Submitted:
11 December 2023
Posted:
12 December 2023
You are already at the latest version
Abstract
Keywords:
1. Introduction
2. Experimental Data and Calculation Methods
3. Results and Discussion
3.1. In what case can we say that an adsorption system follows the Langmuir isotherm?
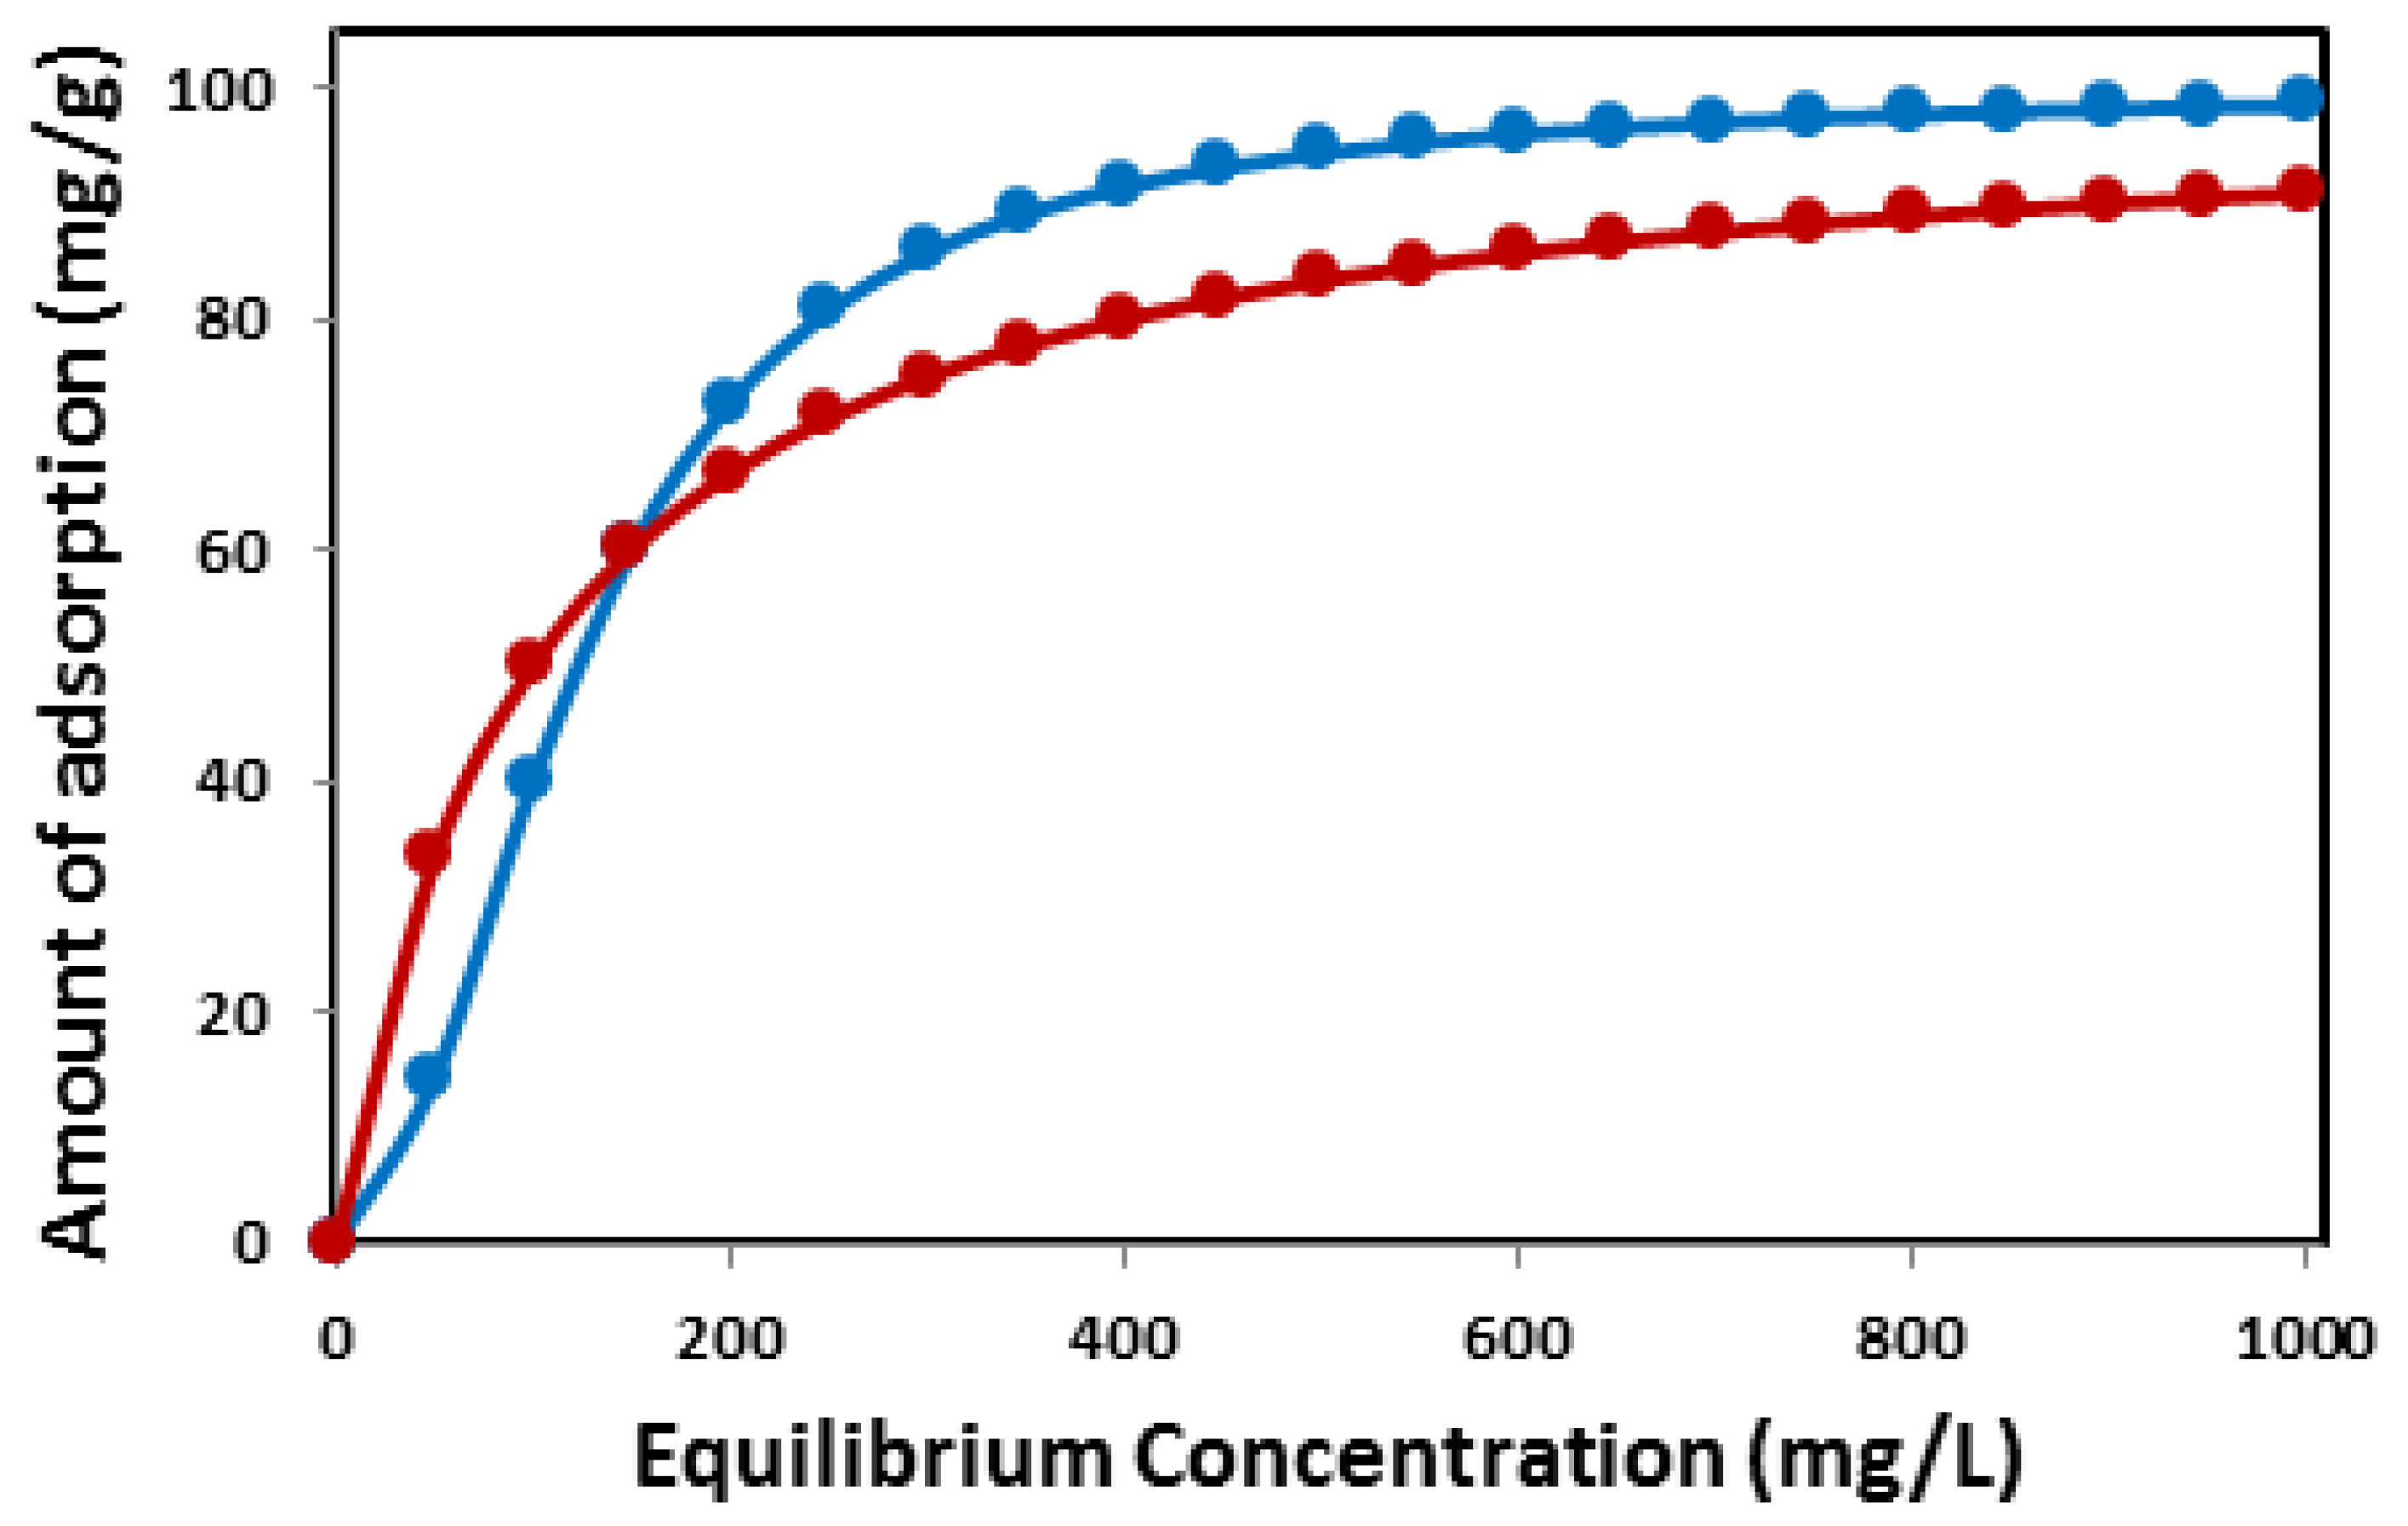
| (mg/L) | (mg/g) | Langmuir Parameters | Form-1 | Form-2 | Form-3 | Form-4 | Non-linear |
|---|---|---|---|---|---|---|---|
| 0 | 0 | (mg/g) | 100 | 100 | 100 | 100 | 100 |
| 50 | 33.33333 | ||||||
| 100 | 50 | ||||||
| 150 | 60 | ||||||
| 200 | 66.66667 | ||||||
| 250 | 71.42857 | ||||||
| 300 | 75 | 0.01 | 0.01 | 0.01 | 0.01 | 0.01 | |
| 350 | 77.77778 | ||||||
| 400 | 80 | ||||||
| 450 | 81.81818 | ||||||
| 500 | 83.33333 | ||||||
| 550 | 84.61538 | ||||||
| 600 | 85.71429 | ||||||
| 650 | 86.66667 | ||||||
| 700 | 87.5 | 1 | 1 | 1 | 1 | 1 | |
| 750 | 88.23529 | ||||||
| 800 | 88.88889 | ||||||
| 850 | 89.47368 | ||||||
| 900 | 90 | ||||||
| 950 | 90.47619 | ||||||
| 1000 | 90.90909 |
3.2. Can we say that an adsorption system follows the Langmuir isotherm if it is described only by one of the linear forms of the Langmuir isotherm?
3.3. Statistical study
3.3.1. Accuracy relationship between linear and non-linear forms of the Langmuir isotherm
3.3.2. Which linear forms create the least error in calculating and K?
4. Conclusion
References
- Karthik, V.; Karuna, B.; Jeyanthi, J.; Periyasamy, S. Biochar production from Manilkara zapota seeds, activation and characterization for effective removal of Cu2+ ions in polluted drinking water. Biomass Convers. Biorefinery 2023, 13, 9381–9395. [Google Scholar] [CrossRef]
- Chen, X.; Cheng, Y.; Pan, Q.; Wu, L.; Hao, X.; Bao, Z.; Li, X.; Yang, M.; Luo, Q.; Li, H. Chiral Nanosilica Drug Delivery Systems Stereoselectively Interacted with the Intestinal Mucosa to Improve the Oral Adsorption of Insoluble Drugs. ACS Nano 2023, 17, 3705–3722. [Google Scholar] [CrossRef]
- Chen, G.; Liu, G.; Pan, Y.; Liu, G.; Gu, X.; Jin, W.; Xu, N. Zeolites and metal–organic frameworks for gas separation: the possibility of translating adsorbents into membranes. Chemical Society Reviews 2023. [Google Scholar] [CrossRef]
- Wang, Y.; Othman, R. Natural gas storage by adsorption. In Surface Process, Transportation, and Storage, Elsevier: Amsterdam, The Netherlands, 2023; pp. 261–297.
- Langmuir, I. The adsorption of gases on plane surfaces of glass, mica and platinum. J. Am. Chem. Soc. 1918, 40, 1361–1403. [Google Scholar] [CrossRef]
- Bolster, C.H.; Hornberger, G.M. On the use of linearized Langmuir equations. Soil Sci. Soc. Am. J. 2007, 71, 1796–1806. [Google Scholar] [CrossRef]
- Hu, Q.; Lan, R.; He, L.; Liu, H.; Pei, X. A critical review of adsorption isotherm models for aqueous contaminants: Curve characteristics, site energy distribution and common controversies. J. Environ. Manag. 2023, 329, 117104. [Google Scholar] [CrossRef]
- Kumar, K.V.; Sivanesan, S. Comparison of linear and non-linear method in estimating the sorption isotherm parameters for safranin onto activated carbon. J. Hazard. Mater. 2005, 123, 288–292. [Google Scholar] [CrossRef]
- Kumar, K.V.; Sivanesan, S. Prediction of optimum sorption isotherm: Comparison of linear and non-linear method. J. Hazard. Mater. 2005, 126, 198–201. [Google Scholar] [CrossRef]
- Ncibi, M.C. Applicability of some statistical tools to predict optimum adsorption isotherm after linear and non-linear regression analysis. J. Hazard. Mater. 2008, 153, 207–212. [Google Scholar] [CrossRef]
- Jasper, E.E.; Ajibola, V.O.; Onwuka, J.C. Nonlinear regression analysis of the sorption of crystal violet and methylene blue from aqueous solutions onto an agro-waste derived activated carbon. Appl. Water Sci. 2020, 10, 1–11. [Google Scholar] [CrossRef]
- Schulthess, C.; Dey, D. Estimation of Langmuir constants using linear and nonlinear. Soil Sci. Soc. Am. J. 1996, 60, 433–442. [Google Scholar] [CrossRef]
- Harter, R.D. Curve-fit errors in Langmuir adsorption maxima. Soil Sci. Soc. Am. J. 1984, 48, 749–752. [Google Scholar] [CrossRef]
- Tsai, S.-C.; Juang, K.-W. Comparison of linear and nonlinear forms of isotherm models for strontium sorption on a sodium bentonite. J. Radioanal. Nucl. Chem. 2000, 243, 741–746. [Google Scholar] [CrossRef]
- Parimal, S.; Prasad, M.; Bhaskar, U. Prediction of equillibrium sorption isotherm: comparison of linear and nonlinear methods. Ind. Eng. Chem. Res. 2010, 49, 2882–2888. [Google Scholar] [CrossRef]
- López-Luna, J.; Ramírez-Montes, L.E.; Martinez-Vargas, S.; Martínez, A.I.; Mijangos-Ricardez, O.F.; González-Chávez, M.d.C.A.; Carrillo-González, R.; Solís-Domínguez, F.A.; Cuevas-Díaz, M.d.C.; Vázquez-Hipólito, V. Linear and nonlinear kinetic and isotherm adsorption models for arsenic removal by manganese ferrite nanoparticles. SN Appl. Sci. 2019, 1, 1–19. [Google Scholar] [CrossRef]
- Chen, X. Modeling of experimental adsorption isotherm data. information 2015, 6, 14–22. [Google Scholar] [CrossRef]
- Bai, C.; Wang, L.; Zhu, Z. Adsorption of Cr (III) and Pb (II) by graphene oxide/alginate hydrogel membrane: Characterization, adsorption kinetics, isotherm and thermodynamics studies. Int. J. Biol. Macromol. 2020, 147, 898–910. [Google Scholar] [CrossRef]
- Chen, Y.; Zhao, H.; Li, Y.; Zhao, W.; Yang, X.; Meng, X.; Wang, H. Two-step preparation of an amidoxime-functionalized chelating resin for removal of heavy metal ions from aqueous solution. J. Chem. Eng. Data 2019, 64, 4037–4045. [Google Scholar] [CrossRef]
- Darwish, A.; Rashad, M.; AL-Aoh, H.A. Methyl orange adsorption comparison on nanoparticles: Isotherm, kinetics, and thermodynamic studies. Dye. Pigment. 2019, 160, 563–571. [Google Scholar] [CrossRef]
- Yao, X.; Ji, L.; Guo, J.; Ge, S.; Lu, W.; Cai, L.; Wang, Y.; Song, W.; Zhang, H. Magnetic activated biochar nanocomposites derived from wakame and its application in methylene blue adsorption. Bioresour. Technol. 2020, 302, 122842. [Google Scholar]
- Tapan Kumar, S. Adsorption of methyl orange onto chitosan from aqueous solution. J. Water Resour. Prot. 2010, 2, 2969. [Google Scholar]
- Ahmed, W.; Mehmood, S.; Núñez-Delgado, A.; Ali, S.; Qaswar, M.; Shakoor, A.; Mahmood, M.; Chen, D.-Y. Enhanced adsorption of aqueous Pb(II) by modified biochar produced through pyrolysis of watermelon seeds. Sci. Total. Environ. 2021, 784, 147136. [Google Scholar] [CrossRef]
- Sajjadi, S.-A.; Meknati, A.; Lima, E.C.; Dotto, G.L.; Mendoza-Castillo, D.I.; Anastopoulos, I.; Alakhras, F.; Unuabonah, E.I.; Singh, P.; Hosseini-Bandegharaei, A. A novel route for preparation of chemically activated carbon from pistachio wood for highly efficient Pb(II) sorption. J. Environ. Manag. 2019, 236, 34–44. [Google Scholar] [CrossRef]
- Liu, X.; Zhang, L. Removal of phosphate anions using the modified chitosan beads: Adsorption kinetic, isotherm and mechanism studies. Powder Technol. 2015, 277, 112–119. [Google Scholar] [CrossRef]
- Imanipoor, J.; Mohammadi, M.; Dinari, M.; Ehsani, M.R. Adsorption and Desorption of Amoxicillin Antibiotic from Water Matrices Using an Effective and Recyclable MIL-53(Al) Metal–Organic Framework Adsorbent. J. Chem. Eng. Data 2020, 66, 389–403. [Google Scholar] [CrossRef]
- Wang, W.; Maimaiti, A.; Shi, H.; Wu, R.; Wang, R.; Li, Z.; Qi, D.; Yu, G.; Deng, S. Adsorption behavior and mechanism of emerging perfluoro-2-propoxypropanoic acid (GenX) on activated carbons and resins. Chem. Eng. J. 2019, 364, 132–138. [Google Scholar] [CrossRef]
- Wei, J.; Liu, Y.; Li, J.; Zhu, Y.; Yu, H.; Peng, Y. Adsorption and co-adsorption of tetracycline and doxycycline by one-step synthesized iron loaded sludge biochar. Chemosphere 2019, 236, 124254. [Google Scholar] [CrossRef]
- Rashtbari, Y.; Hazrati, S.; Azari, A.; Afshin, S.; Fazlzadeh, M.; Vosoughi, M. A novel, eco-friendly and green synthesis of PPAC-ZnO and PPAC-nZVI nanocomposite using pomegranate peel: Cephalexin adsorption experiments, mechanisms, isotherms and kinetics. Adv. Powder Technol. 2020, 31, 1612–1623. [Google Scholar] [CrossRef]
- Lv, S.-W.; Liu, J.-M.; Ma, H.; Wang, Z.-H.; Li, C.-Y.; Zhao, N.; Wang, S. Simultaneous adsorption of methyl orange and methylene blue from aqueous solution using amino functionalized Zr-based MOFs. Microporous Mesoporous Mater. 2019, 282, 179–187. [Google Scholar] [CrossRef]
- Zheng, Y.; Cheng, B.; You, W.; Yu, J.; Ho, W. 3D hierarchical graphene oxide-NiFe LDH composite with enhanced adsorption affinity to Congo red, methyl orange and Cr (VI) ions. J. Hazard. Mater. 2019, 369, 214–225. [Google Scholar] [CrossRef]
- Chang, Y.S.; Au, P.I.; Mubarak, N.M.; Khalid, M.; Jagadish, P.; Walvekar, R.; Abdullah, E.C. Adsorption of Cu(II) and Ni(II) ions from wastewater onto bentonite and bentonite/GO composite. Environ. Sci. Pollut. Res. 2020, 27, 33270–33296. [Google Scholar] [CrossRef]
- Ahmed, M.; Okoye, P.; Hummadi, E.; Hameed, B. High-performance porous biochar from the pyrolysis of natural and renewable seaweed (Gelidiella acerosa) and its application for the adsorption of methylene blue. Bioresour. Technol. 2019, 278, 159–164. [Google Scholar] [CrossRef]
- Asuquo, E.; Martin, A.; Nzerem, P.; Siperstein, F.; Fan, X. Adsorption of Cd (II) and Pb (II) ions from aqueous solutions using mesoporous activated carbon adsorbent: Equilibrium, kinetics and characterisation studies. J. Environ. Chem. Eng. 2017, 5, 679–698. [Google Scholar] [CrossRef]
- Li, B.; Guo, J.; Lv, K.; Fan, J. Adsorption of methylene blue and Cd(II) onto maleylated modified hydrochar from water. Environ. Pollut. 2019, 254, 113014. [Google Scholar] [CrossRef]
- Ahmed, M.; Islam, A.; Asif, M.; Hameed, B. Human hair-derived high surface area porous carbon material for the adsorption isotherm and kinetics of tetracycline antibiotics. Bioresour. Technol. 2017, 243, 778–784. [Google Scholar] [CrossRef]
- Albadarin, A.B.; Collins, M.N.; Naushad, M.; Shirazian, S.; Walker, G.; Mangwandi, C. Activated lignin-chitosan extruded blends for efficient adsorption of methylene blue. Chem. Eng. J. 2017, 307, 264–272. [Google Scholar] [CrossRef]
- Alizadeh, A.; Abdi, G.; Khodaei, M.M.; Ashokkumar, M.; Amirian, J. Graphene oxide/Fe3O4/SO3H nanohybrid: A new adsorbent for adsorption and reduction of Cr (vi) from aqueous solutions. RSC Adv. 2017, 7, 14876–14887. [Google Scholar] [CrossRef]
- Ghasemi, S.S.; Hadavifar, M.; Maleki, B.; Mohammadnia, E. Adsorption of mercury ions from synthetic aqueous solution using polydopamine decorated SWCNTs. J. Water Process. Eng. 2019, 32, 100965. [Google Scholar] [CrossRef]
- Gao, Y.; Deng, S.-Q.; Jin, X.; Cai, S.-L.; Zheng, S.-R.; Zhang, W.-G. The construction of amorphous metal-organic cage-based solid for rapid dye adsorption and time-dependent dye separation from water. Chem. Eng. J. 2018, 357, 129–139. [Google Scholar] [CrossRef]
- Pishnamazi, M.; Khan, A.; Kurniawan, T.A.; Sanaeepur, H.; Albadarin, A.B.; Soltani, R. Adsorption of dyes on multifunctionalized nano-silica KCC-1. J. Mol. Liq. 2021, 338, 116573. [Google Scholar] [CrossRef]
- Jia, Y.; Zhang, Y.; Fu, J.; Yuan, L.; Li, Z.; Liu, C.; et al. A novel magnetic biochar/MgFe-layered double hydroxides composite removing Pb2+ from aqueous solution: Isotherms, kinetics and thermodynamics. Colloids Surf. A 2019, 567, 278–287. [Google Scholar] [CrossRef]
- Li, X.; Wang, S.; Liu, Y.; Jiang, L.; Song, B.; Li, M.; et al. Adsorption of Cu (II), Pb (II), and Cd (II) ions from acidic aqueous solutions by diethylenetriaminepentaacetic acid-modified magnetic graphene oxide. J. Chem. Eng. Data 2017, 62, 407–416. [Google Scholar] [CrossRef]
- Foroutan, R.; Peighambardoust, S.J.; Peighambardoust, S.H.; Pateiro, M.; Lorenzo, J.M. Adsorption of crystal violet dye using activated carbon of lemon wood and activated carbon/Fe3O4 magnetic nanocomposite from aqueous solutions: a kinetic, equilibrium and thermodynamic study. Molecules 2021, 26, 2241. [Google Scholar] [CrossRef]
- Radi, S.; Tighadouini, S.; El Massaoudi, M.; Bacquet, M.; Degoutin, S.; Revel, B.; Mabkhot, Y.N. Thermodynamics and Kinetics of Heavy Metals Adsorption on Silica Particles Chemically Modified by Conjugated β-Ketoenol Furan. J. Chem. Eng. Data 2015, 60, 2915–2925. [Google Scholar] [CrossRef]
- Oussalah, A.; Boukerroui, A.; Aichour, A.; Djellouli, B. Cationic and anionic dyes removal by low-cost hybrid alginate/natural bentonite composite beads: Adsorption and reusability studies. Int. J. Biol. Macromol. 2018, 124, 854–862. [Google Scholar] [CrossRef]
- Vijayaraghavan, K.; Ashokkumar, T. Characterization and evaluation of reactive dye adsorption onto Biochar Derived from Turbinaria conoides Biomass. Environ. Prog. Sustain. Energy 2019, 38. [Google Scholar] [CrossRef]
- Pei, Y.; Jiang, Z.; Yuan, L. Facile synthesis of MCM-41/MgO for highly efficient adsorption of organic dye. Colloids Surf. A 2019, 581, 123816. [Google Scholar] [CrossRef]
- Tong, D.S.; Wu, C.W.; Adebajo, M.O.; Jin, G.C.; Yu, W.H.; Ji, S.F.; Zhou, C.H. Adsorption of methylene blue from aqueous solution onto porous cellulose-derived carbon/montmorillonite nanocomposites. Appl. Clay Sci. 2018, 161, 256–264. [Google Scholar] [CrossRef]
- Nguyen, D.T.; Tran, H.N.; Juang, R.-S.; Dat, N.D.; Tomul, F.; Ivanets, A.; Woo, S.H.; Hosseini-Bandegharaei, A.; Nguyen, V.P.; Chao, H.-P. Adsorption process and mechanism of acetaminophen onto commercial activated carbon. J. Environ. Chem. Eng. 2020, 8, 104408. [Google Scholar] [CrossRef]
- Jawad, A.H.; Mubarak, N.S.A.; Abdulhameed, A.S. Hybrid crosslinked chitosan-epichlorohydrin/TiO 2 nanocomposite for reactive red 120 dye adsorption: kinetic, isotherm, thermodynamic, and mechanism study. J. Polym. Environ. 2020, 28, 624–637. [Google Scholar] [CrossRef]
- Guo, S.; Huang, L.; Li, W.; Wang, Q.; Wang, W.; Yang, Y. Willow tree-like functional groups modified magnetic nanoparticles for ultra-high capacity adsorption of dye. J. Taiwan Inst. Chem. Eng. 2019, 101, 99–104. [Google Scholar] [CrossRef]
- Meili, L.; Lins, P.; Costa, M.; Almeida, R.; Abud, A.; Soletti, J.; Dotto, G.; Tanabe, E.; Sellaoui, L.; Carvalho, S.; et al. Adsorption of methylene blue on agroindustrial wastes: Experimental investigation and phenomenological modelling. Prog. Biophys. Mol. Biol. 2018, 141, 60–71. [Google Scholar] [CrossRef] [PubMed]
- Wu, M.; Zhao, S.; Jing, R.; Shao, Y.; Liu, X.; Lv, F.; Hu, X.; Zhang, Q.; Meng, Z.; Liu, A. Competitive adsorption of antibiotic tetracycline and ciprofloxacin on montmorillonite. Appl. Clay Sci. 2019, 180, 105175. [Google Scholar] [CrossRef]
- Wang, N.; Chen, J.; Wang, J.; Feng, J.; Yan, W. Removal of methylene blue by Polyaniline/TiO2 hydrate: Adsorption kinetic, isotherm and mechanism studies. Powder Technol. 2019, 347, 93–102. [Google Scholar] [CrossRef]
- Marrakchi, F.; Khanday, W.; Asif, M.; Hameed, B. Cross-linked chitosan/sepiolite composite for the adsorption of methylene blue and reactive orange 16. Int. J. Biol. Macromol. 2016, 93, 1231–1239. [Google Scholar] [CrossRef] [PubMed]
- Chen, L.; Lü, L.; Shao, W.; Luo, F. Kinetics and Equilibria of Cd(II) Adsorption onto a Chemically Modified Lawny Grass with H[BTMPP]. J. Chem. Eng. Data 2011, 56, 1059–1068. [Google Scholar] [CrossRef]
- Anirudhan, T.S.; Jalajamony, S.; Sreekumari, S.S. Adsorptive Removal of Cu(II) Ions from Aqueous Media onto 4-Ethyl Thiosemicarbazide Intercalated Organophilic Calcined Hydrotalcite. J. Chem. Eng. Data 2012, 58, 24–31. [Google Scholar] [CrossRef]
- Yan, M.; Huang, W.; Li, Z. Chitosan cross-linked graphene oxide/lignosulfonate composite aerogel for enhanced adsorption of methylene blue in water. Int. J. Biol. Macromol. 2019, 136, 927–935. [Google Scholar] [CrossRef]
- Boudechiche, N.; Fares, M.; Ouyahia, S.; Yazid, H.; Trari, M.; Sadaoui, Z. Comparative study on removal of two basic dyes in aqueous medium by adsorption using activated carbon from Ziziphus lotus stones. Microchem. J. 2019, 146, 1010–1018. [Google Scholar] [CrossRef]
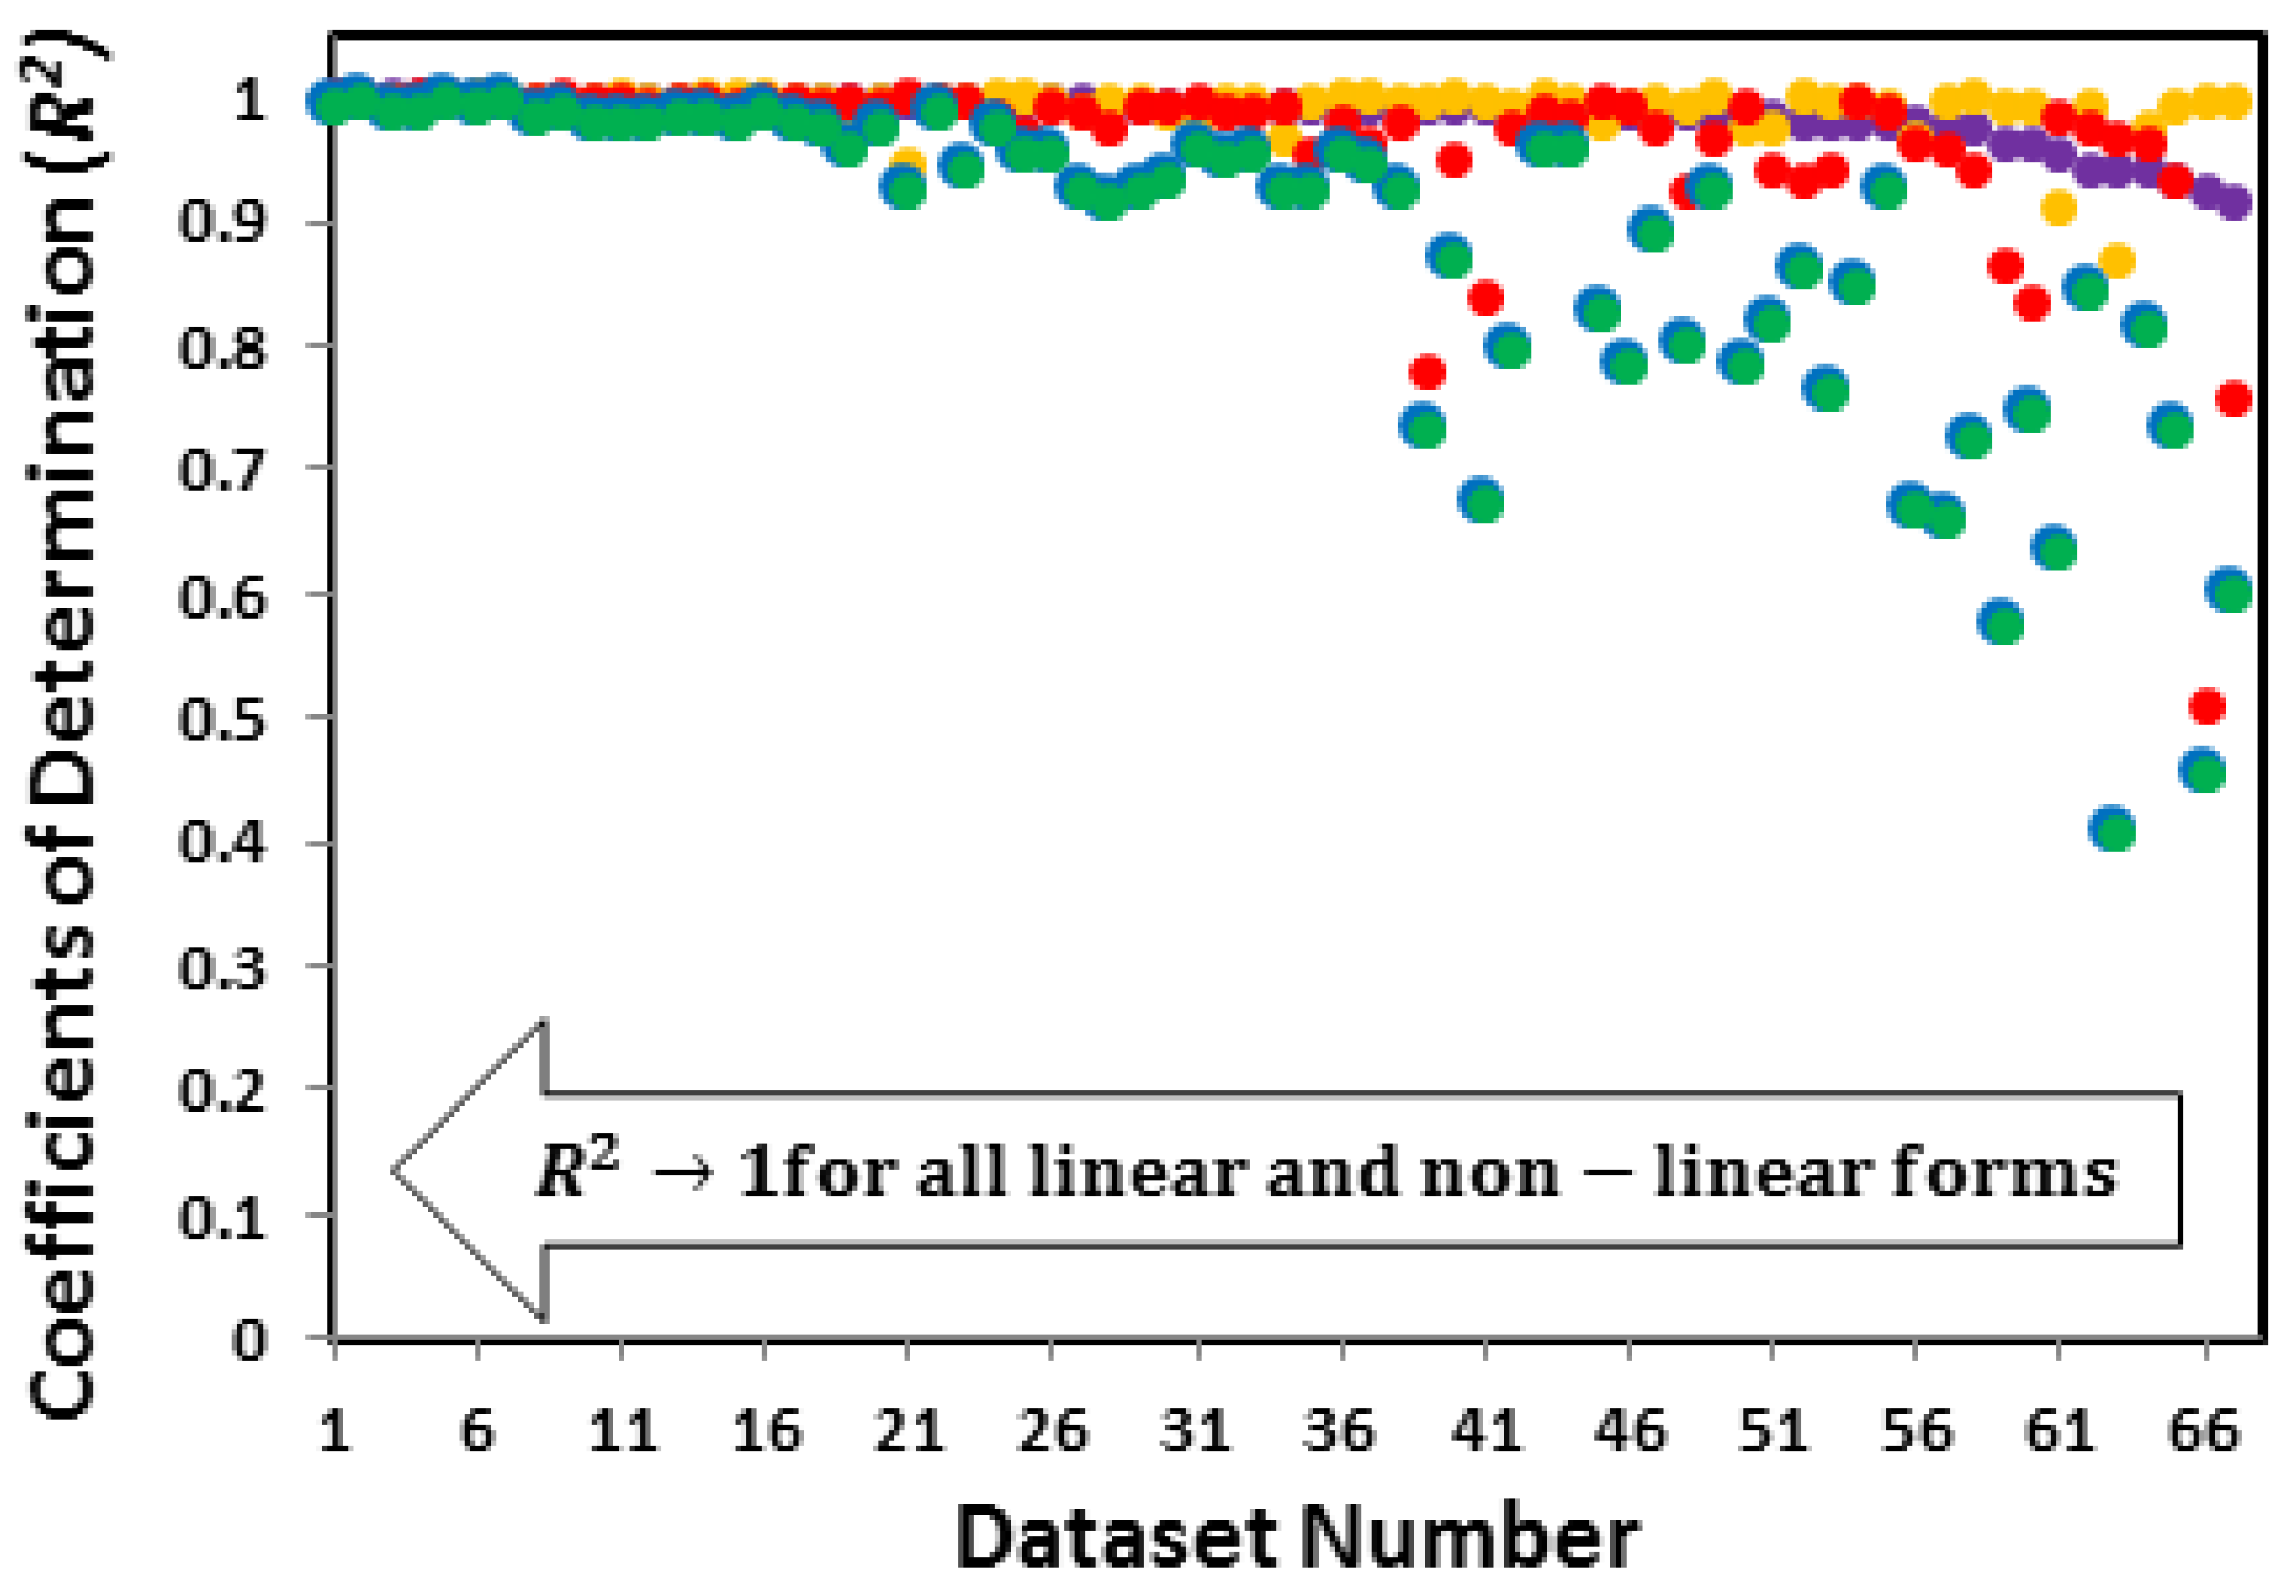
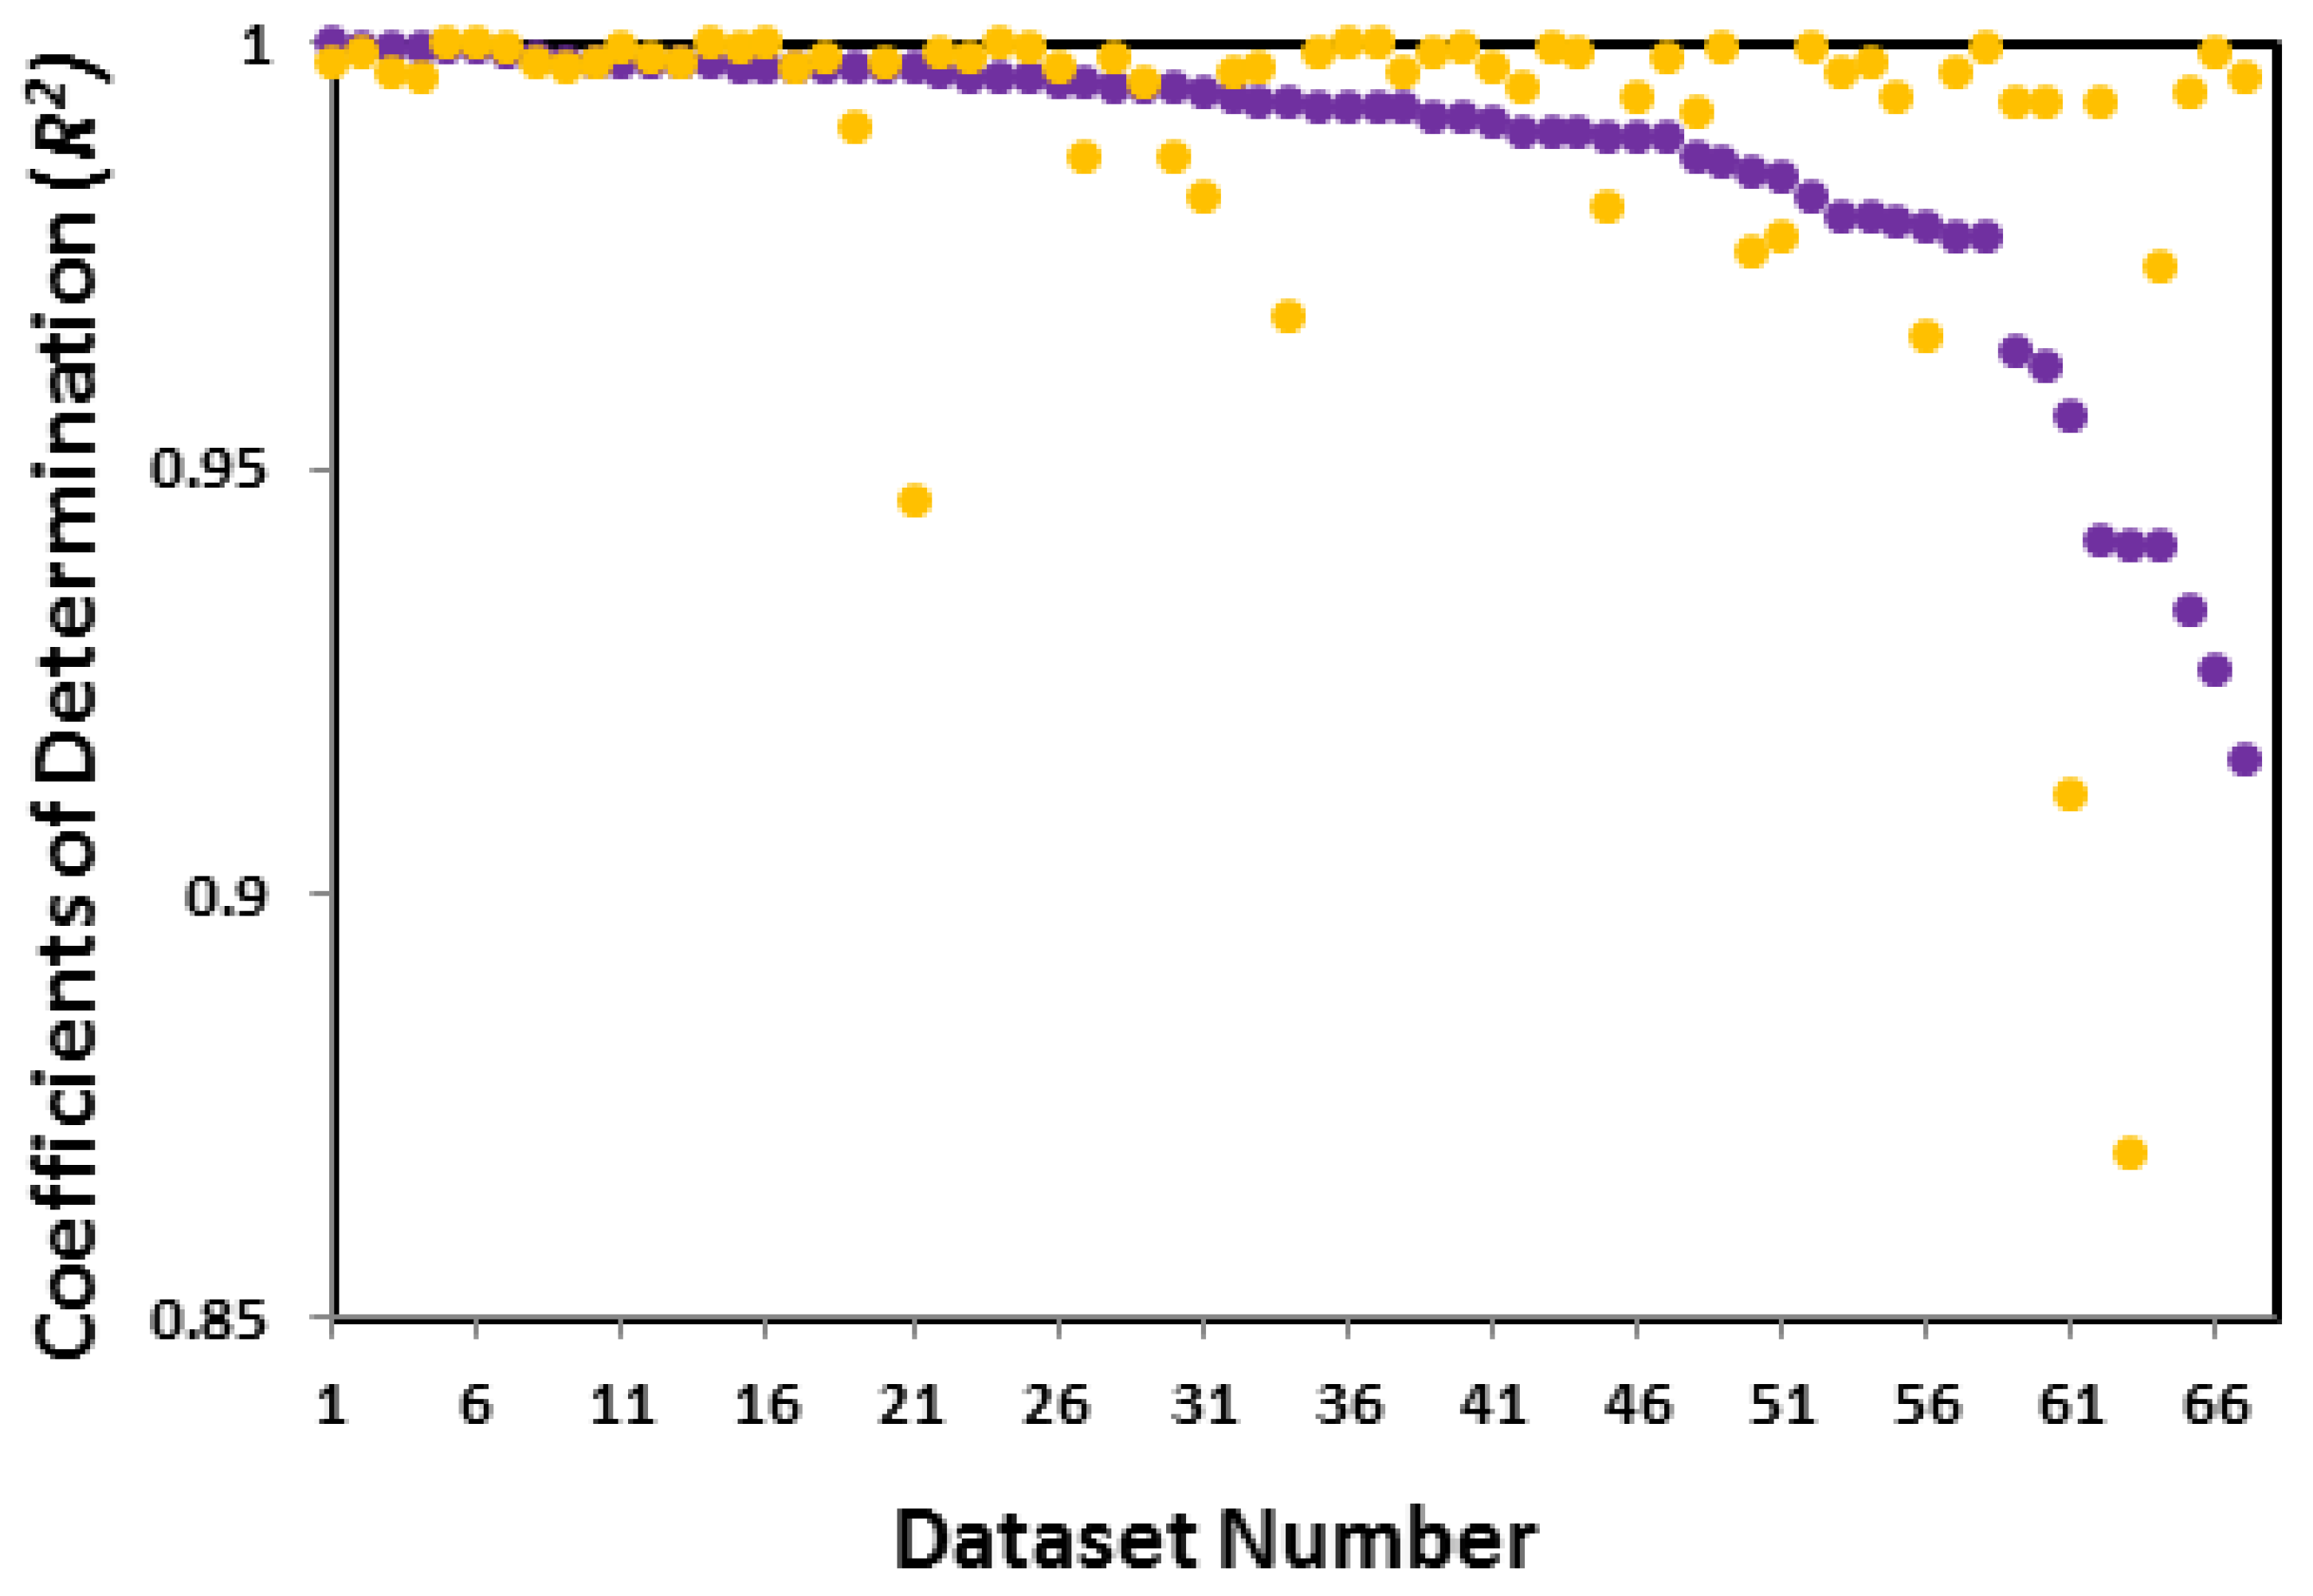
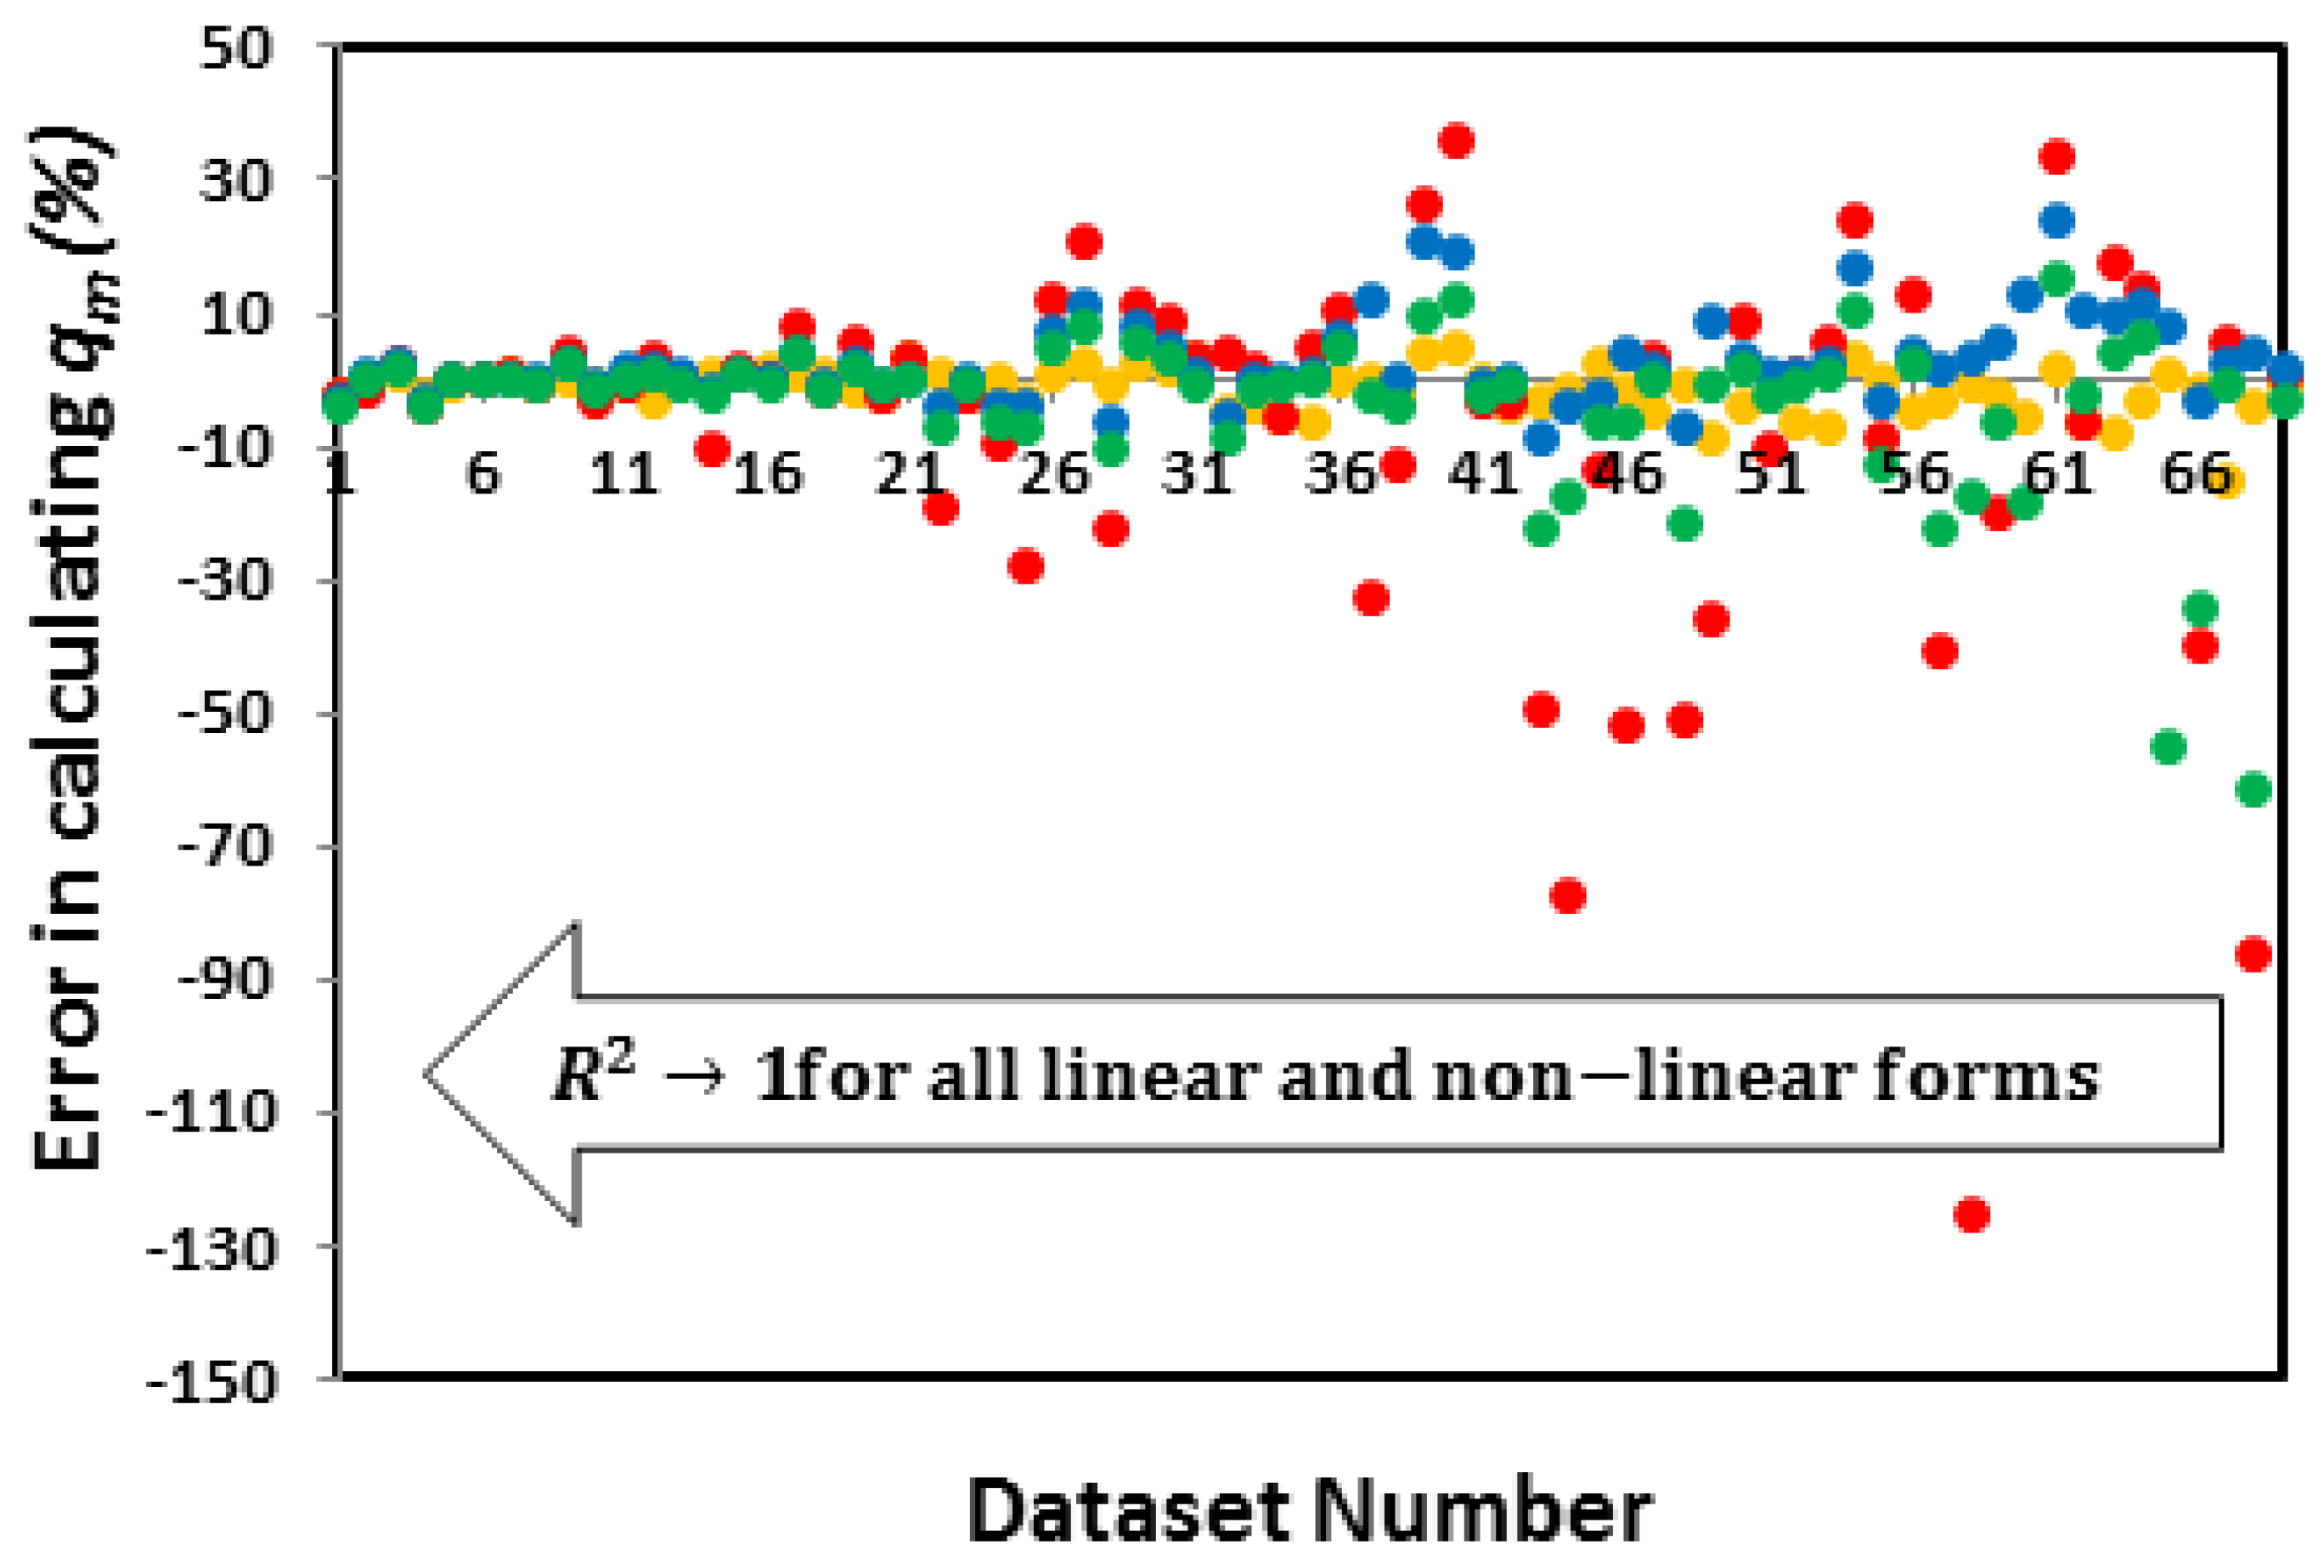
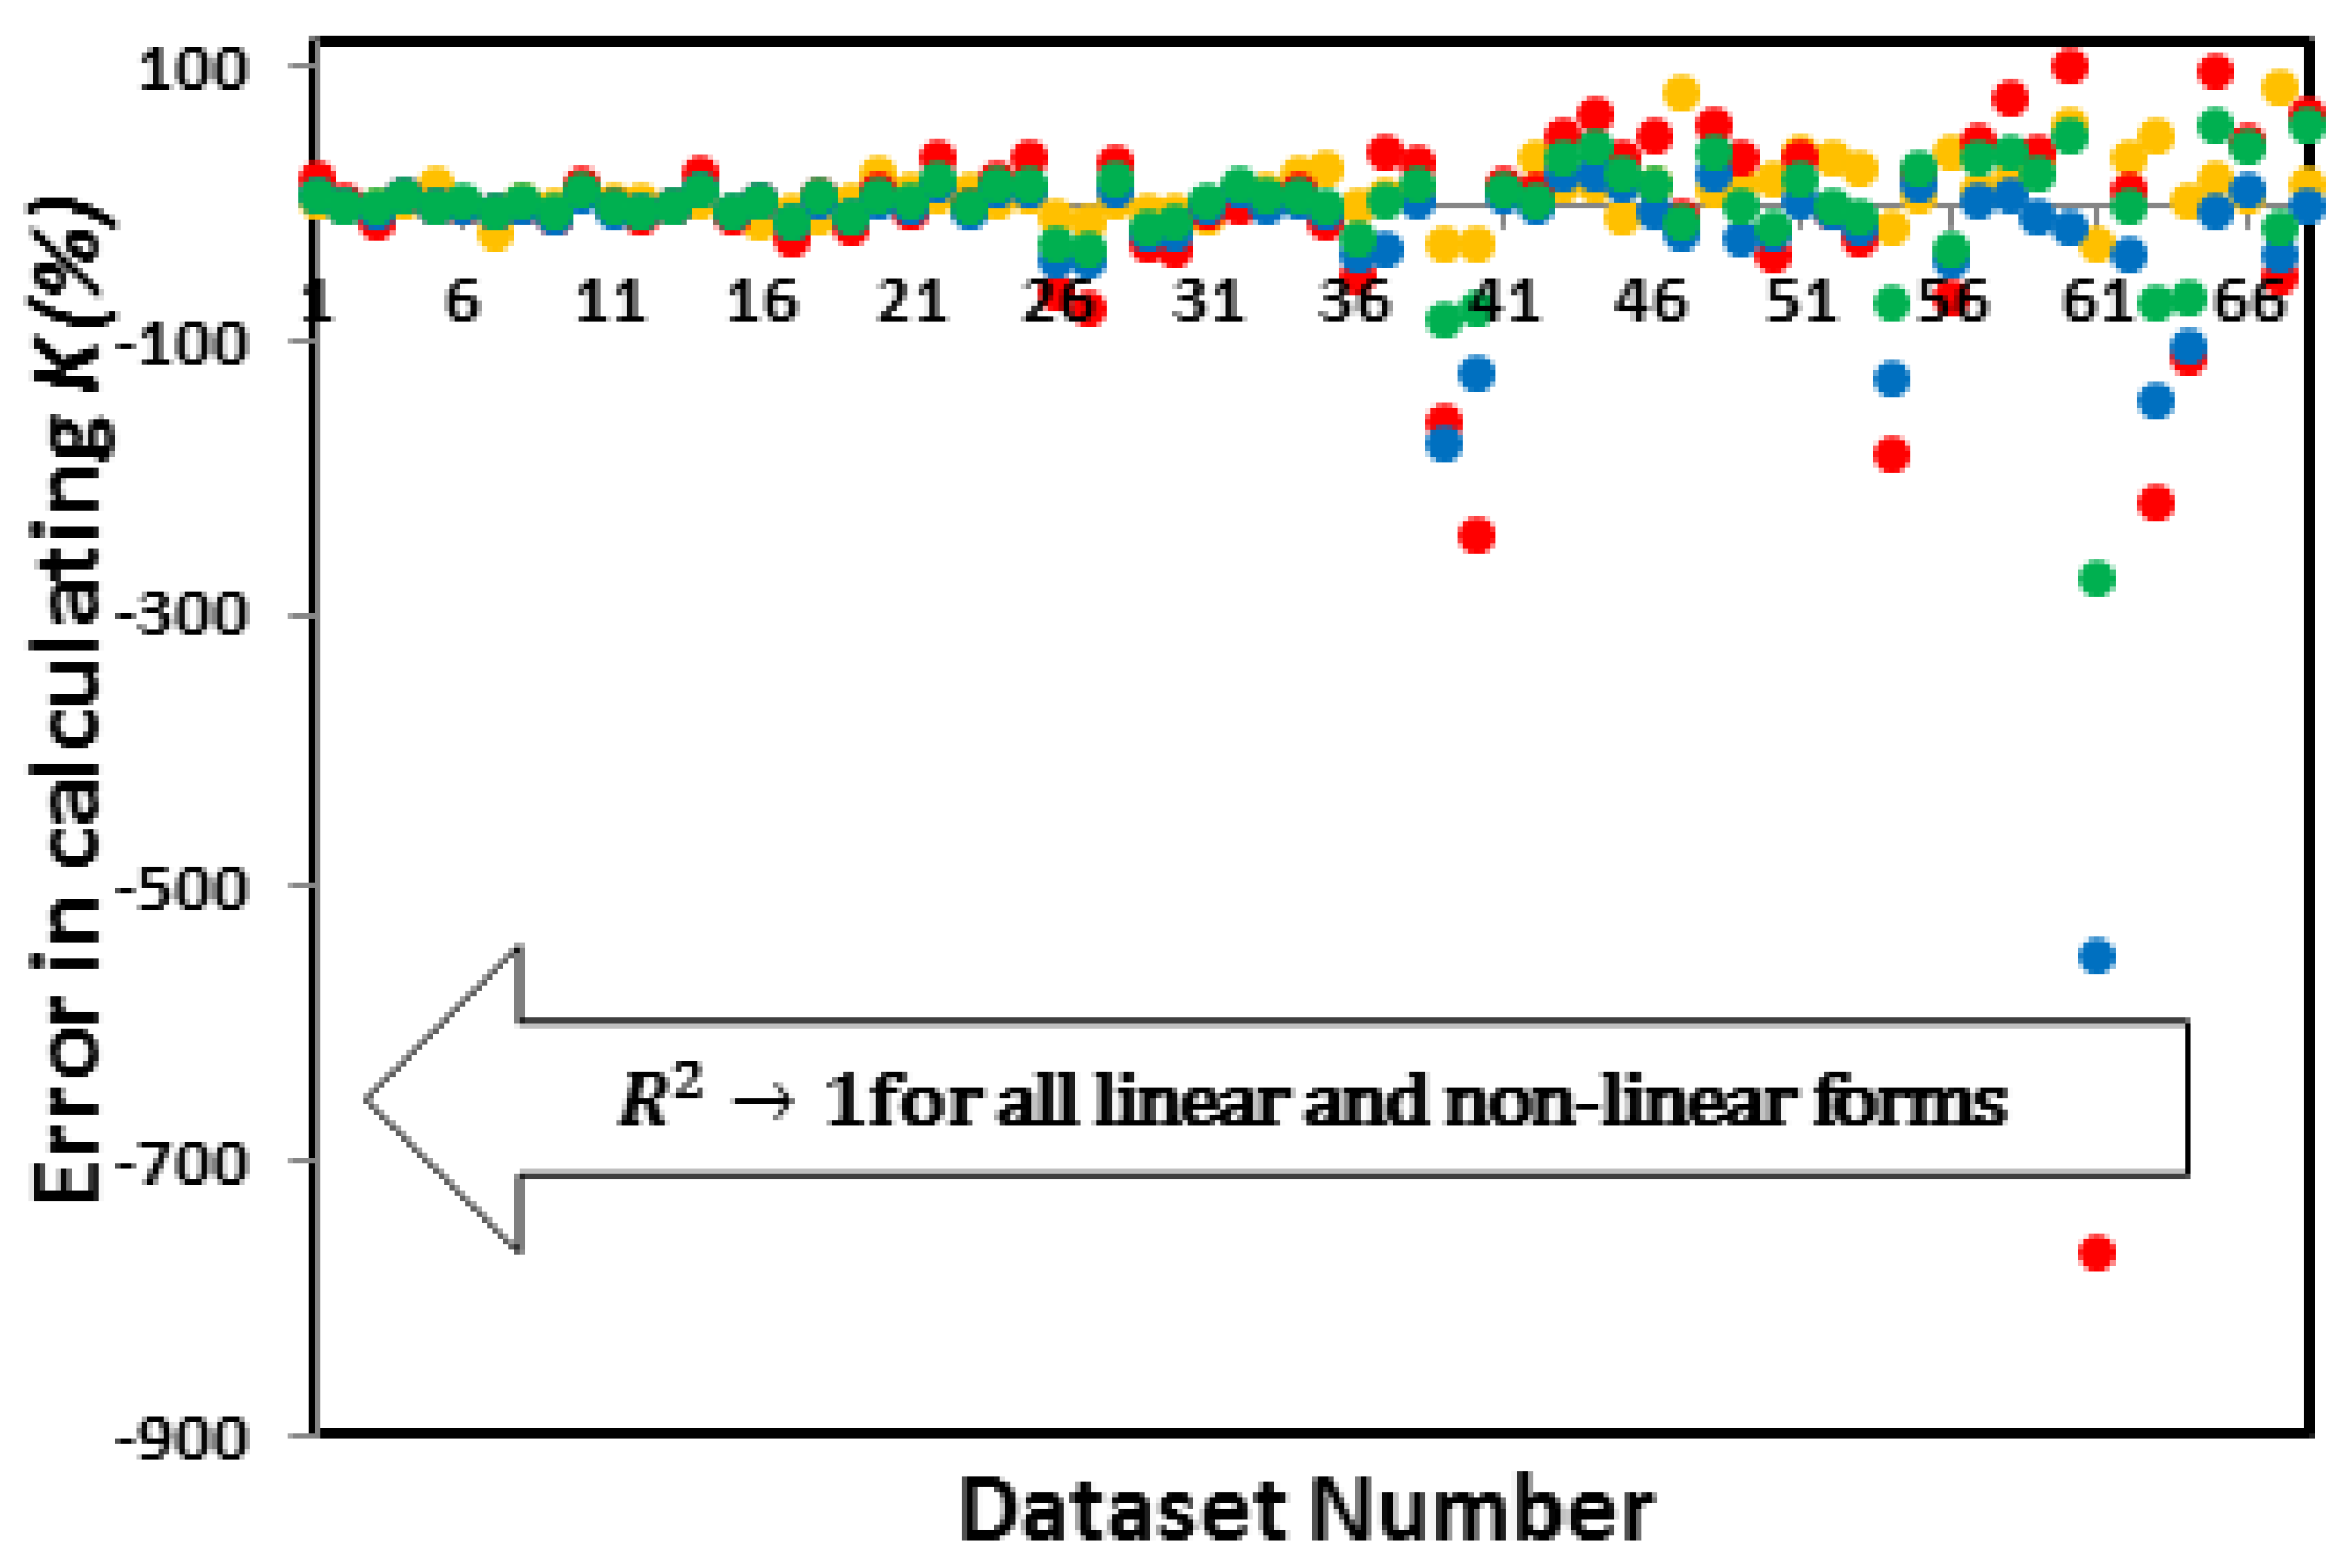
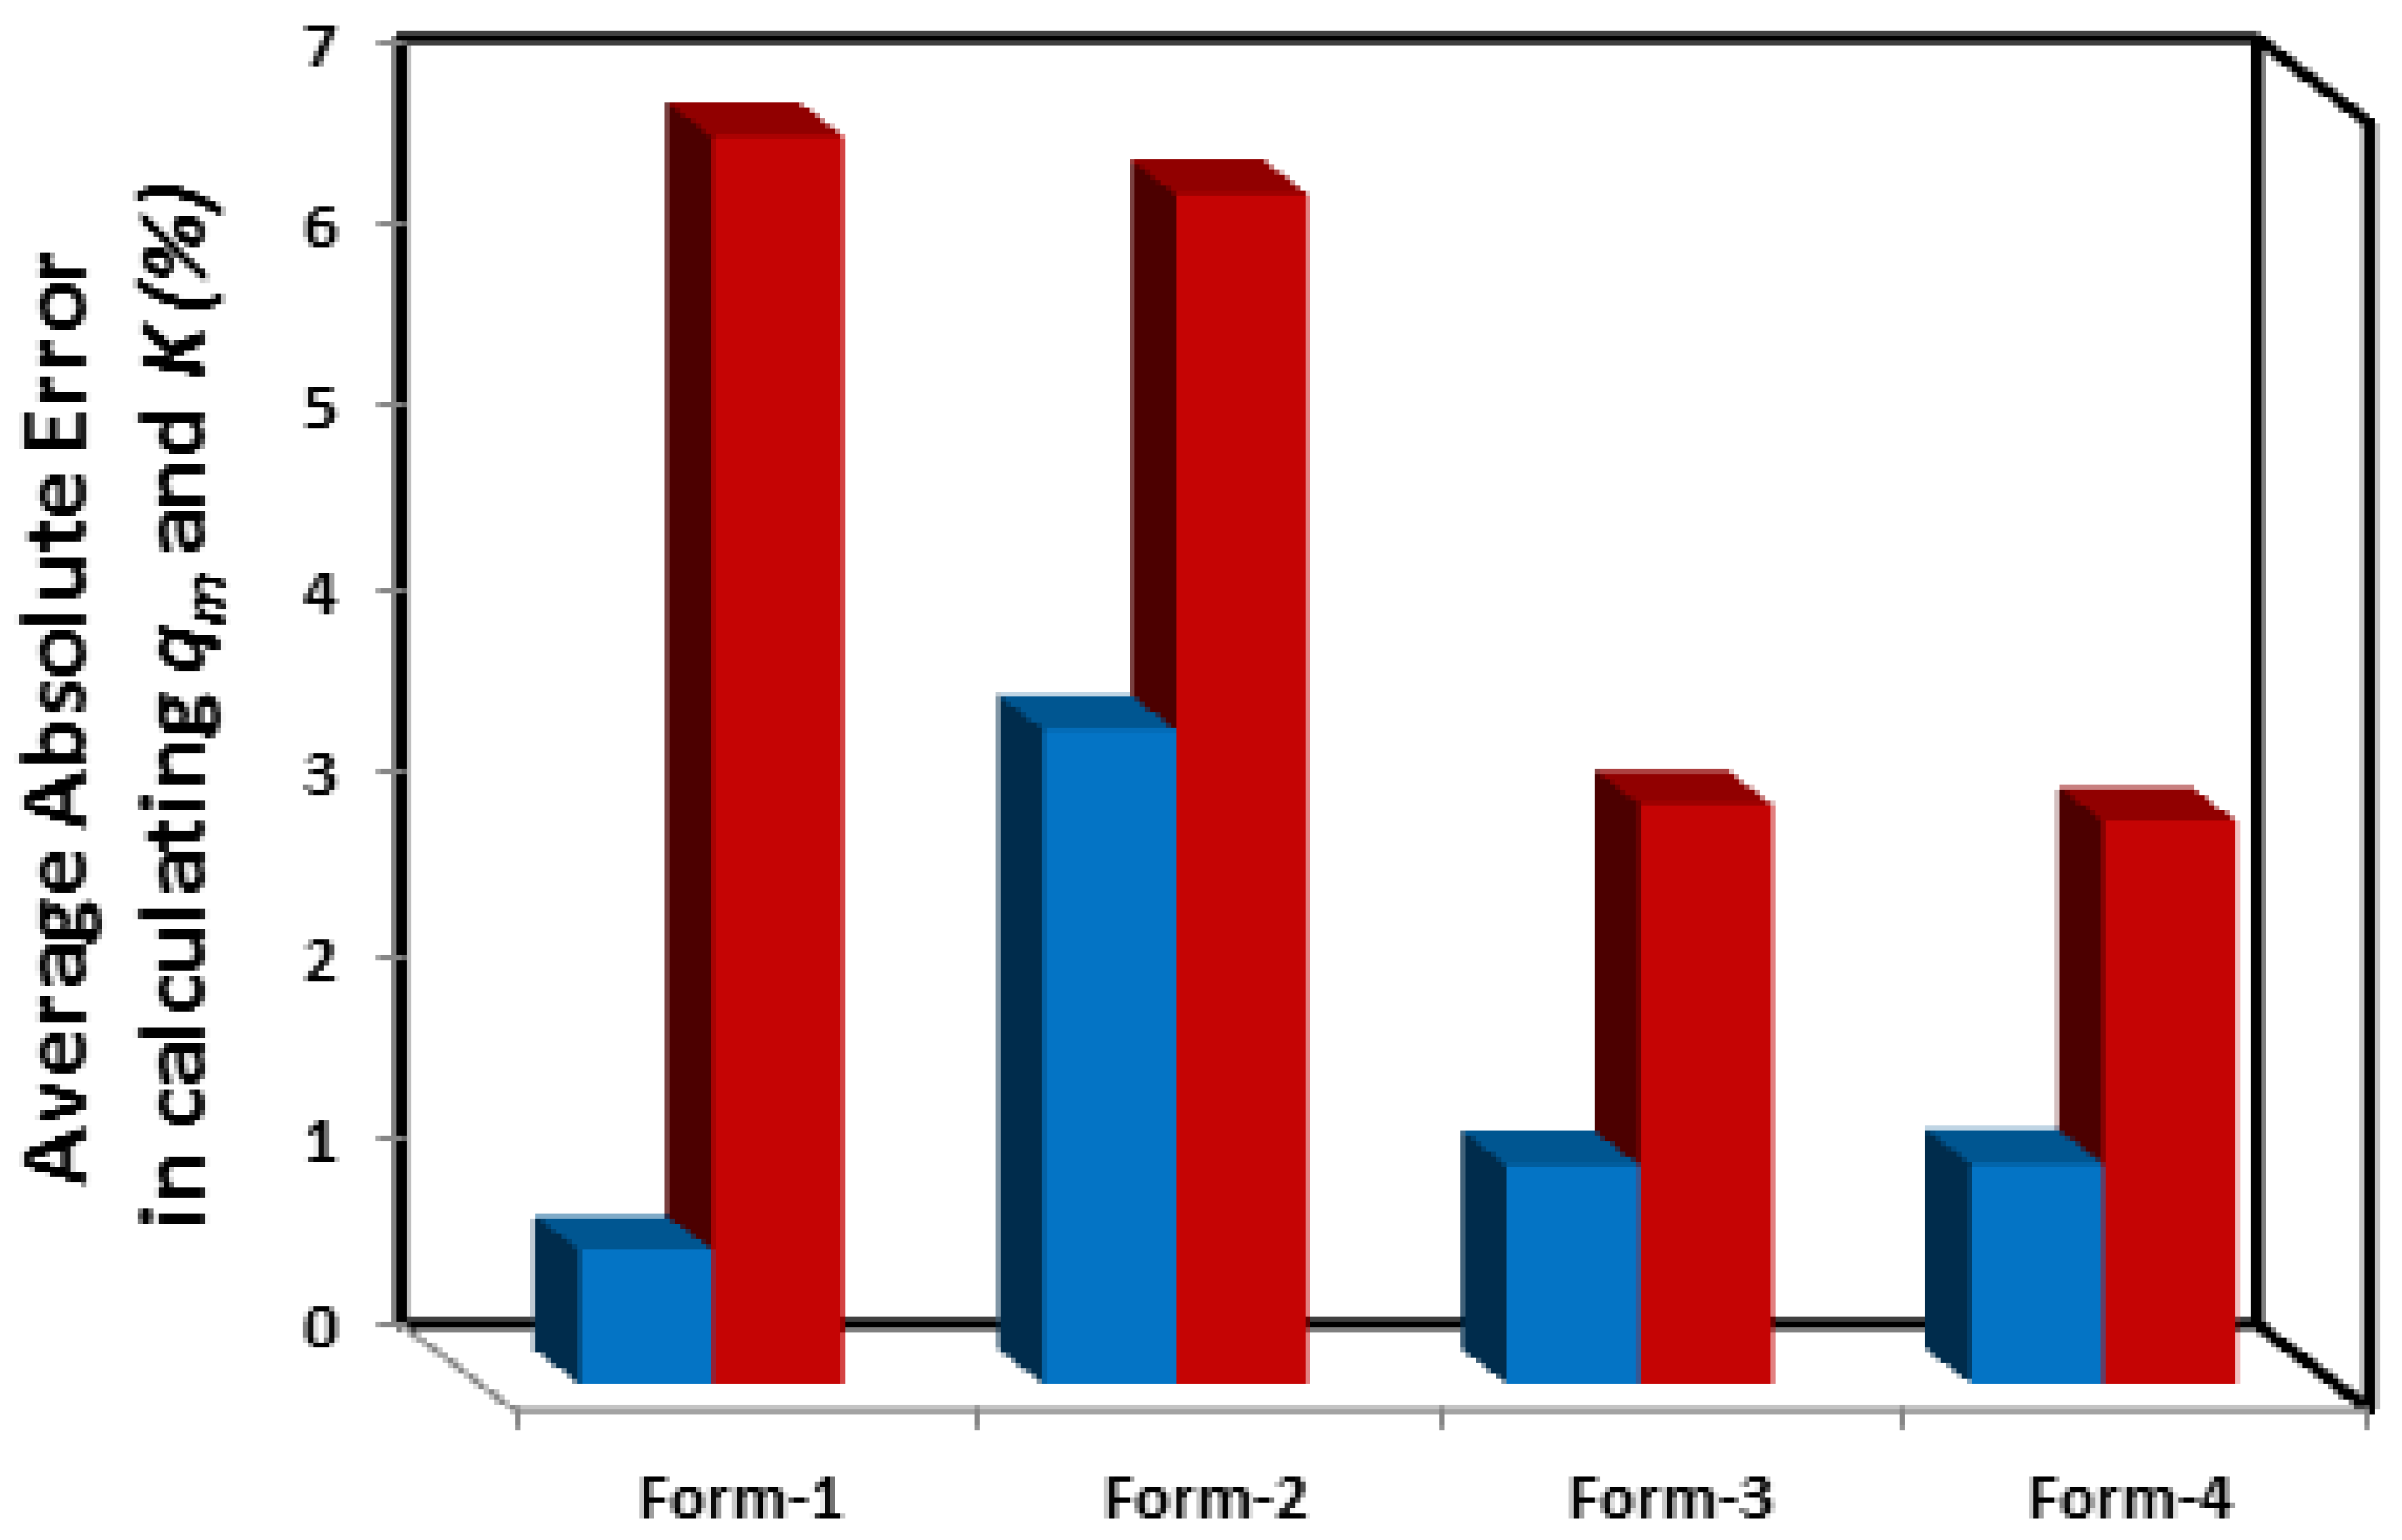
| System | Adsorbate | Adsorbent | Reported Isotherm | Coefficients of determination (R2) of linear and Non-linear forms of the Langmuir Isotherm | Reference | ||||
|---|---|---|---|---|---|---|---|---|---|
| Non-linear | Form-4 | Form-3 | Form-2 | Form-1 | |||||
| 1 | Methyl Orange | Chitosan | Langmuir | 0.9999 | 0.9926 | 0.9926 | 0.9994 | 0.9979 | [22] |
| -33 | |||||||||
| 2 | Methyl Orange | Chitosan | Langmuir | 0.9998 | 0.9978 | 0.9978 | 0.9998 | 0.9992 | [22] |
| -27 | |||||||||
| 3 | Methyl Orange | Chitosan | Langmuir | 0.9998 | 0.9891 | 0.9891 | 0.9989 | 0.9967 | [22] |
| -40 | |||||||||
| 4 | Methyl Orange | Chitosan | Langmuir | 0.9997 | 0.9891 | 0.9891 | 0.9996 | 0.9962 | [22] |
| -45 | |||||||||
| 5 | Pb(II) | Modified biochar by H2O2 (HP-BC) | Langmuir | 0.9996 | 0.9991 | 0.9991 | 0.9999 | 1 | [23] |
| 6 | Pb(II) | Pistachio wood-derived activated carbon | Toth | 0.9993 | 0.994 | 0.994 | 0.9974 | 0.9999 | [24] |
| 7 | Phosphate | Chitosan biosorbent modified with zirconium ions (ZCB) | Langmuir | 0.9992 | 0.9955 | 0.9955 | 0.9987 | 0.9998 | [25] |
| 8 | Amoxicillin | MIL-53(Al) | Langmuir | 0.9981 | 0.9856 | 0.9856 | 0.9972 | 0.998 | [26] |
| (at 303 K) | Metal−Organic Framework | ||||||||
| 9 | Perfluoro-2-propoxypropanoic acid (GenX) | Powdered Activated Carbon (PAC) | Langmuir | 0.998 | 0.9901 | 0.9901 | 0.9996 | 0.9971 | [27] |
| 10 | Tetracycline | Iron loaded sludge biochar | Langmuir | 0.9979 | 0.9809 | 0.9809 | 0.9968 | 0.9977 | [28] |
| (at 313.15 K) | |||||||||
| 11 | Pb(II) | Biochar (BC) | Langmuir | 0.9979 | 0.9794 | 0.9794 | 0.9956 | 0.9998 | [23] |
| 12 | Amoxicillin | MIL-53(Al) | Langmuir | 0.9978 | 0.9832 | 0.9832 | 0.9963 | 0.9978 | [26] |
| (at 323 K) | Metal−Organic Framework | ||||||||
| 13 | Amoxicillin | MIL-53(Al) | Langmuir | 0.9978 | 0.9802 | 0.9802 | 0.9941 | 0.9983 | [26] |
| (at 313 K) | Metal−Organic Framework | ||||||||
| 14 | Cephalexin | PPAC-nZVI | Langmuir | 0.9976 | 0.9834 | 0.9834 | 0.9972 | 0.9999 | [29] |
| 15 | Methyl Orange | UiO-66-NH2MOF | Langmuir | 0.9973 | 0.9878 | 0.9878 | 0.9965 | 1 | [30] |
| (at 35 oC) | |||||||||
| 16 | Cr(VI) | NiFe LDH microspheres | Liu | 0.9973 | 0.9804 | 0.9804 | 0.9919 | 0.9996 | [31] |
| 17 | Tetracycline | Iron loaded sludge biochar | Langmuir | 0.9972 | 0.9815 | 0.9815 | 0.999 | 0.997 | [28] |
| (at 303.15 K) | |||||||||
| 18 | Cu(II) | Bentonite | Langmuir | 0.9972 | 0.977 | 0.977 | 0.9942 | 0.9984 | [32] |
| 19 | Amoxicillin | MIL-53(Al) | Langmuir | 0.9971 | 0.9738 | 0.9738 | 0.9918 | 0.9979 | [26] |
| (at 333 K) | Metal−Organic Framework | ||||||||
| 20 | Methylene Blue | Porous Biochar | Langmuir | 0.9971 | 0.9594 | 0.9594 | 0.9991 | 0.9899 | [33] |
| (at 30 oC) | |||||||||
| 21 | Methyl Orange | NiO | Langmuir | 0.9969 | 0.9227 | 0.9227 | 0.9994 | 0.9462 | [20] |
| (at 60 oC) | |||||||||
| 22 | Pb(II) | Commercial Activated Carbon (CGAC) | Langmuir | 0.9966 | 0.987 | 0.987 | 0.9974 | 0.999 | [34] |
| 23 | Methylene Blue | Maleylated modified | Langmuir | 0.9961 | 0.974 | 0.974 | 0.9839 | 1 | [35] |
| (at 303 K) | hydrochar | ||||||||
| 24 | Tetracycline | Human hair-derived high surface area porous carbon material (HHC) | Langmuir | 0.9961 | 0.9402 | 0.9402 | 0.9962 | 0.9984 | [36] |
| (at 50 oC) | |||||||||
| 25 | Methylene Blue | Magnetic wakame biochar nanocomposites | Langmuir | 0.9959 | 0.9562 | 0.9562 | 0.9695 | 0.9995 | [21] |
| (at 20 oC) | |||||||||
| 26 | Tetracycline | Human hair-derived high surface area porous carbon material (HHC) | Langmuir | 0.9956 | 0.9538 | 0.9538 | 0.9938 | 0.9973 | [36] |
| (at 40 oC) | |||||||||
| 27 | Cd(II) | Commercial Activated Carbon (CGAC) | Langmuir | 0.9955 | 0.9239 | 0.9239 | 0.9894 | 0.9869 | [34] |
| 28 | Methyl Orange | Graphene oxide-NiFe LDH | Liu | 0.9949 | 0.9142 | 0.9142 | 0.9741 | 0.9983 | [31] |
| 29 | Methylene Blue | Activated lignin-chitosan extruded (ALiCE) | Langmuir | 0.9947 | 0.9256 | 0.9256 | 0.9916 | 0.9956 | [37] |
| 30 | Cr(VI) | Graphene oxide/Fe3O4/SO3H nanohybrid | Langmuir | 0.9946 | 0.9323 | 0.9323 | 0.9931 | 0.9866 | [38] |
| 31 | Hg (II) | Polydopamine decorated SWCNTs | Freundlich | 0.994 | 0.9583 | 0.9583 | 0.9972 | 0.9822 | [39] |
| 32 | Methyl Orange | NiFe LDH microspheres | Liu | 0.9939 | 0.9488 | 0.9488 | 0.9866 | 0.9968 | [31] |
| 33 | Acid Fuchsin (AF) | Amorphous solid based on the Pd12L24 cage | Langmuir | 0.9933 | 0.9547 | 0.9547 | 0.9884 | 0.9972 | [40] |
| (αMOC-1) | |||||||||
| 34 | Methyl Orange | NiO | Langmuir | 0.9928 | 0.9256 | 0.9256 | 0.9942 | 0.9676 | [20] |
| (at 30 oC) | |||||||||
| 35 | Methylene Blue | Maleylated modified | Langmuir | 0.9927 | 0.9554 | 0.9554 | 0.979 | 1 | [35] |
| (at 313 K) | hydrochar | ||||||||
| 36 | Methylene Blue | Magnetic wakame biochar nanocomposites | Langmuir | 0.9927 | 0.9261 | 0.9261 | 0.9531 | 0.9989 | [21] |
| -30 | |||||||||
| 37 | Methylene Blue | Maleylated modified | Langmuir | 0.9926 | 0.9478 | 0.9478 | 0.9623 | 1 | [35] |
| (at 323 K) | hydrochar | ||||||||
| 38 | Tetracycline | Iron loaded sludge biochar | Langmuir | 0.9922 | 0.9231 | 0.9231 | 0.979 | 0.9968 | [28] |
| (at 293.15 K) | |||||||||
| 39 | Acid Fuchsin (AF) | Multifunctionalized micromesoporous | Langmuir | 0.9915 | 0.7336 | 0.7336 | 0.781 | 0.999 | [41] |
| nano-silica KCC-1 | |||||||||
| (MF-KCC-1) | |||||||||
| 40 | Pb(II) | Magnetic biochar/MgFe-LDH | Langmuir | 0.9912 | 0.8699 | 0.8699 | 0.952 | 0.9994 | [42] |
| 41 | Pb(II) | Diethylenetriaminepentaacetic acid modified magnetic graphene oxide (DTPA/MGO) | Langmuir | 0.9909 | 0.6721 | 0.6721 | 0.8392 | 0.9973 | [43] |
| 42 | Cd (II) | Diethylenetriaminepentaacetic acid modified magnetic graphene oxide (DTPA/MGO) | Langmuir | 0.9897 | 0.7975 | 0.7975 | 0.9736 | 0.9948 | [43] |
| 43 | Crystal Violet | Activated Carbon of | Dubinin–Radushkevich | 0.9894 | 0.9574 | 0.9574 | 0.9906 | 0.9997 | [44] |
| Lemon Wood | |||||||||
| 44 | Cd(II) | Silica | Langmuir | 0.9893 | 0.9579 | 0.9579 | 0.9827 | 0.999 | [45] |
| Particles Chemically Modified by Conjugated β-Ketoenol Furan | |||||||||
| 45 | Tetracycline | Human hair-derived high surface area porous carbon material (HHC) | Langmuir | 0.9892 | 0.8244 | 0.8244 | 0.9961 | 0.9808 | [36] |
| (at 30 oC) | |||||||||
| 46 | Congo Red | Hybrid alginate/ | Langmuir | 0.9892 | 0.7833 | 0.7833 | 0.9916 | 0.9938 | [46] |
| natural bentonite | |||||||||
| 47 | Remazol Brilliant Blue | Biochar | Toth | 0.989 | 0.892 | 0.892 | 0.9748 | 0.9984 | [47] |
| 48 | Crystal Violet (CV) | MCM-41/MgO | Langmuir | 0.9865 | 0.8014 | 0.8014 | 0.9258 | 0.992 | [48] |
| A-20 | |||||||||
| 49 | Methylene Blue | Porous cellulosederived | Redlich-Peterson | 0.986 | 0.9223 | 0.9223 | 0.9651 | 0.9994 | [49] |
| carbon/montmorillonite nanocomposites | |||||||||
| 50 | Methylene Blue | Amorphous solid based on the Pd12L24 cage | Langmuir | 0.9846 | 0.7845 | 0.7845 | 0.9922 | 0.9755 | [40] |
| (αMOC-1) | |||||||||
| 51 | Crystal Violet (CV) | MCM-41/MgO | Langmuir | 0.9841 | 0.8156 | 0.8156 | 0.942 | 0.9771 | [48] |
| B-20 | |||||||||
| 52 | Acetaminophen | Commercial | Redlich–Peterson | 0.9821 | 0.8608 | 0.8608 | 0.9335 | 0.9995 | [50] |
| Activated Carbon (CAC) | |||||||||
| 53 | Methyl Orange | Amorphous solid based on the Pd12L24 cage | Langmuir | 0.9796 | 0.764 | 0.764 | 0.9411 | 0.9963 | [40] |
| (αMOC-1) | |||||||||
| 54 | Reactive Red 120 | Hybrid crosslinked chitosan-epichlorohydrin/TiO2 nanocomposite | Langmuir | 0.9795 | 0.8485 | 0.8485 | 0.9972 | 0.9979 | [51] |
| (CTS-ECH/TNC) | |||||||||
| 55 | Congo Red (CR) | Fe3O4 -g-PGMA-g-PEI | Langmuir | 0.9792 | 0.9265 | 0.9265 | 0.9889 | 0.9937 | [52] |
| 56 | Methylene Blue | Agroindustrial wastes (Soursop residue) | Sips | 0.9786 | 0.6666 | 0.6666 | 0.9631 | 0.9658 | [53] |
| 57 | Ciprofloxacin (CIP) | Montmorillonite (Mt) | Langmuir | 0.9774 | 0.725 | 0.725 | 0.9413 | 0.9995 | [54] |
| 58 | Tetracycline | Montmorillonite (Mt) | Langmuir | 0.9774 | 0.6595 | 0.6595 | 0.9593 | 0.9963 | [54] |
| 59 | Cu(II) | Diethylenetriaminepentaacetic acid modified magnetic graphene oxide (DTPA/MGO) | Langmuir | 0.9635 | 0.5736 | 0.5736 | 0.8655 | 0.9933 | [43] |
| 60 | Methylene Blue | Polyaniline/TiO2 hydrate | Temkin | 0.9621 | 0.7461 | 0.7461 | 0.8333 | 0.9932 | [55] |
| 61 | Pb(II) | Amidoxime-functionalized chelating resin (PAO-g-PS) | Langmuir | 0.9561 | 0.6339 | 0.6339 | 0.9835 | 0.9119 | [19] |
| 62 | Methylene Blue | Cross-linked chitosan/sepiolite composite | Freundlich | 0.9418 | 0.8442 | 0.8442 | 0.9745 | 0.9929 | [56] |
| 63 | Cd (II) | Amidoxime-functionalized chelating resin (PAO-g-PS) | Langmuir | 0.9411 | 0.4077 | 0.4077 | 0.9676 | 0.8693 | [19] |
| 64 | Cd(II) | Modified lawny grass adsorbent (RG) containing H[BTMPP] (Cyanex272) | Sips | 0.941 | 0.8148 | 0.8148 | 0.9632 | 0.9739 | [57] |
| 65 | Cu(II) | 4-ethyl thiosemicarbazide (ETSC) intercalated | Freundlich | 0.9334 | 0.7326 | 0.7326 | 0.9338 | 0.9944 | [58] |
| organophilic calcined hydrotalcite (OHTC) | |||||||||
| 66 | Methylene Blue | Chitosan cross-linked graphene oxide/lignosulfonate composite | Langmuir | 0.9261 | 0.4524 | 0.4524 | 0.509 | 0.9992 | [59] |
| (at 323 K) | |||||||||
| 67 | Basic Red 46 (BR46) | Activated carbon from Ziziphus lotus stones | Langmuir | 0.9156 | 0.5982 | 0.5982 | 0.7574 | 0.9958 | [60] |
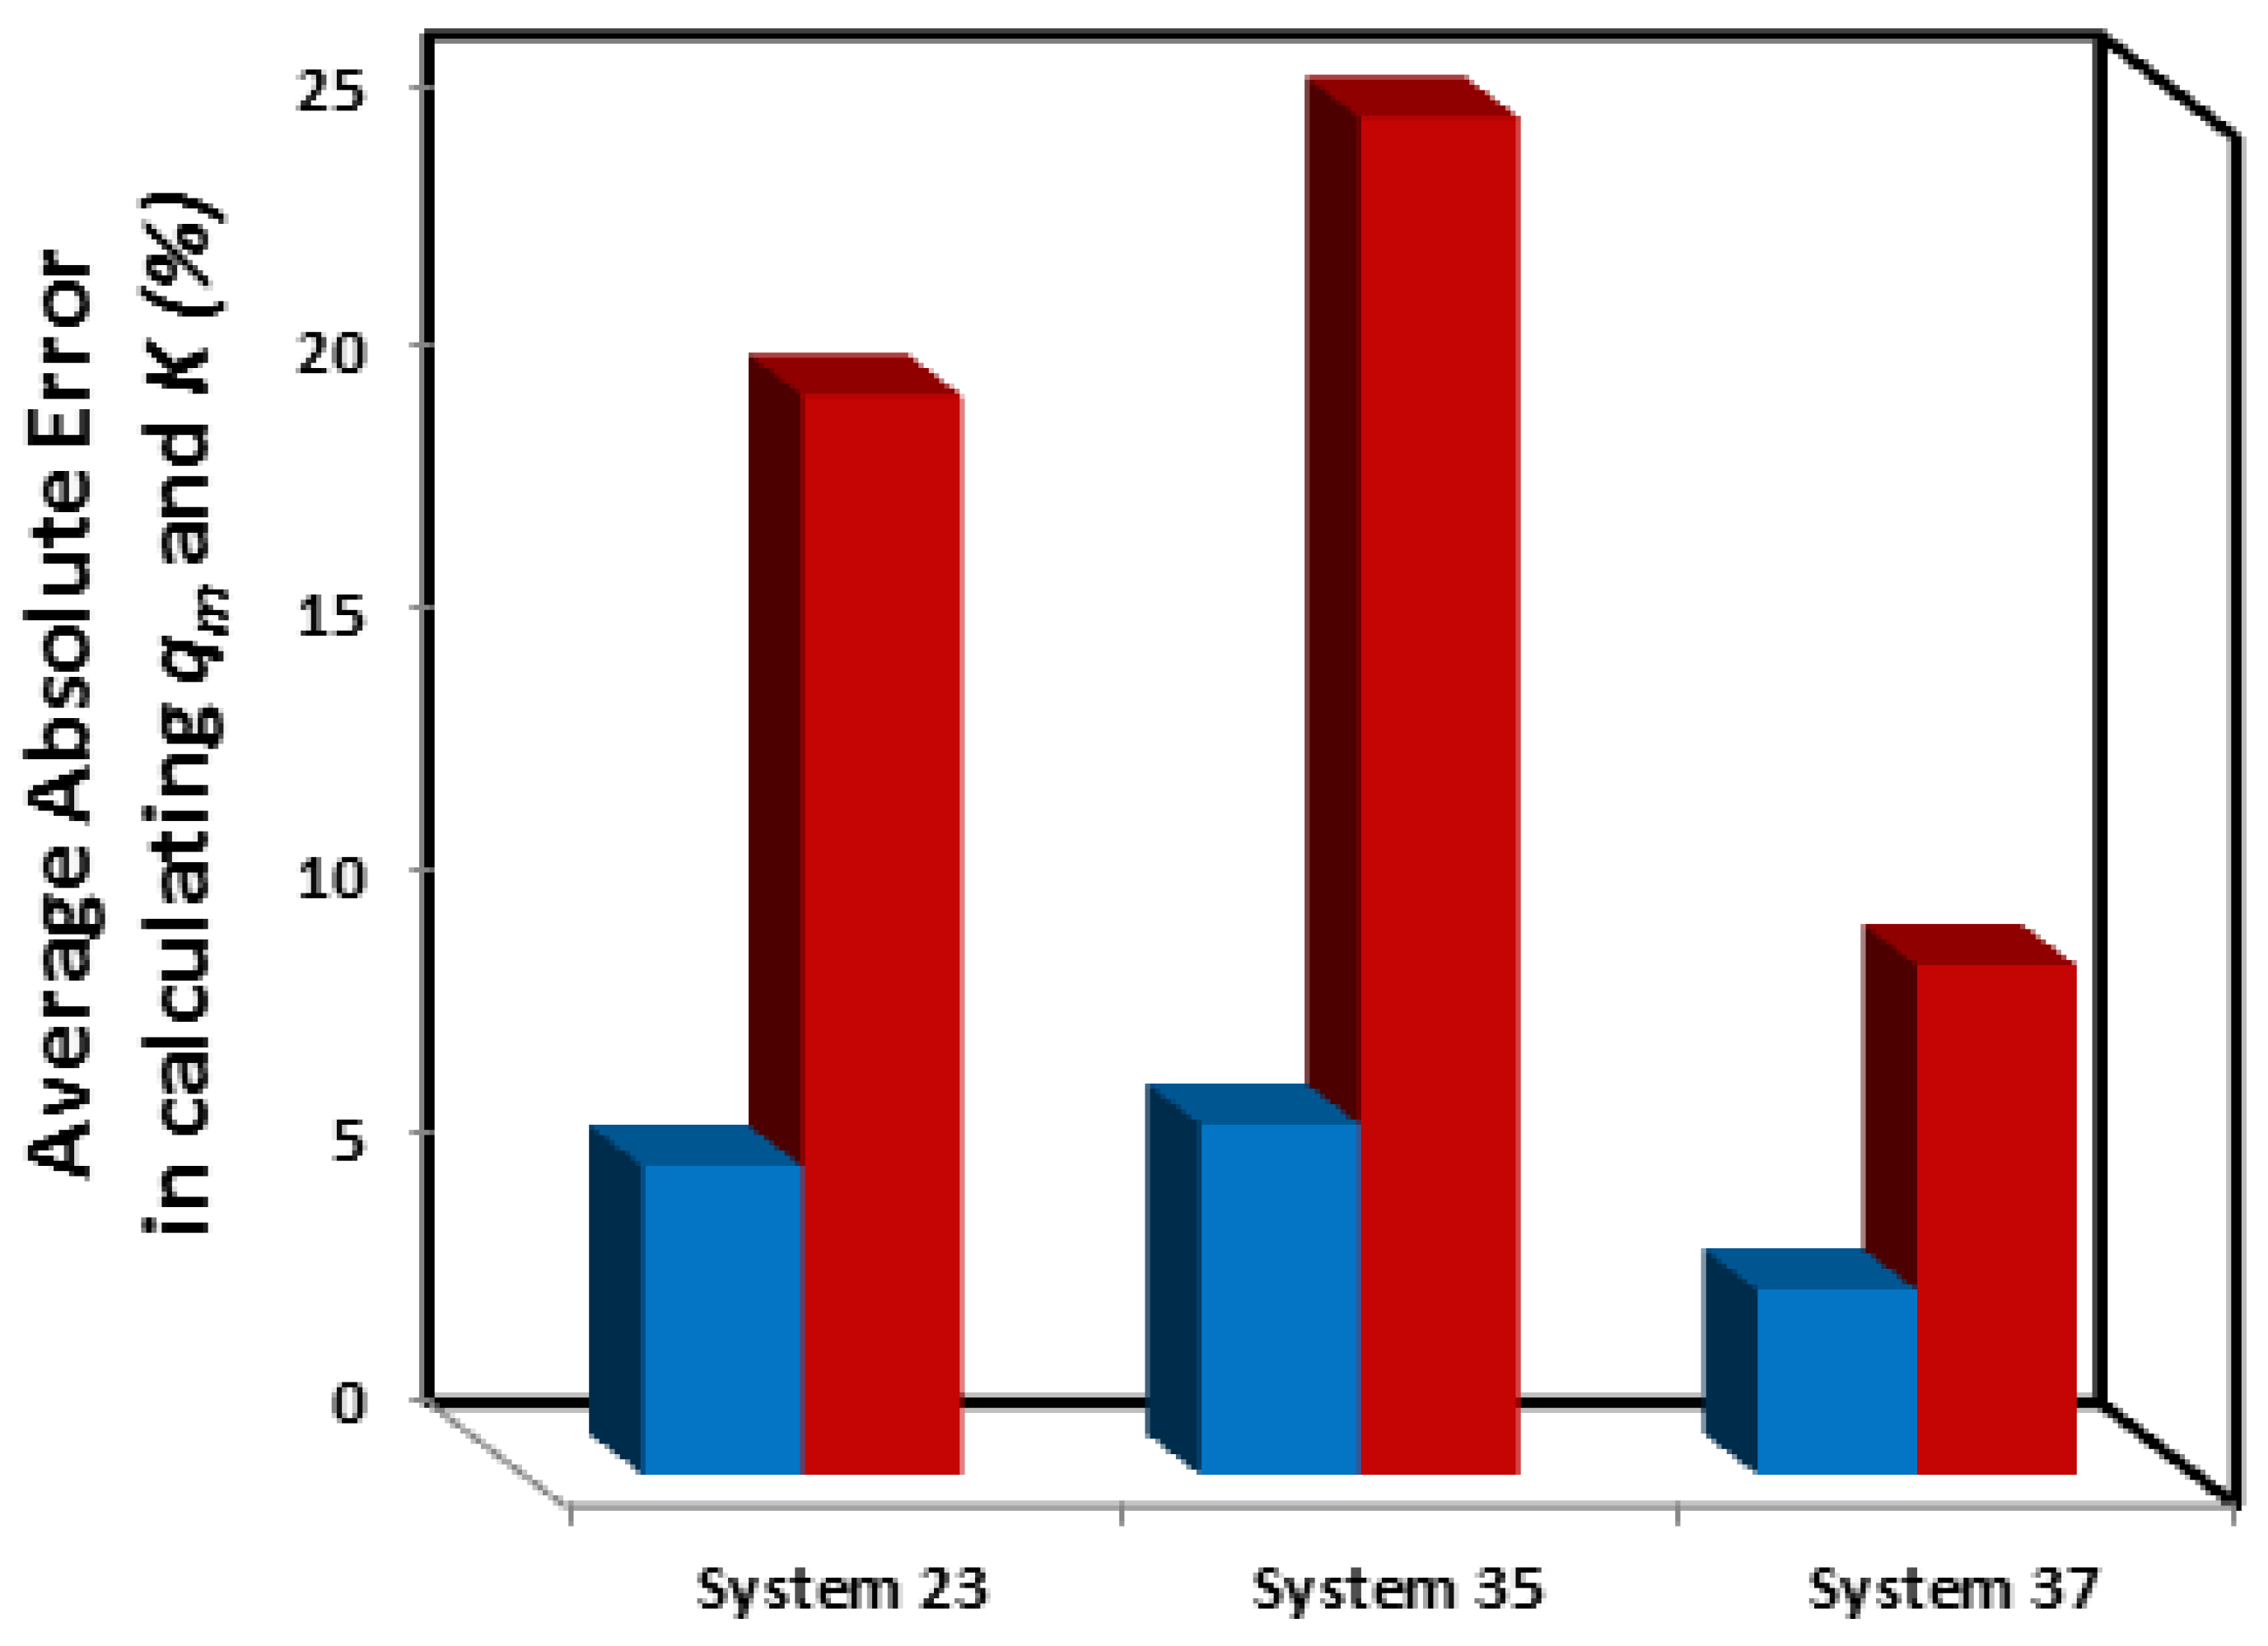
| System | ) of linear and Non-linear forms of the Langmuir Isotherm | Langmuir constant (K) of linear and Non-linear forms of the Langmuir Isotherm | |||||||||
|---|---|---|---|---|---|---|---|---|---|---|---|
| Non-linear | Form-4 | Form-3 | Form-2 | Form-1 | Non-linear | Form-4 | Form-3 | Form-2 | Form-1 | ||
| 1 | 30.6 | 31.77 | 31.59 | 34.96 | 31.25 | 0.0684 | 0.0643 | 0.0648 | 0.0567 | 0.0658 | |
| 2 | 29.04 | 28.91 | 28.85 | 29.58 | 28.98 | 0.0636 | 0.0642 | 0.0643 | 0.0622 | 0.0639 | |
| 3 | 34.51 | 33.94 | 33.69 | 31.54 | 34.12 | 0.0653 | 0.0671 | 0.0678 | 0.0738 | 0.0665 | |
| 4 | 36.18 | 37.6 | 37.29 | 37.73 | 37.03 | 0.0735 | 0.0692 | 0.0699 | 0.0687 | 0.0706 | |
| 5 | 54.72 | 54.68 | 54.67 | 54.64 | 55.24 | 0.4464 | 0.4502 | 0.4505 | 0.4507 | 0.3859 | |
| 6 | 192.2 | 192.6 | 192.2 | 192.3 | 192.3 | 1.822 | 1.806 | 1.816 | 1.857 | 1.8571 | |
| 7 | 62.65 | 62.48 | 62.42 | 62.11 | 62.11 | 1.648 | 1.703 | 1.71 | 1.75 | 1.987 | |
| 8 | 754.6 | 742.5 | 734.5 | 714.2 | 769.2 | 0.0195 | 0.021 | 0.0216 | 0.023 | 0.0187 | |
| 9 | 0.7877 | 0.7693 | 0.7657 | 0.7547 | 0.789 | 4.055 | 4.319 | 4.363 | 4.4805 | 4.072 | |
| 10 | 331.9 | 330.6 | 327.7 | 333.3 | 333.3 | 0.0465 | 0.0474 | 0.0483 | 0.0462 | 0.046 | |
| 11 | 42.12 | 42.77 | 42.54 | 43.47 | 42.55 | 0.1312 | 0.119 | 0.1215 | 0.1126 | 0.1191 | |
| 12 | 476.1 | 478.2 | 473.7 | 476.1 | 476.1 | 0.0129 | 0.0129 | 0.0131 | 0.0131 | 0.0129 | |
| 13 | 644.4 | 636.9 | 634.2 | 625 | 666.6 | 0.0162 | 0.0169 | 0.0171 | 0.0178 | 0.0156 | |
| 14 | 82.43 | 84.06 | 83.56 | 90.9 | 81.96 | 0.4699 | 0.4184 | 0.4254 | 0.3606 | 0.4436 | |
| 15 | 211.2 | 204.5 | 201.3 | 192.3 | 208.3 | 0.0284 | 0.0324 | 0.0341 | 0.0382 | 0.0296 | |
| 16 | 163.6 | 164.4 | 163.9 | 163.9 | 161.3 | 0.0887 | 0.0859 | 0.087 | 0.0877 | 0.1009 | |
| 17 | 246.5 | 250.4 | 248.5 | 250 | 243.9 | 0.024 | 0.0225 | 0.023 | 0.0224 | 0.0263 | |
| 18 | 198.4 | 191.1 | 189.6 | 181.8 | 196.1 | 0.0706 | 0.0798 | 0.0812 | 0.0878 | 0.0745 | |
| 19 | 301.2 | 303 | 300.7 | 303 | 303 | 0.0119 | 0.0118 | 0.0119 | 0.0119 | 0.0117 | |
| 20 | 513.2 | 454.5 | 442.9 | 384.6 | 500 | 0.0661 | 0.0881 | 0.0918 | 0.112 | 0.0754 | |
| 21 | 776 | 934.8 | 859.6 | 833.3 | 909 | 0.0006 | 0.0005 | 0.0005 | 0.0005 | 0.0005 | |
| 22 | 20.12 | 20.28 | 20.22 | 20.53 | 20.57 | 0.1177 | 0.1117 | 0.1132 | 0.1069 | 0.0933 | |
| 23 | 209.4 | 224.2 | 217.2 | 250 | 208.3 | 0.0466 | 0.038 | 0.0404 | 0.0315 | 0.0443 | |
| 24 | 1151 | 1154 | 1149 | 1111 | 1111 | 0.4745 | 0.4675 | 0.48 | 0.5 | 0.4285 | |
| 25 | 489.4 | 491.8 | 488 | 500 | 500 | 0.8331 | 0.8327 | 0.8708 | 0.8333 | 0.7407 | |
| 26 | 163.5 | 174 | 169.6 | 178.5 | 163.9 | 0.0246 | 0.0207 | 0.0217 | 0.0196 | 0.0236 | |
| 27 | 27.34 | 29.34 | 28.31 | 34.96 | 28.16 | 0.0088 | 0.0075 | 0.008 | 0.0057 | 0.0081 | |
| 28 | 35.7 | 35.53 | 35.41 | 35.21 | 35.46 | 0.3835 | 0.3981 | 0.406 | 0.4188 | 0.404 | |
| 29 | 36.24 | 33.28 | 32.12 | 28.65 | 35.46 | 0.1206 | 0.1588 | 0.1715 | 0.211 | 0.134 | |
| 30 | 220.6 | 243.9 | 233.8 | 270.2 | 222.2 | 0.0112 | 0.0092 | 0.0098 | 0.0077 | 0.0108 | |
| 31 | 249.9 | 235 | 230 | 222.2 | 243.9 | 0.1119 | 0.1297 | 0.1353 | 0.1433 | 0.1188 | |
| 32 | 404.5 | 384.9 | 375.3 | 357.1 | 400 | 0.0481 | 0.0612 | 0.0669 | 0.0784 | 0.0517 | |
| 33 | 139.6 | 140.9 | 138.6 | 135.1 | 135.1 | 0.0308 | 0.0299 | 0.0312 | 0.0328 | 0.0339 | |
| 34 | 273.2 | 296.3 | 288.1 | 263.1 | 285.7 | 0.0016 | 0.0014 | 0.0014 | 0.0016 | 0.0015 | |
| 35 | 1180 | 1191 | 1183 | 1250 | 1250 | 0.5033 | 0.4698 | 0.4917 | 0.4444 | 0.4 | |
| 36 | 536.4 | 544.1 | 534.5 | 526.3 | 555.5 | 0.8916 | 0.8379 | 0.9046 | 0.8636 | 0.7826 | |
| 37 | 1171 | 1172 | 1163 | 1111 | 1250 | 0.5675 | 0.5756 | 0.6072 | 0.6428 | 0.421 | |
| 38 | 103.2 | 98.49 | 96.24 | 92.59 | 103.1 | 0.1252 | 0.1572 | 0.1702 | 0.1888 | 0.1286 | |
| 39 | 627.6 | 641.9 | 550.9 | 833.3 | 625 | 0.0711 | 0.0683 | 0.093 | 0.0439 | 0.0658 | |
| 40 | 465.8 | 482.5 | 464.1 | 526.3 | 476.1 | 0.0694 | 0.059 | 0.0677 | 0.0481 | 0.0619 | |
| 41 | 299.6 | 264.2 | 243 | 192.3 | 285.7 | 0.0446 | 0.0793 | 0.0994 | 0.1529 | 0.0578 | |
| 42 | 134.2 | 113.5 | 101.7 | 89.28 | 131.5 | 0.0445 | 0.1656 | 0.2886 | 0.3862 | 0.0573 | |
| 43 | 23.64 | 24.12 | 23.88 | 24.44 | 23.58 | 1.513 | 1.332 | 1.392 | 1.274 | 1.358 | |
| 44 | 51.97 | 52.3 | 51.78 | 53.47 | 54.05 | 0.4185 | 0.4088 | 0.4267 | 0.3816 | 0.2724 | |
| 45 | 351.9 | 414 | 367.2 | 625 | 357.1 | 0.0161 | 0.0096 | 0.0122 | 0.0053 | 0.0136 | |
| 46 | 128.9 | 158.1 | 140.4 | 192.3 | 133.3 | 0.0158 | 0.0101 | 0.0122 | 0.0076 | 0.0135 | |
| 47 | 92.99 | 98.63 | 95.05 | 105.2 | 90.9 | 0.0517 | 0.0396 | 0.0443 | 0.0336 | 0.056 | |
| 48 | 1646 | 1754 | 1583 | 2500 | 1666 | 0.5895 | 0.4981 | 0.6215 | 0.2857 | 0.5 | |
| 49 | 138.1 | 137.6 | 136 | 133.3 | 144.9 | 34.22 | 38.52 | 41.84 | 37.5 | 6.9 | |
| 50 | 194.3 | 236.7 | 208.8 | 294.1 | 196.1 | 0.0162 | 0.0099 | 0.0126 | 0.0069 | 0.0145 | |
| 51 | 1844 | 1860 | 1681 | 2500 | 2000 | 0.2046 | 0.2067 | 0.2534 | 0.1333 | 0.1785 | |
| 52 | 226.6 | 232.5 | 225.4 | 250 | 232.8 | 0.1214 | 0.1013 | 0.1176 | 0.0778 | 0.0743 | |
| 53 | 398 | 355.8 | 329.7 | 303 | 384.6 | 0.0531 | 0.0924 | 0.1209 | 0.1506 | 0.0631 | |
| 54 | 208.6 | 235.5 | 215 | 227.2 | 208.3 | 0.8193 | 0.5924 | 0.6982 | 0.6197 | 0.7619 | |
| 55 | 1909 | 1865 | 1827 | 1666 | 2000 | 0.0913 | 0.1204 | 0.1299 | 0.1538 | 0.0581 | |
| 56 | 41.1 | 41.36 | 40.17 | 38.75 | 47.39 | 0.5751 | 0.6697 | 0.7933 | 0.8805 | 0.0913 | |
| 57 | 1.065 | 1.254 | 1.032 | 2.398 | 1.072 | 5.812 | 3.53 | 5.353 | 1.401 | 4.8 | |
| 58 | 0.9897 | 1.055 | 0.9372 | 1.183 | 1.011 | 50.31 | 39.25 | 54.05 | 30.4 | 32.19 | |
| 59 | 2.063 | 3.338 | 1.978 | 3.837 | 2.147 | 0.3131 | 0.1315 | 0.3226 | 0.108 | 0.2689 | |
| 60 | 585.7 | 601.6 | 524.5 | 625 | 625 | 0.0838 | 0.0849 | 0.1138 | 0.0765 | 0.054 | |
| 61 | 118.7 | 88.38 | 63.8 | 35.84 | 112.3 | 0.0264 | 0.0836 | 0.2013 | 0.5017 | 0.0363 | |
| 62 | 399.5 | 360.1 | 316.8 | 294.1 | 384.6 | 0.0527 | 0.0973 | 0.1447 | 0.1365 | 0.0678 | |
| 63 | 1.405 | 1.89 | 1.445 | 1.966 | 1.43 | 0.2776 | 0.1606 | 0.2533 | 0.1511 | 0.2564 | |
| 64 | 13.99 | 14.45 | 13.8 | 13.88 | 14.12 | 0.0163 | 0.0144 | 0.0176 | 0.0166 | 0.0145 | |
| 65 | 57.85 | 56.39 | 53.74 | 50.25 | 64.1 | 0.2559 | 0.6073 | 0.829 | 0.99 | 0.0881 | |
| 66 | 1015 | 1074 | 896.9 | 909.1 | 1111 | 1.134 | 1.134 | 2.508 | 1.5714 | 0.5625 | |
| 67 | 259.5 | 271.6 | 257.8 | 250 | 312.5 | 1.064 | 0.7197 | 1.203 | 1.29 | 0.1088 | |
| (mg/L) | (mg/g) | Langmuir Parameters | Form-1 | Form-2 | Form-3 | Form-4 | Non-linear |
|---|---|---|---|---|---|---|---|
| 0 | 0 | (mg/g) | 119.05 | 227.27 | 118.81 | 152.03 | 118.25 |
| 50 | 14.28571 | ||||||
| 100 | 40 | ||||||
| 150 | 60 | ||||||
| 200 | 72.72727 | ||||||
| 250 | 80.64516 | ||||||
| 300 | 85.71429 | 0.0047 | 0.0015 | 0.0062 | 0.0032 | 0.0069 | |
| 350 | 89.09091 | ||||||
| 400 | 91.42857 | ||||||
| 450 | 93.10345 | ||||||
| 500 | 94.33962 | ||||||
| 550 | 95.27559 | ||||||
| 600 | 96 | ||||||
| 650 | 96.57143 | ||||||
| 700 | 97.0297 | 0.9649 | 0.9214 | 0.5222 | 0.5222 | 0.9658 | |
| 750 | 97.4026 | ||||||
| 800 | 97.70992 | ||||||
| 850 | 97.9661 | ||||||
| 900 | 98.18182 | ||||||
| 950 | 98.36512 | ||||||
| 1000 | 98.52217 |
| System | Langmuir Isotherm | Toth Isotherm | |||||||
|---|---|---|---|---|---|---|---|---|---|
| (mg/g) | (mg/g) | ||||||||
| 61 | 1.4055 | 0.2777 | 0.9561 | 0.0173 | 0.8862 | 0.2459 | 202.9 | 0.9950 | 0.0058 |
| 63 | 2.063 | 0.3131 | 0.9411 | 0.0309 | 1.338 | 0.2665 | 27.43 | 0.9990 | 0.0039 |
| 64 | 13.99 | 0.0164 | 0.9410 | 0.2921 | 14.96 | 0.0217 | 0.7773 | 0.9985 | 0.0288 |
Disclaimer/Publisher’s Note: The statements, opinions and data contained in all publications are solely those of the individual author(s) and contributor(s) and not of MDPI and/or the editor(s). MDPI and/or the editor(s) disclaim responsibility for any injury to people or property resulting from any ideas, methods, instructions or products referred to in the content. |
© 2023 by the authors. Licensee MDPI, Basel, Switzerland. This article is an open access article distributed under the terms and conditions of the Creative Commons Attribution (CC BY) license (http://creativecommons.org/licenses/by/4.0/).


