Preprint
Article

Complex Dynamical Orbit Re-entry Navigation and Control

Altmetrics

Downloads

80

Views

30

Comments

0

This version is not peer-reviewed

Submitted:

08 December 2023

Posted:

12 December 2023

You are already at the latest version

Alerts
Abstract
Calculating a minimum-time trajectory requires the solving of a boundary value problem resulting from invocation of necessary conditions of optimality to set up a set of ordinary differential equations to solve the trajectory between the initial position and desired ending position with set constraints on the path between the two. This manuscript expresses the minimum time optimum trajectory between a satellite in a geosynchronous orbit and a target set on earth’s surface utilizing a non-rotating earth centric coordinate system. Expressing motion in coordinates of rotating reference frames necessitates transformation between reference frames, and one such transformation is embodied in the Direction Cosine Matrices (DCM) formed by a sequence of three successive frame rotations. Rotation about the local wing of an aerospace vehicle is almost never the pitch angle, yet modern application of kinematics often assumes such (with accompanying angular error). The same assertion is usually true about the nature of roll and yaw angles. This manuscript evaluates which sequence is the most advantageous for an object starting in space and then travels through the atmosphere to a target on the Earth’s surface. Simulation precision (validated by the quaternion normalization condition) reveals the so-called 132 rotation is the most accurate with an average error of 0.14° and a computational time of 0.013 seconds: resulting in a 97.95% increase in accuracy over the ubiquitous 321 “aerospace” rotation sequence and a 99.84% increase over the so-called 313 “orbital” rotation sequence. Utilizing the proposed optimal trajectory candidate yields a total flight time of 2 hours, 34 minutes and 46 seconds, or an average velocity of 3.85 kilometers per second, while impacting the target with a velocity of 11.54 kilometers per second.
Keywords: 
Subject: Engineering  -   Aerospace Engineering

1. Introduction

The study presented in this manuscript seek to minimize errors to increase safe deliveries, and the focus is twofold: 1) errors due the choice of kinematic representation (i.e., “representation errors”), where there is a difference between the mathematical representation and the beliefs about the representation by the users; and 2) reentry trajectory optimization to minimize the delivery time.

1.1. Errors Induced by Choice of Kinematic Representation

The study of forces in action, known as kinetics, combined with the properties of motion without reference to forces, or kinematics, forms the study of dynamic motion. In 1775 Leonhard Euler, a Swiss mathematician, began the formal study of kinematics [1]. Following this Baron William Thomson, better known as Lord Kelvin, and a physicist named Guthrie Tait [5] showed that system of dynamic motion maintains energy conservation. A decade later in 1876, Theoretische Kinematik by Franz Reuleaux was republished in English [6] and became a staple in engineering courses from Italy to Russia and the United States by taking practices of engineers and compiling them into a single source document. Prior to the end of the century Thomas Wallace Wright compiled necessary topics for kinematics into a single disquisition [7] that was specifically designed to allow mathematics as simple as basic geometry and trigonometry while still allowing calculus for more compact forms. Five years later in 1903 John Theodore Merz, a German British chemist attempted to unify the kinematic field of thought by publishing a history of European thought on the subject [8].
In a philosophical effort to give credit to the works of Chasle, Hamilton and Rodrigues, Sir Edmund Whittaker published four editions in 1904 [9-12]. In contrast to the approach of Whittaker, Irving Porter Church focused on the engineering approach and published his own guide in 1908 [13]. In an effort to build on Wrights work [14] and reduce the mathematical requirements further Christian Hugo Eduard Study, another German mathematician published reference [15] in 1913. Five years later Andrew Gray argued that the key facet to understand dynamics is kinematics in reference [16]. Gray’s assertion was reemphasized in 1954 when Clifford Truesdell stated, “I cannot too strongly urge that a kinematical result is a result valid forever, no matter how time and fashion may change the ”laws” of physics” [17] and then again in 1967 when G.C. Fox stated “It is my belief that students have difficulty with mechanics because of an inadequate knowledge of kinematics” [18].
In the second half of 1950’s Kane focused on kinetics and expounded on D’Alembert’s version of Lagrange’s equation [20,21]. Computational capabilities drastically approved over the following decade and were utilized by Fang in order to develop a way to mathematically simulate rigid body rotational kinematics [22]. Henderson, in the late 1970’s, further elaborated on the kinematic relationships between rotational sequences as well as the four-dimensional quaternion and direction cosine matrices [23,24]. From this history, the sequential rotation sequences were formed with the two specific sequences being termed the aerospace sequence about repeating axes, sometimes referred to as the “Tait-Bryan angles”, and the orbital sequence using axis-type repetitions, or the “proper Euler angles”.
In the 1980’s, ubiquitous acceptance of two rotation sequences (the so-called “orbital” sequence, and the so–called “aerospace” sequence) appeared in the literature and mature textbooks. [25] In the following decade of the 1990’s renewed interest in improvements was evidenced amidst the ubiquitously accepted paradigms elaborated in a comprehensive survey presented in [26] and evaluation of linearization schemes in reference [27]. Renewed interest in the errors resulting from a chosen kinematic selection was sparked at conference in the United Kingdom at the turn of the century [28] and elaborated for attitude estimation the same year in the Journal of Guidance, Control, and Dynamics. [29] The differences in choices for parameterizing attitude was presented geometrically in 2013. [30] From the available rotation choices, the question may be posed: of the twelve possible sequences, which is the best to convert inertial coordinates to body coordinates? In 2018, Smeresky and Rizzo [31] studied the sequence known as the so–called “aerospace sequence” (also referred to as “3-2-1”) and concluded that the yaw and pitch angles do not accurately depict a rotation about the body’s z –axis and y –axis respectively. Conversely, only the roll angle, or last angle in the rotation sequence, is accurate in the rotation about the body’s x -axis. These facts drive some of the innovations in this manuscript. In 2019, [32] presented the full analytical derivations of the attitude error kinematics equations.
Two figures of merit are used to evaluate the twelve rotation sequences: mean and standard deviation of the representation error to indicate how the tested sequence compares to true roll, pitch and yaw angles and computational burden as shown by total calculation time which shows relative numerical superiority. As an aside, this manuscript separates itself from the work of Smeresky, et. Al, [31] by calculating absolute representation error and precise execution time of the rotation sequence as opposed to tracking errors and end-to-end simulation run-time. Instead, the kinematics portions of this manuscript repeat and validate just–published work. [33]. Meanwhile, the application of Pontryagin’s minimization methods [34] follow the procedures laid out by Sandberg [35] as elaborated in [36] are utilized for the trajectory optimization portions of this manuscript’s proposals, importantly notice time minimization is proposed here, where Sandberg [35] and Raigoza [37] optimized for minimum fuel usage and Raigoza proposed autonomous collision avoidance during reentry.
The results from kinematic analysis show that the so-called aerospace sequence and the reverse (123 sequence) are contrasting in error and computational time with the aerospace sequence being superior between the two. Additionally, the 123 sequence results in a significantly slower computational time than all other rotation sequences. Symmetric rotation sequences, or those that rotate about the same axis first and third in order, average slower computational times than non-symmetric, or rotations involving all three axes, despite requiring the mathematical process and steps to solve for Euler angles. Of all the non-symmetric rotation sequences, the “aerospace” rotation sequence (also called the “321”) was the fastest, while the fastest symmetrical sequence was the “232” demonstrating lower computational requirements.

1.2. Reentry Trajectory Optimization to Minimize the Delivery Time

There are many terms that can be associated with an optimum trajectory; whether the problem is looking for the path of least resistance, the path that provides the best fuel burn, or the path that takes the least amount of time to get from point a to point b. Most of the time, these paths are not direct lines connecting the two points. Knowing the starting and end points turn the selection of the flight path into a boundary value problem solved using ordinary differential equations that can be solved in a multitude of ways. The first, and possibly least complex, method is known as the shooting method where the problem is turned into an initial value problem. A major downfall to the shooting method is initial guesses are required for any unknown initial values. If the provided initial guesses are even minutely off, the entire problem will “implode” and fail to provide a viable solution as the problem is extremely sensitive to initial guess errors [NEW 1]. A second method is known as the collocation method where the boundary value problem is provided a set number of points to form a mesh between the start and end points and this mesh is then continuously analyzed to form an optimal path between the two [NEW2]. As the dynamics and variables used are all known positions, the collocation method eliminates the errors induced by guessing errors but does typically require more computing power than the shooting method. The MATLAB function bvp4c is a built-in program that uses the collocation method. Lastly, multiple companies have developed their own proprietary programs that will solve boundary value problems to a set accuracy. This manuscript uses the program “DIDO” to solve the dynamic optimal problem for a missile set in geosynchronous orbit to a target on the earth’s surface. An advantage to using DIDO is its ability to solve complex dynamic problems without requiring the user to generate the Hamiltonian or any costates or endpoint vectors [NEW3]. By not having to code the Hamiltonian or costate equations, the opportunities for human error in coding is limited to the initial complex dynamic functions.
In the case of a missile delivered from orbit, the amount of fuel used, while a consideration, does not outweigh the necessity to strike the target as fast as possible. A solid rocket motor will burn at a set rate and does not require the oxygen of the atmosphere to burn, and as such can be planned for as a set constant depending on flight time. To validate the results achieved, the Hamiltonian and all costates are developed to concur with the products from DIDO’s program. By manually computing the Hamiltonian and associated equations, natural points are produced that can be analyzed to ensure the validity of the simulation. The results from this manuscript produce a minimum time trajectory from the launch position to chosen target site with a flight time of two hours, thirty-four minutes and forty-six seconds, a fraction of the time required to launch in the opposite direction.
B. 
Broad context and proposed innovations
Just last year, [42] proposed and investigated the potential of using suborbital space vehicles for the transportation of cargo to precise delivery locations. Towards achievement of the necessary high–precision of delivery to ensure safety, this manuscript describes selection of kinematics representations to minimize errors and also includes a formal time–minimizing optimization problem seeking rapid delivery capabilities. Three-dimensional (rotational and translational) motion with six degrees of freedom when applied to an object delivered from geostationary orbit. Due to size constraints in modern systems and to minimize necessary computing power, efficient schemes are desired to provide vehicle guidance. Determining the most accurate and computationally efficient kinematic representation is, therefore, essential to producing an effective space delivery capability.
  • This research simulates an object launched from geosynchronous orbit with limited computing power. Proposed innovations include:
  • Identification of an optimal (minimum time) trajectory from a set launch point to any target on the surface of the earth as measured by minimal time of flight.
  • Identification of most accurate rotation sequence, where accuracy is evaluated based on ability to correctly represent rotations about body axes (the paradigm expected by a pilot).
  • Identification of the options with advantageous computational requirements measured in minimal computational time.

2. Materials and Methods

Due to the design of the project, the optimal trajectory is one that takes the least amount of time for the object to arrive at the targeted destination within a set number of constraints. Pontryagin’s Principle was used to accomplish this minimum time trajectory by solving a boundary value problem with ordinary differential equations.

2.1. Dynamic Problem Framing

A state variable is one that describes the corresponding state of a dynamic system and can be written as a function of a control variable and the dynamic function of that system. When the state dynamic functions are known, the performance function can be written as Equation 1, where J is the standard performance function, x is a state vector, u is the control variable, E is the endpoint performance (also known as the cost function) and F is the running performance (also known as the running cost).
J x · , u ( · ) = E x f + t 0 t f F ( x t , u ( t ) ) d t
To minimize the performance function, the state variables are normalized using a common unit of measurement, CU, to ensure that the units make sense. The common unit is used to create a costate identified by λ as shown in Equation 2.
λ = C U x u n i t
Each state and costate variable do not just consist of a single value but is instead a vector and combines to create the value ω as shown in Equation 3.
ω x = λ · x = λ 1 x 1 + λ 2 x 2 + λ N x x N x
Knowing this combination, the units of Equation 1 are the common unit established to form the costate vector since the endpoint performance is composed of the common unit and the running performance is the common unit per time unit integrated.
Table 1. Table of proximal variable definitions.
Variable/concept Definition Variable/concept Definition
J Performance Function x General State Vector
F Running Performance Function E Endpoint Performance Function
u Control Variable λ Costate Variable
CU Common Unit

2.2. Pontryagin’s Principles

Pontryagin used a series of equations to determine a candidate optimal solution written as “HAMVET” [36]. These letters represent the sequence: Hamiltonian, Adjoint Equation, Minimization of the Hamiltonian, Value Condition, Evolution Condition, and Transversality. The process is called HAzMAT in [34].

2.2.1. Hamiltonian construction

The Hamiltonian function is defined by the running cost and costate transposed as a function of the state and control variables as shown in Equation 4.
H λ , x , u = F x , u + λ T f x , u

2.2.2. Adjoint Equations

The adjoint equations describe the rate of change of the costate vector and is defined as the partial derivative of the Hamiltonian with respect to the corresponding state vector as shown in Equation 5.
λ ˙ = H x
By utilizing the adjoint equation, a boundary value problem is created. Knowing the endpoints, or the beginning and ending conditions, the optimal trajectory connecting the endpoints can be solved for.

2.2.3. Minimization of the Hamiltonian

The Hamiltonian is minimized with respect to the control variable only as shown in Equation 6 in effort to provide additional variables to set as boundary points for the overall solution. Additionally, minimizing with respect to the control variables provides a verification and validation point to check the solution.
H u = 0

2.2.4 Final Value Condition

In certain problems when the total time is unknown or complicated, the Value Condition becomes necessary to provide an optimal stopping condition and is defined as E ̅ as shown in Equations 7 and 8.
H @ t f E ¯ t f
E ¯ = t f + υ 1 x f x f + υ 2 x f x f +
Table 2. Table of proximal variable definitions.
Variable/concept Definition Variable/concept Definition
H Hamiltonian Function E ¯ Final Value Condition
F Running Performance λ Costate Variable
x State Variable u Control Variable
t Time

2.2.5 Hamiltonian Evolution Condition

In some situations, a control input will not provide a constant value Hamiltonian, but instead require control constraints. An example of a situation requiring a control constraint is an airplane with a maximum deflection angle of a control surface. At some point, the control surface will reach its maximum deflection and require a different control input to maintain trajectory. These control constraints are placed into the problem as shown in Equation 9.
u L u ( t ) u U
Karush observed that using this constraint, if the control variable is equal to the lower constraint, then the partial of the Hamiltonian with respect to that variable must be greater than zero. Similarly, if the control variable equals the maximum constraint, then the partial is less than zero. Finally, if the control variable is between the two constraints, then the partial equals zero. The problem with this solution is that it relies on the assumption that the Hamiltonian has a constant slope with respect to the control variable instead of realizing the possibility that the relationship is not constant in nature. To account for the possibility of a nonlinear relationship, the Lagrangian of the Hamiltonian, H ̅, is created as shown in Equation 10 where μ is another control variable such that the partial of the Hamiltonian plus this variable is equal to zero.
H ¯ μ , λ , x , u , t H λ , x , u , t + μ T μ
Setting the partial derivative of the Lagrangian of the Hamiltonian with respect to the control variable equal to zero allows the use of what is known as the Karush-Kuhn-Tucker, or KKT, conditions. The two conditions are the stationarity condition and the complementarity condition shown in Equations 11 and 12.
H u = 0
μ i 0 = 0 0             u i = u i l o w e r u i l o w e r < u i < u i u p p e r u i = u i u p p e r
This process changes the basic boundary value problem established with the formation of the adjoint equation into a differential algebraic non-smooth boundary problem but allows for the possibility of a nonlinear control.
Table 3. Table of proximal variable definitions.
Variable/concept Definition Variable/concept Definition
u Control Variable H Hamiltonian Function
μ Stationarity Control Variable λ Costate Variable
x State Variable t Time
E Endpoint Performance

2.2.6. Transversality

Transversality is a tool that enables the generation of additional boundaries necessary to solve the boundary value problem by checking the ending value of the costate vector by setting it equal to the change in the Endpoint Lagrangian developed by the Endpoint Value Condition, defined by Equation 8, with respect to the change in the final condition of each respective state as shown in Equation 13.
λ x t f = E ¯ x f

2.3. Solving the Boundary Value Problem

There are a few different methods in which to attempt to determine an optimal solution to the boundary value problem. The first, known as the shooting method, is a simple iterative approach in which the boundary value problem is transformed into an initial value problem using the known initial values and subsequently guessing on the remaining unknown initial values. These values are then iterated forward through the state dynamic equations to see if the final conditions set forth are met. If the required conditions are not met, the initial conditions that were guessed are changed and equations are run again. This process repeats until the conditions do meet at which point the solution becomes a candidate for the optimal solution pending verification and validation. The shooting method is extremely sensitive to small errors in the initial values used for the problem as these errors are then magnified through the dynamic state equations during the iteration.
The second method of solving the boundary value problem is known as the collocation method. The collocation method creates a mesh of a set number of points between the initial condition to the final condition and then adjusts each of these points until all conditions of the BVP are satisfied through the dynamic equations given. The collocation method requires more guesses than the shooting method as any unknown final conditions will need to be guessed in addition to the initial conditions. Additionally, this method requires a great deal more computing power.
Lastly, some companies or corporations create their own software designed to solve the boundary value problem. These programs are typically not either shooting or collocation methods, but instead generate their own algorithm to produce the solution. For this project, a program called “DIDO” [43] is used that takes the problem with the dynamic equations and formats Pontryagin’s Principle into a boundary value problem and then produces a candidate solution. To understand the solution that DIDO gives, it is important that the use works through Pontryagin’s Principle and conduct verification or validation in order to determine if the candidate solution is truly optimal.
For kinetics, this manuscript will discuss the use of Newton’s and Euler’s principles and specifically how they combine to form Chasle’s theorem to form a direct line to explaining the six degrees of freedom in kinetics. Direction cosines and the matrices they form, or quaternions, describe the body of an object in terms of a predefined axis.

2.4. Kinetics of Rotational Motion

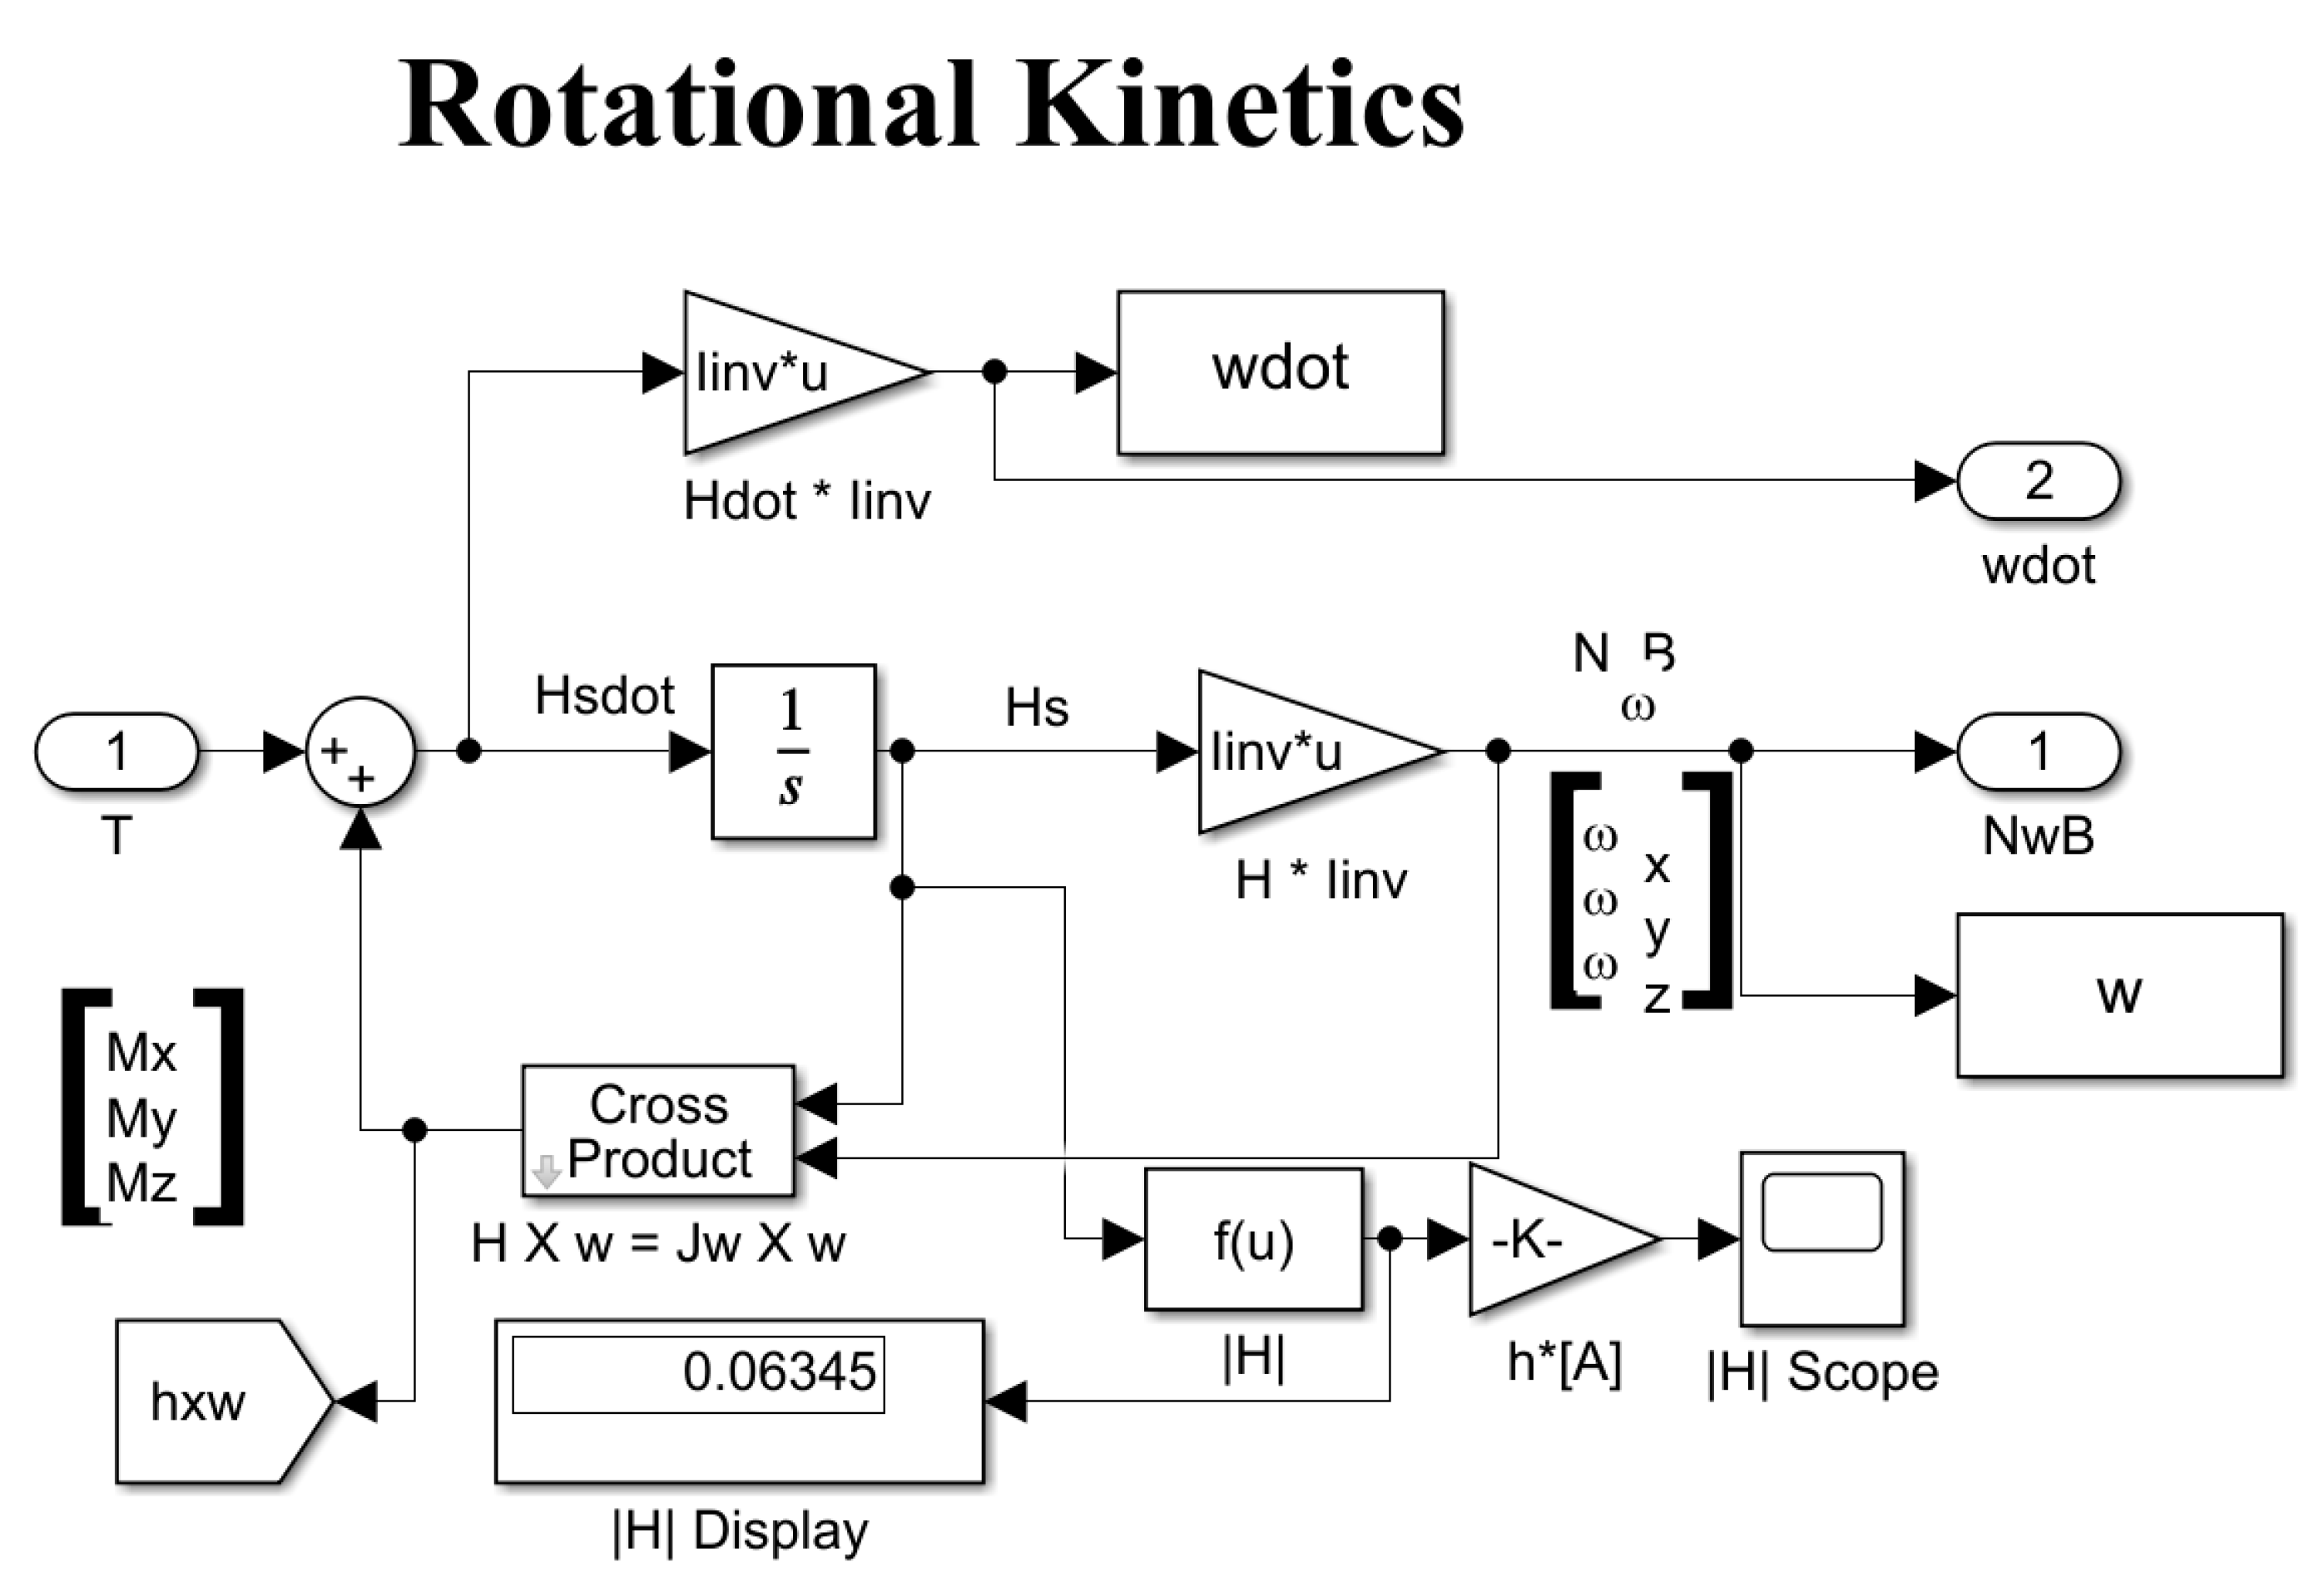
In accordance with Euler’s equations of motion, the sums of externally applied torques will angularly accelerate a proportional mass moment of inertia as depicted in Equation 14, where τ is torque, J is the rotation tensor, and ω is the angular velocity.
τ n = J α n τ = J ω ˙ + ω × J ω

2.5. Kinetics of Translational Motion

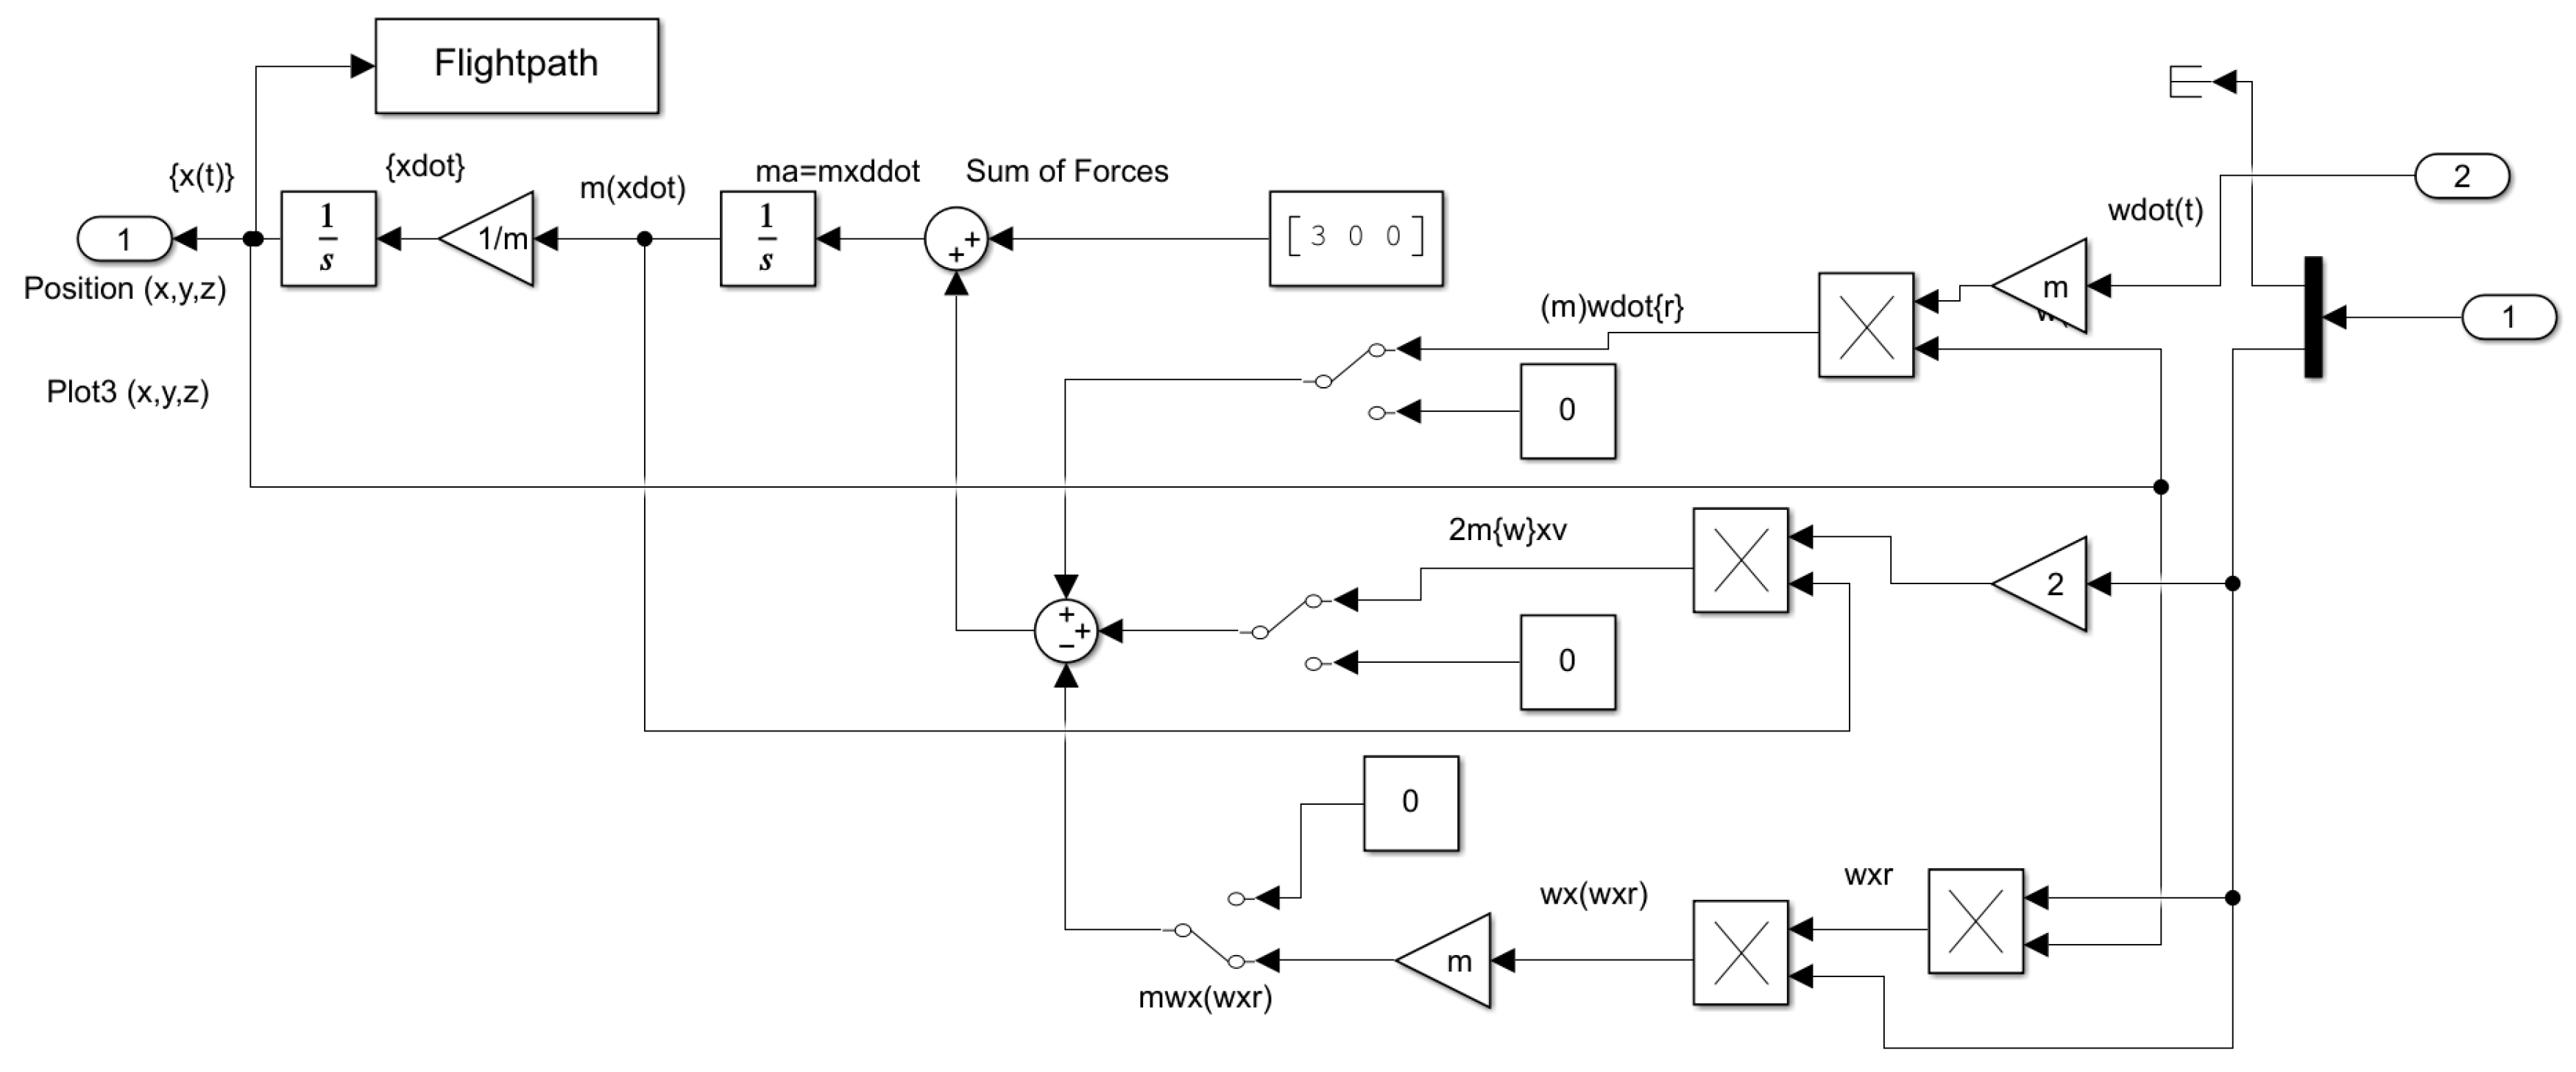
Similarly, an object of a defined mass will accelerate proportionally to the sum of forces acting on that mass in accordance with Newton’s second law as depicted in Equation 15 where F is the force, m is the defined mass, a is the acceleration, ω is angular velocity, r’ is the position vector, and v’ is velocity vector.
F = m a + m d ω d t × r + 2 m ω × v + m ω × ω × r
Newton’s law applies in the inertial frame and allows us to express our results in a set of coordinates in another defined frame of reference.
Table 4. Table of proximal variable definitions.
Variable/concept Definition Variable/concept Definition
τ Torque J Rotation Tensor
ω Angular Velocity m Mass
a Acceleration v Velocity
r’ Position Vector t Time

2.6. Kinetics of Disturbance Forces and Torques

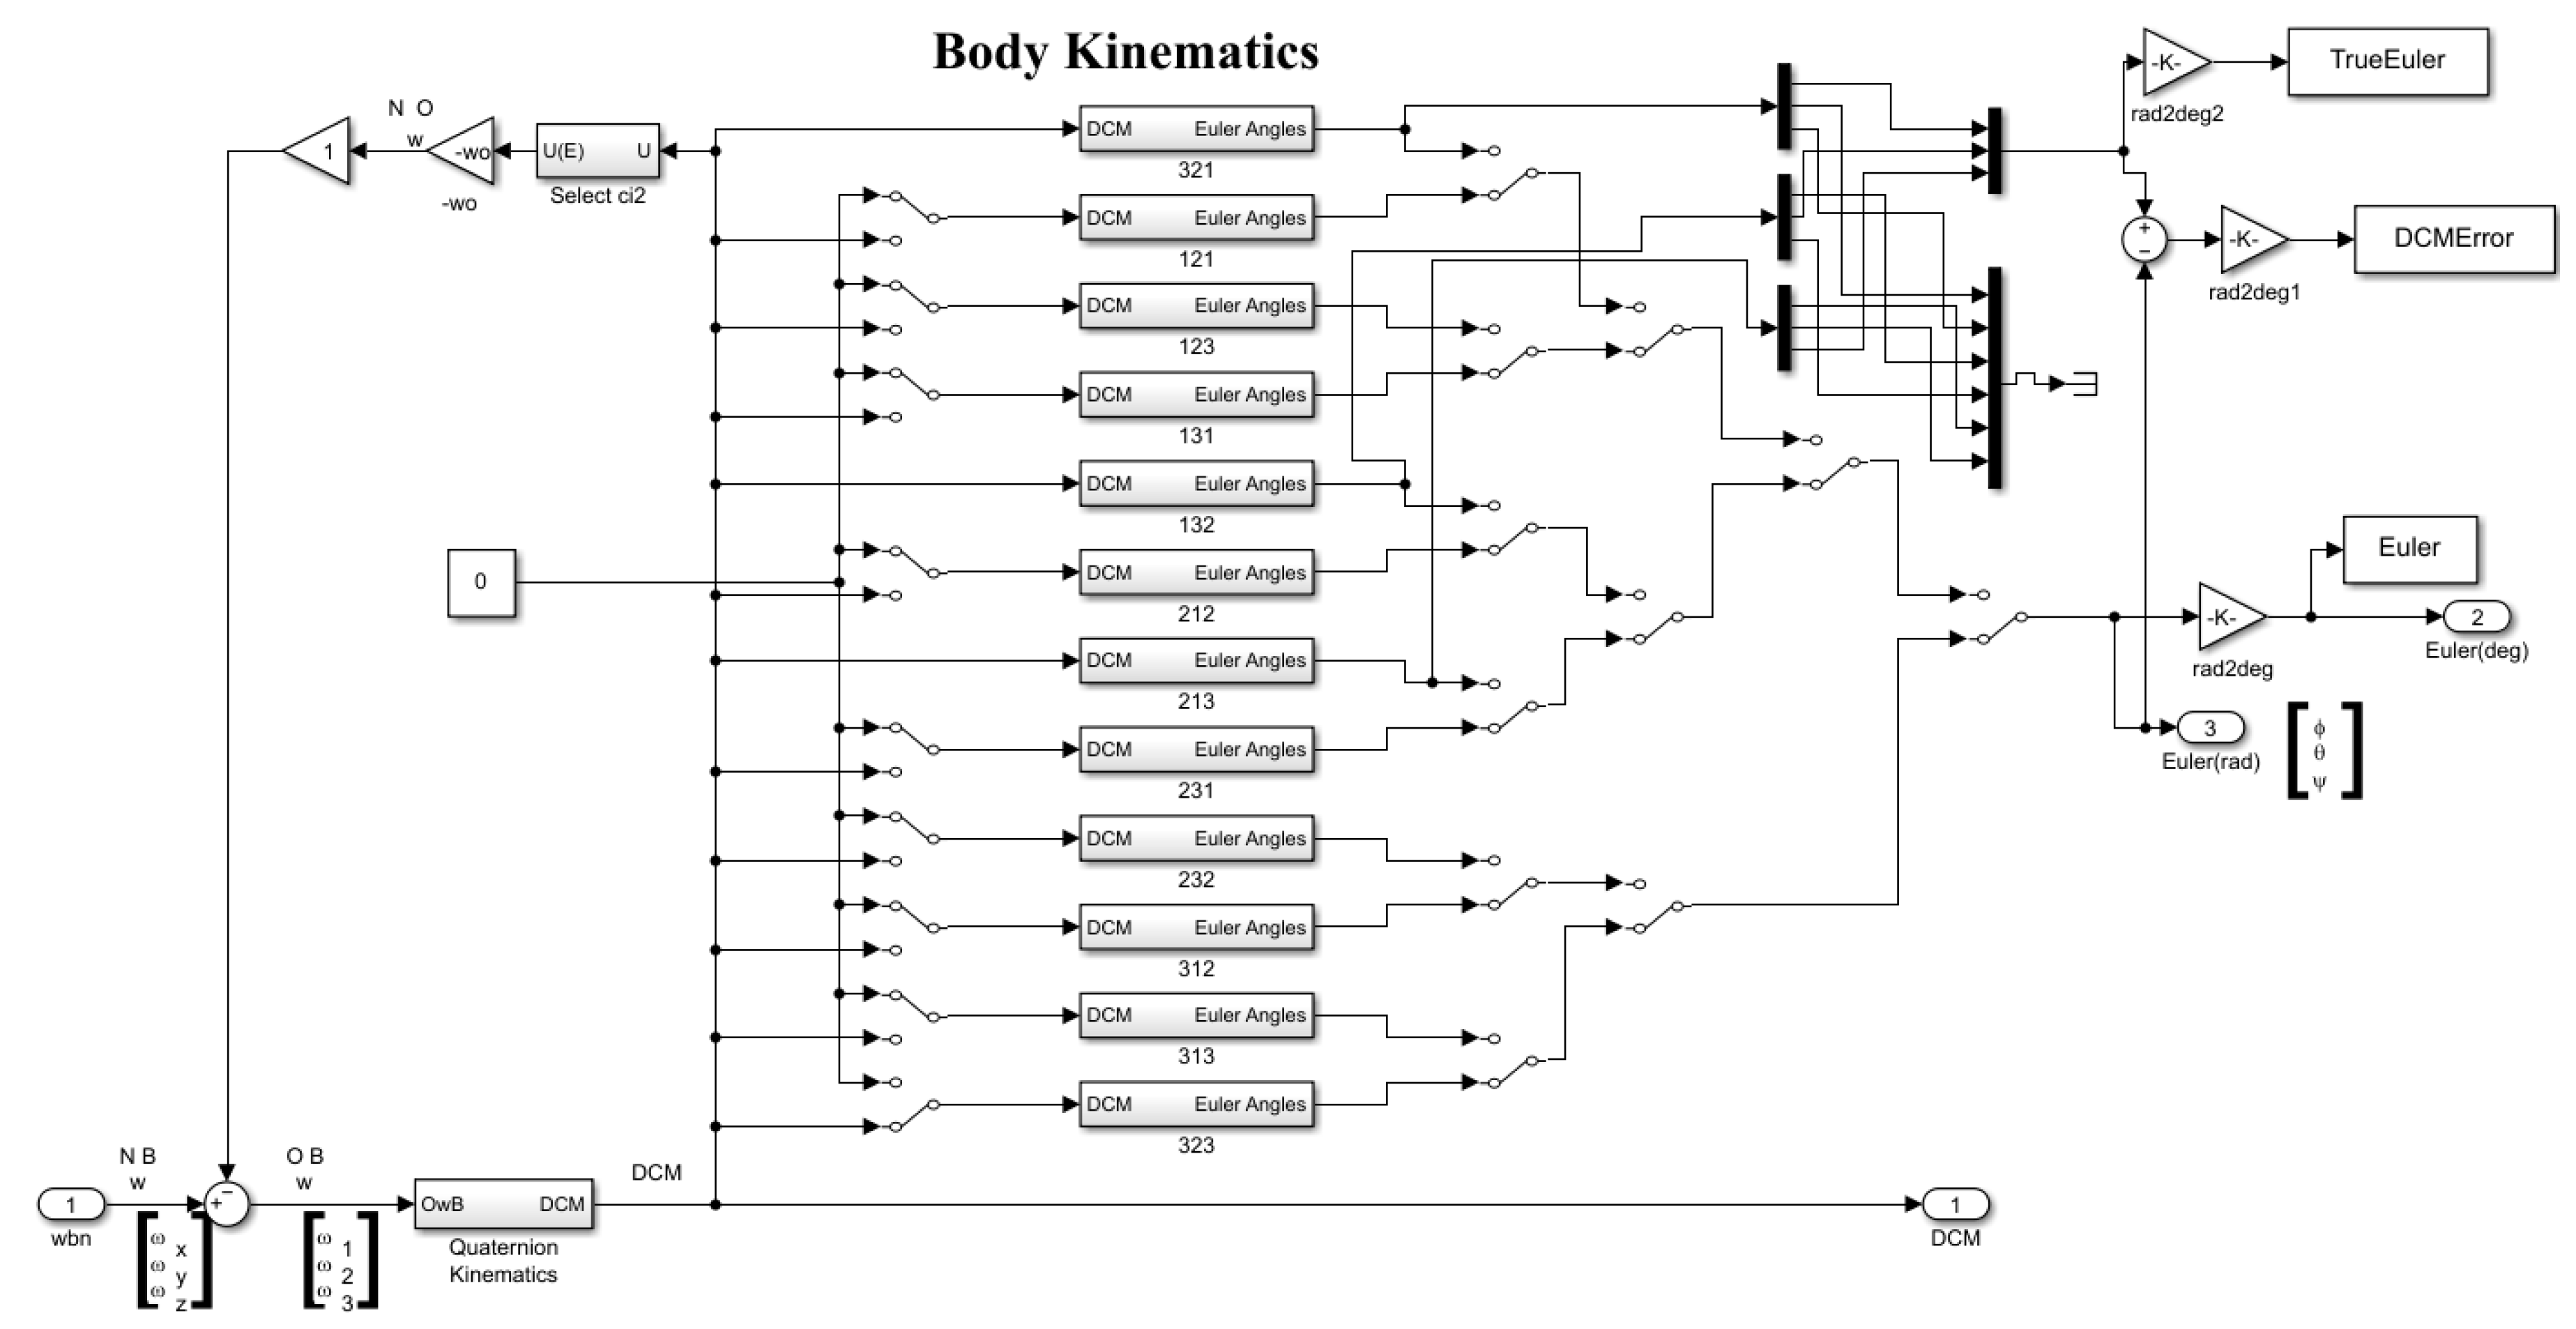
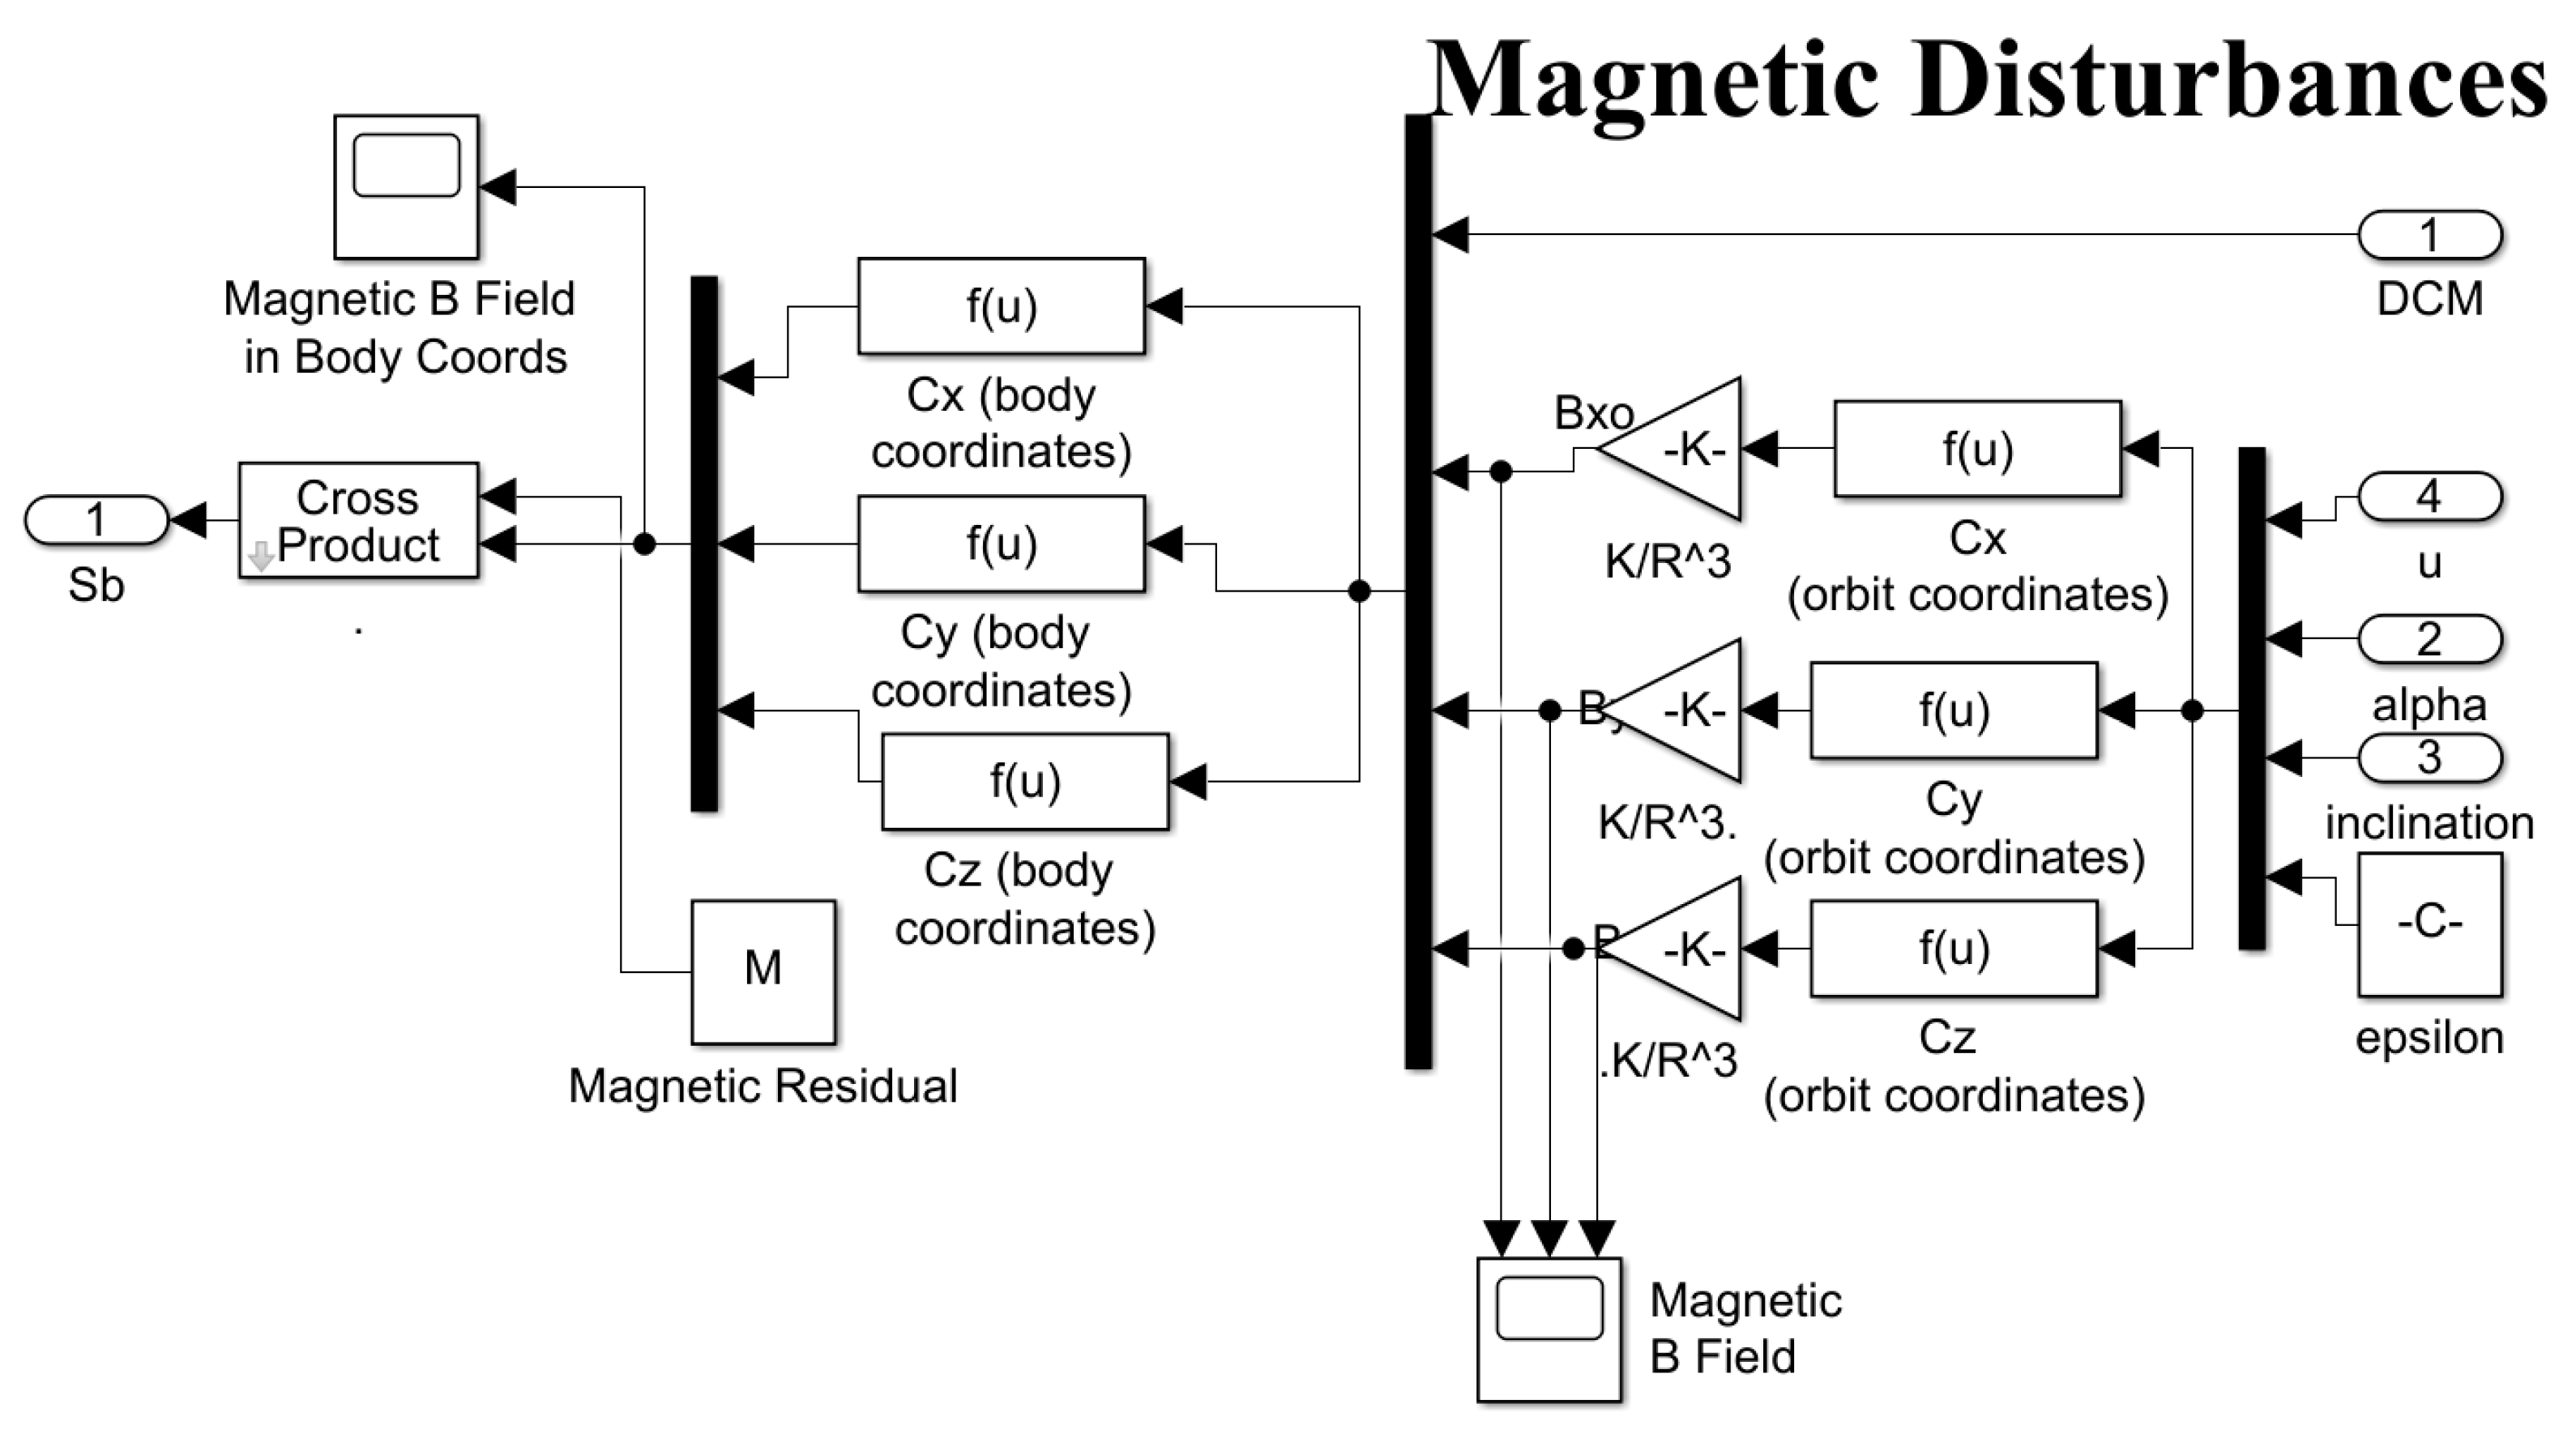
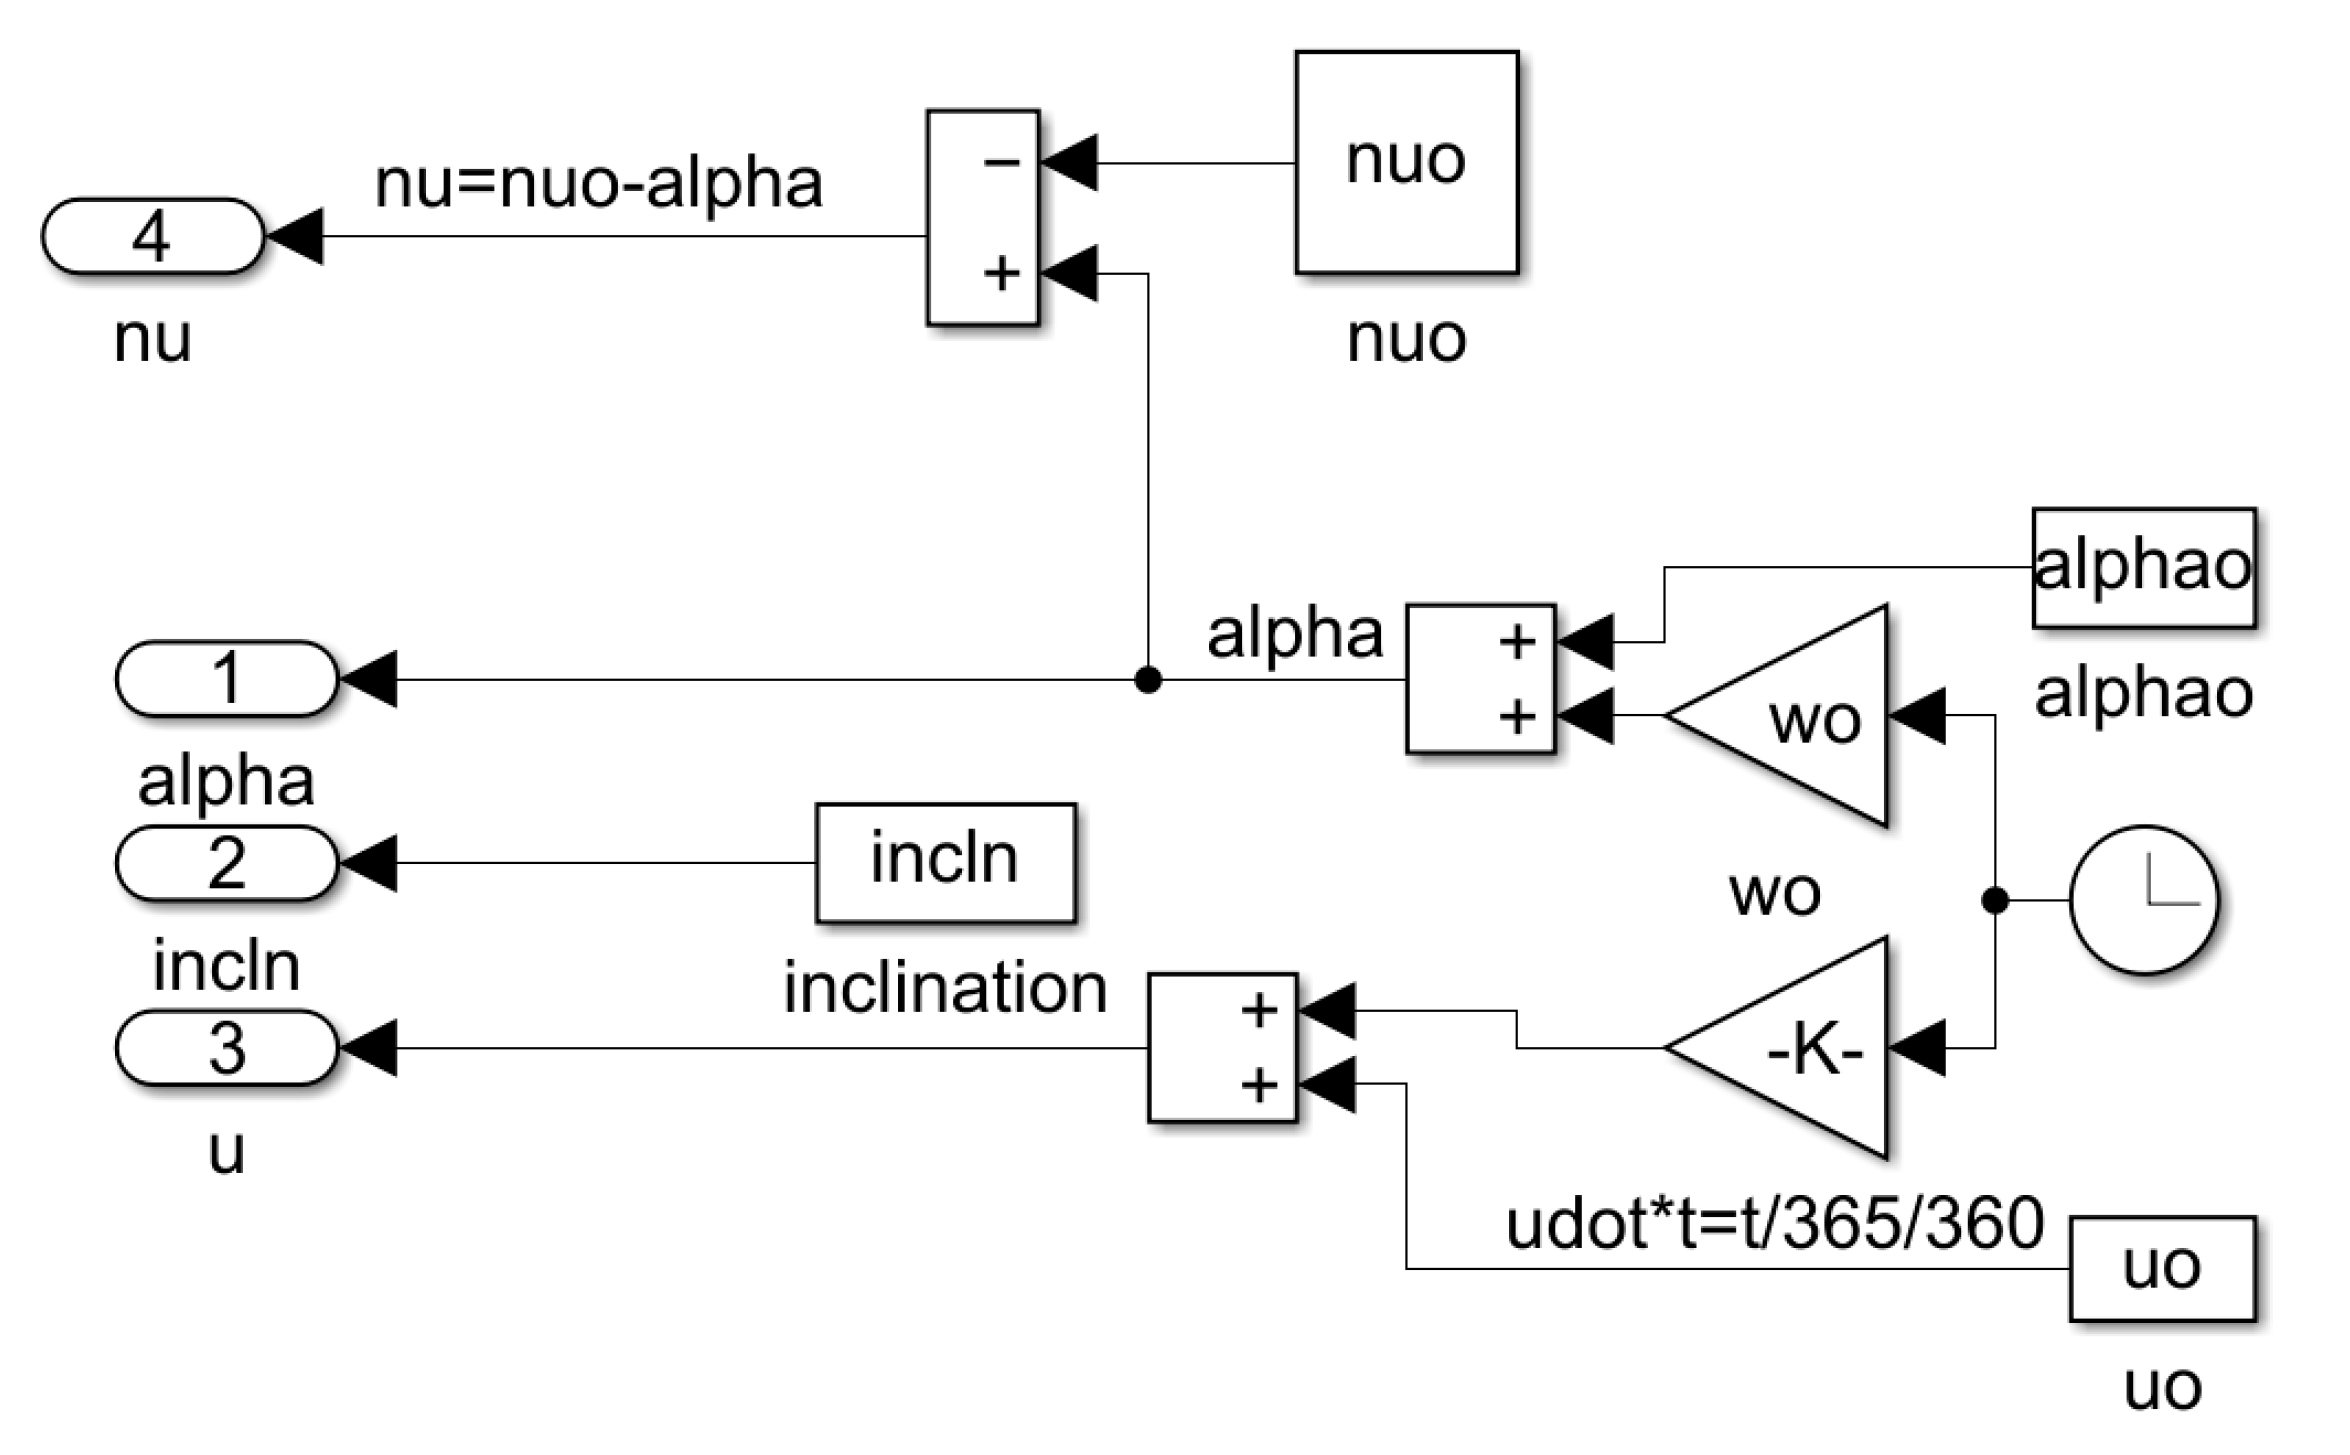
Disturbance forces and torques act on a body in accordance with equations (14) and (15) and are accounted for within the Simulink model for simulation found in Appendix (A).

2.7. Kinetics of Motion in Three Degrees

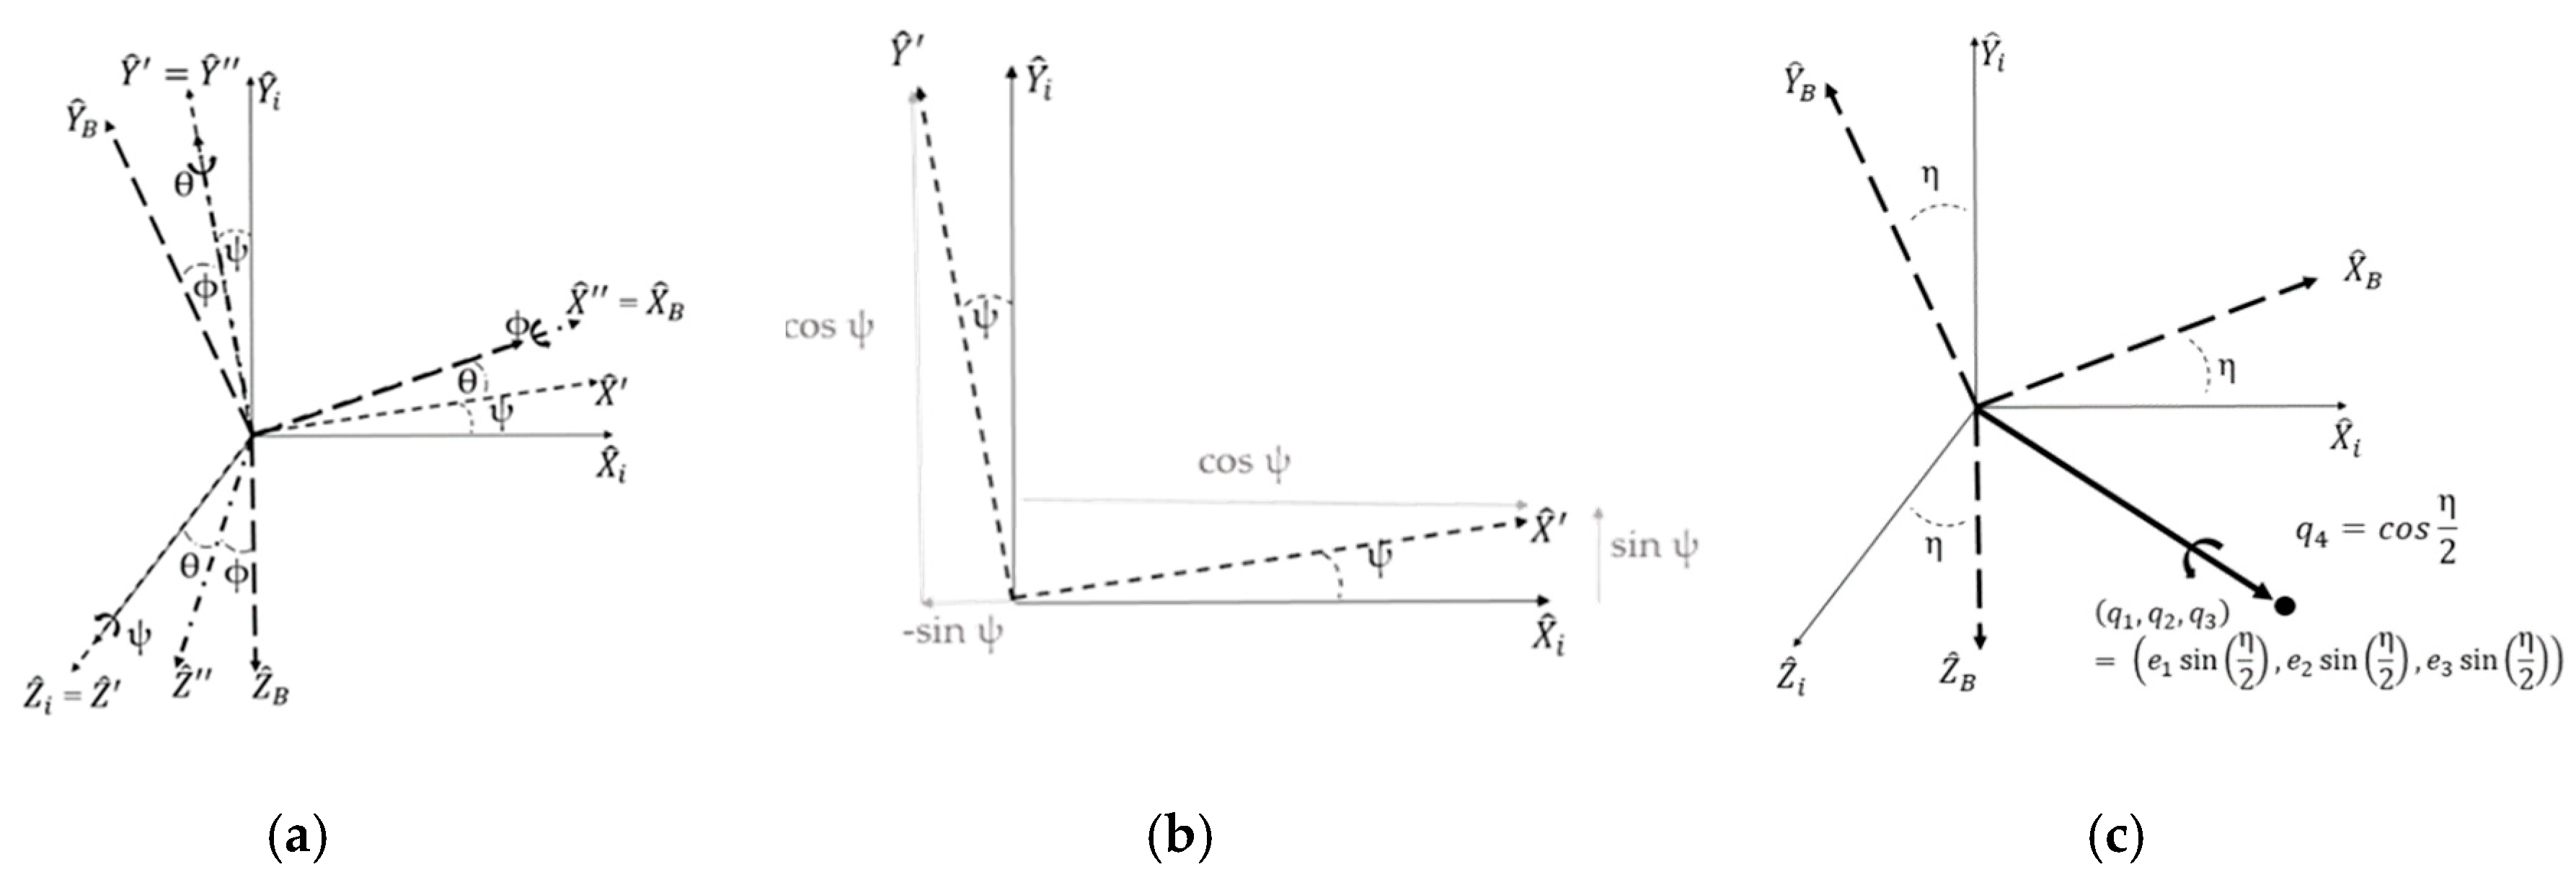
By utilizing direction cosines, we are able to take a set of coordinates relative to the non-rotating inertial frame and express them in terms of the body frame to account for motion in all three degrees as depicted in Figure 1, where all lines are unit vectors and the thin solid line represents the non-rotating inertial frame and each dash line increasing in weight indicates the first prime, second prime and finally the body frame respectively.
Table 5. Table of proximal variable definitions.
Variable/concept Definition Variable/concept Definition
θ Pitch Euler Angle ϕ Roll Euler Angle
ψ Yaw Euler Angle B Body Axis Designation
i Inertial Axis ‘ and ‘’ Intermediate Axes
The DCM is labeled in the order that the mathematical calculations are solved, right to left in accordance with algebraic multiplication rules to pre-multiply the total transformation matrix. Equation (16) represents the three mathematical calculations for a “3-2-1” rotation and is then multiplied to generate the total DCM in Equation (17).
X B Y B Z B = 1 0 0 0 c o s Φ s i n Φ 0 s i n Φ c o s Φ 1 r o t a t i o n   a b o u t   Z " = Z B c o s θ 0 s i n θ 0 1 0 s i n θ 0 c o s θ 2 r o t a t i o n   a b o u t   Y c o s ψ s i n ψ 0 s i n ψ c o s ψ 0 0 0 1 X i Y i Z i 3 r o t a t i o n   a b o u t   Z i
X B Y B Z B = c o s θ c o s ψ c o s θ s i n ψ s i n θ s i n Φ s i n θ c o s ψ c o s Φ s i n ψ s i n Φ s i n θ s i n ψ + c o s Φ c o s ψ s i n Φ c o s θ c o s Φ s i n θ c o s ψ + s i n θ s i n ψ c o s Φ s i n θ s i n ψ s i n Φ c o s ψ c o s Φ c o s θ X i Y i Z i
A mathematical problem arising from the DCM is the inability to pull values directly from the matrix due to quadrant ambiguity presented by the law of sines and cosines. To solve the quadrant ambiguity problem portions of the DCM have to be individually selected that allow use of the atan2 function to solve for a specific angle by cancelling out other portions, as shown in Equation 18 in which the atan2 function distinguishes between the four standard reference quadrants.
tan 1 D C M 1,2 D C M 1,1 atan 2 c o s θ s i n ψ c o s θ c o s ψ = ψ
An additional mathematical error from the law of sines and cosines is singularities in the DCM from solutions equaling 1/0. Lastly, the DCM, based on the chosen order of rotation, results in errors in the final result with only the “last” rotation having zero error due to being the only rotation about the body axis. To account for zero error in all three Euler angles, an additional rotation needs to be completed for each angle in the “last” position.
One way to remove the singularity problem presented by DCMs is to use the quaternion where the three-dimensional rotation is executed around a 4th axis; a scaled, stretched and normalized eigenvector, instead of the three standard axes. This requires induction of three imaginary axes of motion as opposed to the standard inertial frame and is shown in Figure (1c) and Equation (19) where q represents the different values of the quaternion and η is the angle that allows a single rotation [1,2]. The quaternion works so long as we enforce the quaternion normalization condition shown in Equation (19). Specifically, Equation 19 shows a direct comparison to the DCM shown in Equation (17).
Table 6. Table of proximal variable definitions.
Variable/concept Definition Variable/concept Definition
DCM Direction Cosine Matrix q Quaternion
B Body Reference Frame i Inertial Reference Frame
u Controller ω Angular Velocity
J Rotational Tensor ω d Desired ω
X B Y B Z B = D C M X i Y i Z i = 1 2 q 2 2 + q 3 2 2 q 1 q 2 + q 3 q 4 2 q 1 q 3 + q 2 q 4 2 q 1 q 2 + q 3 q 4 1 2 q 1 2 + q 3 2 2 q 2 q 3 + q 1 q 4 2 q 1 q 3 + q 2 q 4 2 q 2 q 3 + q 1 q 4 1 2 q 1 2 + q 2 2 X i Y i Z i q T q + q 4 2 = q 1 2 + q 2 2 + q 3 2 + q 4 2 = 1 Q u a t e r n i o n   n o r m a l i z a t i o n   c o n d i t i o n

2.8. Guidance of Motion in Three Degrees

The guidance of objects is known as the outer loop function and generates commands for the inner loop discussed in section 2.5 by accounting for three degrees of freedom of translational motion governed by Newton’s 2nd Law expressed in Equation 15.

2.9. Decoupling Nonlinear Coupled Motion

Due to the transport theorem, ω couples the three degrees of freedom of translational and rotational motion. Additionally, equations 14 and 15 are internally coupled within the inertia matrix with ω, causing motion in all three degrees with inputs to only one. A non-linear decoupling controller is placed in a feedback control, or a desired output is placed in a feed forward control, to decouple the nonlinear couple motion as displayed in Equation 20 where u is the controller and ω d is the desired output angular velocity.
T = u ω × J ω n o n l i n e a r d e c o u p l i n g c o n t r o l l e r = u + ω d × J ω d D e s i r e d   o u t p u t f o r f e e d f o r w a r d

2.10. Interim Summary

By using Newton’s and Euler’s equations and invoking Chasle’s method, we are able to express six degrees of freedom for a three-dimensional movement of an object. DCMs are then used to describe the position of a body in terms of a defined axes, with quaternions used to eliminate singularities and validate the DCM. From these equations we pull out the true Euler angles.
Table 7. Table of proximal variable definitions.
Variable/concept Definition Variable/concept Definition
r Distance (km) v Planet Relative Velocity
θ Longitude Angle φ Latitude Angle
γ Flight Path Angle ψ Heading Azimuth
L Lift D Drag
m Mass T Thrust
ρ Air Density A Surface Area
C D Coefficient of Drag ρ P Propellant Density
A B Burn Area P C Chamber Pressure
μ Gravitational Parameter

2.11. Dynamic Modeling

The dynamic equations of motion describing the vehicle in flight are defined as shown in Equation 21, where r is the distance from the center of the planet in kilometers, θ is the longitude angle, φ is the latitude angle, v is the planet relative velocity, γ is the planet relative flight path angle (or pitch), and ψ is the planet relative heading azimuth (or yaw).
r ˙ = v s i n γ θ ˙ = v c o s γ s i n ψ r c o s φ φ ˙ = v c o s γ c o s ψ r v ˙ = D m μ s i n γ r 2 + T m γ ˙ = L γ m v μ c o s γ r 2 v + v r c o s γ ψ ˙ = L ψ m v c o s γ + v r c o s γ s i n ψ t a n φ

2.11.1. Truth Model Development

The truth model, or high-fidelity model, for this application would include a changing drag force, D, with altitude as is defined by the drag equation shown in Equation 22 due to changing air density and velocity.
F D = 1 2 ρ v 2 C D A
For any motor other than a nuclear reactor, the mass of the vehicle will change during flight as fuel burns where the mass flow rate of a solid rocket motor propellant grain is defined by Equation 23 as a function of the density of the propellant, burn area, chamber pressure and empirical constants that describe the pressure dependence and temperature effects of the propellant. A solid rocket motor is required due to operating in a vacuum for most of the flight path as the solid rocket motor’s oxidizer is mixed into the propellant grain, enabling its use in space.
m ˙ = ρ P A B a P C n
Additionally, the thrust of any rocket motor is not going to be constant due to ramp up and burn off periods, but the motor can be designed so that these periods are extremely short and negligible during the duration of the burn. The solar pressure disturbance acting on the vehicle while in orbit needs to be considered as well.

2.11.2. Medium Fidelity Optimization Model

Taking the high-fidelity model described by the truth model, a medium fidelity model can be derived from these equations. A way to do this is by assuming a constant set of forces acting on the vehicle during the duration of the flight. For example, instead of modeling atmospheric pressure at varying altitude, the median or average altitude could be picked and use that pressure to calculate the drag on a set vehicle size or design. As the mass flow rate will depend on the specific impulse and thrust requirements with the burn parameter (neutral, regressive, or progressive), it is difficult to accurately input this data before the propellant composition and grain design is chosen. These constants, along with the Earth’s gravitational parameter, would then be placed into the dynamic equations and run to verify the project design and ensure useable trajectory outputs are given. Even with these modifications, the problem set would be true in nature so long as the scaling is consistent throughout the process.
In this model, additional constraints could be placed to prevent flight maneuvering through certain areas where there is a higher density of satellites or a final desired impact angle on the target. Both constraints would be beneficial if applied. The first so that the vehicle is not knocked off trajectory or causing catastrophic damage to another satellite during its flight path. The second so that maximum penetration is achieved, and blast area is near a true circle instead of an ellipse that extends beyond the point of impact. A secondary benefit from a vertical impact is the near impossibility of intercepting from modern defense systems due to the speed of the vehicle flight at endgame. The outputs from this model would give trajectories of the vehicle but would not take the additional step of converting those trajectory and state inputs into true control input commands.

2.11.3. Low Fidelity Model

As the medium-fidelity model is already assuming a constant thrust, drag and mass, the only way to simplify the problem further is to assume a constant gravitational force acting on the vehicle during the flight instead of as a function of altitude and force vehicle to operate in one plane at a time (i.e., zero out the flight path angle or heading azimuth). In the case of making gravity a constant, less acceleration over time is expected compared with the truth model due to losing the increased gravitational pull near end game, but the overall direction and orientation of the flight path should look similar.
If one of the angles was made constant, the model would be limited to a two-dimensional system, making the ability to turn towards the target off the north-south or east-west axis impossible. Additionally, by zeroing one of the control angles and making the other a constant input, the longitude and latitude states would be shown as constant. In these flight paths, the vehicle is expected to look like the path of a ball thrown off the side of a building, arcing down toward the earth until it impacts after its initial turn in the appropriate direction. Table 1 below shows a comparison of the variables and concepts considered for each fidelity level of the model.
Table 8. High, medium, and low fidelity model comparison of incorporating variables/concepts.
Variable/concept Low fidelity Medium fidelity High fidelity
Control actuator input No No Yes
Coupled motion No No Yes
Reference frame conversion No No Yes
Variable mass No No Yes
Variable drag No No Yes
Variable gravity No Yes Yes
Path constraints No Yes Yes
Simultaneous state calculations No Yes Yes
Constant gravity Yes No No
Isolate states Yes No No
Zero thrust Yes No No

2.12. Trajectory Optimization Boundary Value Problem Development

2.12.1. Constraints

Due to real world considerations, an object can only take a certain amount of force on its control fins before they break. Because of this, the controls identified by the lift force in flight path angle and heading angle are limited to 1 k g k m s 2 or 1000 Newtons of force. With the extremely high velocities the vehicle will encounter, the heating rate of the nose, Q ˙ , must also be limited. A value of 4.9 × 10 9 W m 2 was arbitrarily chosen based on density change rate.

2.12.2. Canonical Scaling

To validate the solving of the program in incremental steps, this milestone is run initially with constant drag instead of fluctuating as a function of altitude. Additionally, the model is run isolating the flight pitch angle and planet relative heading angle separately. To solve the model mathematically, the equations were canonically scaled with the scaling terms displayed in the unnumbered equation immediately below, where R = 6378km, M = 10, AU = 1 and g = 0.00981 km/sec2:
r ~ = r R ;   τ = t T U ;   v ~ = v V ;   m ~ = m M ;   D ~ = D F U ;   T ~ = T F U ;   V = R T U ;   T U = R g ;   F U = M A ;   A = R T U 2 ;   a U = 1
For units to cancel appropriately, θ and φ are scaled with the relation of a U T U * θ ~ ˙ = θ ˙ , the gravitational parameter was scaled by μ ~ = T U 2 R 3 μ , and the controls were scaled by L ~ = T U 2 R M L . Full canonical scaling of each equation is found in Appendix B.
Table 9. Table of proximal variable definitions.
Variable/concept Definition Variable/concept Definition
r Distance R Scaling Term
τ Time TU Scaling Term
v velocity V Scaling Term
m Mass M Scaling Term
D Drag FU Scaling Term
T Thrust g Gravitational Constant

2.12.3. Development of Necessary Conditions

To find the minimum time trajectory, the problem is viewed through the steps of Pontryagin’s Principle by completing the HAMVET process. A full walkthrough of Pontryagin’s Principle is found in Appendix B.

2.12.3.1. Hamiltonian Construction

As there must be one costate for every state, the Hamiltonian can be written as seen in Equation 24 with path constraint controls identified as ε.
H ¯ x , λ , u = λ r v ~ s i n γ + λ θ v ~ c o s γ s i n ψ r ~ c o s φ + λ φ v ~ c o s γ c o s ψ r ~ + λ v D ~ m ~ μ ~ s i n γ r ~ 2 + T ~ m ~ + λ γ L ~ γ m ~ v ~ μ ~ c o s γ r ~ 2 v ~ + v ~ r ~ c o s γ + λ ψ L ~ γ m ~ v ~ c o s γ + v ~ r ~ c o s γ s i n ψ c o s φ + ε 1 L ~ γ + ε 2 L ~ ψ + ε 3 k ~ Q ρ ~ v ~ 3

2.12.3.2 Adjoint Equation Development

The rate of change of each costate is defined as the negative of the partial derivative of the Hamiltonian with respect to the corresponding state. These Equations are shown in Equation 25.
λ ˙ r = H r = λ θ ν ~ c o s γ s i n ψ r ~ 2 c o s φ λ φ ν ~ c o s γ c o s ψ r ~ 2 + λ ν 2 u ~ s i n γ r ~ 3 λ γ ν ~ c o s γ r ~ 2 2 μ ~ c o s γ ν ~ r ~ 3 λ ψ ν ~ r ~ 2 c o s γ s i n ψ t a n φ λ ˙ θ = H θ = 0 λ ˙ φ = H φ = λ θ ν ~ c o s γ s i n ψ s i n φ r ~ 2 c o s φ + λ ψ ν ~ c o s γ s i n ψ t a n 2 φ + 1 r ~ λ ˙ v = H v = λ r s i n γ + λ θ c o s γ s i n ψ r ~ c o s φ + λ φ c o s γ c o s ψ r ~ + λ γ c o s γ r ~ L ~ γ m ~ v ~ 2 + μ ~ c o s γ v ~ 2 r ~ 2 λ ψ L ~ ψ m ~ v ~ 2 c o s γ c o s γ s i n ψ t a n φ r ~ + 3 ε 3 k ~ Q v ~ 2 ρ ~ λ ˙ γ = H γ = λ r v ~ c o s γ λ θ v ~ s i n γ s i n ψ r ~ c o s φ λ φ v ~ s i n γ c o s ψ r ~ λ γ v s i n γ r ~ μ ~ s i n γ v ~ r ~ 2 λ v u ~ c o s γ r ~ 2 λ ψ L ~ ψ s i n γ m ~ v ~ c o s 2 γ v ~ s i n γ s i n ψ t a n φ r ~ λ ˙ ψ = H ψ = λ θ v ~ c o s γ c o s ψ r ~ c o s φ λ φ v ~ c o s γ s i n ψ r ~ + λ ψ v ~ c o s γ c o s ψ t a n φ r ~

2.12.3.1 Hamiltonian Minimization

Minimize the Hamiltonian with respect to each control to find possible verification factors available for the solution. These two equations, or the stationarity conditions, are shown in Equation 27 and 28 with the complementarity conditions listed in Equation 29.
Table 10. Table of proximal variable definitions.
Variable/concept Definition Variable/concept Definition
H Hamiltonian Function λ Costate Variable
r Distance v Velocity
γ Flight Path Angle ψ Heading Azimuth
φ Latitude Angle θ Longitude Angle
L Lift Control Value m Mass
D Drag T Thrust
μ Gravitational Parameter ε Path Constraint Control
H u = H L ~ γ = 0 = λ γ m ~ v ~ + ε 1
H u = H L ~ ψ = 0 = λ ψ m ~ v ~ c o s γ + ε 2
ε 1 0     i f                               L ~ γ = 10 = 0   i f 10   L ~ γ 10   0   i f                                     L ~ γ = 10 ε 2 0     i f                               L ~ ψ = 10 = 0   i f 10   L ~ ψ 10   0   i f                                     L ~ ψ = 10 ε 3 0     i f                                           Q ˙ = 0 = 0   i f               0   Q ˙ 4.9 e 9   0   i f                                     Q ˙ = 4.9 e 9
Table 11. Table of proximal variable definitions.
Variable/concept Definition Variable/concept Definition
H Hamiltonian Function L Lift Control Unit
u Control Variable m Mass
v Velocity λ Costate Variable
γ Flight Path Angle ψ Heading Azimuth
ε Path Constraint Variable Q ˙ Heating Rate
E Endpoint Value Function t Time
r Distance θ Longitude Angle
φ Latitude Angle

2.12.3.1 Endpoint Value Condition

The value of the Hamiltonian at the final time can be found by taking the partial derivative of the endpoint cost with respect to time and is shown in Equation 29.
E = t f + ν 1 r f r f + ν 2 θ f θ f + ν 3 φ f φ f ; E t f = 1 = H ¯ t f

2.12.3.1 Hamiltonian Evolution Condition

The Hamiltonian Evolution Condition shows how the Hamiltonian behaves with respect to time and is found by taking the partial derivative of the Hamiltonian with respect to time as shown in Equation 30.
H t = H t = 0

2.12.3.1 Transversality Condition

Transversality is used to determine more points for verification and validation and is done by taking the partial derivative of the endpoint cost function with respect to each state individually as shown in Equation 31.
E = t f + ν 1 r f r f + ν 2 θ f θ f + ν 3 φ f φ f λ r ( t f ) = E r f = ν 1 λ θ ( t f ) = E θ f = ν 2 λ φ ( t f ) = E φ f = ν 3 λ v ( t f ) = E v = 0 λ γ ( t f ) = E γ f = 0 λ ψ ( t f ) = E ψ f = 0
Table 12. Table of proximal variable definitions.
Variable/concept Definition Variable/concept Definition
E Endpoint Value Function t Time
r Distance θ Longitude Angle
φ Latitude Angle λ Costate Variable
t Time v Velocity
γ Flight Path Angle ψ Heading Azimuth

2.12.4. Development of Necessary Conditions

By completing the HAMVET process, it is shown that the theta costate is constant throughout the duration of flight, and the Hamiltonian is constant with an endpoint value of -1; or in other words, constant at -1. Velocity, flight pitch angle and planet relative heading co-states are all equal to zero at final time. With the canonical scaling used, the dynamic equations of motion can be written the same way with new boundary conditions as defined in equation (32).
r 0 , θ 0 , φ 0 , v 0 , γ 0 , ψ 0 = ( 42164,0 , 0,0 , 0,0 ) r f = 6378 θ f , φ f = 36.6002 , 121.8947   d e g r e e s λ ~ v ( t f ) = 0 λ ~ γ ( t f ) = 0 λ ~ ψ ( t f ) = 0 H ¯ t f = 1 = c o n s t a n t

3. Results

The trajectory problem was solved in MATLAB using the DIDO program. The complete DIDO program files can be found in Appendix C.

3.1. Trajectory Optimization Solution

3.1.1. Low Fidelity Dynamic Verification

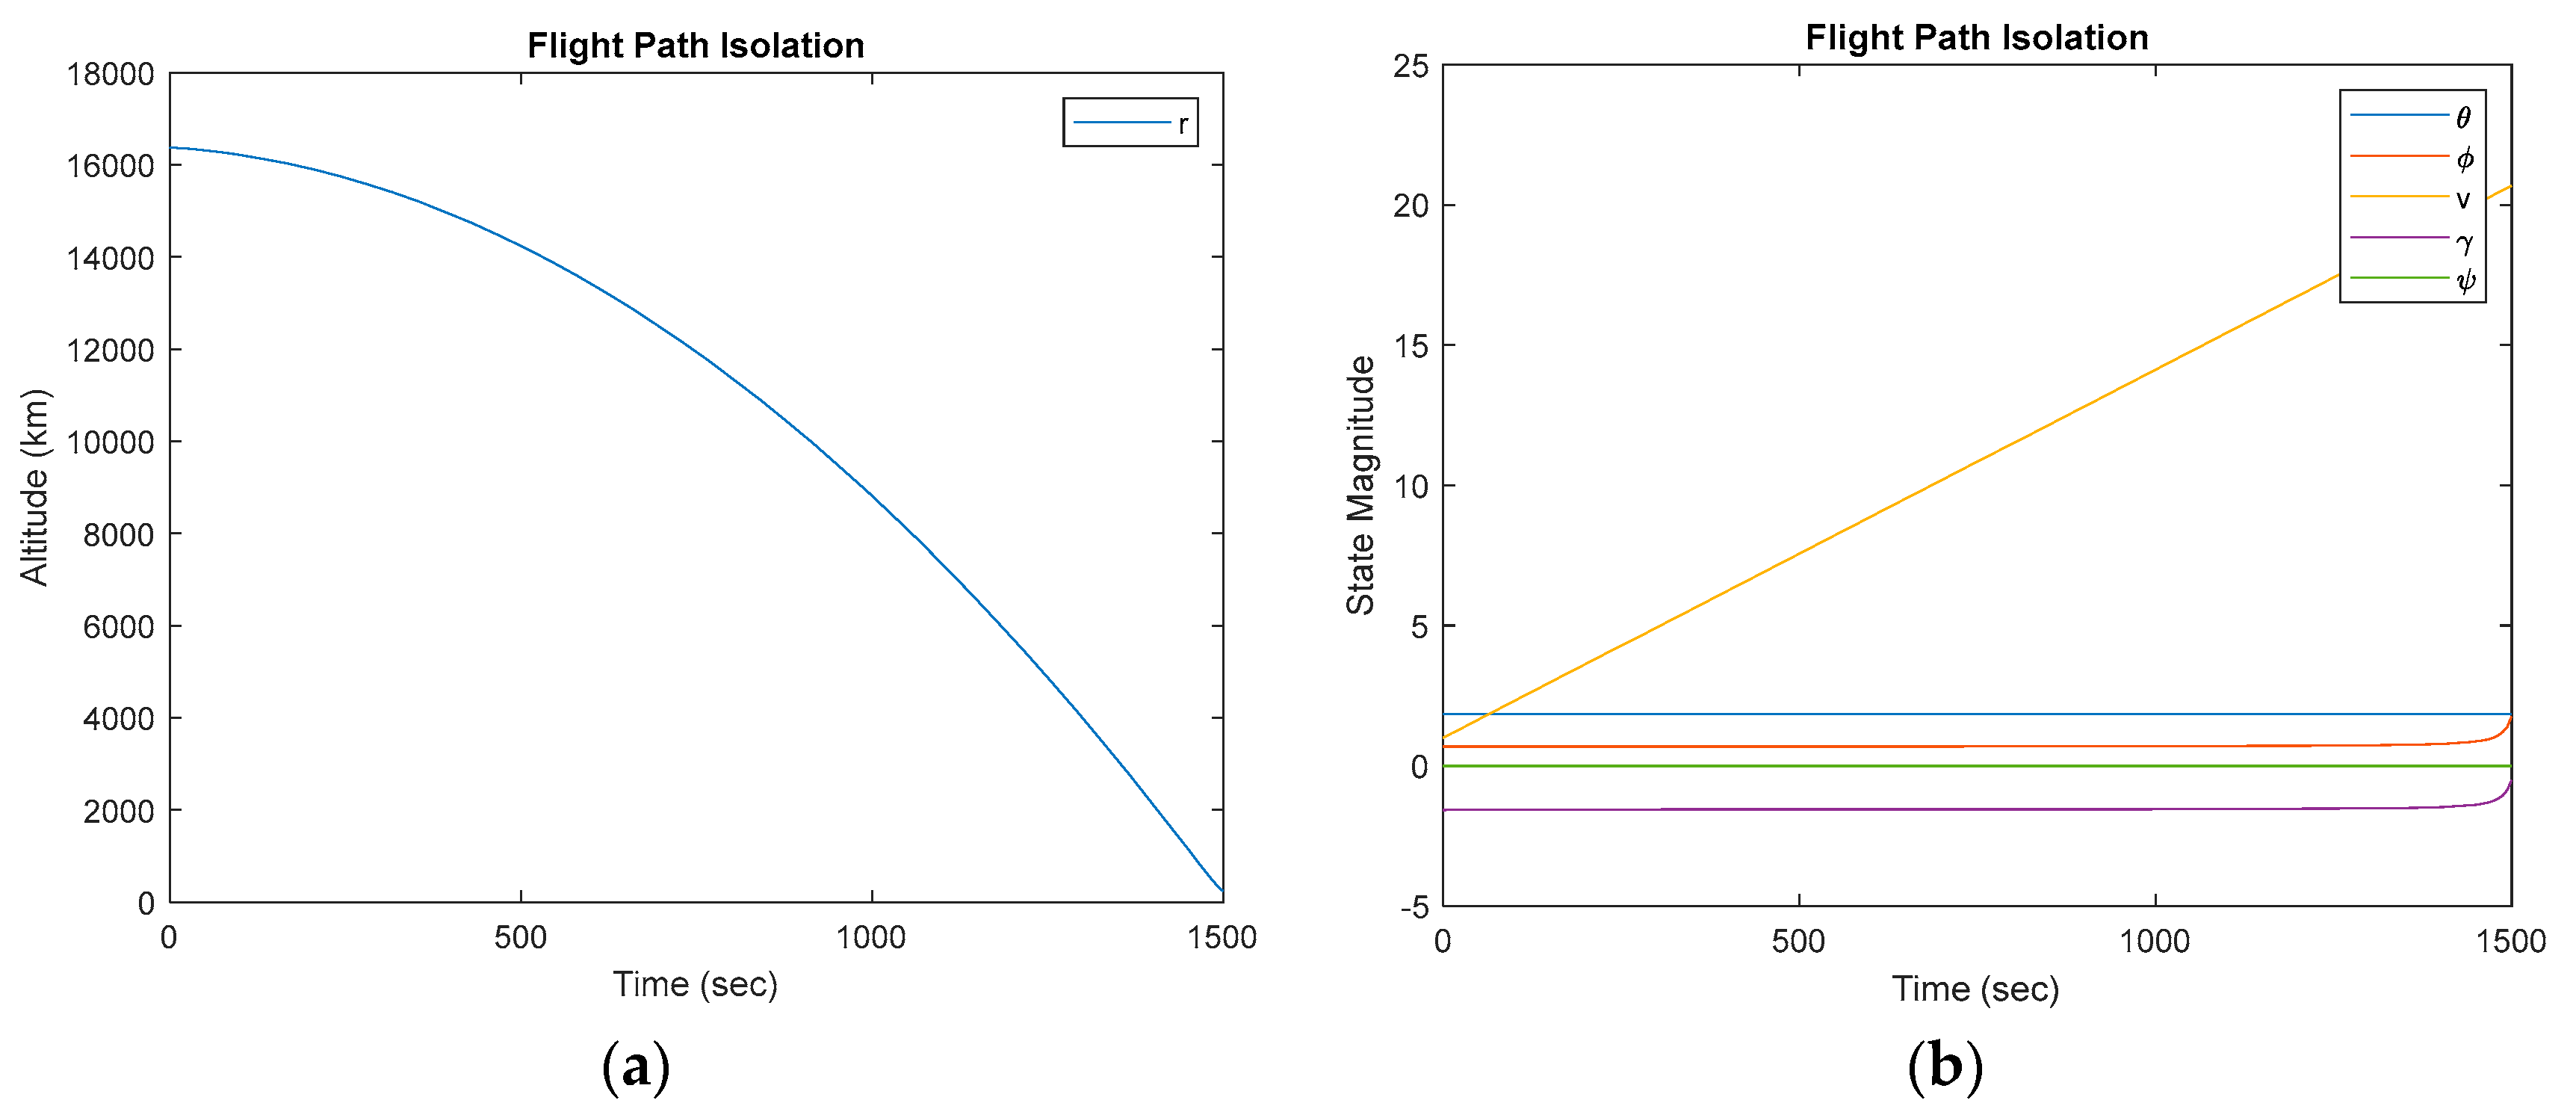
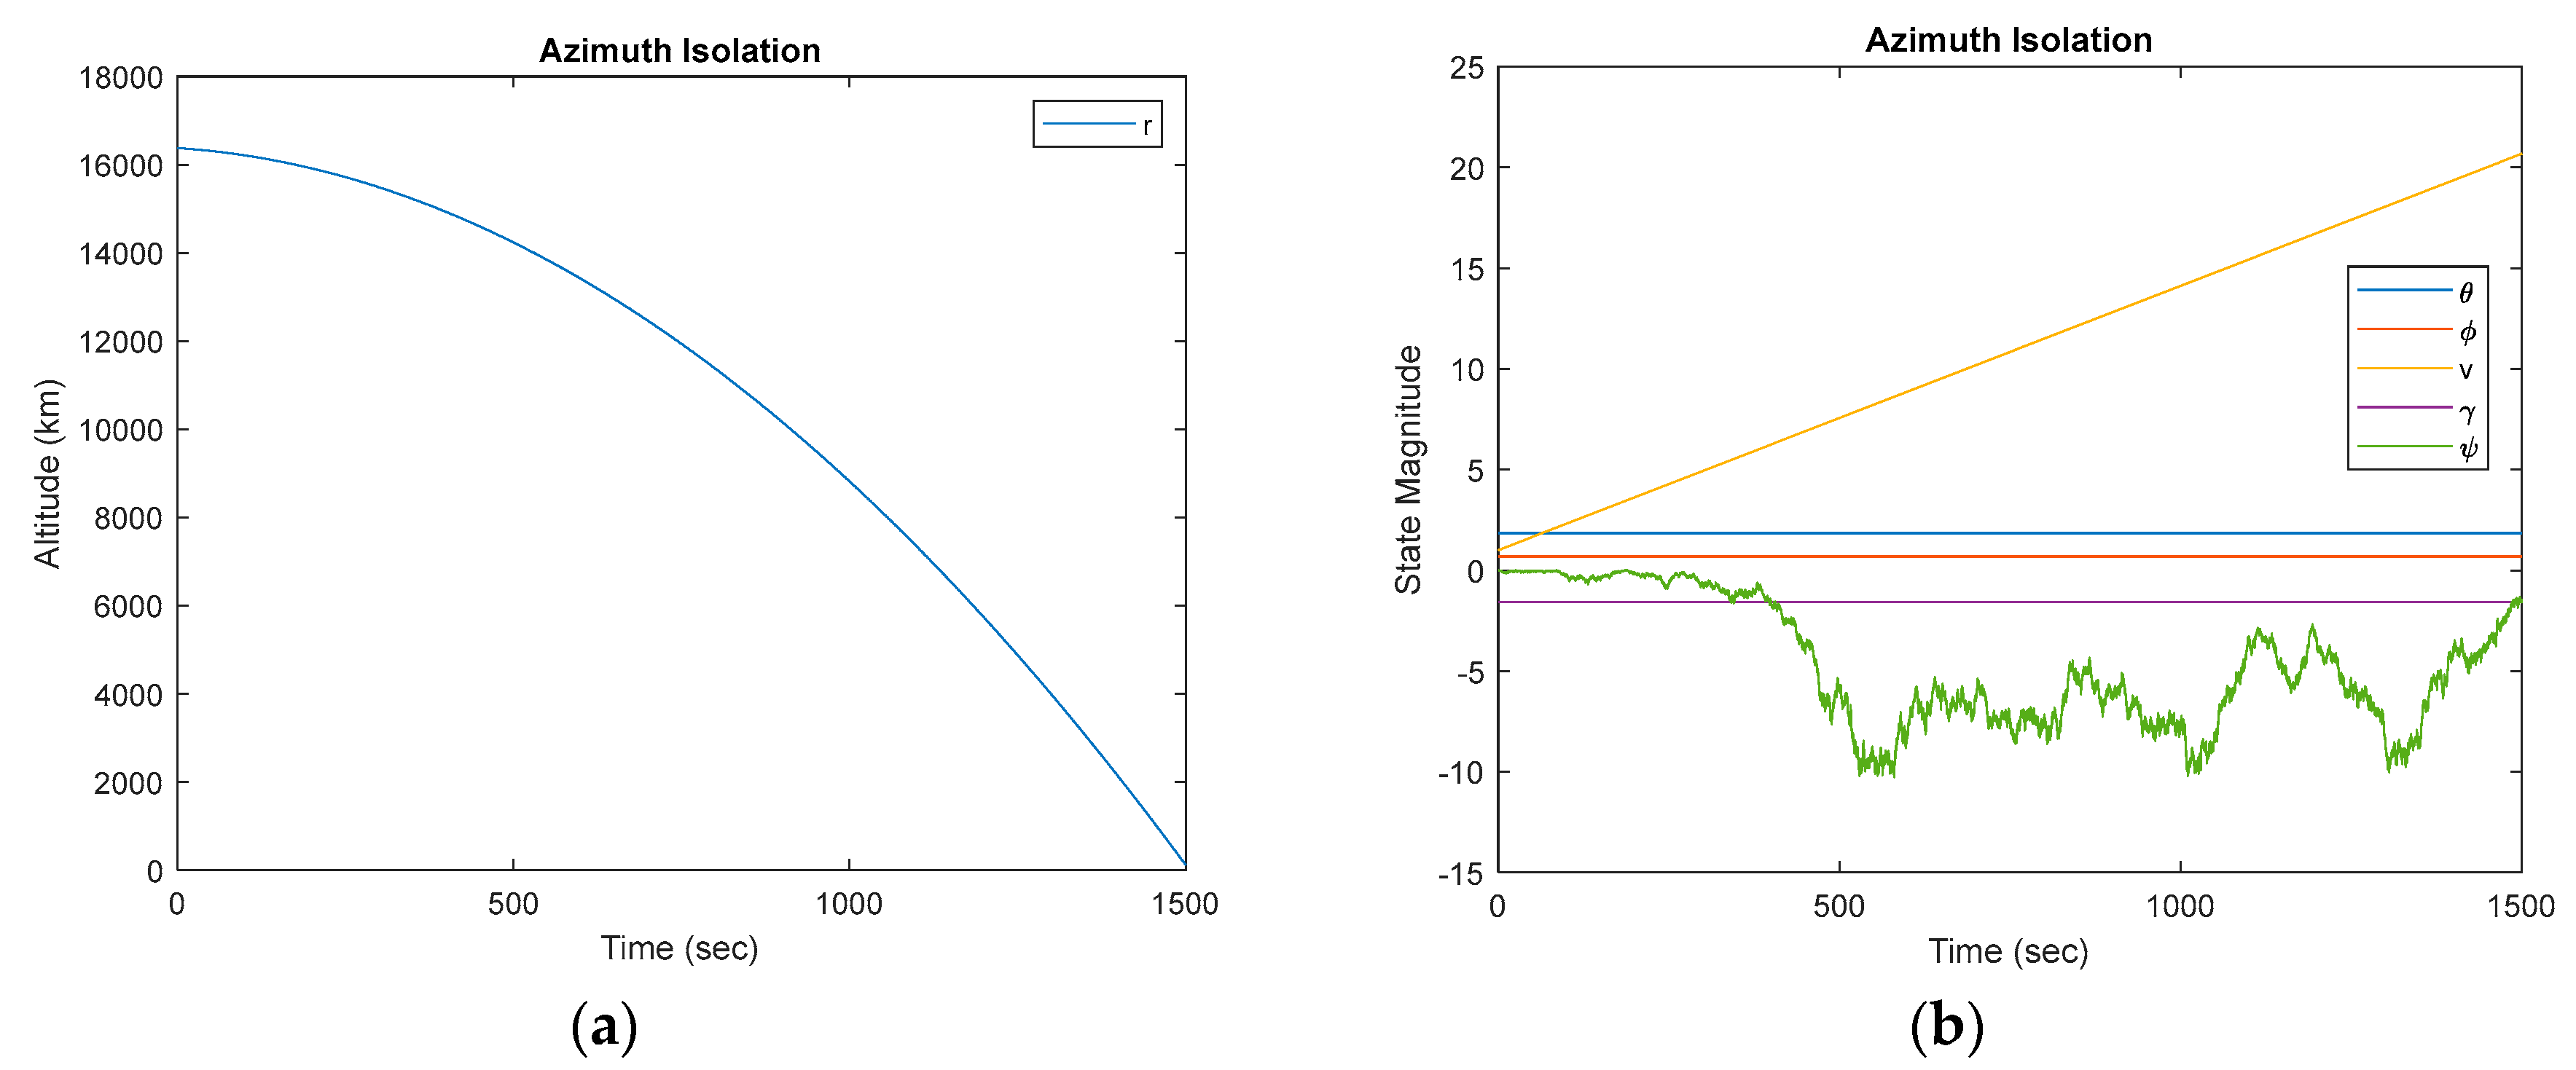
The low fidelity numerical simulation was run twice, once for each isolated control state of γ and ψ and produced the altitude and state magnitudes shown in Figure 2 and Figure 3.
Table 13. Table of proximal variable definitions.
Variable/concept Definition Variable/concept Definition
φ Latitude Angle v Velocity
γ Flight Path Angle ψ Heading Azimuth
θ Longitude Angle r Distance
With the flight path isolated by zeroing out azimuth, the altitude and states behaved exactly as expected. Altitude dropped at a constant parabolic rate as expected with the constant forces applied and gravity and thrust overriding the drag. Velocity increased at a constant rate due to these forces while latitude and longitude remained constant due to no turn inputs and isolated controls. With ψ ̇ set to equal 0, the initial input angle of 0 remains constant with a constant gravitational force, γ slowly decreases in angle magnitude as it is a function of the radius and velocity but on much smaller scale. The end portion of the plot where pitch and azimuth look to start spiking is where if the simulation was run for a longer time, the vehicle bounces off the earth and proceeds back up.
When the azimuth angle is isolated and pitch is set to an initial angle with no change, the altitude behaves as expected. Velocity increases at a constant rate as expected with the constant forces acting on the vehicle while latitude and longitude remain constant as the cosine of -90 degrees is near zero, causing little to no change in the overall state. γ remains constant as we have set the rate change to zero. Initial simulation runs resulted in azimuth angles on the order of 1014 due to the angle not being limited so radians continued to climb to numbers that are not within the range of angles. To fix this problem, the “wrapToPi” function was placed in front of the ψ ̇ equation to convert the output of the angle to a value between -π and π (-180 to 180 degrees).
Additionally, as expected, r, v, latitude, and longitude remained constant from one simulation to the other. Based on these observations, the base dynamics of the model have been validated and the simulation can proceed to a medium fidelity, or optimization model.

3.1.2. Medium fidelity model validation

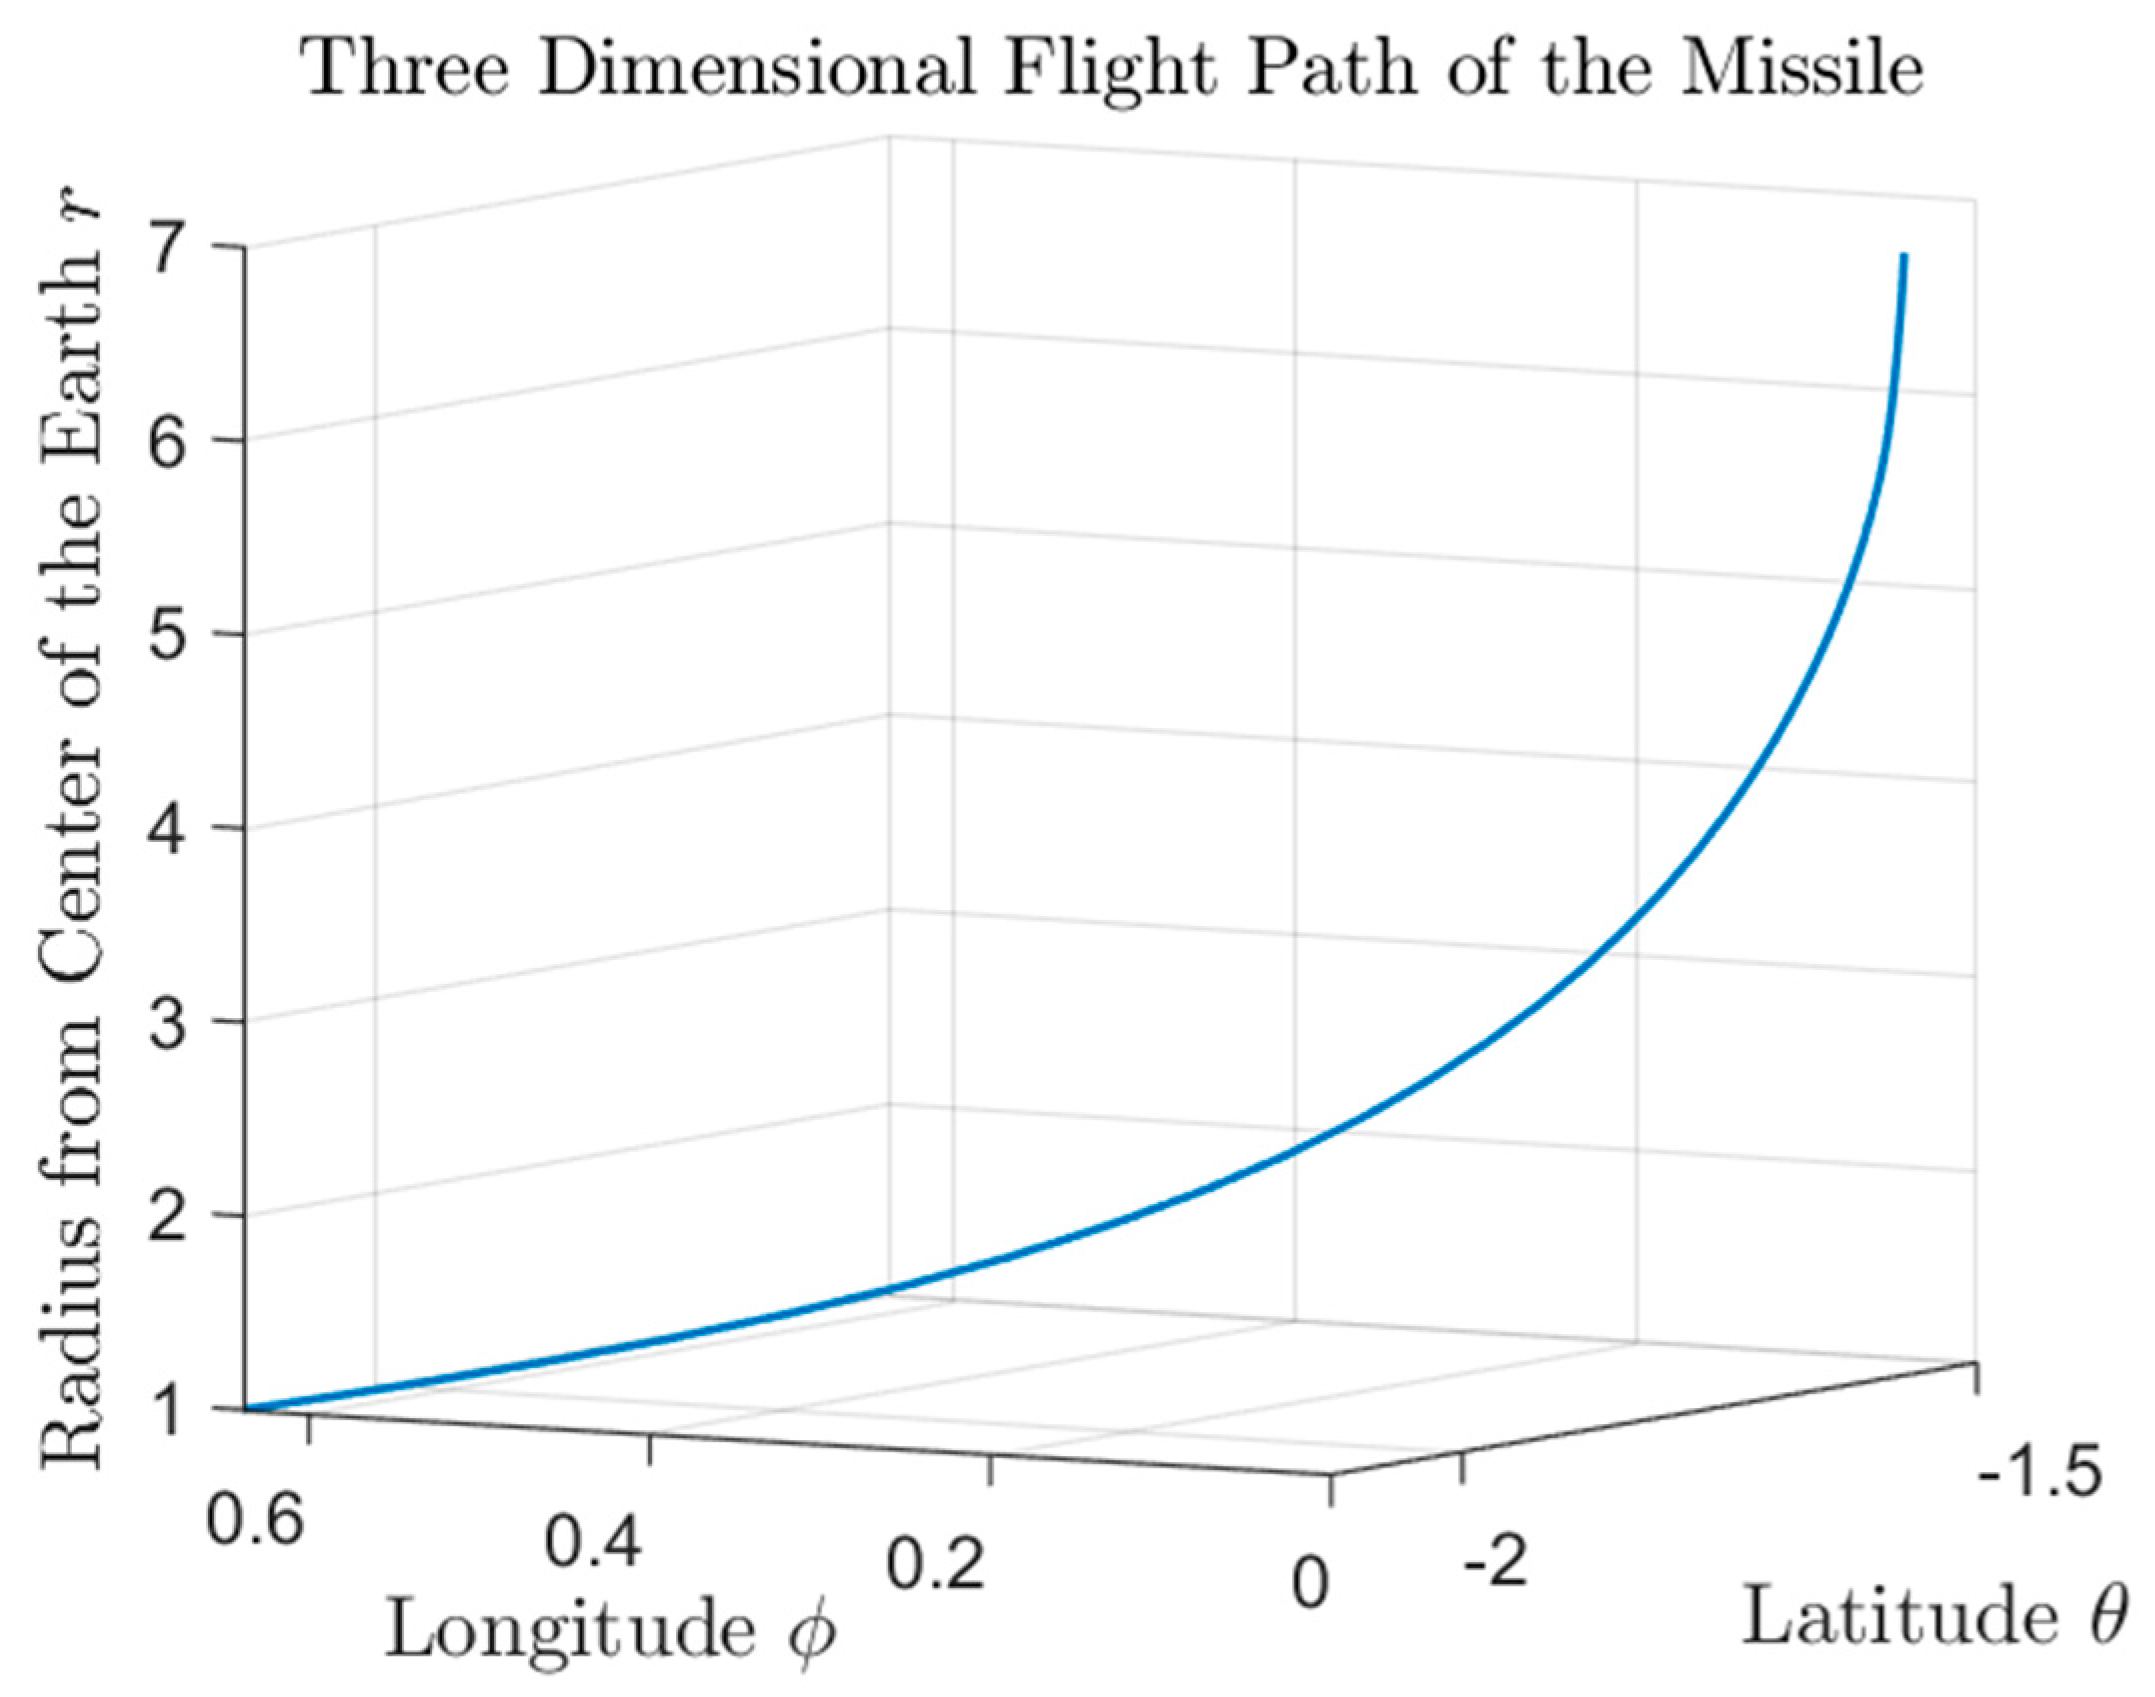
The dynamic model was simulated another time with the vehicle at the same longitude as the target and making the rate of change of the flight pitching angle to zero in the dynamics equations while accounting for a changing gravitational force due to altitude. The scaled outputs from this simulation are shown in Figure 4.
Table 14. Table of proximal variable definitions.
Variable/concept Definition Variable/concept Definition
φ Latitude Angle v Velocity
γ Flight Path Angle ψ Heading Azimuth
θ Longitude Angle r Distance
L Lift Control Variable
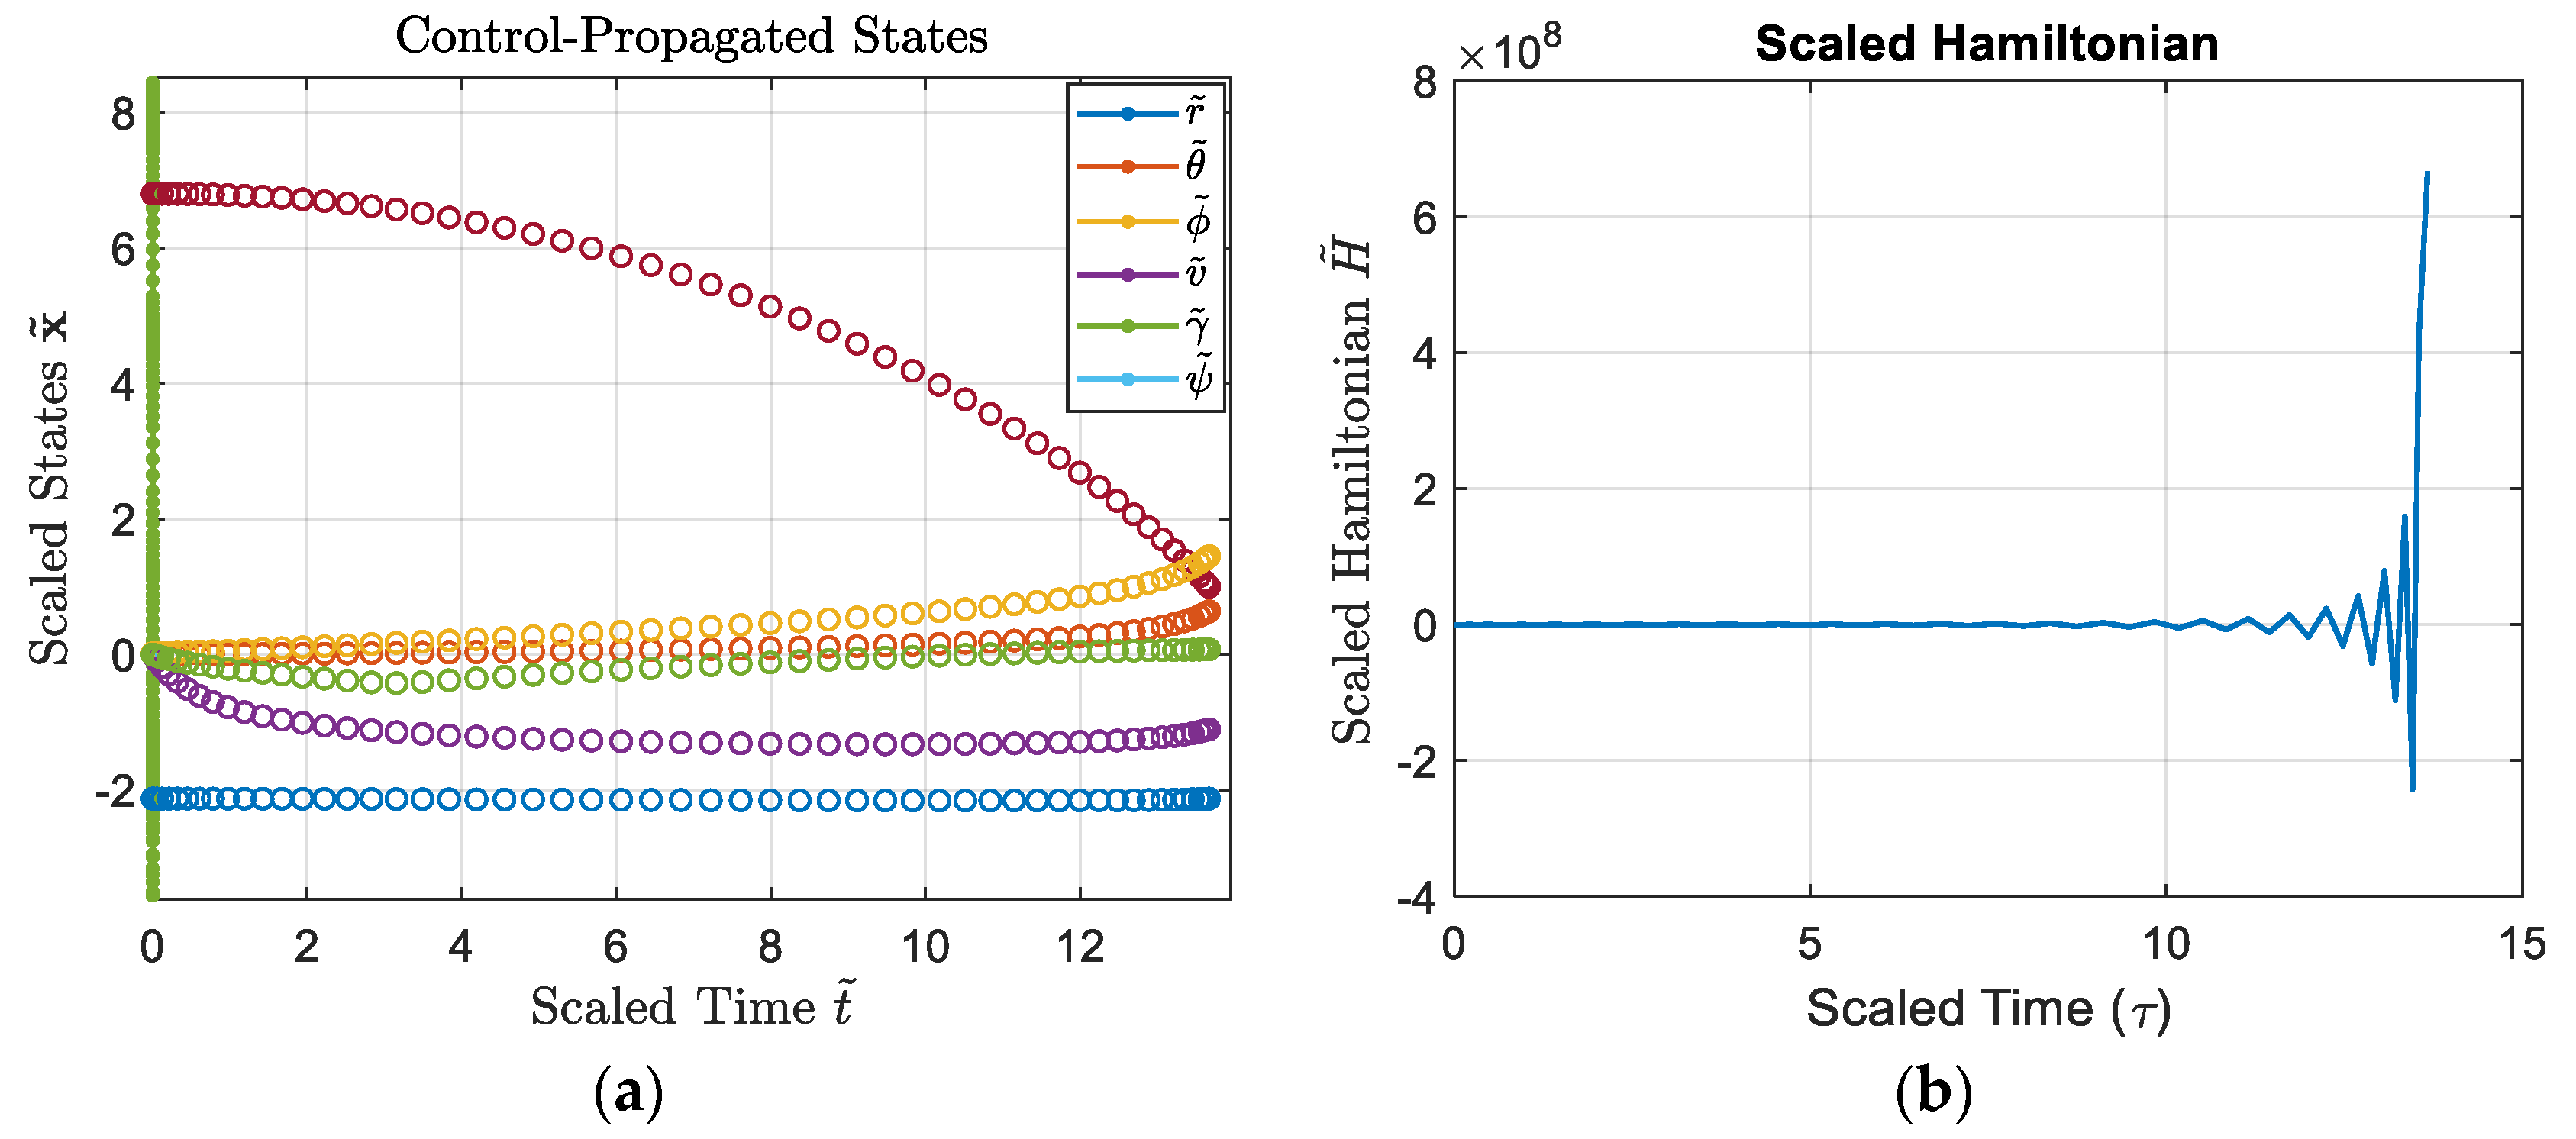
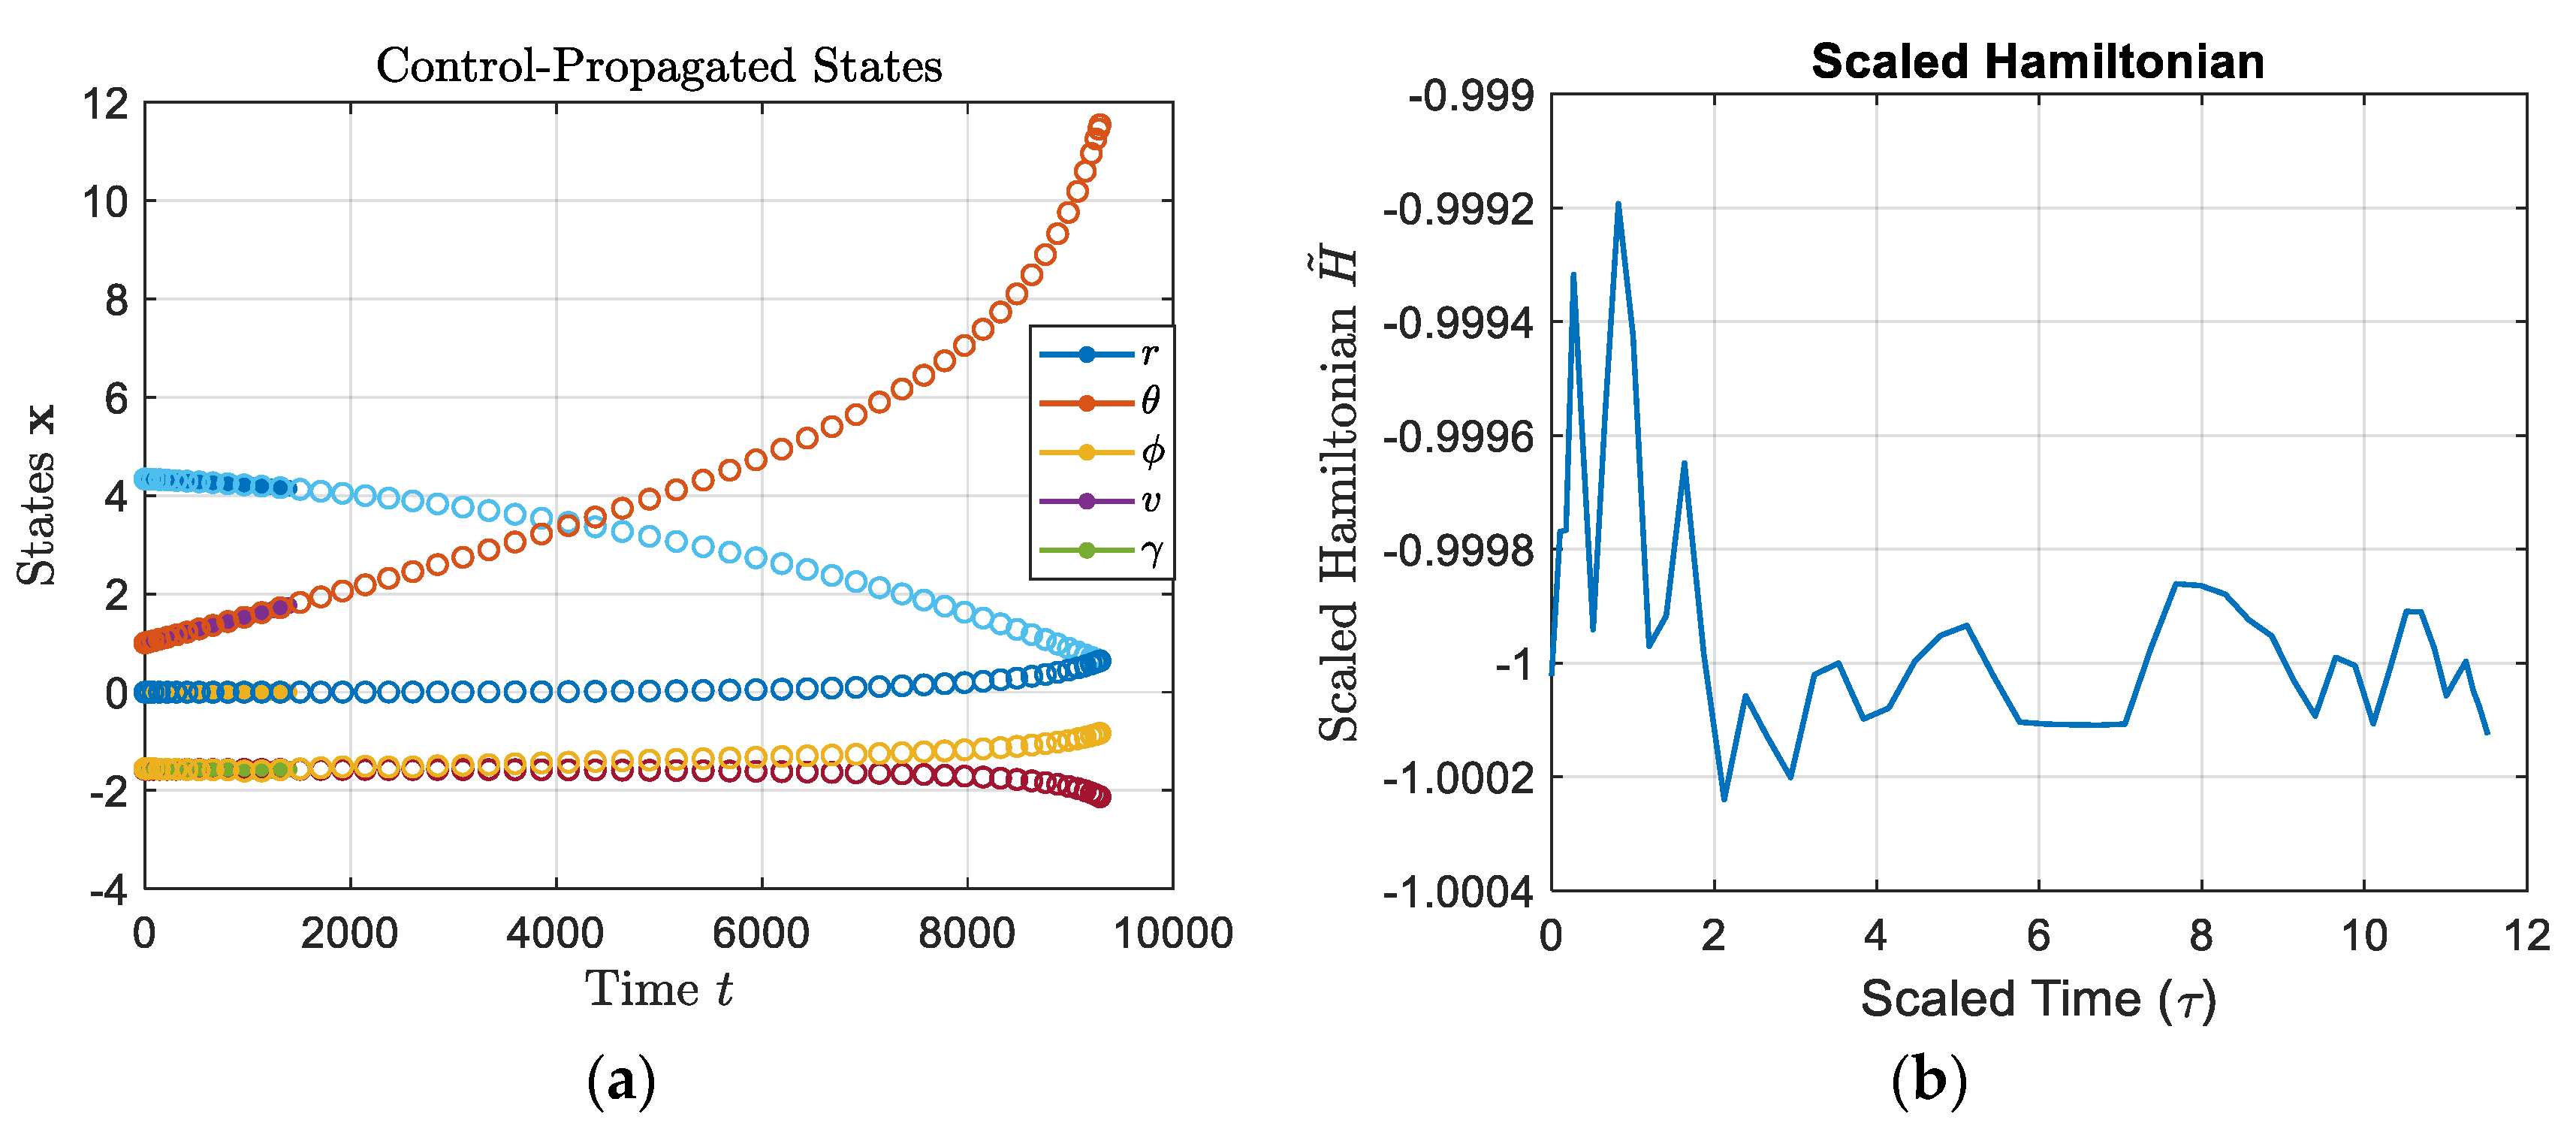
As expected, the altitude falls in a parabolic fashion towards the earth with a corresponding increase in velocity throughout the simulation. To verify that we have isolated the azimuth heading control, the controls page shows a nearly constant flight path angle control. For analyzing purposes, the propagated states and Hamiltonian are shown in Figure 5 and a three-dimensional depiction of the flight path is shown in Figure 6.
Table 15. Table of proximal variable definitions.
Variable/concept Definition Variable/concept Definition
φ Latitude Angle v Velocity
γ Flight Path Angle ψ Heading Azimuth
θ Longitude Angle r Distance
As seen in Figure 5a, the state trajectories follow that of the propagated states to satisfy the feasibility check. The Hamiltonian remains constant for the first 90% of the simulation before it destabilizes and diverges at the end of the simulation leading to some doubt as to the optimality of the simulation. Conversely, the theta co-state does stay constant for the duration of the simulation as expected. This leads to the belief that the Hamiltonian is spiking due to a lack of determinacy on the time value in the problem which could possibly be resolved by adding a running cost in the final problem. Additionally, all co-states ended as expected with velocity, flight path angle and heading azimuth all ending near zero.
The next test had both controls activated to test the overall validity of the dynamic model while maintaining constant forces throughout the simulation. No constraints were placed on the model other than limiting the controls to approximately 1000N as an arbitrary limit on the forces allowed on the control fins. Due to singularity issues that arose when -90 degrees was chosen as the initial flight path angle, an initial angle of -89 was used. Figure 7 shows the scaled outputs of this simulation.
Table 16. Table of proximal variable definitions.
Variable/concept Definition Variable/concept Definition
φ Latitude Angle v Velocity
γ Flight Path Angle ψ Heading Azimuth
θ Longitude Angle r Distance
L Lift Control Variable λ Costate Variable
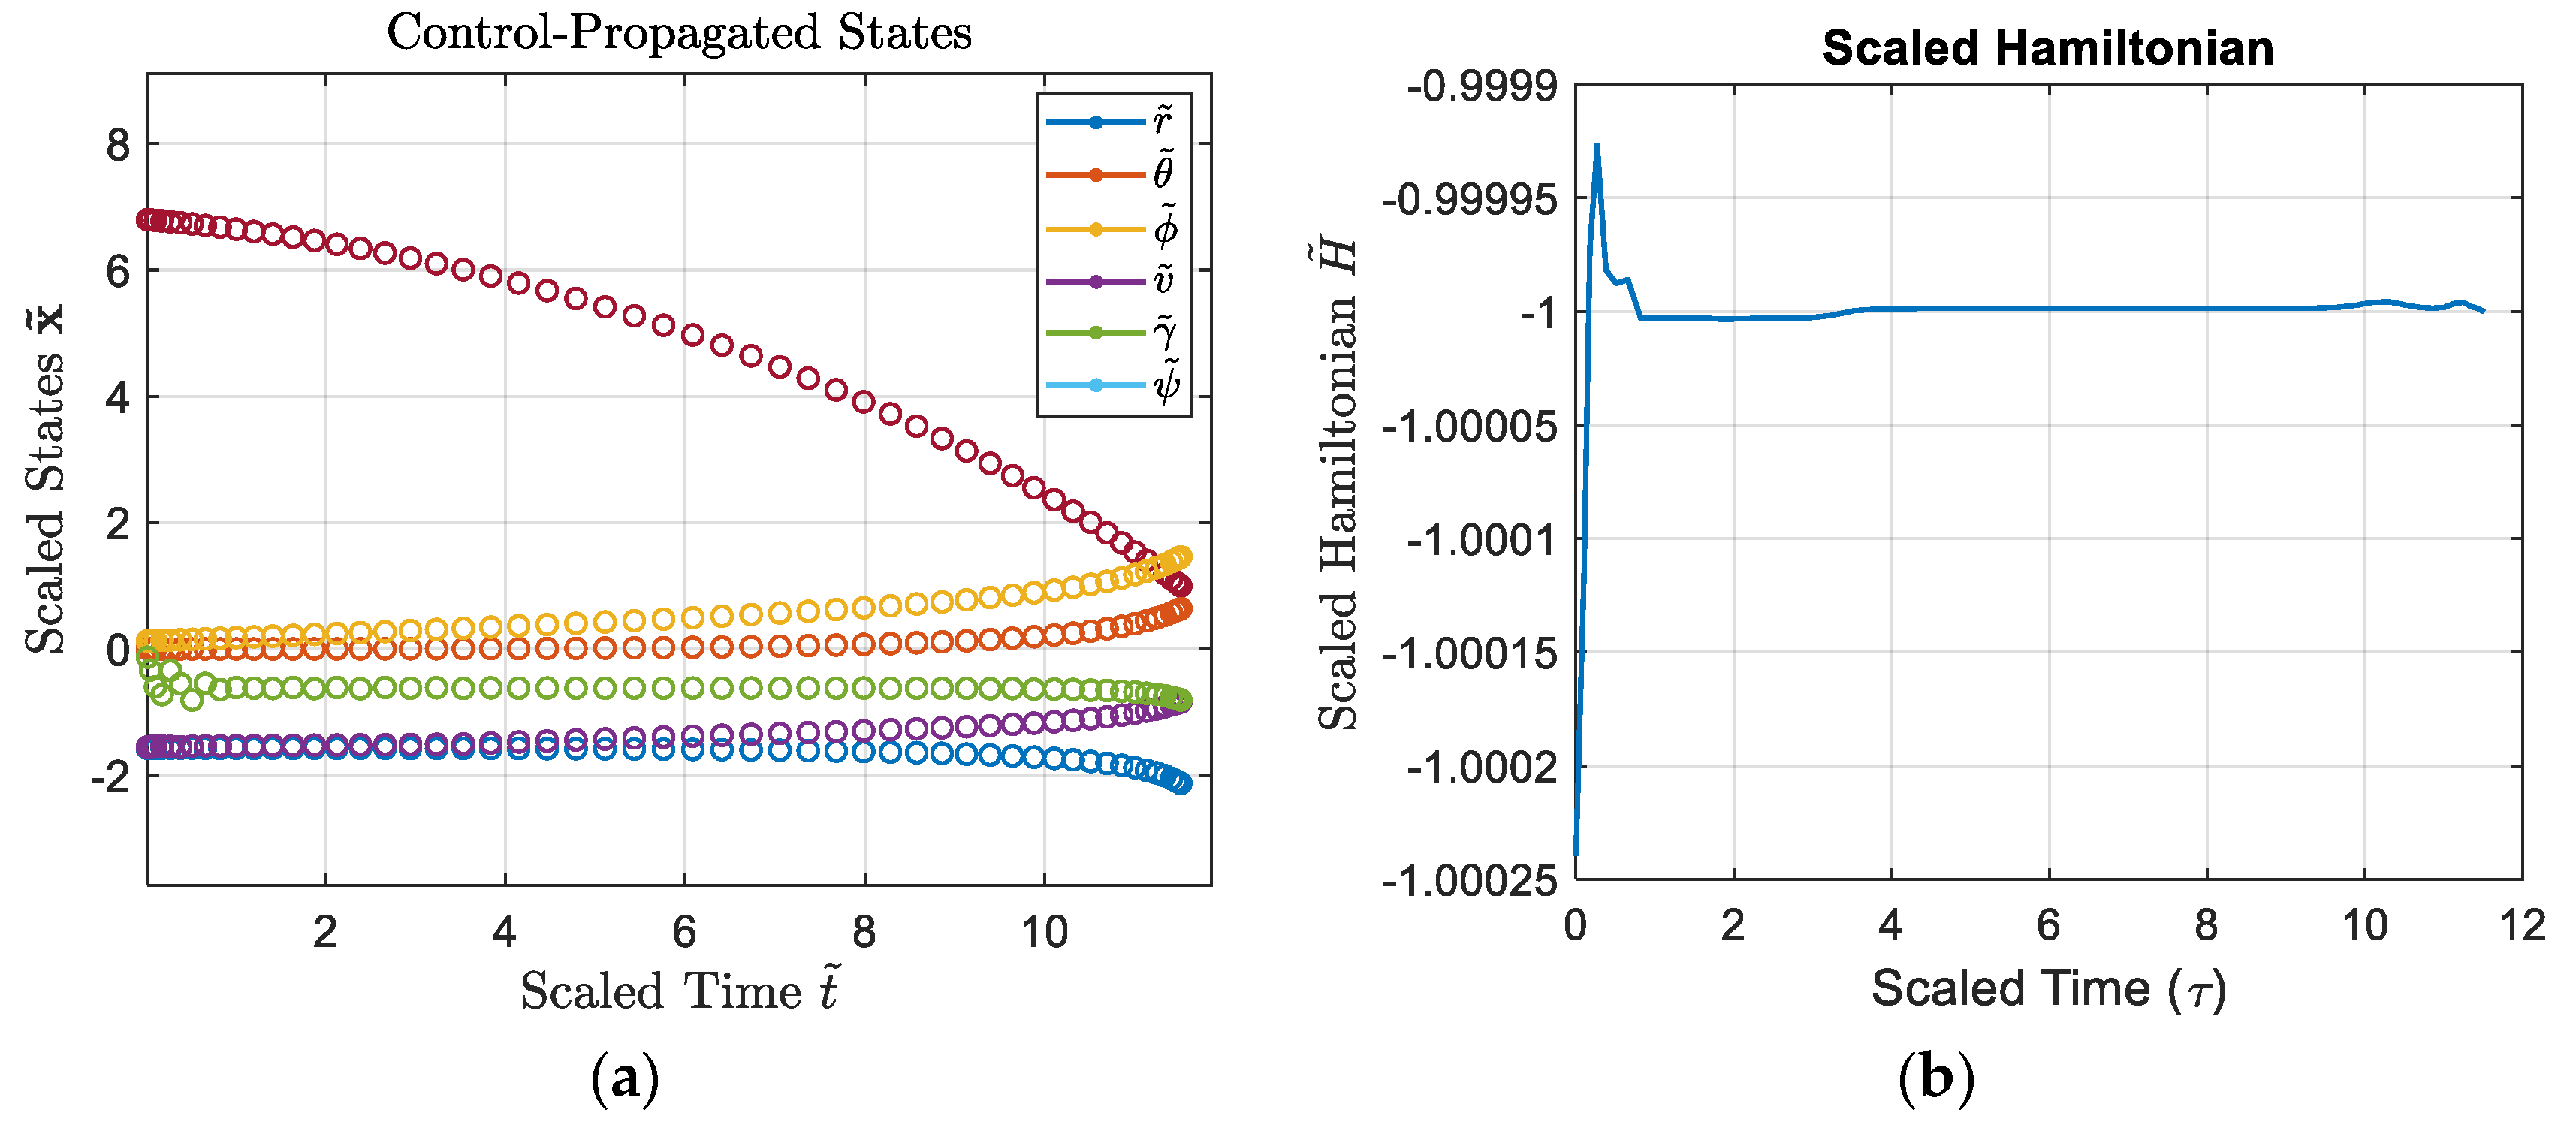
The trajectories act as expected with the altitude lowering from its initial altitude to final in a parabolic fashion with a corresponding increase in velocity. For analysis, the simulation was again propagated through the ode45 program. Figure 8 shows the control propagated states and Hamiltonian.
As shown in the propagated states, the trajectories of the states perfectly match those of the DIDO solution. Additionally, the Hamiltonian is nearly constant at 1 for the duration of the simulation with a maximum fluctuation of two ten-thousandths from a steady -1. For the purposes of this simulation, this will be labeled as constant at -1. Lastly, the co-states converge to zero as expected from the HAMVET process. Between these points, the feasibility of the model is verified.
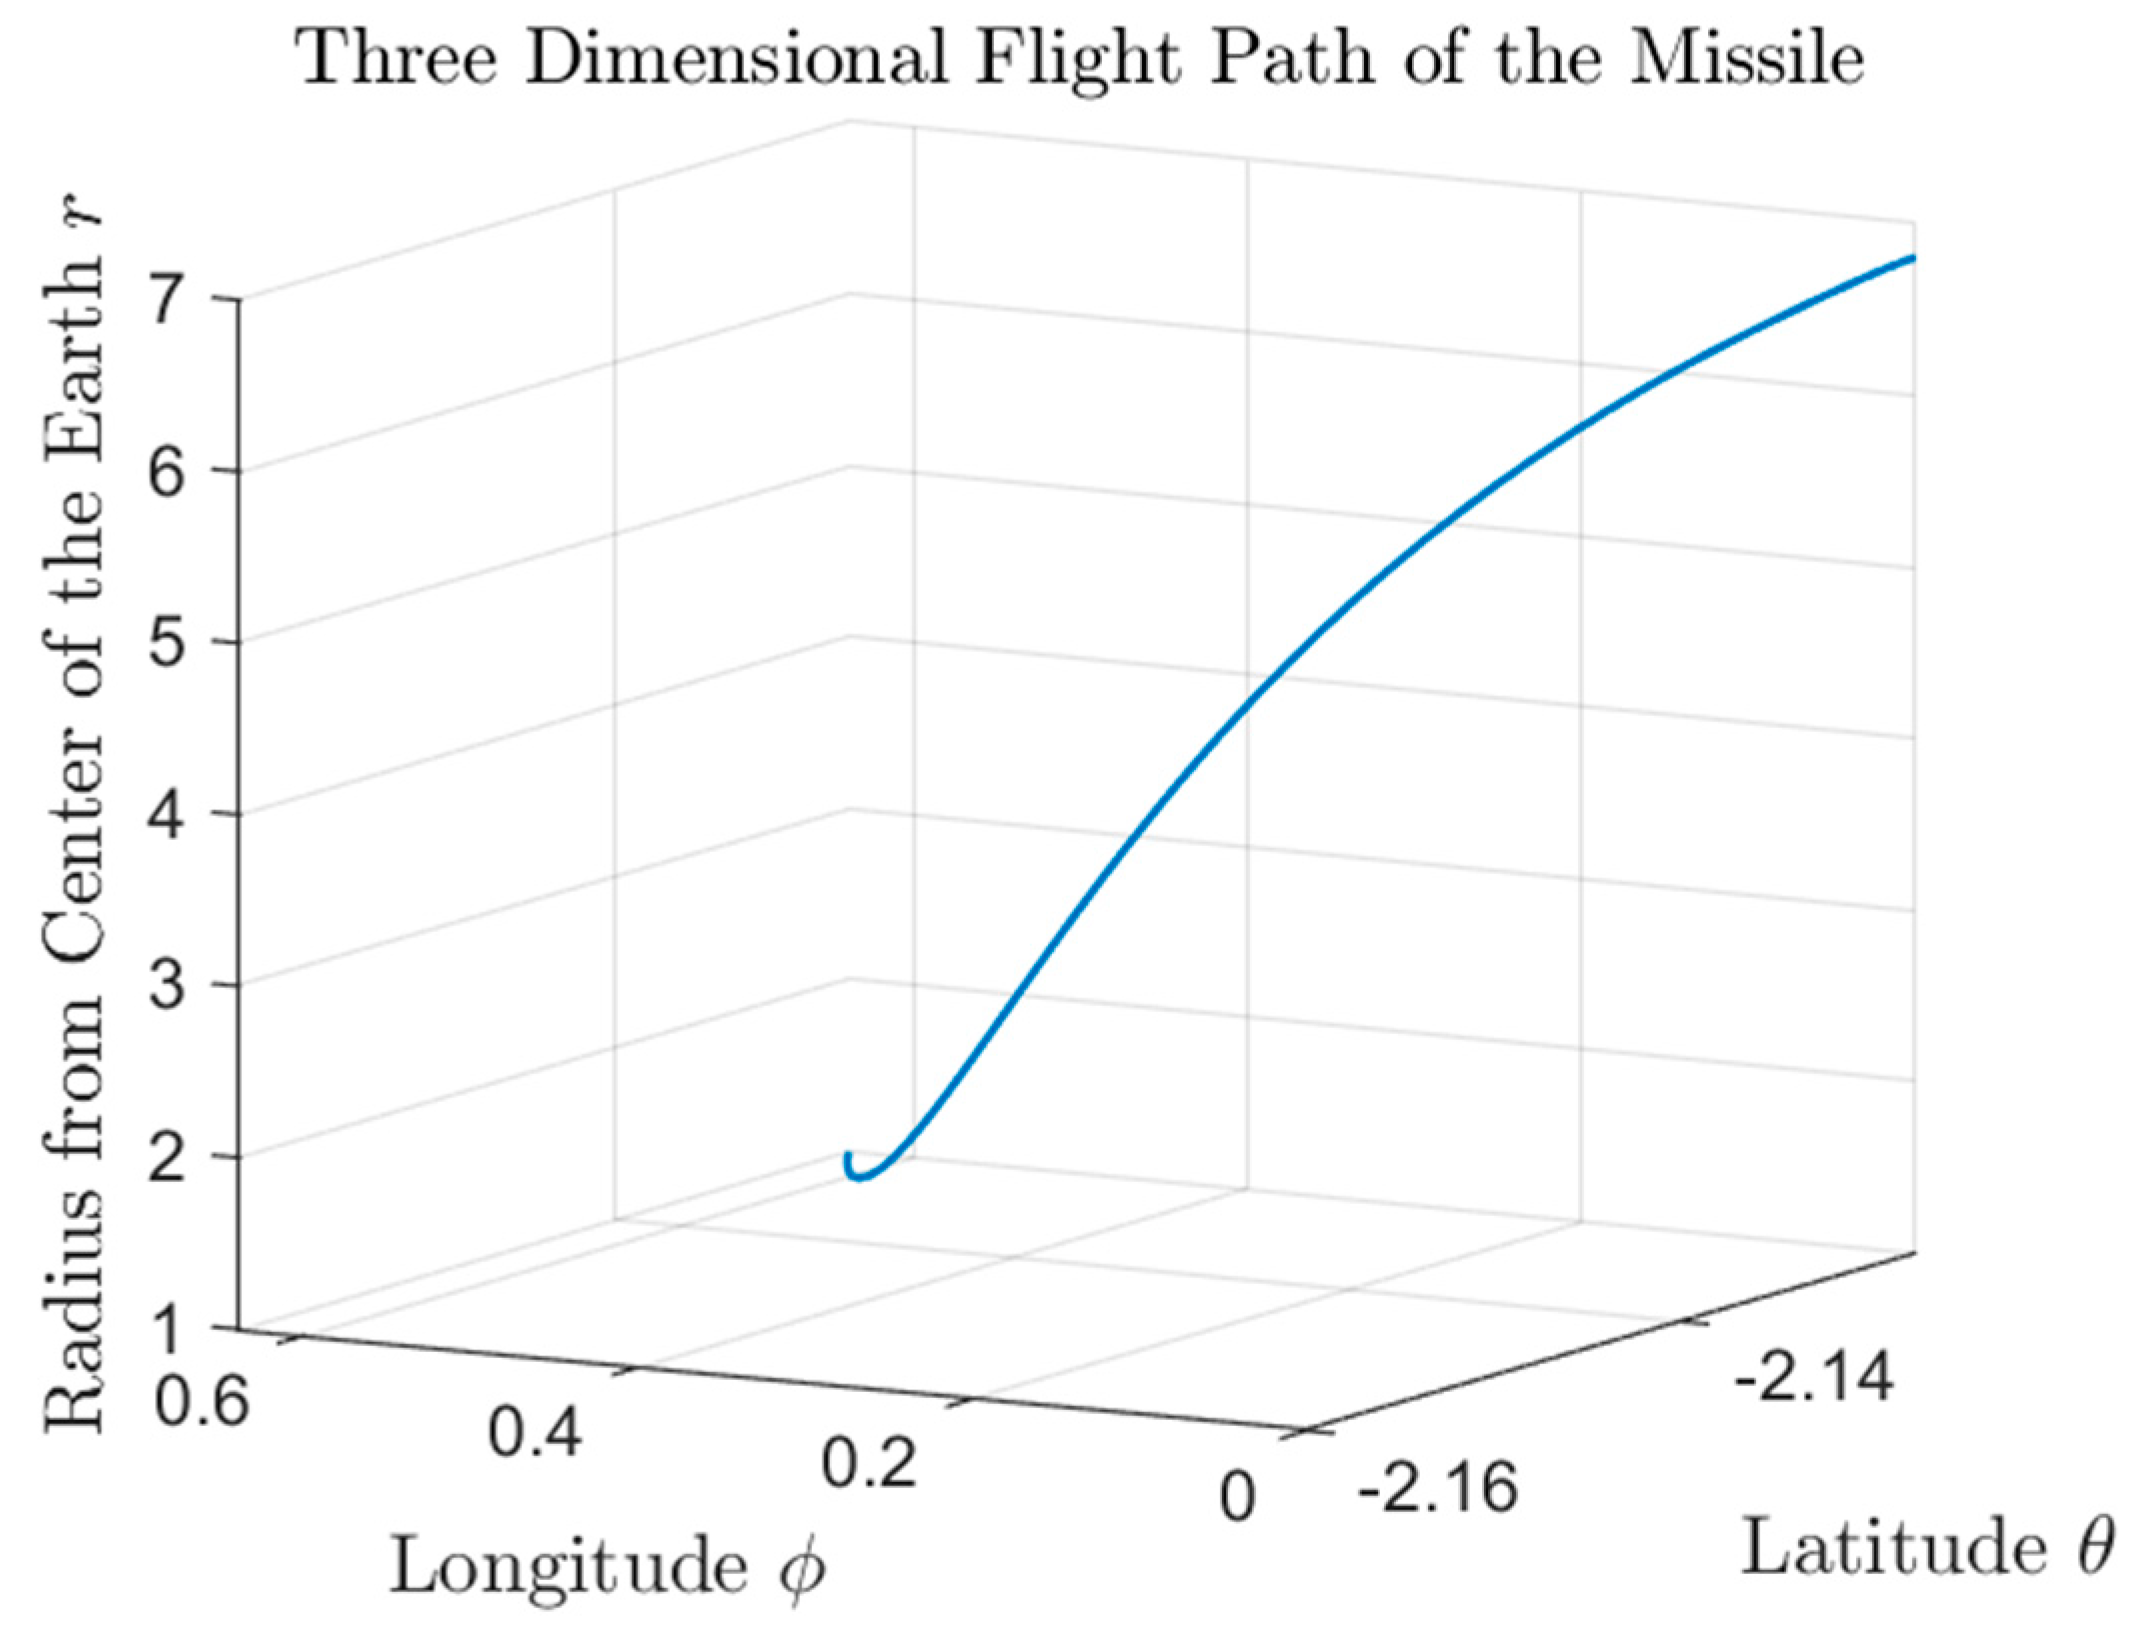
This flight path appears closer to what is expected with a large downward trajectory while building speed prior to turning in a smooth manner towards the target instead of arcing around the target which was shown in the single control plots. This smooth flight profile is shown in Figure 9.
These tests verify the general build of the model using propagated states while isolating each individual control and using the DIDO program to solve for an extremal solution and repeating the process with both controls activated without path constraints or varying thrust or drag.

3.1.3. Optimization Model

The model was updated to account for the constrain the heating rate of the vehicle during flight through varying density based off of altitude in accordance with Equation 33 where kQ is the heating constant, ρ is the air density at altitude and v is the velocity of the vehicle and air density was calculated using Equation 34 where ρo is the air density at sea level, h is the altitude, rp is the radius of the earth, and Hs is a height scaling factor equal to 7500.
Q ˙ = k Q ρ v 3 < 4.9 e 9 W m 2
ρ = ρ 0 exp h r p H S
The remaining initial conditions remained constant from the previous test. Figure 10 shows the scaled outputs of this simulation.
Table 17. Table of proximal variable definitions.
Variable/concept Definition Variable/concept Definition
φ Latitude Angle v Velocity
γ Flight Path Angle ψ Heading Azimuth
θ Longitude Angle r Distance
L Lift Control Variable λ Costate Variable
As seen in Figure 13, the trajectories act as expected with the altitude lowering from its initial altitude to final in a parabolic fashion with a corresponding increase in velocity. Of note, the heading azimuth state fluctuates much more drastically than seen in any other tests to this point. For verification and validation, Figure 11 shows the control propagated states and Hamiltonian.
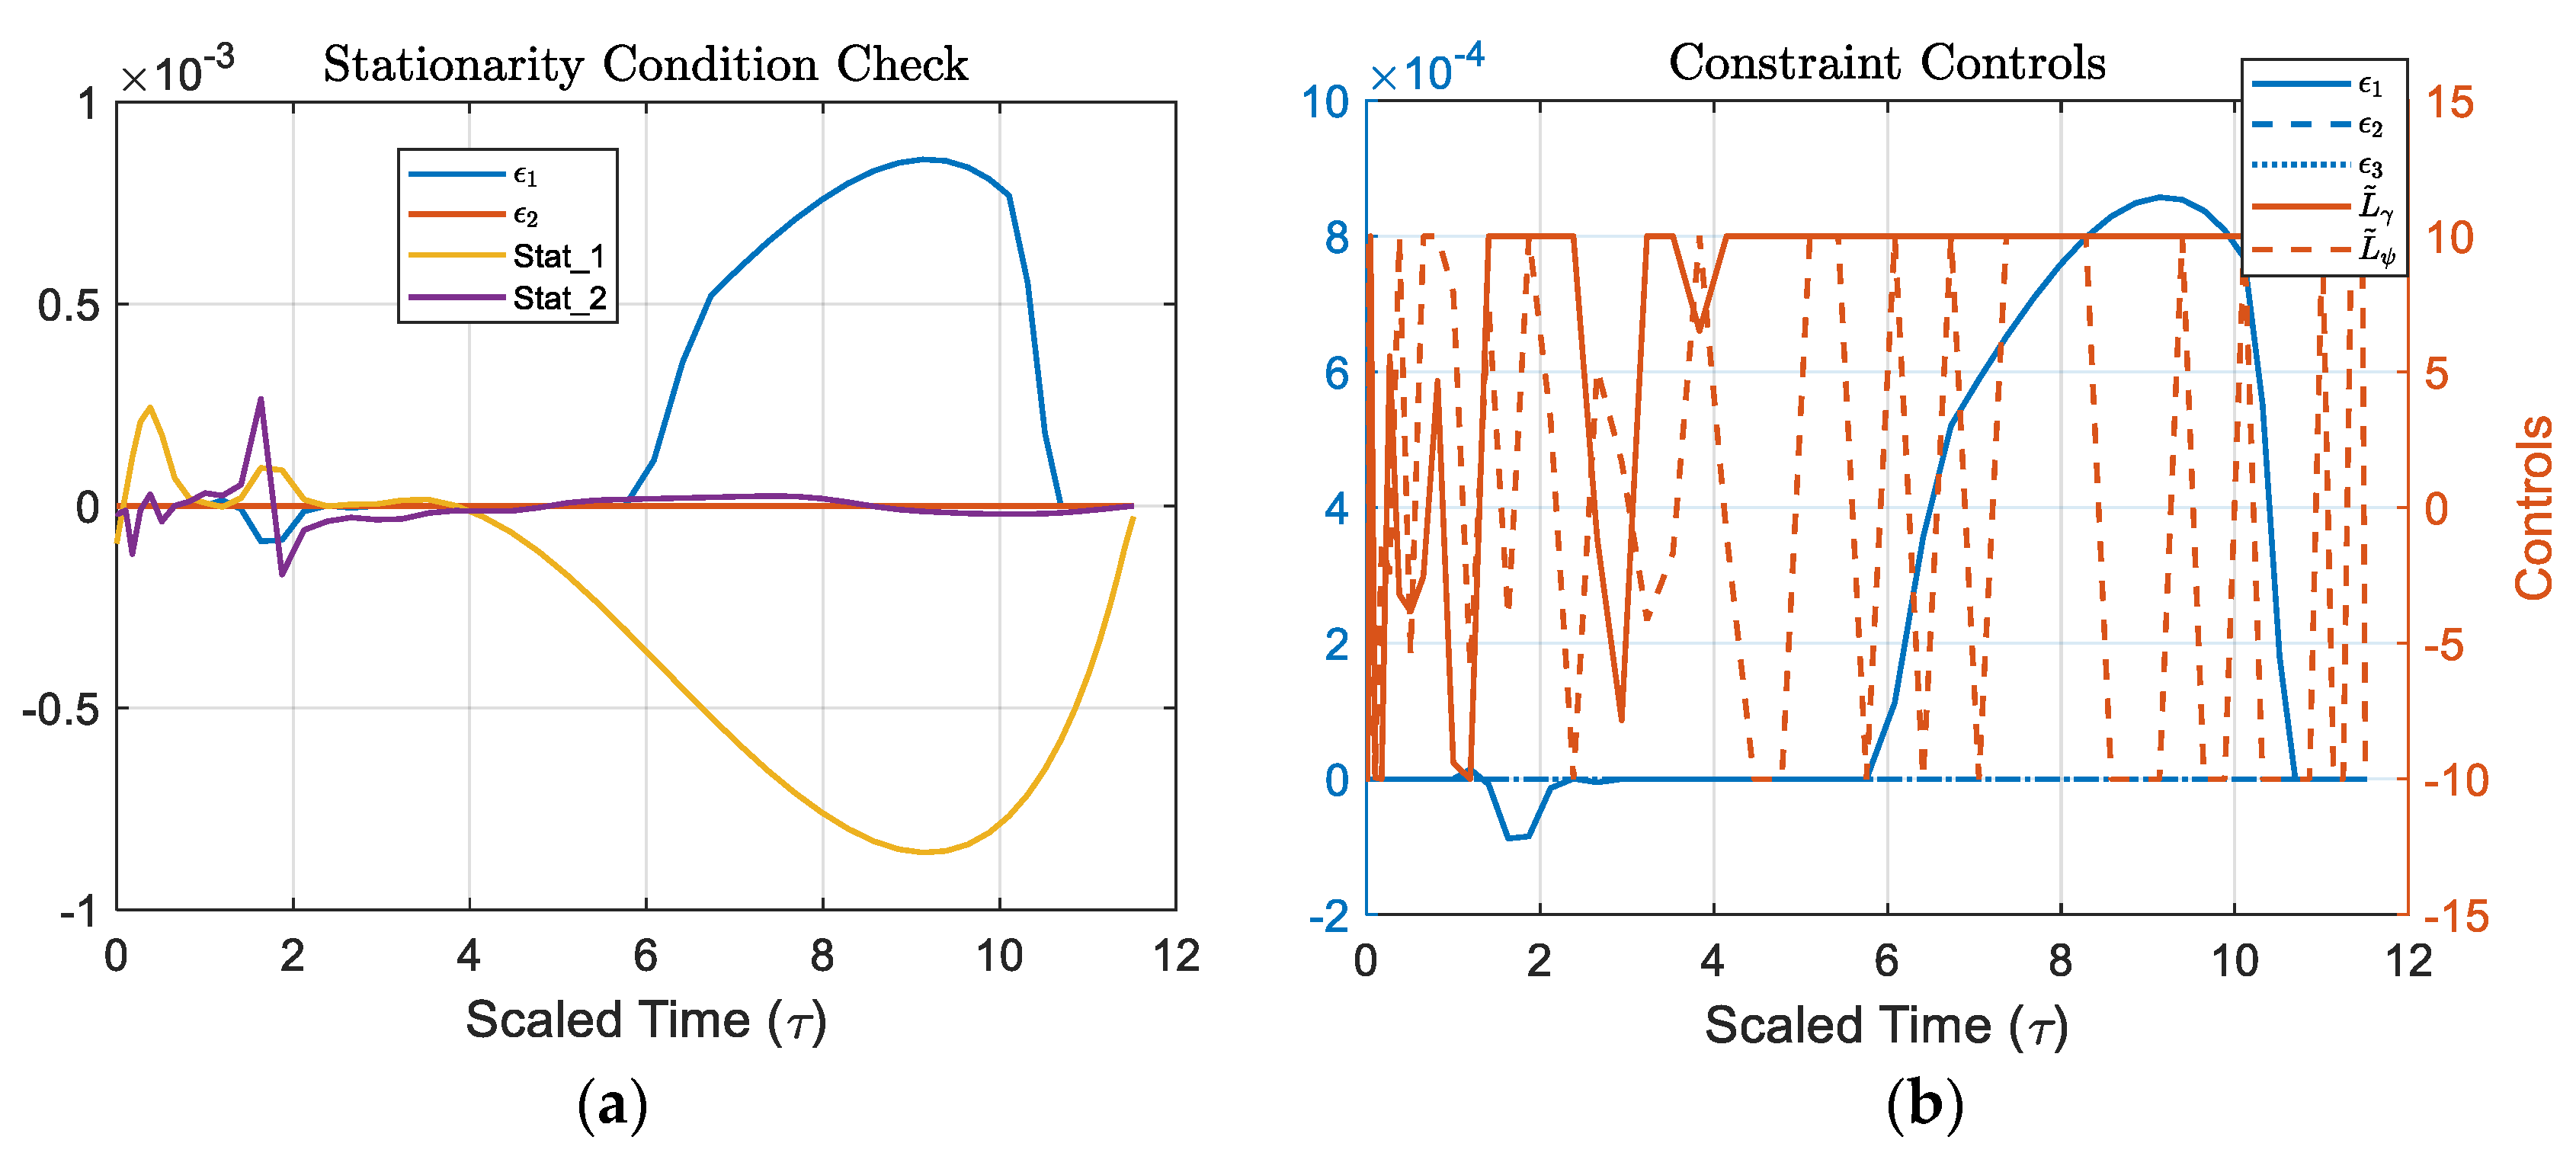
The Hamiltonian is nearly constant at 1 for the duration of the simulation with a maximum fluctuation of 8 ten-thousandths from a steady -1. For the purposes of this simulation, this will be labeled as constant at -1. The feasibility check follows the dynamic path for all except for φ with iteration unable to maintain due to small step sizes, most likely due to singularities in the denominator of the equations due to the denominator of the azimuth state dynamic containing the cosine of the flight path angle. At any point the flight path angle crosses -90 degrees, or straight down, this value turns to zero and is mathematically impossible to calculate. An additional cause for the failure to continue solving is the drastic changes in the azimuth state as the ode45 solver is unable to follow the sudden change in direction while propagating states forward. Attempts at solving this included lessening the initial downward angle of the vehicle, but this is undesirable as it presents a bias towards a certain hemisphere instead of allowing global targeting. Additionally, when this initial angle was placed in for troubleshooting, the feasibility check would pass as the singularities were no longer present, but the overall solution was deemed as a suboptimal solution instead of the extremal solution that is achieved with a near 90-degree initial angle. The stationarity condition checks, and complementarity condition checks are shown in Figure 12.
Table 18. Table of proximal variable definitions.
Variable/concept Definition Variable/concept Definition
ε Path Constraint Variable L Lift Control Variable
Based on the stationarity condition in equation (26), the path constraint control, ε_1 should be equal and opposite of the function identified as Stat1 in Figure 12a. Similarly, the path constraint control ε2 should be equal and opposite of the curve labeled as Stat2 in accordance with equation (27). While not perfectly matching in the slope of the curve, the magnitudes for the first path constraint control match with ε_1 maxing out at 8.57e-4 and Stat1 with maximum negative of -8.57e-4. The second stationarity check is a little off in that the constraint control remains constant at zero for the duration of the simulation, but Stat2 fluctuates to a maximum of 2.6e-4. While this number is small, a closer relationship in slope in the first stationarity check and magnitude in the second would be preferred.
According to the complementarity conditions in Equation 28 and that the scaled controls max out at 10 and -10, the constraint controls should remain constant at zero for the duration of the simulation with the possibility of the control fluctuating either positively or negatively when the control is touching the maximum deflection of 10. As shown in Figure 12b, the only time that ε_1 fluctuates is when L ~ γ is holding at 10.0, allowing a value greater than or equal to zero during this time. From the scaled time of 5 to 11, this is shown in the maximum fluctuation of the control to a value of 8.57e-4. Of concern is that while L ~ γ is at a positive 10 from scaled time 1 to 2.5, there is a negative ε_1 which should not occur. While the values remain small in the range of 1e-4, according to the complementarity conditions there should not be a negative value at all during this time, but instead should be greater than or equal to zero.
The second complementarity condition follows the same rules as the first regarding when a positive and negative value are allowed. With ε2, however, the value remains constant at zero for the duration of the simulation. This path constraint control passes the check as even when the controls are maxed, the constraint control is allowed to maintain zero. Due to being unable to constrain the heating rate of the vehicle due to constant velocity increases with a maximum velocity at the final time, the heating rate constraint is never activated and ε3 remains constant at zero.
Lastly, the co-states converge to zero as expected from the HAMVET process. The λ ~ v costate ends at 1.2928e-4, λ ~ γ ends at -0.0198, and λ ~ ψ ends at -1.4421e-4. With λ ~ v having a maximum magnitude of -14.2817, the end point is less than one ten-thousandth of a percent of the maximum magnitude. Doing the same comparison with λ ~ γ and λ ~ ψ , the end points result in 5.5% and 3.3% of the maximum magnitude respectively. Between these points, the feasibility of the model is verified. The states, co-states and controls were descaled and are shown in Figure 13, but due to the large magnitude differences and scale of the plot all the states appear to be at zero.
To observe the behavior of each state, they are plotted individually with the state and co-state simultaneously as shown in Figure 14 and Figure 15.
Table 19. Table of proximal variable definitions.
Variable/concept Definition Variable/concept Definition
φ Latitude Angle v Velocity
γ Flight Path Angle ψ Heading Azimuth
θ Longitude Angle r Distance
λ Costate Variable L Lift Control Variable
Figure 14 and Figure 15 are beneficial in observing the direct behavior of each individual state. During the simulations and testing, it was observed that the heating rate could not be constrained to any value other than the maximum value expected at sea level with the maximum velocity. By looking at Figure 14a, this becomes apparent as the velocity is constantly increasing due to the constant thrust on the vehicle, and therefore the maximum heating rate will occur at the exact point that it was calculated and cannot be lowered. To constrain the heating rate, the velocity will need to be lowered by either a variable thrust motor or utilizing a non-extremal solution. Figure 14 a and b indicate that the vehicle falls almost vertically from the release point for the first third of flight before making a smooth turn towards the target. This behavior is expected due to the limited control authority from control fins in orbit.
Comparing the behavior of the flight path angle and heading azimuth illustrates a difference in the method used for adjustments between the two. Figure 15b shows that the flight path angle gradually decreases towards zero as the vehicle flies and impacts with a flight path angle of -47.86 degrees, or nearly 48 degrees nose down below the planet relative horizon. In contrast to this method, the heading azimuth makes large and rapid adjustments at the beginning of the trajectory and then smooths out at the end, impacting with a heading azimuth of -46.93 degrees, or 47 degrees to the left of planet relative 0 (north). Due to the search window of -180 degrees to 180 degrees, or a full 360-degree circle, the heading azimuth bounces from -180 to 180 degrees and continues but should be viewed as continuing through planet relative south heading as the vehicle maneuvers. This portion of the flight is the same portion that causes the validation check to fail with the sharp changes in direction of the state vector.
Even with these concerns, an extremal solution was found with the vehicle directly hitting the intended target. The optimal flight time of the trajectory for this specific target case is two hours, thirty-four minutes, and forty-six seconds. The vehicle impacts with a final velocity of 11.54 km/sec, equaling a kinetic energy of 0.333 terajoules. This kinetic energy is roughly equivalent to 300,000 lbs. of TNT. For perspective, this is 150 times the strength of a standard 2000lb bomb carried by fighter aircraft without any explosives in the vehicle itself. The three-dimensional trajectory of the vehicle flight path is shown in Figure 16.

3.2. Coordinate Transformation Results

3.2.1. Simulation Configuration and Accuracy

The simulation was run using multiple Matlab Simulink solvers in order to determine the accuracy of the simulation as demonstrated in Figure 17 and Table X.
Table 20. High, medium, and low fidelity model comparison of incorporating variables/concepts.
Solver Solver Type Frequency (Hz) Max Error
ode4 Runge-Kutta 34.6 1.6x10⁻¹⁰
ode5 Dormand-Prince 34.6 1.1x10⁻¹²
ode5 Dormand-Prince 40 1.7x10⁻⁹
ode4 Dormand-Prince 40 3.1x10⁻¹³
Auto Auto Select FAILED FAILED
ode4 Runge-Kutta 90 2.1x10⁻¹⁵
ode4 Runge-Kutta 110 1.4x10⁻¹⁵
ode4 Runge-Kutta 130 1.4x10⁻¹¹
ode4 Runge-Kutta 100 0.9 x10⁻¹⁵
1 Runge-Kutta (ode4) with 100Hz was selected
Using the quaternion normalization condition, the simulation was verified to be accurate to near machine precision in the case of input to a single Euler angle while accounting for six degrees of freedom. For commanded Pitch, Roll and Yaw simultaneously, best precision was found to be 4.8x10⁻¹¹ using the ode4 solver with a frequency of 117Hz.

3.2.2. Dynamics of Motion in Six Degrees

The only change between tests was the order of the mathematical rotation conducted in the DCM in order to validate the accuracy and computation required for each and allow a direct comparison.

3.2.2.1. Kinetics of Rotational Motion

The simulation ran in accordance with Euler’s equations of motion accounting for the changing angular velocities and accelerations found with a falling and rotating object, while accounting for the rotation of the earth under the falling missile.

3.2.2.2. Kinetics of Translational Motion

With mass remaining constant, the simulation runs in accordance with Newton’s second law. The simulation starts in a geosynchronous orbit with less velocity than required to maintain orbit. This initial condition, coupled with the commanded inputs, immediately initiates a dive towards the earth with a constant thrust along the XBody axis.

3.2.2.3. Kinetics of Disturbance Forces and Torques

The simulation accounts for magnetic disturbances and the gravity gradient as the missile falls to the earth but does not account for drag disturbances. While drag would slow the missile, because the forces used remain constant, the DCM comparison remains valid.

3.2.2.4. Kinetics of Motion

As discussed in Section III, the only “true” Euler angle output from a DCM is the last mathematical rotation. For the purposes of analysis, the true Roll angle, Φ, is pulled from executing a 321 rotation; the true pitch angle, Θ, is from a 132 rotation; and the true yaw angle, ψ, is from a 213 rotation. The true Euler angles from these rotations is given as Φ = -0.5825°, Θ = 10.2404°, and ψ = 0.0863°. With the defined maneuver of Φ = 10°, Θ = -30°, and ψ = 30°, the desired angles, rates and acceleration trajectories remain constant.
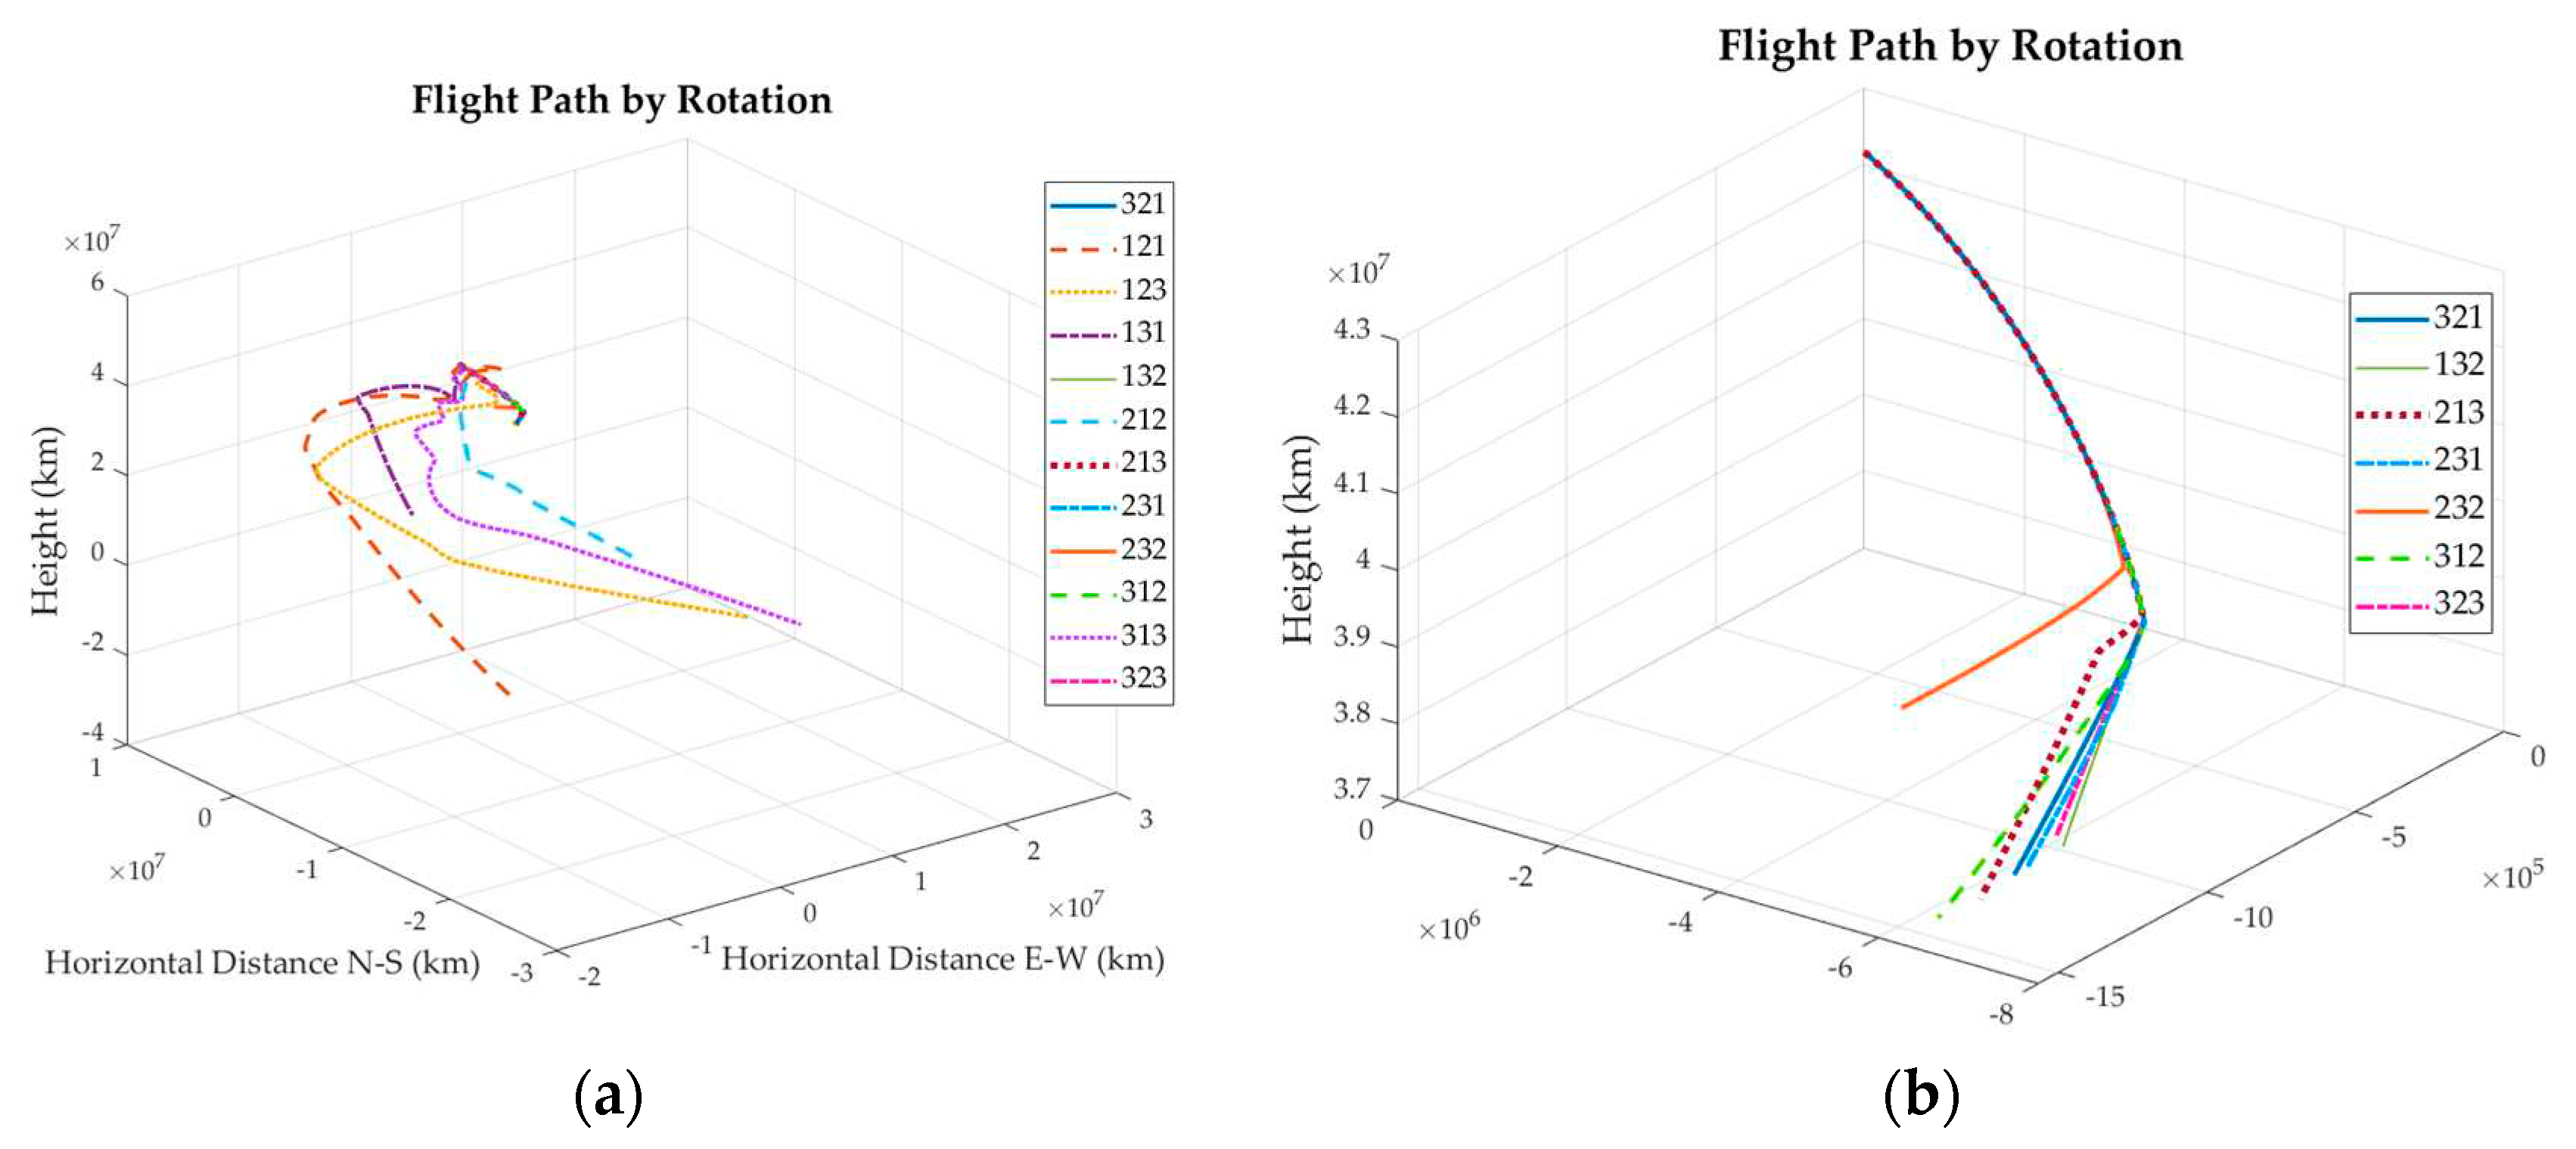
Changing the mathematical rotation order changes the flightpath and distance traveled of the missile as displayed in Figure 18. Derived Euler angles with associated error and computational burden expressed in run time for each rotation are found in Table 3.
Figure 18. Three-Dimensional plot of the Vehicle Flight Path.
Preprints 92685 g018
Figure 19. Comparison of Quaternion Normalizations (on the ordinate) for different step sizes and solver schemes.
Preprints 92685 g019
Figure 20. Three-dimensional flight path of the missile based on the order of mathematical rotation chosen in the DCM and a zoomed in portion of the rotations traveling closest to each other.
Preprints 92685 g020
Table 21. Derived Euler angles, associated error and simulation run time.
Rotation Angle Derived Value (Deg) Error (Deg) Average Error (Deg) Run Time (Sec) Rotation Angle Derived Value (Deg) Error (Deg) Average Error (Deg) Run Time (Sec)
121 Roll (Φ) 130.7395 131.322 55.3893 0.005 231 Roll (Φ) 0.4906 1.0731 7.312 0.014
Pitch (Θ) 45.0 34.7596 Pitch (Θ) -10.2447 20.4851
Yaw (ψ) 0.0 0.0863 Yaw (ψ) -0.2915 0.3778
123 Roll (Φ) 144.7919 145.3744 58.7043 0.014 232 Roll (Φ) 108.6987 109.2812 97.58703 0.013
Pitch (Θ) -6.3093 16.5497 Pitch (Θ) 0.0 10.2404
Yaw (ψ) -14.1025 14.1888 Yaw (ψ) -173.153 173.2395
131 Roll (Φ) 0.0 0.5825 108.4614 0.013 312 Roll (Φ) 0.9839 1.5664 0.5805 0.014
Pitch (Θ) -164.374 174.6144 Pitch (Θ) 10.2398 0.0006
Yaw (ψ) -150.101 150.1873 Yaw (ψ) 0.2608 0.1745
132 Roll (Φ) -0.2011 0.3814 0.143967 0.013 313 Roll (Φ) 0.0 0.5825 89.83103 0.012
Pitch (Θ) 10.2404 0.0 Pitch (Θ) -156.248 166.4886
Yaw (ψ) 0.1368 0.0505 Yaw (ψ) -102.336 102.422
212 Roll (Φ) 76.5964 77.1789 34.52863 0.012 321 Roll (Φ) -0.5825 0.0 6.8473 0.015
Pitch (Θ) -16.0803 26.3207 Pitch (Θ) -10.2373 20.4777
Yaw (ψ) 0.0 0.0863 Yaw (ψ) 0.1505 0.0642
213 Roll (Φ) -0.8559 0.2734 6.916233 0.013 323 Roll (Φ) 9.9889 10.5714 37.2335 0.011
Pitch (Θ) -10.2349 20.4753 Pitch (Θ) 0.0 10.2404
Yaw (ψ) 0.0863 0.0 Yaw (ψ) 90.975 90.8887

4. Discussion

Based on this analysis, it can be shown that the most accurate single DCM rotation method for a missile delivered from orbit is the 132 sequences. Of all the rotation schemes, the 132 is the only rotation resulting in less than 1 degree of error in all three Euler angle calculations from the true Euler angles derived. The next closest solution is the 312 sequences with the most accurate pitch value of any rotation not used to calculate the true value. In all simulations when a rotation is repeated (i.e., 131 or 313), the average error is drastically larger than the remaining rotation schemes. All simulations had similar computational burdens, with eleven of the twelve rotation schemes separated by three one-thousandths of a second. Between the two most accurate rotation schemes, the 132 rotation was one one-thousandth of a second quicker than the 312 (0.013 vs 0.014 seconds). Therefore, in order to maximize accuracy for this type of delivery without increasing computing power required, a 132-rotation scheme will provide the most accurate solution, while any solution not rotating by one of the Euler angles will lead to the greatest miss.
Due to the construct of the simulation, the DCM was continuously updated as the missile fell to the ground, causing an updated Euler angle. While the method of solving for each angle resulted in no quadrant ambiguity, the angles values were dependent on other “non-true” values from the DCM sequence selected. To find a constant true Euler angle, further research can be conducted to resolve this dependency.
The optimal trajectory solution is validated through a series of tests with error in the level of tens of thousandths of a point through the duration of flight as determined during the development of the Hamiltonian and using Pontryagin’s Principle. The program is written in a manner that is easily replicated for any target by merely changing the desired latitude and longitude of impact while still accounting for variable density and gravitational forces at altitude.
Combining the means to calculate a desired flight path with the ability to convert it into useable information and commands for the missile control system provides a means for defense agencies to fill a gap within the hypersonic weapons systems capabilities that will defeat current defense systems available. The optimal trajectories calculated are being tracked in open loop, amplifying the importance of eliminating kinematically induced errors as described in this manuscript. With these conclusions in mind, one can say that an orbitally delivered kinetic missile that accurately impacts only the desired target at over 33 times the speed of sound and comparable to an atomic weapon with zero fallout is within our reach.

Author Contributions

Conceptualization, D.C.; methodology, D.C. and T.S; software, D.C. and T.S.; validation, D.C and T.S.; formal analysis, D.C.; investigation, D.C.; resources, D.C and T.S.; data curation, D.C.; writing—original draft preparation, D.C.; writing—review and editing, T.S. and J.H.; supervision, T.S.; All authors have read and agreed to the published version of the manuscript.

Funding

This research received no external funding.

Institutional Review Board Statement

Not applicable.

Informed Consent Statement

Not applicable.

Data Availability Statement

Data supporting reported results can be obtained by contacting the corresponding author.

Conflicts of Interest

The authors declare no conflict of interest.

Appendix A SIMULINK® models

Figure A1. Simulink System Page.
Preprints 92685 g0a1
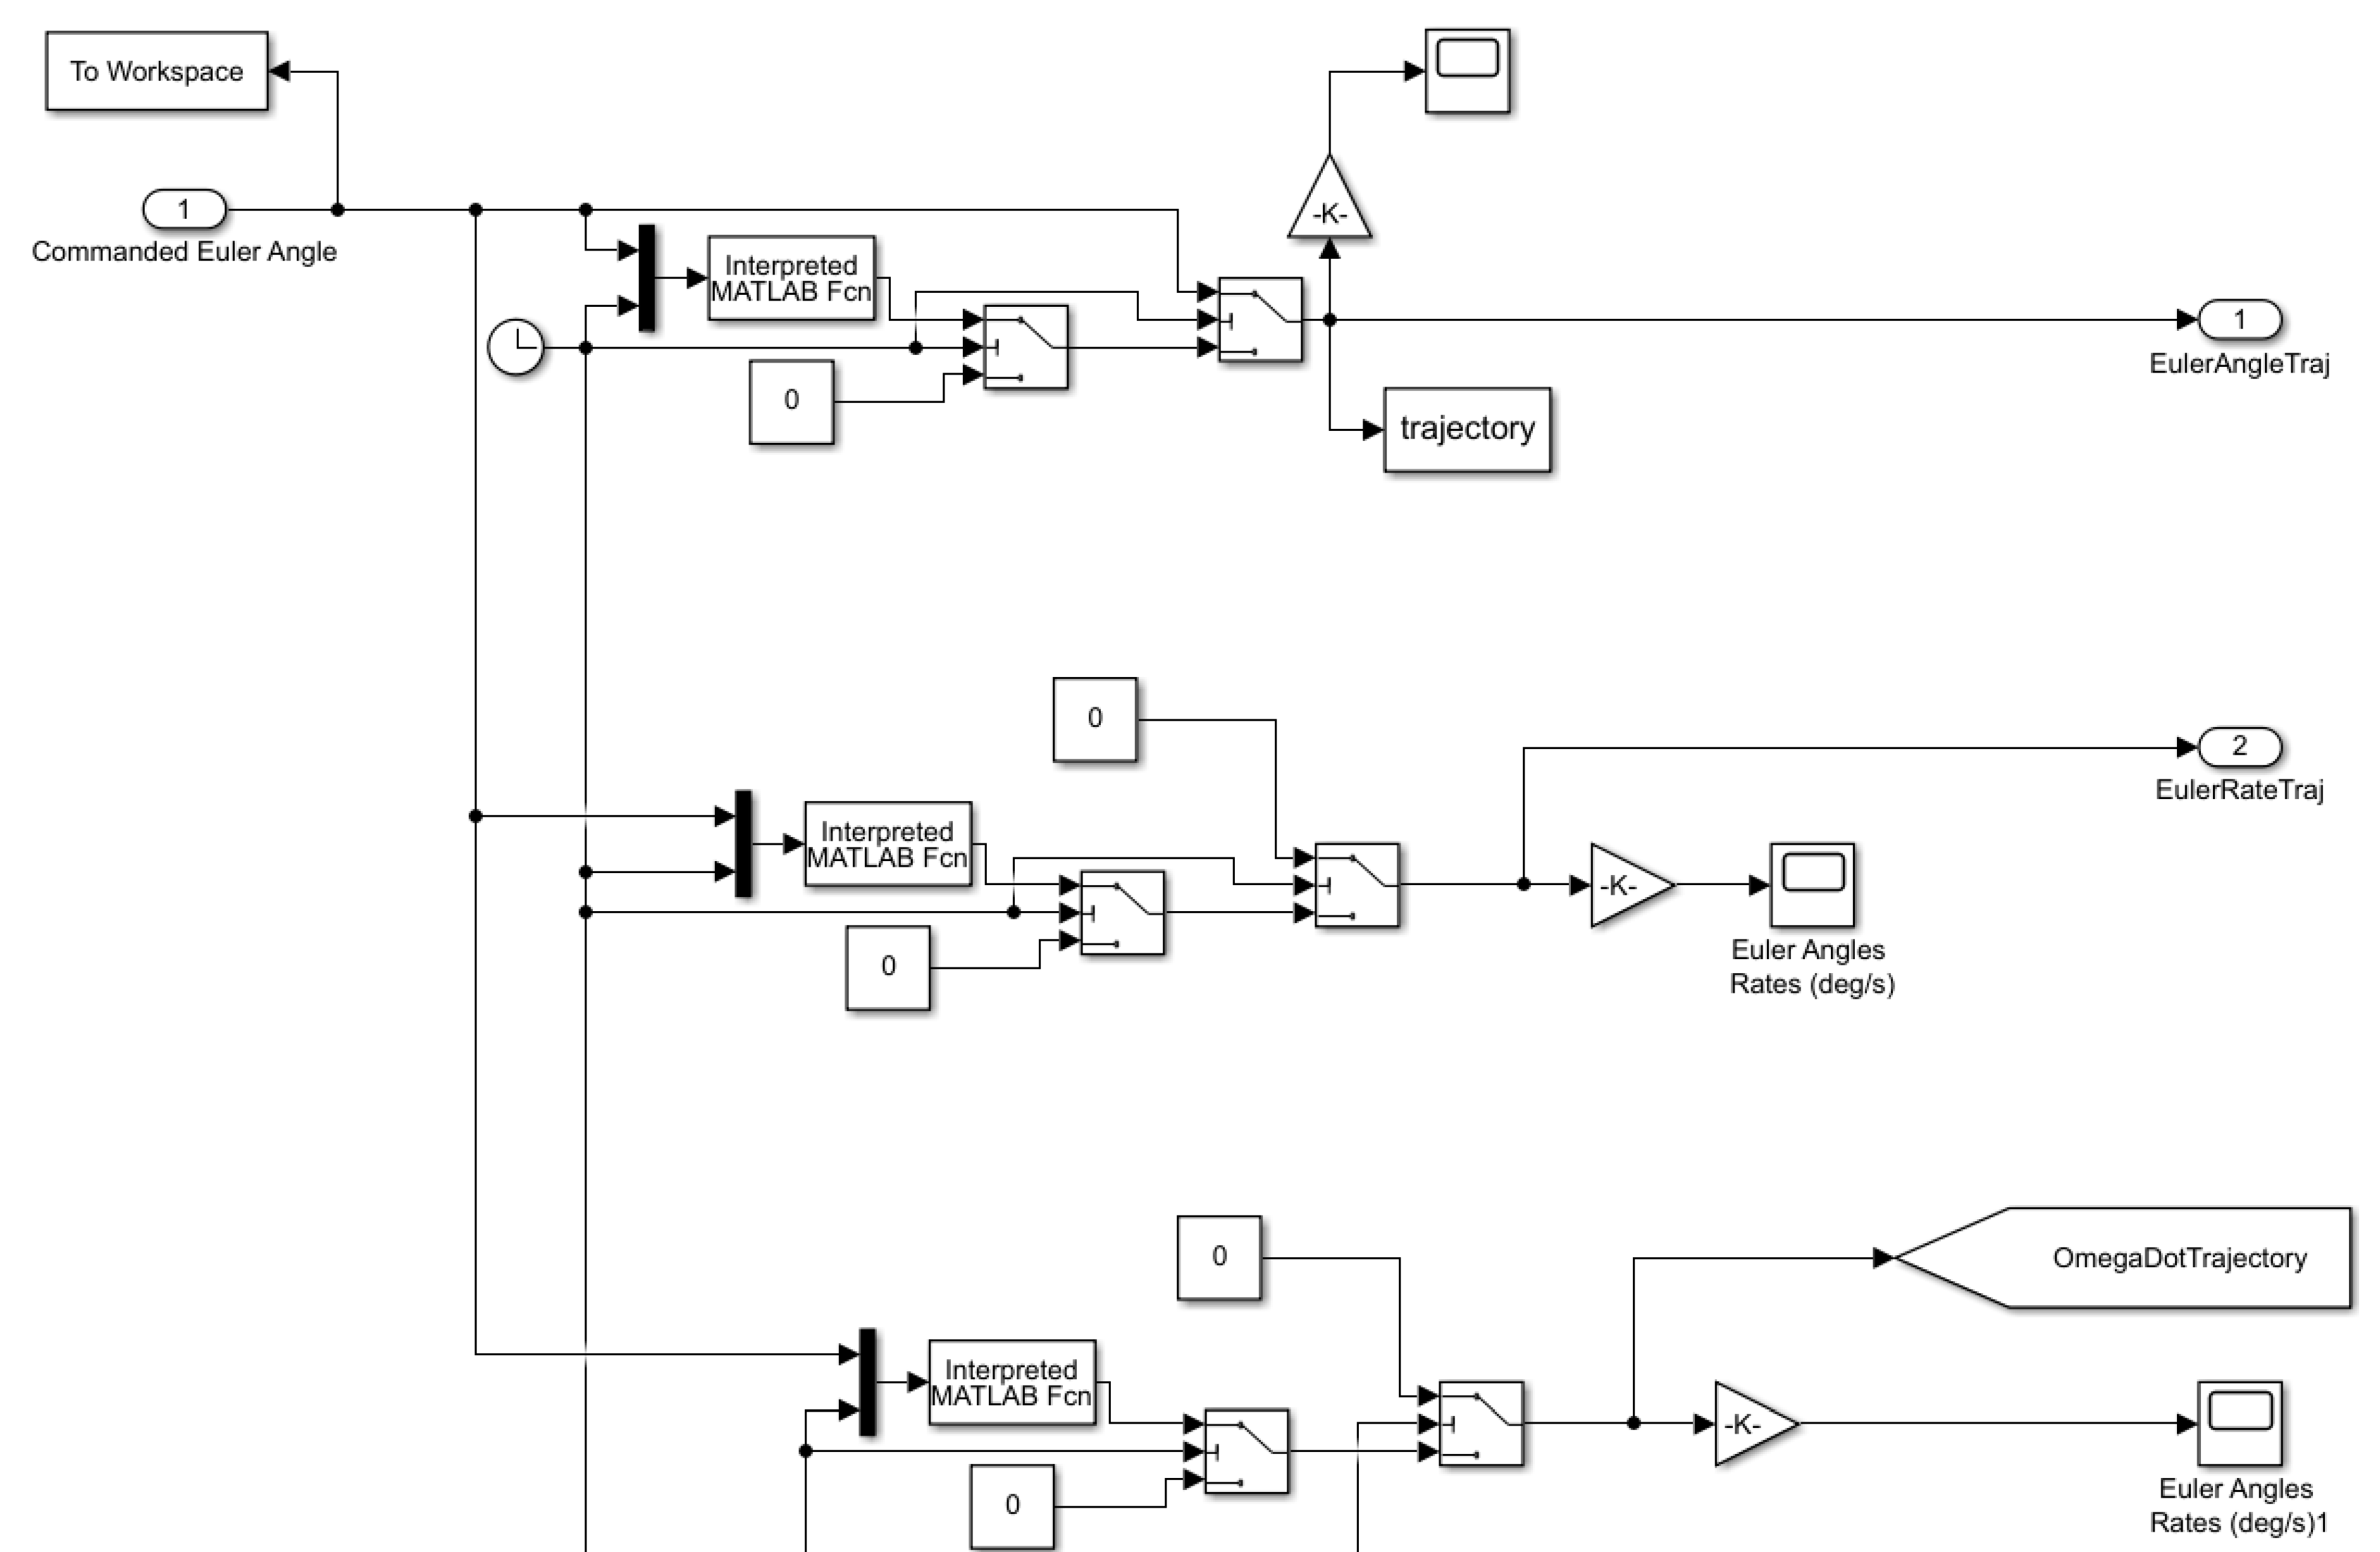
Figure A2. Trajectory Generation Subsystem.
Preprints 92685 g0a2
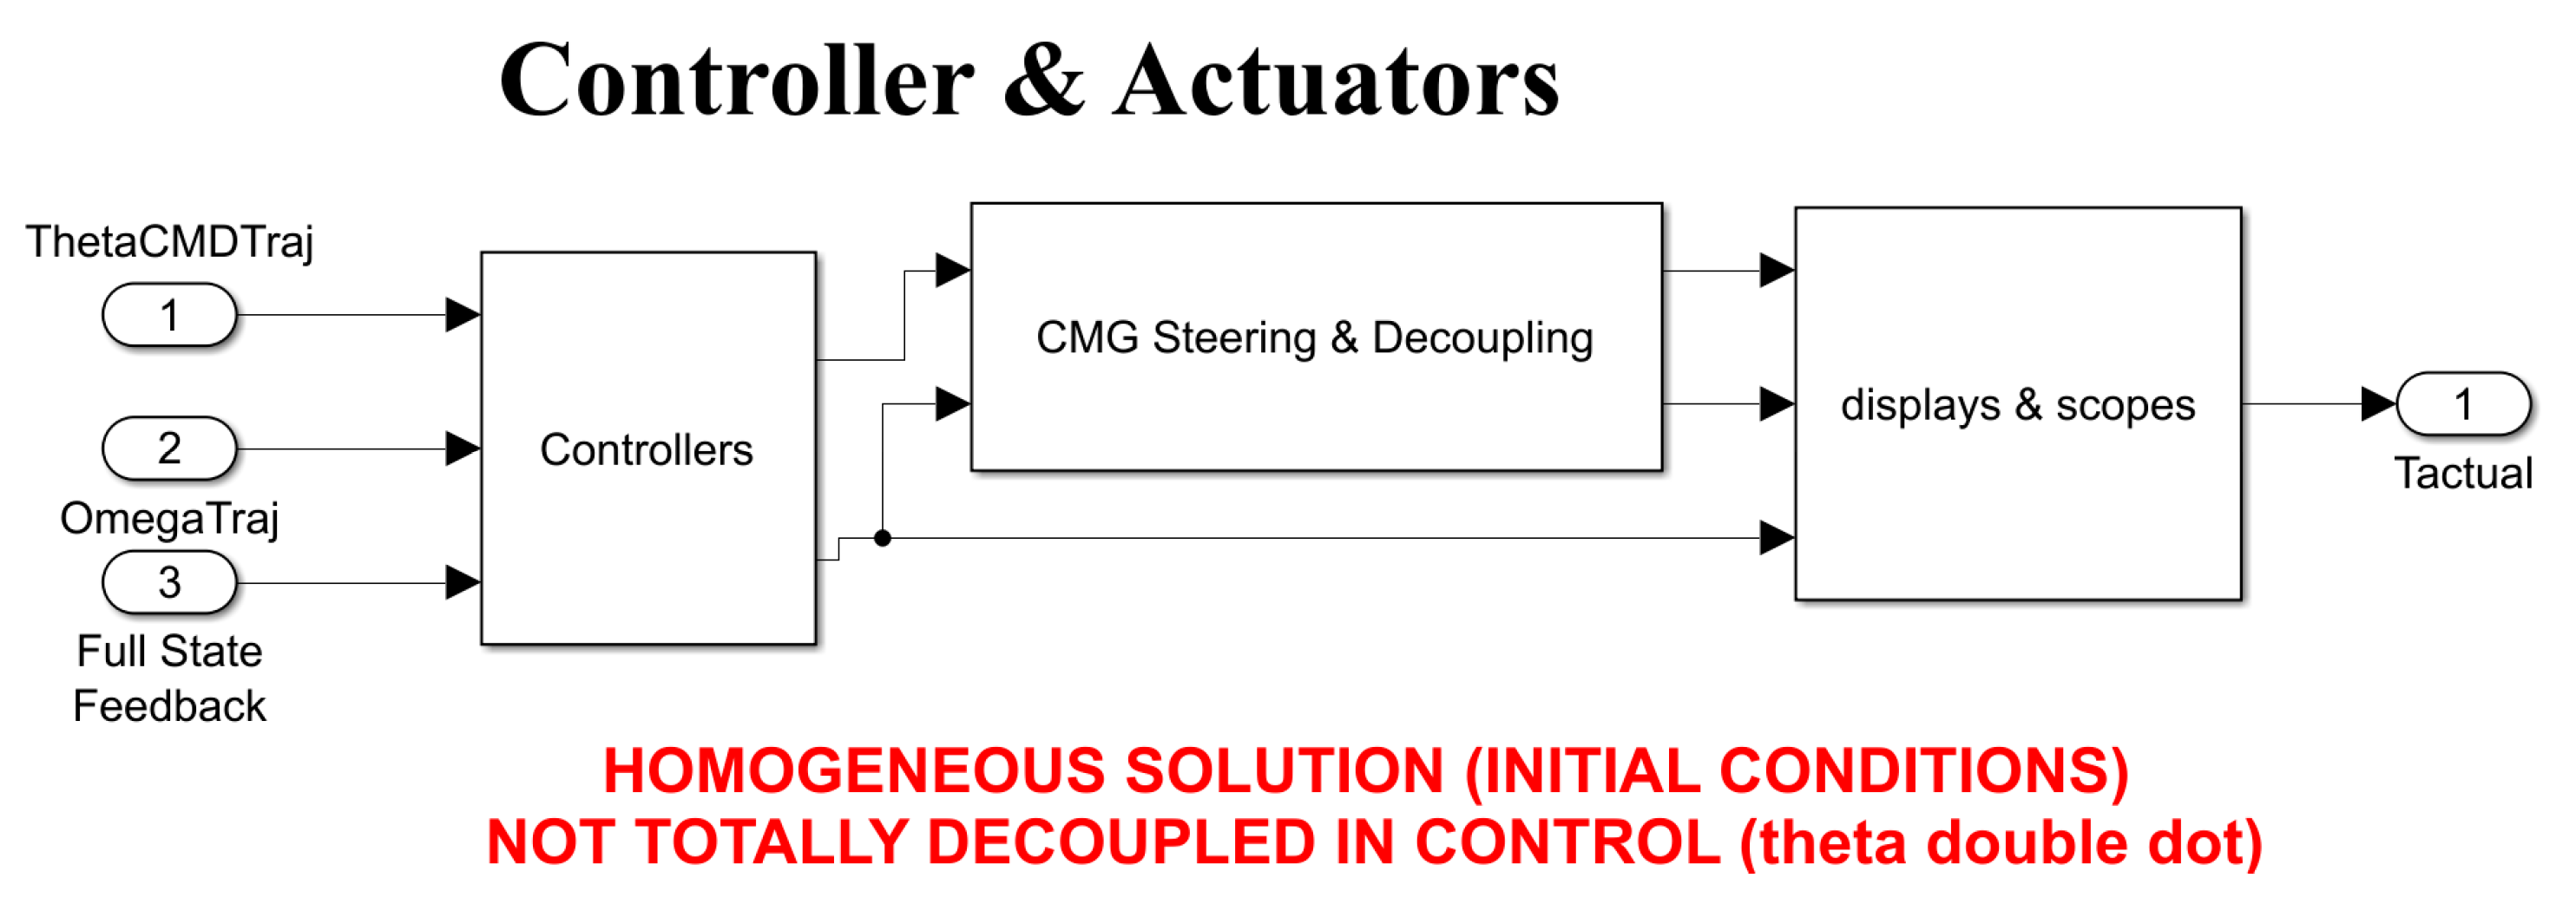
Figure A3. Actuators and controls subsystem.
Preprints 92685 g0a3
Figure A4. Sensors and observer’s subsystem.
Preprints 92685 g0a4
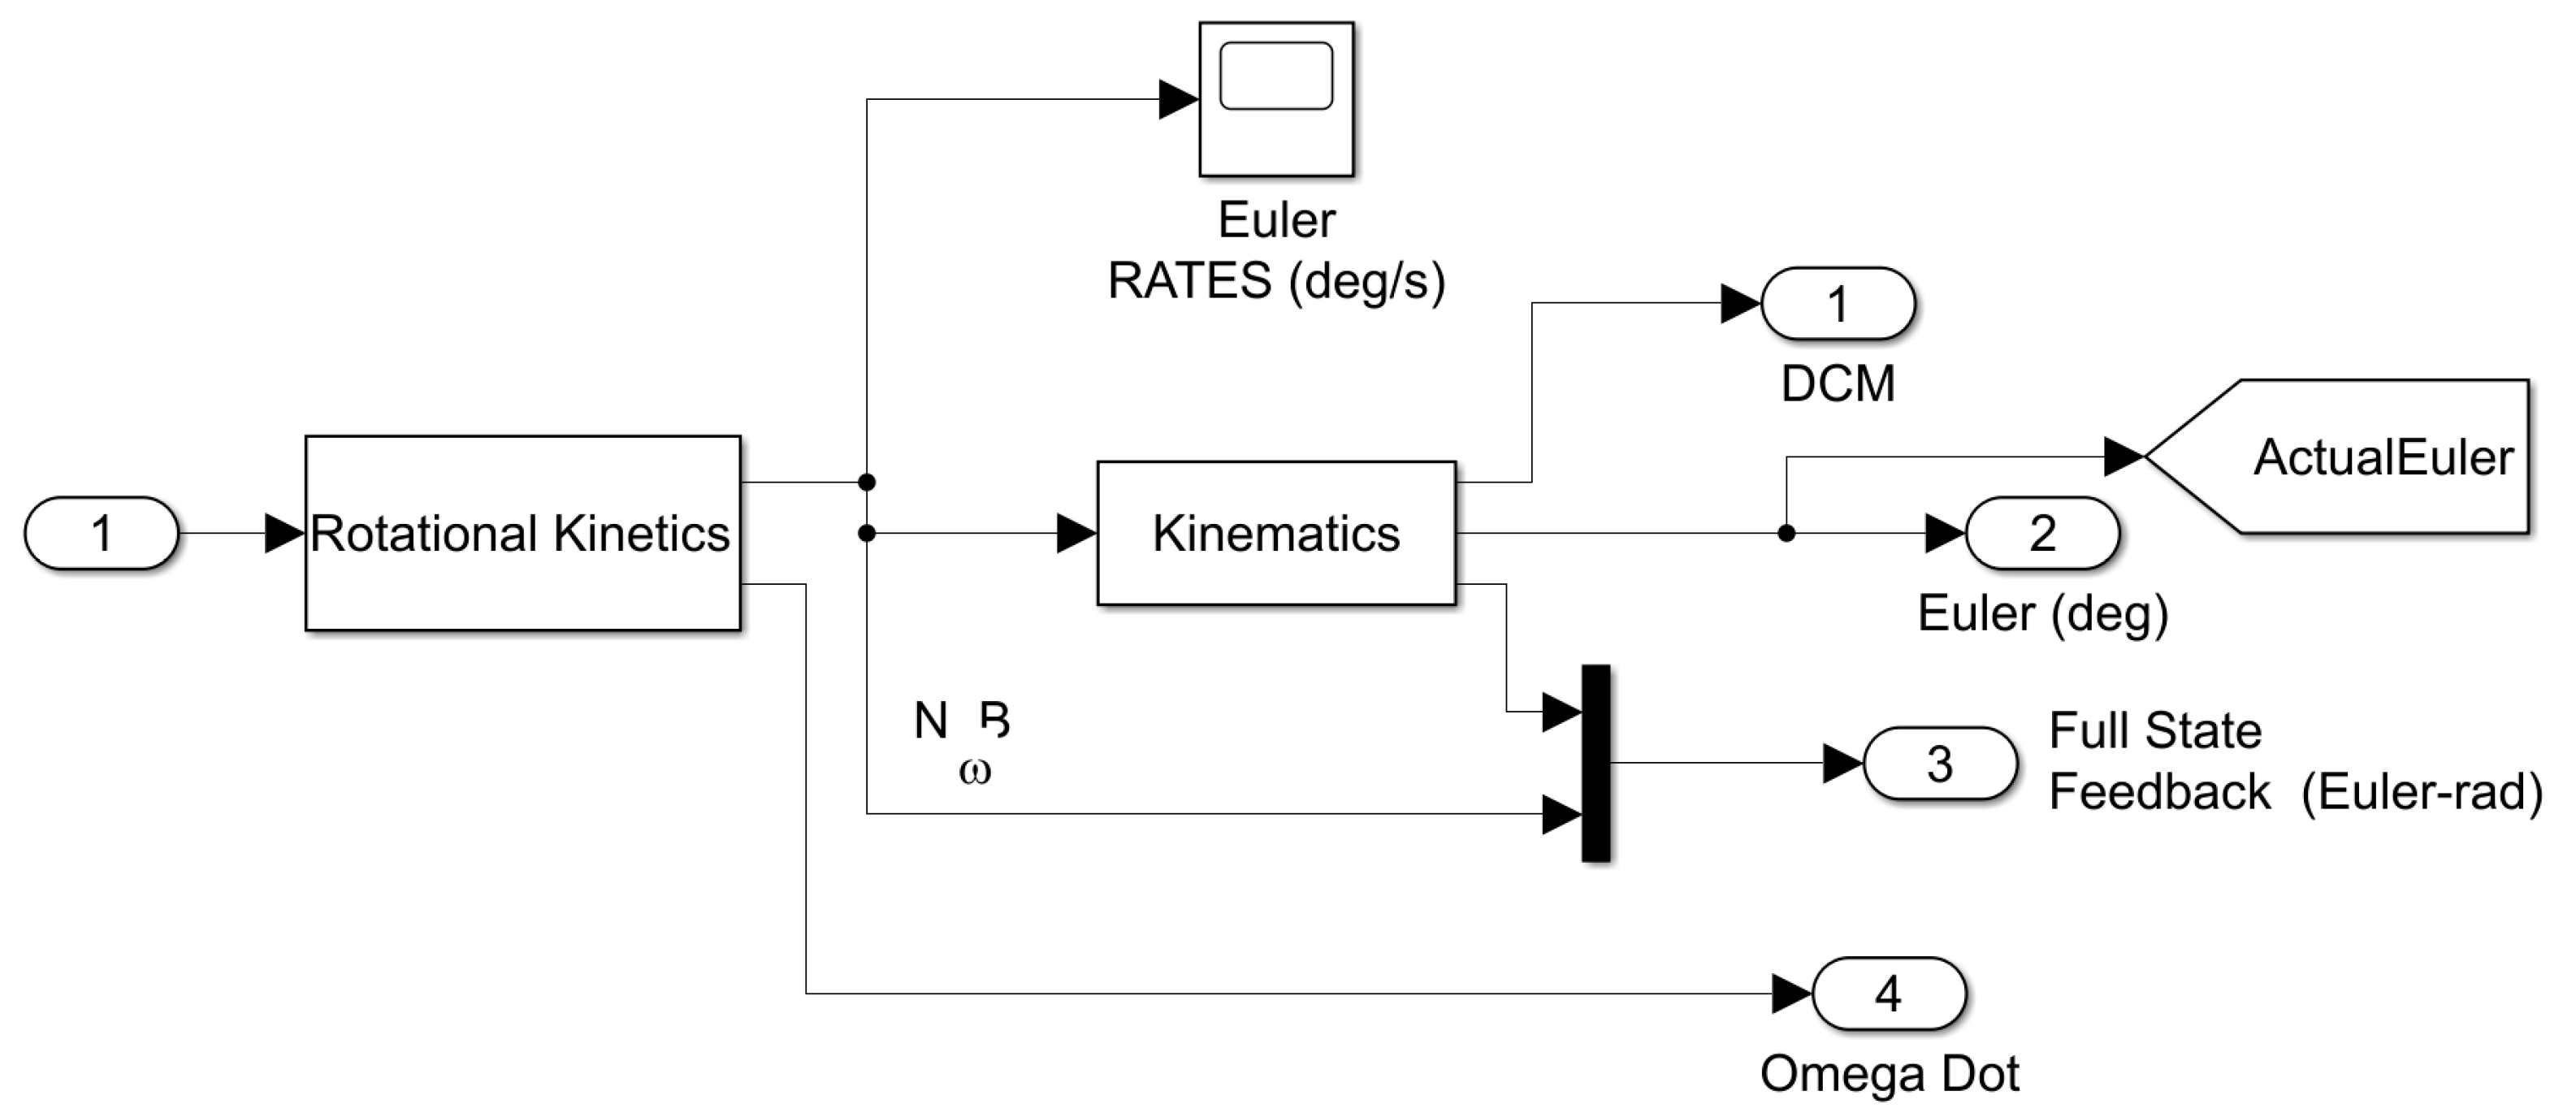
Figure A5. Dynamics Subsystem.
Preprints 92685 g0a5
Figure A6. Rotational Kinetics Subsystem.
Preprints 92685 g0a6
Figure A7. Kinematics Subsystem.
Preprints 92685 g0a7
Figure A8. Translational Kinetics Subsystem.
Preprints 92685 g0a8
Figure A9. Disturbances Summing Subsystem.
Preprints 92685 g0a9
Figure A10. Disturbances Subsystem.
Preprints 92685 g0a10
Figure A11. Magnetic Disturbances Subsystem.
Preprints 92685 g0a11
Figure A12. Orbit Parameters Subsystem.
Preprints 92685 g0a12
Figure A13. Solar and Aero Disturbances Subsystem.
Preprints 92685 g0a13
Figure A14. Orbit Parameters Subsystem.
Preprints 92685 g0a14

Appendix B Complete canonical scaling and Pontryagin’s principle

B.1. Canonical scaling

r ~ = r R ;   τ = t T U ; v ~ = v V ; m ~ = m M ; D ~ = D F U ; T ~ = T F U ; V = R T U ; T U = R g ; F U = M A ; A = R T U 2 ; a U = 1
x = r , θ , φ , v , γ , ψ T R ,   u = [ L γ , L ψ ] R Minimize J x · , u · , t f = t f Subject To   r ˙ = v sin γ θ ˙ = v cos γ sin ψ r cos φ φ ˙ = v cos γ cos ψ r v ˙ = D m μ sin γ r 2 + T m γ ˙ = L γ m v μ cos γ r 2 v + v r cos γ ψ ˙ = L ψ m v cos γ + v r cos γ sin ψ tan φ t 0 = 0 r 0 , θ 0 , φ 0 , v 0 , γ 0 , ψ 0 = ( 42164,0 , 0,0 , 0,0 ) r f = 6378 θ f , φ f = 36.6002 , 121.8947   d e g r e e s 10 L ~ γ 10 10 L ~ ψ 10 μ = 3.986004418 × 10 5   k m 3 s 2 m = 5000   k g T = 4000   l b f = 17793   N   k g m s 2 = 17.793   k g * k m s 2 k Q = 164,000 W k m · K ( T h e r m a n   C o n d u c t i v i t y   o f   T u n g s t e n )  
B.1.1. r
r ~ ˙ = d r R d t T U = d r 1 R d t 1 T U = T U R d r d t
r ~ ˙ = T U R v sin γ = T U R V v ~ sin γ = V T U R v ~ sin γ = R T U T U R v ~ sin γ
r ~ ˙ = v ~ sin γ   = > D i s t a n c e   U n i t T i m e   U n i t × u n i t l e s s
B.1.2. Θ
a U T U * θ ~ ˙ = θ ˙
θ ~ ˙ = v cos γ sin ψ r cos φ / a u T U = v ~ V cos γ sin ψ r ~ R cos φ / a u T U = v ~ R T U cos γ sin ψ r ~ R cos φ / a u T U
θ ~ ˙ = v ~ cos γ sin ψ r ~ T U cos φ /   a u T U
θ ~ ˙ = v ~ cos γ sin ψ r ~ cos φ       = > u n i t l e s s t i m e
B.1.3. φ
a U T U * φ ~ ˙ = φ ˙
φ ~ ˙ = v cos γ cos ψ r a u T U = v ~ V cos γ cos ψ r ~ R a u T U = v ~ R T U cos γ cos ψ r ~ R a u T U
φ ~ ˙ = v ~ cos γ cos ψ r ~                 = > u n i t l e s s t i m e
B.1.4. v
v ~ ˙ = d v V d t T U = d v 1 V d t 1 T U = T U V d v d t
v ~ ˙ = T U R T U D m μ sin γ r 2 + T m = T U R T U D ~ F U m ~ M μ sin γ ( r ~ R ) 2 + T ~ F U m ~ M = T U R T U D ~ M A m ~ M μ sin γ ( r ~ R ) 2 + T ~ M A m ~ M
v ~ ˙ = T U R T U D ~ M R T U 2 m ~ M μ sin γ ( r ~ R ) 2 + T ~ M R T U 2 m ~ M = T U 2 R D ~ R m ~ T U 2 μ sin γ ( r ~ R ) 2 + T ~ R m ~ T U 2
v ~ ˙ = D ~ m ~ μ sin γ T U 2 r ~ R 3 + T ~ m ~                   s e t   μ ~ = T U 2 R 3 μ
v ~ ˙ = D ~ m ~ μ ~ sin γ r ~ 2 + T ~ m ~             = > D i s t T i m e 2
B.1.5. γ
a U T U * γ ~ ˙ = γ ˙
γ ~ ˙ = L γ m v μ cos γ r 2 v + v r cos γ a u T U = L γ m ~ M v ~ V μ cos γ ( r ~ R ) 2 v ~ V + v ~ V r ~ R cos γ a u T U
γ ~ ˙ = L γ m ~ M v ~ R T U μ cos γ ( r ~ R ) 2 v ~ R T U + v ~ R T U r ~ R cos γ a u T U = L γ T U 2 m ~ v ~ R M μ cos γ T U 2 r ~ 2 v ~ R 3 + v ~ r ~ cos γ
γ ~ ˙ = L γ T U 2 m ~ v ~ R M μ ~ cos γ r ~ 2 v ~ + v ~ r ~ cos γ               s e t   L ~ = T U 2 R M L
γ ~ ˙ = L ~ γ m ~ v ~ μ ~ cos γ r ~ 2 v ~ + v ~ r ~ cos γ       = > u n i t l e s s t i m e
B.1.6. ψ
ψ ~ ˙ = L ψ m v cos γ + v r cos γ sin ψ tan φ a u T U = L ψ m ~ M v ~ V cos γ + v ~ V r ~ R cos γ sin ψ tan φ a u T U
ψ ~ ˙ = L ψ m ~ M v ~ R T U cos γ + v ~ R T U r ~ R cos γ sin ψ tan φ a u T U = L ψ T U 2 m ~ v ~ R M cos γ + v ~ r ~ cos γ sin ψ tan φ
ψ ~ ˙ = L ~ ψ m ~ v ~ cos γ + v ~ r ~ cos γ sin ψ tan φ             = > u n i t l e s s T i m e
B.1.7. Q
Q ˙ = k Q ρ v 3 k g . 5 m . 5 k g . 5 m 1.5 m 3 s 3 k m g 2 m 2 s 2 W m 2
Q ~ ˙ = Q ˙ Q U   a n d   s e t   K U = M . 5 R . 5 ,   D U = M R 3
Q ~ ˙ = T U Q U K U k ~ Q D U ρ ~ V v ~ 3 = T U Q U M . 5 R . 5 k ~ Q M . 5 R 1.5 ρ ~ R 3 T U 3 v ~ 3 = T U Q U M R 2 R 2 T U 3 k ~ Q ρ ~ v ~ 3
s e t   Q U = R 2 T U 2 M R 2 Q ~ ˙ = k ~ Q ρ ~ v ~ 3 m a s s t i m e 2

B.2. HAMVET

B.2.1. Hamiltonian construction

H ¯ x , λ , u = F x , u + λ T f x , u + ε T h ( x , u )
H ¯ x , λ , ε , u = 0 + λ r θ φ v γ ψ   since we need to have one costate for every state
H ¯ x , λ , ε , u = λ r v ~ sin γ + λ θ v ~ cos γ sin ψ r ~ cos φ + λ φ v ~ cos γ cos ψ r ~ + λ v D ~ m ~ μ ~ sin γ r 2 + T ~ m ~ + λ γ L ~ γ m ~ v ~ μ ~ cos γ r ~ 2 v ~ + v ~ r ~ cos γ + λ ψ L ~ ψ m ~ v ~ cos γ + v ~ r ~ cos γ sin ψ tan φ + ε 1 L ~ γ + ε 2 L ~ ψ +

B.2.2. Adjoint equations

λ   ̇ = ( H   ̅ ) / x
So ,
λ ˙ r = H ¯ r = λ θ v ~ cos γ sin ψ r ~ 2 cos φ λ φ v ~ cos γ cos ψ r ~ 2 + λ v 2 μ ~ sin γ r ~ 3 λ γ v ~ r ~ 2 cos γ 2 μ ~ cos γ v ~ r ~ 3 λ ψ v ~ r ~ 2 cos γ sin ψ tan φ
λ ˙ θ = 0     H ¯ θ
λ ˙ φ = H ¯ φ = λ θ v ~ cos γ sin ψ sin φ r ~ cos 2 φ + λ ψ v ~ cos γ sin ψ ( tan 2 φ + 1 ) r ~
λ ˙ v = H ¯ v = λ r sin γ + λ θ cos γ sin ψ r ~ cos φ + λ φ cos γ cos ψ r ~ + λ γ cos γ r ~ L ~ γ m ~ v ~ 2 + μ ~ cos γ v ~ 2 r ~ 2 λ ψ L ~ ψ m ~ v ~ 2 cos γ cos γ sin ψ tan φ r ~ + 3 ε 3 k ~ Q v ~ 2 ρ ~
λ ˙ γ = H ¯ γ = λ r v ~ cos γ λ θ v ~ sin γ sin ψ r ~ cos φ λ φ v ~ sin γ cos ψ r ~ λ γ v ~ sin γ r ~ μ ~ sin γ v ~ r ~ 2 λ v μ ~ cos γ r ~ 2 λ ψ v ~ r ~ sin γ sin ψ tan φ L ~ ψ sin γ m ~ v ~ cos 2 γ
λ ˙ ψ = H ¯ ψ = λ θ v ~ cos γ cos ψ r ~ cos φ λ φ v ~ cos γ sin ψ r ~ + λ ψ v ~ r ~ cos γ cos ψ tan φ

B.2.3. Minimizing the Hamiltonian with respect to u

H ¯ u = H ¯ L ~ γ = 0 = λ γ m ~ v ~ + ε 1
H ¯ u = H ¯ L ~ ψ = 0 = λ ψ m ~ v ~ cos γ + ε 2
ε 1 0     i f                               L ~ γ = 10 = 0   i f 10   L ~ γ 10   0   i f                                     L ~ γ = 10
ε 2 0     i f                               L ~ ψ = 10 = 0   i f 10   L ~ ψ 10   0   i f                                     L ~ ψ = 10
ε 3 0     i f                                           Q ˙ = 0 = 0   i f               0   Q ˙ 120   0   i f                                     Q ˙ = 120

B.2.4. Value condition 

H @ t f = E t f
H @ t f = H ( λ t f , x t f , ε t f , u t f , t f )
E = t f + ν 1 r f r f + ν 2 θ f θ f + ν 3 φ f φ f
E t f = 1
H ¯ t f = 1

B.2.5. Hamiltonian evolution condition 

H t = H t = 0

B.2.6. Transversality 

E = E x f + ν t e x f   w i t h   λ t f = E x f
E = t f + ν 1 r f r f + ν 2 θ f θ f + ν 3 φ f φ f
λ r ( t f ) = E r f = ν 1
λ θ ( t f ) = E θ f = ν 2
λ φ ( t f ) = E φ f = ν 3
λ v ( t f ) = E v = 0
λ γ ( t f ) = E γ f = 0
λ ψ ( t f ) = E ψ f = 0
So, the boundary value problem becomes:
r ~ ˙ = v ~ sin γ
θ ~ ˙ = v ~ cos γ sin ψ r ~ cos φ
φ ~ ˙ = v ~ cos γ cos ψ r ~
v ~ ˙ = D ~ m ~ μ ~ sin γ r 2 + T ~ m ~
γ ~ ˙ = L ~ γ m ~ v ~ μ ~ cos γ r ~ 2 v ~ + v ~ r ~ cos γ
ψ ~ ˙ = L ~ ψ m ~ v ~ cos γ + v ~ r ~ cos γ sin ψ tan φ
Q ~ ˙ = k ~ Q ρ ~ v ~ 3 120
λ ~ ˙ r = λ θ v ~ cos γ sin ψ r ~ 2 cos φ λ φ v ~ cos γ cos ψ r ~ 2 + λ v 2 μ ~ sin γ r ~ 3 λ γ v ~ r ~ 2 cos γ 2 μ ~ cos γ v ~ r ~ 3 λ ψ v ~ r ~ 2 cos γ sin ψ tan φ
λ ~ ˙ θ = 0  
λ ~ ˙ φ = λ θ v ~ cos γ sin ψ sin φ r ~ cos 2 φ + λ ψ v ~ cos γ sin ψ ( tan 2 φ + 1 ) r ~
λ ~ ˙ v = λ r sin γ + λ θ cos γ sin ψ r ~ cos φ + λ φ cos γ cos ψ r ~ + λ γ cos γ r ~ L ~ γ m ~ v ~ 2 + μ ~ cos γ v ~ 2 r ~ 2 λ ψ L ~ ψ m ~ v ~ 2 cos γ cos γ sin ψ tan φ r ~ + 3 ε 3 k ~ Q v ~ 2 ρ ~
λ ~ ˙ ψ = λ θ v ~ cos γ cos ψ r ~ cos φ λ φ v ~ cos γ sin ψ r ~ + λ ψ v ~ r ~ cos γ cos ψ tan φ
With Boundary Conditions:
r ~ 0 , θ ~ 0 , φ ~ 0 , v ~ 0 , γ ~ 0 , ψ ~ 0 = ( 6.61,0 , 0,0 , 0,0 )
r ~ f = 1
θ ~ f , φ ~ f = 36.6002 , 121.8947   d e g r e e s
λ ~ v ( t f ) = 0
λ ~ γ ( t f ) = 0
λ ~ ψ ( t f ) = 0
H ¯ t f = 1 = c o n s t a n t
With Complementarity Conditions:
ε 1 0     i f                           L ~ γ = 10 = 0   i f 10   L ~ γ 10   0   i f                                   L ~ γ = 10
ε 2 0     i f                           L ~ ψ = 10 = 0   i f 10   L ~ ψ 10   0   i f                                   L ~ ψ = 10
ε 3 0     i f                                       Q ˙ = 0 = 0   i f               0   Q ˙ 4.9   0   i f                                 Q ˙ = 4.9

Appendix C DIDO Program Code

C.1. Preamble file

function [rBar, thetaBar, phiBar, vBar, gammaBar, psiBar, LgammaBar, LpsiBar, tBar, ...
 
r0Bar, theta0Bar, phi0Bar, v0Bar, gamma0Bar, psi0Bar, t0Bar, ...
 
rfBar, thetafBar, phifBar, vfBar, gammafBar, psifBar, tfBar, ...
 
uBar, TBar, mBar, DBar, Cd, S, R, V, kq, FU, DU, KU] ...
 
= MS4Preamble(primal)
%=========================================================================
% Preamble for Missile Launched from Geostationary Orbit to Specific Target min time
%=========================================================================
%Scaled Values
rBar = primal.states(1,:); %States
thetaBar = primal.states(2,:);
phiBar = primal.states(3,:);
vBar = primal.states(4,:);
gammaBar = primal.states(5,:);
psiBar = primal.states(6,:);
 
LgammaBar = primal.controls(1,:); %Controls
LpsiBar = primal.controls(2,:);
 
tBar = primal.time; %Time
 
r0Bar = primal.initial.states(1); %Initial States
theta0Bar = primal.initial.states(2);
phi0Bar = primal.initial.states(3);
v0Bar = primal.initial.states(4);
gamma0Bar = primal.initial.states(5);
psi0Bar = primal.initial.states(6);
 
t0Bar = primal.initial.time; %Initial Time
 
rfBar = primal.final.states(1); %Final States
thetafBar = primal.final.states(2);
phifBar = primal.final.states(3);
vfBar = primal.final.states(4);
gammafBar = primal.final.states(5);
psifBar = primal.final.states(6);
 
tfBar = primal.final.time; %Final Time
 
uBar = primal.constants.uBar; %Constants
TBar = primal.constants.TBar;
mBar = primal.constants.mBar;
DBar = primal.constants.DBar;
g = primal.constants.g;
Cd = primal.constants.Cd;
S = primal.constants.S;
FU = primal.constants.FU;
R = primal.constants.R;
V = primal.constants.V;
TU = primal.constants.TU;
kq = primal.constants.kq;
DU = primal.constants.DU;
KU = primal.constants.KU;
 
%eof
C.1. Pz %Search Space for rBar
 
-pi, pi; %Search Space for thetaBar (Longitude)
 
-pi/2, pi/2; %Search Space for phiBar (Latitude)
 
0, 5; %Search Space for vBar
 
-pi, pi; %Search Space for gammaBar
 
-pi, pi]; %Search Space for psiBar
search.controls = [-11, 11; %Search Space for Lgamma
 
-11, 11]; %Search Space for Lpsi
%=========================================================================
%Defining Problem Specific Constants
%Unscaled Constants
mu = 3.986004418e5; %Earth Gravitational Parameter km/sec2
Thrust = 17.799; %4000lbf converted to kgkm/s^2
mass = 5000; %Initial Mass
 
MS4.constants.g = 0.00981; %Gravitational Constant of Earth in km/s^2
MS4.constants.Cd = 0.8; %Drag Coefficient
MS4.constants.S = 3.44e-6; %Drag Reference Area (km^2)
MS4.constants.kq = sqrt(1000)*9e-5; %kg^.5/km^.5
 
%Scaling Factors
MS4.constants.R = 6378; %Distance Scaling
MS4.constants.TU = sqrt(MS4.constants.R/MS4.constants.g);%Time Scaling
MS4.constants.AU = 1; %Angle Scaling => Radians remain unscaled
MS4.constants.V = MS4.constants.R/MS4.constants.TU; %Velocity Scaling
MS4.constants.M = 10; %Mass Scaling
MS4.constants.A = MS4.constants.R/(MS4.constants.TU^2);%Acceleration Scaling
MS4.constants.FU = MS4.constants.M*MS4.constants.A; %Force Scaling
MS4.constants.DU = MS4.constants.M/(MS4.constants.R^3); %Density Scaling
MS4.constants.KU = (MS4.constants.M^.5)/(MS4.constants.R^.5);
 
%Scaled Constants
MS4.constants.uBar = (MS4.constants.TU^2/(MS4.constants.R^3))*mu; %Scaled Earth Gravitational Parameter
%MS4.constants.TBar = Thrust/MS4.constants.FU; %Scaled Thrust
MS4.constants.TBar = Thrust;
MS4.constants.mBar = mass/MS4.constants.M; %Scaled Mass in kg
MS4.constants.DBar = 1.2344;
%=========================================================================
%Boundary Conditions
rInitial = 43378; %kilometers - Does not change
rFinal = 6378; %kilometers - Changes with tgt location
r0Bar = rInitial/MS4.constants.R; %Scale initial condition
rfBar = rFinal/MS4.constants.R; %Scale final condition
phi0Bar = deg2rad(0); %Latitude is unscaled in radians
theta0Bar = deg2rad(-90); %Longitude is unscaled in radians
v0Bar = 1/MS4.constants.V; %Initial velocity is near zero
gamma0Bar = deg2rad(-89); %Flight Path angle is unscaled in radians
psi0Bar = deg2rad(0); %Flight Path Azimuth is unscaled in radians
phifBar = deg2rad(36.6002); %Latitude of target to radians
thetafBar = deg2rad(-121.8947); %Longitude of target to radians
 
bounds.events = [r0Bar, r0Bar; %Radius of geosynchronous orbit
 
theta0Bar, theta0Bar;%Set initial latitude of orbit
 
phi0Bar, phi0Bar; %Set initial longitude of orbit
 
v0Bar, v0Bar; %v0 is 0
 
gamma0Bar, gamma0Bar;%Set initial flightpath angle
 
psi0Bar, psi0Bar; %Set initial flightpath azimuth
 
rfBar, rfBar; %Target radius
 
thetafBar, thetafBar;%Target latitude
 
phifBar, phifBar]; %Target longitude
%=========================================================================
%Initial and Final Time Constraints
bounds.initial.time = [0, 0]; %Clock starts at beginning
bounds.final.time = [0, 15]; %Guess on upper bound
%=========================================================================
%Path Constraints
bounds.path = [-10, 10; %Control Constraint, -10<=LBar<=10
 
-10, 10; %Control Constraint, -10<=LBar<=10
 
0, 4.9]; %Heating Rate Constraint
%=========================================================================
%Problem Definition
MS4.cost = 'MS4Cost';
MS4.dynamics = 'MS4Dynamics';
MS4.events = 'MS4Events';
MS4.path = 'MS4Path';
MS4.search = search;
MS4.bounds = bounds;
 
%=========================================================================
%DIDO Formulation check
 
check(MS4);
 
%=========================================================================
%Node selection
algorithm.nodes = 55;
 
%=========================================================================
%Run DIDO and time the program
tic
[cost, primal, dual] = dido(MS4, algorithm);
toc
 
%=========================================================================
%Output Analysis
 
[rBar, thetaBar, phiBar, vBar, gammaBar, psiBar, LgammaBar, LpsiBar, tBar, ...
 
r0Bar, theta0Bar, phi0Bar, v0Bar, gamma0Bar, psi0Bar, t0Bar, ...
 
rfBar, thetafBar, phifBar, vfBar, gammafBar, psifBar, tfBar, ...
 
uBar, TBar, mBar, DBar, Cd, S, R, V, kq, FU, DU, KU] ...
 
= MS4Preamble(primal);
 
 
MinTime = cost*MS4.constants.TU
 
lam_rBar = dual.dynamics(1,:);
lam_thetaBar = dual.dynamics(2,:);
lam_phiBar = dual.dynamics(3,:);
lam_vBar = dual.dynamics(4,:);
lam_gammaBar = dual.dynamics(5,:);
lam_psiBar = dual.dynamics(6,:);
 
eps1 = dual.path(1,:);
eps2 = dual.path(2,:);
eps3 = dual.path(3,:);
 
stat1 = lam_gammaBar./(mBar.*vBar);
stat2 = lam_psiBar./(mBar.*vBar.*cos(gammaBar));
%=========================================================================
%PLOTS
figure;
plot(tBar, [rBar; thetaBar; phiBar; vBar; gammaBar; psiBar]); grid on;
title('Scaled State Trajectories (2D View)','Interpreter','latex');
xlabel('Scaled Time (\tau)','FontSize',16);
ylabel('Scaled States $\mathbf{\tilde{x}}$','Interpreter','latex','FontSize',16);
legend('$\tilde{r}$','$\tilde{\theta}$','$\tilde{\phi}$','$\tilde{v}$','$\tilde{\gamma}$','$\tilde{\psi}$','Interpreter','latex','FontSize', 10);
 
figure;
plot(tBar, [LgammaBar; LpsiBar]); grid on;
title('Scaled Controls')
legend('$\tilde{L}_\gamma$','$\tilde{L}_\psi$','Interpreter','latex','FontSize',10)
xlabel('Scaled Time (\tau)','FontSize',16)
 
figure;
plot(tBar, [lam_rBar; lam_thetaBar; lam_phiBar; lam_vBar; lam_gammaBar; lam_psiBar]); grid on;
title('Scaled Co-State Trajectories','Interpreter','latex');
legend('$\tilde{\lambda_r}$','$\tilde{\lambda_\theta}$','$\tilde{\lambda_\phi}$','$\tilde{\lambda_v}$','$\tilde{\lambda_\gamma}$','$\tilde{\lambda_\psi}$','Interpreter','latex','FontSize', 10);
xlabel('Scaled Time (\tau)','FontSize',16);
 
figure;
plot(tBar, dual.Hamiltonian); grid on;
title('Scaled Hamiltonian');
xlabel('Scaled Time (\tau)','FontSize',16);
ylabel('Scaled Hamiltonian $\tilde{H}$','Interpreter','latex','FontSize',16);
 
figure;
plot3(thetaBar,phiBar,rBar); grid on;
title('Three Dimensional Flight Path of the Missile','Interpreter','latex');
xlabel('Latitude ${\theta}$','Interpreter','latex','FontSize',16);
ylabel('Longitude ${\phi}$','Interpreter','latex','FontSize',16);
zlabel('Radius from Center of the Earth ${r}$','Interpreter','latex','FontSize',10);
 
figure;
yyaxis left
plot(tBar, [eps1; eps2; eps3]); grid on;
title('Constraint Controls','Interpreter','latex');
xlabel('Scaled Time (\tau)','FontSize',16);
ylabel('${\epsilon}$','Interpreter','latex','FontSize',16);
yyaxis right
plot(tBar, [LgammaBar; LpsiBar]);
legend('${\epsilon_1}$','${\epsilon_2}$','${\epsilon_3}$','$\tilde{L}_\gamma$','$\tilde{L}_\psi$','Interpreter','latex','FontSize', 10);
ylabel('Controls');
 
figure;
plot(tBar, [eps1; eps2; stat1; stat2]); grid on;
title('Stationarity Condition Check','Interpreter','latex');
xlabel('Scaled Time (\tau)','FontSize',16);
legend('${\epsilon_1}$','${\epsilon_2}$','Stat_1','Stat_2','Interpreter','latex','FontSize',10);
%==========================================================================
%Unscale States, Co-States, Controls
r = rBar.*MS4.constants.R;
theta = thetaBar;
phi = phiBar;
v = MS4.constants.V.*vBar;
gamma = gammaBar;
psi = psiBar;
T = tBar.*MS4.constants.TU;
 
lam_r = (MS4.constants.TU/MS4.constants.R) .* lam_rBar;
lam_theta = (MS4.constants.TU/MS4.constants.AU) .* lam_thetaBar;
lam_phi = (MS4.constants.TU/MS4.constants.AU) .* lam_phiBar;
lam_v = (MS4.constants.TU/MS4.constants.V) .* lam_vBar;
lam_gamma = (MS4.constants.TU/MS4.constants.AU) .* lam_gammaBar;
lam_psi = (MS4.constants.TU/MS4.constants.AU) .* lam_psiBar;
 
Lgamma = LgammaBar./(MS4.constants.TU^2/(MS4.constants.R*MS4.constants.M));
Lpsi = LpsiBar./(MS4.constants.TU^2/(MS4.constants.R*MS4.constants.M));
 
% figure;
% plot(T, [(r.*.0003); v]); grid on;
% title('State Trajectories','Interpreter','latex');
% xlabel('Time ${t}$','Interpreter','latex','FontSize',16);
% ylabel('States $\mathbf{{x}}$','Interpreter','latex','Fontsize',16);
% legend('${r}$','${v}$','Interpreter','latex','FontSize',16);
 
figure;
plot(T, [r; v; theta; phi; gamma; psi]); grid on;
title('State Trajectories','Interpreter','latex');
xlabel('Time $(t)$','Interpreter','latex','FontSize',16);
ylabel('States $\mathbf{{x}}$','Interpreter','latex','FontSize',16);
legend('${r}$','${v}$','${\theta}$','${\phi}$','${\gamma}$','${\psi}$','Interpreter','latex','FontSize',10);
 
figure;
plot(T, [lam_r; lam_theta; lam_phi; lam_v; lam_gamma; lam_psi]); grid on;
title('Co-State Trajectories','Interpreter','latex');
xlabel('Time ${t}$','Interpreter','latex','FontSize',16);
ylabel('Co-States $\mathbf{{\lambda}}$','Interpreter','latex','FontSize',16);
legend('${\lambda_r}$','${\lambda_\theta}$','${\lambda_\phi}$','${\lambda_v}$','${\lambda_\gamma}$','${\lambda_\psi}$','Interpreter','latex','FontSize',10);
 
figure;
plot(T, [Lgamma; Lpsi]); grid on;
title('Controls');
legend('${L_\gamma}$','${L_\psi}$','Interpreter','latex','FontSize',10);
xlabel('Time ${t}$','Interpreter','latex','FontSize',10);
%==========================================================================
%Individual State Comparisons
figure;
yyaxis left
plot(T,r);
xlabel('Time (sec)'),ylabel('${r}$','Interpreter','latex');
yyaxis right
plot(T,lam_r);
ylabel('${\lambda_r}$','Interpreter','latex')
title('${r}$ vs ${\lambda_r}$','Interpreter','latex')
 
figure;
yyaxis left
plot(T,theta);
xlabel('Time (sec)'),ylabel('${\theta}$','Interpreter','latex');
yyaxis right
plot(T,lam_theta);
ylabel('${\lambda_\theta}$','Interpreter','latex')
title('${\theta}$ vs ${\lambda_\theta}$','Interpreter','latex')
 
figure;
yyaxis left
plot(T,phi);
xlabel('Time (sec)'),ylabel('${\phi}$','Interpreter','latex');
yyaxis right
plot(T,lam_phi);
ylabel('${\lambda_\phi}$','Interpreter','latex')
title('${\phi}$ vs ${\lambda_\phi}$','Interpreter','latex')
 
figure;
yyaxis left
plot(T,v);
xlabel('Time (sec)'),ylabel('${v}$','Interpreter','latex');
yyaxis right
plot(T,lam_v);
ylabel('${\lambda_r}$','Interpreter','latex')
title('${v}$ vs ${\lambda_v}$','Interpreter','latex')
 
figure;
yyaxis left
plot(T,gamma);
xlabel('Time (sec)'),ylabel('${\gamma}$','Interpreter','latex');
yyaxis right
plot(T,lam_gamma);
ylabel('${\lambda_\gamma}$','Interpreter','latex')
title('${\gamma}$ vs ${\lambda_\gamma}$','Interpreter','latex')
 
figure;
yyaxis left
plot(T,psi);
xlabel('Time (sec)'),ylabel('${\psi}$','Interpreter','latex');
yyaxis right
plot(T,lam_psi);
ylabel('${\lambda_\psi}$','Interpreter','latex')
title('${\psi}$ vs ${\lambda_\psi}$','Interpreter','latex')
 
% %==========================================================================
% Feasibility Check
t_vec = T(:);
[T_feas, X_feas] = ode45(@(t,y)stateDynamics(t,y,t_vec,[Lgamma; Lpsi]),[t_vec(1) t_vec(end)],[r(1);theta(1);phi(1);v(1);gamma(1);psi(1)]);
r_feas = X_feas(:,1);
theta_feas = X_feas(:,2);
phi_feas = X_feas(:,3);
v_feas = X_feas(:,4);
gam_feas = X_feas(:,5);
psi_feas = X_feas(:,6);
 
figure;
hLines = plot(T_feas,(r_feas./1e4),'.-',T_feas,theta_feas,'.-',T_feas,phi_feas,'.-',T_feas,v_feas,'.-',T_feas,gam_feas,'.-',T_feas,psi_feas,'.-'); hold on; grid on;
hMarkers4 = plot(t_vec,[r./1e4; theta; phi; v; gamma; psi],'o');
set(hLines,'MarkerSize',12);
set(hMarkers4,'LineWidth',1);
title('Control-Propagated States','Interpreter','latex');
xlabel('Time ${t}$','Interpreter','latex','FontSize',16);
ylabel('States $\mathbf{{x}}$','Interpreter','latex','FontSize',16);
legend('${r}$','${\theta}$','${\phi}$','${v}$','${\gamma}$','Interpreter','latex');
 
 
%==========================================================================
%% FEASIBILITY CHECK FUNCTION
function dXdt = stateDynamics(t,X,tData,uData,MS4)
 
Lg_t = interp1(tData,uData(1,:),t,'pchip');
 
Lp_t = interp1(tData,uData(2,:),t,'pchip');


r = X(1);
 
theta = X(2);
 
phi = X(3);
 
v = X(4);
 
gamma = X(5);
 
psi = X(6);


drdt = v .* sin(gamma);
 
dtdt = (v.*cos(gamma).*sin(psi))./(r.*cos(phi));
 
dpdt = (v.*cos(gamma).*cos(psi))./r;
 
dvdt = -(.1211/5000)-((3.986004418e5.*sin(gamma))./(r.^2))+(1.7461/5000);
 
dgdt = (Lg_t./(5000.*v))-((3.9860044815e5.*cos(gamma))./((r.^2).*v))+((v./r).*cos(gamma));
 
didt = (Lp_t./(5000.*v.*cos(gamma)))+((v./r).*cos(gamma).*sin(psi).*tan(phi));


dXdt = [drdt; dtdt; dpdt; dvdt; dgdt; didt];
end
C.1. Dynamics file
All appendix sections must be cited in the main text. In the appendices, Figures, Tables, etc. should be labeled starting with “A”—e.g., Figure A1, Figure A2, etc.
function dxdtBar = MS4Dynamics(primal)
%Missile from Geosynchronous Orbit to target on Earth in minimum time
 
%=========================================================================
 
[rBar, thetaBar, phiBar, vBar, gammaBar, psiBar, LgammaBar, LpsiBar, tBar, ...
 
r0Bar, theta0Bar, phi0Bar, v0Bar, gamma0Bar, psi0Bar, t0Bar, ...
 
rfBar, thetafBar, phifBar, vfBar, gammafBar, psifBar, tfBar, ...
 
uBar, TBar, mBar, DBar, Cd, S, R, V, kq, FU, DU, KU] ...
 
= MS4Preamble(primal);
 
 
%Equations of Motion
 
rdotBar = vBar.*sin(gammaBar);
thetadotBar = (vBar.*cos(gammaBar).*sin(psiBar))./(rBar.*cos(phiBar));
phidotBar = (vBar.*cos(gammaBar).*cos(psiBar))./rBar;
[T, a, P, rho] = atmosisa((rBar.*R.*1000)-(R*1000));%Unscale altitude and change to meters
rhoBar = rho./DU; %Scale Density by Density Unit Scale Factor
SBar = S/(R^2); %Scale ReferenceArea
Dscale = .5.*rhoBar.*vBar.^2*Cd*SBar; %Scaled Drag
vdotBar = -(DBar/mBar)-((uBar.*sin(gammaBar))./(rBar.^2))+(TBar./mBar);
gammadotBar = (LgammaBar./(mBar.*vBar))-((uBar*cos(gammaBar))./(rBar.^2.*vBar))+((vBar./rBar).*cos(gammaBar));
psidotBar = (LpsiBar./(mBar.*vBar.*cos(gammaBar)))+((vBar./rBar).*cos(gammaBar).*sin(psiBar).*tan(phiBar));
 
 
dxdtBar = [rdotBar;
 
thetadotBar;
 
phidotBar;
 
vdotBar;
 
gammadotBar;
 
psidotBar];
 
 
%eof
C.1. Cost file
function [EndpointCost, RunningCost] = MS4Cost(primal)
%Missile from Geosynchronous Orbit to target on Earth in minimum time
%=========================================================================
[rBar, thetaBar, phiBar, vBar, gammaBar, psiBar, LgammaBar, LpsiBar, tBar, ...
 
r0Bar, theta0Bar, phi0Bar, v0Bar, gamma0Bar, psi0Bar, t0Bar, ...
 
rfBar, thetafBar, phifBar, vfBar, gammafBar, psifBar, tfBar, ...
 
uBar, TBar, mBar, DBar, Cd, S, R, V, kq, FU, DU, KU] ...
 
= MS4Preamble(primal);
EndpointCost = tfBar;
RunningCost = 0;
%eof
C.1. Events file
function endpointFunction = MS4Events(primal)
%Missile from Geosynchronous Orbit to target on Earth in minimum time
%Endpoint File
%=========================================================================
 
[rBar, thetaBar, phiBar, vBar, gammaBar, psiBar, LgammaBar, LpsiBar, tBar, ...
 
r0Bar, theta0Bar, phi0Bar, v0Bar, gamma0Bar, psi0Bar, t0Bar, ...
 
rfBar, thetafBar, phifBar, vfBar, gammafBar, psifBar, tfBar, ...
 
uBar, TBar, mBar, Cd, S, R, V, kq, FU, DU, KU] ...
 
= MS4Preamble(primal);
 
 
endpointFunction = zeros(9,1);
 
%Beginnning Enpoints
endpointFunction(1) = r0Bar;
endpointFunction(2) = theta0Bar;
endpointFunction(3) = phi0Bar;
endpointFunction(4) = v0Bar;
endpointFunction(5) = gamma0Bar;
endpointFunction(6) = psi0Bar;
 
%Final Endpoints
endpointFunction(7) = rfBar;
endpointFunction(8) = thetafBar;
endpointFunction(9) = phifBar;
C.1. Path file
function H = MS4Path(primal)
%Missile from Geosynchronous Orbit to target on Earth in minimum time
%-----------------------------------------
% Call preamble and load primal variables:
%-----------------------------------------
[rBar, thetaBar, phiBar, vBar, gammaBar, psiBar, LgammaBar, LpsiBar, tBar, ...
 
r0Bar, theta0Bar, phi0Bar, v0Bar, gamma0Bar, psi0Bar, t0Bar, ...
 
rfBar, thetafBar, phifBar, vfBar, gammafBar, psifBar, tfBar, ...
 
uBar, TBar, mBar, DBar, Cd, S, R, V, kq, FU, DU, KU] ...
 
= MS4Preamble(primal);
%=======================================================
% path constraint function:
H(1,:) = LgammaBar;
H(2,:) = LpsiBar;
 
h = (rBar.*R.*1000);
rho0 = 1.225; %Sea level density in kg/m^3
Hs = 7500; %Height scale
rp = R*1000;
rho = rho0*exp(-(h-rp)/Hs);
vd = vBar.*V.*1000;
qdot = kq.*sqrt(rho).*(vd.^3);
H(3,:) = qdot/1e9; %Scale in Engineering Units
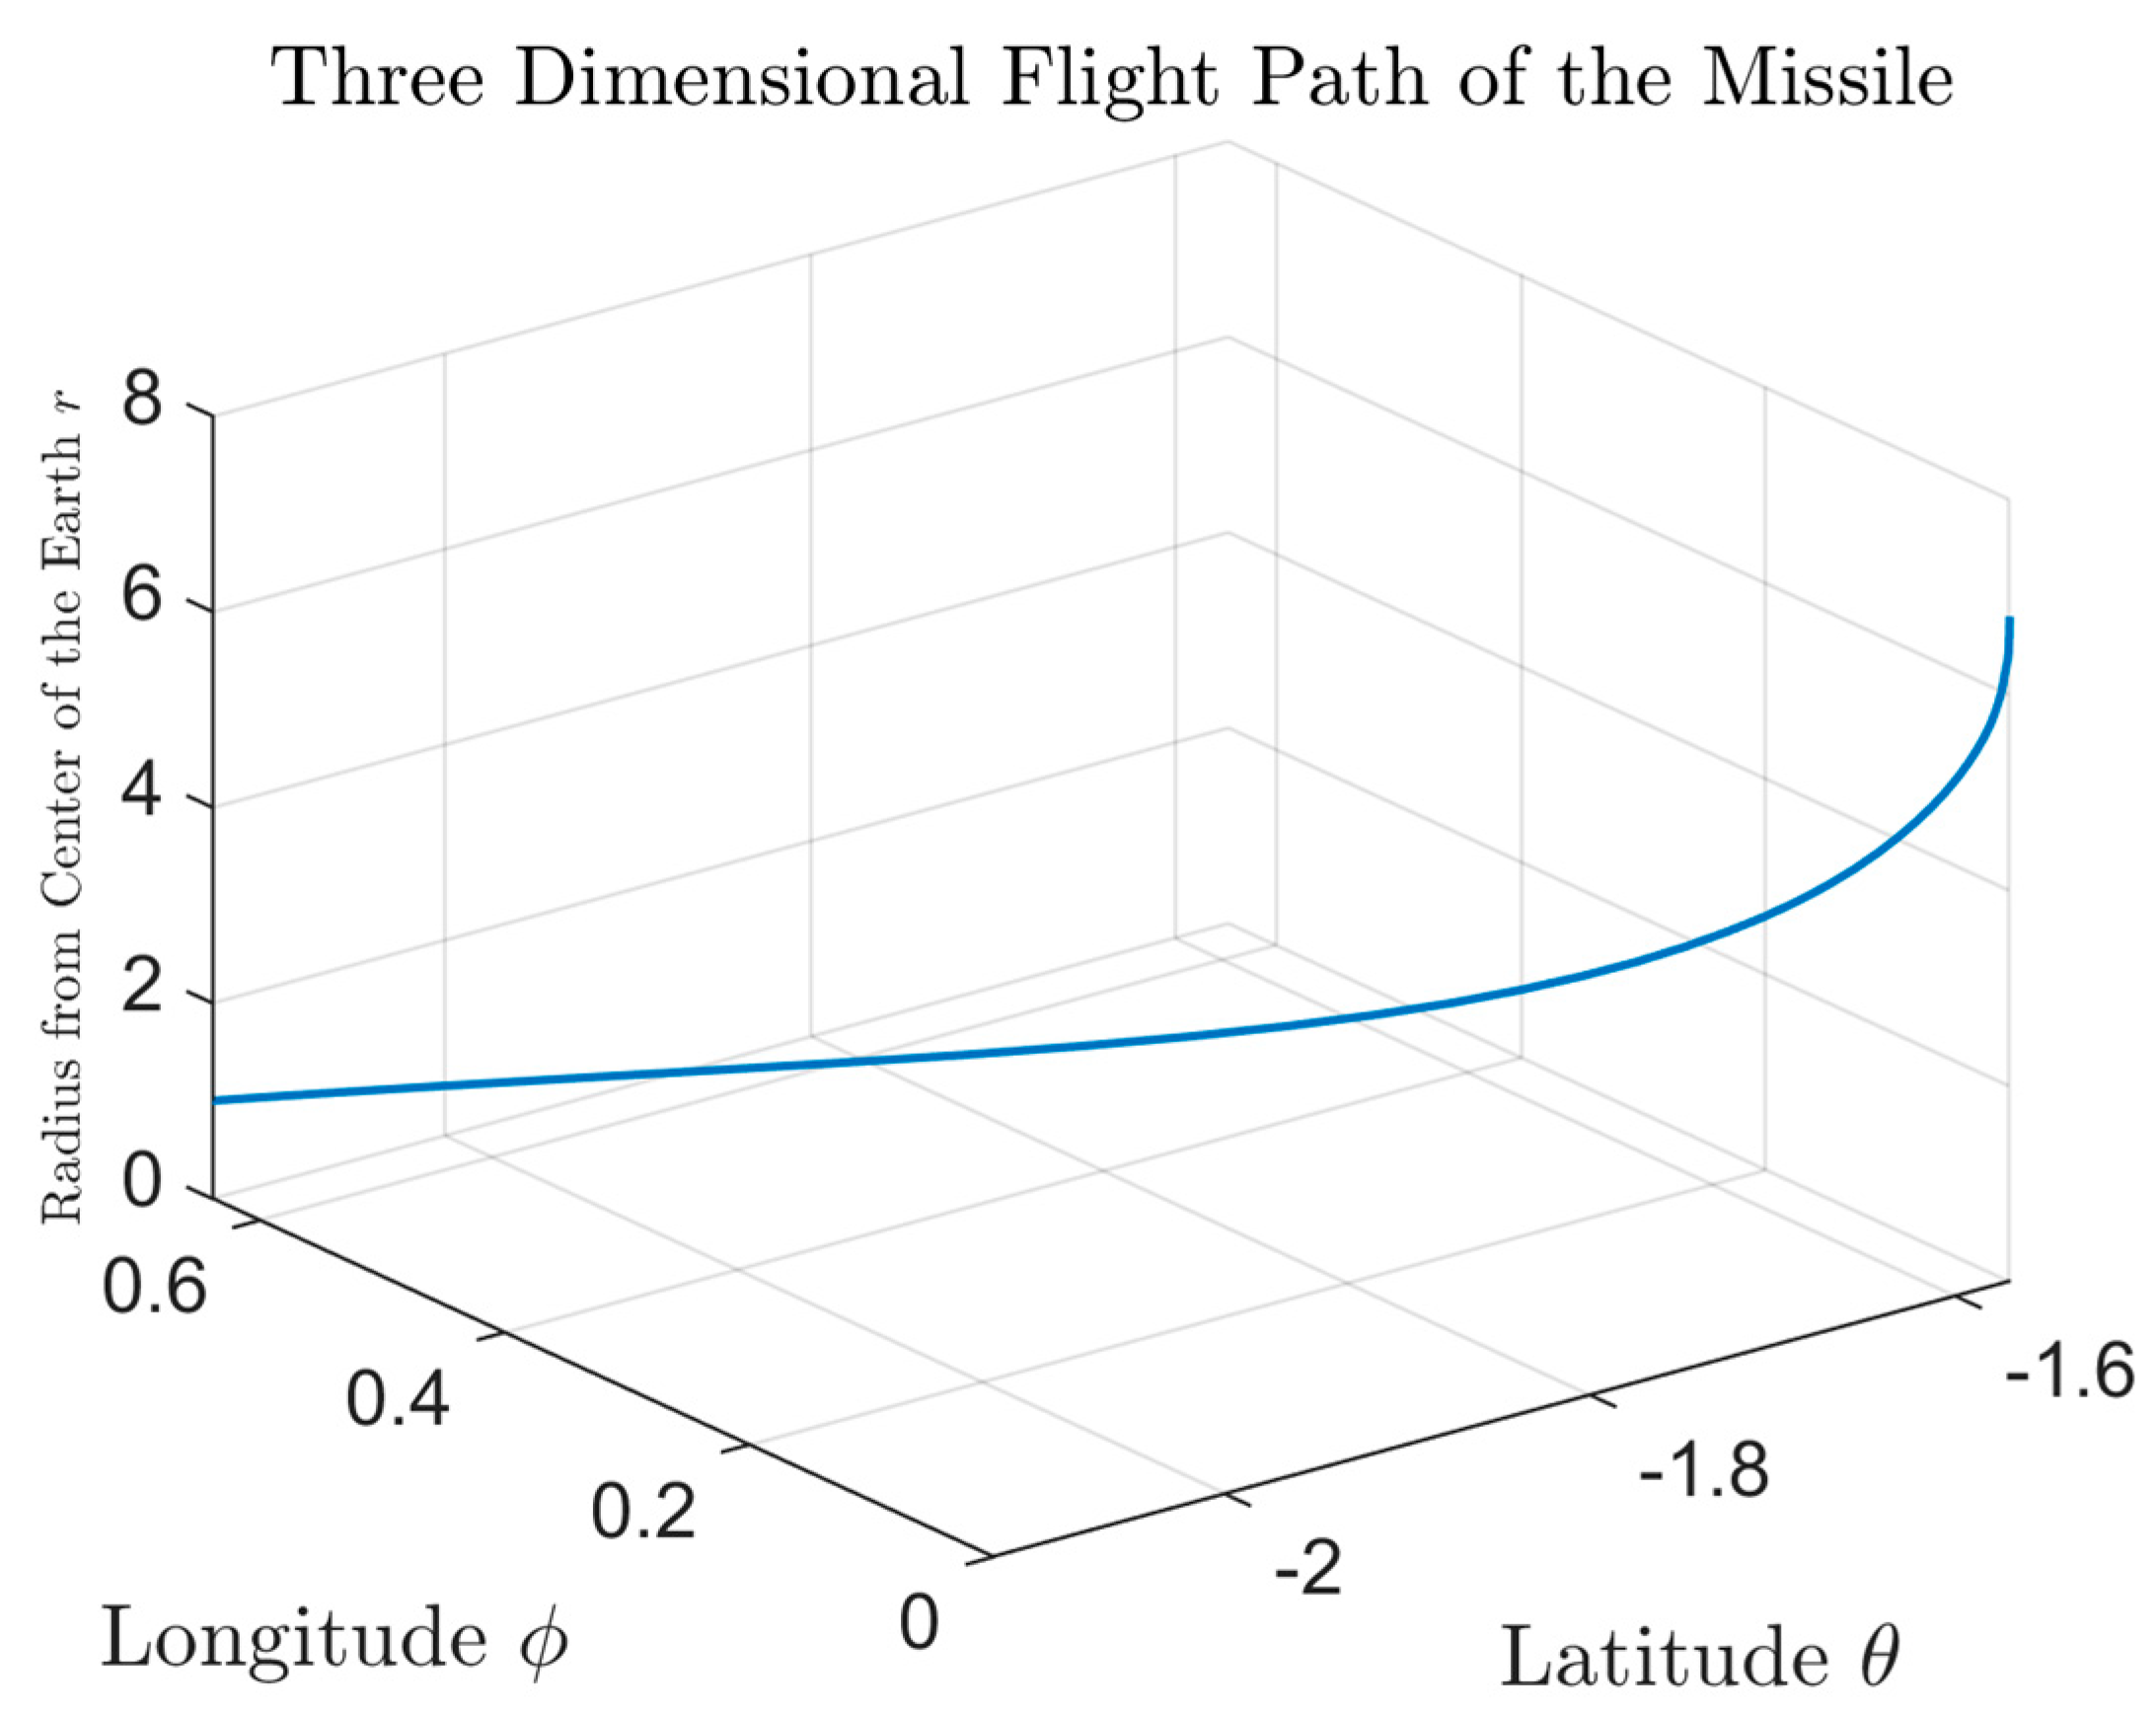
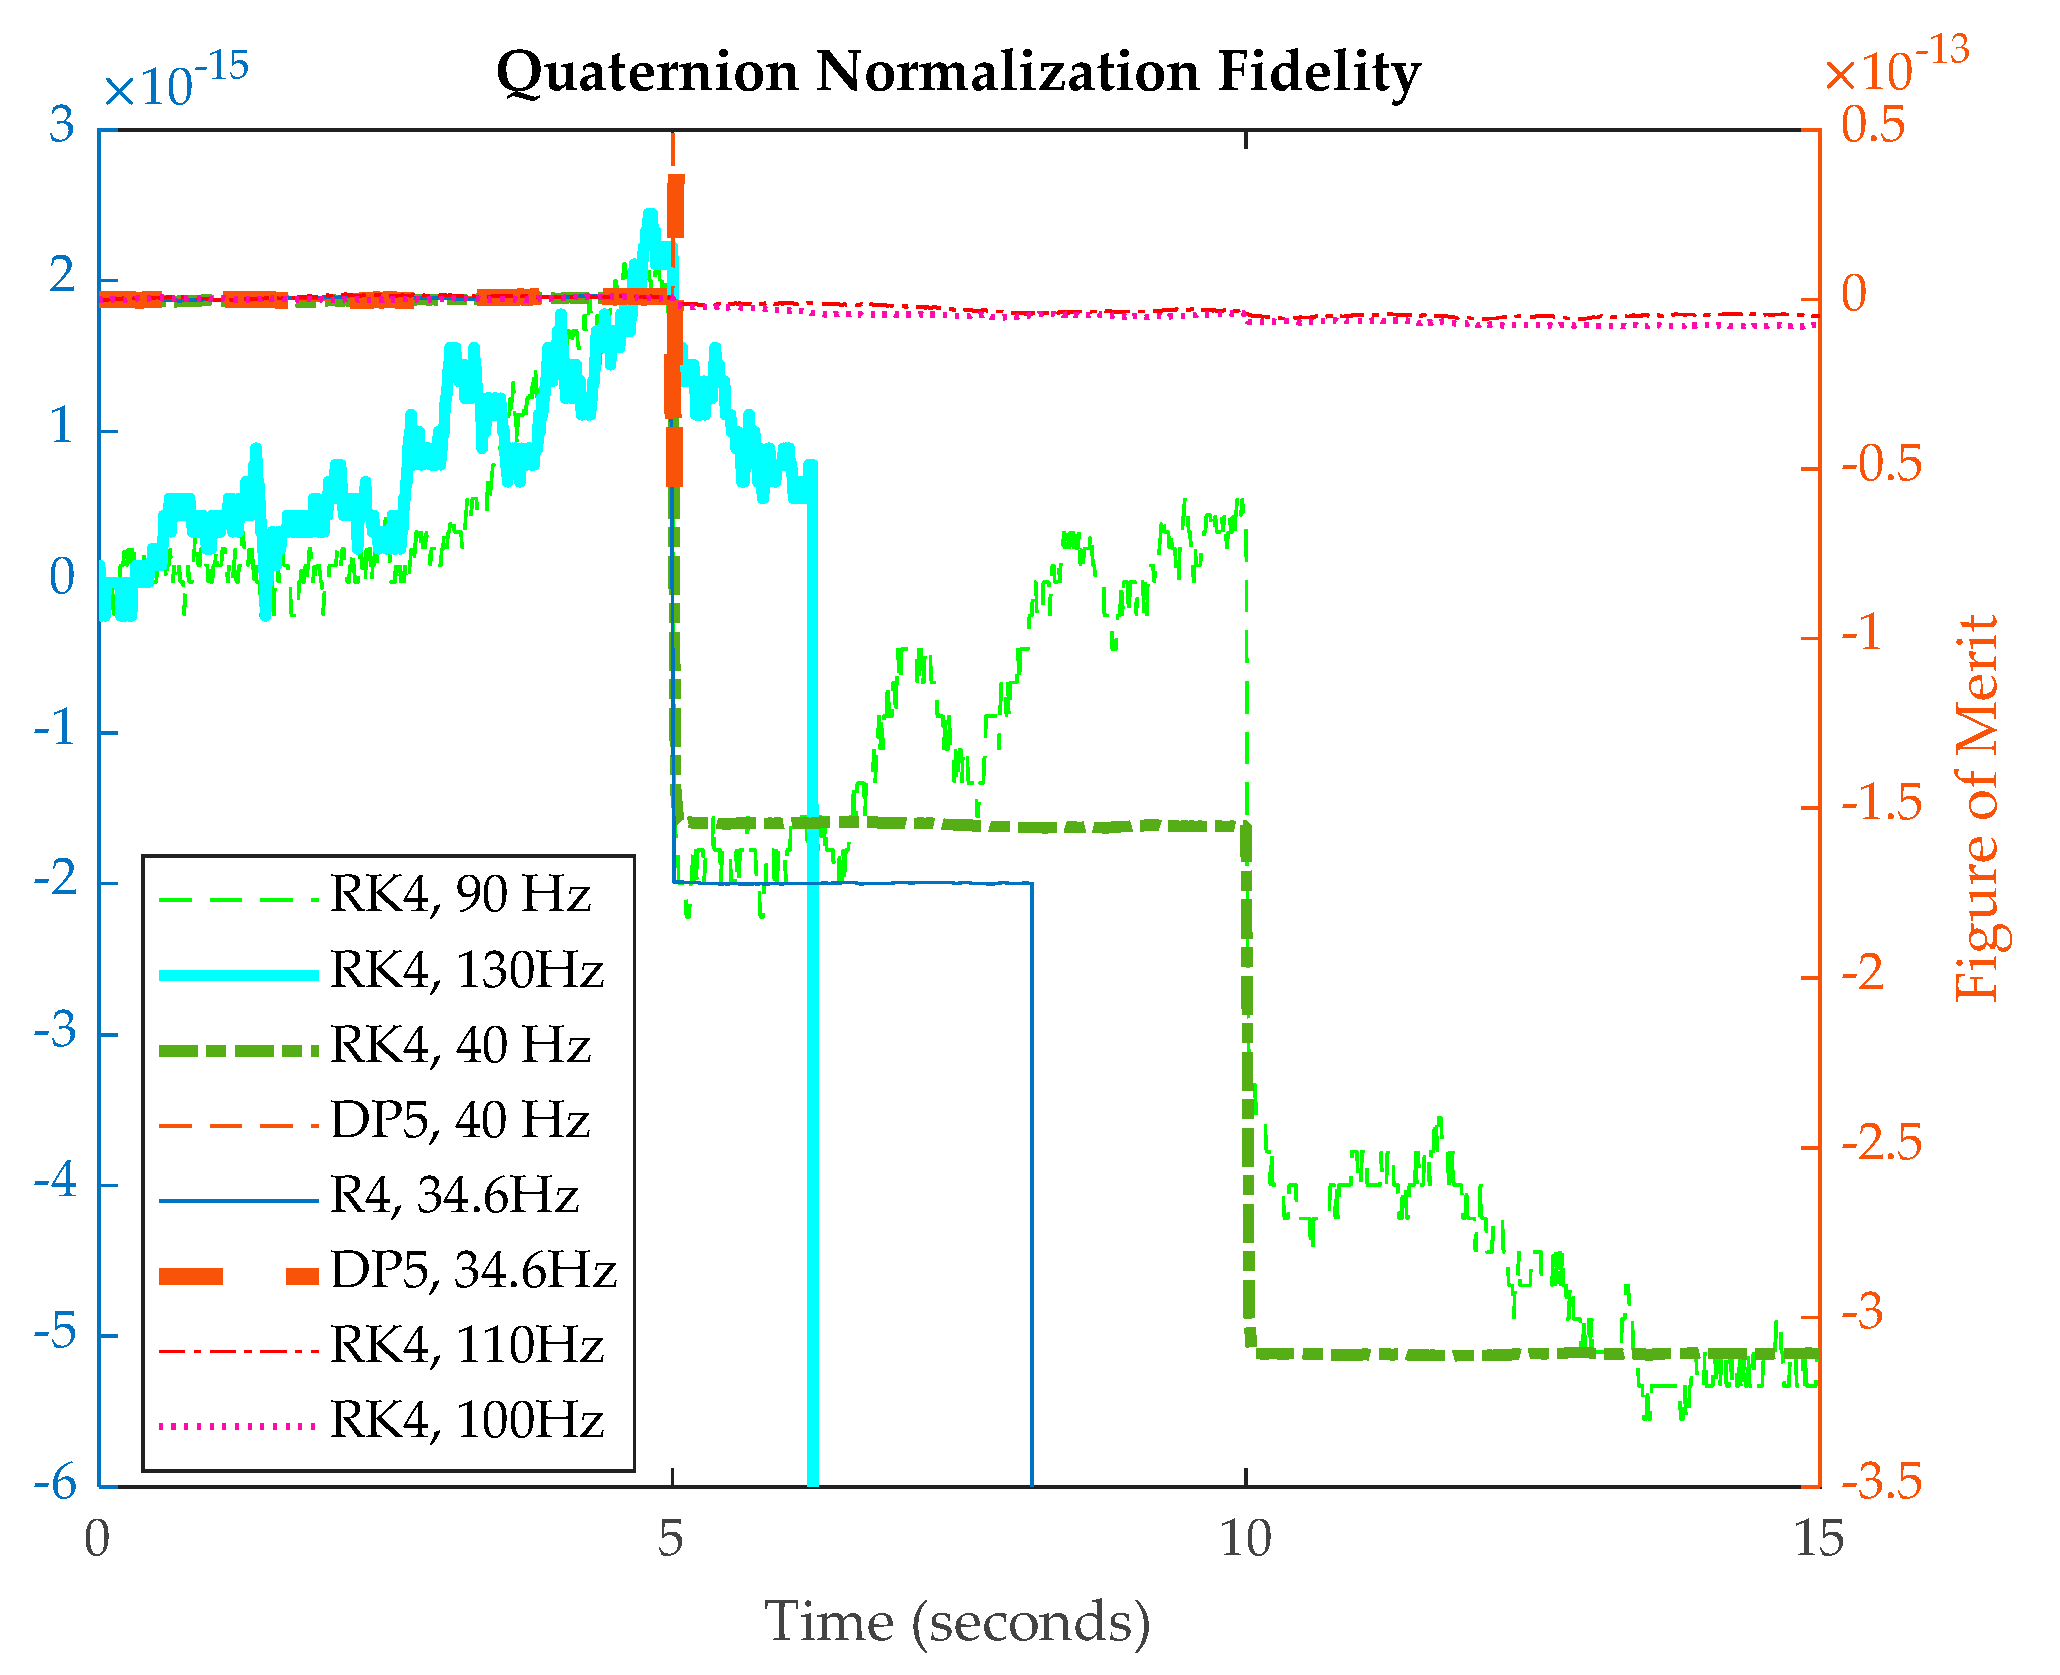
References

  1. Beauchamp, P. Guidance, Navigation, and Control Technology Assessment – Onboard and Ground Navigation and Mission Design. Available online: https://science.nasa.gov/resource/guidance-navigation-and-control-technology-assessment-onboard-and-ground-navigation-and-mission-des/ (accessed 30 November 30, 2023).
  2. Shuttle Reentry Streak from Orbit. Available online: https://apod.nasa.gov/apod/ap110801.html (accessed 30 November 2023).
  3. NASA Image Use Policy For educational or informational purposes. Available online: https://www.nasa.gov/nasa-brand-center/images-and-media/ (accessed 30 November 30, 2023).
  4. Euler, L. (Euler) Formulae Generales pro Translatione Quacunque Corporum Rigidorum (General Formulas for the Translation of Arbitrary Rigid Bodies), Presented to the St. Petersburg Academy on 9 October 1775. and First Published in Novi Commentarii Academiae Scientiarum Petropolitanae 1776, 20, pp. 189–207 (E478) and was reprinted in Theoria motus corporum rigidorum, ed. nova, 1790, pp. 449–460 (E478a) and later in his collected works Opera Omnia, Series 2, Volume 9, pp. 84–98. Available online: https://math.dartmouth.edu/~euler/docs/originals/E478.pdf (accessed on 24 October 2021).
  5. Thompson, W.; Tait, P.G. Elements of Natural Philosophy; Cambridge University Press: Cambridge, UK, 1872.
  6. Reuleaux, F.; Kennedy Alex, B.W. The Kinematics of Machinery: Outlines of a Theory of Machines; Macmillan: London, UK, 1876; Available online: https://archive.org/details/kinematicsofmach00reuluoft (accessed on 24 October 2021).
  7. Wright, T.W. Elements of Mechanics Including Kinematics, Kinetics and Statics; D. Van Nostrand Company: New York, NY, USA; Harvard University: Cambridge, MA, USA, 1896.
  8. Merz, J.T. A History of European Thought in the Nineteenth Century; Blackwood: London, UK, 1903; p. 5. [CrossRef]
  9. Whittaker, E.T. A Treatise on the Analytical Dynamics of Particles and Rigid Bodies; Cambridge University Press: Cambridge, UK, 1904.
  10. Whittaker, E.T. A Treatise on the Analytical Dynamics of Particles and Rigid Bodies; Cambridge University Press: Cambridge, UK, 1917.
  11. Whittaker, E.T. A Treatise on the Analytical Dynamics of Particles and Rigid Bodies; Cambridge University Press: Cambridge, UK, 1927.
  12. Whittaker, E.T. A Treatise on the Analytical Dynamics of Particles and Rigid Bodies; Cambridge University Press: Cambridge, UK, 1937.
  13. Church, I.P. Mechanics of Engineering; Wiley: New York, NY, USA, 1908; p. 111. [Google Scholar].
  14. Wright, T.W. Elements of Mechanics Including Kinematics, Kinetics, and Statics, with Applications; Nostrand: New York, NY, USA, 1909.
  15. Study, E. ; Delphenich, D.H., Translator; Foundations and goals of analytical kinematics. Sitzber. d. Berl. Math. Ges. 1913, 13, 36–60. Available online: http://neo-classical-physics.info/uploads/3/4/3/6/34363841/study-analytical_kinematics.pdf (accessed on 14 April 2017).
  16. Gray, A. A Treatise on Gyrostatics and Rotational Motion; MacMillan: London, UK, 1918; ISBN 978-1-4212-5592-7. (Published 2007).
  17. Truesdell C. The present status of the controversy regarding the bulk viscosity of fluids. Proc. R. Soc. 1954, 226(1164). http://doi.org/10.1098/rspa.1954.0237.
  18. Fox, G. Methods for Constructing Invariant Amplitudes Free from Kinematic Singularities and Zeros. Phys. Rev. 1967, 157, 1493. [CrossRef]
  19. Rose, M.E. Elementary Theory of Angular Momentum; John Wiley & Sons: New York, NY, USA, 1957; ISBN 978-0-486-68480-2. (Published 1995).
  20. Kane, T.R. Analytical Elements of Mechanics Volume 1; Academic Press: New York, NY, USA; London, UK, 1959. [CrossRef]
  21. Kane, T.R. Analytical Elements of Mechanics Volume 2 Dynamics; Academic Press: New York, NY, USA; London, UK, 1961.
  22. Fang, A.C.; Zimmerman, B.G. Digital Simulation of Rotational Kinematics; NASA Technical Report NASA TN D-5302; NASA: Washington, DC, USA, October 1969. Available online: https://ntrs.nasa.gov/archive/nasa/casi.ntrs.nasa.gov/19690029793.pdf (accessed on 24 October 2021).
  23. Henderson, D.M. Euler Angles, Quaternions, and Transformation Matrices—Working Relationships; As NASA Technical Report NASA-TM-74839; July 1977. Available online: https://ntrs.nasa.gov/archive/nasa/casi.ntrs.nasa.gov/19770024290.pdf (accessed on 24 October 2021).
  24. Henderson, D.M. Euler Angles, Quaternions, and Transformation Matrices for Space Shuttle Analysis; Houston Astronautics Division as NASA Design Note 1.4-8-020; 9 June 1977. Available online: https://ntrs.nasa.gov/archive/nasa/casi.ntrs.nasa.gov/19770019231.pdf (accessed on 24 October 2021).
  25. Hughes, P.C. Spacecraft Attitude Dynamics; J. Wiley: Hobken, NJ, USA, 1986; Chapter 1.
  26. Shuster, M.D. A Survey of Attitude Representations. J. Astronaut. Sci. 1993, 41(4), 439–517.
  27. Bach, R.; Paielli, R. Linearization of Attitude-Control Error Dynamics. IEEE Trans. Autom. Control 1993, 38(10), 1521–1525. [CrossRef]
  28. Mortari, D. The Attitude Error Estimator. In Proceedings of the International Conference on Dynamics and Control of Systems and Structures in Space, Cambridge, UK, 14–18 July 2002.
  29. Markley, F.L. Attitude Error Representations for Kalman Filtering. J. Guid. Control Dyn. 2003, 26(2), 311–317. [CrossRef]
  30. Tanygin, S. Projective Geometry of Attitude Parameterizations with Applications to Control. J. Guid. Control Dyn. 2013, 36(5), 656–666. [CrossRef]
  31. Smeresky, B.; Rizzo, A.; Sands, T. Kinematics in the Information Age. Mathematics 2018, 6(9), 148. [CrossRef]
  32. Bani Younes, A.; Mortari, D. Derivation of All Attitude Error Governing Equations for Attitude Filtering and Control. Sensors 2019, 19(21), 4682. [CrossRef]
  33. Hall, D.; Sands, T. Vehicle Directional Cosine Calculation Method. Vehicles 2023, 5(1), 114-132. [CrossRef]
  34. Pontryagin, L.S.; Boltyanski, V.G.; Gamkrelidze, R.S.; Mishchenko, E.F. The Mathematical Theory of Optimal Processes; CRC Press: Boca Raton, FL, USA, 1962.
  35. Sandberg, A.; Sands, T. Autonomous Trajectory Generation Algorithms for Spacecraft Slew Maneuvers. Aerospace 2022, 9(3), 135. [CrossRef]
  36. Ross, M. A Primer on Pontryagin's Principle in Optimal Control, Second Edition. Collegiate Publishers: San Francisco, USA, 2015.
  37. Raigoza, K.; Sands, T. Autonomous Trajectory Generation Comparison for De-Orbiting with Multiple Collision Avoidance. Sensors 2022, 22(18), 7066. [CrossRef]
  38. GoPro Awards: On a Rocket Launch to Space. Available online: https://www.youtube.com/watch?v=bDoh8zQDT38 (accessed 30 November 2023).
  39. Youtube image use policy, “In the United States, works of commentary, criticism, research, teaching, or news reporting may be considered fair use.” Available online: https://support.google.com/youtube/answer/9783148?hl=en (accessed 30 November 30, 2023).
  40. An illustration of the European ATV-2 re-entry and breakup because of the atmospheric forces of Earth. Available online: https://www.nbcnews.com/id/wbna43496909 (accessed 30 November 30, 2023).
  41. ESA Image Use Policy, “You may use ESA images or videos for educational or informational purposes”. Available online: https://www.esa.int/ESA_Multimedia/Copyright_Notice_Images (accessed 30 November 2023).
  42. Walton, R.; Goehlich, R. SPACE CARGO: Ultra-fast Delivery on Earth –Potential of Using Suborbital Space Vehicles for the Transportation of Cargo. International Journal of Aviation, Aeronautics, and Aerospace 2022, 9(1). [CrossRef]
  43. DIDO Optimal control software. Available online: (https://www.mathworks.com/products/connections/product_detail/dido.html) accessed 16 February 2023.
  44. Morrison, D.D.; Riley, J.D.; Zancanaro, J.F. Multiple shooting method for two-point boundary value problems. Commun. ACM 1962, 5, 613–614. [CrossRef]
  45. Bialecki, Bernard. “Sinc-Collection Methods for Two-Point Boundary Value Problems.” Ima Journal of Numerical Analysis 11 (1991): 357-375. [CrossRef]
  46. The MathWorks, Inc. (2022). “DIDO Optimal Control Software”. MATLAB version: 9.13.0 (R2022b). Available online: https://www.mathworks.com/products/connections/product_detail/dido.html.
Figure 1. (a) Guidance, Navigation, and Control Technology Assessment image. [1] Credit: NASA, Patricia M. Beauchamp. (b) Shuttle STS-135 mission reentry streak from orbit. [2] Credit: NASA, International space station Expedition 28 crew, usage compliant with image use policy [3].
Preprints 92685 g001
Figure 2. (a) Re-entry mission by UP Aerospace [38] Credit:, usage compliant with image use policy [39] (b) European ATV-2 re-entry and breakup because of the atmospheric forces of Earth. [40] Illustration credit: ESA/D. Ducros, usage compliant with image use policy [41].
Preprints 92685 g002
Figure 3. (a) A depiction of three-dimensional comparison of the body frame to the inertial frame through prime axes by the Euler angles pitch (θ), roll (ϕ) and yaw (ψ). (b) depicts determining the sign value of each sine or cosine for direction cosine matrix (DCM) of rotating about the Zi axis. 1c depicts a rotation using a quaternion to directly compare the inertial frame to the body frame by mathematically rotating around a 4th axis, defined in relation to the eigenvector, by the angle η.
Preprints 92685 g003
Figure 4. Subfigure (a) is altitude flight descent and (b) shows the state magnitudes with isolating the flight path angle and constant control input.
Preprints 92685 g004
Figure 5. Subfigure (a) is altitude flight descent and (b) shows the state magnitudes with isolating the azimuth angle and constant control input.
Preprints 92685 g005
Figure 6. Subfigure (a) is the simulation output of the scaled states, and (b) is the scaled co-states, and 4c is the scaled controls.
Preprints 92685 g006
Figure 7. Subfigure (a) is altitude flight descent and (b) shows the state magnitudes with isolating the azimuth angle and constant control input.
Preprints 92685 g007
Figure 8. Three-Dimensional plot of the vehicle flight path.
Preprints 92685 g008
Figure 9. Subfigure (a) is the simulation output of the scaled states, (b) is the scaled co-states, and (c) is the scaled controls.
Preprints 92685 g009
Figure 10. Subfigure (a) is the propagated states of the simulation and (b) is the Hamiltonian vs time.
Preprints 92685 g010
Figure 11. Three-Dimensional plot of the Vehicle Flight Path.
Preprints 92685 g011
Figure 12. Subfigure (a) is the simulation output of the scaled states, (b) is the scaled co-states and (c) is the scaled controls.
Preprints 92685 g012
Figure 13. Subfigure (a) is the propagated states of the simulation with r divided by 1e4 to balance the chart and (b) is the Hamiltonian vs time.
Preprints 92685 g013
Figure 14. Subfigure (a) the stationarity condition check and (b) is the complementarity condition check.
Preprints 92685 g014
Figure 15. Subfigure (a) is the simulation output of the scaled states, (b) is the scaled co-states and (c) is the scaled controls.
Preprints 92685 g015
Figure 16. Subfigure (a) is the r state and co-vector, (b) is the θ state and co-vector, and (c) is the φ state and co-vector.
Preprints 92685 g016
Figure 17. Subfigure (a) is the v state and co-vector, (b) is the γ state and co-vector, and (c) is the ψ state and co-vector.
Preprints 92685 g017
Disclaimer/Publisher’s Note: The statements, opinions and data contained in all publications are solely those of the individual author(s) and contributor(s) and not of MDPI and/or the editor(s). MDPI and/or the editor(s) disclaim responsibility for any injury to people or property resulting from any ideas, methods, instructions or products referred to in the content.
Copyright: This open access article is published under a Creative Commons CC BY 4.0 license, which permit the free download, distribution, and reuse, provided that the author and preprint are cited in any reuse.
Prerpints.org logo

Preprints.org is a free preprint server supported by MDPI in Basel, Switzerland.

Subscribe

© 2024 MDPI (Basel, Switzerland) unless otherwise stated