Preprint
Article

Analysis of Thermal Performance of Three Construction Systems Used in National Housing: The Case of Al Ain, UAE

Altmetrics

Downloads

134

Views

43

Comments

0

Submitted:

08 December 2023

Posted:

13 December 2023

You are already at the latest version

Alerts
Abstract
Structural systems in housing projects contribute to the energy consumption of buildings during and after construction, and the climate plays a significant role in this energy consumption. Housing projects in harsh environments such in the United Arab Emirates (UAE) directly contribute to energy performance, specifically in low-density residential areas. By selecting the most efficient structural system, prior construction can enhance energy performance in such housing projects. The present study investigates the energy performance of three different structural systems used in UAE national housing: precast concrete, reinforced concrete, and light gauge steel (LGS). The case studies used for this study were constructed in Abu Dhabi, the capital of the UAE, specifically in Alain city. Second, through qualitative analysis and average annual billing of each housing project, the study identifies the thermal defects and determines the electricity consumptions of each system. The results indicate that the LGS system provides high thermal conductivity through its structural elements whereas reinforced concrete leads to the highest annual energy consumption in kW h/m2. Finally, precast concrete has few thermal defects in its junctions and structural elements. The results indicate that LGS and reinforced concrete should be further studied, especially with regard to insulation and improvement, prior to implementation in housing systems.
Keywords: 
Subject: Engineering  -   Architecture, Building and Construction

1. Introduction

The world is witnessing a period of drastic climatic change. One of the main causes for these changes is global warming, which is strongly linked to the increasing rate of energy consumption. Economic activities, especially the burning of fossil fuels and deforestation, contribute significantly to the atmospheric level of greenhouse gases. CO2 levels have increased 25% since pre-industrial times because of human activities. According to estimates, the earth’s average surface temperature without the greenhouse effect would be −18 °C rather than +15 °C [1]. Furthermore, the construction industry is responsible for 60% of worldwide energy consumption, 40% of which is consumed by buildings [2], and 70.4% of the energy consumed by buildings is by residential buildings [3]. In comparison with nonresidential buildings, residential buildings have a lower internal load, and their cooling load accounts for a large part of residential energy consumption. A building’s energy consumption can be reduced in several ways, such as by improving building equipment systems and/or using innovative building components [4]. For instance, a part of the heating, ventilation, and air-conditioning (HVAC) load comes from the heat loss through thermal bridges within the building envelope. A recent study done in the UAE reports that over 59% of the total residential building energy consumption is due to HVAC [5]. Therefore, residential buildings present a significant opportunity to decrease the effect of thermal bridges and energy consumption and thereby reduce the emission of greenhouse gases.
Several energy-saving and emission-reduction policies have been adopted worldwide. According to the European Union, the goal is to improve energy efficiency to 32.5% by 2030 [6]. In a similar vein, Saudi Arabia has pledged to eliminate net emissions by 2060, without changing its position as the world’s leading oil producer [7]. Likewise, the United Arab Emirates (UAE) Net Zero by 2050 strategic initiative has a goal to become the first Middle-East and North African nation to achieve net-zero emissions by 2050. The strategy aligns with the Paris Agreement, which aims to reduce greenhouse gas emissions and limit global warming to 1.5 °C compared with pre-industrial levels [8].
The present study is vital to achieving the sustainability goals of the UAE, which have been pioneers in this field in research, and standards such as Estidama that enhance sustainability in the construction sector. However, the market remains dominated by conventional construction using reinforced concrete, which allows undesirable heat transfer through thermal bridges, leading to high energy consumption for cooling [9]. A study by Aoul et al. revealed that the thermal performance of a building is strongly affected by the type of construction material used, the thickness of the insulation, and mortar joints [10]. Furthermore, the authors suggest that thermal anomalies can be reduced by using skilled workmanship and otherwise enhancing construction quality. Hagi et al. [11] used thermal imaging to audit thermal bridges formed by building components. The authors report that heat transfer through building enclosures can occur either by conduction through the walls because of a temperature gradient (i.e., material conductivity), or by conduction through walls due to solar heating of the outside surface of the wall. In addition, the authors report that thermal defects leading to thermal bridges are caused by design decisions made during the design and construction stages. Although existing studies have focused on thermal bridging and energy loss in construction systems in the UAE, no analysis has yet been conducted to determine how construction systems affect post-occupancy energy loss.
The conventional method of construction in the UAE is the cast-in situ method where concrete is transported and then procedurally cast at the site [12]. Widely used and understood, this method has been studied to meet sustainability goals set by the government and was found unable to attain the required efficiency [13]. Consequently, we must focus our efforts on tackling energy efficiency within the construction sector and, more specifically, in the method of construction.
This paper addresses this issue by analyzing the thermal performance of common construction methods, namely, light gauge steel (LGS), precast, and reinforced concrete. This investigation focuses on a housing project in Abu Dhabi, for which 80% of its constructions are for residential use and local neighborhoods define the overall construction environment [14]. Numerical evaluations have been carried out based on a case study of Abu Dhabi national housing projects in Al Ain City. Based on the case study, we strive to answer two distinct but correlated questions:
  • What is the most thermally efficient structural system to use in UAE housing projects?
  • What are the thermal defects of these systems and how do these defects affect the energy demand of the housing projects post-occupancy?

2. Literature Review

2.1. Construction Systems in the UAE

Globally, concrete is one of the most used construction materials and sees use in about 60% of the constructed environment in most developed countries [15]. The versatility and strength of reinforced concrete have led to many modern constructions that we know and use every day. Concrete is easy to produce and shape and offers considerable compressive strength. However, it can support only small tensile loads. Consequently, steel is used as a construction material because it is easy to make in tubular shapes and can be used when tensile strength is required.
Construction methods have now developed to the point that the most prevalent building methods involve prefabricated modular systems [16,17]. Recently, the UAE government has preferred to use these methods in construction projects due to their low cost, reduced labor requirements, and fast project delivery time [18,19]. Among the most well known of these methods involve the use of precast concrete and LGS.
The concrete can be either precast or in situ concrete. Precast concrete systems use standardized structural components that are produced off-site and then transported to the site for assembly [20]. This strategy has been used extensively in many residential and commercial construction projects because it offers greater durability, better thermal properties, and easy handling. In addition, precast concrete is of higher quality because it is manufactured under strict controls [21].
When it comes to energy consumption, a recent study [22] reported that the transportation and operational energy consumption of precast systems is greater than that of conventional building construction systems. Precast concrete consumes 60% more energy for transportation compared with the conventional system, and 30% more energy for operation [22]. Overall, embodied energy expended for prefabricated construction, by the deployment of energy-efficient materials and optimal construction periods, is reportedly 5.7% greater than conventional construction [22].
Considering LGS, which is “a cold-rolled” steel product commonly available in the shape of flat sheets, angles, or channels and often used to frame nonstructural partitions, it is used in external-wall frames, floor frames, internal walls, etc. [23]. It is used as a base which is then covered with boards and materials [24]. A study in 2019 reported that 19% less maintenance energy is required when using LGS than when using the conventional system [25].

2.2. Thermal Bridging and Thermal Inefficiency

In thermodynamics, thermal bridges refer to excessive heat loss or gain through a structure, since heat transfers through an object that is more conductive than its surroundings. Thermal bridging occurs due to the difference in temperature between the interior and exterior of a building. In general, the interior temperature is higher than the exterior temperature due to the absence of airflow [26]. Thermal bridging in homes and buildings can lead to higher utility bills due to energy loss.
Multiple studies have reported that precast concrete panels made from steel and concrete have low thermal efficiency and represent major unreported defects in thermal performance. These studies also emphasize that using alternative materials with low thermal conductivity such as glass fiber, carbon fiber, basalt fiber, etc. can reduce the thermal conductivity of structures [27,28,29].
Hamed et al. revealed that the thermal resistance of a precast panel is proportional to the length of the thermal path [27]. The study also found that “staggering of shear connectors increases thermal path length and subsequently improve the thermal resistance of panels” (see page 81 of Ref. [27]). Conversely, there is a paucity of studies on thermal bridging and the thermal performance of LGS systems. One of the rare studies on this subject focused on mitigation strategies to reduce thermal bridging in LGS structures such as simplifying the facade geometry; avoiding interruption between the insulating layers, and joining insulation layers at full length [30].
Furthermore, recent studies have focused on the relation between thermal bridging and the thermal performance of conventional construction systems used in the UAE. For example, Ismail et al. emphasized that thermal bridging should be minimized in the design and construction stages and calculated that it is one of the main deficiencies in the thermal performance of masonry [31]. Zedan et al. found that thermal bridges caused by mortar joints between insulated building blocks increase the annual heating and cooling load by 11% [32].

2.3. Nondestructive Testing: Infrared Thermography

Rapid technological advancements have enhanced the tools available for building diagnostics. Today, tools for nondestructive testing are easily available and are quick and accurate to use in multiple situations [33]. Nondestructive testing is considered one of the most efficient ways to improve the accuracy of post-occupancy diagnosis of buildings [33].
The present study used infrared thermography (IRT) to test building envelopes and to determine rates of energy loss. We selected IRT for this study because it is a mature, nondestructive testing technique that is easy to use for researchers and technicians [10,33]. Data were retrieved from empirical imagery along with numerical data of a building’s facade, from which the building’s energy performance was deduced [34]. The data acquired by IRT depends on the difference between the interior and exterior surface temperatures, so IRT has become an extremely popular tool for post-occupancy studies and determines the U values for energy efficiency studies. Recently, the accuracy of IRT has increased its popularity for use in studies in the UAE. Aoul et al. used IRT to test seven constructed and under-construction housing projects and produce a qualitative review. In addition, Kim et al. used the same tools for post-occupancy studies of buildings of the UAE University [35]. Thus, IRT is well suited for the climate of the UAE.

3. Materials and Methods

3.1. Case study and Investigation Criteria

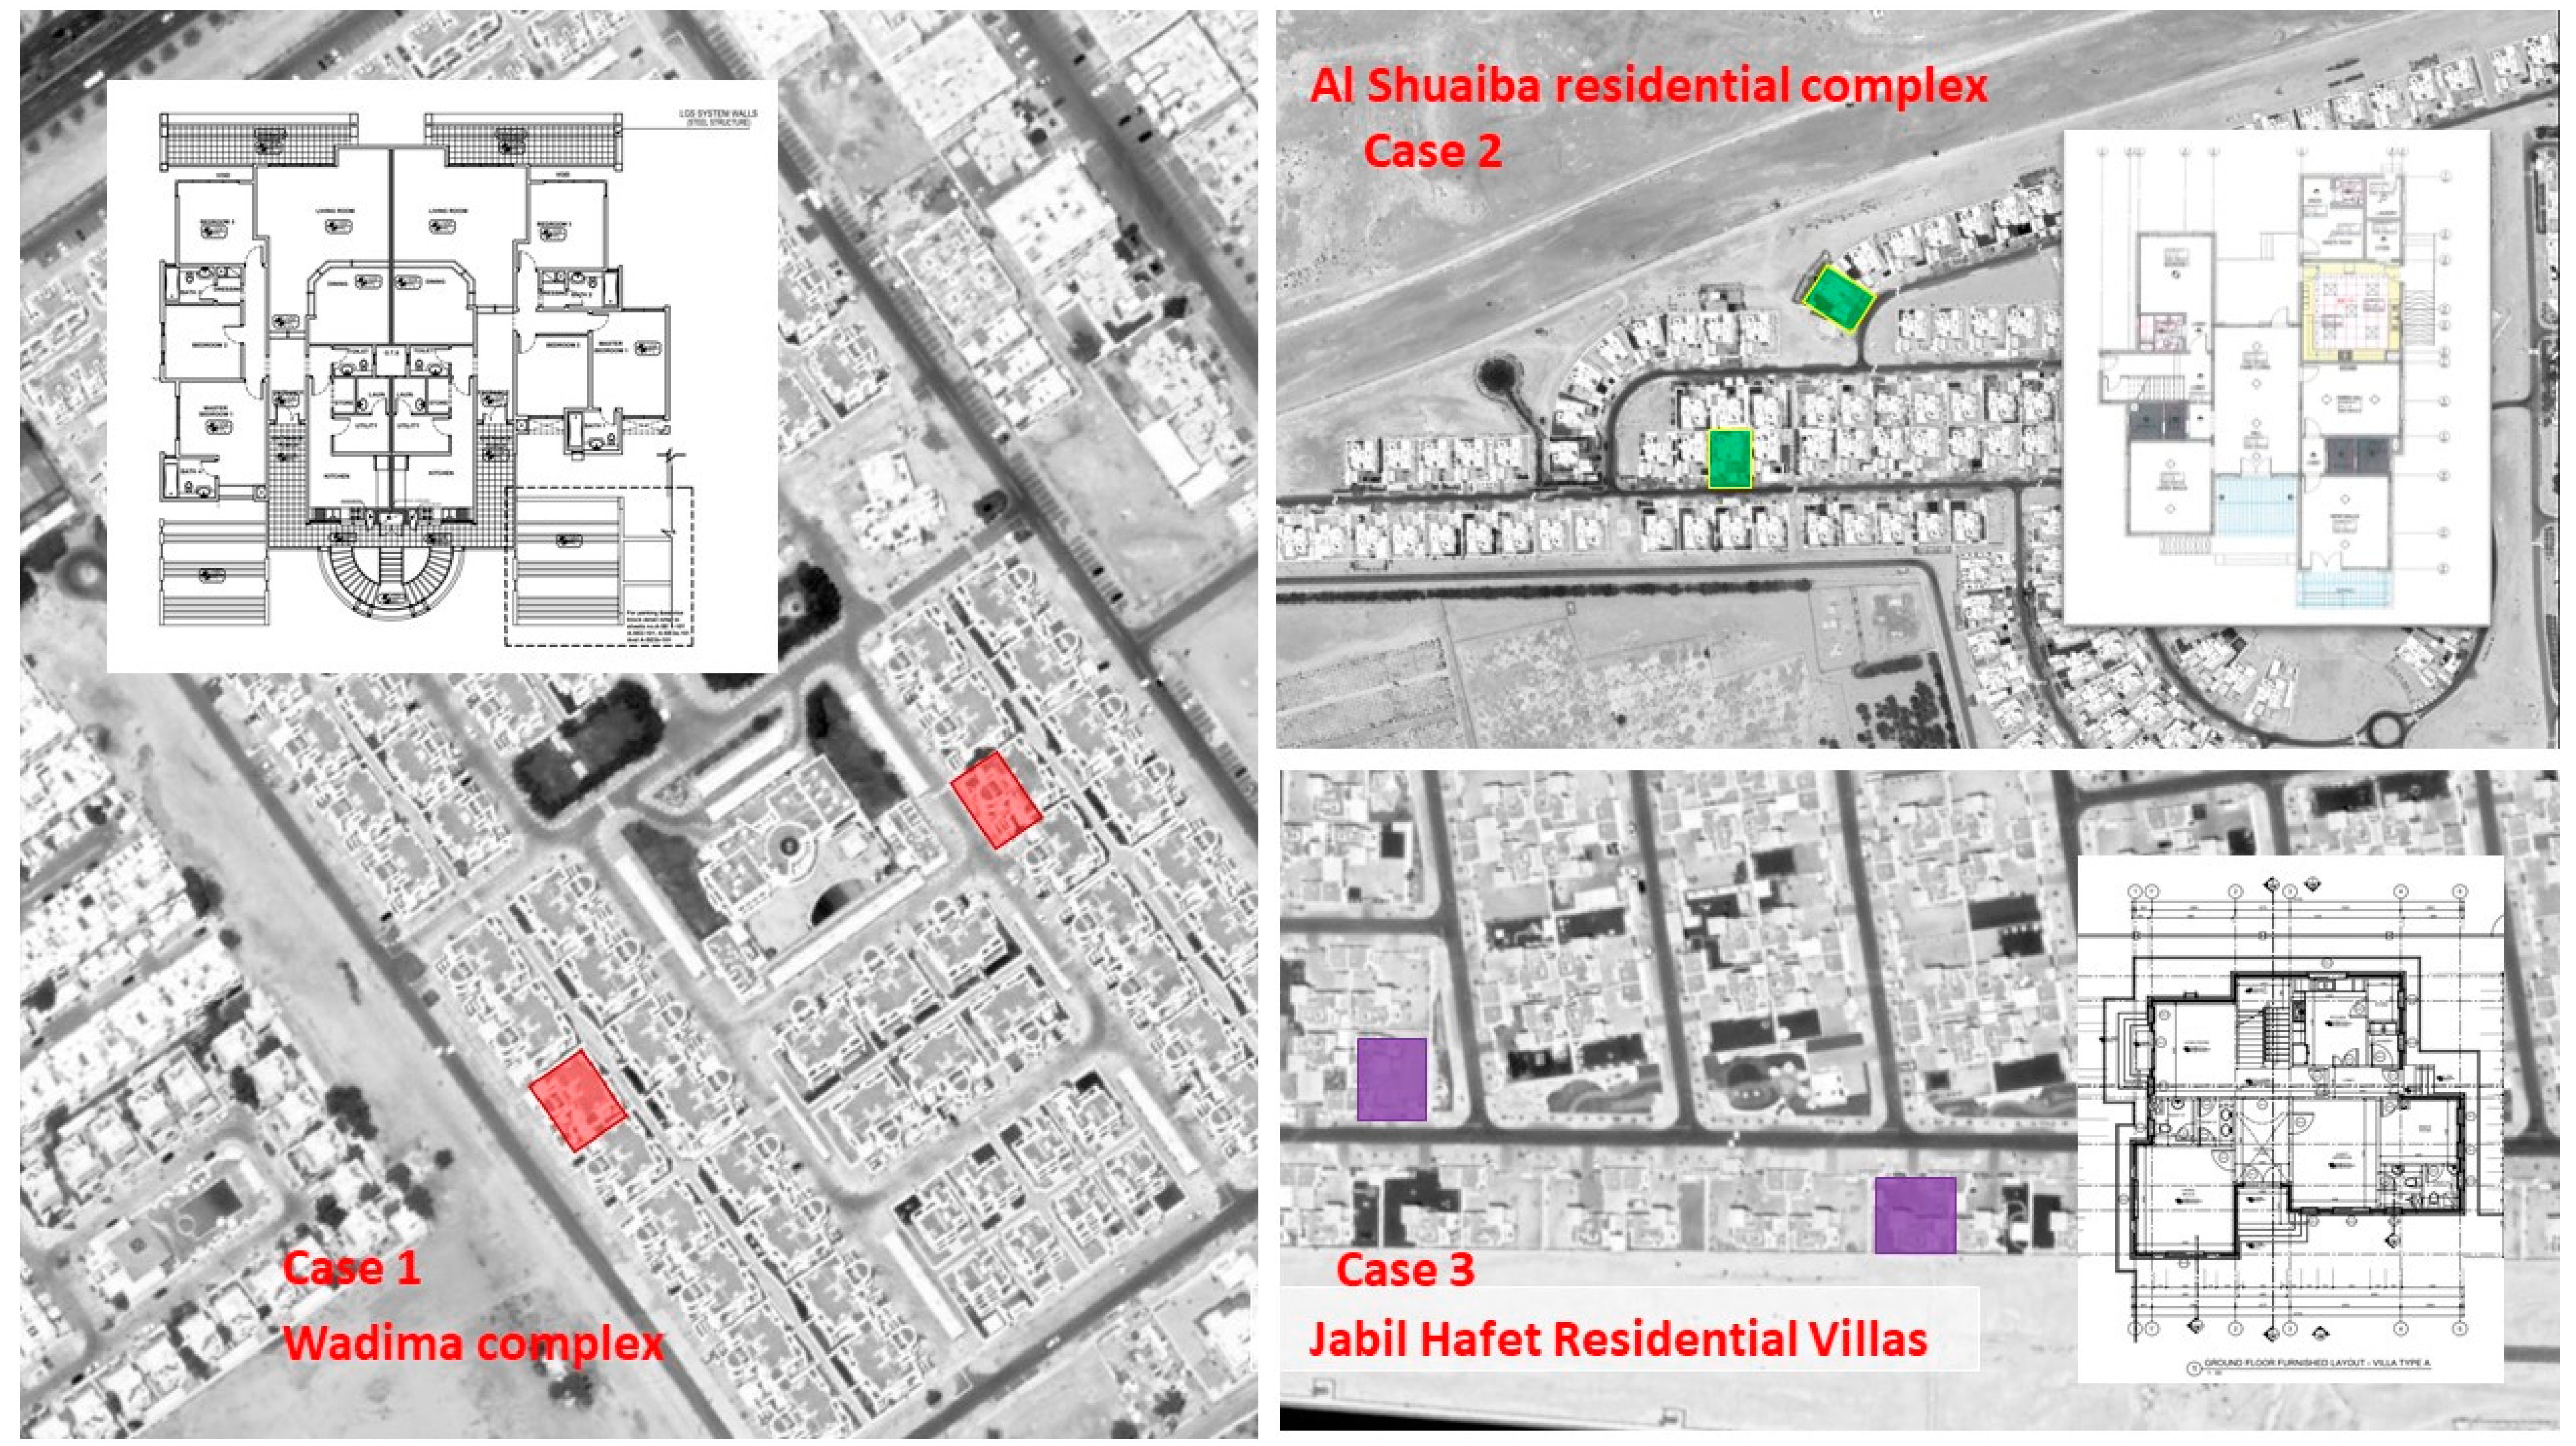
This study determines the thermal efficiency of the various construction methods used in UAE housing projects. In particular, the average annual energy consumption is determined to compare thermal bridging through walls, materials, and system joints such as wall-wall joints and wall-celling joints. Accordingly, three cases from Al Ain City of Abu Dhabi were selected due to their difference in terms of construction systems. The buildings were selected because they house the largest population of Emiratis in the city. As illustrated in Figure 1, the projects were selected from different areas of Al Ain City to sample a significant fraction of the city’s area, climate, and geography. To ensure accurate results, two units from each case were used as research samples. The selection of these units was based on two criteria: (1) the building’s orientation and (2) the operating hours of the air conditioner. Before collecting data, the residents of each building were asked to turn on their air conditioners for at least four hours to ensure significant differences between the internal and external temperatures. Data were acquired from the south and south-west facades between 12.45 and 2 pm.
Alain has a hot, arid climate [36]. The highest temperature in Al Ain averages 43.3 °C and occurs in July and the lowest temperature of 11.3 °C occurs in January. Unlike coastal cities in the UAE, Alain has low relative humidity, which facilitates the interpretation of data from construction systems. The field investigation spanned from November 2021 through January 2022, during which Al Ain has its lowest annual temperatures. This is consistent with the hypothesis of the study whereby all cases should perform in the most energy-efficient way. Thermal bridging or air leakage should be detected in all three cases.
In Al Ain, residential villas are divided into (1) Emirati-owned villas and (2) private rental houses (mainly for expatriates). The case studies considered include both categories, as detailed below.
  • Case 1: Wadeema complex is a rental apartment attached to three different apartments and is part of a residential compound used mainly by expatriates. The LGS construction system was used for the four apartments. Due to the limited time frame of the study, we normalized all the other apartments based on the data obtained from one apartment.
  • Case 2: Al Shuaiba Residential Villas constitute an emirate national villa constructed from concrete brick wood infill with reinforced concrete for beam and post structures. This is the most used construction method in Al Ain.
  • Case 3: Jabel Hafeet Residential Villas are constructed from a precast concrete system that is the most used material for national houses in the UAE. As a result, the market for precast concrete has been growing rapidly in UAE.
Figure 2 shows the locations of the samples used in the study for each case, where the orientation of each facade was considered in the sample selection. Architectural plans were used to determine where to take IRT readings and can be used to understand how structural joints affect heat gain. Table 1 shows the characteristics of the cases under consideration for further investigation.
IRT readings were taken from the south and southwest facades between 12.45 and 2 pm from November 2021 through January 2022. A passive approach was used in this investigation by maintaining the indoor and outdoor temperatures at their normal levels [33]. Related studies in Al Ain, such as that of Aoul et al., used the same approach to identify thermal defects in building envelopes. The results of that study suggest improving the construction stages through improved workmanship.
The present study includes thermal images acquired by IRT to examine construction materials. Critical construction areas, such as corners, envelope openings, lentils, and beams, are considered. In an IRT study, specific environmental conditions must be met. In this case, the temperature gradient must be at least 10 °C between the interior and exterior of the building under investigation. The measurements were taken from both the interior and exterior cladding from the north and south facades. Both facades must be tested to understand the importance of building orientation during the winter. The results were retrieved by inspecting the IRT false-color map.
In addition, all residents provided electricity bills for one year to quantify the study’s findings and better understand the annual energy consumption of each household.

4. Thermal Performance

The study of the three systems of construction focuses on the relation between the thermal performance of the given system and the effect of the material used, the wall-wall and ceiling-wall junctions, and the annual average energy consumption.

4.1. LGS Construction System

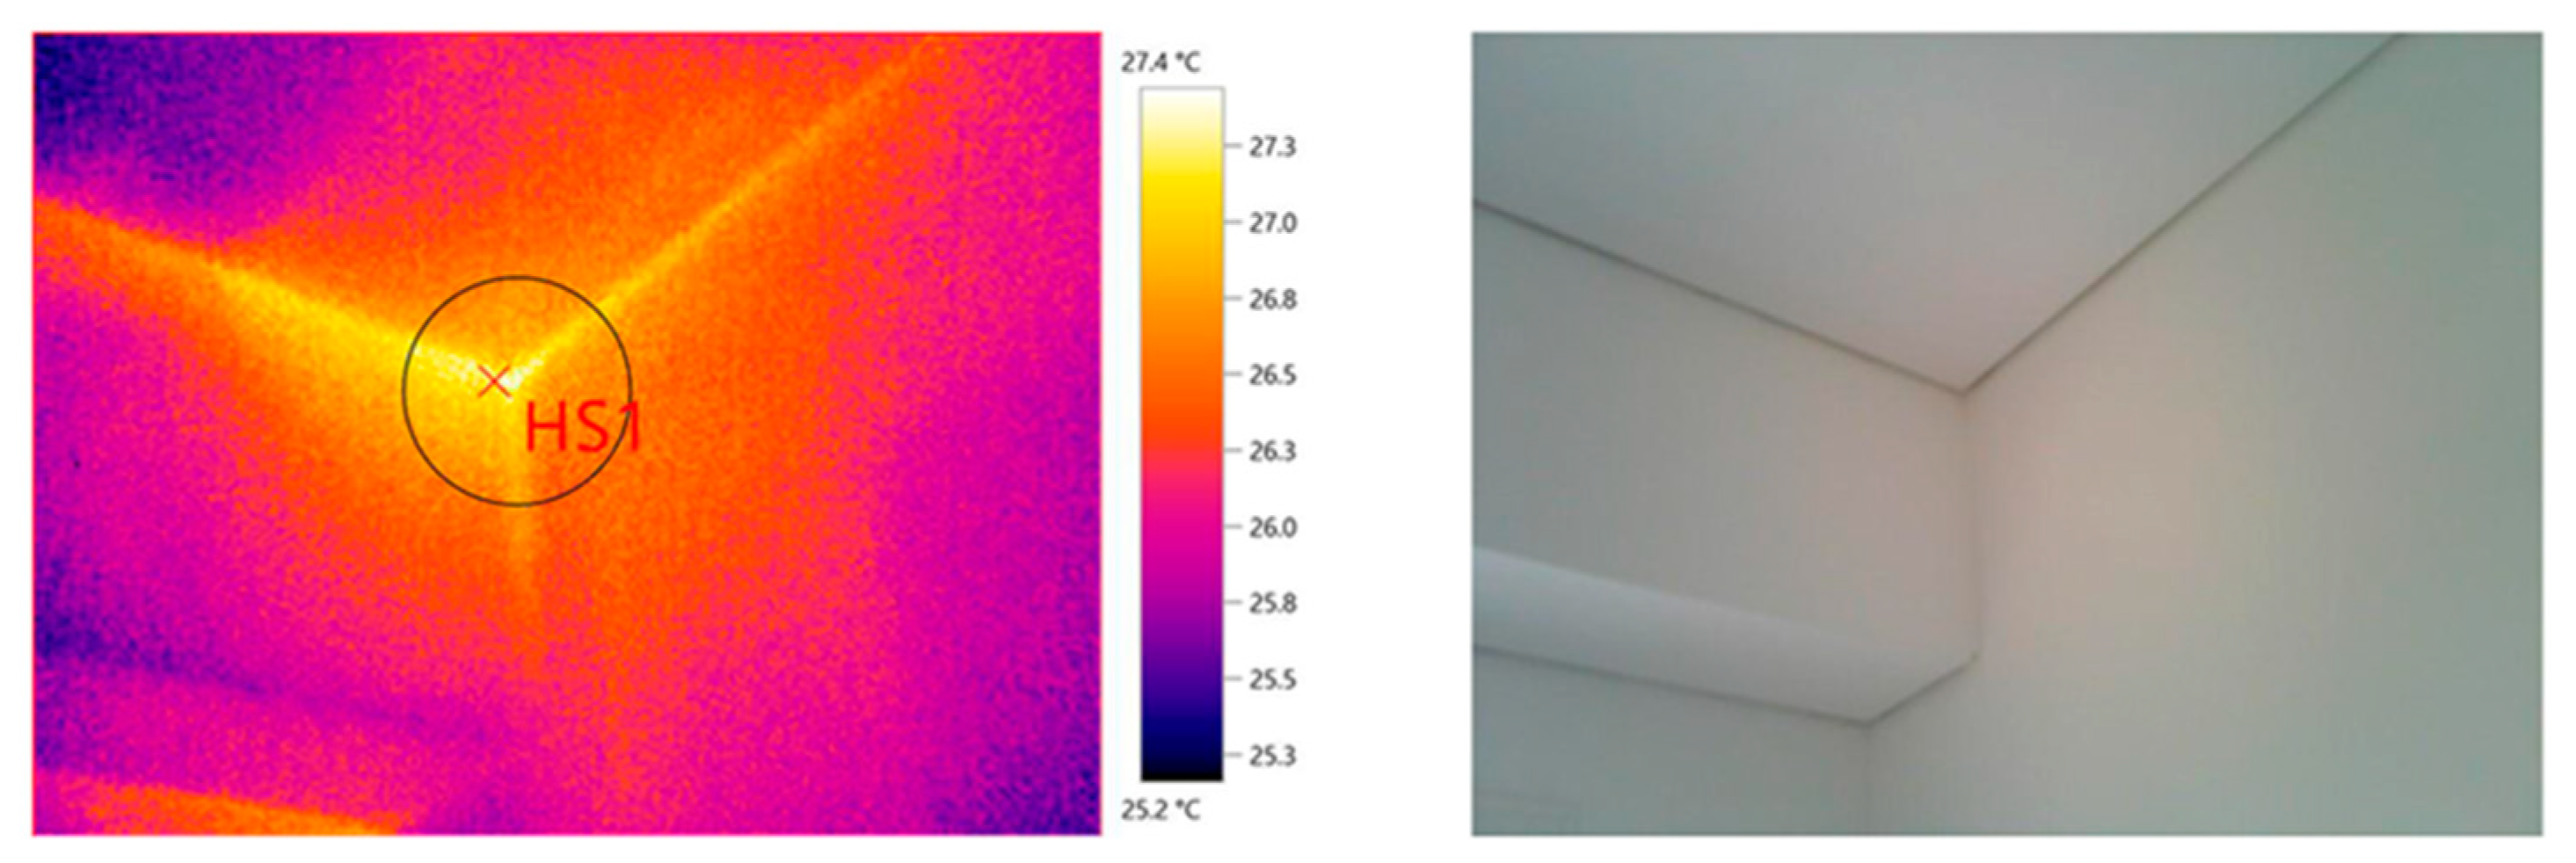
The two units forming case 1 were audited by using IRT, which revealed several issues related to the thermal performance of the LGS structural system in cases LC01 and LC02. The major issue was the high thermal conductivity of the LGS frames because the thermal imaging of the interior southern wall of units LC01 and LC02 recorded temperatures for the LGS frames that differed from the temperature of the other structural material. For LC01 (LC02), the temperature of the LGS frames was 27.3 °C (27.4 °C) versus 24.5 °C (25.6 °C) for the rest of the wall (see Figure 3 and Figure 4). Note that the drawings show that the frames were insulated with 150-mm-thick glass wool blanket insulation (Figure 5).
Other thermal images for the same units show that, in both units, the temperature at the southwest corner at the wall-wall and wall-ceiling junctions exceeds that of the rest of the wall, (27.4 °C vs 25.3 °C for LC01, and 27.9 °C vs 24.5 °C for LC02; see Figure 6 and Figure 7.
The as-built detailed drawings of the wall-to-wall junction show that uninsulated expansion joints were added, which causes the thermal bridges at the corners (see Figure 5, right). The results for both units audited are thus essentially the same for this case study.

4.2. Reinforced Concrete Construction System

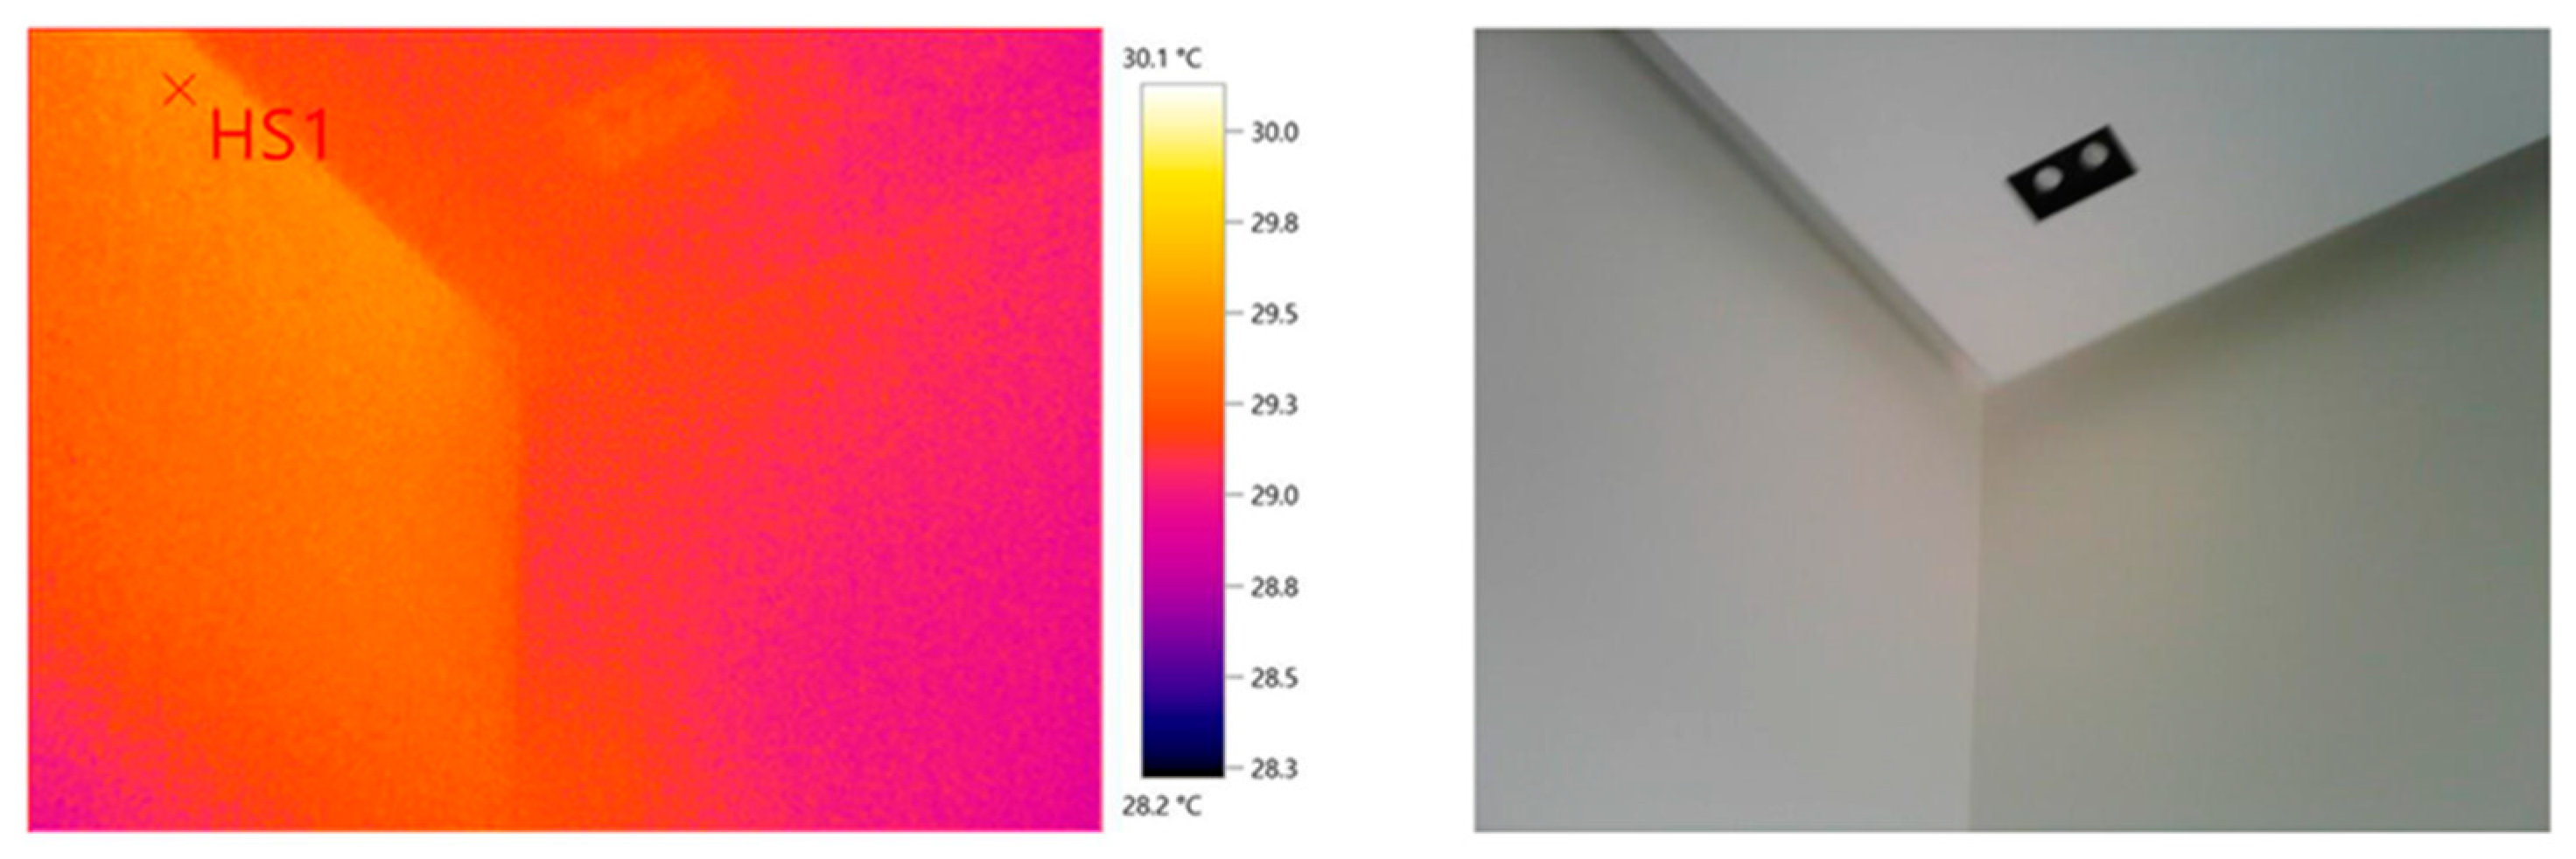
The units RC01 and RCO2 selected for case 2 were built from reinforced concrete and highlight several common thermal problems. The thermal images shown in Figure 8 and Figure 9 show thermal bridges through the wall layers and materials. The temperature of the interior of the wall is 25.9 °C for RC01, which is essentially the same as recorded for RC02 (25.7 °C).
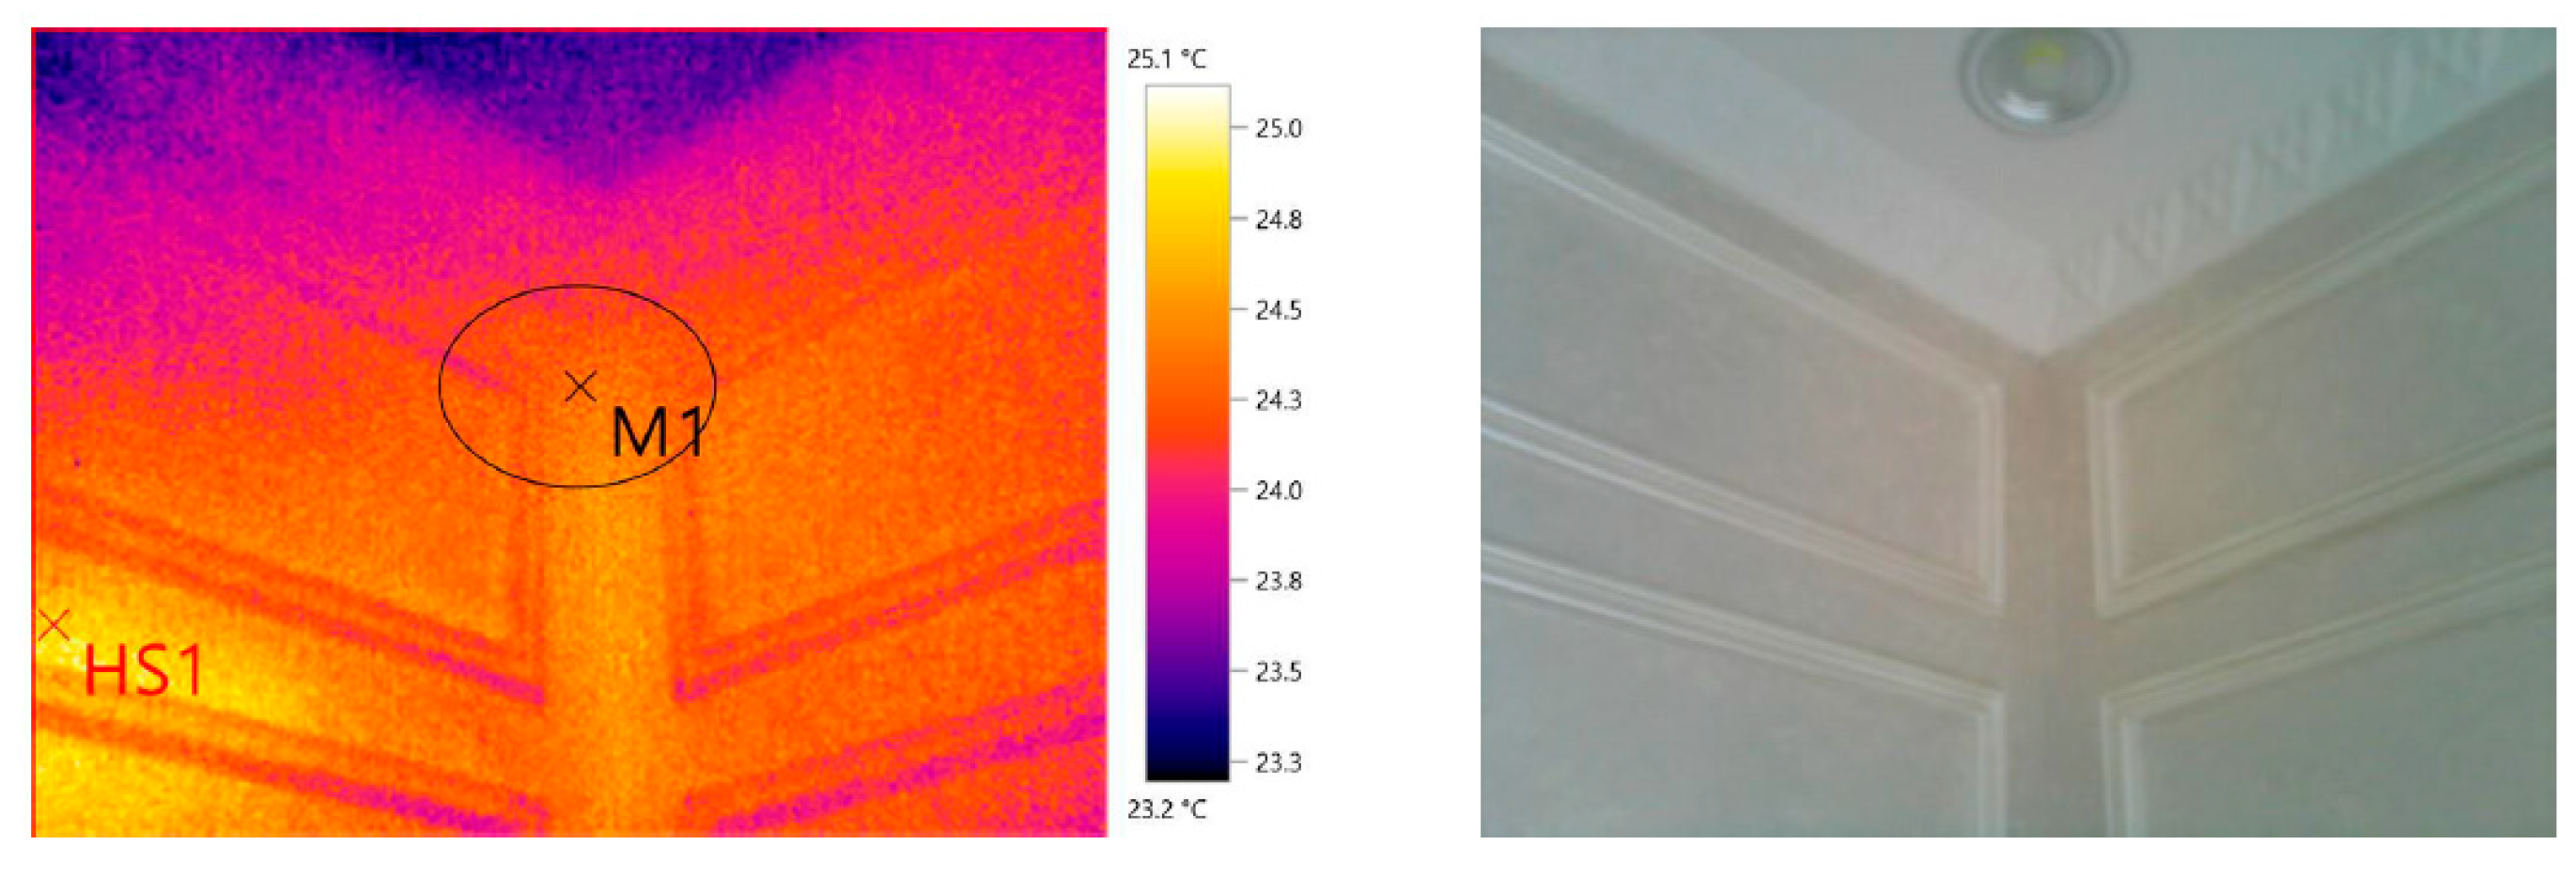
The thermal images shown in Figure 11 and Figure 12 of the southwest corners of units RC01 and RC02 reveal thermal bridges at wall-to-wall joints and ceiling-to-wall joints. The IRT images reveal an average indoor temperature of 24.1 °C (25.1 °C) for RC01 (RC02), which means that neither unit needs thermal insulation. Additionally, the additional layer of gypsum board tested in RC01 produces no significant difference in thermal performance. Note that all other facades produced similar results.

4.3. Precast Construction System

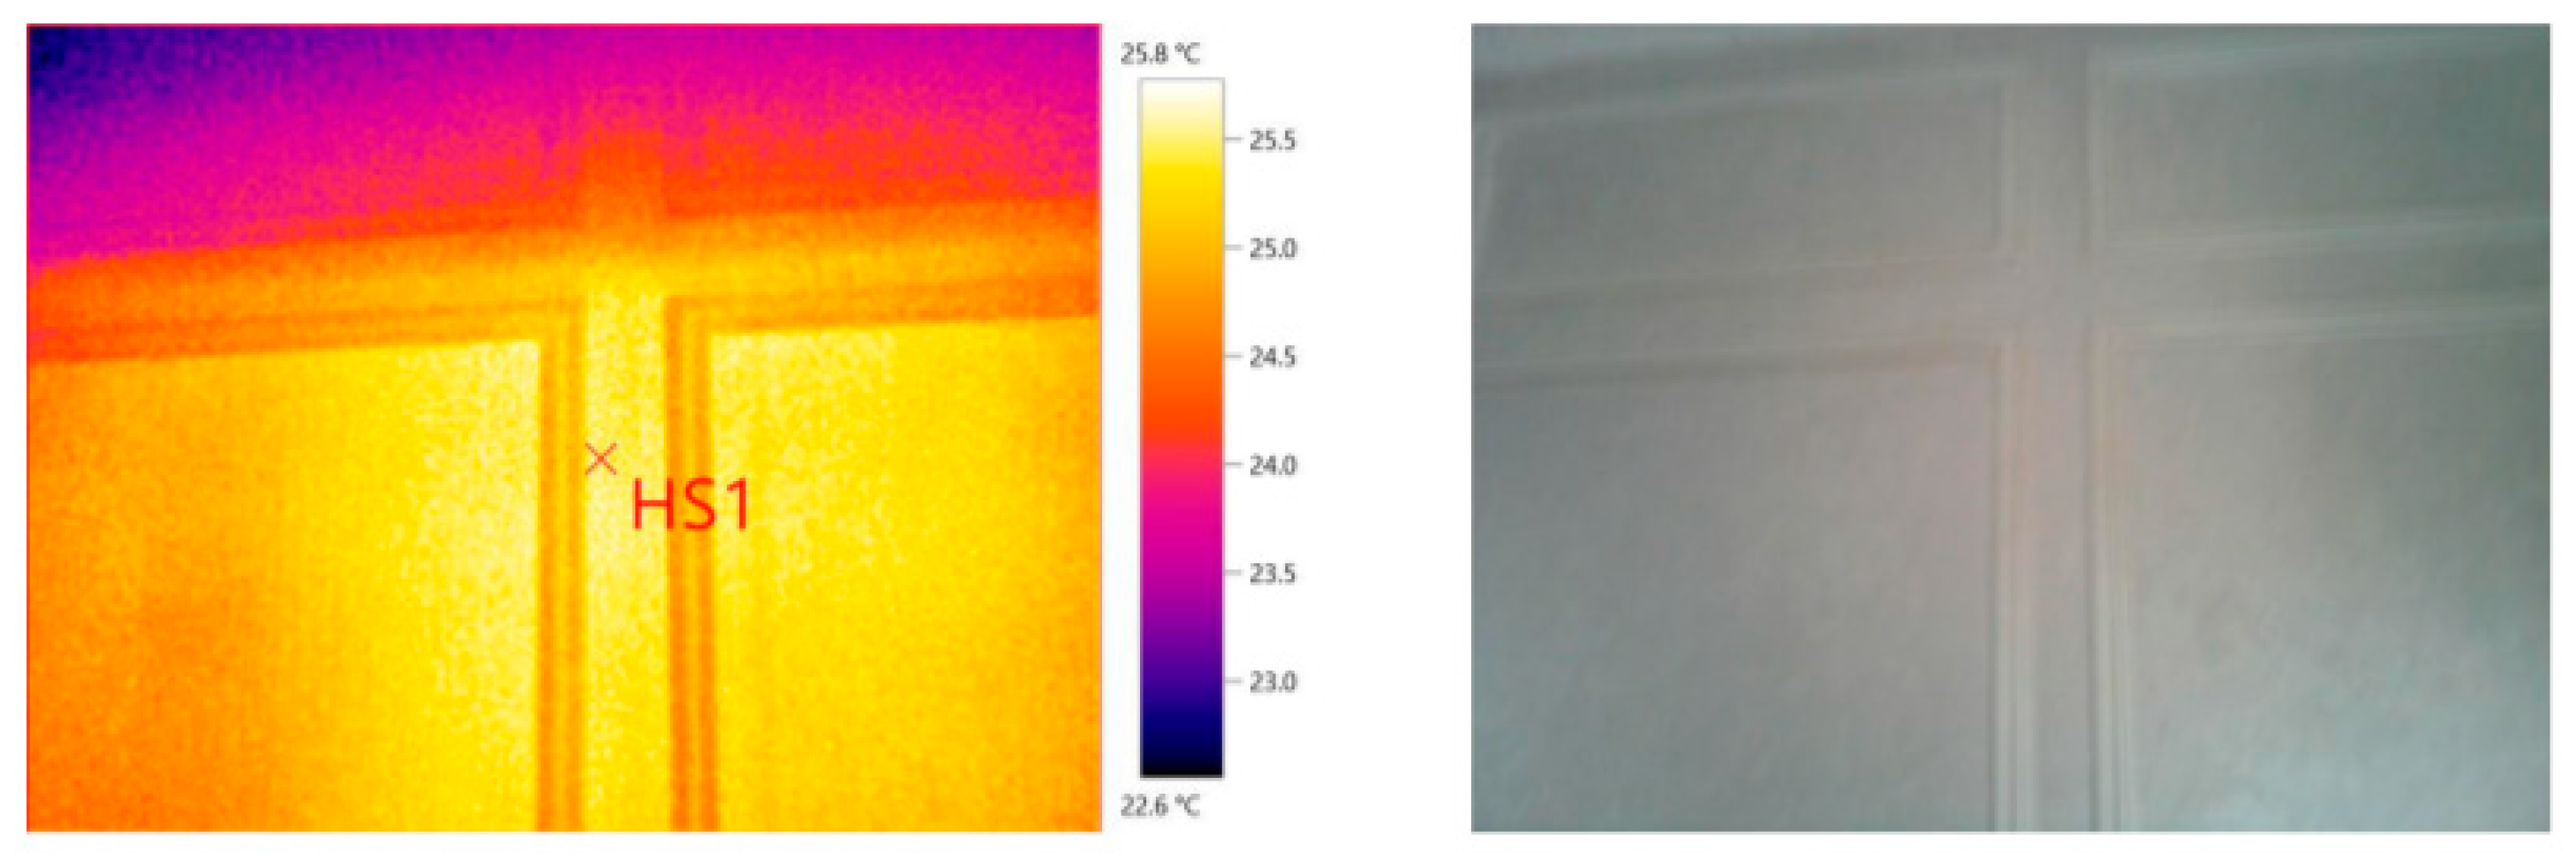
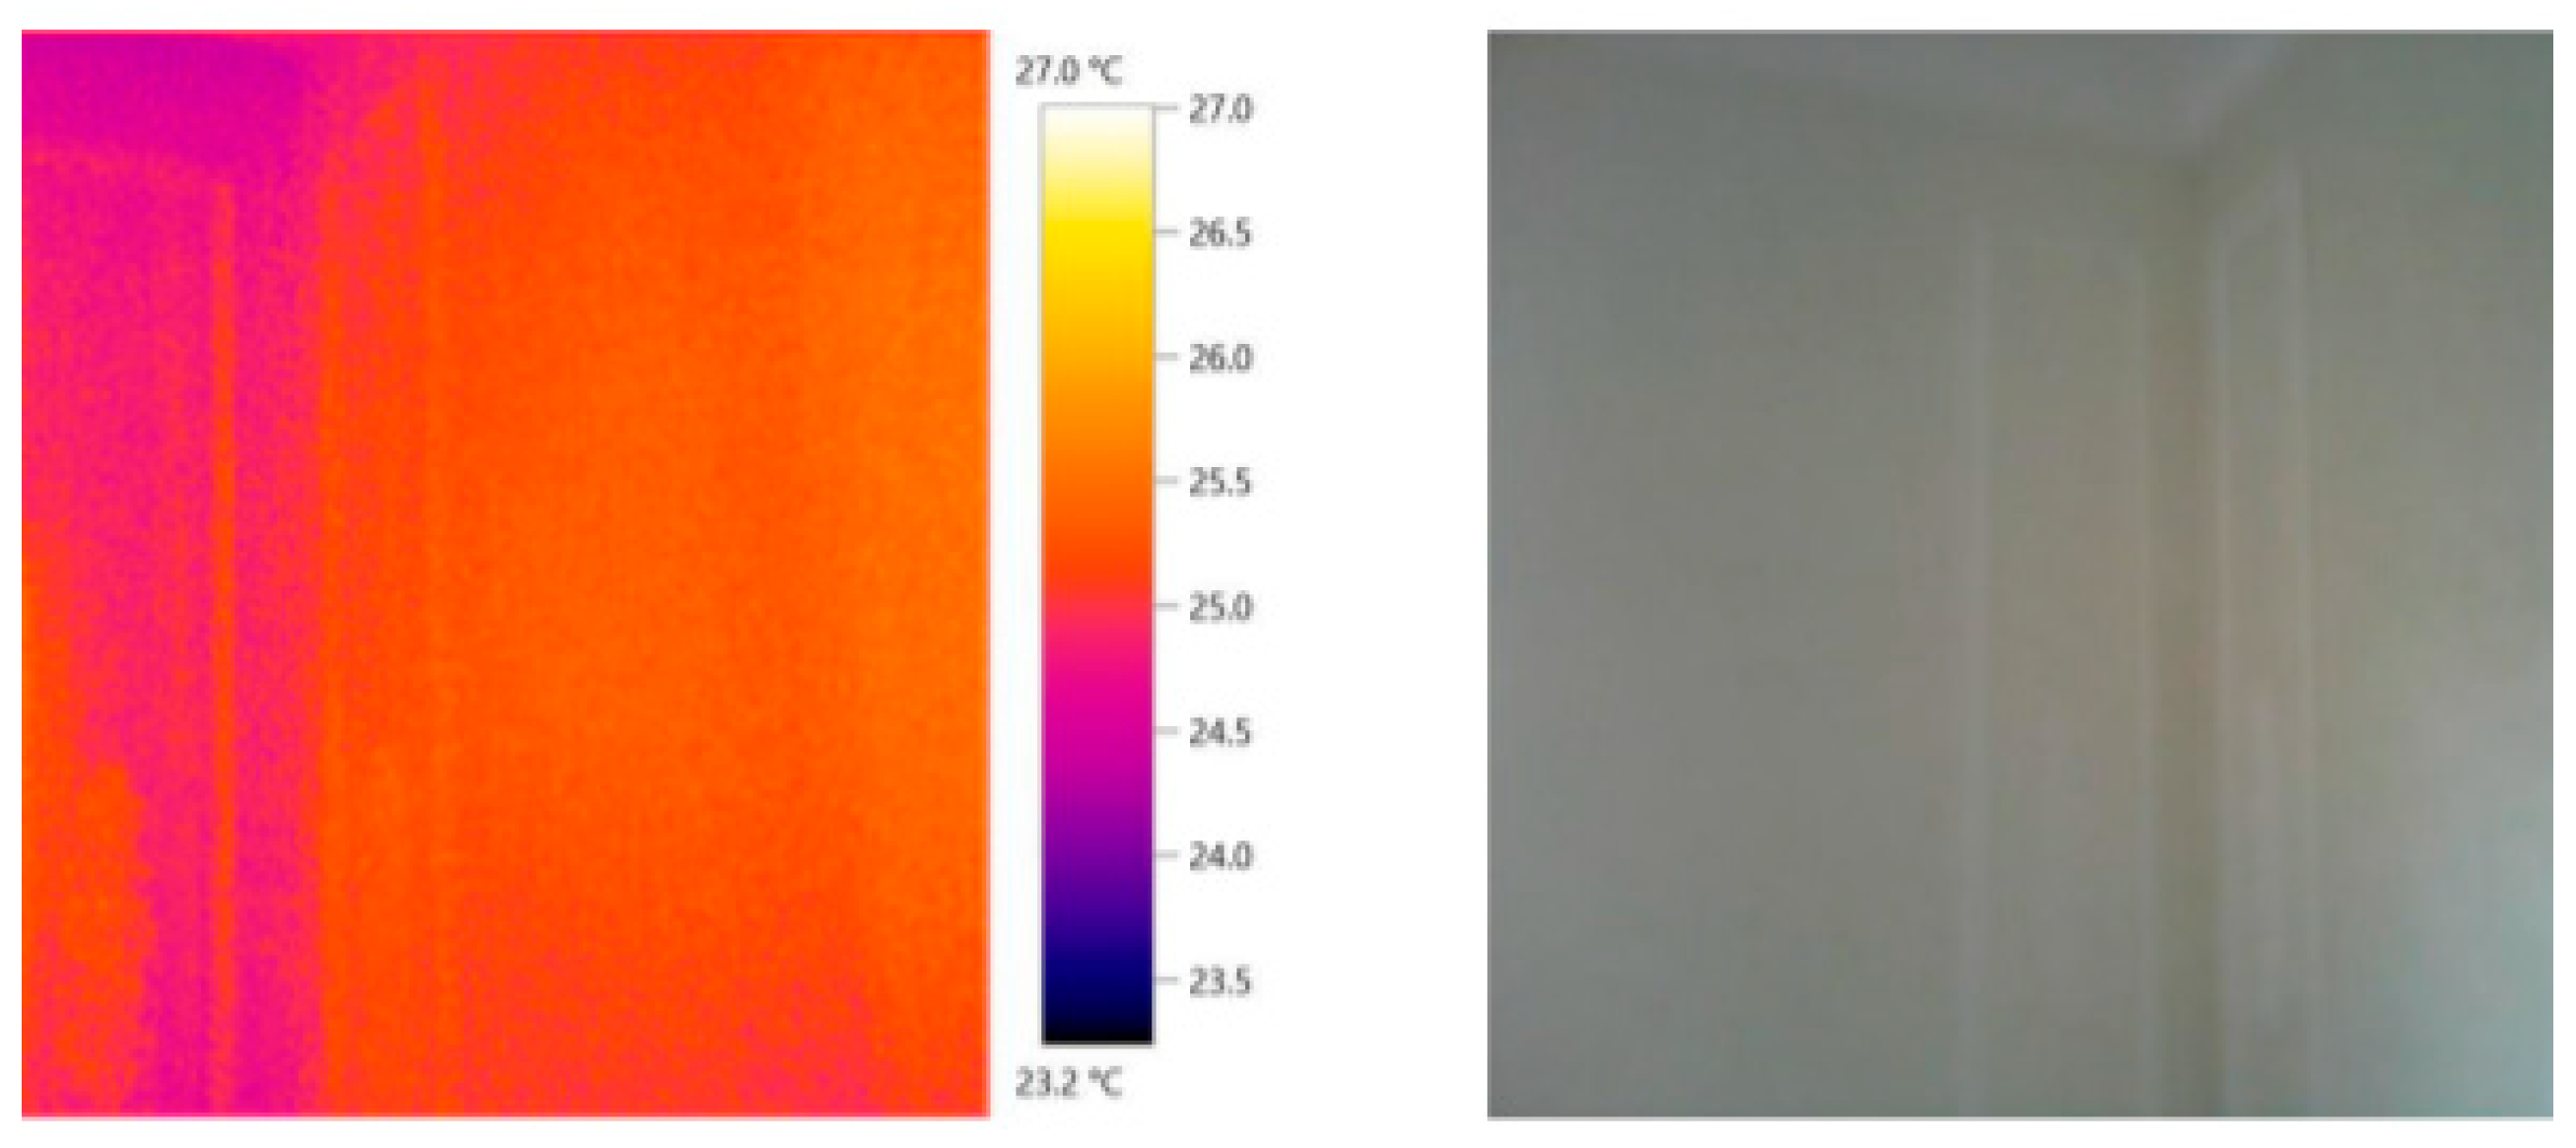
The units PC01 and PCO2 selected for case 2 were built from precast concrete. The thermal images shown in Figure 13 and Figure 14 reveal the thermal bridges through the wall layers and materials. The temperature of the interior of the wall of PC01 and PC02 is 25 °C.
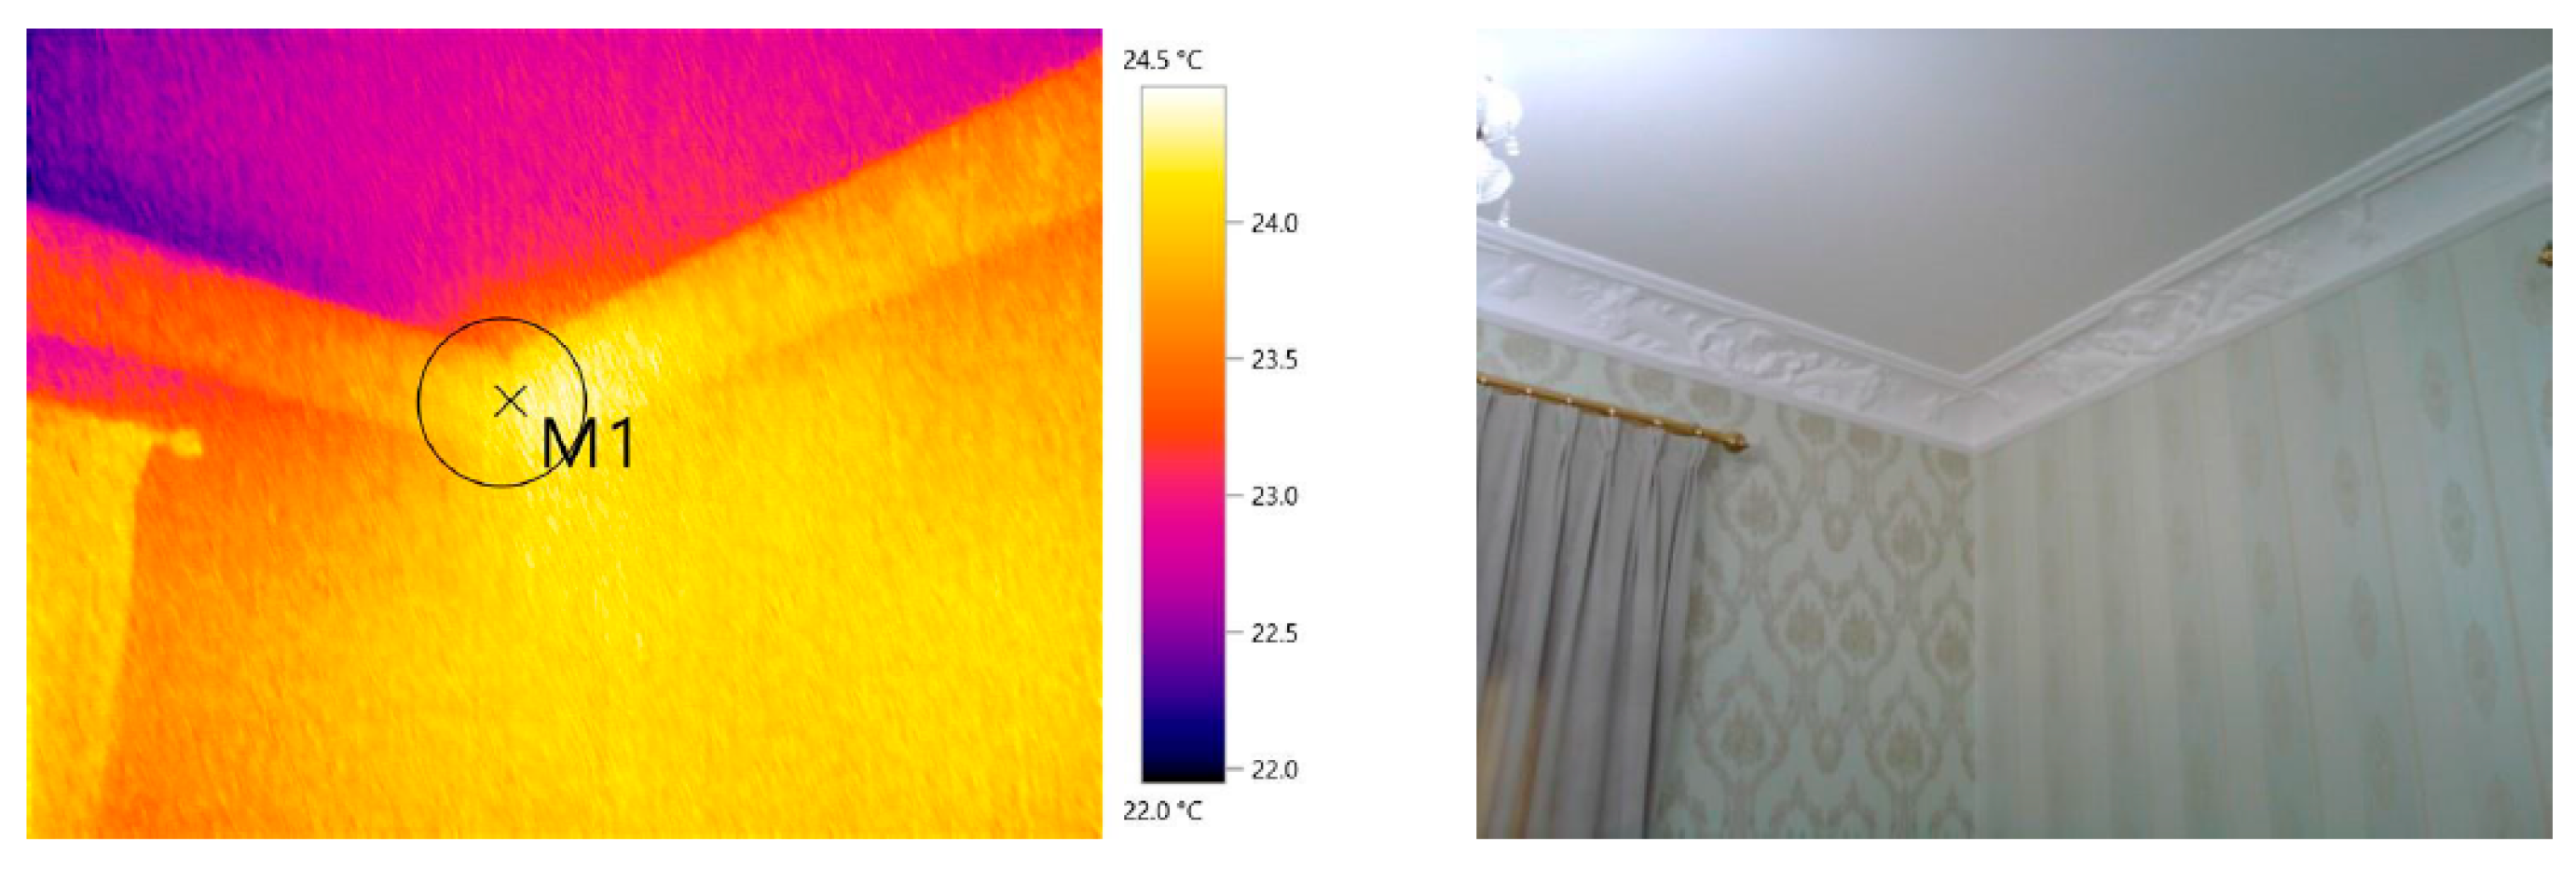
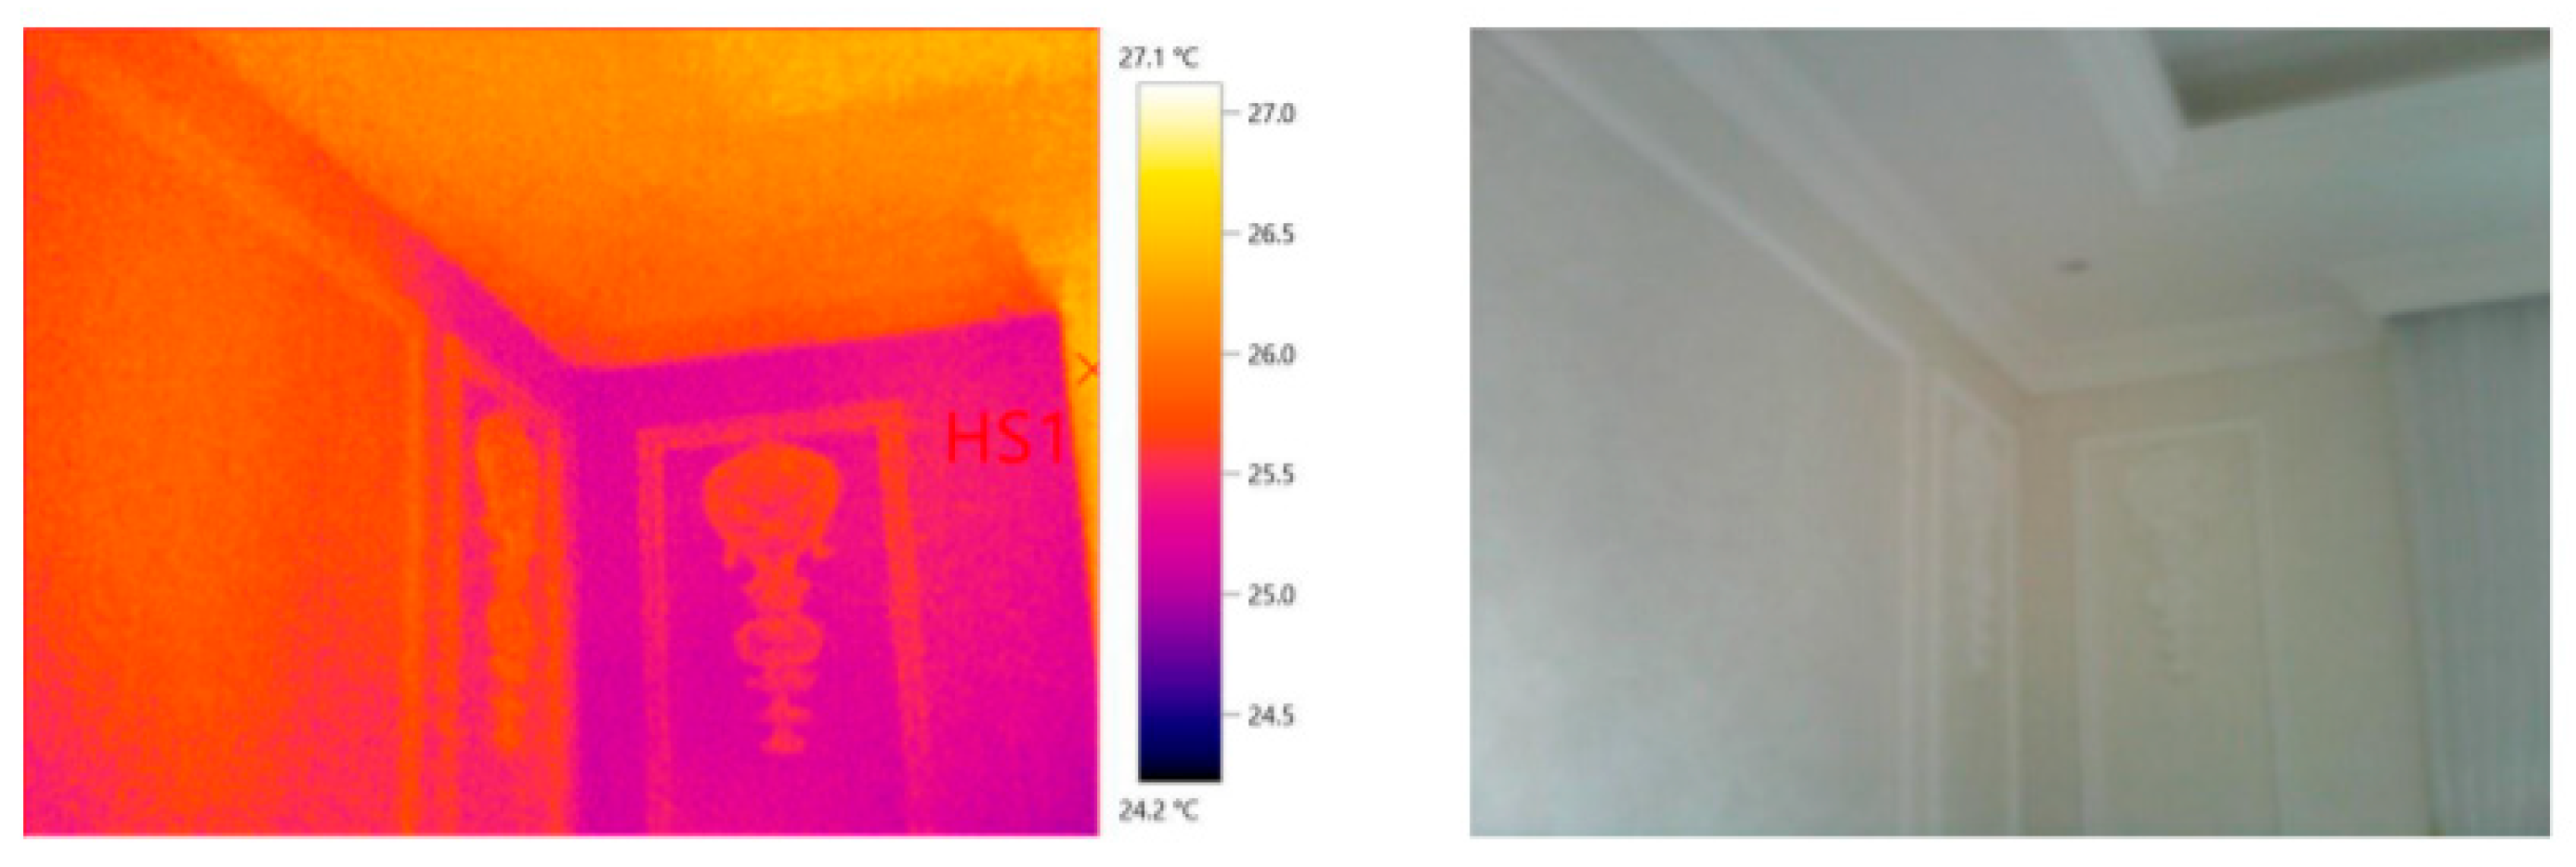
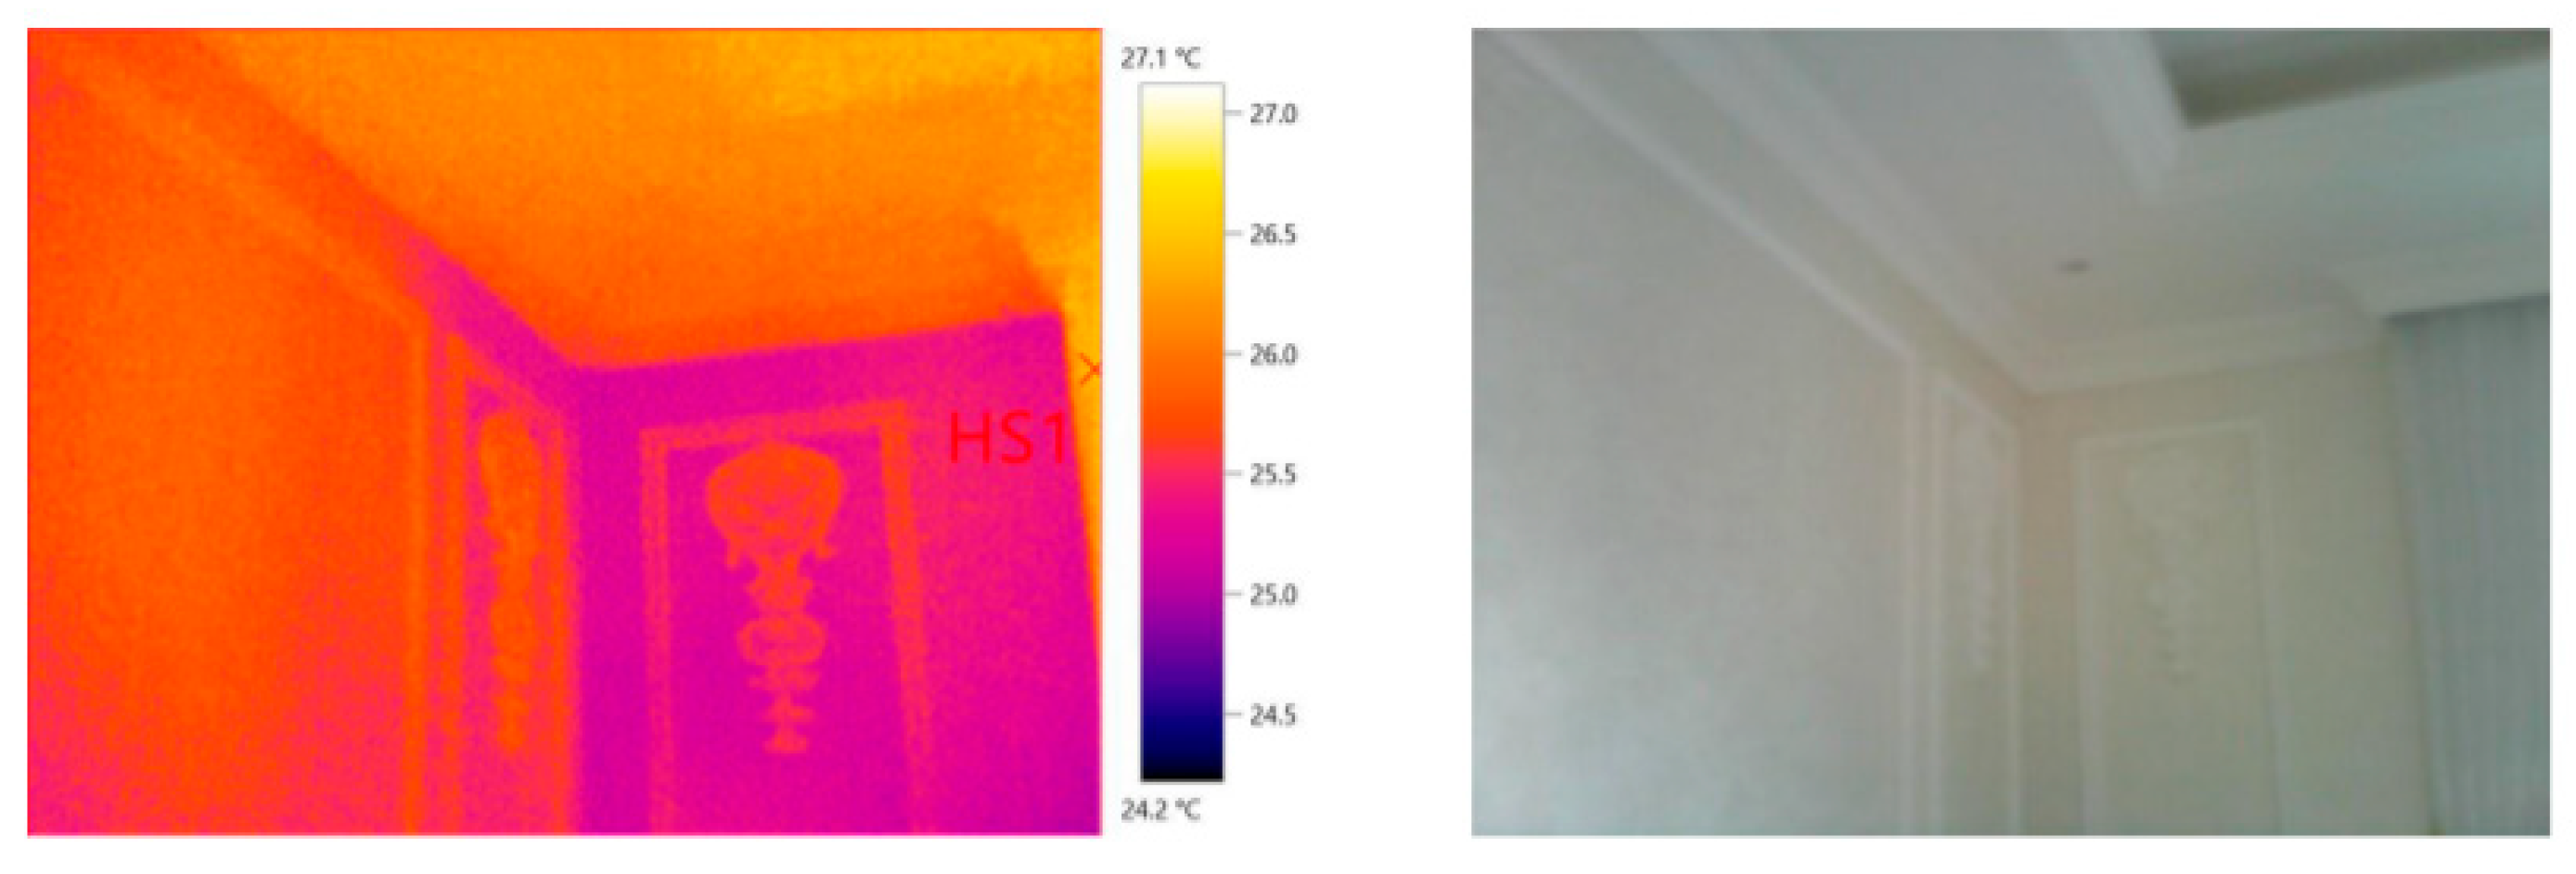
The thermography of the wall-wall junction of the precast system shows a small difference in the thermal performance between the junction and the rest of the interior wall for both PC01 and PC02. The thermograph gives 25.5 °C at the wall-wall junction versus an average of 25 °C over the rest of the wall. Conversely, the thermograph gives 27.1 °C (28.0 °C) at the wall-celling junction versus 25.0 °C (26.2 °C) over the rest of the wall in PC01 (PC02); see Figure 16 and Figure 17.
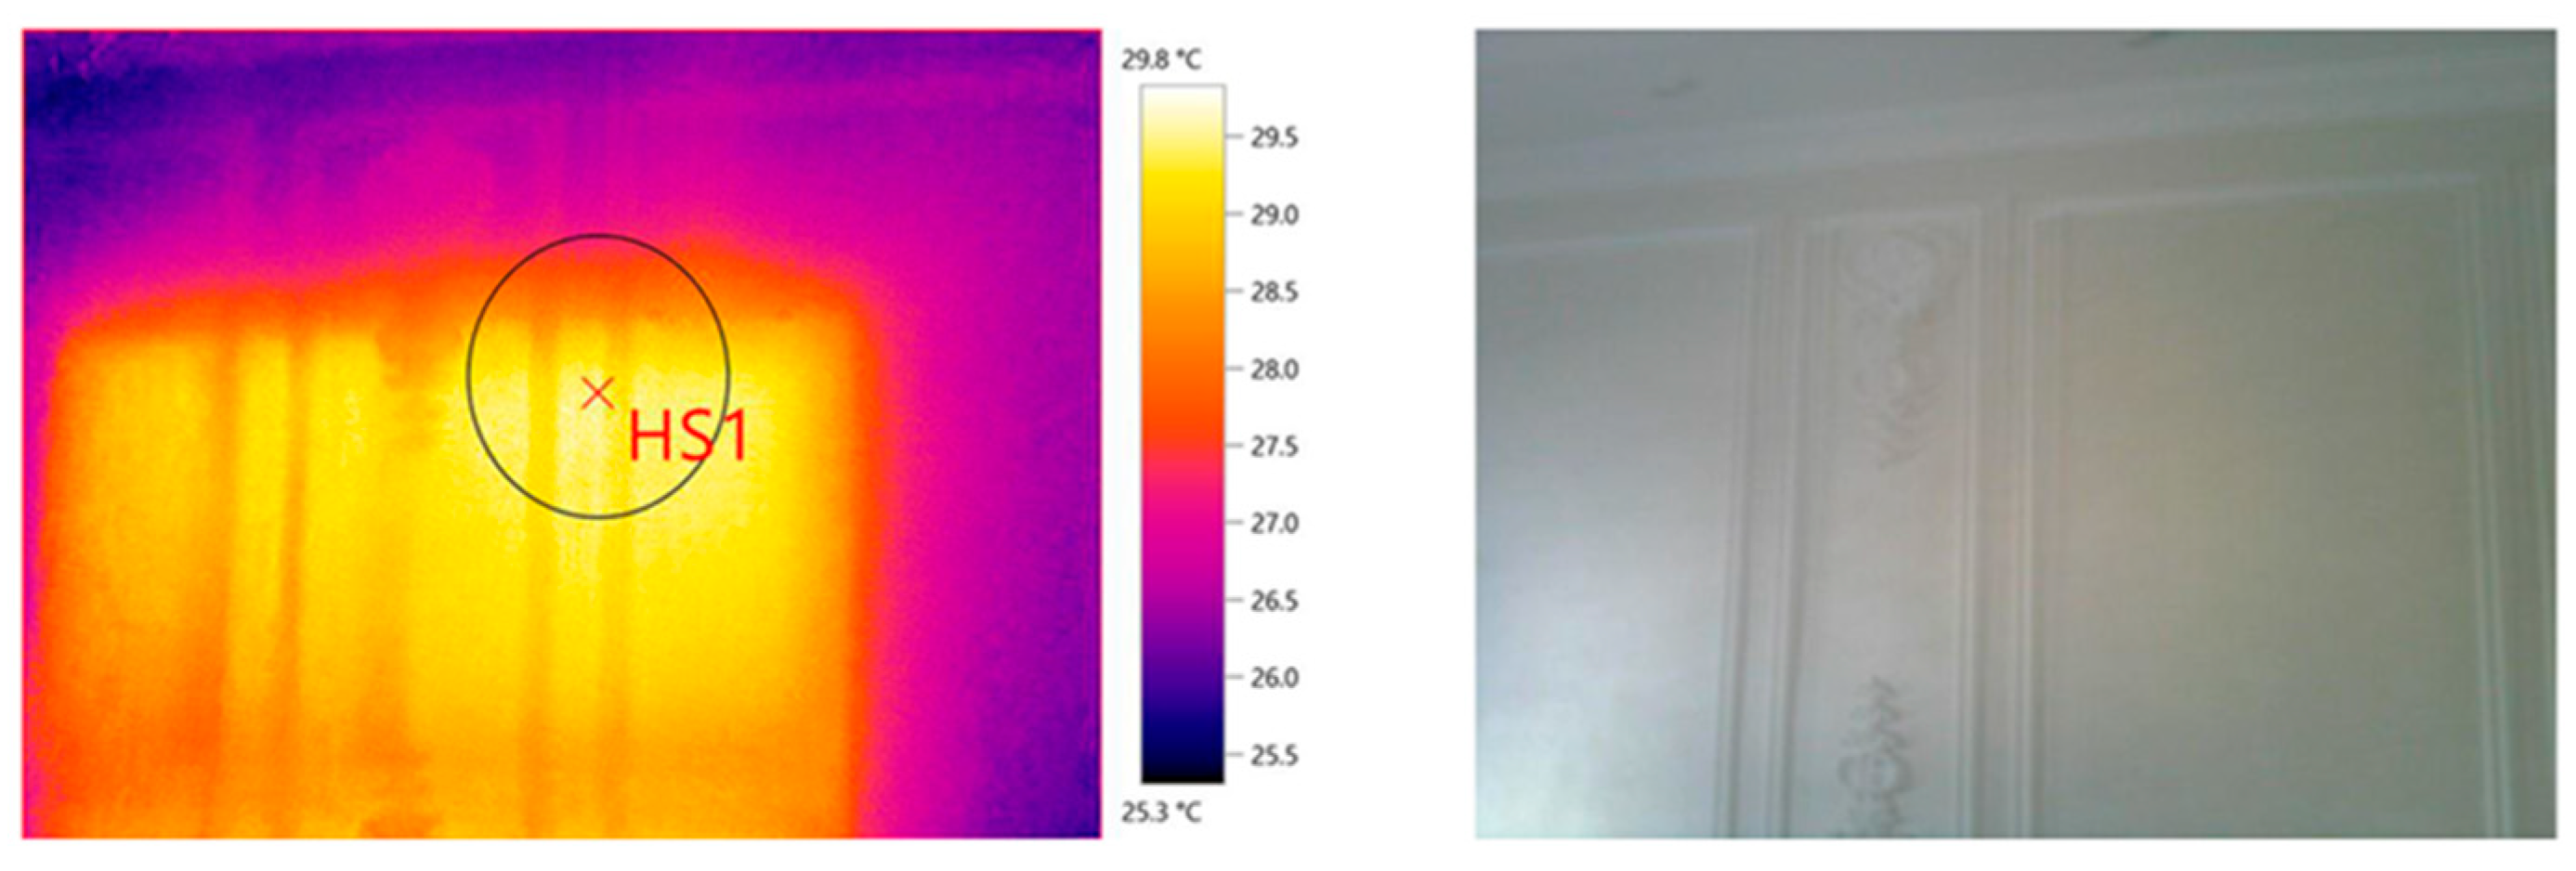
The audit of PC01 and PC02 reveals that the owner of one of the units modified one of the walls by closing the window using covenantal construction. However, the thermograph of the modified wall reveals that the thermal conductivity of the modified part differs from that of the original precast wall. The interior surface of the modified wall is at 29.5 °C versus 25.2 °C for the original wall. (see Figure 18).
The study detects several thermal bridges in the three construction systems, the most notable of which is the steel frames of the LGS system, for which IRT detects a temperature difference of 4.9 °C between the steel frame and the other parts of the structure. The other cases reveal thermal bridges at the wall-to-wall and wall-to-ceiling junctions despite the insulation provided, as shown in the as-built drawings. These results are consistent with the results of Aoul et al. [10], which reveal that thermal performance is strongly affected by the type of construction material used and by the thickness of the insulation. However, this leads to a higher interior average temperature for the LGS system than for the other systems: the average hotspot temperature for the LGS system is 27.9 °C versus 25.3 °C for the reinforced concrete system, and 23.6 °C for the precast system. Note that, heretofore, few studies have investigated the thermal performance of the LGS system used in UAE construction.

4.4. Annual Electricity Demand

The annual electricity demand for the three cases is shown in Table 2. Since all the cases have different areas, users, and typologies, we compare the average energy consumption of two units for each case. The table shows that the precast system consumes the least energy per unit area (0.19 kW/m2 versus 0.21 kW/m2 for the LGS system and 0.22 kW/m2 for the reinforced concrete system). This means that the precast system requires less electricity than the other two systems. Table 2 also shows the average interior hotspot for the three systems. The LGS system produces the highest average interior temperature, (27.9 °C), followed by reinforced concrete (25.3 °C), and finally precast concrete (23.6 °C).
Although the energy consumption per unit area (kW/m2) is minimal for the precast concrete system, these results depend on the overall consumption and user behavior regarding electricity use. In addition, the number of occupants is beyond the scope of this study. However, based on the present results, the precast system offers the best thermal performance of the three systems investigated, although the thermography results for the precast system still indicate thermal defects at the junction points, which is consistent with published results that also indicate thermal defects at the junction points for the precast system [10]. For the reinforced concrete system, the results reveal thermal defects at the junction points, which, based on the literature review and the as-built wall drawings, are related to the mortar joints between the concrete blocks.
Additionally, based on the average annual electricity bills and the average temperature of the interior hotspot, the present results show that the precast system provides the best thermal performance of the three systems. These results suggest a low rate of heat transferred across the thermal bridges in the precast system compared with the other two systems investigated. The LGS system performs better than the reinforced concrete system in terms of the average annual energy consumption, whereas the reinforced concrete system performs better than the LGS system in terms of the average interior hotspot temperature.

5. Conclusions

The aim of this research was (i) to compare the thermal performance of three construction systems in terms of thermal bridging and (ii) to understand the defects in the systems and how they affect the thermal performance of the system. The results show that, based on the average annual electricity bills and the average interior hotspot temperature, the precast system offers the best thermal performance of the three systems. These findings reflect a low rate of heat transferred across the thermal bridges in the precast system compared with the other two systems investigated. However, the LGS system outperforms the reinforced concrete system in terms of average annual energy consumption, whereas the reinforced concrete system outperforms the LGS in terms of average interior hotspot temperature. Further studies are needed to understand the implication and insulation solutions for the three systems and their effect on thermal performance.

References

  1. T. Barker, P. Ekins, and N. Johnstone, Global warming and energy demand. 1995.
  2. R. Broun and G. F. Menzies, “Life cycle energy and environmental analysis of partition wall systems in the UK,” Procedia Eng., vol. 21, pp. 864–873, 2011.
  3. Z. Zhou, C. Wang, X. Sun, F. Gao, W. Feng, and G. Zillante, “Heating energy saving potential from building envelope design and operation optimization in residential buildings: A case study in northern China,” J. Clean. Prod., vol. 174, pp. 413–423, 2018.
  4. A. Brás, F. Gonçalves, and P. Faustino, “Cork-based mortars for thermal bridges correction in a dwelling: Thermal performance and cost evaluation,” Energy Build., vol. 72, pp. 296–308, 2014.
  5. A. Al Amoodi and E. Azar, “Impact of human actions on building energy performance: A case study in the United Arab Emirates (UAE),” Sustainability, vol. 10, no. 5, 2018.
  6. G. Trotta, “Assessing energy efficiency improvements, energy dependence, and CO2 emissions in the European Union using a decomposition method,” Energy Effic., vol. 12, no. 7, pp. 1873–1890, 2019.
  7. I. Gerretsen, “Saudi Arabia pledges net zero by 2060, but no oil exit plan,” 2021. https://www.climatechangenews.com/2021/10/25/saudi-pledges-net-zero-2060-no-oil-exit-plan/#:~:text=Saudi Arabia has pledged to,the world’s leading oil producer.&text=Half of the country’s electricity,according to the updated plan (accessed Mar. 17, 2022).
  8. United Nations, “For a livable climate: Net-zero commitments must be backed by credible action.” https://www.un.org/en/climatechange/net-zero-coalition#:~:text=Through this UN-backed campaign,Off Air (accessed Mar. 17, 2022).
  9. X. Zhang, G.-J. Jung, and K.-N. Rhee, “Performance Evaluation of Thermal Bridge Reduction Method for Balcony in Apartment Buildings,” Buildings, vol. 12, no. 1, p. 63, 2022.
  10. K. A. T. Aoul, R. Hagi, R. Abdelghani, M. Syam, and B. Akhozheya, “Building envelope thermal defects in existing and under-construction housing in the UAE; infrared thermography diagnosis and qualitative impacts analysis,” Sustainability, vol. 13, no. 4, pp. 1–23, 2021.
  11. R. Hagi, K. A. T. Aoul, R. Abdelghani, B. Akhozheya, Y. Abdou, and N. Suleiman, “Thermal performance gap investigation using infrared thermal imagery in the UAE residential buildings,” 2019.
  12. M. A. Kadir, W. Lee, M. Jaafar, S. Sapuan, and A. Ali, “Construction performance comparison between conventional and industrialised building systems in Malaysia,” Struct. Surv., 2006.
  13. A. Al-Hajj and K. Hamani, “Material waste in the UAE construction industry: Main causes and minimization practices,” Archit. Eng. Des. Manag., vol. 7, no. 4, pp. 221–235, 2011.
  14. S. M. Wheeler, “Built landscapes of metropolitan regions: An international typology,” J. Am. Plan. Assoc., vol. 81, no. 3, pp. 167–190, 2015.
  15. G. Lahn, P. Stevens, and F. Preston, Saving oil and gas in the gulf. 2013.
  16. D. A. Steinhardt and W. Manley, KarenMiller, “Reshaping housing: the role of prefabricated systems,” 2013.
  17. R. Minunno, T. O’Grady, G. M. Morrison, R. L. Gruner, and M. Colling, “Strategies for applying the circular economy to prefabricated buildings,” Buildings, vol. 8, no. 9, 2018.
  18. M. Dave, B. Watson, and D. Prasad, “Performance and perception in prefab housing: An exploratory industry survey on sustainability and affordability,” Procedia Eng., vol. 180, pp. 676–686, 2017.
  19. M. R. Hosseini, I. Martek, E. K. Zavadskas, A. A. Aibinu, M. Arashpour, and N. Chileshe, “Critical evaluation of off-site construction research: A Scientometric analysis,” Autom. Constr., vol. 87, pp. 235–247, 2018.
  20. V. Ogyiri, “Comparative Cost Analysis of Precast and In Situ Concrete Floor Slabs in Ghana,” 2014.
  21. P. K. Priya and M. Neamitha, “A review on precast concrete,” Int. J. Eng. Technol., vol. 5, no. 1, 2018.
  22. S. T. Abey and K. Anand, “Embodied energy comparison of prefabricated and conventional building construction,” J. Inst. Eng. Ser. A, vol. 100, no. 4, pp. 777–790, 2019.
  23. M. Malik, Nabeel and Ahmad, Rafiq and Al-Hussein, “Generation of safe tool-paths for automatic manufacturing of light gauge steel panels in residential construction,” Autom. Constr., vol. 98, pp. 46–60, 2019.
  24. R. Mazumdar, “Construction activity can be fast tracked via LGS Construction Technology,” 2020. Construction Activity Can Be Fast-Tracked via LGS Construction Technology (accessed Mar. 17, 2022).
  25. H. E. S. Abdelghany, “Lifecycle Assessment LCA comparison for different prefabricated modular construction systems with the conventional construction system for affordable houses in Egypt,” 2017.
  26. A. P. Gomes, H. A. de Souza, and A. Tribess, “Impact of thermal bridging on the performance of buildings using Light Steel Framing in Brazil,” Appl. Therm. Eng., vol. 52, no. 1, pp. 84–89, 2013.
  27. E. Hamed, “Modeling, analysis, and behavior of load-carrying precast concrete sandwich panels,” J. Struct. Eng., vol. 142, no. 7, 2016.
  28. S. M. Bida, F. N. A. Abdul Aziz, M. S. Jaafar, F. Hejazi, and N. Abu Bakar, “Thermal Resistance of Insulated Precast Concrete Sandwich Panels,” Int. J. Concr. Struct. Mater., vol. 15, no. 1, pp. 1–12, 2021.
  29. P. Amin Einea, D. С. Salmon, G. J. Fogarasi, T. D. Culp, and M. K. Tadros, “State-of-the-art of precast concrete sandwich panels,” PCI J., vol. 36, no. 6, pp. 78–98, 1991.
  30. C. Martins, P. Santos, and L. Simoes da Silva, “Lighweight steel framed construction systems,” Contrib. Sustain. Build. to Meet EU, 2014.
  31. M. Ismaiel, Y. Chen, C. Cruz-Noguez, and M. Hagel, “Thermal resistance of masonry walls: a literature review on influence factors, evaluation, and improvement,” J. Build. Phys., 2021.
  32. M. F. Zedan, S. Al-Sanea, A. Al-Mujahid, and Z. Al-Suhaibani, “Effect of thermal bridges in insulated walls on air-conditioning loads using whole building energy analysis,” Sustainability, vol. 8, no. 6, 2016.
  33. A. Kylili, P. A. Fokaides, P. Christou, and S. A. Kalogirou, “Infrared thermography (IRT) applications for building diagnostics: A review,” Appl. Energy, vol. 134, pp. 531–549, 2014.
  34. F. Bianchi, A. L. Pisello, G. Baldinelli, and F. Asdrubali, “Infrared thermography assessment of thermal bridges in building envelope: Experimental validation in a test room setup,” Sustainability, vol. 6, no. 10, pp. 7107–7120, 2014.
  35. Y. K. Kim, L. Bande, K. A. Tabet Aoul, and H. Altan, “Dynamic energy performance gap analysis of a university building: Case studies at UAE university campus, UAE,” Sustainability, vol. 13, no. 1, p. 120, 2020.
  36. Climate-Data, “Al Ain Climate.” https://en.climate-data.org/asia/united-arab-emirates/abu-dhabi/al-ain-1210/ (accessed Mar. 17, 2022).
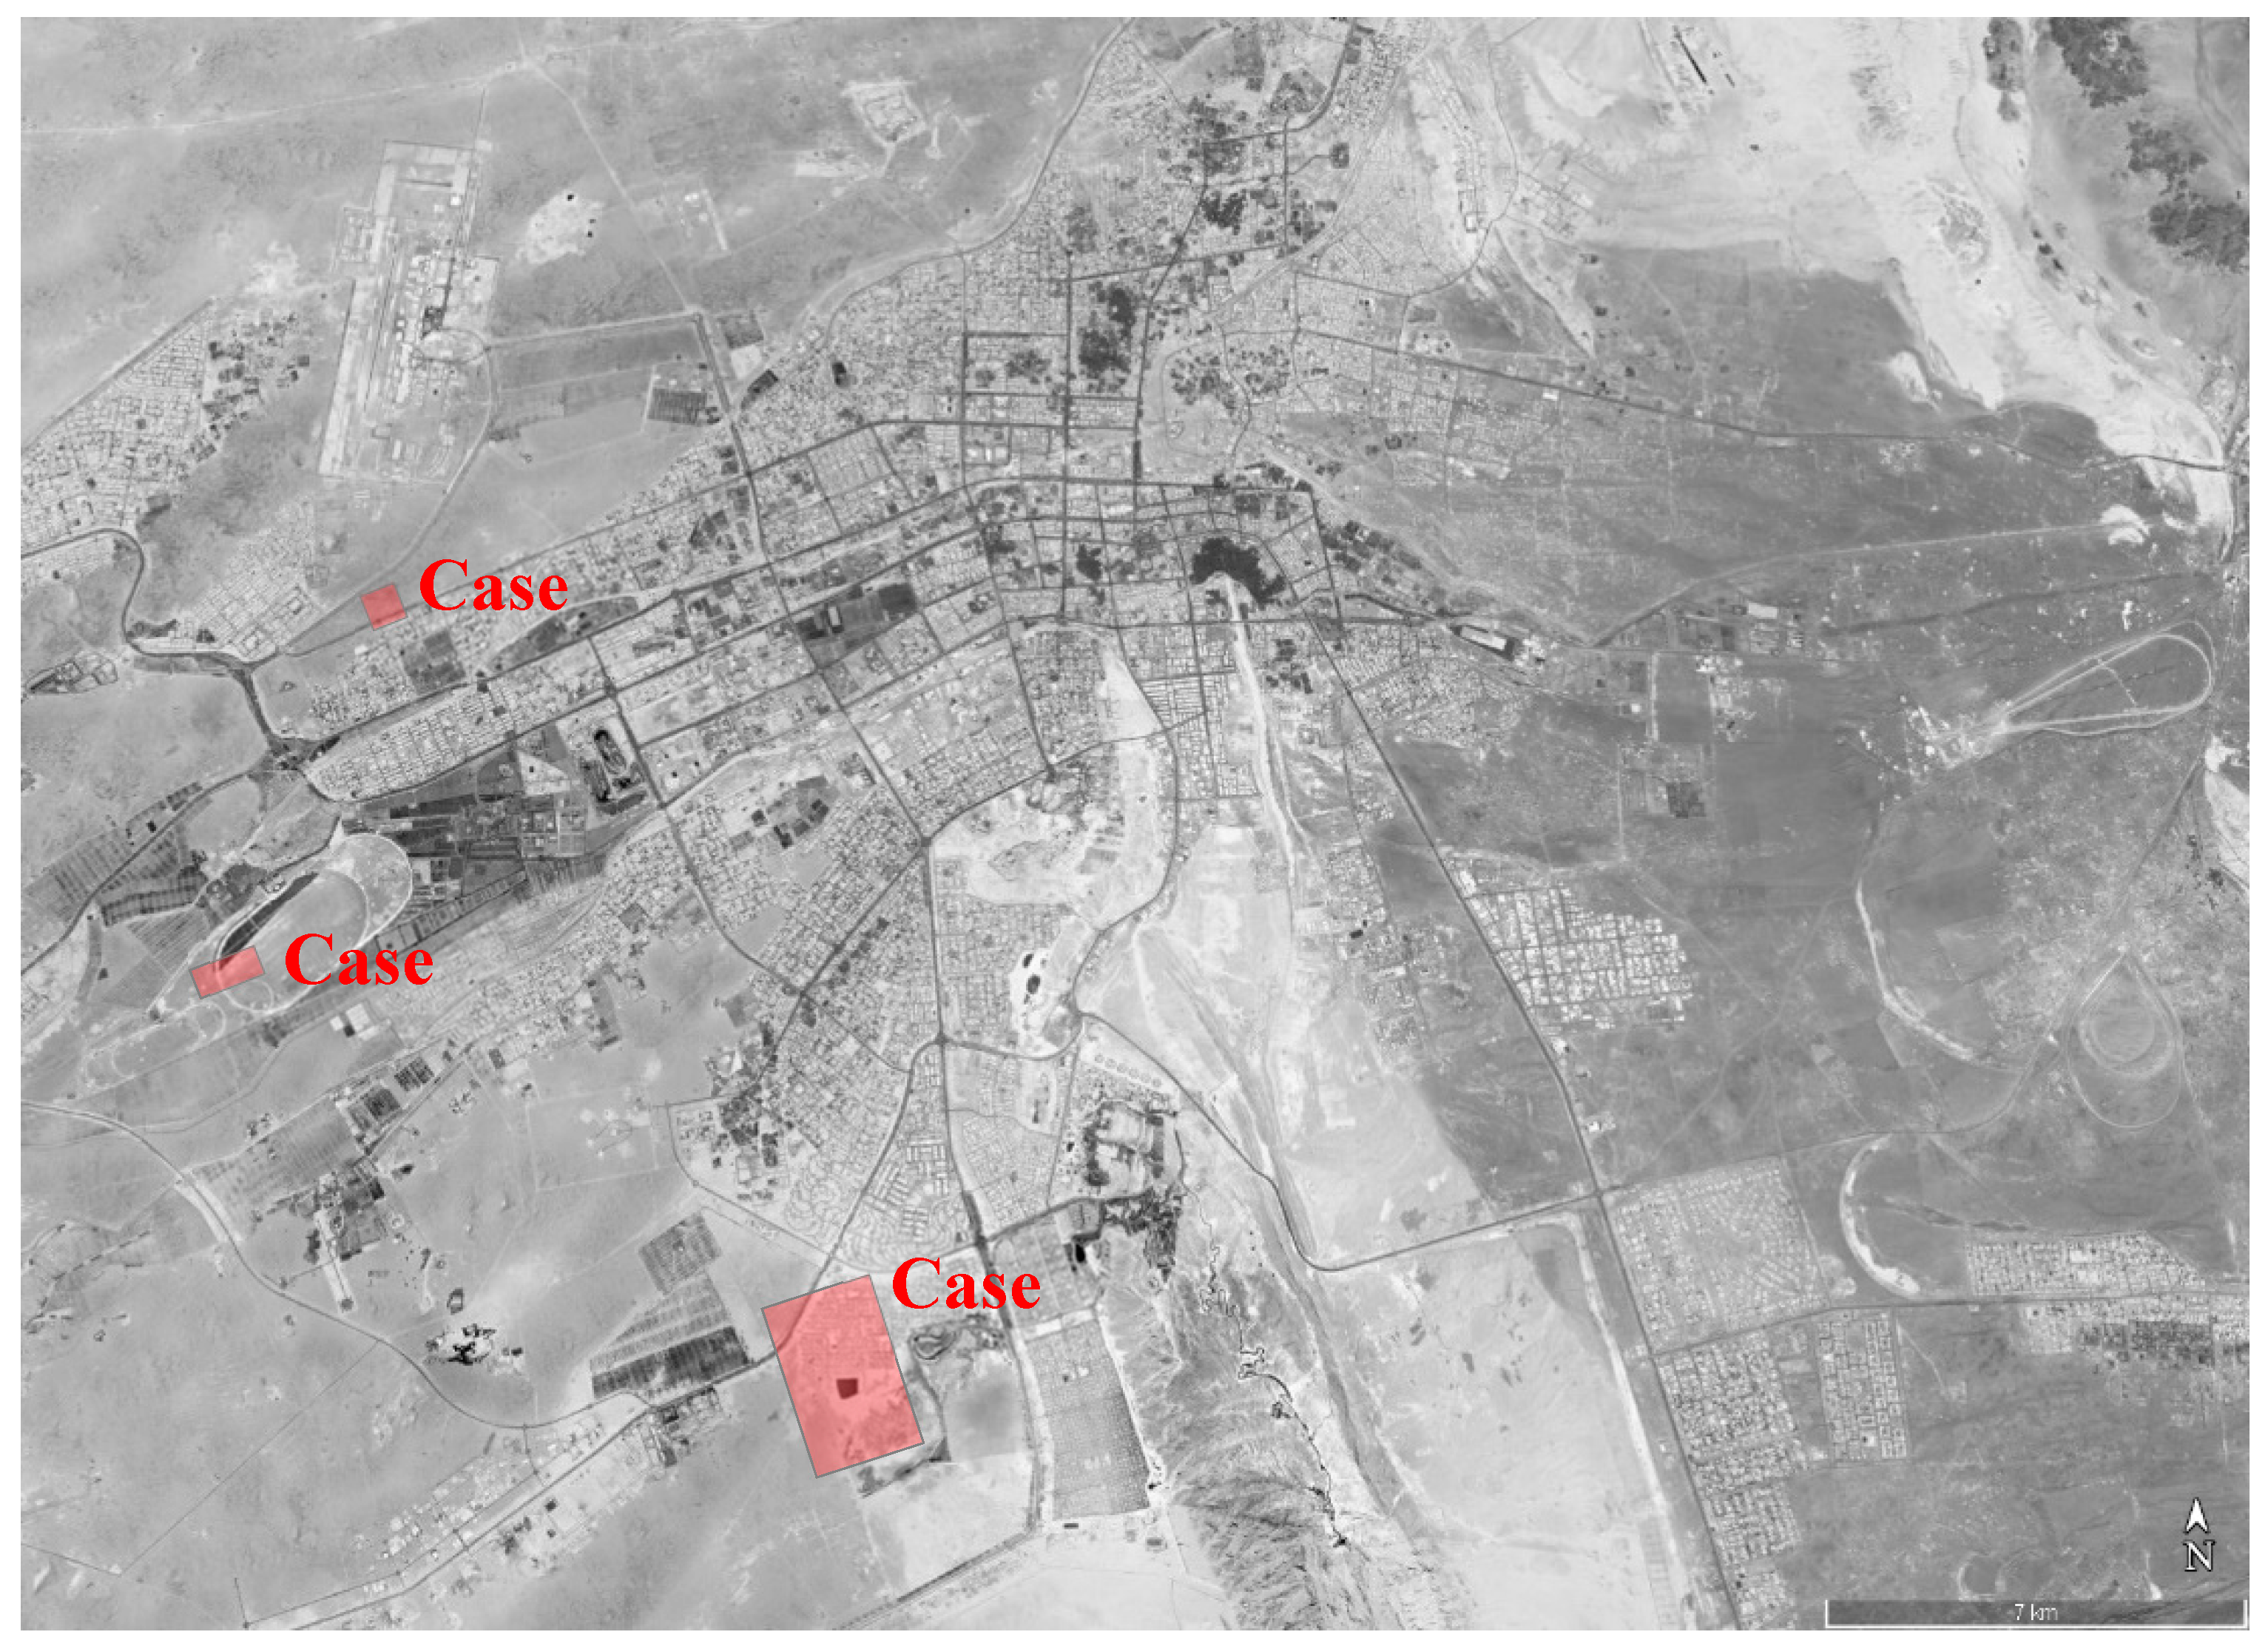
Figure 1. Satellite image of Al Ain City showing locations of case studies. Image retrieved from Google Maps on November 7, 2021. Case (1): Wadeema complex, case (2): Al Shuaiba Residential Villas, and case (3): Jabel Hafeet Residential Villas.
Preprints 92739 g001
Figure 2. Location of research samples and architectural plans.
Preprints 92739 g002
Figure 3. Infrared thermography for LC01 southern interior wall shows the temperature difference between the LGS frames and the other structural material of the wall. The temperature of the LGS frame is 27.3 °C at the hotspot, whereas the temperature of the remaining wall is 24.5 °C. The thermal image was taken on November 5, 2021 at 1:15 pm local time.
Preprints 92739 g003
Figure 4. Infrared thermography for LC02 southern interior wall shows the temperature difference between the LGS frames and the other structural material of the wall. The temperature of the LGS frame is 27.4 °C at the hotspot, whereas the temperature of the remaining wall is 25.6 °C. The thermal image was taken on November 5, 2021 at 1:30 pm local time.
Preprints 92739 g004
Figure 5. Left: Detailed drawing of as-built exterior wall. Right: Detailed drawing of wall-to-wall junction.
Preprints 92739 g005
Figure 6. Thermal image of southwest corner of LC01 unit shows the temperature difference between corner junctions and the other parts of the same wall. The temperature at the junction is 27.4 °C, whereas the rest of the wall is at 25.3 °C. The thermal image was taken on November 5, 2021 at 1:30 pm local time.
Preprints 92739 g006
Figure 7. Thermal image of southwest corner of LC02 unit shows the temperature difference between corner junctions and the other parts of the same wall. The temperature at the junction is 27.9 °C, whereas the rest of the wall is at 24.5 °C. The thermal image was taken on November 5, 2021 at 1:15 pm local time.
Preprints 92739 g007
Figure 8. Thermal image of southern interior wall of RC01. The temperature of the hot spot is 25.9 °C. The thermal image was taken on November 17, 2021 at 12:45 pm local time.
Preprints 92739 g008
Figure 9. Thermal image of southern interior wall of RC02. The temperature of the hotspot is 25.7 °C. The thermal image was taken on November 17, 2021 at 1:00 pm local time.
Preprints 92739 g009
Figure 10. Detailed drawing of as-built exterior wall.
Preprints 92739 g010
Figure 11. Thermal image of southwest wall of RC01 showing a temperature difference between the concrete wall-to-wall and wall-to-ceiling joints. The temperature at the hot spot is 24.1 °C. The thermal image was taken on November 17, 2021 at 12:45 pm.
Preprints 92739 g011
Figure 12. Thermal image of southwest wall of RC02 showing a temperature difference between the concrete wall-to-wall and wall-to-ceiling joints. The temperature at the hotspot is 25.1 °C. The thermal image was taken on November 17, 2021 at 1:00 pm.
Preprints 92739 g012
Figure 13. Thermal image of interior of southern wall for PC01. The temperature of the interior of the wall is 25 °C. The thermal image was taken on November 17, 2021 at 1:30 pm local time.
Preprints 92739 g013
Figure 14. Thermal image of interior of southern wall for PC02. The temperature of the interior of the wall is 25 °C. The thermal image was taken on November 17, 2021 at 1:45 pm local time.
Preprints 92739 g014
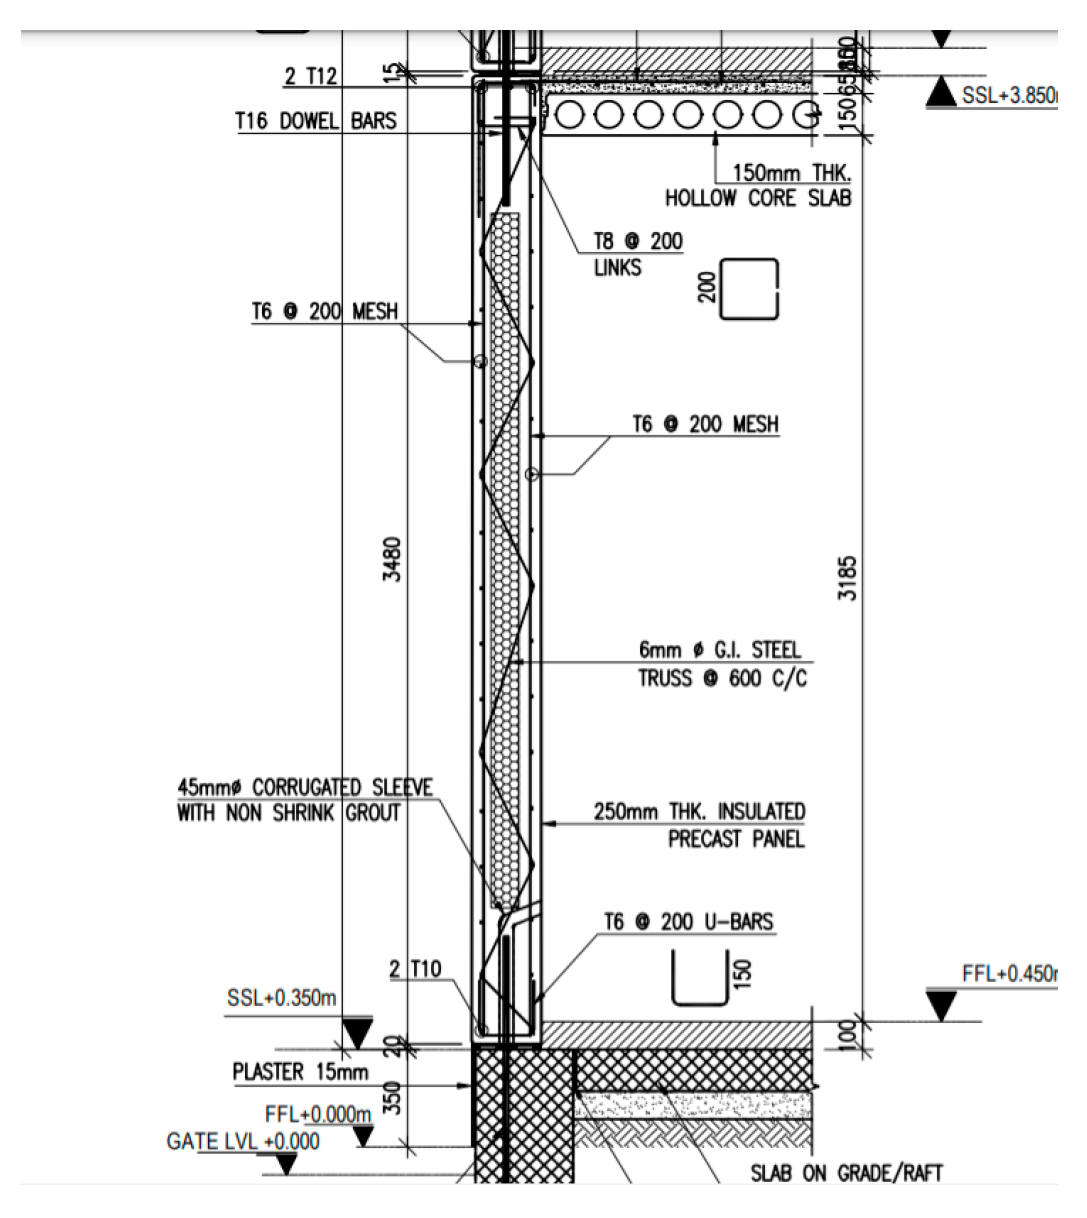
Figure 15. Detailed drawing of as-built exterior precast wall of both PC01 and PC02.
Preprints 92739 g015
Figure 16. Thermal image of southwest corner of PC01 shows a temperature difference between the wall-to-wall and wall-to-ceiling joints and the rest of the wall. The thermal image was taken on November 17, 2021 at 1:30 pm local time.
Preprints 92739 g016
Figure 17. Thermal image of southwest corner of PC02 shows a temperature difference between the wall-to-wall and wall-to-ceiling joints and the rest of the wall. The thermal image was taken on November 17, 2021 at 1:45 pm local time.
Preprints 92739 g017
Figure 18. Thermal image of interior of southern wall in unit PC01. The thermal image was taken on No-vember 17, 2021 at 1:30 pm local time.
Preprints 92739 g018
Table 1. Characteristics of residential units at each site.
Case Area Construction Sample#break#units Construction information HVAC Construction year
1 164.7 m2 LGS system 2 (LC01)#break#(LC02) Attached units – residential compound, two-bedroom apartment Duct Unit; set point temperature 21 °C 2014
2 525.7 m2 Reinforced#break#Concrete 2 (RC01)#break#(RC02) Single-family house, two#break#levels Split unit. set point temperature 21 °C 2016
3 476.2 m2 Precast concrete (PC) 2 (PC01)#break#(PC02) Single-family house, two#break#levels Split unit. set point temperature 21 °C 2017
Table 2. Annual average energy consumption.
Case Area System Average Annual Demand Consumption/Area Average Interior Hotspot Temperature
1 164.7 m2 LGS System 35.7 kW 0.21 kW/m2 27.9 °C
2 525.7 m2 Reinforced concrete 119.3 kW 0.22 kW/m2 25.3 °C
3 476.2 m2 Precast concrete (PC) 93.1 kW 0.19 kW/m2 23.6 °C
Disclaimer/Publisher’s Note: The statements, opinions and data contained in all publications are solely those of the individual author(s) and contributor(s) and not of MDPI and/or the editor(s). MDPI and/or the editor(s) disclaim responsibility for any injury to people or property resulting from any ideas, methods, instructions or products referred to in the content.
Copyright: This open access article is published under a Creative Commons CC BY 4.0 license, which permit the free download, distribution, and reuse, provided that the author and preprint are cited in any reuse.
Prerpints.org logo

Preprints.org is a free preprint server supported by MDPI in Basel, Switzerland.

Subscribe

© 2024 MDPI (Basel, Switzerland) unless otherwise stated