Submitted:
11 December 2023
Posted:
12 December 2023
You are already at the latest version
Abstract
Keywords:
1. Introduction
2. Materials and Methods
| Flight 1 | Flight 2 | Flight 3 | Flight 4 | |
| Ijaci | V5 | VT | R3 | R5 |
| Lavras | V5 | V10 | VT | R3 |
| Nazareno | V8 | VT | R4 | R6 |
3. Results and discussion
4. Conclusions
Author Contributions
Funding
Data Availability Statement
Acknowledgments
Conflicts of Interest
References
- CHIPINDU, L. , MUPANGWA, W., MTSILIZAH, J., NYAGUMBO, I. & ZAMAN-ALLAH, M. (2020). Maize Kernel Abortion Recognition and Classification Using Binary Classification Machine Learning Algorithms and Deep Convolutional Neural Networks. Ai, v. 1, n. 3, p. 361–375. [CrossRef]
- CRUZ, C. D. GENES (2013). A software package for analysis in experimental statistics and quantitative genetics. Acta Scientiarum. v.35, n.3, p.271-276. [CrossRef]
- DI GENNARO, S. F. , RIZZA, F., BADECK, F. W., BERTON, A., DELBONO, S., GIOLI, B., TOSCANO, P., ZALDEI, A., & MATESE, A. (2018). UAV-based high-throughput phenotyping to discriminate barley vigour with visible and near-infrared vegetation indices. International Journal of Remote Sensing, v. 39, n. 15–16, p. 5330–5344. [CrossRef]
- GARCÍA-MARTÍNEZ, H. , FLORES-MAGDALENO, H., ASCENCIO-HERNÁNDEZ, R., KHALIL-GARDEZI, A., TIJERINA-CHÁVEZ, L., MANCILLA-VILLA, O. R. & VÁZQUEZ-PEÑA, M. A. (2020). Corn grain yield estimation from vegetation indices, canopy cover, plant density, and a neural network using multispectral and rgb images acquired with unmanned aerial vehicles. Agriculture, v. 10, n. 7, p. 1–24. [CrossRef]
- GITELSON, A. A. , KAUFMAN, Y. J., STARK, R. & RUNDQUIST, D. (2002). Novel algorithms for remote estimation of vegetation fraction. Remote Sensing of Environment, v. 80, n. 1, p. 76–87. [CrossRef]
- HUBER, P. J. (1973). “Robust Regression: Asymptotics, Conjecture, and Monte Carlo.” Annals of Statistics 1:799–821. https://www.jstor. 2958. [Google Scholar]
- HUBER, P. J. , & RONCHETTI, E. M. (2009). Robust Statistics. 2nd ed. New York: John Wiley & Sons.
- JANNOURA, R. , BRINKMANN, K., UTEAU, D., BRUNS, C. & GEORG, R. (2014). ScienceDirect Monitoring of crop biomass using true colour aerial photographs taken from a remote controlled hexacopter. Biosystems Engineering, v. 129, p. 341–351. [CrossRef]
- KEFAUVER, S. C. , EL-HADDAD, G., VERGARA-DIAZ, O. & ARAUS, J. L. (2015). RGB picture vegetation indexes for High-Throughput Phenotyping Platforms (HTPPs). Remote Sensing for Agriculture, Ecosystems, and Hydrology XVII, v. 9637, n. October, p. 96370J. [CrossRef]
- KIENBAUM, L. , CORREA ABONDANO, M., BLAS, R. & SCHMID, K. (2021). DeepCob: Precise and high-throughput analysis of maize cob geometry using deep learning with an application in genebank phenomics. bioRxiv, p. 2021.03.16.435660.
- KOMYSHEV, E.; GENAEV, M.; AFONNIKOV, D. (2017). Evaluation of the SeedCounter, a mobile application for grain phenotyping. Frontiers in Plant Science, v. 7, n. January, p. 1–9. [CrossRef]
- LI, B. , XU, X., HAN, J., ZHANG, L., BIAN, C., JIN, L. & LIU, J. (2019). The estimation of crop emergence in potatoes by UAV RGB imagery. Plant Methods, v. 15, n. 1, p. 1–13. [CrossRef]
- LI, Y. , WEN, W., GUO, X.; YU, Z.; GU, S.; YAN, H. & ZHAO, C. (2021). High-throughput phenotyping analysis of maize at the seedling stage using end-to-end segmentation network. PLoS ONE, v. 16, n. 1 January, p. 1–19. [CrossRef]
- LIANG, X. , WANG, K., HUANG, C., ZHANG, X., YAN, J. & YANG, W. (2016). A high-throughput maize kernel traits scorer based on line-scan imaging. Measurement: Journal of the International Measurement Confederation, v. 90, p. 453–460. [CrossRef]
- LOUHAICHI, M. , BORMAN, M. M. & JOHNSON, D. E. (2001). Spatially located platform and aerial photography for documentation of grazing impacts on wheat. Geocarto International, v. 16, n. 1, p. 65–70. [CrossRef]
- LU, N. , ZHOU, J., HAN, Z., LI, D., CAO, Q., YAO, X., TIAN, Y., ZHU, Y., CAO, W. & CHENG, T. (2019). Improved estimation of aboveground biomass in wheat from RGB imagery and point cloud data acquired with a low-cost unmanned aerial vehicle system. Plant Methods, v. 15, n. 1, p. 1–16. [CrossRef]
- MAIMAITIJIANG, M. , GHULAM, A., PAHEDING, S. & HARTLING, S. (2017). Unmanned aerial system (UAS) - based phenotyping of soybean using multi- sensor data fusion and extreme learning machine. ISPRS Journal of Photogrammetry and Remote Sensing, v. 134, p. 43–58.
- MAIMAITIJIANG, M.; SAGAN, V.; SIDIKE, P.; HARTLING, S.; ESPOSITO, F.; FRITSCHI, F. B. (2020). Soybean yield prediction from UAV using multimodal data fusion and deep learning. Remote Sensing of Environment, v. 237, February, 111599. [CrossRef]
- MAKANZA, R. , ZAMAN-ALLAH, M., CAIRNS, J. E., EYRE, J., BURGUEÑO, J., PACHECO, Á., DIEPENBROCK, C., MAGOROKOSHO, C., TAREKEGNE, A., OLSEN, M. & PRASANNA, B. M. (2018). High-throughput method for ear phenotyping and kernel weight estimation in maize using ear digital imaging. Plant Methods, v. 14, n. 1, p. 1–13. [CrossRef]
- MATIAS, F. I. , CARAZA-HARTER, M. V. & ENDELMAN, J. B. (2020). FIELDimageR : An R package to analyze orthomosaic images from agricultural field trials. The Plant Phenome Journal, n. 19, p. 1–6. 20 November. [CrossRef]
- MEYER, G. E. & NETO, J. C. (2008). Verification of color vegetation indices for automated crop imaging applications. Computers and Electronics in Agriculture, v. 63, n. 2, p. 282–293. [CrossRef]
- MILLER, N. D. , HAASE, N. J., LEE, J., KAEPPLER, S. M., DE LEON, N. & SPALDING, E. P. (2017). A robust, high-throughput method for computing maize ear, cob, and kernel attributes automatically from images. Plant Journal, v. 89, n. 1, p. 169–178. [CrossRef]
- MOREIRA, F. F. , OLIVEIRA, H. R., VOLENEC, J. J., RAINEY, K. M., & BRITO, L. F. (2020). Integrating High-Throughput Phenotyping and Statistical Genomic Methods to Genetically Improve Longitudinal Traits in Crops. Frontiers in Plant Science, v. 11, n. May, p. 1–18. [CrossRef]
- PIMENTEL-GOMES, F. P. (2009). Curso de estatística experimental. (15th ed.) Piracicaba. p. 451.
- R Core Team (2021). R: A language and environment for statistical computing. R Foundation for Statistical Computing, Vienna, Austria. URL https://www.R-project.org/.
- RAMOS, F. T. , FERREIRA, L. S., PIVETTA, F. & MAIA, J. C. S. (2015). Leaf blade area of different plants estimated by linear and dry matter measures, calibrated with the ImageJ software. V.40, N.8 p. 570-575.
- RESENDE, E. L. , PINHO, R. G. V., SILVA, E. V. V., MASSITELA, J. J., DE SOUZA, V. F. & SOUZA, J. L. D. (2020). Mean components for choosing maize populations to extract inbred lines. Ciencia e Agrotecnologia, v. 44, p. 1–7. [CrossRef]
- RESENDE, M. D. V. de & DUARTE, J. B. (2007). Precisão E Controle De Qualidade Em Experimentos De Avaliação De Cultivares. Pesquisa Agropecuária Tropical, v. 37, n. 3, p. 182–194. [CrossRef]
- SAKAMOTO, T. , GITELSON, A. A., NGUY-ROBERTSON, A. L., ARKEBAUER, T. J., WARDLOW, B. D., SUYKER, A. E., VERMA, S. B. & SHIBAYAMA, M. (2012). Agricultural and Forest Meteorology An alternative method using digital cameras for continuous monitoring of crop status. Agricultural and Forest Meteorology, v. 154–155, p. 113–126. [CrossRef]
- SCOTT, A.J. & KNOTT, M. (1974). A cluster analysis method for grouping means in the analysis of variance. Biometrics, Washington, v.30, n.3, p.507-512, 1974.
- SONG, P. , WANG, J., GUO, X., YANG, W. & ZHAO, C. (2021) High-throughput phenotyping: Breaking through the bottleneck in future crop breeding. Crop Journal, v. 9, n. 3, p. 633–645. [CrossRef]
- TEWES, A. & SCHELLBERG, J. (2018). Towards remote estimation of radiation use efficiency in maize using UAV-based low-cost camera imagery. Agronomy, v. 8, n. 2, p. 1–15. [CrossRef]
- TUCKER, C. J. (1979). Red and photographic infrared linear combinations for monitoring vegetation. Remote Sensing of Environment, v. 8, n. 2, p. 127–150. [CrossRef]
- VIAN, A. L. , BREDEMEIER, C., REGIS, P., DA, F., SANTI, A. L., PAZ, C. & SILVA, D. A. (2018). Critical limits of ndvi for yield potential estimation in maize. (In Portuguese, with English abstract.). Revista Brasileira de Milho e Sorgo, v. 17 n. 1, p. 91-100. [CrossRef]
- WARMAN, C. , SULLIVAN, C. M., PREECE, J.; BUCHANAN, M. E., VEJLUPKOVA, Z., JAISWAL, P. & FOWLER, J. E. A. (2021). Cost-effective maize ear phenotyping platform enables rapid categorization and quantification of kernels. Plant Journal, v. 106, n. 2, p. 566–579. [CrossRef]
- WU, D. , CAI, Z., HAN, J. & QIN, H. (2020). Automatic kernel counting on maize ear using RGB images. Plant Methods, v. 16, n. 1, p. 1–15. https://10.1186/s13007-020-00619-z. [CrossRef]
- YU, N. , LI, L., SCHMITZ, N., TIAN, L. F., GREENBERG, J. A. & DIERS, B. W. (2016). Remote Sensing of Environment Development of methods to improve soybean yield estimation and predict plant maturity with an unmanned aerial vehicle based platform. Remote Sensing of Environment, v. 187, p. 91–101. https://10.1016/j.rse.2016.10.005. [CrossRef]
- ZHANG, H. , LU, Y., MA, Y., FU, J. & WANG, G. (2021). Genetic and molecular control of grain yield in maize. Molecular Breeding, v. 41, n. 3. https://10.1007/s11032-021-01214-3. [CrossRef]
- ZHOU, X. , ZHENG, H. B., XU, X. Q., HE, J. Y., GE, X. K., YAO, X., CHENG, T., ZHU, Y., CAO, W. X. & TIAN, Y. C. (2017). Predicting grain yield in rice using multi-temporal vegetation indices from UAV-based multispectral and digital imagery. ISPRS Journal of Photogrammetry and Remote Sensing, v. 130, p. 246–255. https://10.1016/j.isprsjprs.2017.05.003. [CrossRef]


| Hybrids AB | AB Mean | Hybrids CD | CD Mean |
|---|---|---|---|
| RB 9077 | 12156a | RB 9077 | 12930a |
| DKB 230 | 10623a | DKB 230 | 11151a |
| HybridAB 2 | 9707b | HybridCD 2 | 7445b |
| HybridAB 1 | 9559b | HybridCD 1 | 10235a |
| HybridAB 4 | 9468b | HybridCD 4 | 8242b |
| HybridAB 5 | 9466b | HybridCD 5 | 8711b |
| HybridAB 6 | 9363b | HybridCD 6 | 6236b |
| HybridAB 3 | 8868b | HybridCD 3 | 8732b |
| Hybrid AB | 8306b | Hybrid AB | 10108a |
| Hybrid CD | 6739b | Hybrid CD | 7525b |
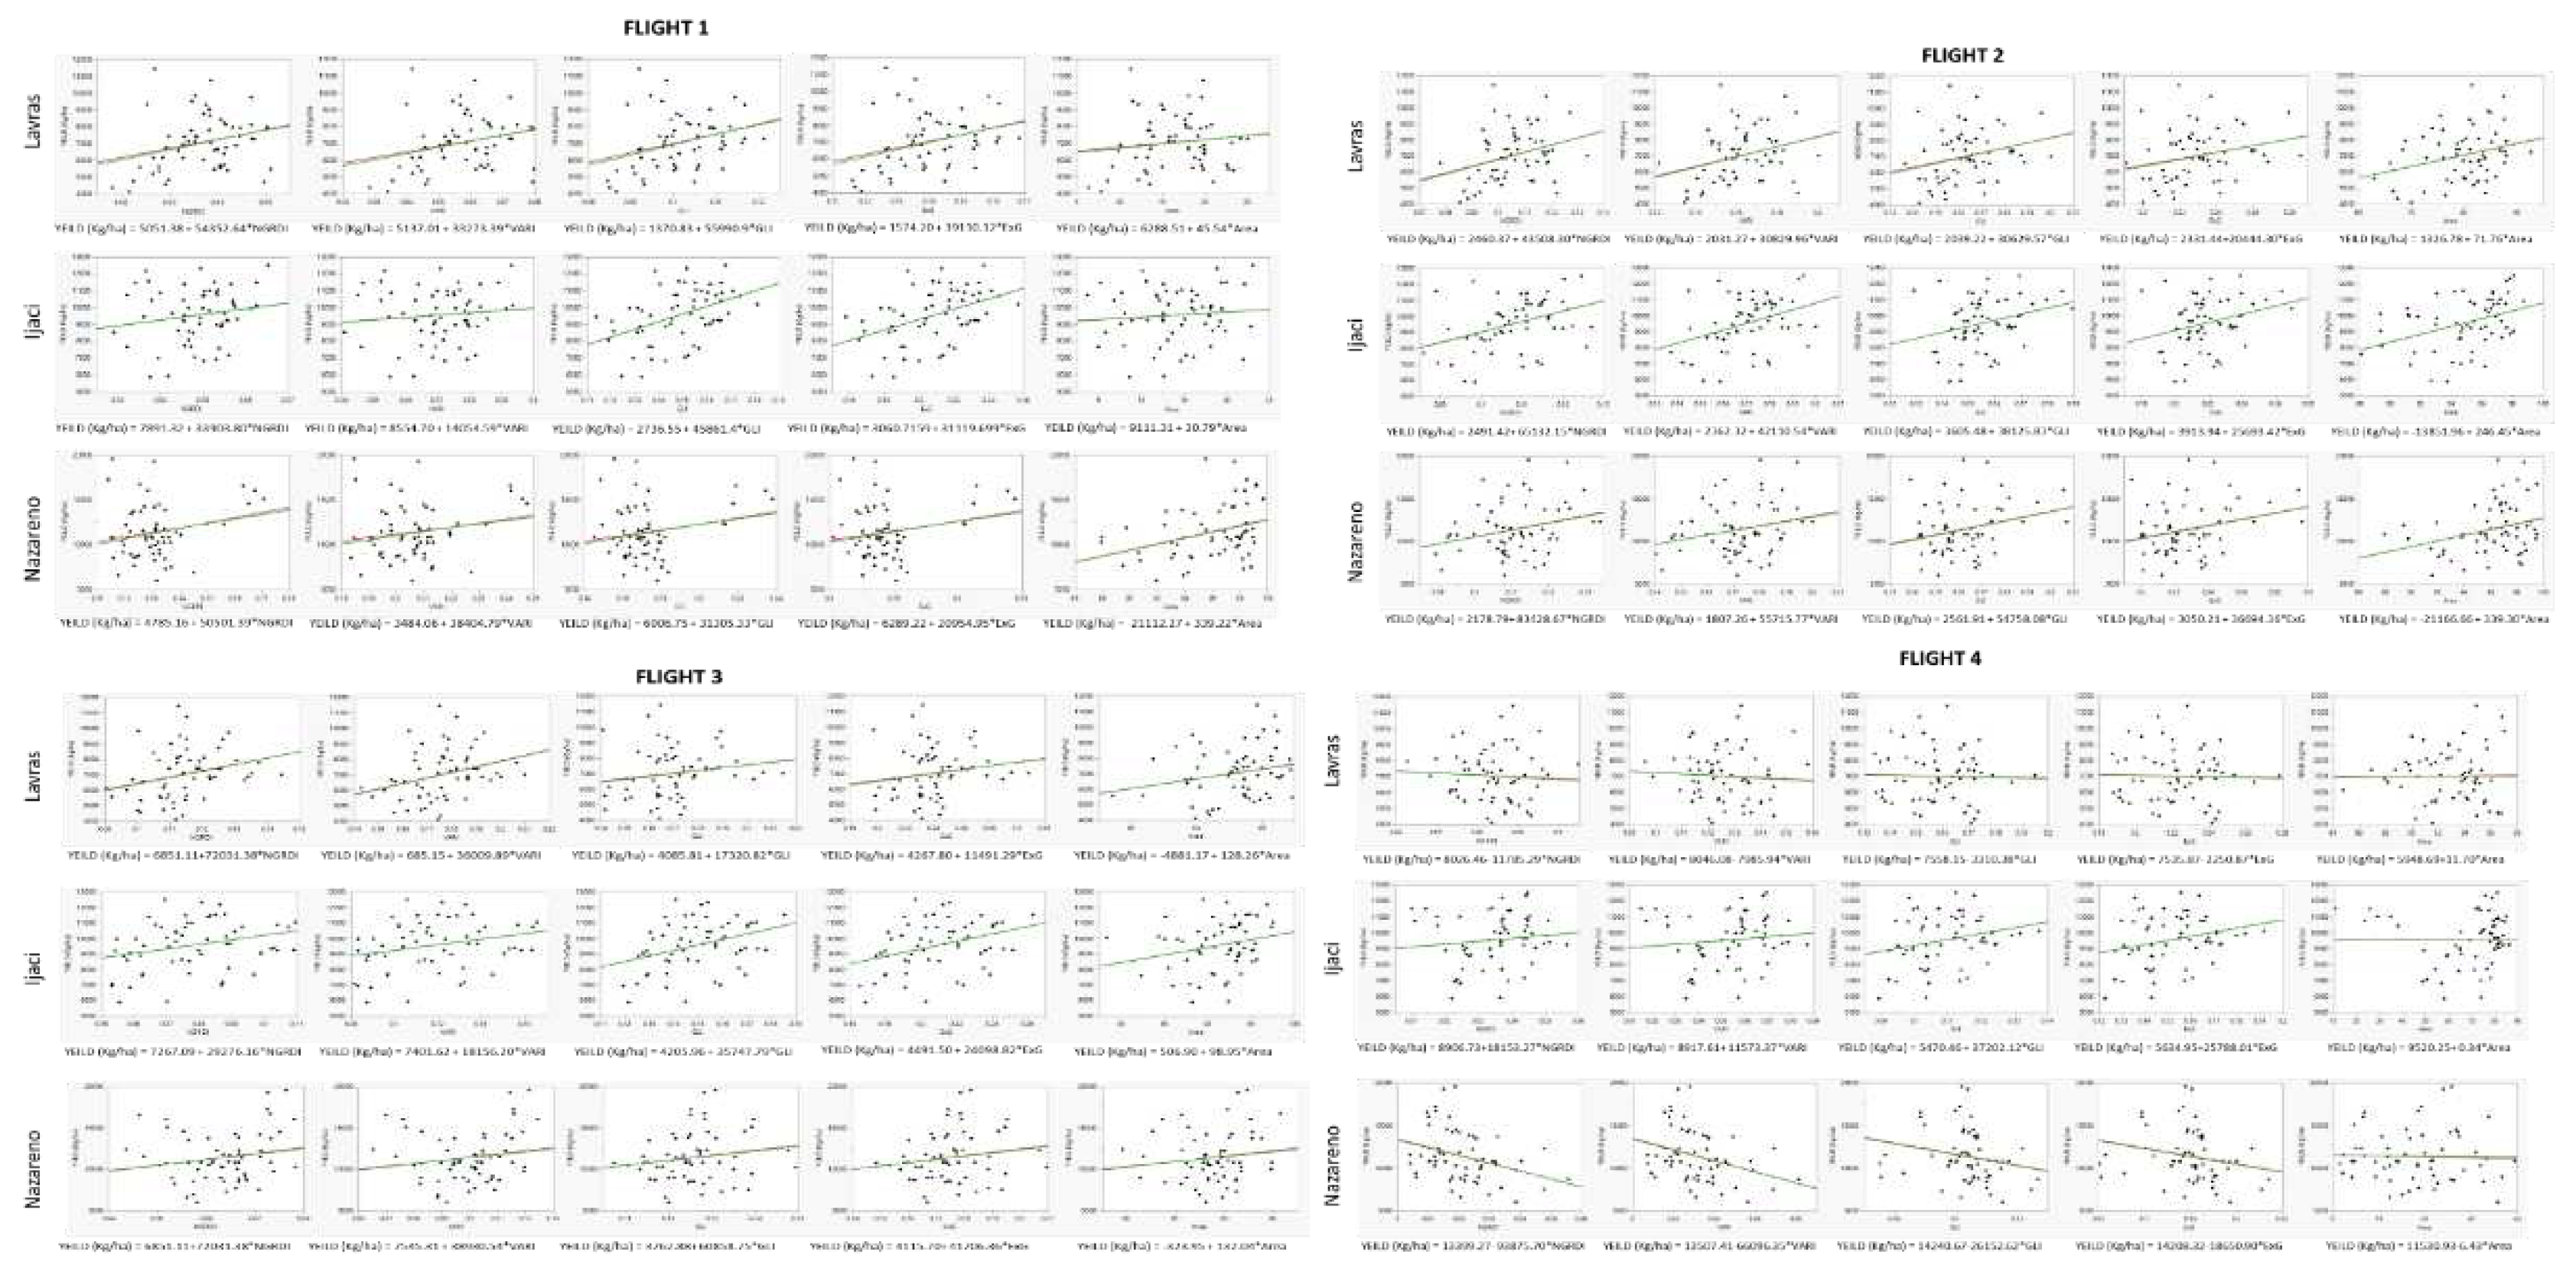
| Flight 1 | Flight 2 | |||||||||
| NGRDI | VARI | GLI | ExG | Area | NGRDI | VARI | GLI | ExG | Area | |
| Lavras | 0.07* | 0.05 | 0.09* | 0.09* | 0.02 | 0.09* | 0.09* | 0.07* | 0.07* | 0.09** |
| Ijaci | 0.03 | 0.01 | 0.19** | 0.19** | 0.01 | 0.14* | 0.14** | 0.08* | 0.06* | 0.15** |
| Nazareno | 0.04 | 0.03 | 0.02 | 0.04* | 0.11** | 0.07* | 0.06* | 0.07* | 0.07* | 0.09** |
| Flight 3 | Flight 4 | |||||||||
| NGRDI | VARI | GLI | ExG | Area | NGRDI | VARI | GLI | ExG | Area | |
| Lavras | 0.08** | 0.10** | 0.03 | 0.03 | 0.05 | 0.003 | 0.004 | 0.001 | 0.001 | 0.0003 |
| Ijaci | 0.08* | 0.07* | 0.12** | 0.13** | 0.06 | 0.02 | 0.01 | 0.06* | 0.06* | 0.00 |
| Nazareno | 0.04 | 0.03 | 0.03 | 0.03 | 0.02 | 0.12** | 0.12** | 0.05 | 0.05 | 0.001 |
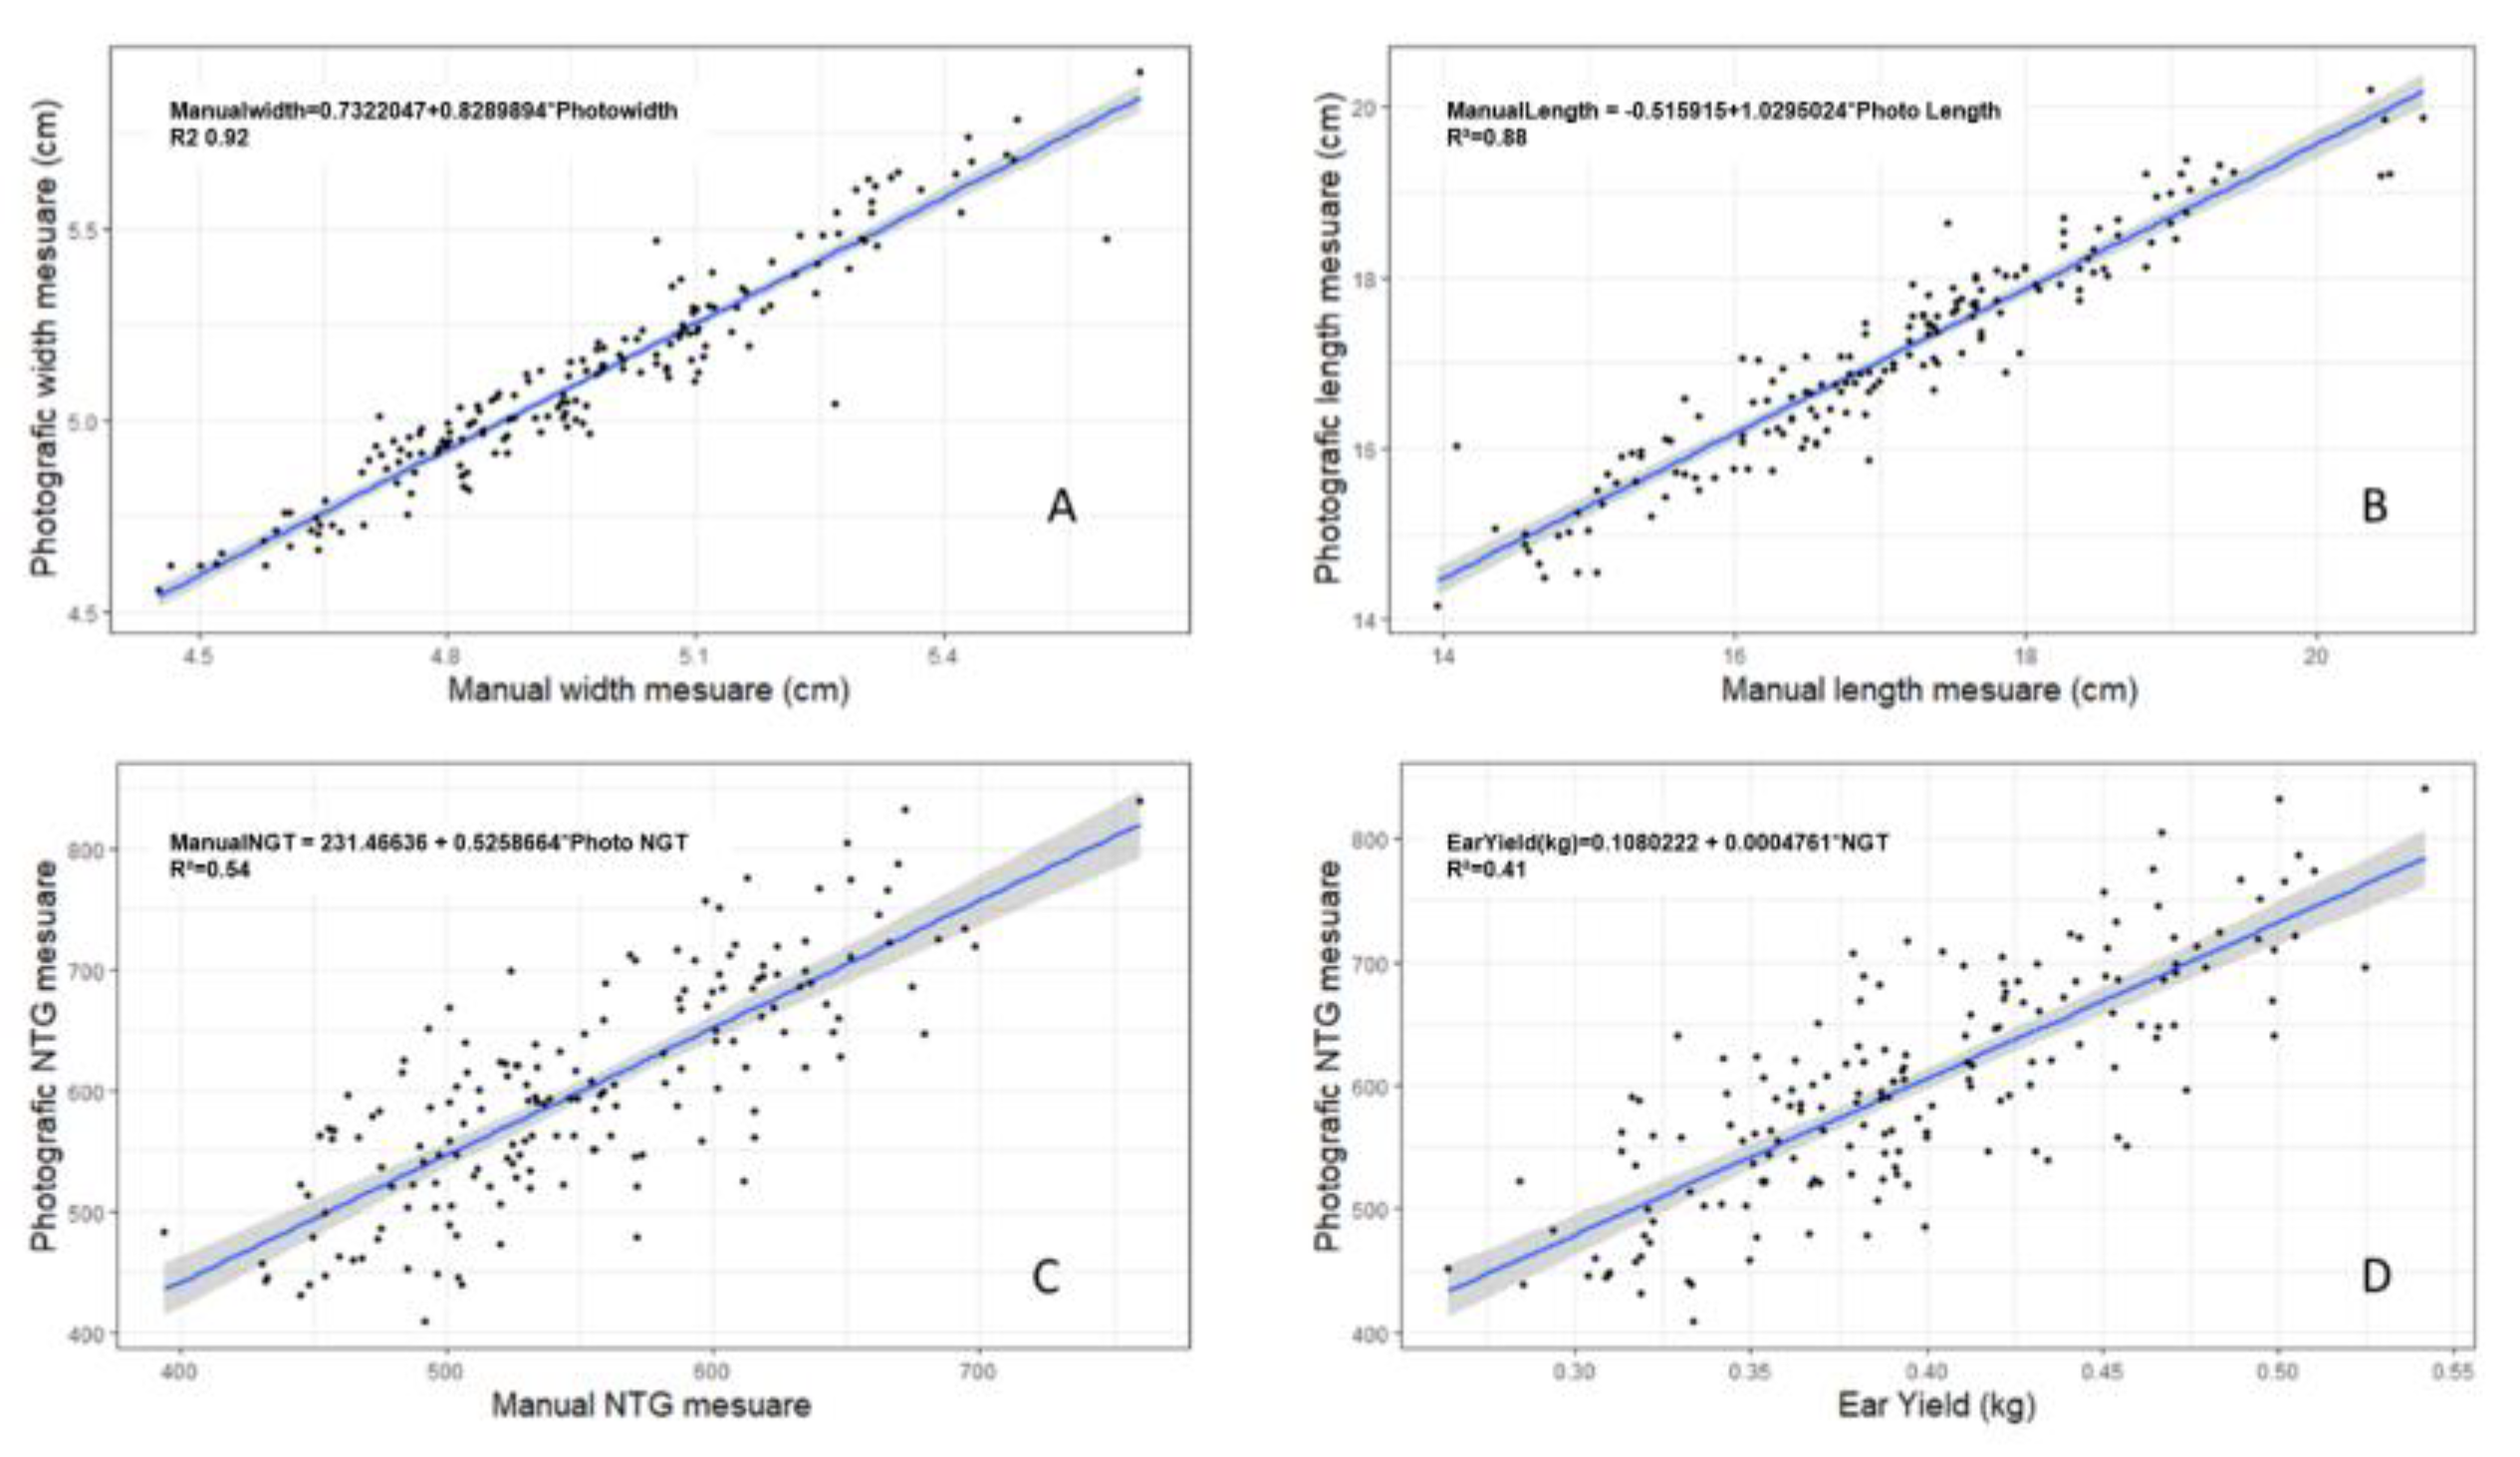
| Manual Accuracy | Photographic Accuracy |
Correlation | |||||||
|---|---|---|---|---|---|---|---|---|---|
| Width | Length | TNG | Width | Length | TNG | Width | Length | TNG | |
| Ijaci AB | 68.95 | 67.94 | 84.56 | 77.12 | 72.85 | 84.58 | 0.90** | 0.95** | 0.65** |
| Ijaci CD | 85.55 | 74.48 | 76.00 | 82.58 | 73.27 | 87.86 | 0.96** | 0.98** | 0.70** |
| Lavras AB | 65.99 | 72.54 | 65.26 | 81.96 | 75.20 | 83.31 | 0.95** | 0.95** | 0.79** |
| Lavras CD | 92.39 | 17.78 | 78.82 | 93.66 | 69.47 | 83.77 | 0.98** | 0.83** | 0.80** |
| Nazareno AB | 57.02 | 80.58 | 83.73 | 71.58 | 79.97 | 93.52 | 0.97** | 0.97** | 0.75** |
| Nazareno CD | 79.78 | 82.20 | 51.23 | 78.62 | 80.78 | 64.96 | 0.98** | 0.97** | 0.71** |
Disclaimer/Publisher’s Note: The statements, opinions and data contained in all publications are solely those of the individual author(s) and contributor(s) and not of MDPI and/or the editor(s). MDPI and/or the editor(s) disclaim responsibility for any injury to people or property resulting from any ideas, methods, instructions or products referred to in the content. |
© 2023 by the authors. Licensee MDPI, Basel, Switzerland. This article is an open access article distributed under the terms and conditions of the Creative Commons Attribution (CC BY) license (http://creativecommons.org/licenses/by/4.0/).


