Introduction
C-peptide is a reliable measure of endogenous insulin production as it is secreted in 1:1 ratio to insulin in pancreatic beta cells after cleavage of proinsulin. The rationale for measuring C-peptide instead of insulin is to discriminate between endogenously produced and external insulin in insulin-treated type 1 diabetes mellitus (T1DM) patients. Most C-peptide-related research has focused on T1DM, while much less is known about the characteristics of C-peptide outside T1DM.
The normal physiological range for the fasted C-peptide is 0.9-1.8 ng/ml (Yosten et al., 2014).
C-peptide lower than 0.6 ng/ml is regarded as an indicator of beta-cell failure and, therefore, is used as a diagnostic marker for T1DM (Leighton, 2017).
In clinical practice, measurement of C-peptide is limited to T1DM and a few other rare conditions like insulinoma, beta-cell tumor, and sulfonylurea therapy (Venugopal et al., 2021). Since these latter conditions are associated with elevated C-peptide levels, low C-peptide levels in the clinical routine are typically linked to T1DM. However, beyond T1DM, other conditions are associated with low C-peptide levels, too. These conditions are physiological and include fasting and low-carbohydrate diets. In our experience, clinicians often dismiss these conditions when seeing a low C-peptide level.
Currently, an increasing number of people are following different forms of low-carbohydrate diets or practicing fasting. In the absence of support from a medical professional trained in low-carbohydrate diets, most of them are self-administering such diets. Most often, they are left without professional help when it comes to the evaluation of the blood work.
The authors of this article have been using a low-carbohydrate diet, denoted paleolithic ketogenic diet (PKD), in the treatment of chronic diseases, including diabetes, autoimmune diseases, epilepsy, and cancer, for the last 12 years.
Thus far, we have published several case reports of patients successfully treated with the PKD. These include: type 2 (Tóth and Clemens, 2015a) and type 1 diabetes (Tóth and Clemens, 2014; 2015b), Crohn’s disease (Tóth et al, 2016), Gilbert’s syndrome (Tóth and Clemens, 2015c), epilepsy (Clemens et al., 2013, 2015); complete reversal of cervical intraepithelial neoplasia (Tóth et al., 2018); halted progression of soft palate cancer (Tóth and Clemens, 2016), regression of rectal cancer (Tóth and Clemens, 2017) and unexpectedly long survival with glioblastoma (Tóth et al., 2019). In 2017, we published a study with 50 patients on the PKD with 98% showing magnesium levels in the normal range, which is unexpected for a population with chronic diseases. This finding highlights that a low-carbohydrate diet may be associated with laboratory findings different from those generally seen.
In our practice, we have seen cases where individuals following a low-carbohydrate diet were wrongly diagnosed with T1DM, and some of them were therefore put on insulin therapy. This is because ketones are generally present in the urine in diabetic ketoacidosis and it is sometimes assumed that T1DM is also the cause of ketonuria in low-carbohydrate dieters. Thus, a low C-peptide level combined with urinary ketones may increase the likelihood of misdiagnosing a potentially healthy low-carbohydrate dieter as a T1 diabetic.
Previously, we have published cases of new-onset T1DM where, besides long-term normoglycaemia and insulin-freedom, the PKD also resulted in preservation or an increase in C-peptide level, indicating preservation and/or restoration of endogenous pancreatic insulin production capacity over time (Tóth and Clemens, 2014, 2015b; Clemens and Tóth, 2018). Importantly, restoration of endogenous pancreatic insulin production is typically not seen in T1DM on other versions of the ketogenic diet.
We also observed that even though PKD prevents a progressive decline of C-peptide in new-onset T1DM cases, C-peptide levels typically remain below the reference range (Tóth and Clemens, 2014, 2015b; Clemens and Tóth, 2018). In order to differentiate between the loss of insulin production and the effect of a low-carbohydrate diet, we introduced the measurement of the stimulated C-peptide, which includes the measurement of C-peptide after a regular PKD meal (Tóth and Clemens, 2015b; Clemens and Tóth, 2018). We believe that the combination of the two measurements provides a better grasp of endogenous insulin production. Of importance, we observed that not only newly diagnosed T1DM patients have low C-peptide levels on the PKD but patients with other conditions and healthy persons, too. These patients and healthy subjects have no symptoms indicative of T1DM.
In order to characterize C-peptide levels in non-T1DM subjects following the PKD, we retrospectively analyzed laboratory data from 100 subjects on the PKD.
Methods
Patients/Subjects
We included patients and healthy subjects who conformed the below criteria:
- (1)
Had an initial consultation with us and took part in our 2-weeks follow-up program to ascertain that they correctly understand and effectuate the diet
- (2)
Had at least one follow-up laboratory blood work that included C-peptide levels
- (3)
Had a diagnosis other than T1DM or were healthy
- (4)
Have been adherent to the diet as assessed by patient feedback and the laboratory blood work
- (5)
Have not been receiving chemotherapy, radiotherapy, or any medicinal therapy nor taking dietary supplements at the time of the laboratory test
We identified 100 subjects (92 patients and 8 healthy controls) who matched criteria 1-5. If more than one follow-up laboratory report was available for a subject, we used the most recent one for the current analysis.
The study was approved by the institutional review board (3/ 2019.08.30).
The Paleolithic Ketogenic Diet (PKD)
The PKD is a meat-fat-based diet similar to the one originally proposed by Voegtlin (1975). The diet has roots in both the paleolithic diet as defined by Cordain (2002) and clinical studies that used the paleolithic diet (e.g. Manheeimer et al., 2015) as well as in the classical ketogenic diet that has been in use in the last 100 years (Kossoff and Hartman. 2012). The PKD comprises 70-100 % animal-based food (in volume) with a fat:protein ratio of approximately 2:1 (in grams).
In the PKD, red and fatty meats are prioritized, and organ meats are encouraged. Milk, dairy, cereals, grains, oilseeds, legumes, nightshades, plant oils (including coconut and olive oil), refined sugars, artificial sweeteners, foods with additives, black tea and herbal tea are all prohibited. Vitamin or mineral supplements are also prohibited in the PKD. In a few cases, coffee is permitted in moderation and some patients are allowed to use small amounts of honey.
Statistical Tests
Pearson correlation was calculated to assess the relation between C-peptide, glucose, and age. T-test for independent samples was carried out to compare C-peptide and glucose levels in males and females.
Results
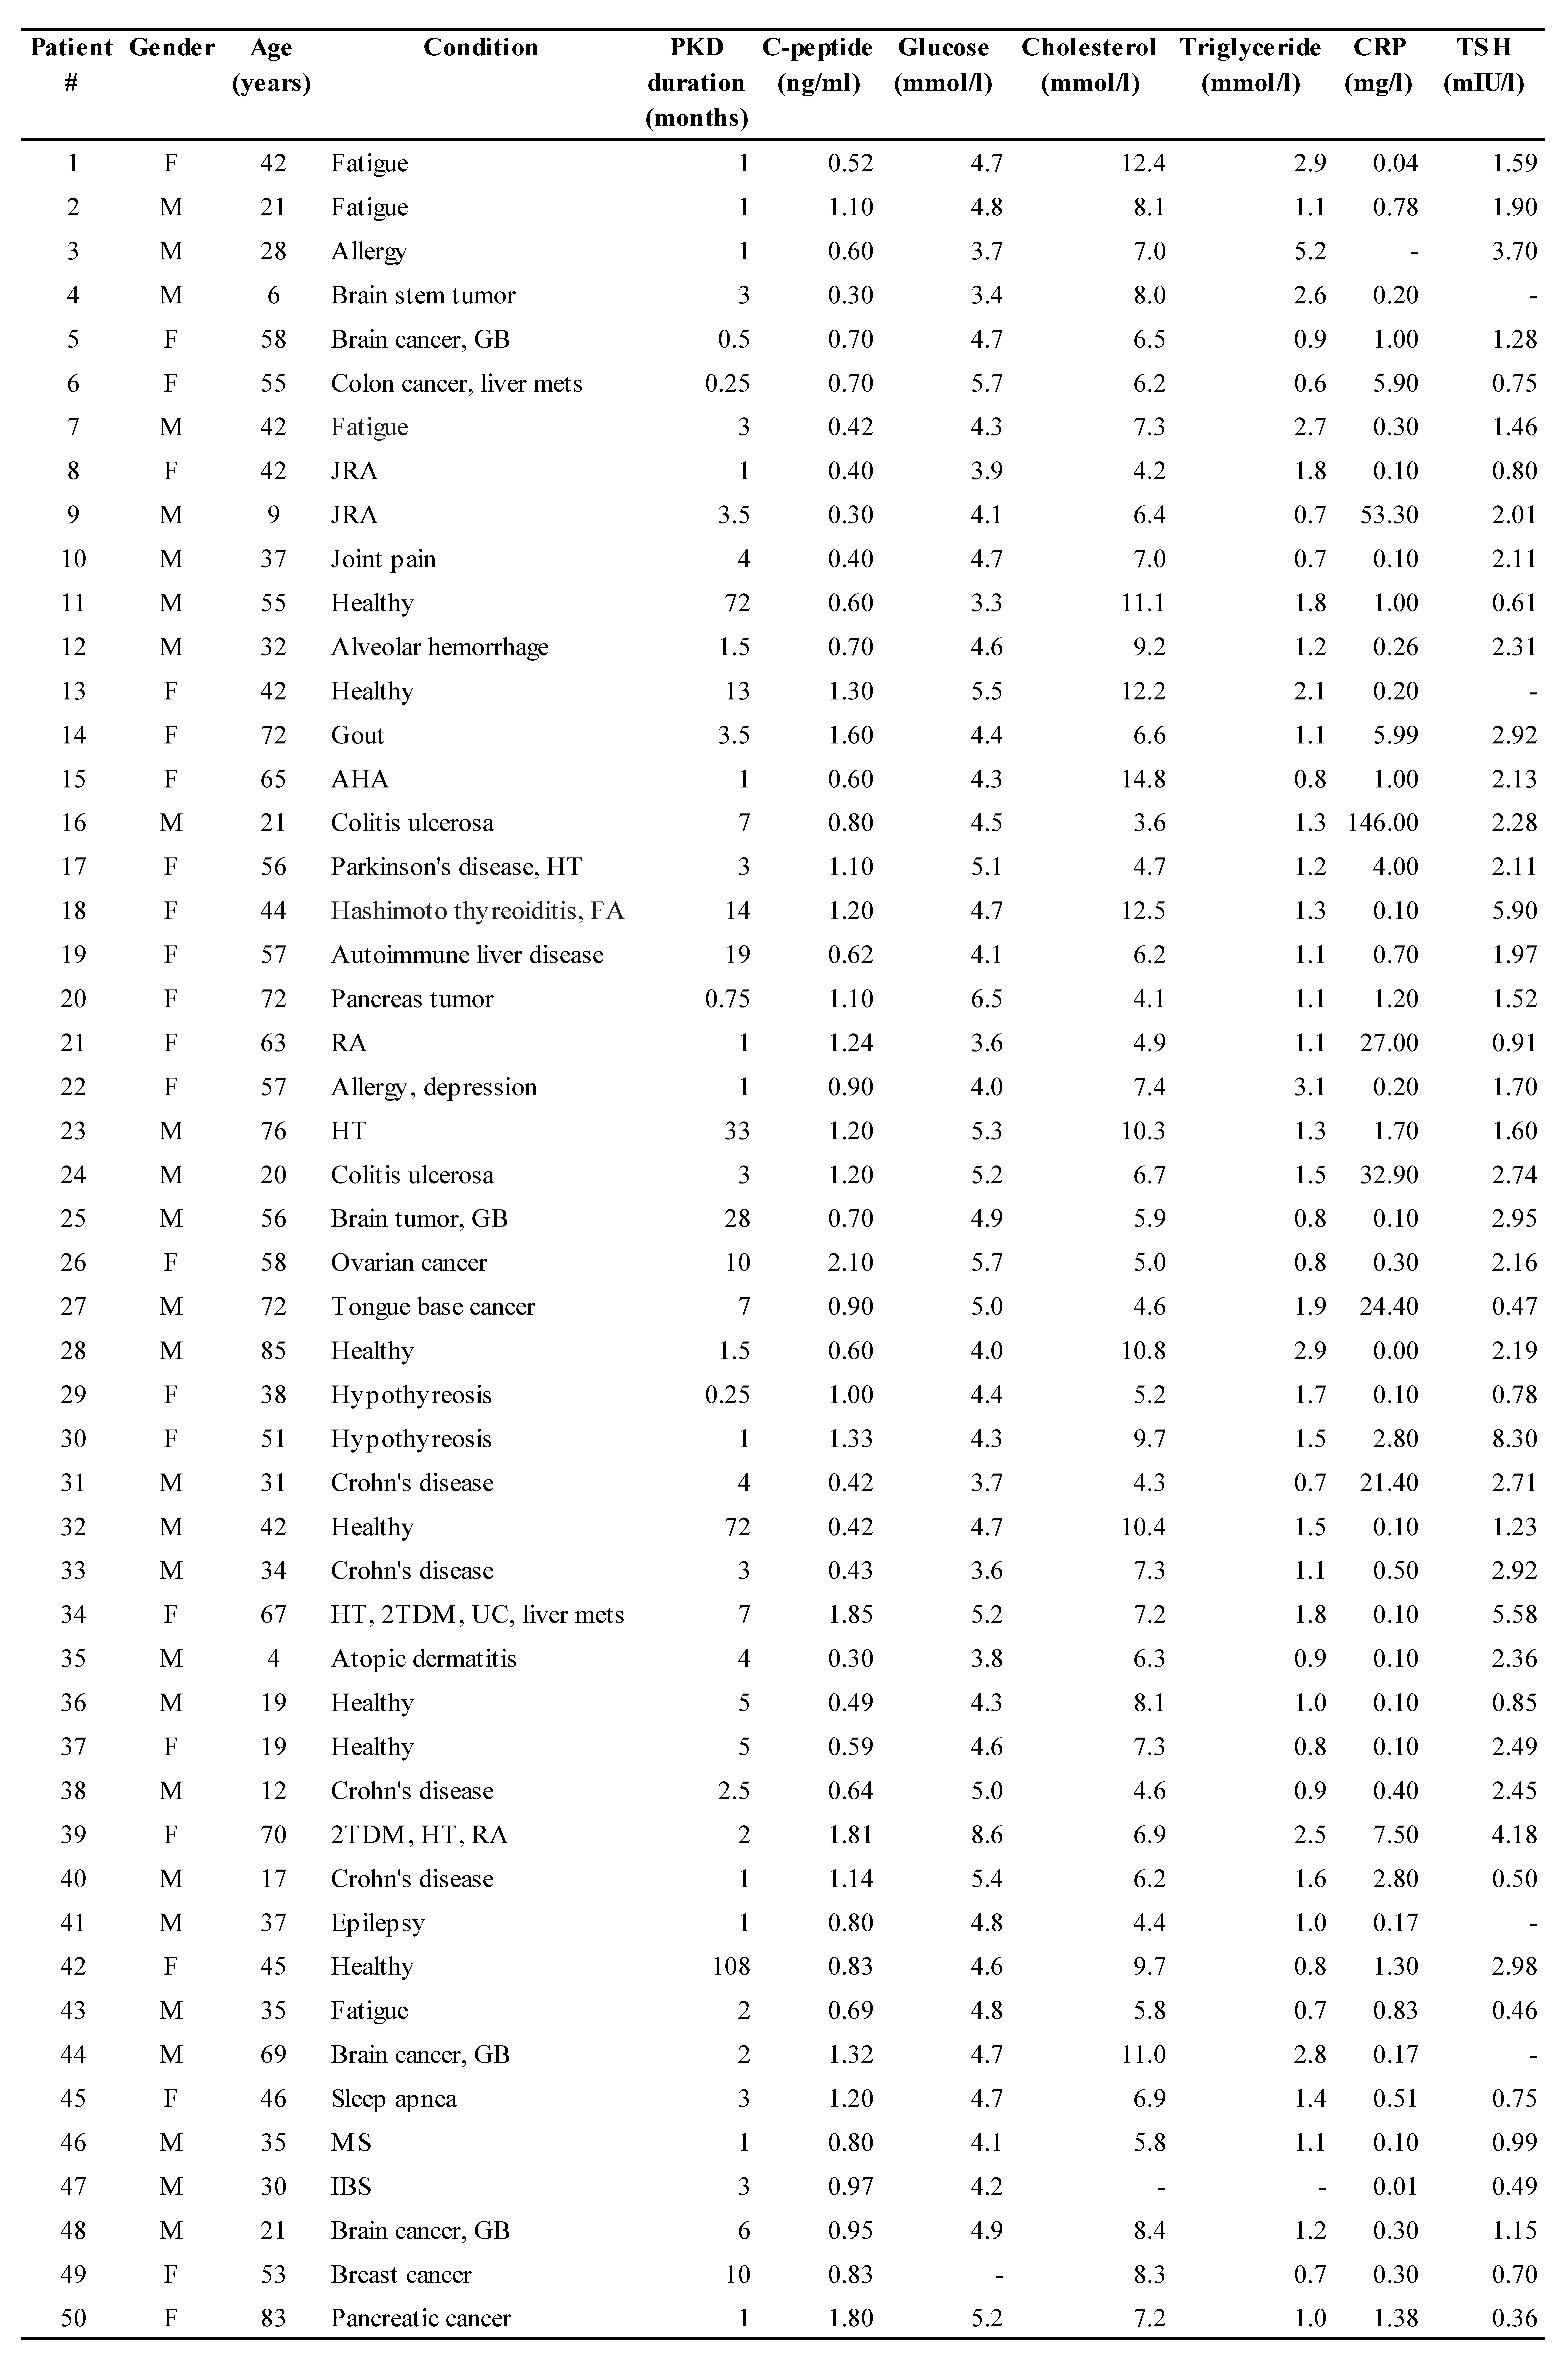
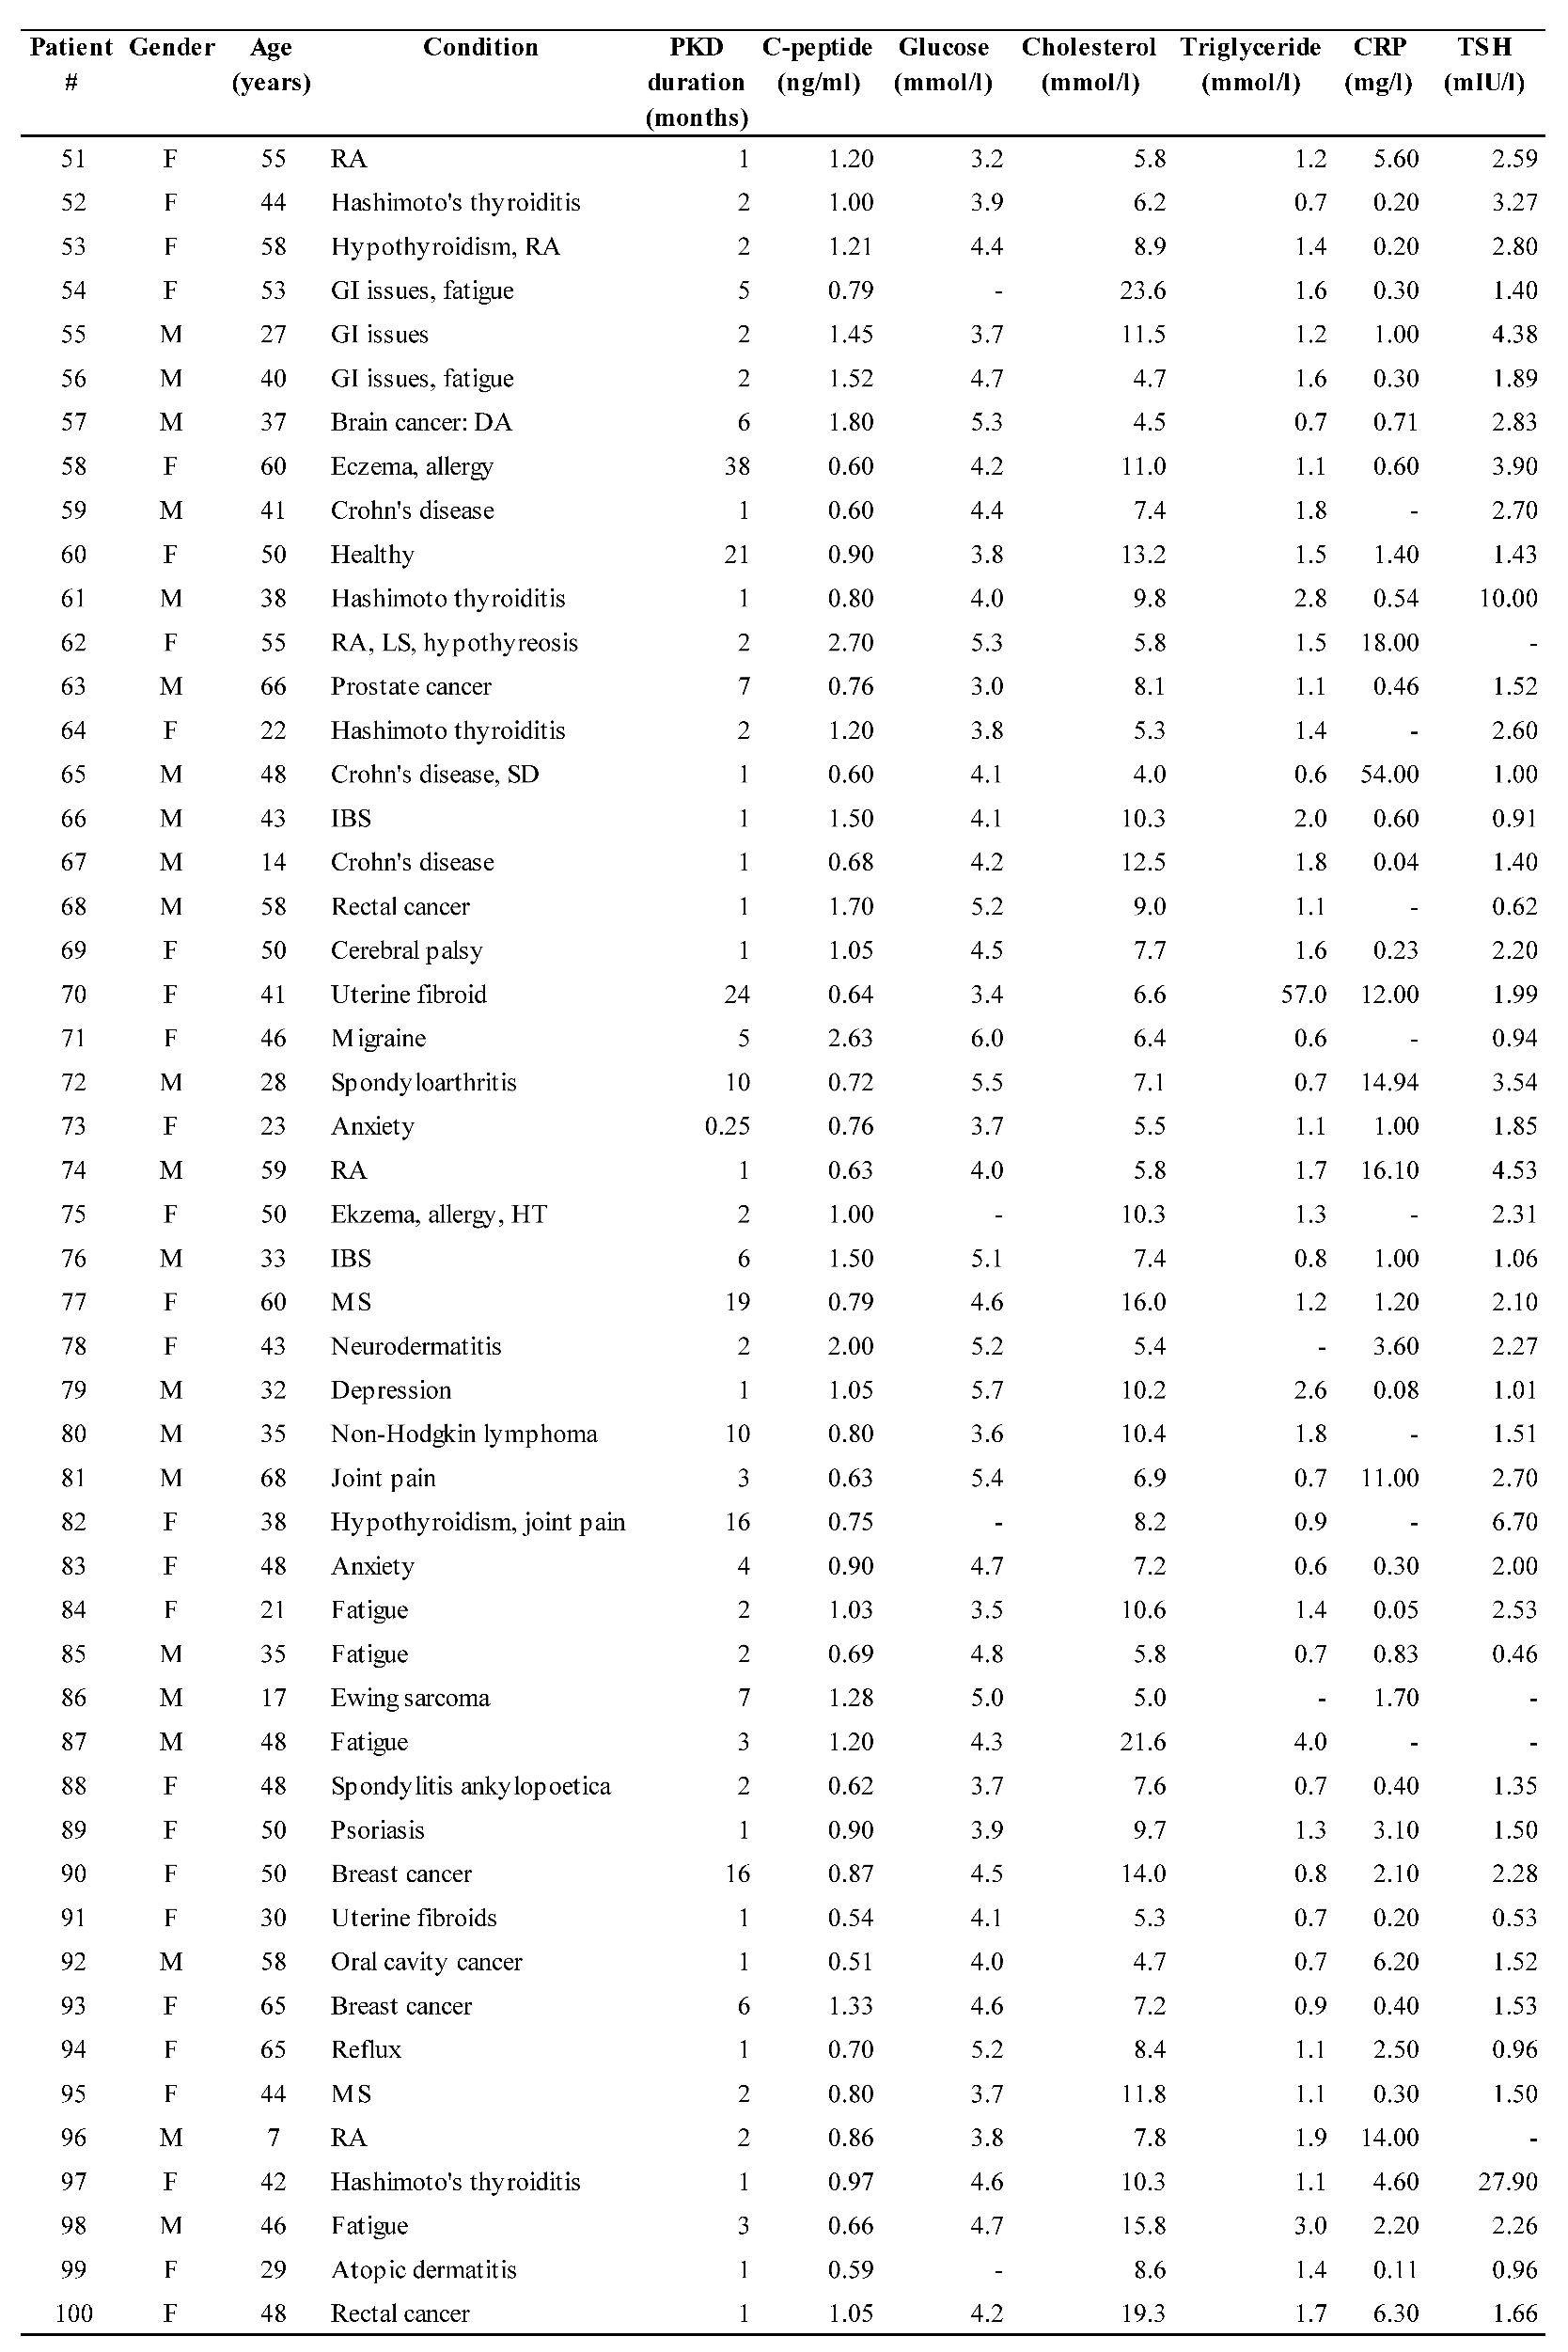
Individual subject data are shown in
Table 1 and
Table 2. Demographics are shown in
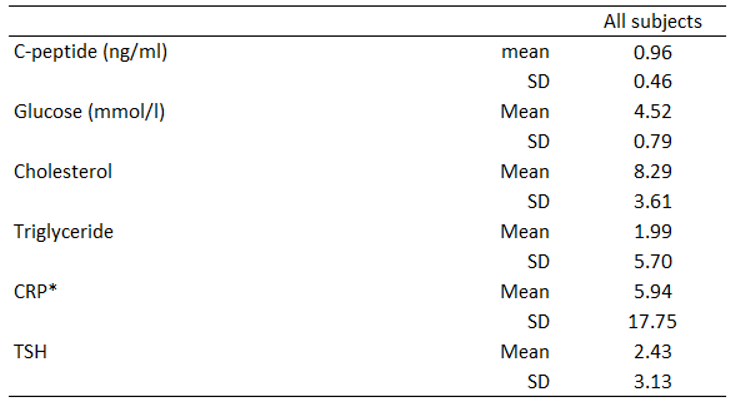
Table 3. Mean and SD for C-peptide, glucose, cholesterol, triglyceride, CRP, and TSH are shown in
Table 4.
Of the 100 subjects, 55 had a C-peptide level below the standard reference range (below 0.9 ng/ml).
As expected, glucose levels were generally low. Triglyceride levels were mainly in the standard reference range, while cholesterol levels were slightly higher than the standard reference range. TSH levels mostly fall in the standard reference range (except for a few patients with hypothyroidism). CRP levels were generally low except for a few outliers.
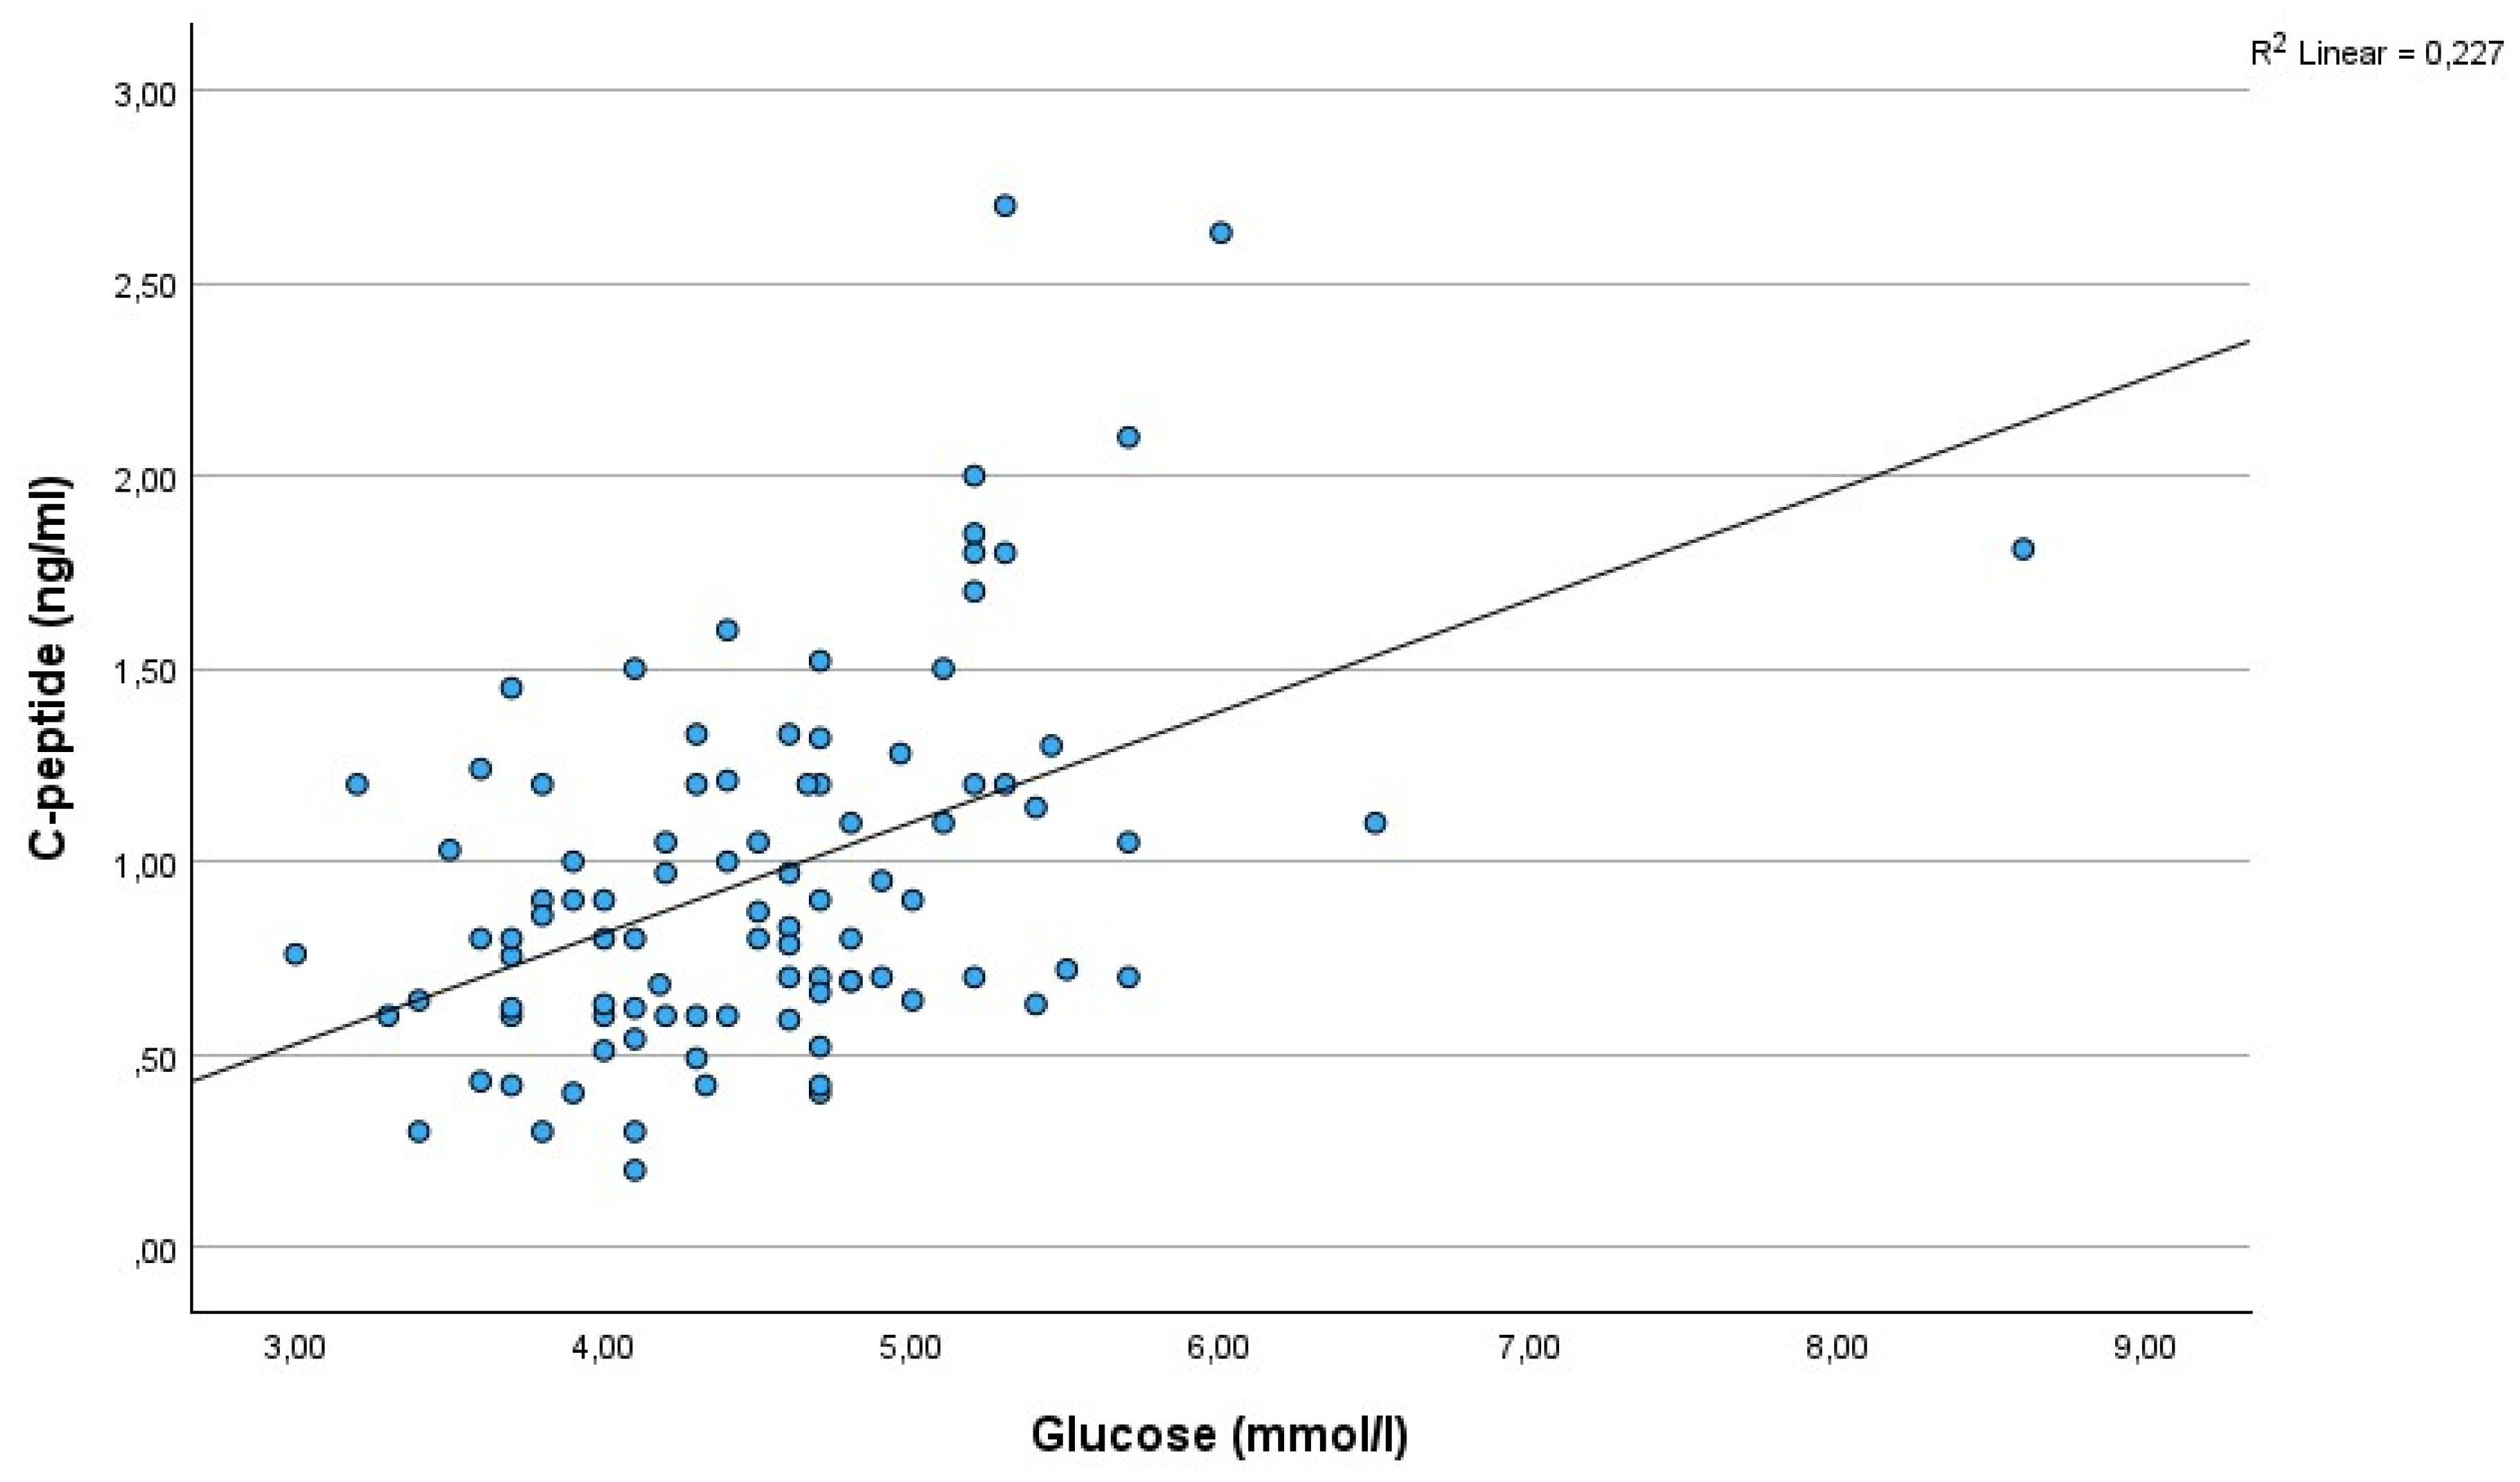
As expected, a strong and significant correlation existed between C-peptide and glucose (r=0.48, p=0.000001)(
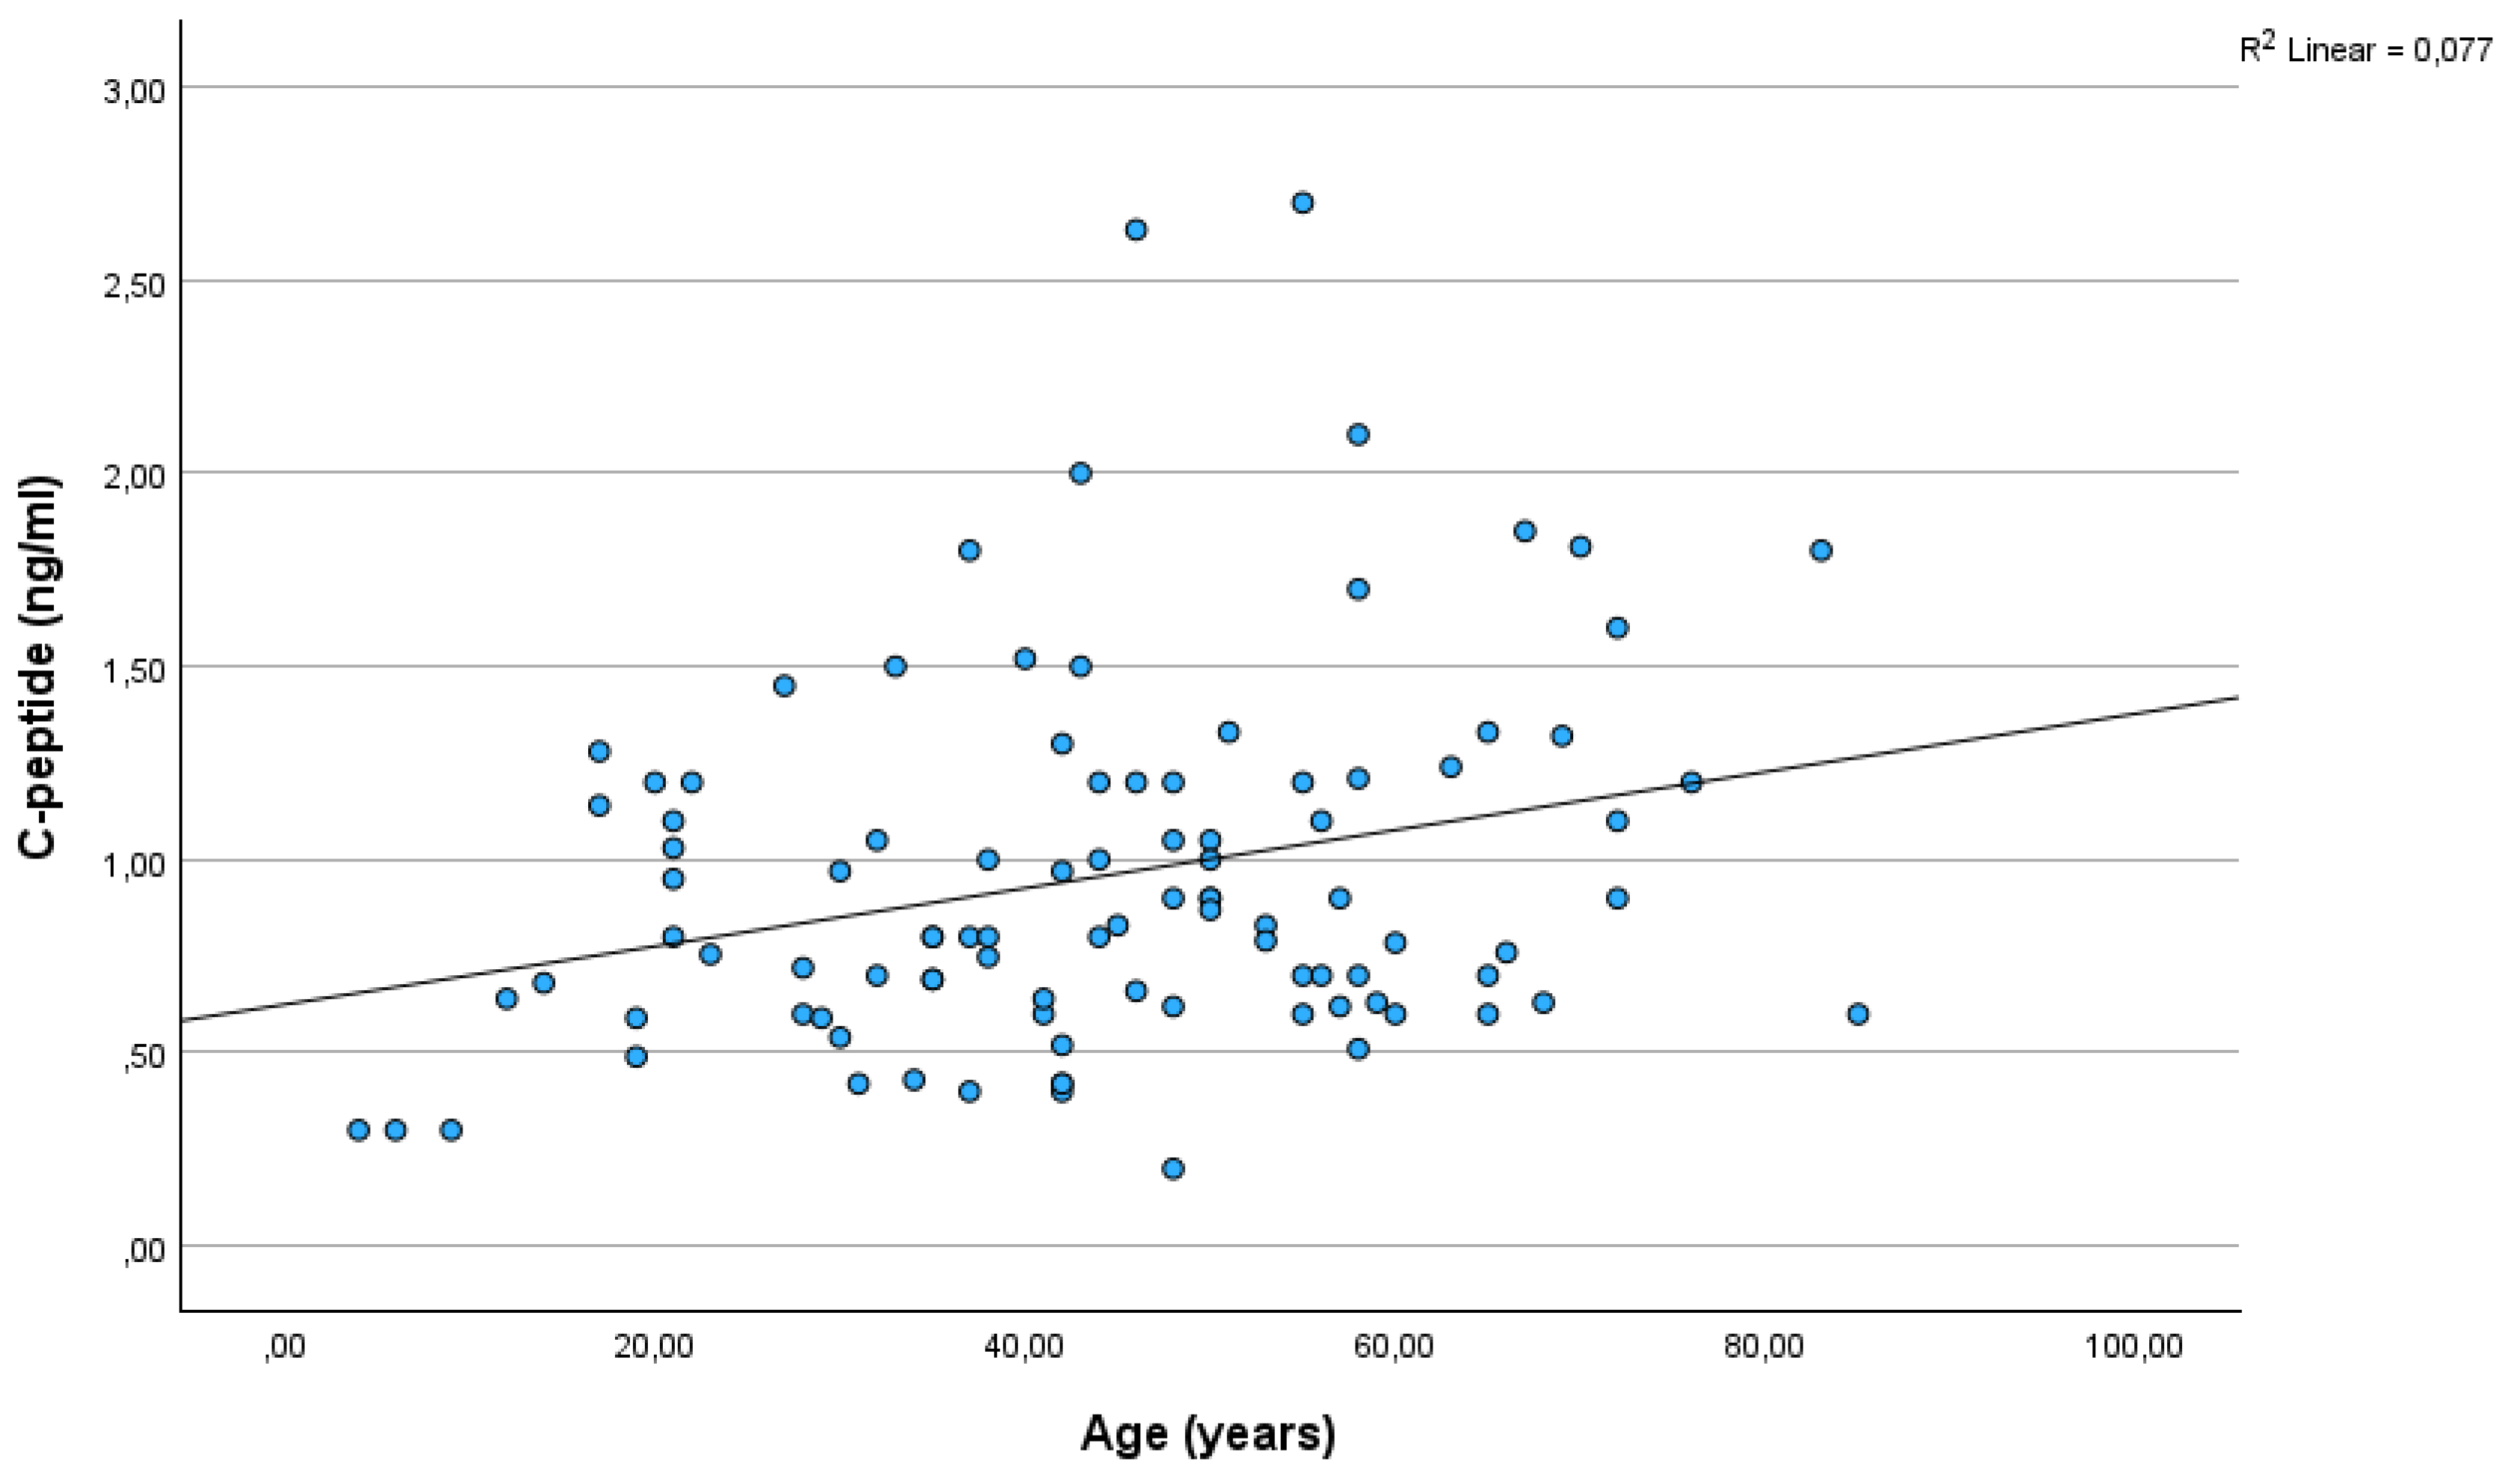
Figure 1). There was a significant correlation between C-peptide and age (r=0,28; p=0,005)(
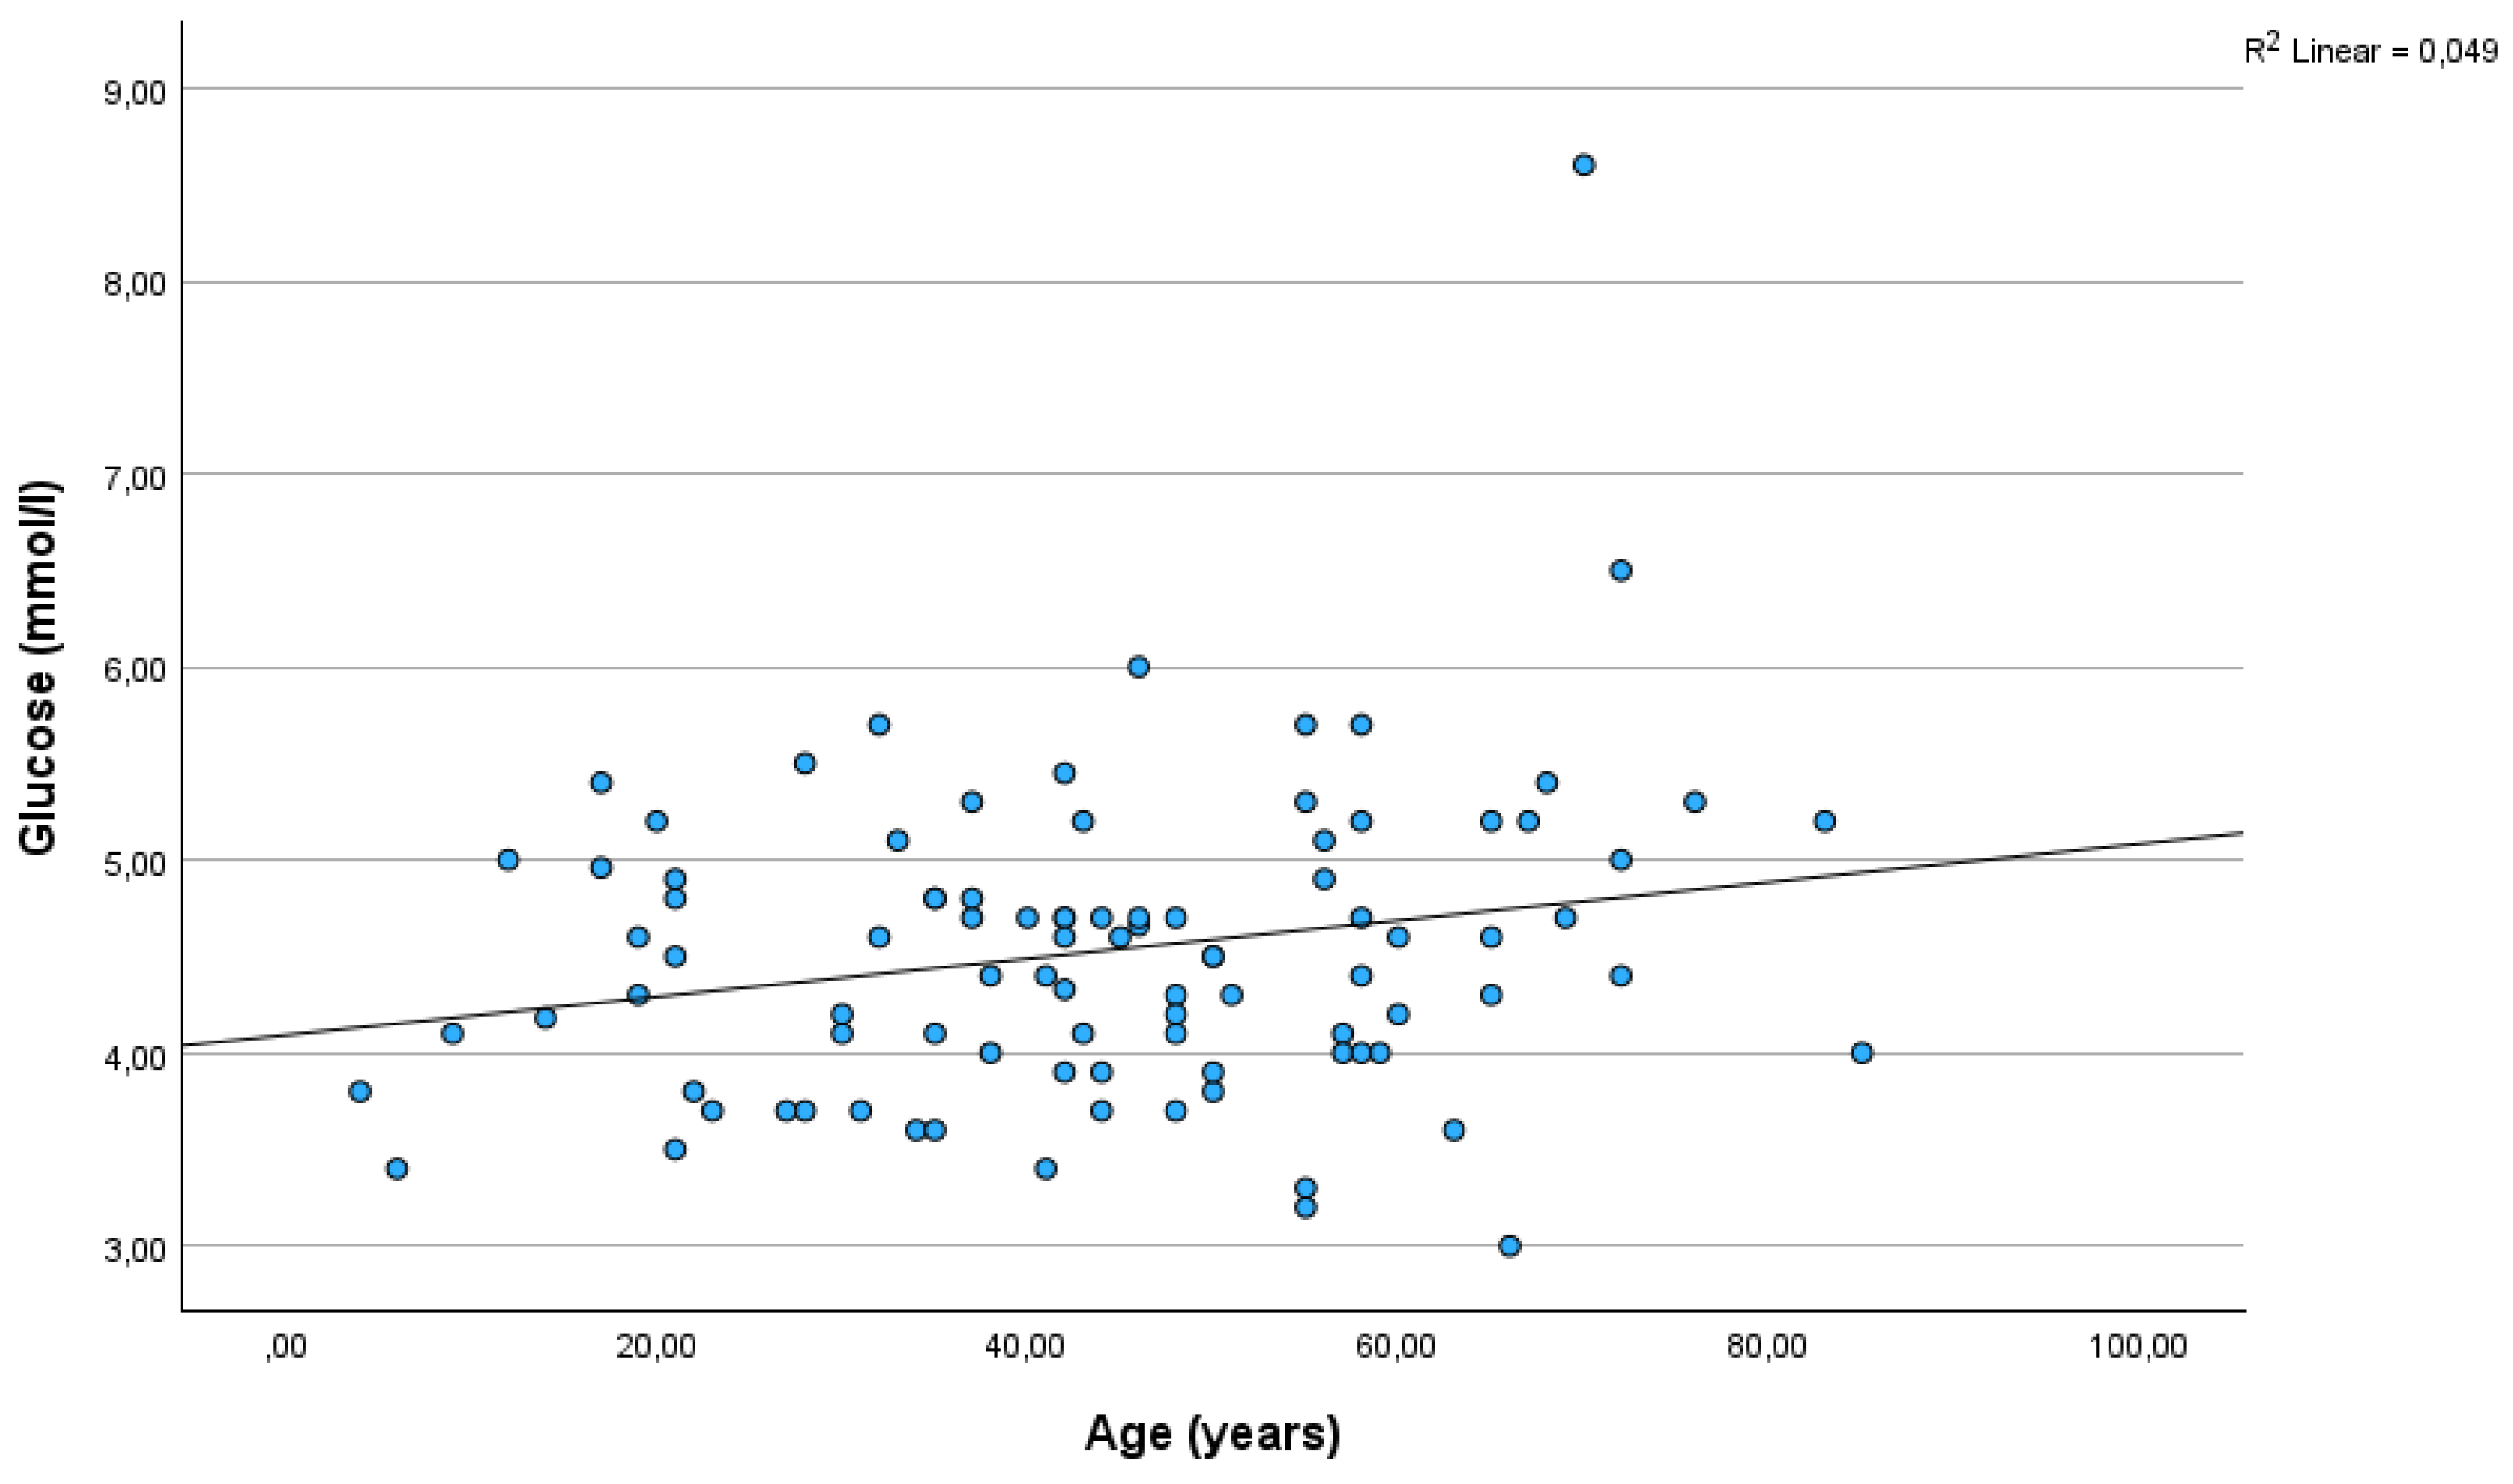
Figure 2). The correlation between glucose and age was also significant (r=0.22, p=0.032)(
Figure 3), but was not as strong as between C-peptide and age.
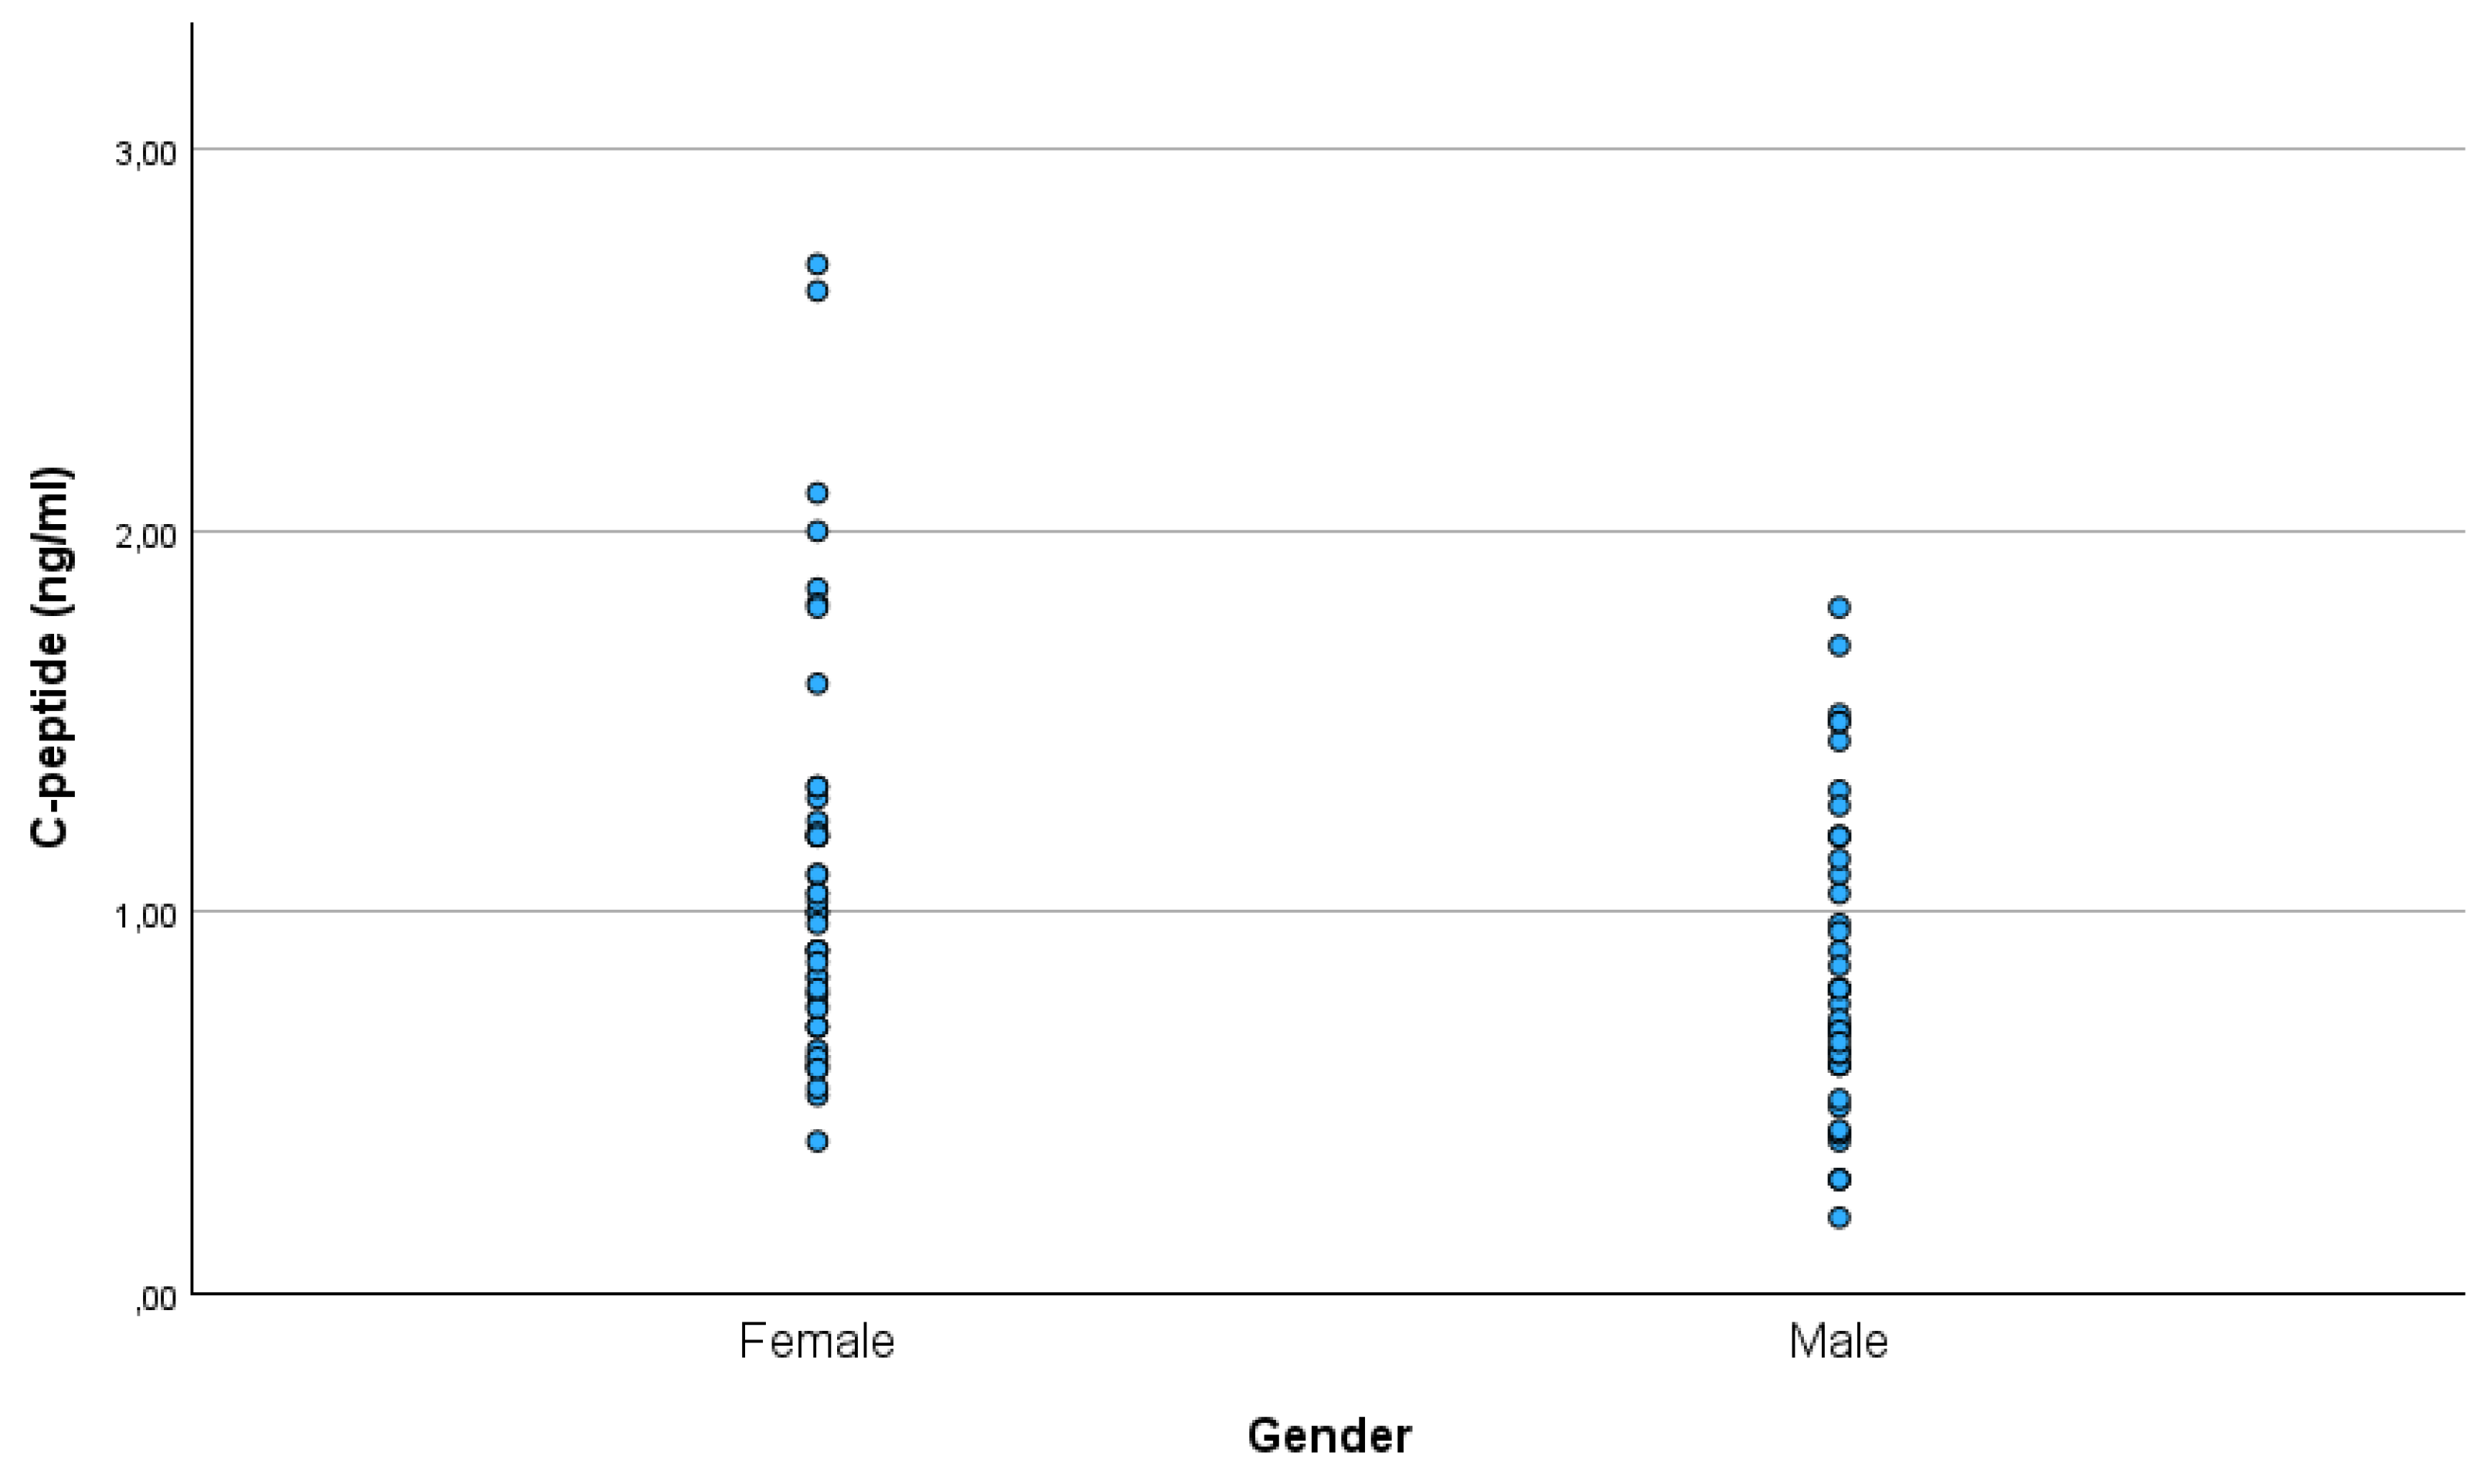
There was a significant difference in the C-peptide between males and females (p=0.009), with females (mean ± SD: 1.08 ± 0.51 ng/ml) having higher C-peptide levels than males (mean ± SD: 0.83 ± 0.39 ng/ml) (
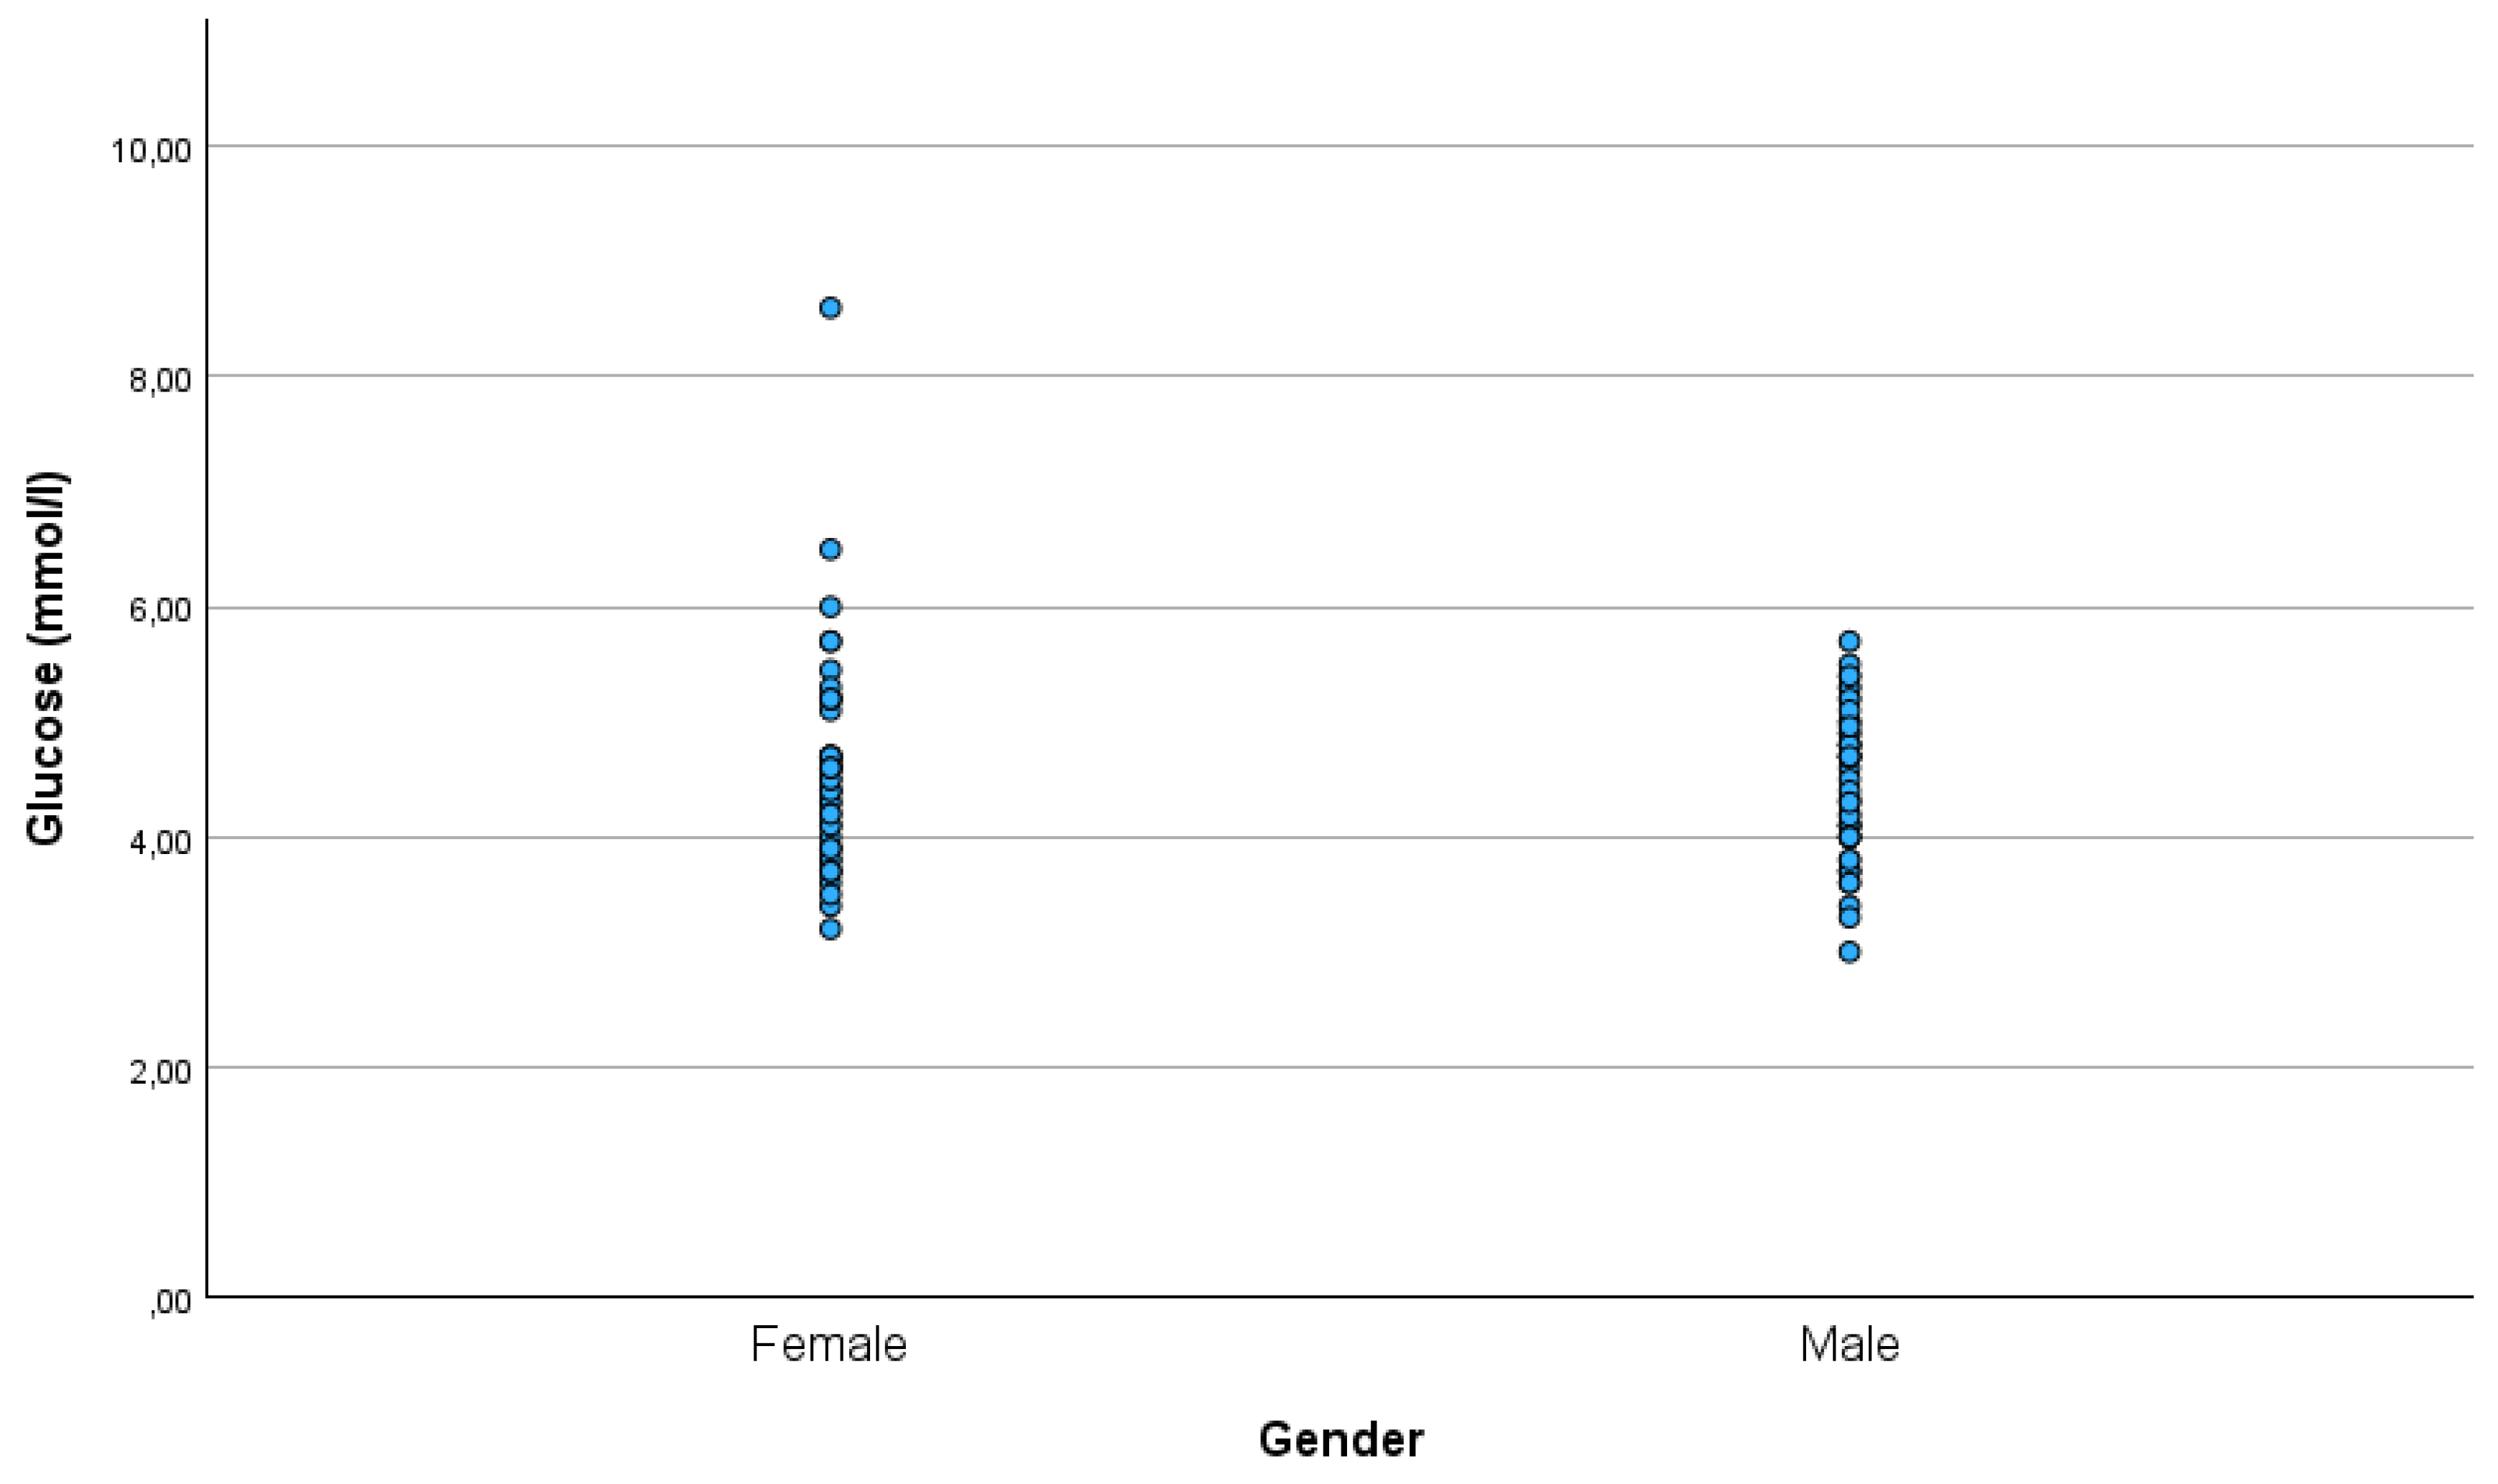
Figure 4). There was no significant difference in glucose between males (mean ± SD: 4.46 ± 0.64 mmol/l) and females (mean ± SD: 4.59 ± 0.93 mmol/l)(
Figure 5).
Discussion
In the last few decades, there has been an upsurge in the interest in low-carbohydrate diets. Historically, the classical ketogenic diet has been used in epilepsy for the last 100 years (Wilder, 1921). Before the discovery of insulin in 1922, the only way to treat T1DM was with a diet low in carbohydrates. Recently, randomized controlled studies and meta-analyses have shown that a low-carbohydrate diet is superior to a low-fat diet in glucose control (van Zuuren et al., 2018). The 2019 consensus statement from the American Diabetes Association also included low-carbohydrate diets as an option in diabetes prevention (Evert et al., 2019).
Lately, there have been attempts to use low-carbohydrate diets in cancer and autoimmune diseases. However, in the absence of a consensus on low-carbohydrate diets for different diseases, those patients who start a low-carbohydrate diet tend to self-apply it without the support of their caring physician. The lack of diet-related training may prevent the physician from properly evaluating laboratory blood in the context of a low-carbohydrate diet. As a result, low C-peptide levels due to a low-carbohydrate diet may be perceived as an alarming sign. This, combined with ketones in the urine, may lead to an incorrect diagnosis of T1DM.
Our data showed that 55% of the patients and healthy subjects on the PKD have a C-peptide level below the reference range. We found a significant correlation between C-peptide and glucose levels similar to previous studies (for example, Bando et al., 2018), which reflects lower insulin need with lower glucose levels. Recently, studies have looked at the postprandial effects of low-carbohydrate meals. These studies show that low-carbohydrate meals are associated with a smaller postprandial elevation of glucose and C-peptide (e.g. Samkani et al., 2018). Only a few studies examined the effect of sustained low-carbohydrate diets on glucose and C-peptide levels. These studies were confined to T2DM patients (Myetta-Côté et al., 2018; Bando et al., 2018).
In the study of Bando et al. (2018), C-peptide levels were relatively low besides relatively high glucose levels (
Table 5). In our present study, however, C-peptide levels were low yet not associated with high glucose levels. In the study of Bando et al. (2018), a few cases have very low C-peptide levels. Such low levels likely reflect the exertion of the own insulin production. In our study, however, low C-peptide levels were seen in patients who are not diabetic. We are not aware of any studies looking at the C-peptide levels associated with low-carbohydrate diets in conditions other than diabetes.
In our previous case reports (Tóth and Clemens; 2014, 2015, Clemens et al., 2018) we reported that newly diagnosed T1DM patients may be able to prevent the progressive decline in C-peptide and may retain normoglycemia and insulin-freedom.
Since we observed that fasting C-peptide measurements are typically below the reference range on the PKD, we have started using paired C-peptide measurements in T1DM patients. This includes two C-peptide measurements: one fasted and another after a regular PKD meal (stimulated C-peptide). The combination of the two measurements helps to distinguish between the effect of the low-carbohydrate diet and the deficiency of endogenous insulin production and thereby provides a better representation of the actual insulin production.
The present analysis showed that non-T1DM patients and healthy subjects on the PKD have C-peptide levels in a similar range as those patients with a recent T1DM diagnosis. This information may be crucial to diabetologists given that an increasing number of patients, including type 1 and type 2 diabetics, are attempting to embark on a low-carbohydrate or ketogenic diet.
Our data showed a significant correlation between C-peptide levels and age. Of note, C-peptide levels were very low in children under the age of 10 years: in 3 out of 4 children below 10 years, C-peptide was 0.3 ng/ml. Such a low C-peptide level combined with ketones in the urine, especially if seen in children, may prompt setting up an incorrect diagnosis of T1DM.
As far as we know, we are the first to report a correlation between C-peptide levels and age in conditions other than non-T1DM. In new-onset T1DM children, a similar relationship has already been reported (Hwang et al., 2017). Interestingly, in our sample, the relationship was smaller, yet significant, between glucose and age.
In our study, males had lower C-peptide levels than females. At the same time, there was no gender difference in glucose.
Our results indicate a need for redefining the reference range for C-peptide if the patient is following a low-carbohydrate diet. The data from the present study may provide a basis for this. The present results also draw attention to the fact that the clinical evaluation of C-peptide should be done within the context of the patient’s diet. In addition to this, C-peptide may be a valuable and reliable tool to monitor dietary adherence on low-carbohydrate diets including the PKD.
References
- Bando H, Ebe K, Muneta T, Bando M, Yonei Y. Urinary C-Peptide Excretion for Diabetic Treatment in Low Carbohydrate Diet (LCD) (2018) Journal of Obesity and Diabetes 1:13-18. [CrossRef]
- Clemens Z, Dabóczi A, Tóth C. The paleolithic ketogenic diet may ensure adequate serum magnesium levels. Journal of Evolution and Health (2017) A joint publication of the Ancestral Health Society and the Society for Evolutionary Medicine and Health, 2(2). Retrieved from https://escholarship.org/uc/item/7fh8h2vs. [CrossRef]
- Clemens Z, Kelemen A, Fogarasi A, Tóth C. Childhood absence epilepsy successfully treated with the paleolithic ketogenic diet. Neurol Ther (2013) 2:71-6. [CrossRef]
- Clemens Z, Kelemen A, Tóth C. NREM-sleep associated epileptiform discharges disappeared following a shift toward the paleolithic ketogenic diet in a child with extensive cortical malformation. Am J Med Case Rep (2015) 3:212-215. [CrossRef]
- Clemens Z, Tóth C. Paleolithic ketogenic diet (PKD) in chronic diseases: Clinical and research data. Journal of Evolution and Health: A joint publication of the Ancestral Health Society and the Society for Evolutionary Medicine and Health (2018) 3(2). Retrieved from https://escholarship.org/uc/item/4x24r436. [CrossRef]
- Cordain, L. The paleo diet: Lose weight and get healthy by eating the food you were designed to eat (2002) New York: Wiley.
- Evert AB, Dennison M, Gardner CD, et al. Nutrition Therapy for Adults With Diabetes or Prediabetes: A Consensus Report. Diabetes Care (2019) 42(5):731-754. [CrossRef]
- Hwang JW, Kim MS, Lee DY. Factors Associated with C-peptide Levels after Diagnosis in Children with Type 1 Diabetes Mellitus. Chonnam Med J (2017) 53(3):216-222. [CrossRef]
- Kossoff EH, Hartman AL. Ketogenic diets: new advances for metabolism-based therapies. Curr Opin Neurol (2012) 25(2):173-178. [CrossRef]
- Leighton E, Sainsbury CA, Jones GC. A Practical Review of C-Peptide Testing in Diabetes. Diabetes Ther. 2017;8(3):475-487. [CrossRef]
- Manheimer EW, van Zuuren EJ, Fedorowicz Z, Pijl H. Paleolithic nutrition for metabolic syndrome: systematic review and meta-analysis. Am J Clin Nutr (2015) 102(4):922-932. [CrossRef]
- Myette-Côté É, Durrer C, Neudorf H, Bammert TD, Botezelli JD, Johnson JD, DeSouza CA, Little JP. The effect of a short-term low-carbohydrate, high-fat diet with or without postmeal walks on glycemic control and inflammation in type 2 diabetes: a randomized trial. Am J Physiol Regul Integr Comp Physiol (2018) 315(6):R1210-R1219. [CrossRef]
- Samkani A, Skytte MJ, Thomsen MN, Astrup A, Deacon CF, Holst JJ, Madsbad S, Rehfeld JF, Krarup T, Haugaard SB. Acute Effects of Dietary Carbohydrate Restriction on Glycemia, Lipemia and Appetite Regulating Hormones in Normal-Weight to Obese Subjects. Nutrients. (2018) 10(9):1285. [CrossRef]
- Tóth C, Clemens Z. A child with type 1 diabetes mellitus (T1DM) successfully treated with the Paleolithic ketogenic diet: A 19-month insulin freedom. Int J Case Rep Images (2015b) 6:752-757. [CrossRef]
- Tóth C, Clemens Z. Gilbert’s syndrome successfully treated with the paleolithic ketogenic diet. Am J Med Case Rep (2015c) 3:117-120. [CrossRef]
- Tóth C, Clemens Z. Halted progression of soft palate cancer in a patient treated with the paleolithic ketogenic diet alone: A 20-months follow-up. Am J Med Case Rep (2016) 4:288-292. [CrossRef]
- Tóth C, Clemens Z. Successful treatment of a patient with obesity, type 2 diabetes and hypertension with the paleolithic ketogenic diet. Int J Case Rep Images (2015a) 6:161-167. [CrossRef]
- Tóth C, Clemens Z. Treatment of rectal cancer with the paleolithic ketogenic diet: A 24-months follow-up. Am J Med Case Rep (2017) 5:205-216. [CrossRef]
- Tóth C, Clemens Z. Type 1 diabetes mellitus successfully managed with the paleolithic ketogenic diet. Int J Case Rep Images (2014) 5:699-703. [CrossRef]
- Tóth C, Dabóczi A, Chanrai M, Schimmer M, Clemens Z. 38-Month Long Progression-Free and Symptom-Free Survival of a Patient With Recurrent Glioblastoma Multiforme: A Case Report of the Paleolithic Ketogenic Diet (PKD) Used As a Stand-Alone Treatment after Failed Standard Oncotherapy. Preprints (2019) 2019120264. [CrossRef]
- Tóth C, Dabóczi A, Howard M, Miller NJ, Clemens Z. Crohn’s disease successfully treated with the paleolithic ketogenic diet. Int J Case Rep Images (2016) 7:570-578. [CrossRef]
- Tóth C, Schimmer M, Clemens Z. Complete cessation of recurrent cervical intraepithelial neoplasia (CIN) by the paleolithic ketogenic diet: a case report. Journal of Cancer Research and Treatment (2018) 6:1-5. [CrossRef]
- van Zuuren EJ, Fedorowicz Z, Kuijpers T, Pijl H. Effects of low-carbohydrate- compared with low-fat-diet interventions on metabolic control in people with type 2 diabetes: a systematic review including GRADE assessments. Am J Clin Nutr (2018) 1;108(2):300-331. [CrossRef]
- Venugopal SK, Mowery ML, Jialal I. C Peptide. [Updated 2020 Jul 2]. In: StatPearls [Internet]. Treasure Island (FL): StatPearls Publishing; 2021 Jan.
- Voegtlin, WL. The stone age diet: Based on in-depth studies of human ecology and the diet of man.(1975) New York: Vantage Press.
- Wilder, R. The effect of ketonemia on the course of epilepsy. Mayo Clinic Bulletin (1921) 2:307.
- Yosten GL, Maric-Bilkan C, Luppi P, Wahren J. Physiological effects and therapeutic potential of proinsulin C-peptide. Am J Physiol Endocrinol Metab. 2014 Dec 1;307(11):E955-68. [CrossRef]
|
Disclaimer/Publisher’s Note: The statements, opinions and data contained in all publications are solely those of the individual author(s) and contributor(s) and not of MDPI and/or the editor(s). MDPI and/or the editor(s) disclaim responsibility for any injury to people or property resulting from any ideas, methods, instructions or products referred to in the content. |
© 2023 by the authors. Licensee MDPI, Basel, Switzerland. This article is an open access article distributed under the terms and conditions of the Creative Commons Attribution (CC BY) license (http://creativecommons.org/licenses/by/4.0/).
