Preprint
Article

Thermal Activation of High-Alumina Coal Gangue Auxiliary Cementitious Admixture: Thermal Transformation, Calcining Product Formation and Mechanical Properties

Altmetrics

Downloads

59

Views

11

Comments

0

A peer-reviewed article of this preprint also exists.

Submitted:

08 December 2023

Posted:

12 December 2023

You are already at the latest version

Alerts
Abstract
In order to utilize high-alumina coal gangue (HACG) as auxiliary cementitious admixture, it is of fundamental significance to thermally activating Al2O3 effectively in HACG and promoting formation of hydratable products containing Al2O3. In this paper, a new preparation technology is developed to make HACG auxiliary cementitious admixture by thermal activation of HACG-Ca(OH)2 (CH) mixture. HACG powders mixed with 20wt.% CH were calcined within a temperature range of 600-900oC, the thermal transformation and mineral phase formation were analyzed by thermogavimetric analyzer (TGA), X-ray diffractometer (XRD), scanning electron microscope (SEM) and energy dispersive X-ray spectrometer (EDS). The hydration reaction between activated HACG-CH mixture and cement was also investigated. HACG experienced a conventional transformation from kaolinite to metakaolin at 600oC and finally to mullite at 900oC. However, CH underwent an unexpected transformation process from CH to CaO, then to CaCO3, and finally to CaO again with increasing calcining temperature. These substances states were associated with dehydroxylation of CH, chemical reaction between CaO and CO2 generating from combustion of carbon in HACG, and decomposition of CaCO3, respectively. It is the formation of a large amount of CaO above 800oC that favors the formation of hydratable products containing Al2O3 in the calcining process and C-A-H gel in hydration process. The mechanical properties of HACG-cement mortar specimens were measured, from which the optimal calcination temperature for preparing HACG auxiliary cementitious admixture was determined to be 850oC. As compared with pure cement mortar specimens, the maximum 28-d flexural and compressive strength of HACG-cement mortar specimens increased by 5.4% and 38.2%, respectively.
Keywords: 
Subject: Engineering  -   Architecture, Building and Construction

1. Introduction

As the largest producer and consumer of coal resource in the world, China has numerous coal mines across the country, which yielded a coal output of 4.07 billion tons in 2021 [1]. Meanwhile, an increasingly serious and urgent problem facing the coal production enterprises is associated with the large amount of coal gangue (CG) discharged during coal production process, since the annual output of CG amounts to hundreds of million tons and the accumulation of CG has reached 7 billion tons in China. CG is a type of rock with low carbon content, and has long been regarded as solid waste in China [2,3]. Although a little part of CG has been reported to be utilized in various applications, such as road base material in road engineering, backfill material in coal mine and coarse aggregate in concrete production instead of natural stone material, the vast majority of CG has not been utilized effectively up to date, and still occupies lots of land for storage, which gives rise to a series of environmental pollution problems such as turbid air, muddy underground water and spontaneous combustion [4,5,6,7,8,9].
The chemical composition of CG varies enormously depending on coal production region in China [10]. After removal of carbon in CG by the method of calcination, the remained main components are Al2O3, SiO2 and CaO, their contents range widely from 14.9 wt.% to 34.3 wt.%, 31.1 wt.% to 66.4 wt.% and 0.21wt.% to 9.03 wt.%, respectively [11]. CG is thus can be classified into three categories with respect of the content of Al2O3 or molar ratio of Al2O3 to SiO2 according to the classification of CG, i.e. high-alumina CG (HACG), claystone CG and sandstone CG [12]. Among them, HACG has the highest content of Al2O3 above 30wt.%, and the highest molar ratio of Al2O3 to SiO2 ranging from 0.46 to 0.55, which means that the primary mineral constituent in HACG is kaolinite. HACG is primarily discharged in coal mines in North China, such as Inner Mongolia Autonomous Region and Shanxi Province. The raw CG produced in coalfields in Datong city, Shanxi province, China, is reported to have a high level of carbon content above 20wt%, but after calcining at 750oC, the remained CG contain 32wt.%-38wt.%Al2O3, 41wt.%-47wt.%SiO2 and 0.05wt.%-0.15wt.%CaO respectively, which means that it is a typical type of HACG with high carbon and low calcium oxide [13].
There have been many investigations on applications of CGs in building materials [14,15,16,17]. As compared with ordinary Portland cement, both claystone CG and sandstone CG have a little higher content of Al2O3 and much higher content of SiO2, but less content of CaO. Therefore, these two types of CG are usually prepared as auxiliary cementitious admixture by the two following processing routes. The first route is to thermally activate CG at 700oC and then to blend activated CG auxiliary cementitious admixture in cement with a certain dosage for use. The second route is to increase calcium oxide content by addition of minerals containing calcium element in CG, such as lime, limestone, gypsum and fluorite, and then to calcine CG with the minerals at a high temperature above 1000oC for formation of hydratable products such as 3CaO•SiO2 (C3S), 2CaO•SiO2 (C2S) and so on. The second route requires a high calcining temperature since calcination at low temperatures of 500-900oC was not found to have a significant effect on improving activity of CG with addition of minerals containing calcium [18,19,20,21].
Since HACG has a much higher content of Al2O3 and a much lower content of CaO than ordinary Portland cement, the above two commonly used processing routes have obvious drawbacks to make auxiliary cementitious admixture using HACG. In the case of the first route, the great amount of Al2O3 in HACG cannot be fully utilized to produce hydratable products because of lack of an appropriate amount of CaO, while in the case of the second route, as the excessively high calcining temperature is required and consequently low pozzolanic activity of mullite forms, this will consume too much energy and reduce the mechanical properties of HACG-cement mortar. Furthermore, there is an important problem concerning selecting appropriate minerals containing CaO for HACG. To a certain extent, the mostly used minerals containing Ca element have little or big limitation. For example, limestone is required a high calcining temperature (about 900oC) for decomposition to CaO and CO2, while lime can react with CO2 to form CaCO3 owing to a large amount of CO2 generating from carbon combustion in HACG. These are major disadvantages that need to be overcome in preparation of HACG auxiliary cementitious admixture. Therefore, a new preparation technology needs to be developed for making HACG auxiliary cementitious admixture by means of an effective material as source of CaO and low-temperature activation.
The present paper is aimed at developing a new preparation technology to make HACG auxiliary cementitious admixture by adding Ca(OH)2 (CH) as the source of CaO and calcining at low temperature (below 900oC). The effect of calcining temperature on thermal transformation, evolution of mineral product phase and surface structure of HACG was analyzed. The flexural and compressive strengths of HACG-cement mortar specimens were also measured, and from which the optimal calcining temperature was determined.

2. Experimental details

2.1. Raw materials

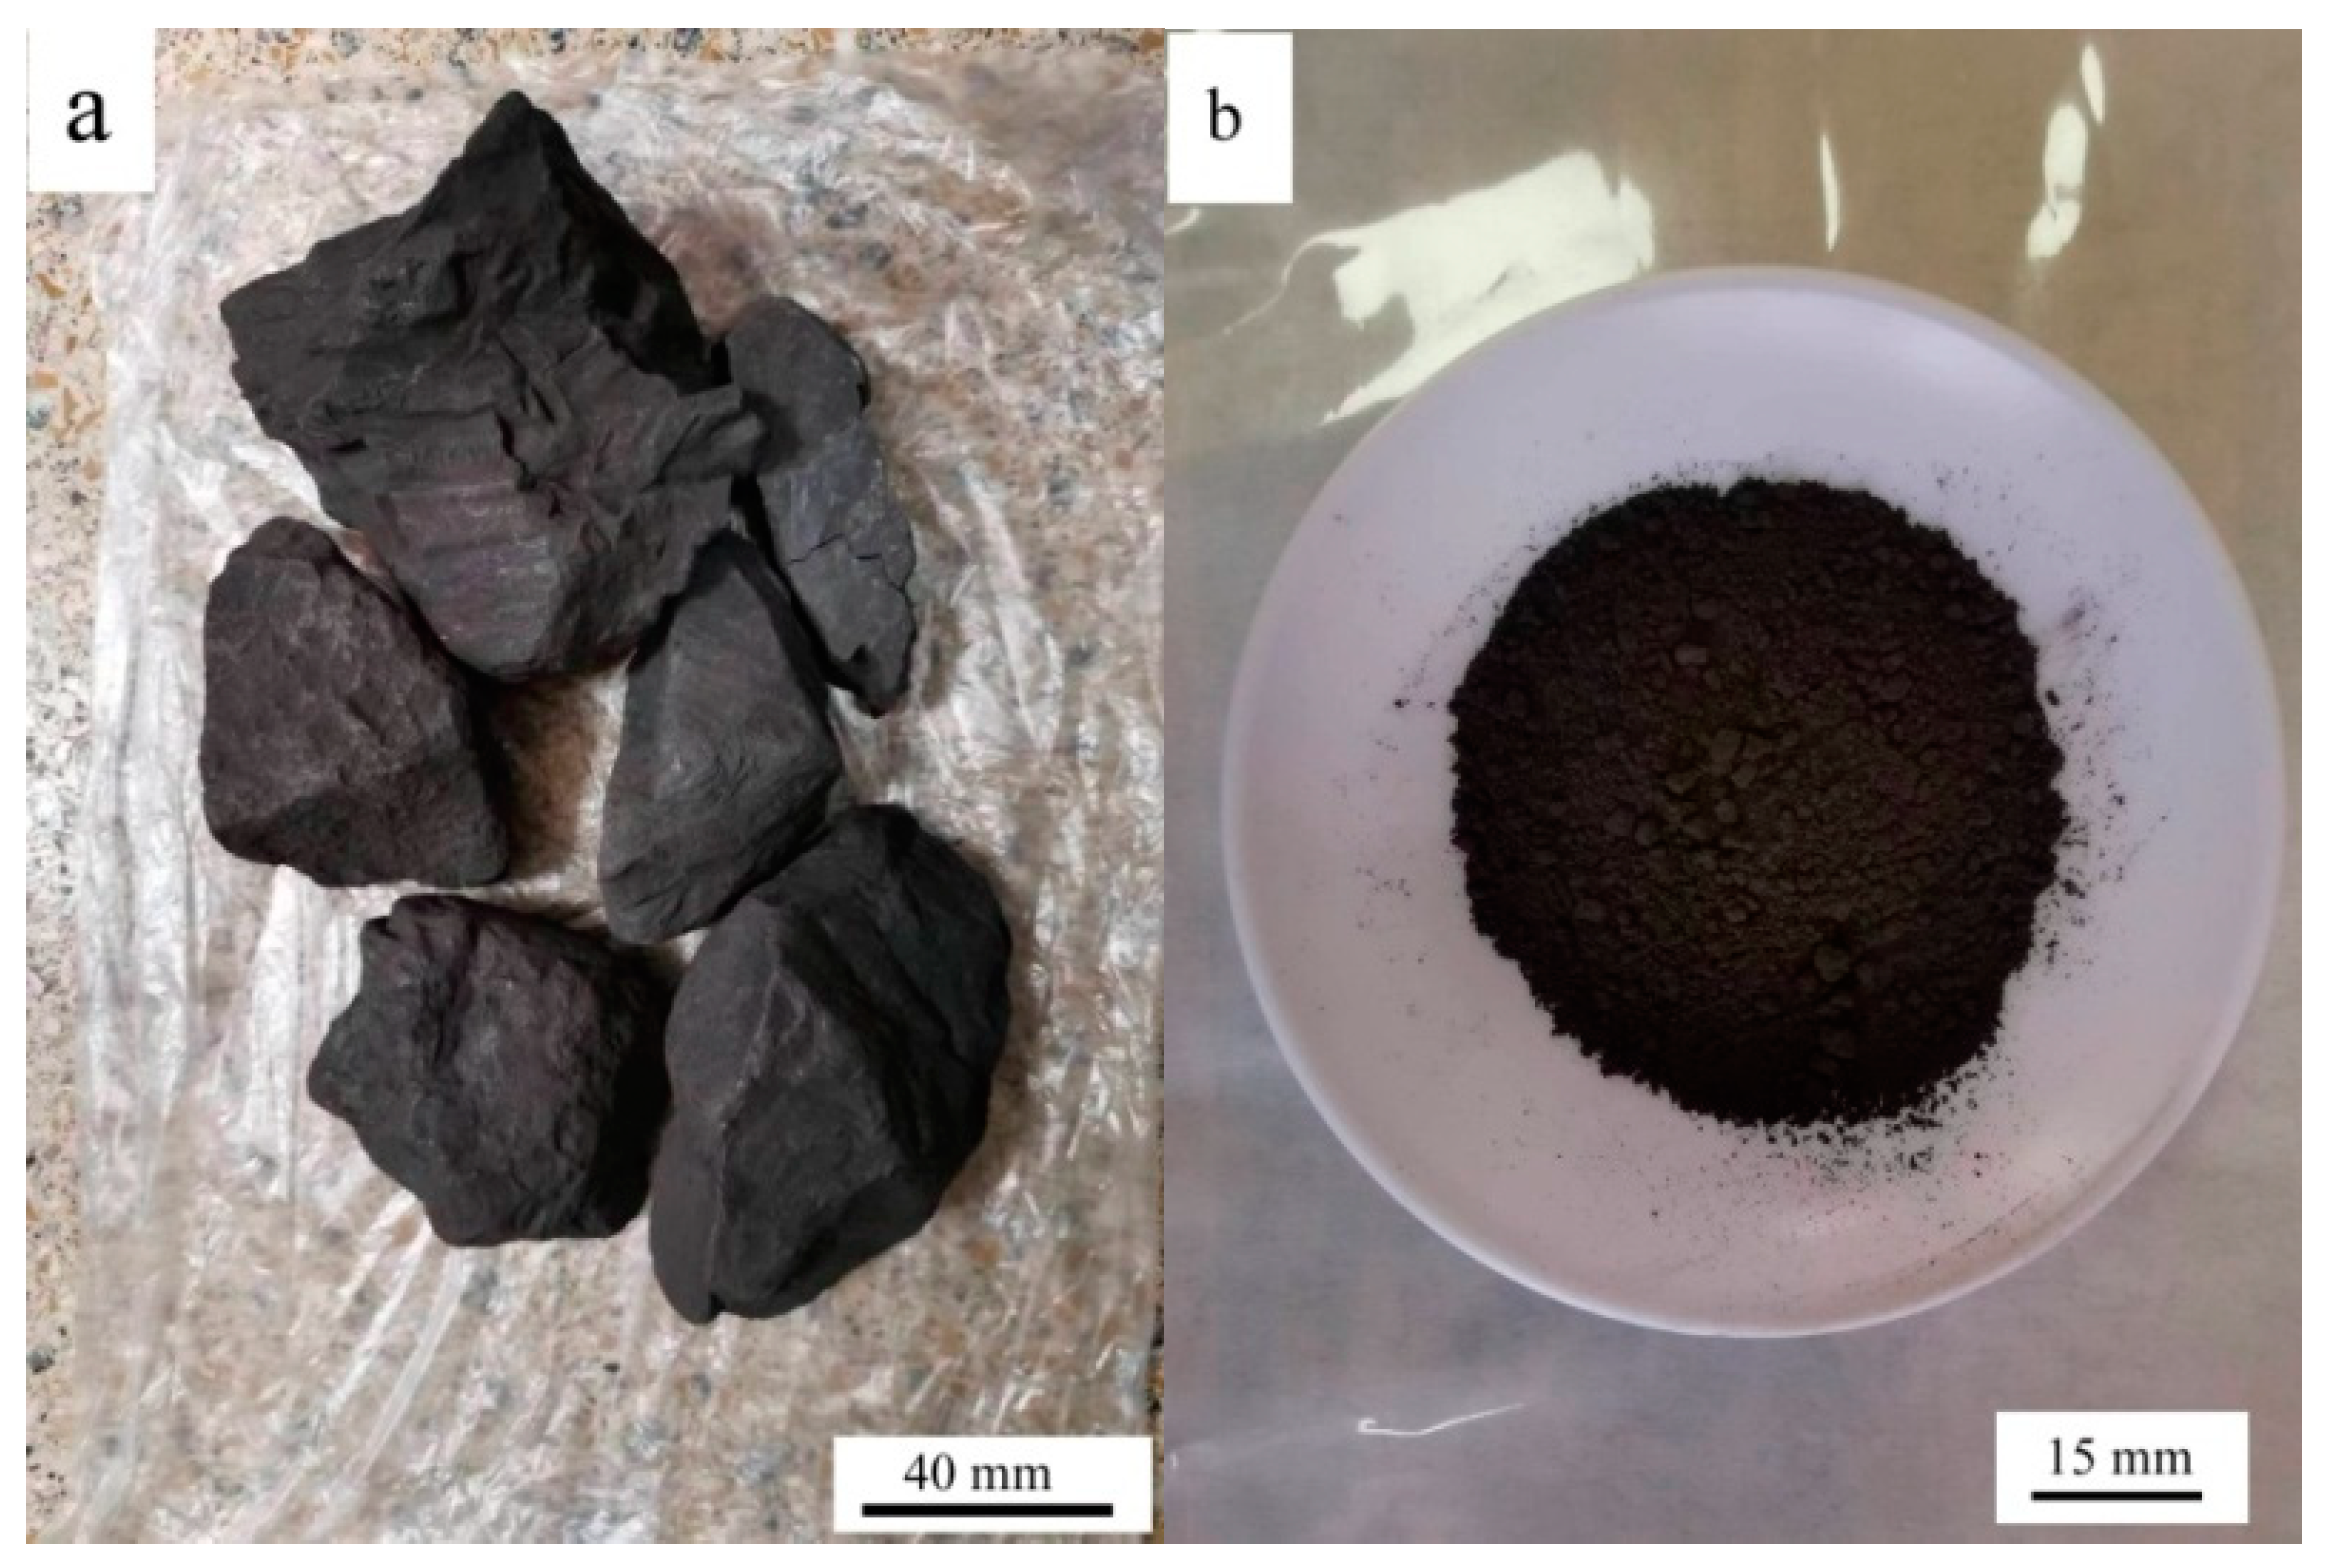
HACG was supplied by Jinneng Holding Coal Industry Group in Datong city, Shanxi Province, China. The blocky HACG was washed, then crushed into pieces with size of 4-6 mm using a XPC-100×150 jaw crusher, and finally smashed into powder using a GJ-1A sealed sample preparation crusher. Raw HACG blocks and smashed powder are shown in Figure 1. The particle size of prepared HACG powder was measured using a Mastersizer 3000 laser particle size analyzer, the mean particle size (d50) of HACG powder was 14.9 μm. The HACG particle size distribution is shown in Figure 2(a). The amount of carbon in HACG powder was estimated by a weight loss ratio method, i.e. weight loss ratio was obtained by the weight reduction after calcining 100 g HACG powder at a certain temperature for 2 h in a resistance furnace dividing the original weight. The weight loss ratios of as-received HACG at the calcining temperatures of 500-1100oC are shown in Figure 2(b). The weight loss ratio increased significantly with calcining temperature until 700oC, and then entered a steady state. The weight loss ratios were 21.2% and 21.4% after calcining at 700 and 800oC, respectively. This indicates that the raw HACG used in the present study contains a higher content of carbon than other types of CGs [6].
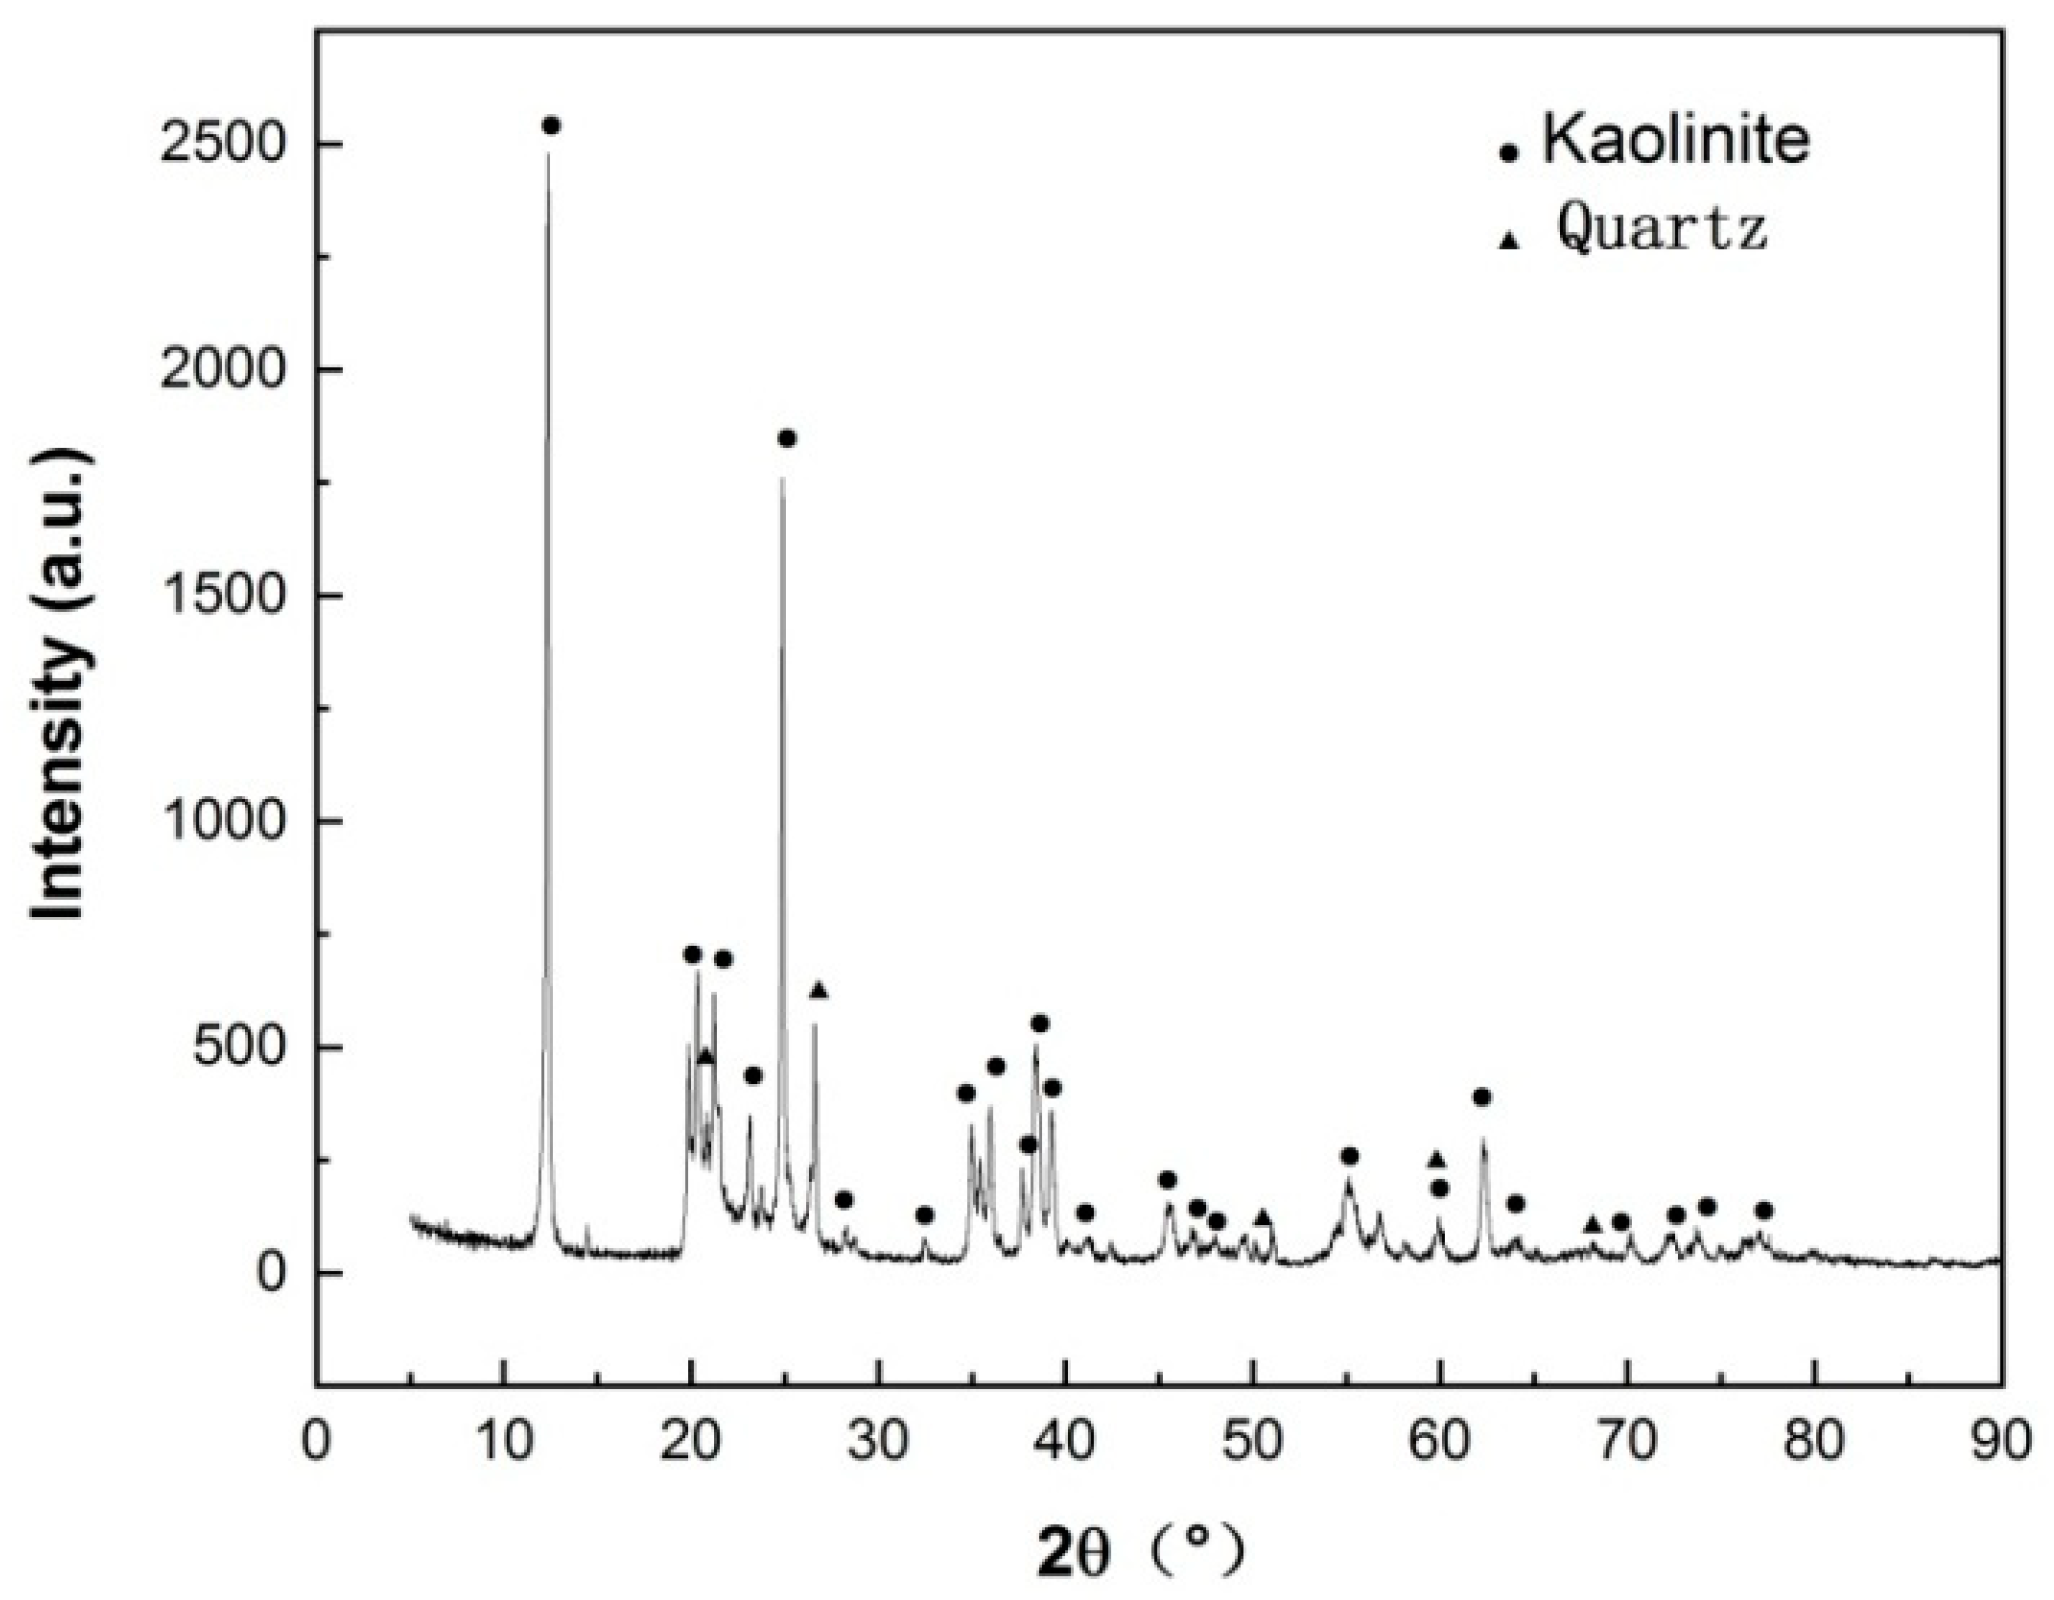
The chemical composition of HACG powder calcined at 700oC was measured using borate melting sample preparation method, as listed in Table 1. The calcined HACG has Al2O3 content as high as 45.01wt.%, and a molar ratio of Al2O3 to SiO2 as high as 0.50 closed to that of metakaolin, but has only 0.11wt.% CaO. The CG used in the present study thus is a typical high alumina and low calcium oxide composition. The mineralogical phases in as-received coal gangue were determined by A Rigaku D/MAX 2500PC X-ray diffractometer (XRD), as shown in Figure 3, from which as-received HACG was identified to consist mainly of kaolinite (Al2O3•2SiO2•2H2O) with a high degree of crystallinity and a little amount of quartz. Ordinary Portland cement (P.O 42.5) was furnished by Yangchun Cement Co., Ltd in Zhucheng City, China, its composition is also given in Table1. ISO standard sand produced by Xiamen ISO standard Sand Co., Ltd. in Xiamen City, China, was used for preparing mortar specimens.

2.2. Adding calcium and thermal activation

In order to compensate for the lack of CaO in as-received HACG, CH (purity above 97wt.%) powder with a average particle size of 22 μm was used to blend in HACG powder. CH powder accounted for 20wt.% of the total weight of HACG-CH mixture. Before thermal activation, HACG and CH powders were mixed thoroughly for 1 h in a V type mixer. Thermal activation of HACG-CH mixtures was performed at various temperatures of 600, 700, 800, 850 and 900oC for 2 h in a resistance furnace, which finally yielded HACG auxiliary cementitious admixtures calcined at different temperatures. The thermal transformation and weight loss of the HACG- CH mixture were analyzed under Ar atmosphere and under air condition using a STA7300 thermogravimetric (TG)/differential thermal analyzer (DTA), respectively. The calcining product phases and surface structures of HACG auxiliary cementitious admixtures were analyzed using XRD and a VEGA3 TESCAN scanning electron microscope (SEM) equipped with an energy dispersive X-ray spectrometer (EDS), respectively.

2.3. Hydration products

HACG auxiliary cementious admixtures calcined at different temperatures were mixed with cement thoroughly with a fixed ratio of 3 to 7, respectively. The HACG- cement mixtures were then added with water and stirred to prepare pastes. The ratio of HACG-cement mixture to water was 1 to 0.5. The pastes were poured into test tubes, and then cured in the sealed test tube at 20oC. After cured for 7 days, the prepared samples were taken out of the test tubes, smashed and ground into fine powders for identifying hydration products via XRD technique.

2.4. Flexural and compressive strength

In order to evaluate the effect of calcining temperature on flexural and compressive strength of HACG-cement mortar, HACG auxiliary cementitious admixtures calcined at different temperatures were blended thoroughly with Portland cement for 1 h in a V-type mixer. HACG auxiliary cementitious admixture was used to replace 30% of Portland cement. HACG-cement mortar specimens were prepared according to Chinese National Standard GB/T 17671-2021 [22]. HACG auxiliary cementitious admixture+Portland cement, sand and water were blended together in the weight proportion 1:3:0.5 to prepare regular square prism mortar specimens of 40×40×160 mm3. After curing in water at room temperature of 20oC for 7 days and 28 days, the prepared HACG-cement mortar specimens were used to test flexural and compressive strength Rf and Rc, as expressed by Eq.(1) and (2), respectively.
R f = 1.5 F f L b 3
R c = F c A
where Ff is the flexural fracture load, L is fulcrum spacing, i.e. 100 mm, b is the side length of the section, i.e. 40 mm, Fc is the maximum compressive load, A is the compression area, i.e. 1600 mm2.
Small flakes with the fracture surfaces were obtained from 28-d flexural strength specimens. The fracture surfaces of small flakes were coated with gold to increase the conductivity, and then were observed using SEM and EDS for analyzing fracture mode and chemical composition. The elemental mappings of O, Ca, C, Si, Al and S were conducted on the fracture surfaces to analyze the hydration state of HACG auxiliary cementitious admixture in HACG-cement mortar.

3. Results and Discussion

3.1. Thermal transformation of HACG-CH mixture

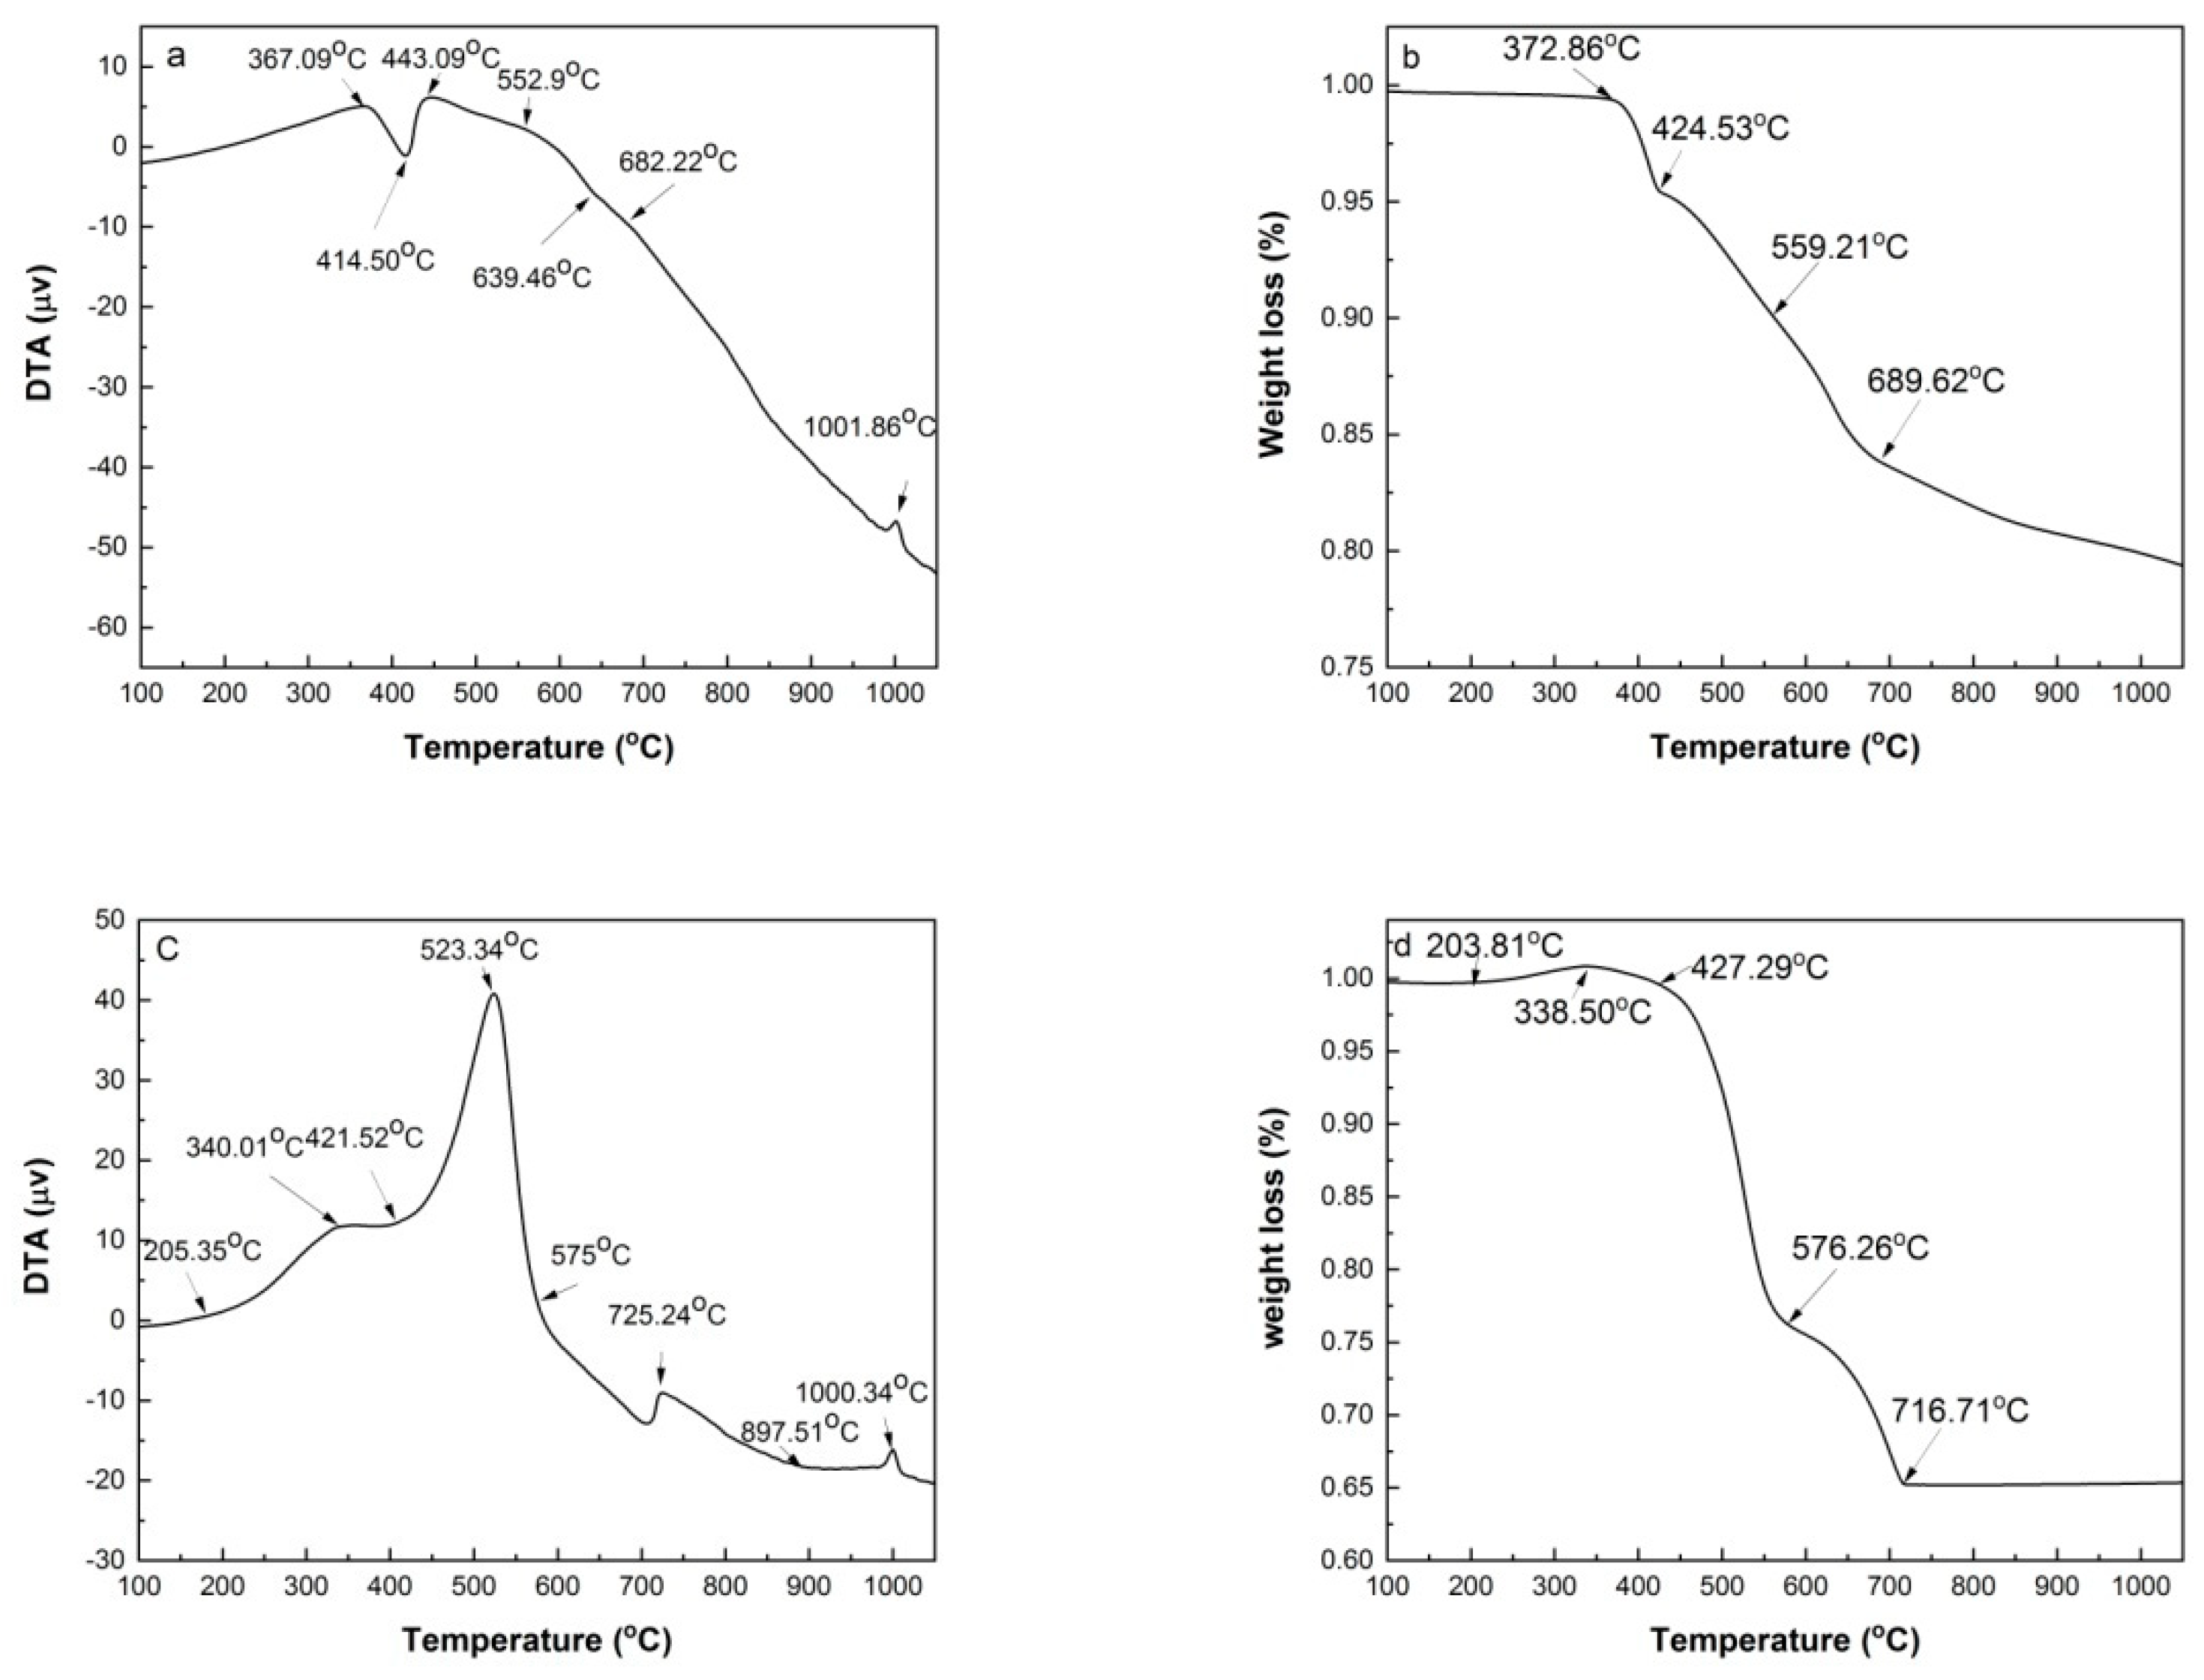
Figure 4 shows DTA and TG curves of HACG powder mixed with CH obtained under Ar atmosphere and air conditions. The reason for conducting the measurement under Ar gas atmosphere is to mainly prohibit many influence factors, such as H2O and CO2 in air and combustion of carbon in HACG, from involving in the thermal transformation process, and thus the analysis of thermal transformation of HACG-CH mixture would be simple and clear. Under Ar atmosphere, as seen from Figure 4(a), there are an evident endothermic peak at 414.50oC and a small exothermic peak at 1001.86oC on DTA curve. The former corresponds to the dehydroxylation of CH, and its onset and finish temperatures are 367.09oC and 443.09oC respectively, while the latter represents the formation of mullite [23]. Moreover, there is an almost imperceptible endothermic peak between 552.97 and 682.22oC, at 639.46oC exactly, which derives from the dehydroxylation of kaolinite. This deduction was made based on the fact that raw coal gangue was found to be dehydrated to form metakaolin (Al2O3•2SiO2) in the temperature range of 555.73-689.90oC by DTA analysis under Ar atmosphere (not shown here). It is noted that the dehydroxylation temperature for kaolinite in the studied HACG is much higher than that of CGs discharged in other regions in China. This might be attributed to a high degree of crystallinity in kaolinite for the studied HACG. The CGs including kaolinite-type CG discharged in Hebei Province and Jiangsu Province in China, were reported to be dehydrated around a lower temperature between 510oC and 550oC [24,25]. Similarly, kaolinite in HACG produced in Taiyuan coalfield in Shanxi Province, China, was also reported to undergo a dehydroxylation process in a higher temperature range of 550-700oC [26]. The thermal transformations such as dehydroxylation of CH and kaolinite were directly reflected on TG curve, as shown in Figure 4(b). Almost no weight loss was observed before 372.86oC, but a rapid weight loss occurred in the range of 372.86-424.53oC due to dehydroxylation of CH, thereafter weight loss proceeded moderately before 559.21oC, and then became a little significant in the temperature range of 559.21oC-689.62oC due to dehydroxylation of kaolinite, and finally turned to be mild until 1050oC due to volatilization of some matters in HACG.
Under air condition, the thermal transformation and weight loss variation were more complicated than under Ar gas protection condition. As seen from Figure 4(c), there are four exothermic peaks in DTA curve. They are at 340.01oC, 523.34oC, 725.24oC and 1000.34oC, respectively. The first three are not observed on the DTA curve measured under Ar atmosphere. The first one was resulted from the formation of a trace of CaCO3, i.e. CH reacted with CO2 in air to produce CaCO3 and H2O, as expressed by Eq.(3). The second one originated from combustion of carbon in HACG, namely the burning of a large amount of carbon in HACG led to an intense and sharp exothermic peak. The third one was associated with the formation of CaCO3 due to a large amount of CO2 produced from the combustion of carbon in HACG and its reaction with CaO generated from dehydroxylation of CH, as expressed by Eq.(4). The fourth one corresponded to the formation of mullite. In addition, there were two endothermic peaks, the obvious one was at 421.52oC, and the weak one was at 897.51oC. The two endothermic peaks were attributed to the dehydroxylation of CH and decomposition of CaCO3, respectively.
Ca(OH)2+CO2 →CaCO3+H2O
CaO+CO2 →CaCO3
These thermal transformations were also reflected on TG curve, as illustrated in Figure 4(d). It was noted that a little weight gain occurred in the temperature range of 203.81-338.50oC due to formation of a trace of CaCO3 and H2O. The weight loss was mild in the temperature range of 338.50-427.29oC owing to dehydroxylation of CH, and became more intense until 576.26oC owing to carbon combustion in HACG, thereafter it entered into a moderate to rapid stage until 716.77oC owing to the effect of dehydroxylation process of kaolinite and the opposite effect of CaCO3 formation. The evidences regarding CH dehydroxylation into CaO, and CaCO3 generating form the reaction between CaO and carbon combustion-induced CO2 were further confirmed by the XRD and SEM analysis in Section 3.2 and Section 3.3.

3.2. Calcination products of HACG –CH mixtures

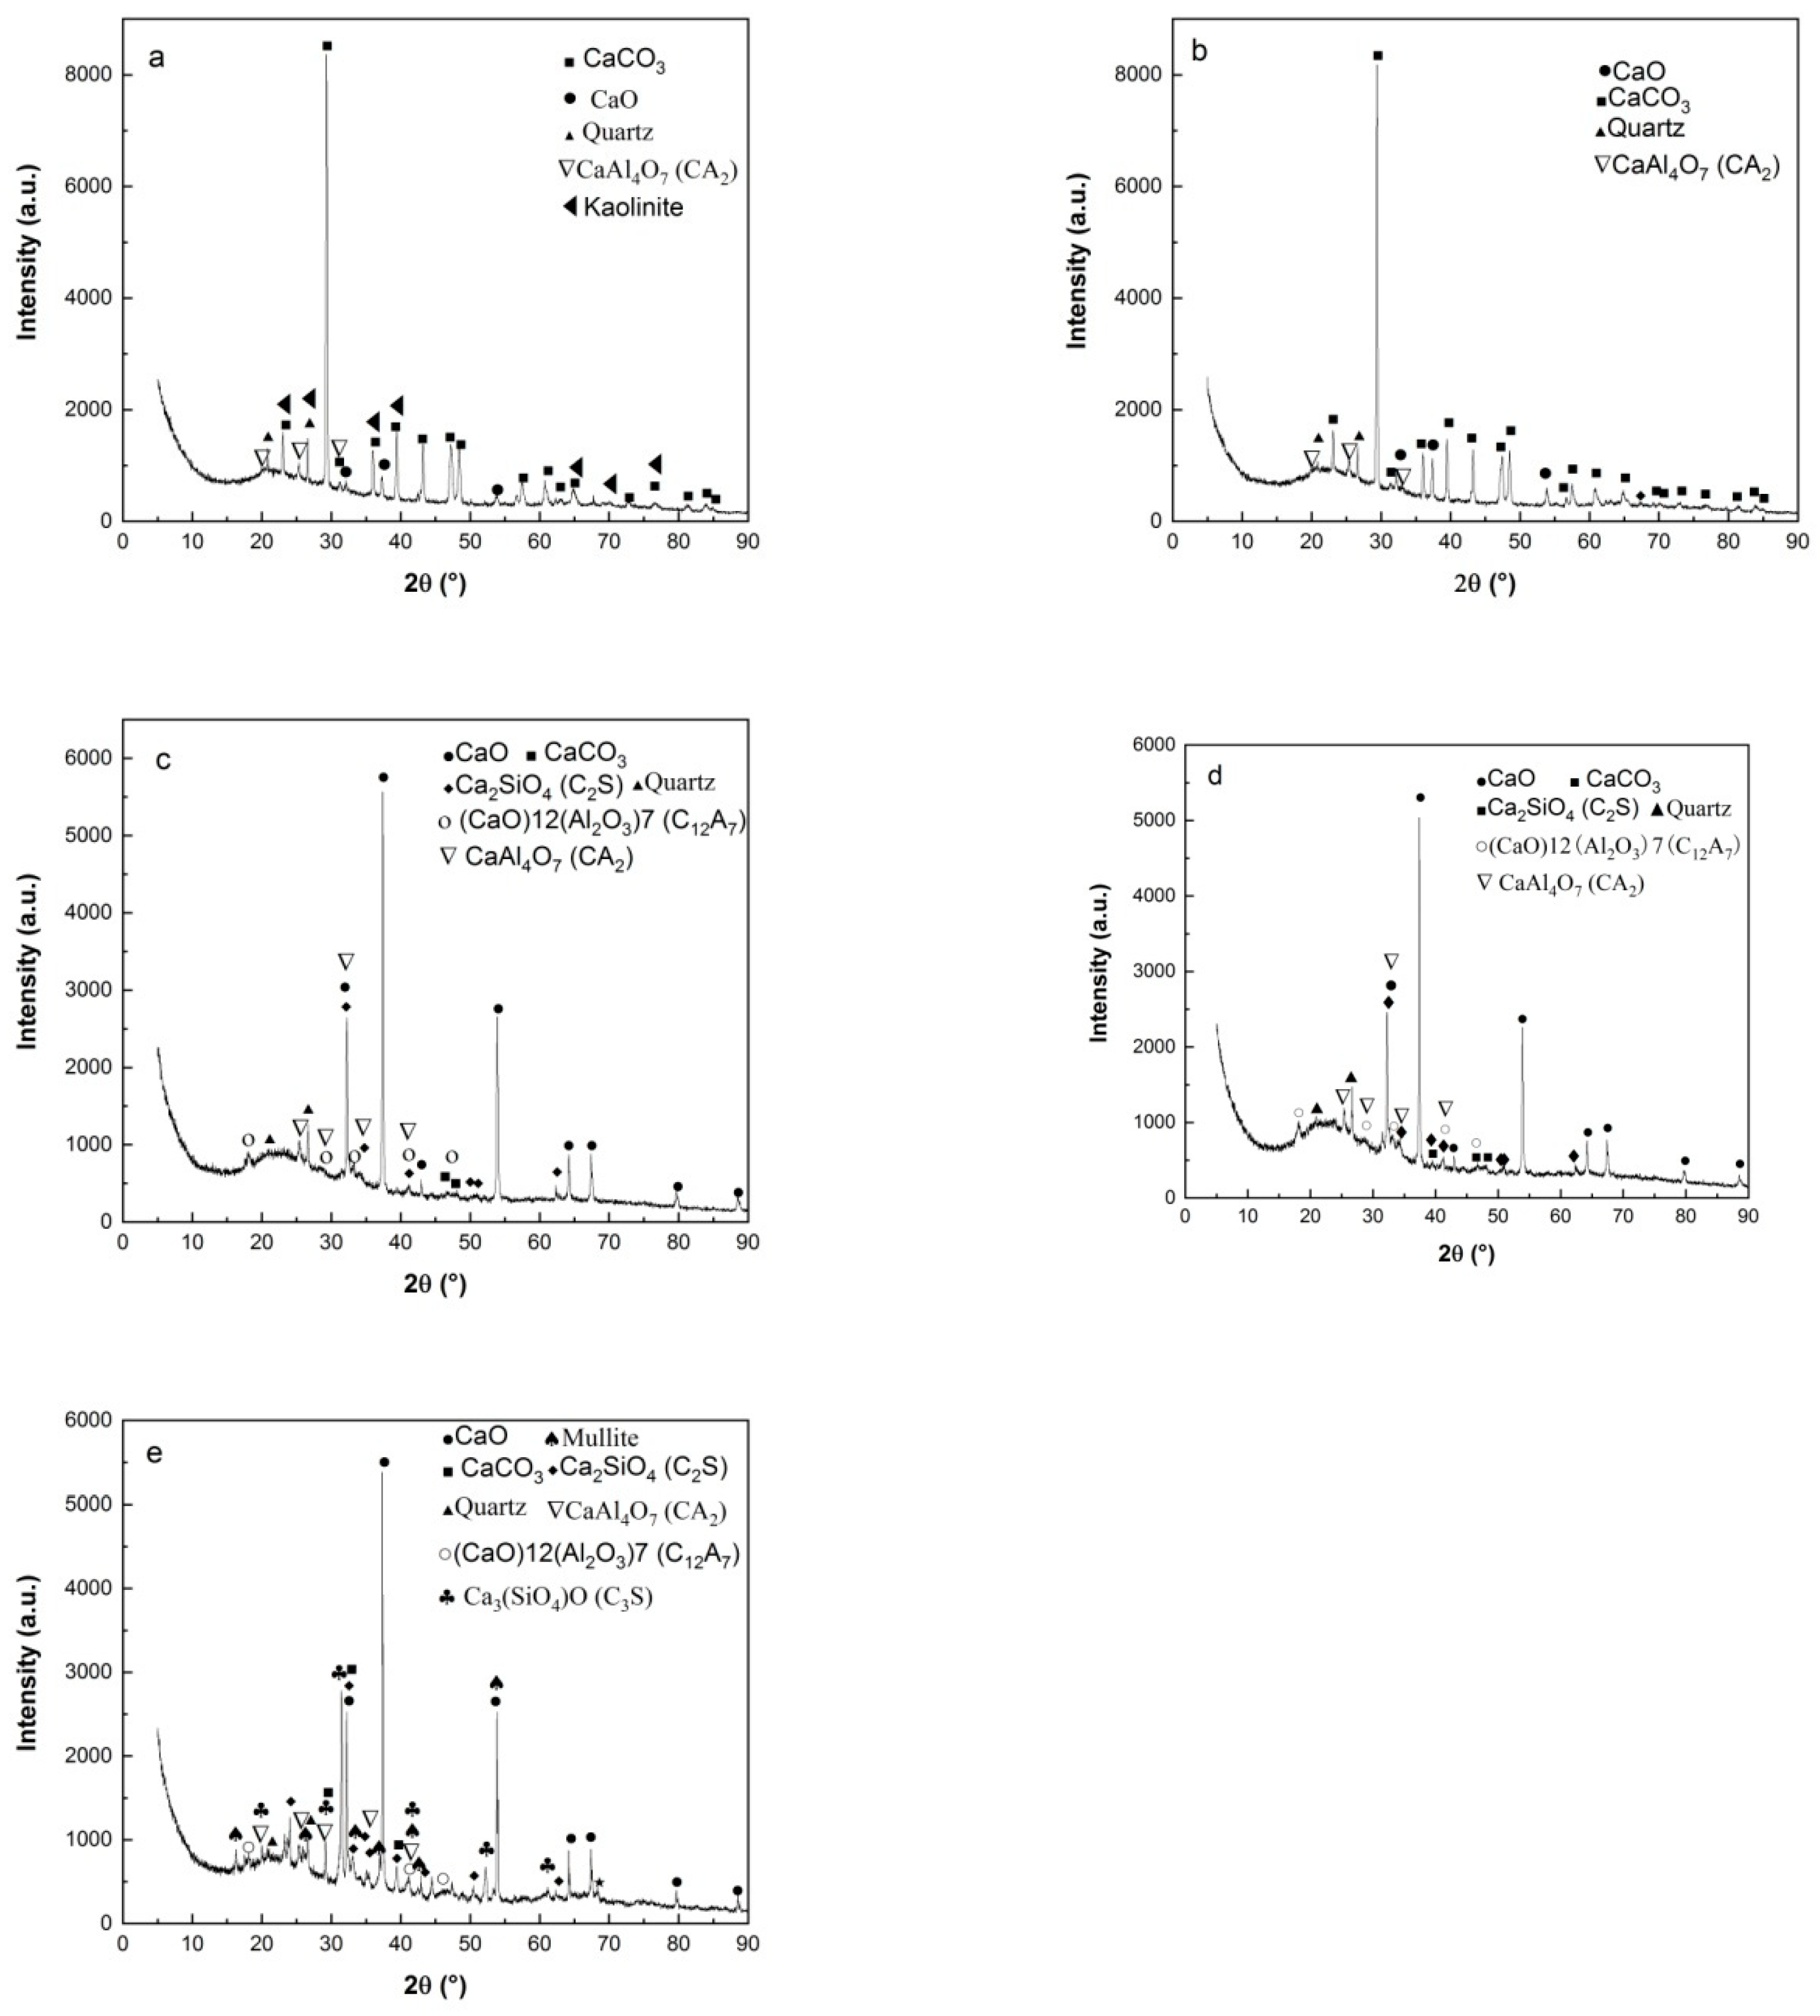
The calcination products of HACG powders mixed with CH calcined at different temperatures was analyzed by XRD, as shown in Figure 5. At 600oC, the typically strong diffraction peaks of kaolinite at 2θ=12.35o and 24.85o found in raw HACG disappeared, and a low intensity hump emerged within 15o to 25o, suggesting that kaolinite began to transform into amorphous metakaolin (Figure 5(a)). Metakaolin is reported to have excellent pozzolanic properties for containing silica and alumina in an active form [27,28]. Meanwhile, a little amount of CaO and CaAl4O7 (CaO•2Al2O3 (CA2)) were found since their diffraction peaks were relatively weak. However, a great amount of CaCO3 was formed unexpectedly at this calcining temperature, since the strongest diffraction peak at 2θ=29.36o belong to CaCO3. Apparently, CH was totally dehydroxylated to form CaO at 600oC, and a little part of CaO reacted with Al2O3 in metakaolin to form CA2 accordingly, as expressed by Eq.(5). As for the formation of a large amount of CaCO3, C element in CaCO3 can only come from CO2 produced during combustion of carbon in HACG, as a rapid and significant carbon combustion-induced weight loss occurred in the temperature range of 427.29-576.26oC on TG curve in air. Therefore, a large amount of CO2 reacted with the most part of CaO, resulting in the massive formation of CaCO3. At 700oC, kaolinite was essentially transformed into metakaolin and the diffraction peaks of CaCO3 was still the most pronounced, while the other main constituent phases maintained their presence unchanged (Figure 5(b)).
CaO+Al2O3→CaO•2Al2O3
As temperature was increased to 800oC, the diffraction peaks of CaCO3 almost disappeared due to decomposition, while CaO demonstrated the most prominent diffraction peaks (Figure 5(c)). The formation of large amount of CaO is actually a turning point in improvement of the reactivity HACG. On the one hand, the transformation can facilitate the chemical reactions between CaO and SiO2 or Al2O3, namely the formation of hydratable mineral products such as Ca2SiO4 (2CaO•SiO (C2S)) and (CaO)12(Al2O3)7 (12CaO•7Al2O3(C12A7)), as expressed by Eq.(6) and (7). On the other hand, large amount of CaO can be transformed into quite amount of CH during hydration process, which helps the hydration reaction among CH, active SiO2 or Al2O3 in metakaolin and H2O. Therefore, the presence of a large amount of CaO in HACG-CH mixture could favors the enhancement in mechanical strength for HACG-cement mortar. At 850oC, the main mineral products were almost the same as those formed at 800oC, but the diffraction peaks of CA2, C2S and C12A7 became a little stronger (Figure 5(d)), indicating a little increase in their amounts. However, At the highest temperature of 900oC, the most significant change was the formation of crystallized mullite and (Ca3SiO4)O (3CaO•SiO (C3S)) (Figure 5(e)). Mullite was transformed from metakaolin as expressed by Eq.(8) [3], and C3S was formed by the reaction between CaO and SiO2, as expressed by Eq.(9). C3S is well known to be an effective hydratable product in cement, but mullite has almost no pozzolanic activity and consequently reduces the reactivity of CG [29,30,31]. Mullite has never been detected in HACG or other CGs by XRD analysis after calcined at a temperature below 950oC, according to the literatures available [24,25,26,30,31]. In the present study, the presence of mullite at 900oC could be promoted by a series of reactions between CaO and Al2O3 or SiO2 in metakaolin. These reactions damage the metakaolin structure greatly, and accelerate the formation of mullite. Although the amount of mullite was little at this temperature, the presence of mullite in HACG-CH mixture implies an increase in crystallinity degree for the remained metakaolin, which could decrease the reactivity of metakaolin and bring about a negative effect on mechanical properties of HACG-cement mortar.
2CaO+SiO2 →2CaO•SiO
CaO+Al2O3 →12CaO •7Al2O3
3(Al2O3•2SiO2)→3Al2O3•2SiO2+4SiO2
3CaO+SiO2 →3CaO•SiO

3.3. Surface structures of HACG- CH mixtures calcined at different temperatures

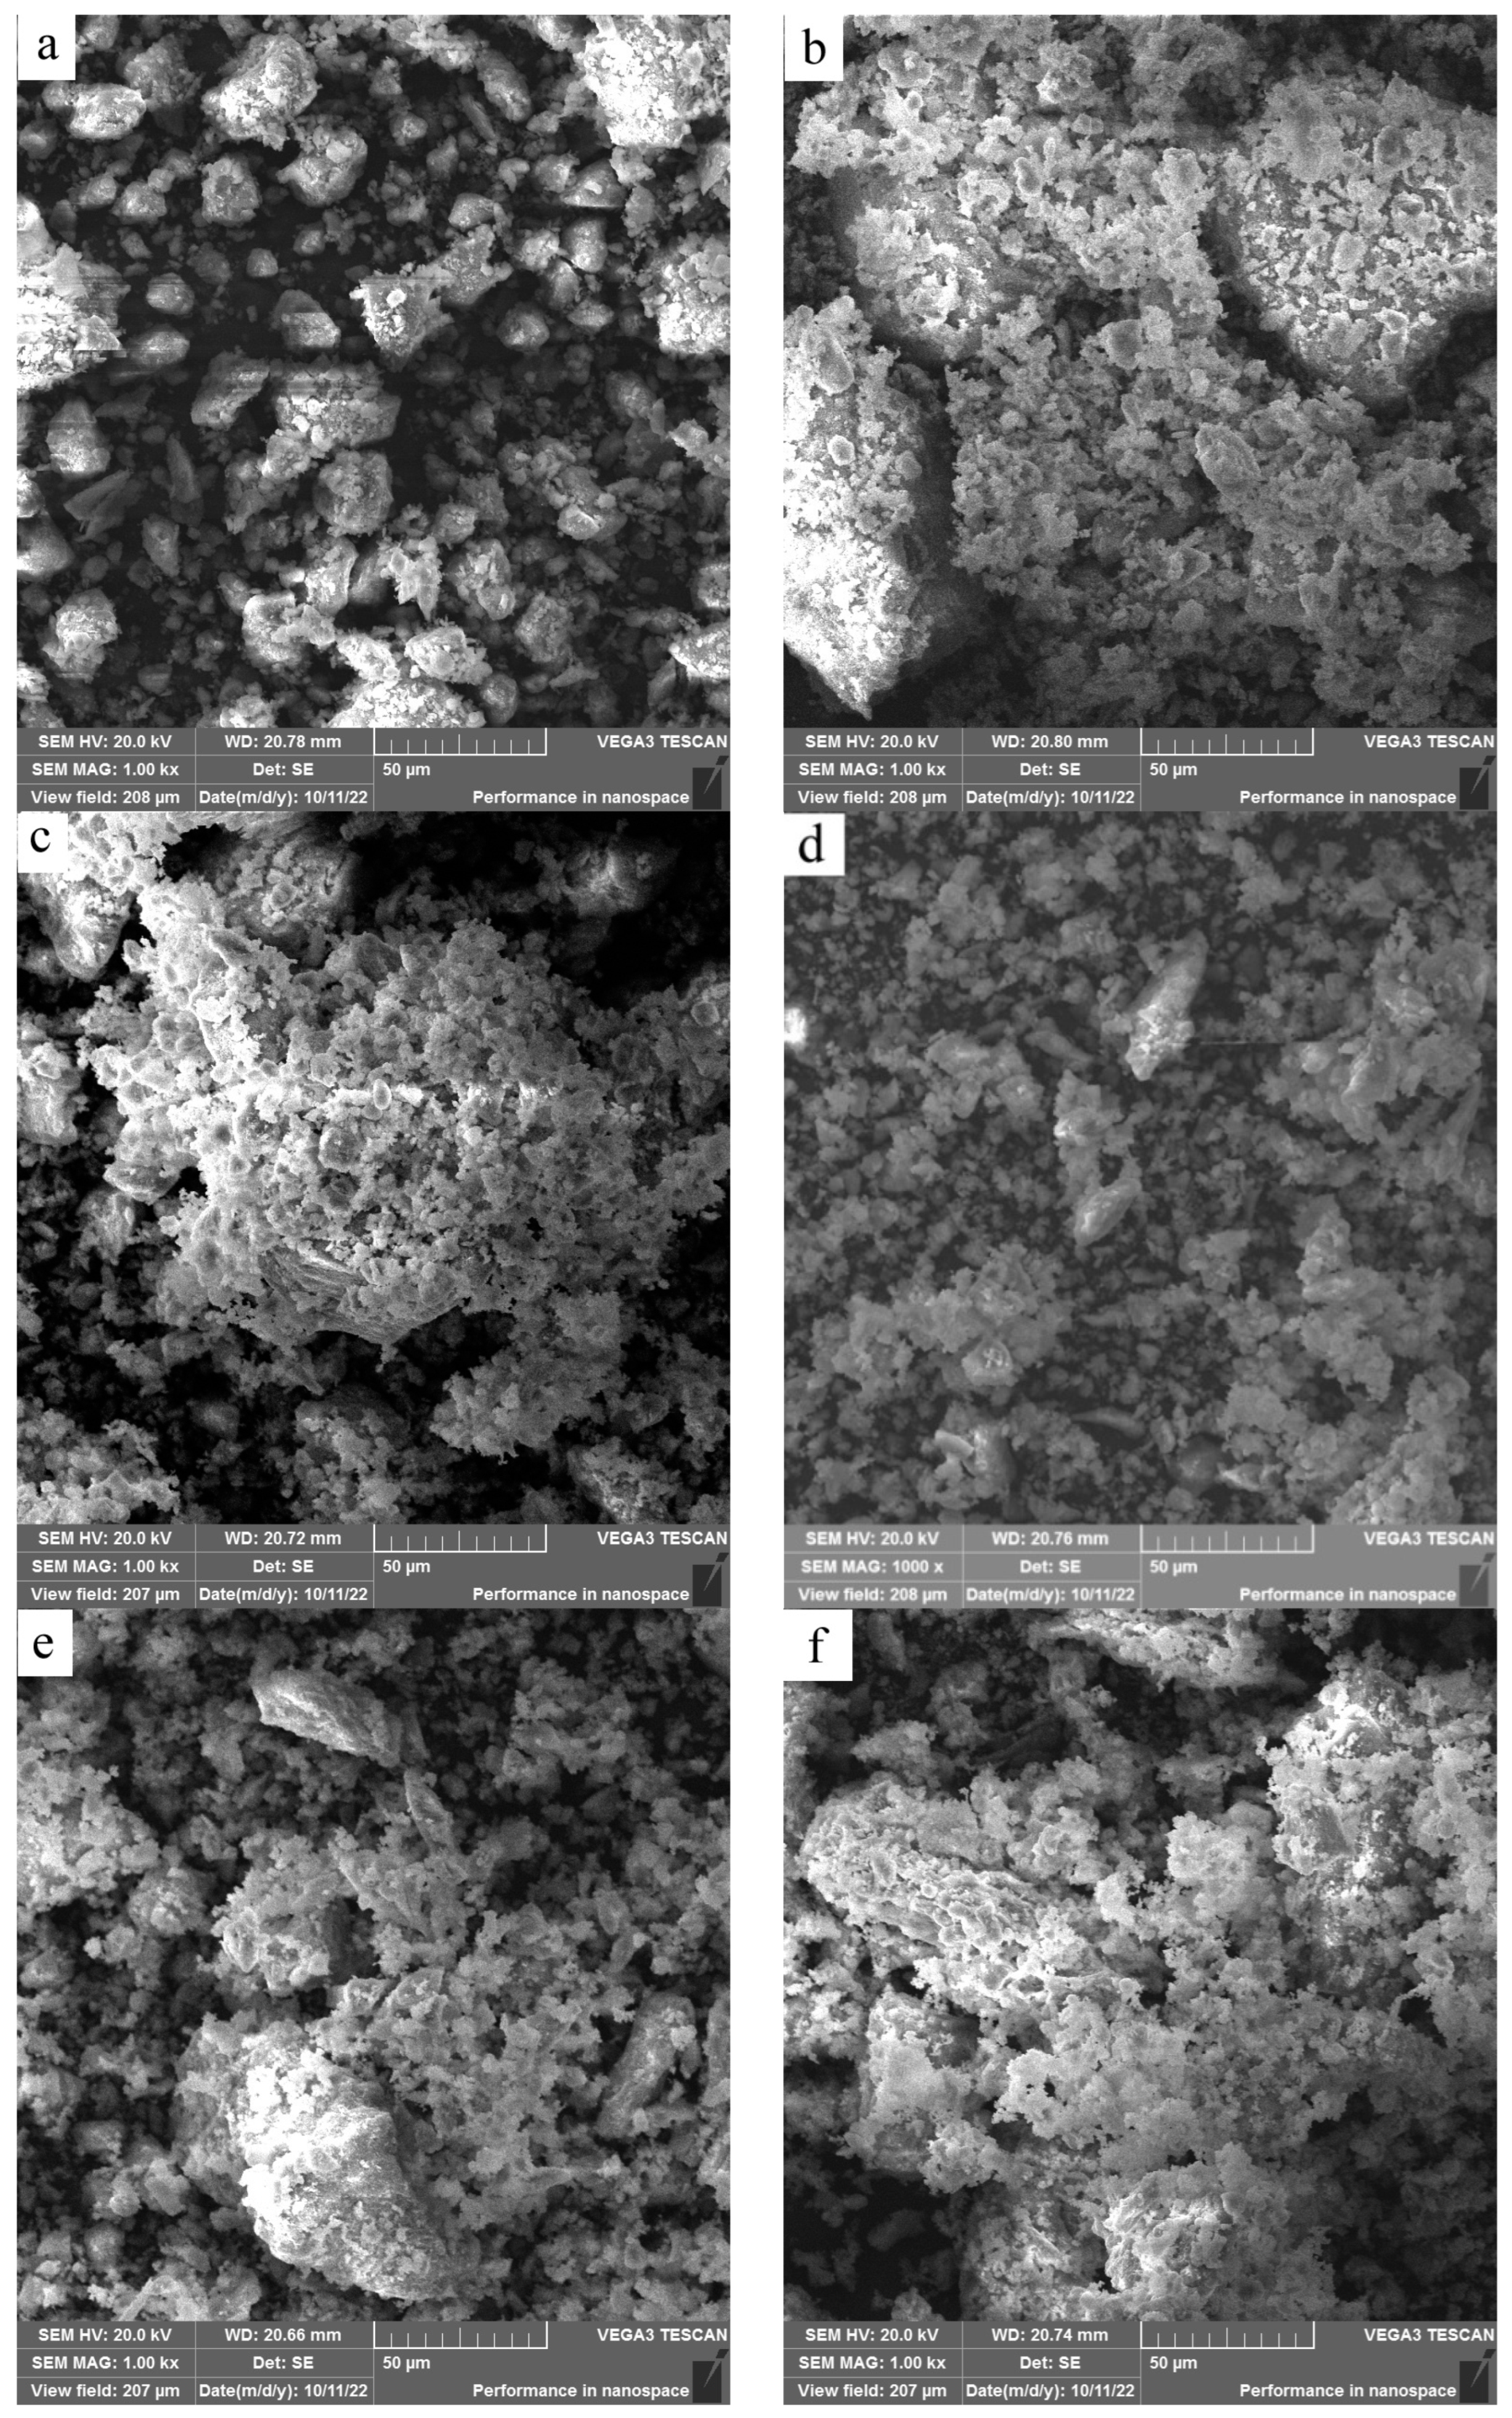
Figure 6 shows the morphologies of HACG powders mixed with CH calcined at different temperatures. As compared with original smashed HACG powder (Figure 6(a)), at 600oC, a lot of laminar products were formed on HACG particles (Figure 6(b)). They appeared to be a weathered surface layer with wide spacing between each piece, exposing the HACG substrate underneath. Such morphology could be brought by dehydroxylation and combustion of carbon in HACG or by the chemical reaction between HACG and CH. At 700oC, most part of laminar products became tiny and dense, covering almost entire surfaces of HACG particles, and the rest evolved into fine granules (Figure 6(c)). This morphological characteristic was associated with formation of large amount of CaCO3 on the original HACG particles as identified by latter EDS composition analysis. At 800oC, the surface products were essentially granular due to a large scale decomposition of CaCO3 into CaO (Figure 6(d)), while at 850oC, some plate-like products occurred besides granular particles, and they connected together (Figure 6(e)), which means that CaO reacted with metakaolin, producing more calcium aluminates and calcium silicates such as CA2, C12A7 and C2S as reveal by latter EDS analysis. At the highest temperature 900oC, the morphology of surface products changed significantly, some fine powders appeared besides more connected plate-like products (Figure 6(f)), indicating certain different reaction products generating.
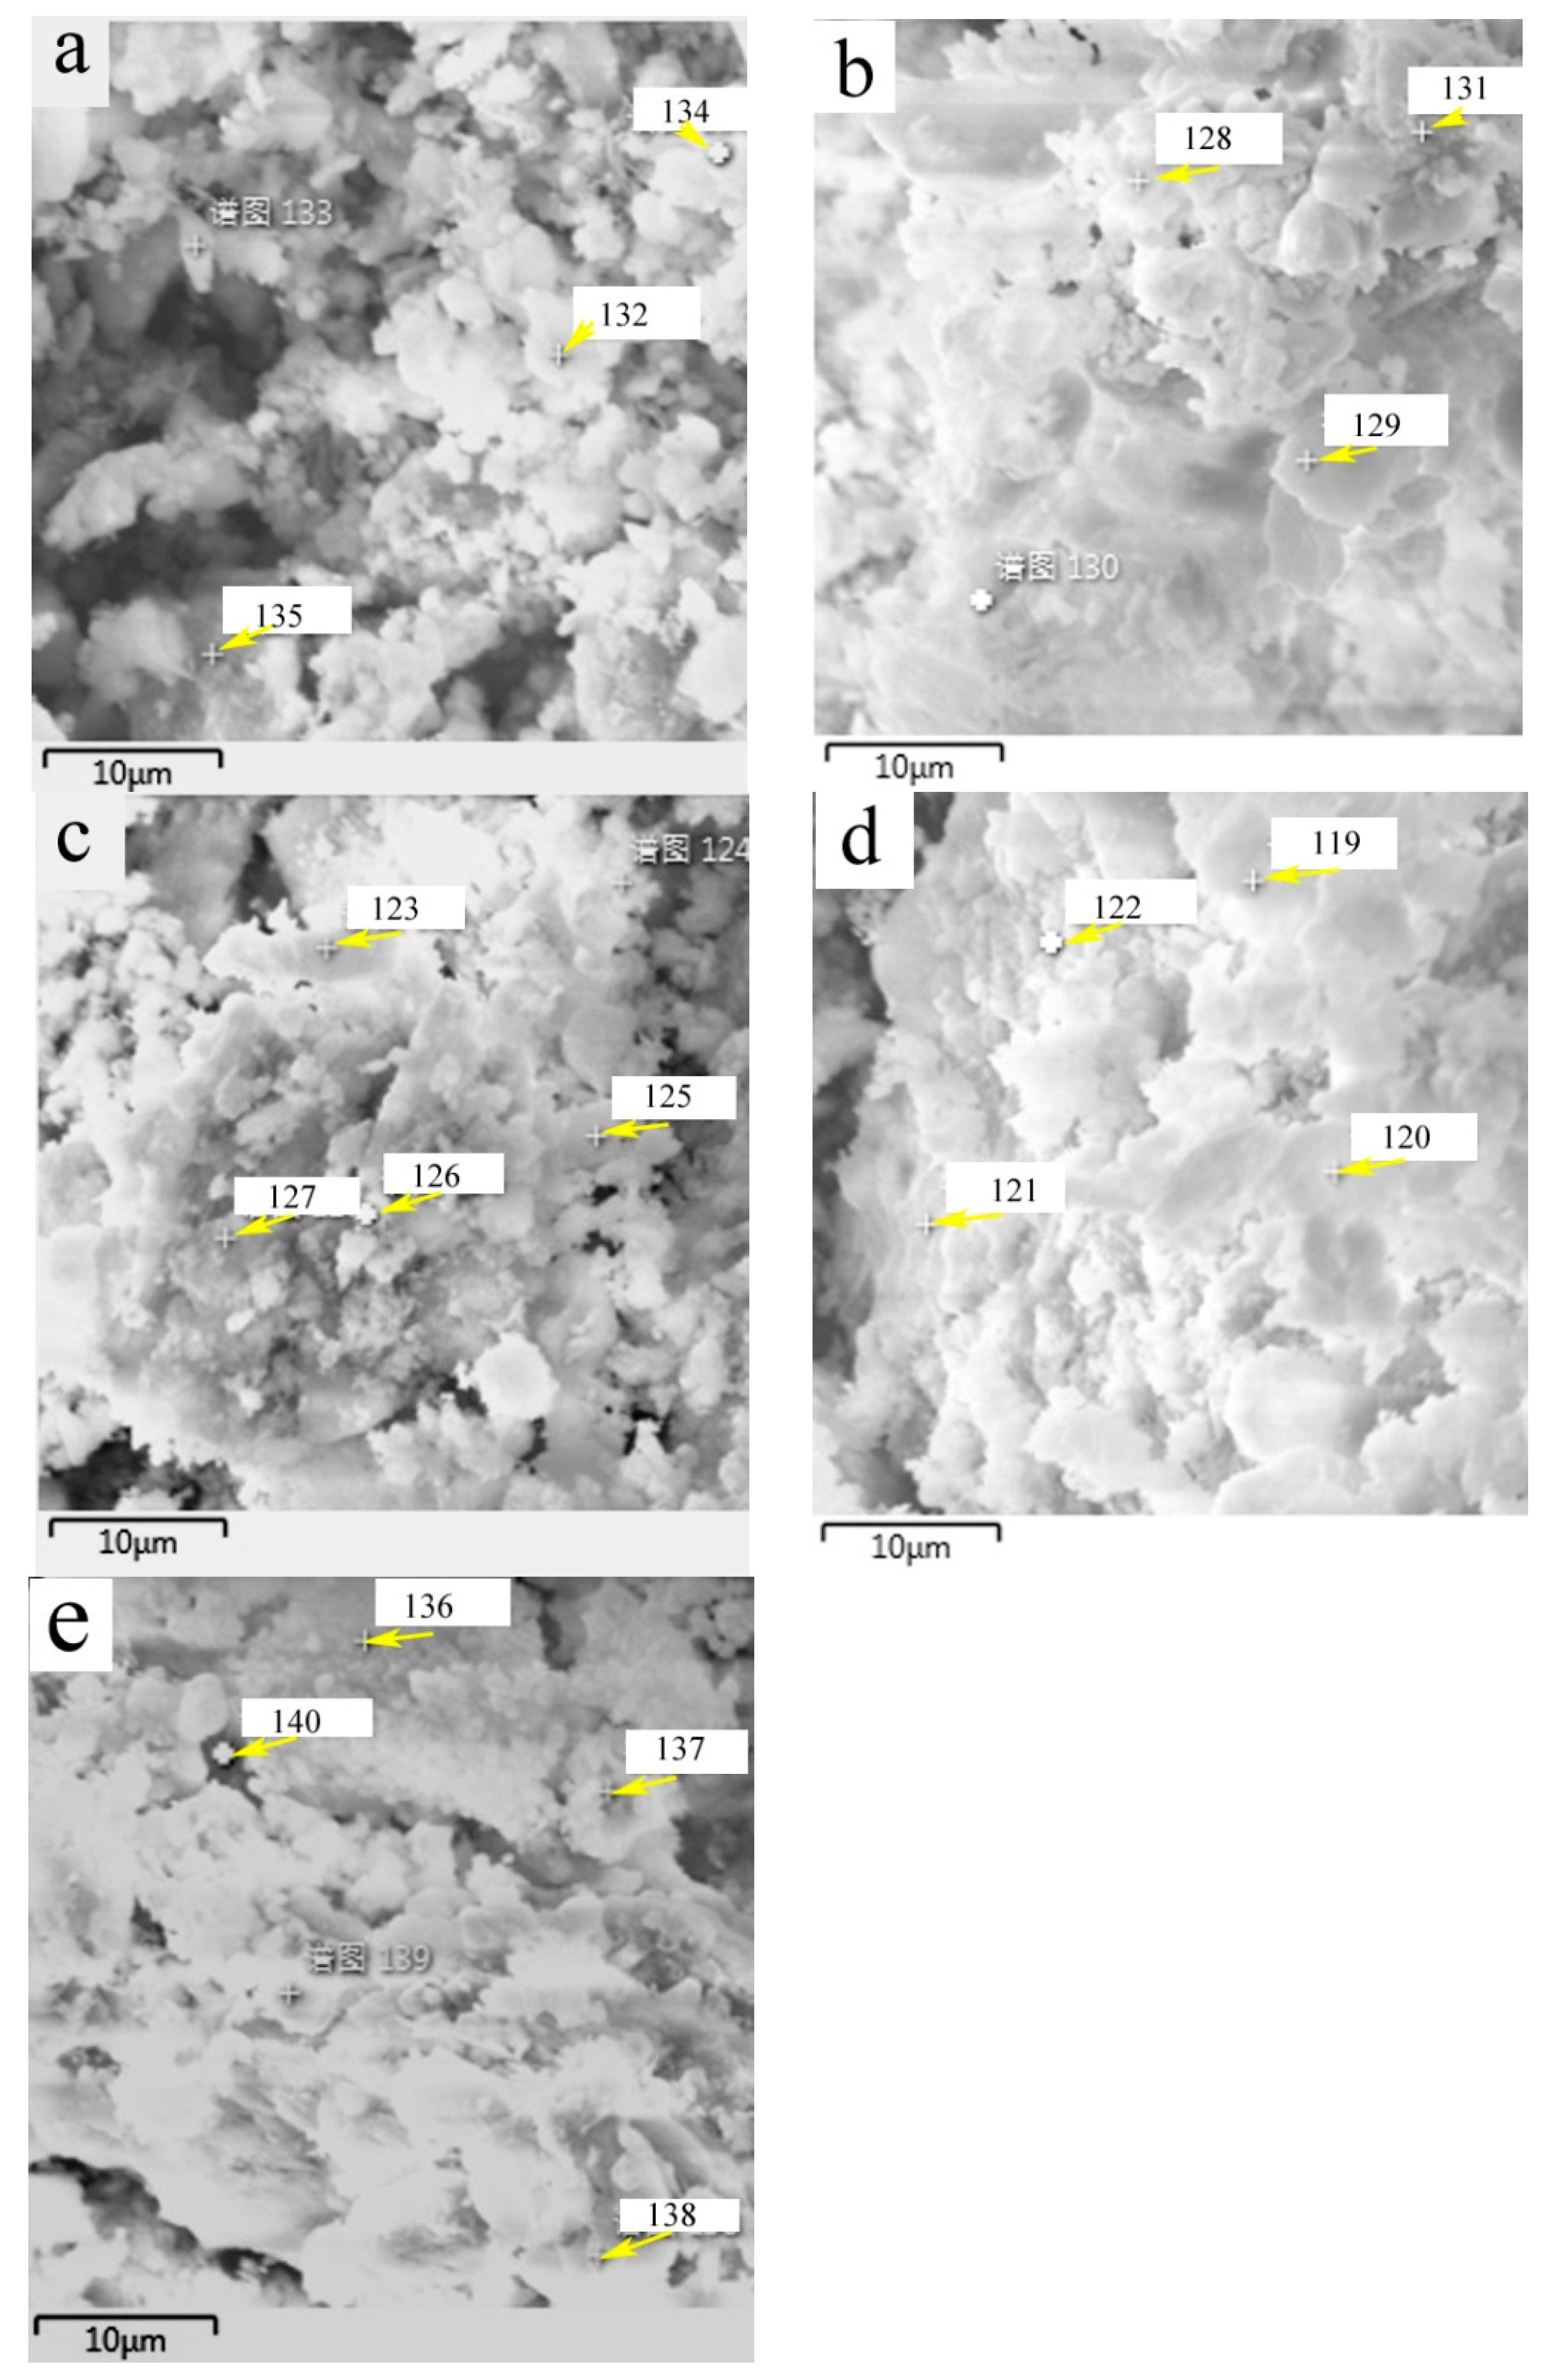
The chemical composition of surface products formed on HACG powders mixed with CH calcined at different temperatures was analyzed by EDS point scanning. The resulting products were deduced to include CaO, CaCO3, metakaolin, CA2, C2S and C12A7 according to their respective compositional characteristics at locations indicated by numbers, as summarized in Table 2. The products emerged at different temperatures were as follows: CaO, CaCO3 and metakaolin at 600oC, CA2 at 700oC, C2S at 800oC, C12A7 at 850oC and 900oC.
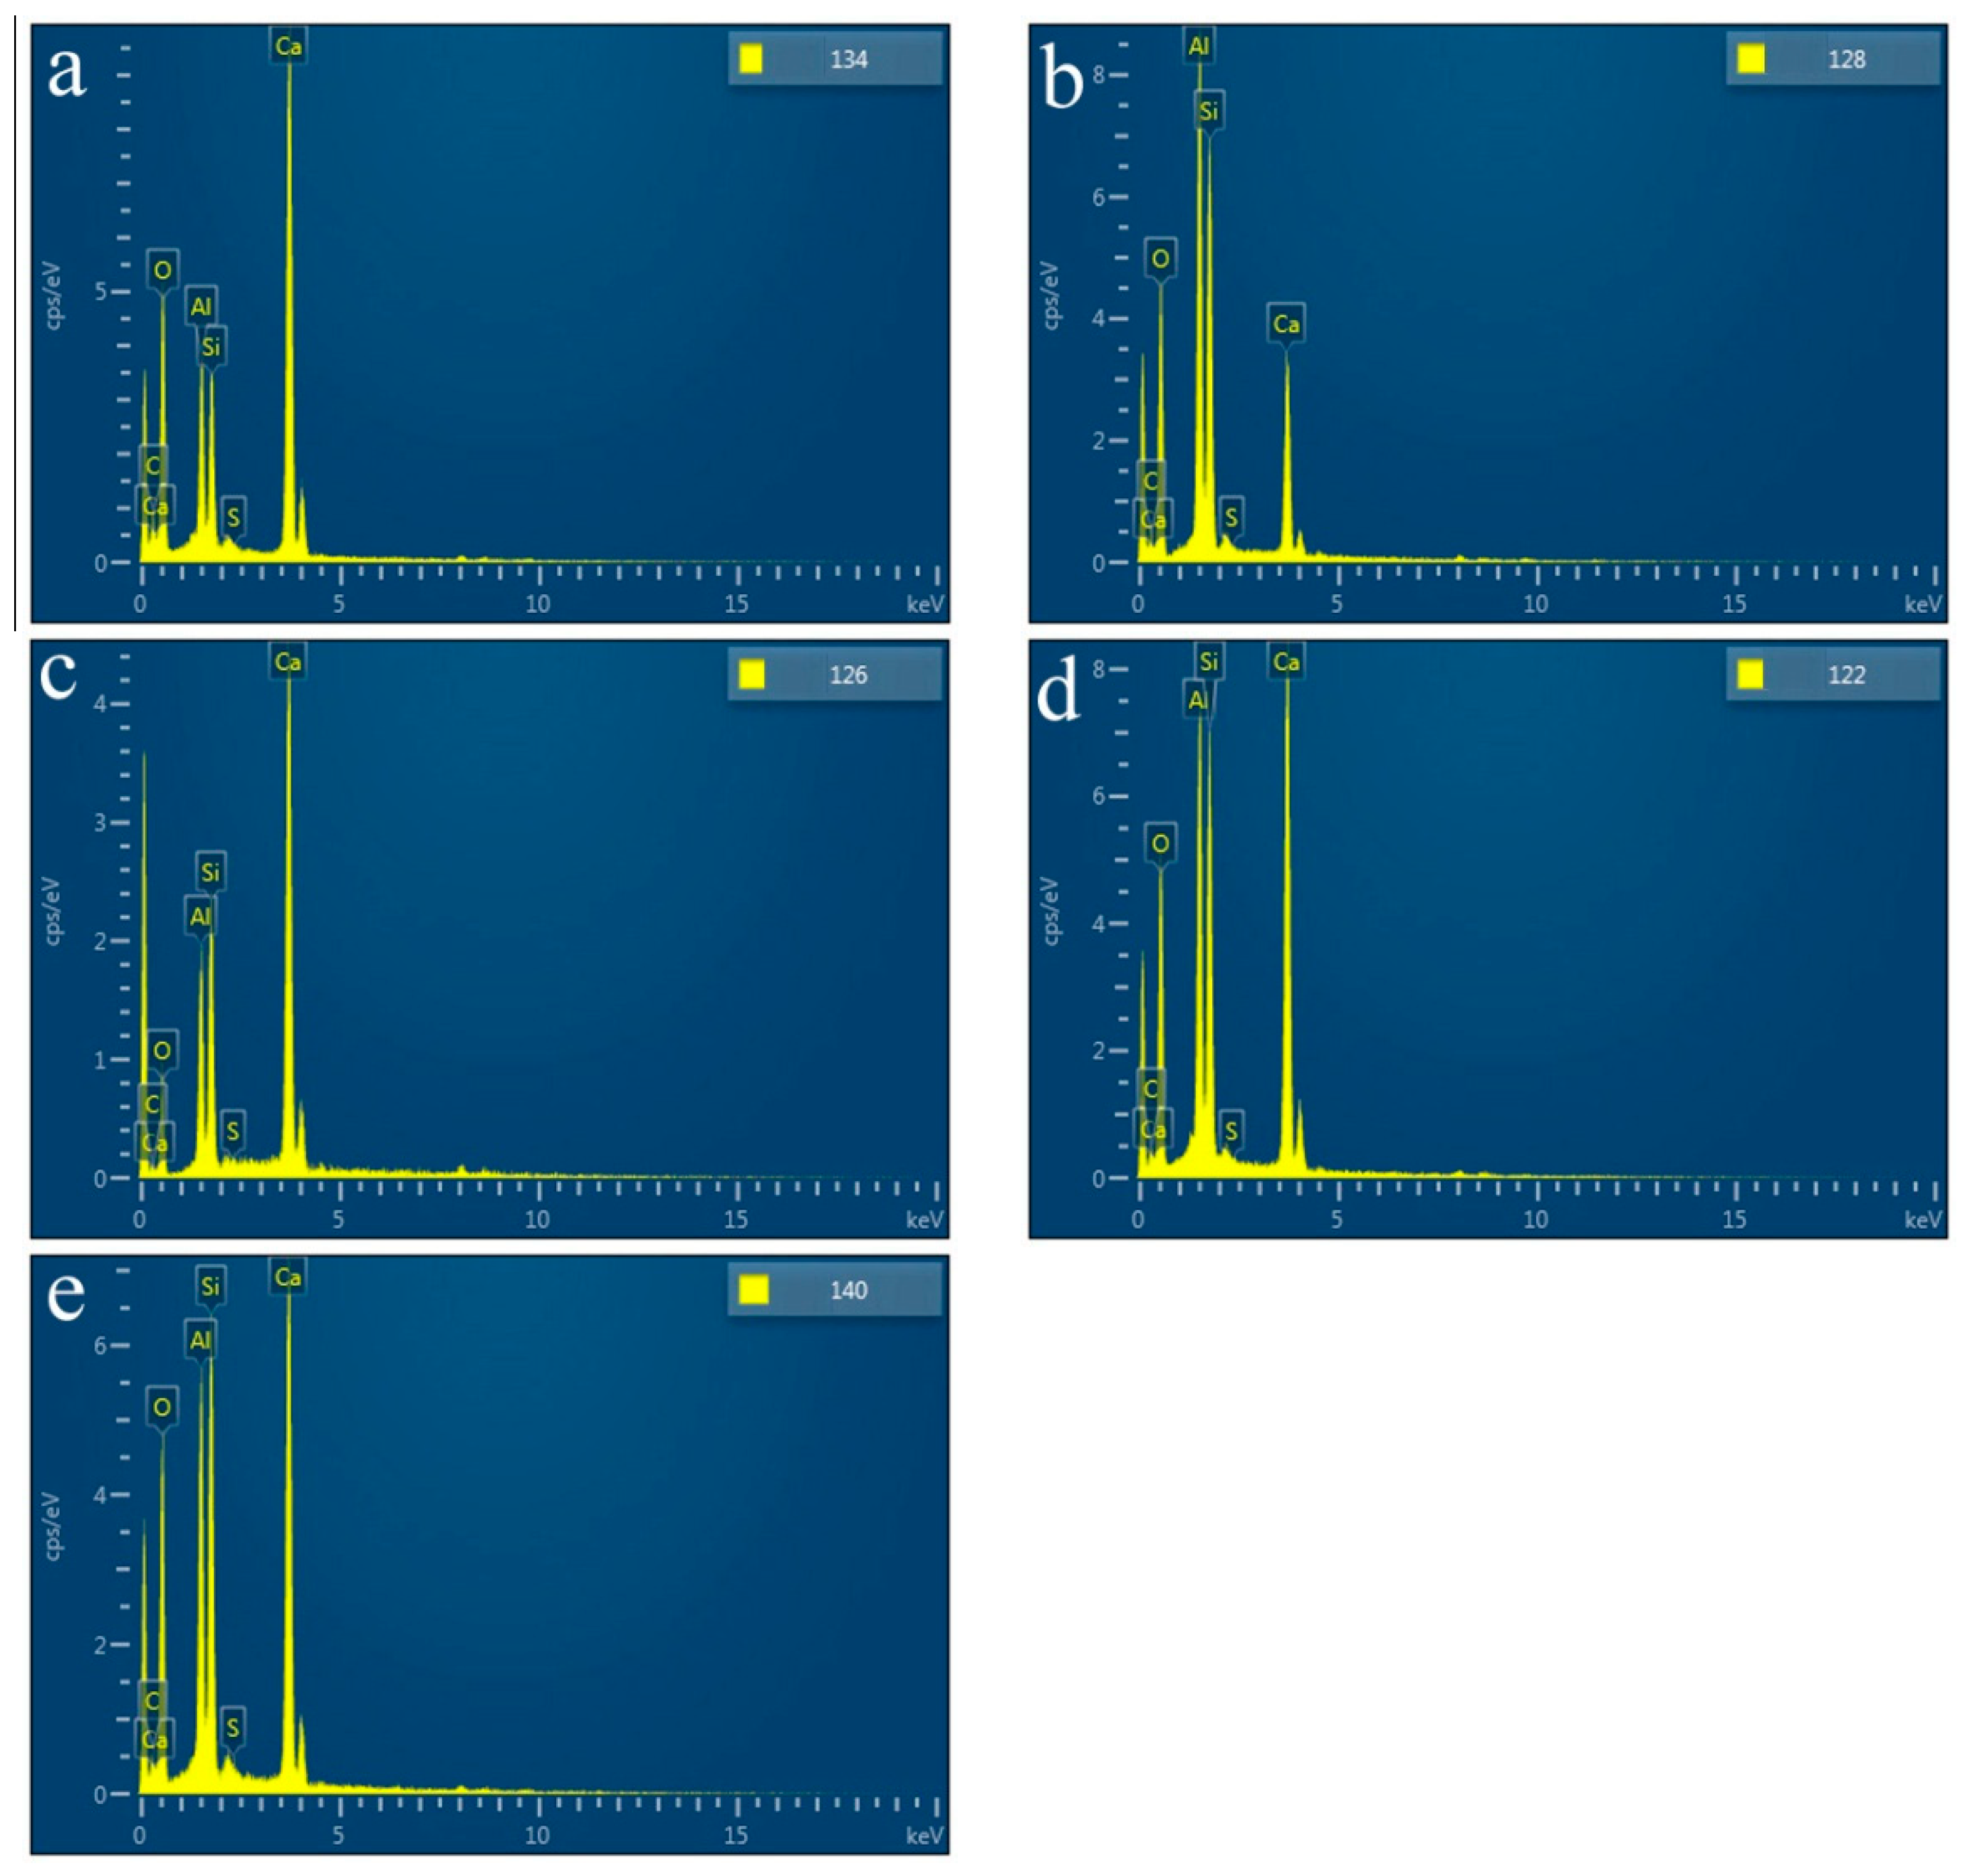
SEM images of HACG powders mixed with CH calcined at different temperatures are shown in Figure 7, in which EDS point scanning locations are indicated by numbers. EDS patterns at certain locations are shown in Figure 8. In order to identify calcining products as accurately as possible, two analysis methods were used. The first one was that if the composition at a location was close to that of a certain type of product, the product could be thus identified. For example, the product at location 135 had 22.35wt.%Al, 22.61wt.%Si, 53.78 wt.%O and only 1.14wt.%Ca, suggesting that it originated from HACG. The contents of Al and Si elements were similar to nominal composition of metakaolin: 21.26 wt.% Al and 22.05 wt.%Si, only the content of O element was higher than 44.09 wt.%O in metakaolin. The product at location 123 was also identified as CaCO3 in such a method, the content of O and Ca elements are similar to nominal 48wt.%O and 40wt.%Ca in CaCO3. The second one was taken by considering metakaolin composition involvement in the product reaction, which included two cases. In the first case, thin product layers could be formed on the metakaolin, such as CaCO3 and CaO. The composition of the product should be handled by reduction of the contents of O, Al and Si elements according to the proportions of O, Al and Si elements in metakaolin. That is, the content of O element is about twice the content of Al or Si elements in metakaolin. For instance, the product at location 129 had about 38wt.%O and 36wt.%Ca after reduction of 12wt.%O according to the contents of 7wt.%Al and 6wt.%Si in metakaolin. The product with 38wt.%O and 36wt.%Ca roughly agreed with normal chemical contents of O and Ca elements in CaCO3, i.e. 48wt.%O and 40wt.%Ca, and was thus deduced to be CaCO3 formed on the metakaolin substrate. In the second case, when Al2O3 or SiO2 in metakaolin reacted with CaO to form products such as CA2, C12A7 and C2S, the composition of products such as CA2, C12A7 and C2S should be evaluated by taking metakaolin as an ensemble using following molecular formulas: CaO•2Al2O3•4SiO2, 12CaO•7Al2O3•14SiO2 and 2CaO•SiO•0.5Al2O3. The deducted products by EDS analysis in Table 2 were also previously identified from XRD patterns in Figure 5, but mullite and C3S were not found by EDS analysis, perhaps owing to the limited number of selected locations for analysis.
3.4. hydration products generated from HACG auxiliary cementitious admixture and cement
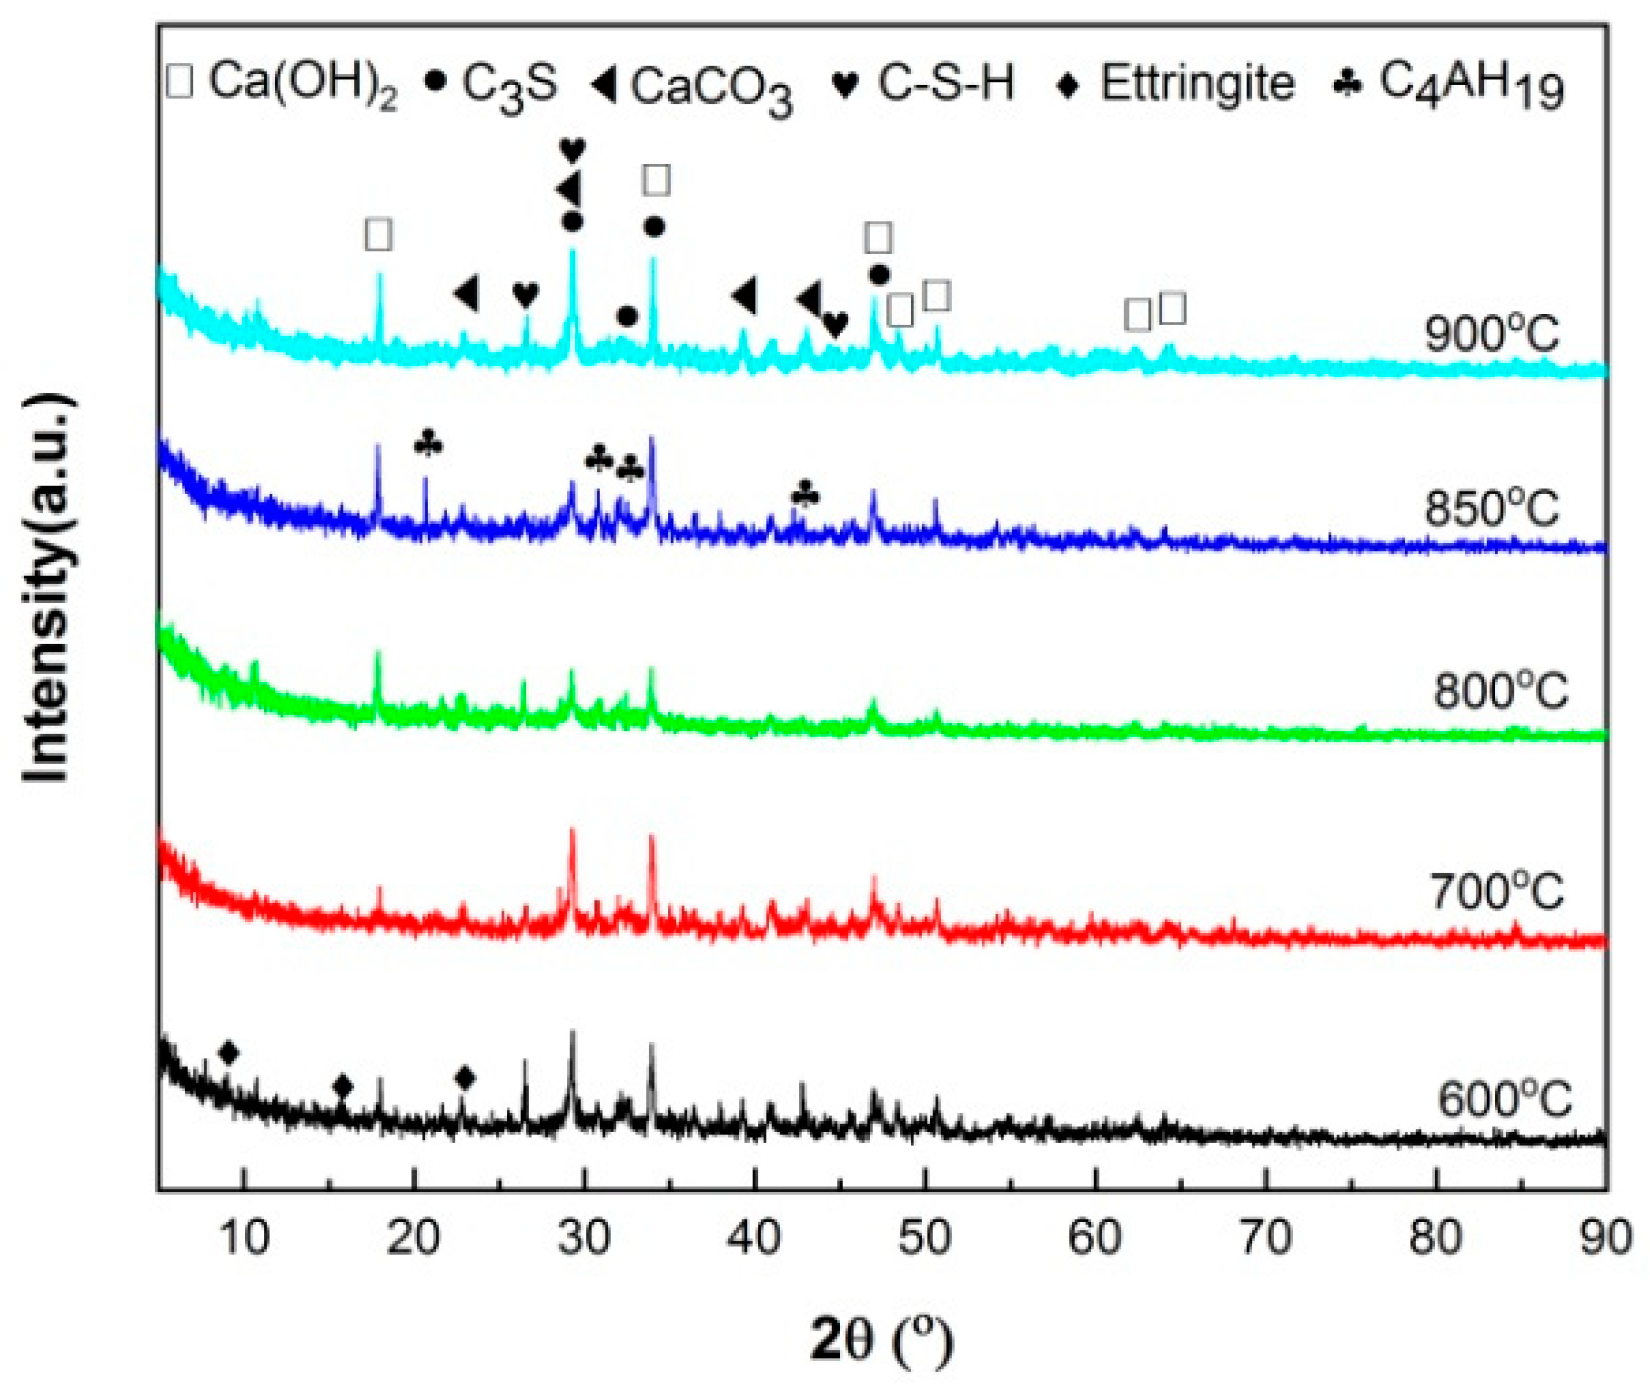
The XRD patterns of hydrated HACG-cement powders are shown in Figure 9. The mineral phases were found to include C3S in cement, CaCO3 in calcined HACG auxiliary admixtures and several types of hydration products. The hydration products were CH, ettringite (Aft (3CaO•Al2O3•3CaSO4•32H2O)), C-S-H and 4CaO•Al2O3•32H2O (C4AH19), in which CH was orignated from both cement and HACG auxiliary cementitious admixture, ettringite and C-S-H were produced from cement, but C4AH19 mainly came from HACG auxiliary cementitious admixture. The dependence of hydration products on the calcining temperature can be clearly observed in Figure 9. At low calcining temperatures of 600 and 700oC, the hydration products were ettringite, CH and C-S-H. However, as calcining temperature above 700oC, the diffraction peaks of CH became stronger than that at 600 and 700oC. Apparently, it is associated with formation of more CaO in HACG auxiliary cementitious admixture. The most noteworthy is that the diffraction peaks of C4AH19 emerge at the calcining temperature of 800oC, and become more significant at 850oC, suggesting that some of calcination products containing Al2O3 in HACG auxiliary cementitious admixture react with CH to form C4AH19. However, at the highest calcining temperature of 900oC, those diffraction peaks from C4AH19 dissaperared immediatly. This could be due to the decrease in reactivity of metakaolin and formation of mullite.

3.5. Flexural and compressive strength of HACG-cement mortar specimens

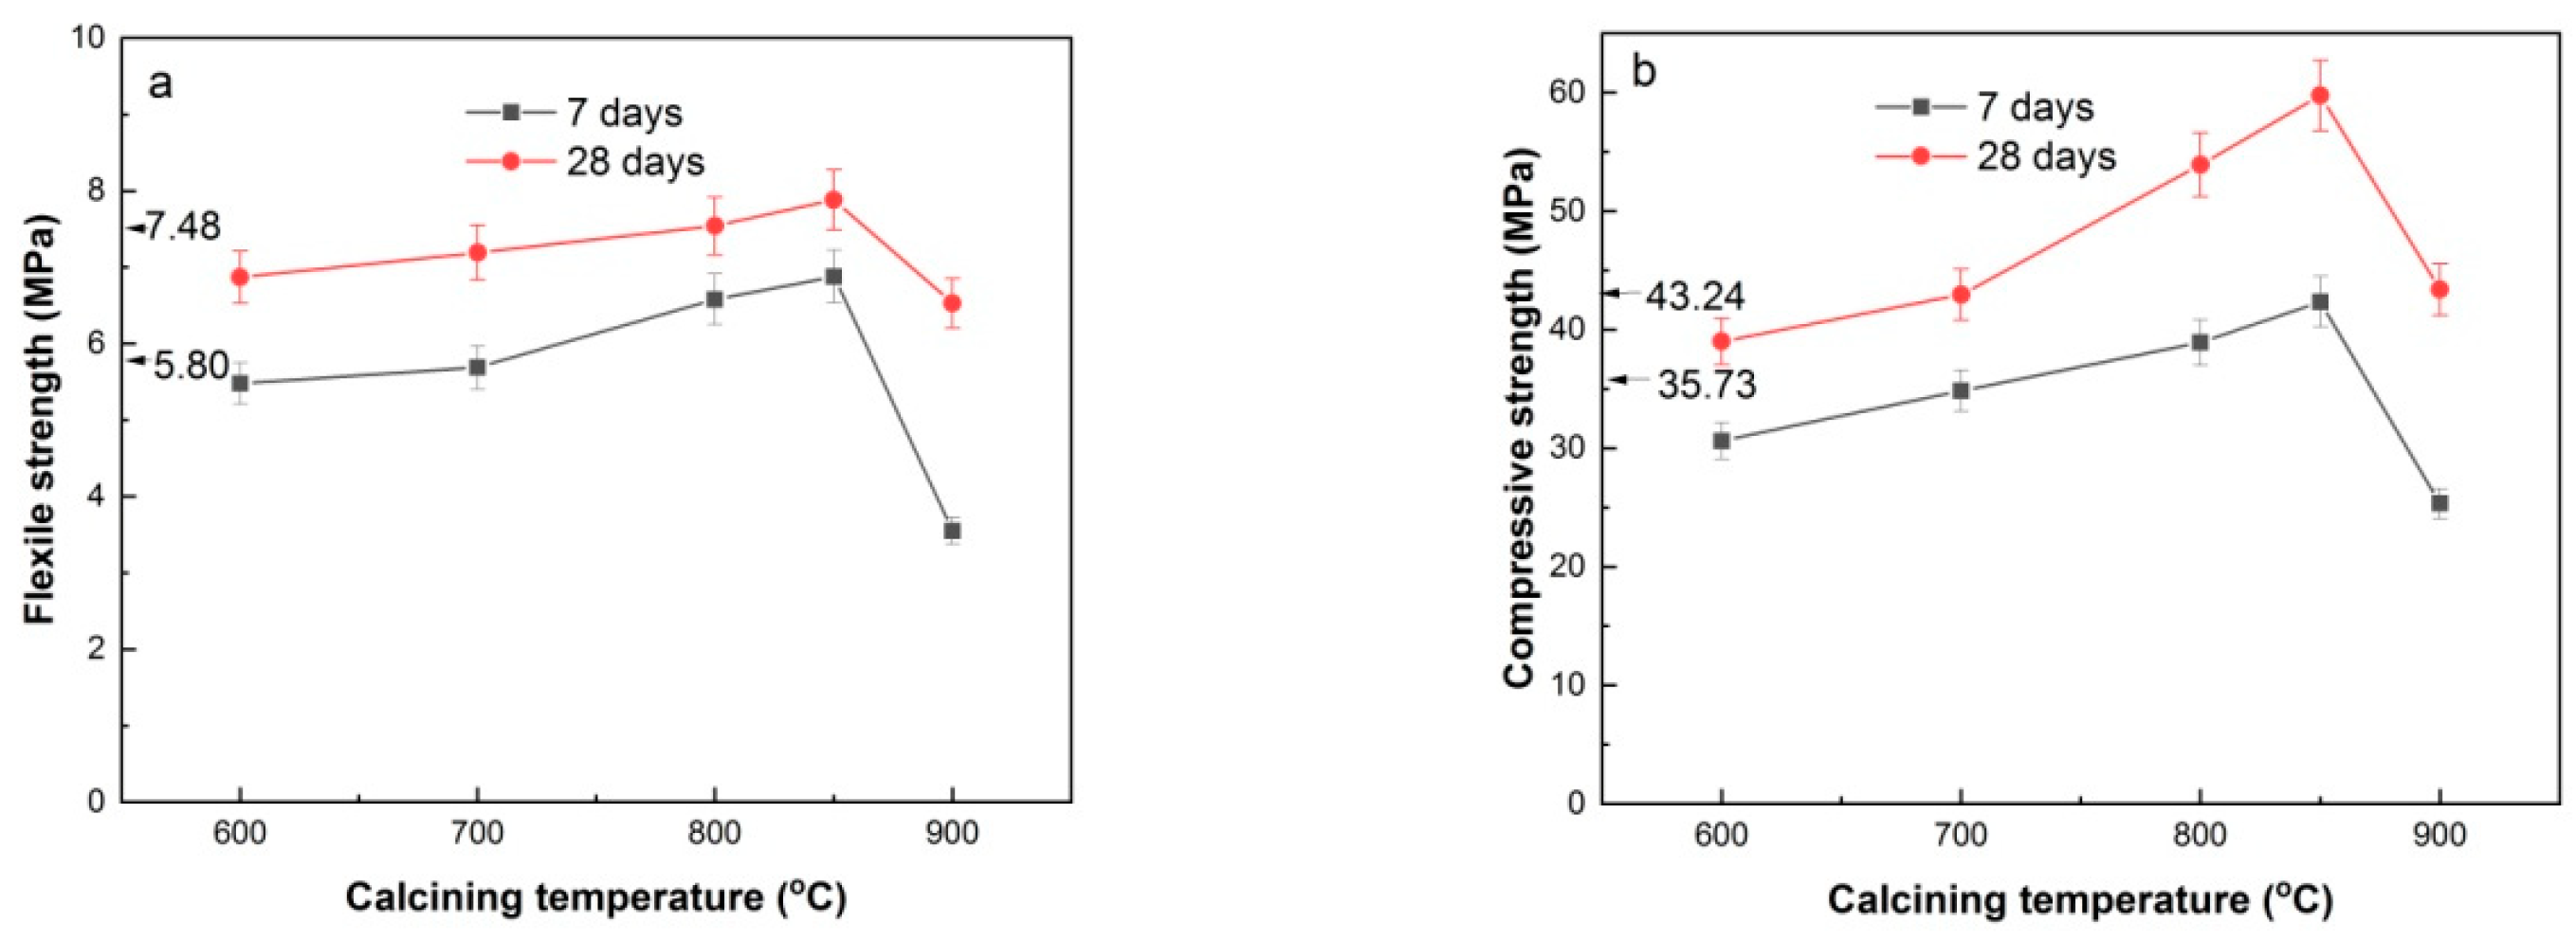
Figure 10 shows the flexural and compressive strength of HACG-cement mortar specimens. The pure cement mortar specimens had flexural strength of 5.80 MPa and 7.48 MPa from 7 days curing and 28 days curing respectively, and compressive strength of 35.73 MPa and 43.24 MPa form 7 days curing and 28 days curing, respectively. With increasing the calcining temperature, 7-d and 28-d flexural strength of HACG-cement mortar specimens increased until 850oC, and then decreased rapidly at 900oC (Figure 10(a)). At 800 and 850oC, HACG-cement mortar specimens had higher 7-d and 28-d flexural strength than pure cement mortar specimens. Similarly, 7-d and 28-d compressive strength of HACG-cement mortar specimens went up with increasing the calcining temperature and reached the maximum at 850oC, and then went down considerably at 900oC (Figure 10(b)). The maximal 28-d flexural and compressive strength of HACG-cement mortar specimens were increased by 5.4% and 38.2% respectively, as compared with that of pure cement mortar specimens.
The variation trend for flexural and compressive strength with calcining temperature can be essentially elucidated on the basis of XRD, EDS and hydration products results mentioned above. Even though hydratable CA2 was found to form at 600 and 700oC, the mechanical properties of HACG-cement mortar were not increased significantly, since quite amount of undecomposed kaolinite and carbon were still remained at 600oC, and massive formation of CaCO3 was originated from the combustion of carbon in HACG at 700oC. These substances have low activity and could exert negative effect on flexural and compressive strength. At higher calcining temperatures such as 800 and 850oC, kaolinite transformed into active metakaolin thoroughly and a great amount of CaCO3 was discomposed into CaO, which promotes the reaction between metakaolin and CaO, and thus a variety of hydratable products such C2S, CA2 and C12A7 were formed. These products can significantly increase the flexural and compressive strength of HACG-cement mortar during hydration process. In addition, the excessive CaO can take part in hydration reaction. However, at the highest temperature of 900oC, the amorphous metakaolin began to be crystallized and partly transformed into mullite, which weakened the activity of HACG auxiliary cement admixture and thus resulted in a considerable decrease in flexural and compressive strength.

3.6. Fracture surfaces of HACG-cement mortar specimens

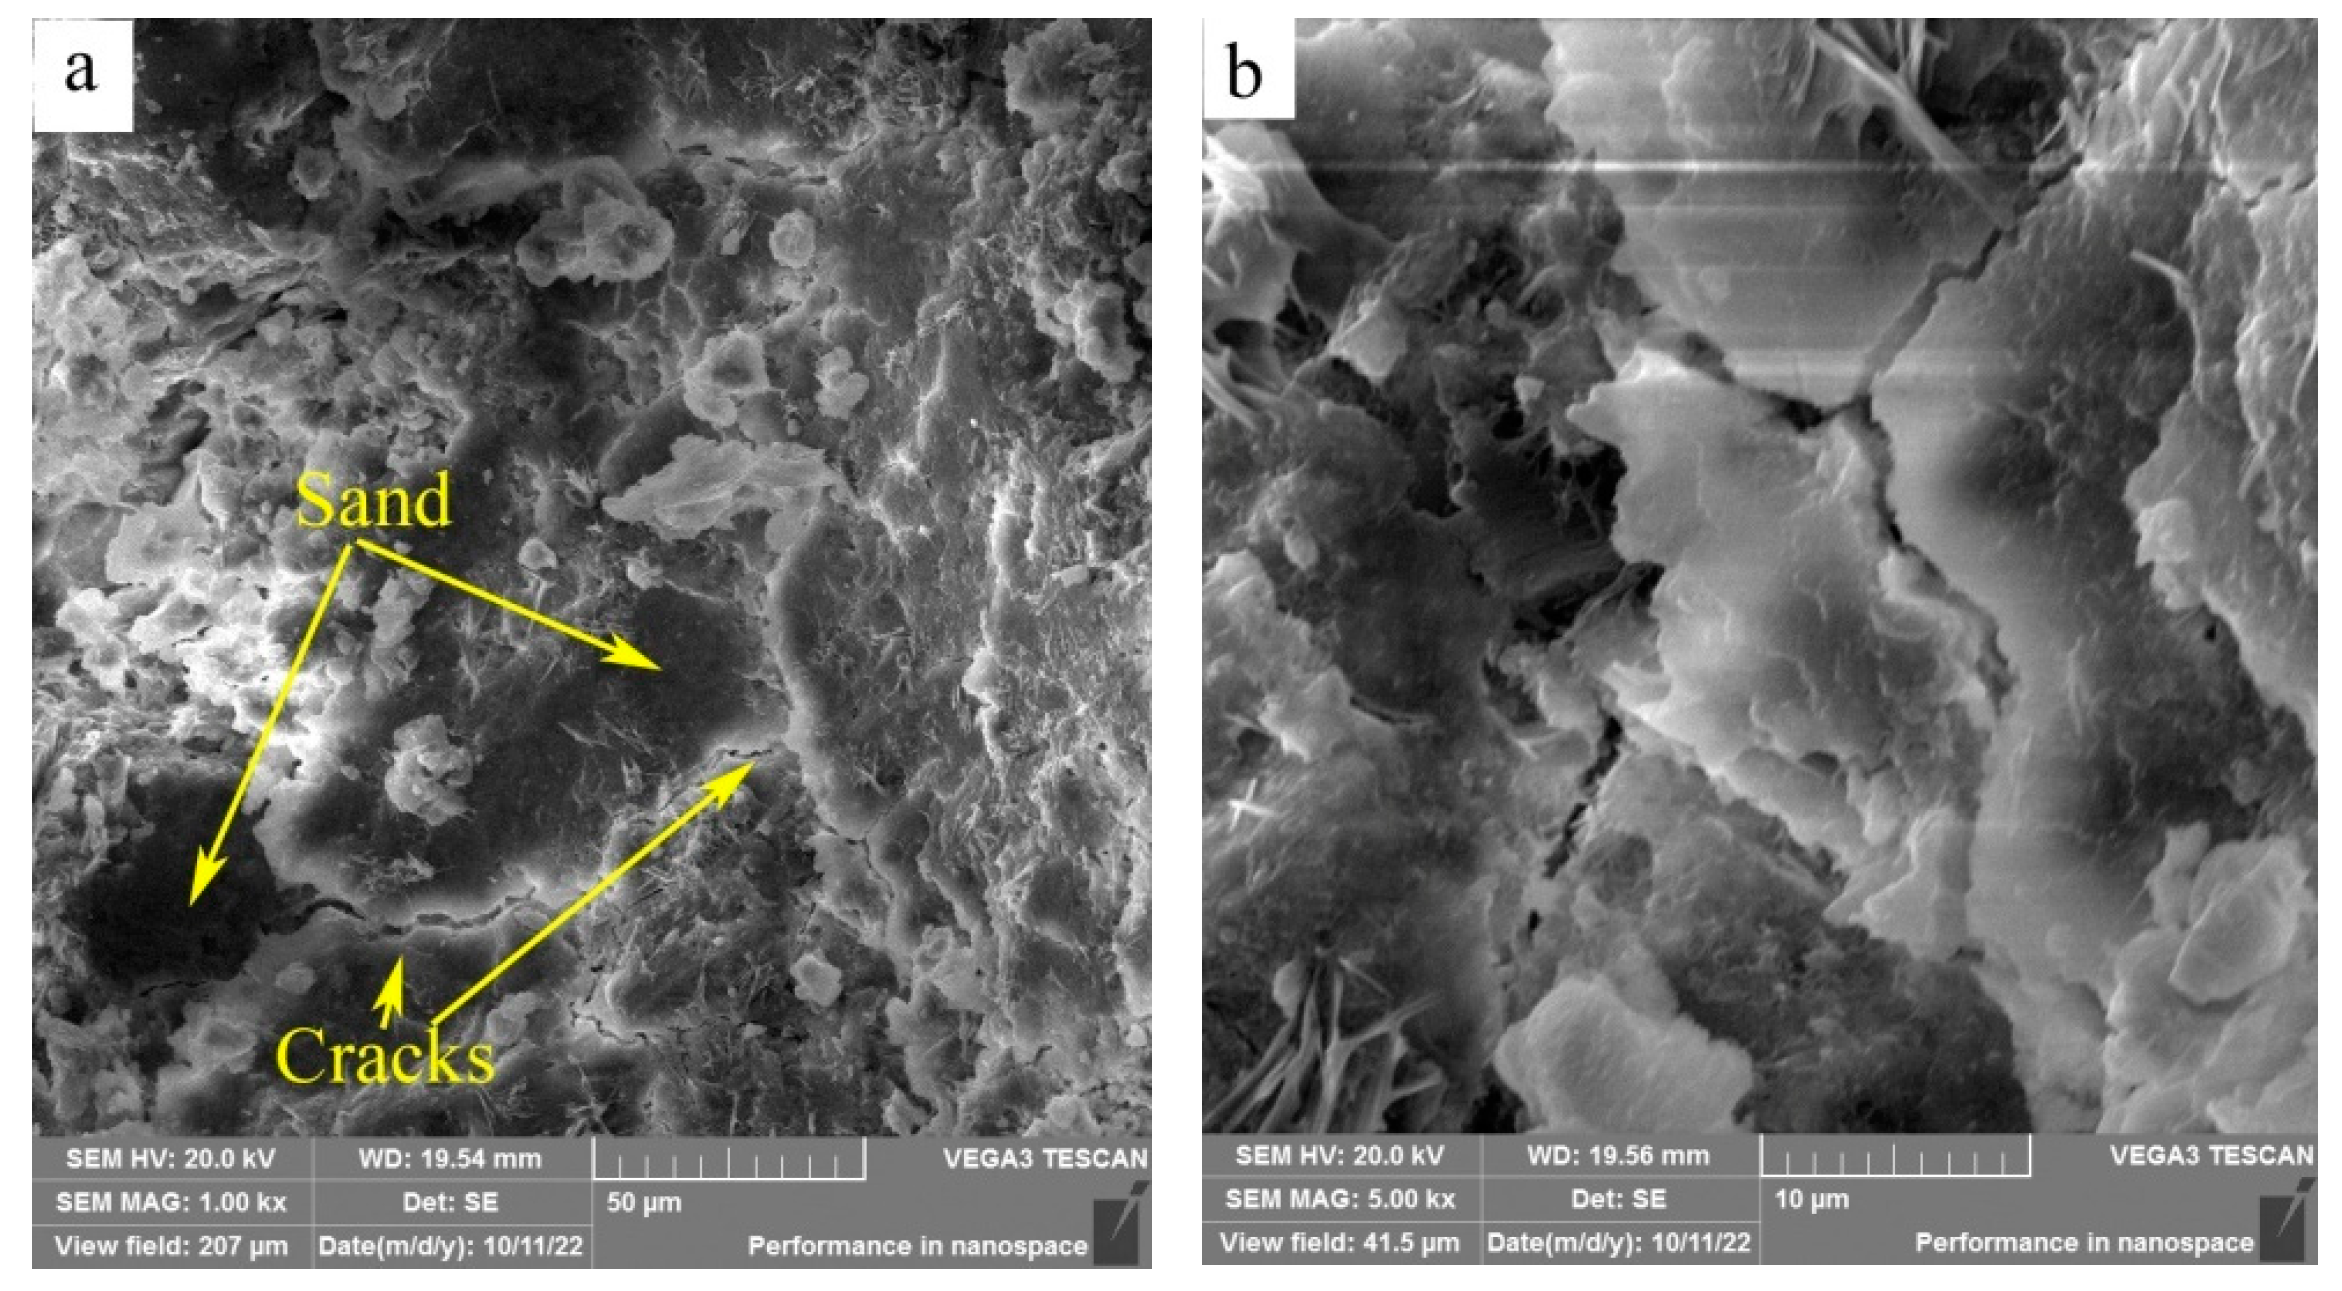
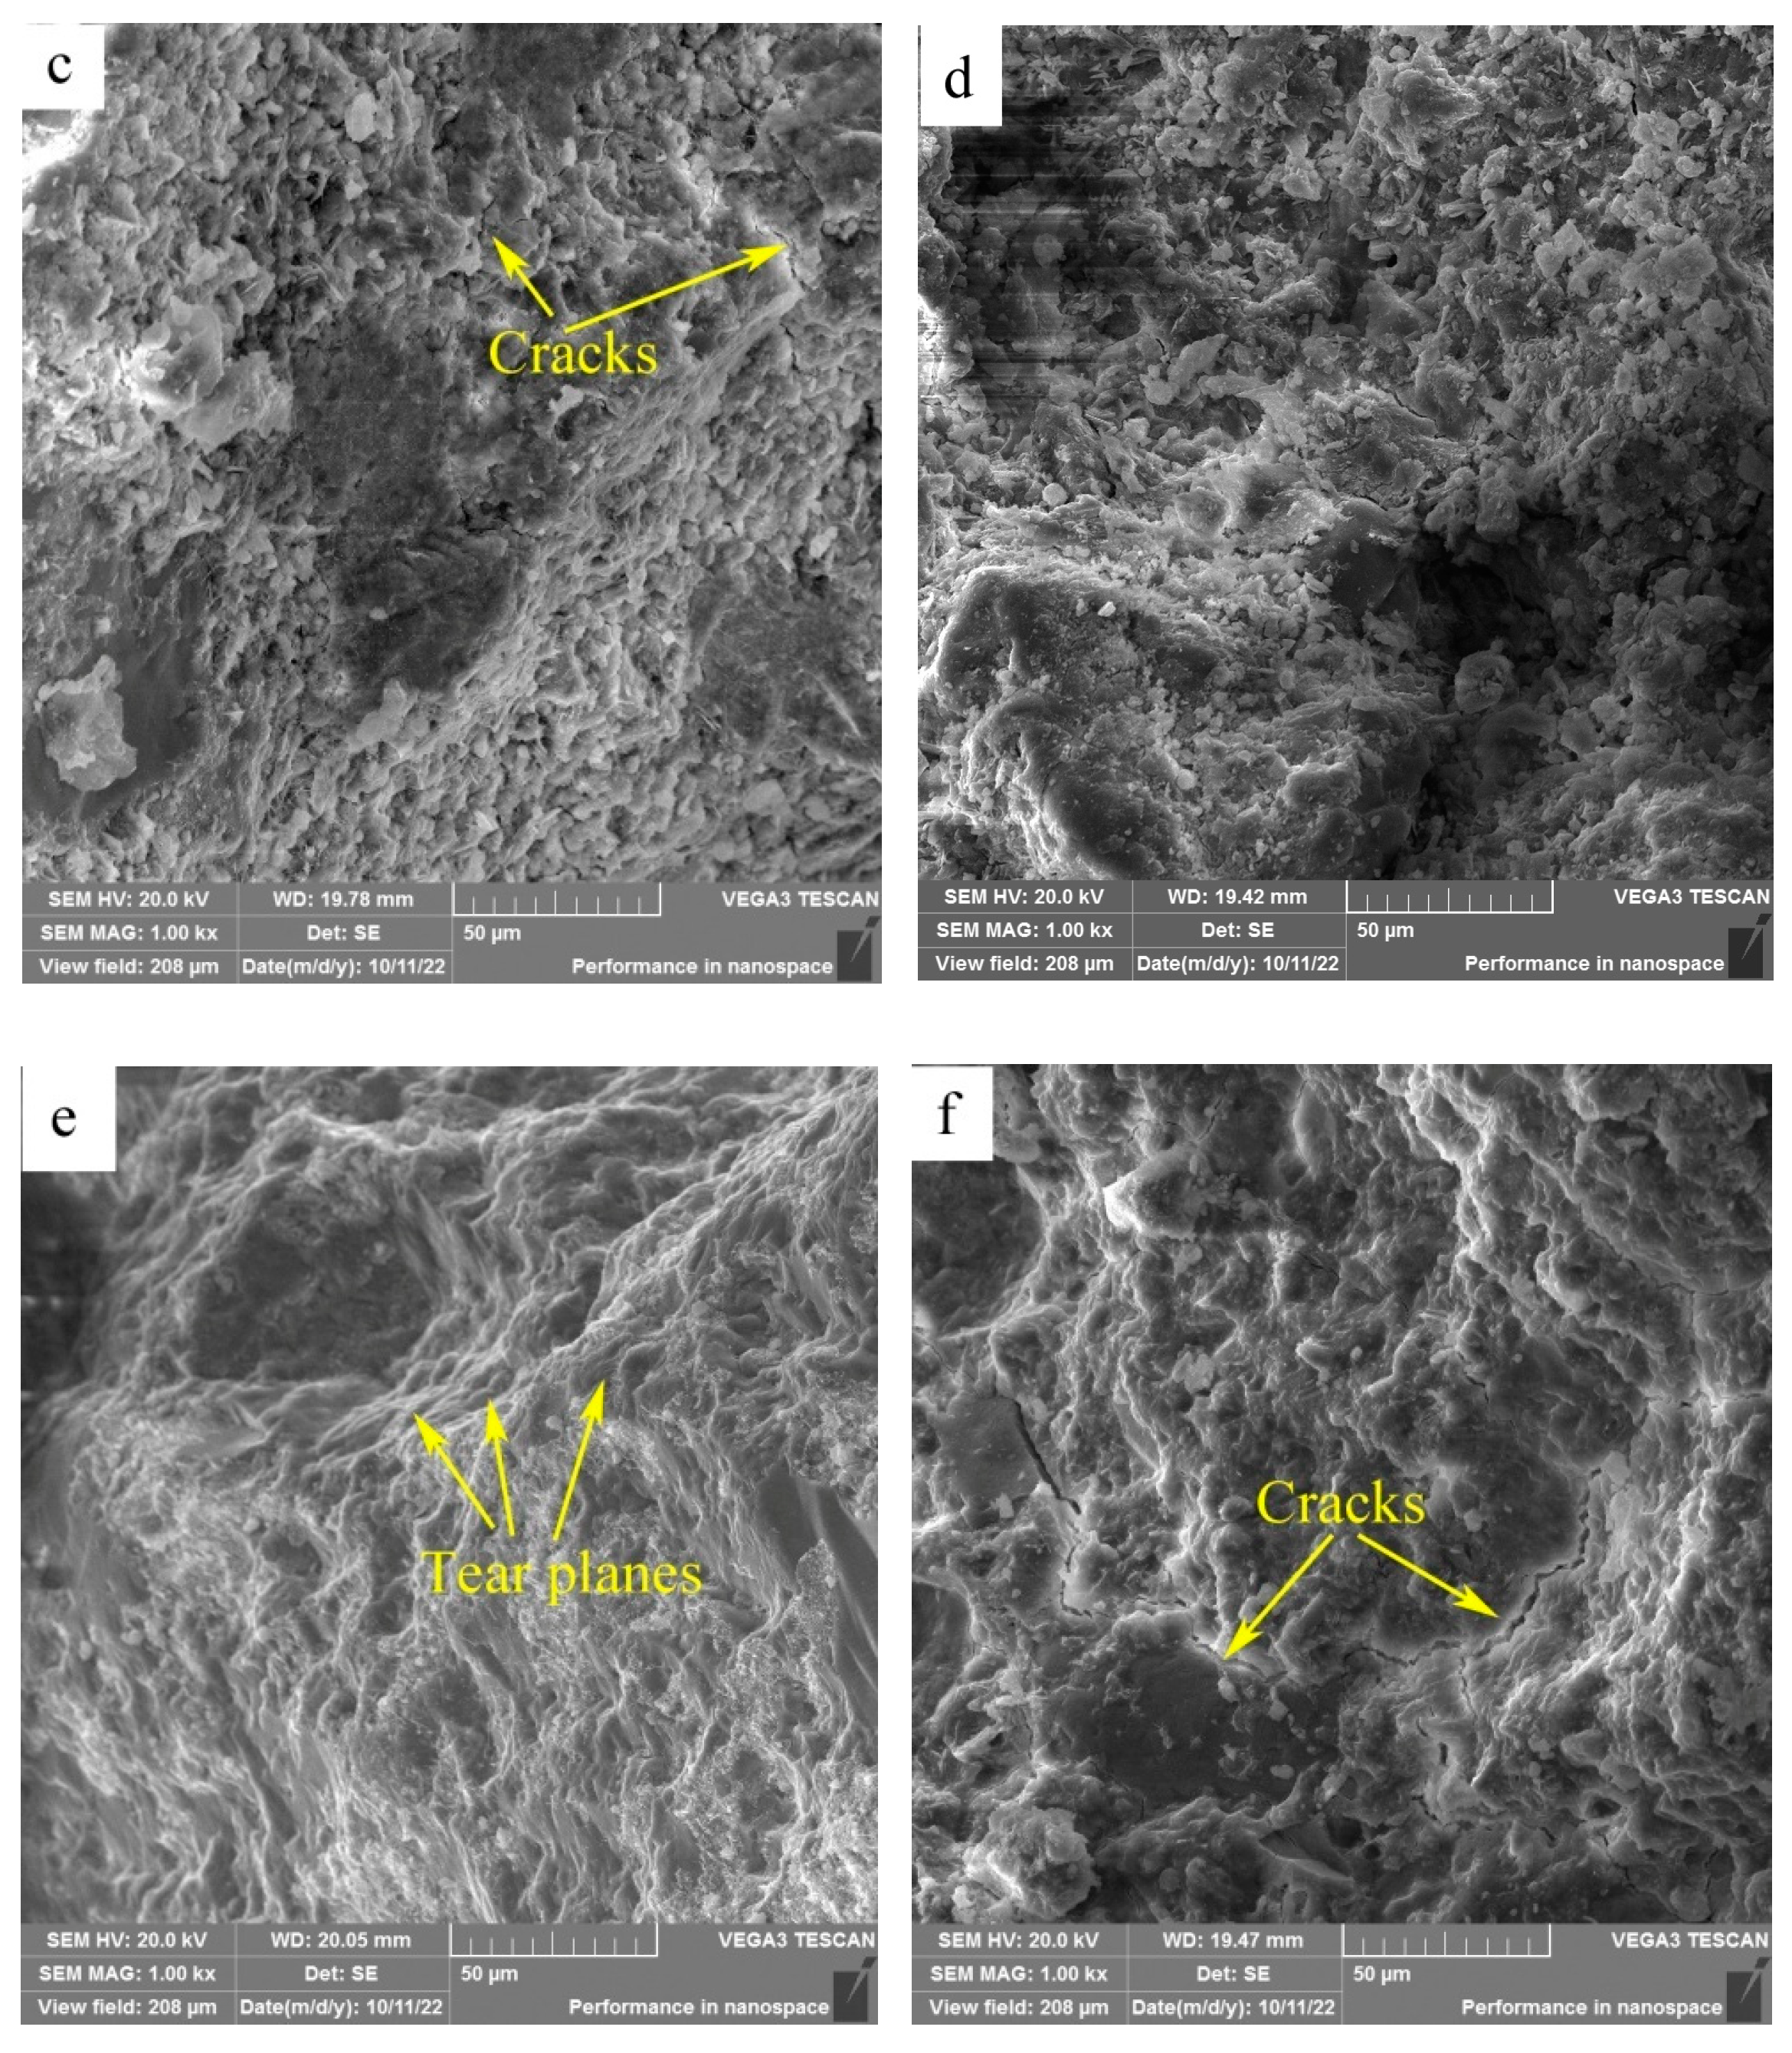
SEM images of the fracture surfaces of HACG-cement mortar specimens after 28-d flexural strength testing are shown in Figure 11. At the calcining temperature of 600oC, the surface presented typical features of cleavage fracture that the surface appeared flat and consisted of a number of large or small planes parallel to the fracture surface (Figure 11(a)). The large dark planes were parts of sand particles as identified by EDS element mapping. Meanwhile, a few of cracks were observed on the boundaries between sand particles and cementious material, and also in cementitious material region as seen from the high magnification photograph (Figure 11(b)), suggesting a weak bonding between sand particle and cementitious material regions, and a low strength in the cementitious material region. At the calcining temperature of 700oC, the surface looked a little rough and consisted of a large amount of lamellas and particles, meanwhile cracks were also formed in the cementitious material region (Figure 11(c)), suggesting that constituents in HACG auxiliary cementitious material were not well hydrated and integrated. As the calcining temperature was increased to 800oC, the surface consisted of dark sand particles and grey cementitious material region (Figure 11(d)). No obvious cracks were found on the boundaries between sand and cementitious material region besides few microcracks in cementitious material region, and there were still a few of lamellas and particles in cementitious material region, suggesting that constituents in cement and HACG auxiliary cementious admixture were still not bonded compactly. At the calcining temperature of 850oC, the surface demonstrated a typical feature of tear fracture that the surface consisted of a series of tear planes of different heights, and almost no crack was observed on the surface (Figure 11(e)). Such a tear fracture mode indicates that every part in HACG-cement mortar was bonded firmly. However, at the highest calcining temperature of 900oC, the surface again showed the features of cleavage fracture. Meanwhile, a few of large cracks were formed on the boundaries between sand and cementious material region, and also found in the cementious material region (Figure 11(f)), suggesting a weak bonding between sand and cementious material regions as well as among the constituents in cementious material. The variation of fracture surface morphology with calcining temperature agrees well with the trend of flexural and compressive strength of HACG-cement mortar, i.e. when a good integrated boundary between sand particle and cementious material region is formed, and the constituents in the cementious material is fully hydrated, the flexural and compressive strength of HACG-cement mortar reach their respective maximum values. That is the reason for the mortar specimens using HACG auxiliary cementitious admixture calcined at 850oC to present the maximum mechanical properties.
The elemental mappings were conducted on the fracture surfaces by EDS (not all shown here). The chemical compositions of the surfaces are listed in Table 3. It is noted that the content of Ca element reaches a high level above 20.1wt.% on the surfaces of mortar specimens with HACG auxiliary cementitious admixtures calcined at 800 and 850oC, which is much higher than that on other mortar specimens surfaces. Meanwhile, the content of C element descends to a low level below 13.4% on the surfaces of mortar specimens with HACG auxiliary cementitious admixtures calcined at 800 and 850oC, which is lower than that on other mortar specimens’ surfaces. The phenomenon of high-Ca and low-C in the mortar specimens with HACG auxiliary cementitious admixtures calcined at 800 and 850oC, indicates not only the significant burning loss of C in HACG, but also a large loss of CO2 due to decomposition of CaCO3 into CaO and subsequent formation of many hydratable products such as C2S, CA2 and C12A7 during calcining process. On the other hand, high level of CaO in the HACG auxiliary cementitious admixtures is conducive to formation of more CH during hydration process, so CH can reacts with H2O and active Al2O3 or SiO2 in metakaolin to form more hydration products such as C-A-H and C-S-H gel. Apparently, these advantages contribute greatly to the higher flexural and compressive strength shown by mortar specimens with HACG auxiliary cementitious admixtures calcined at 800 and 850oC.
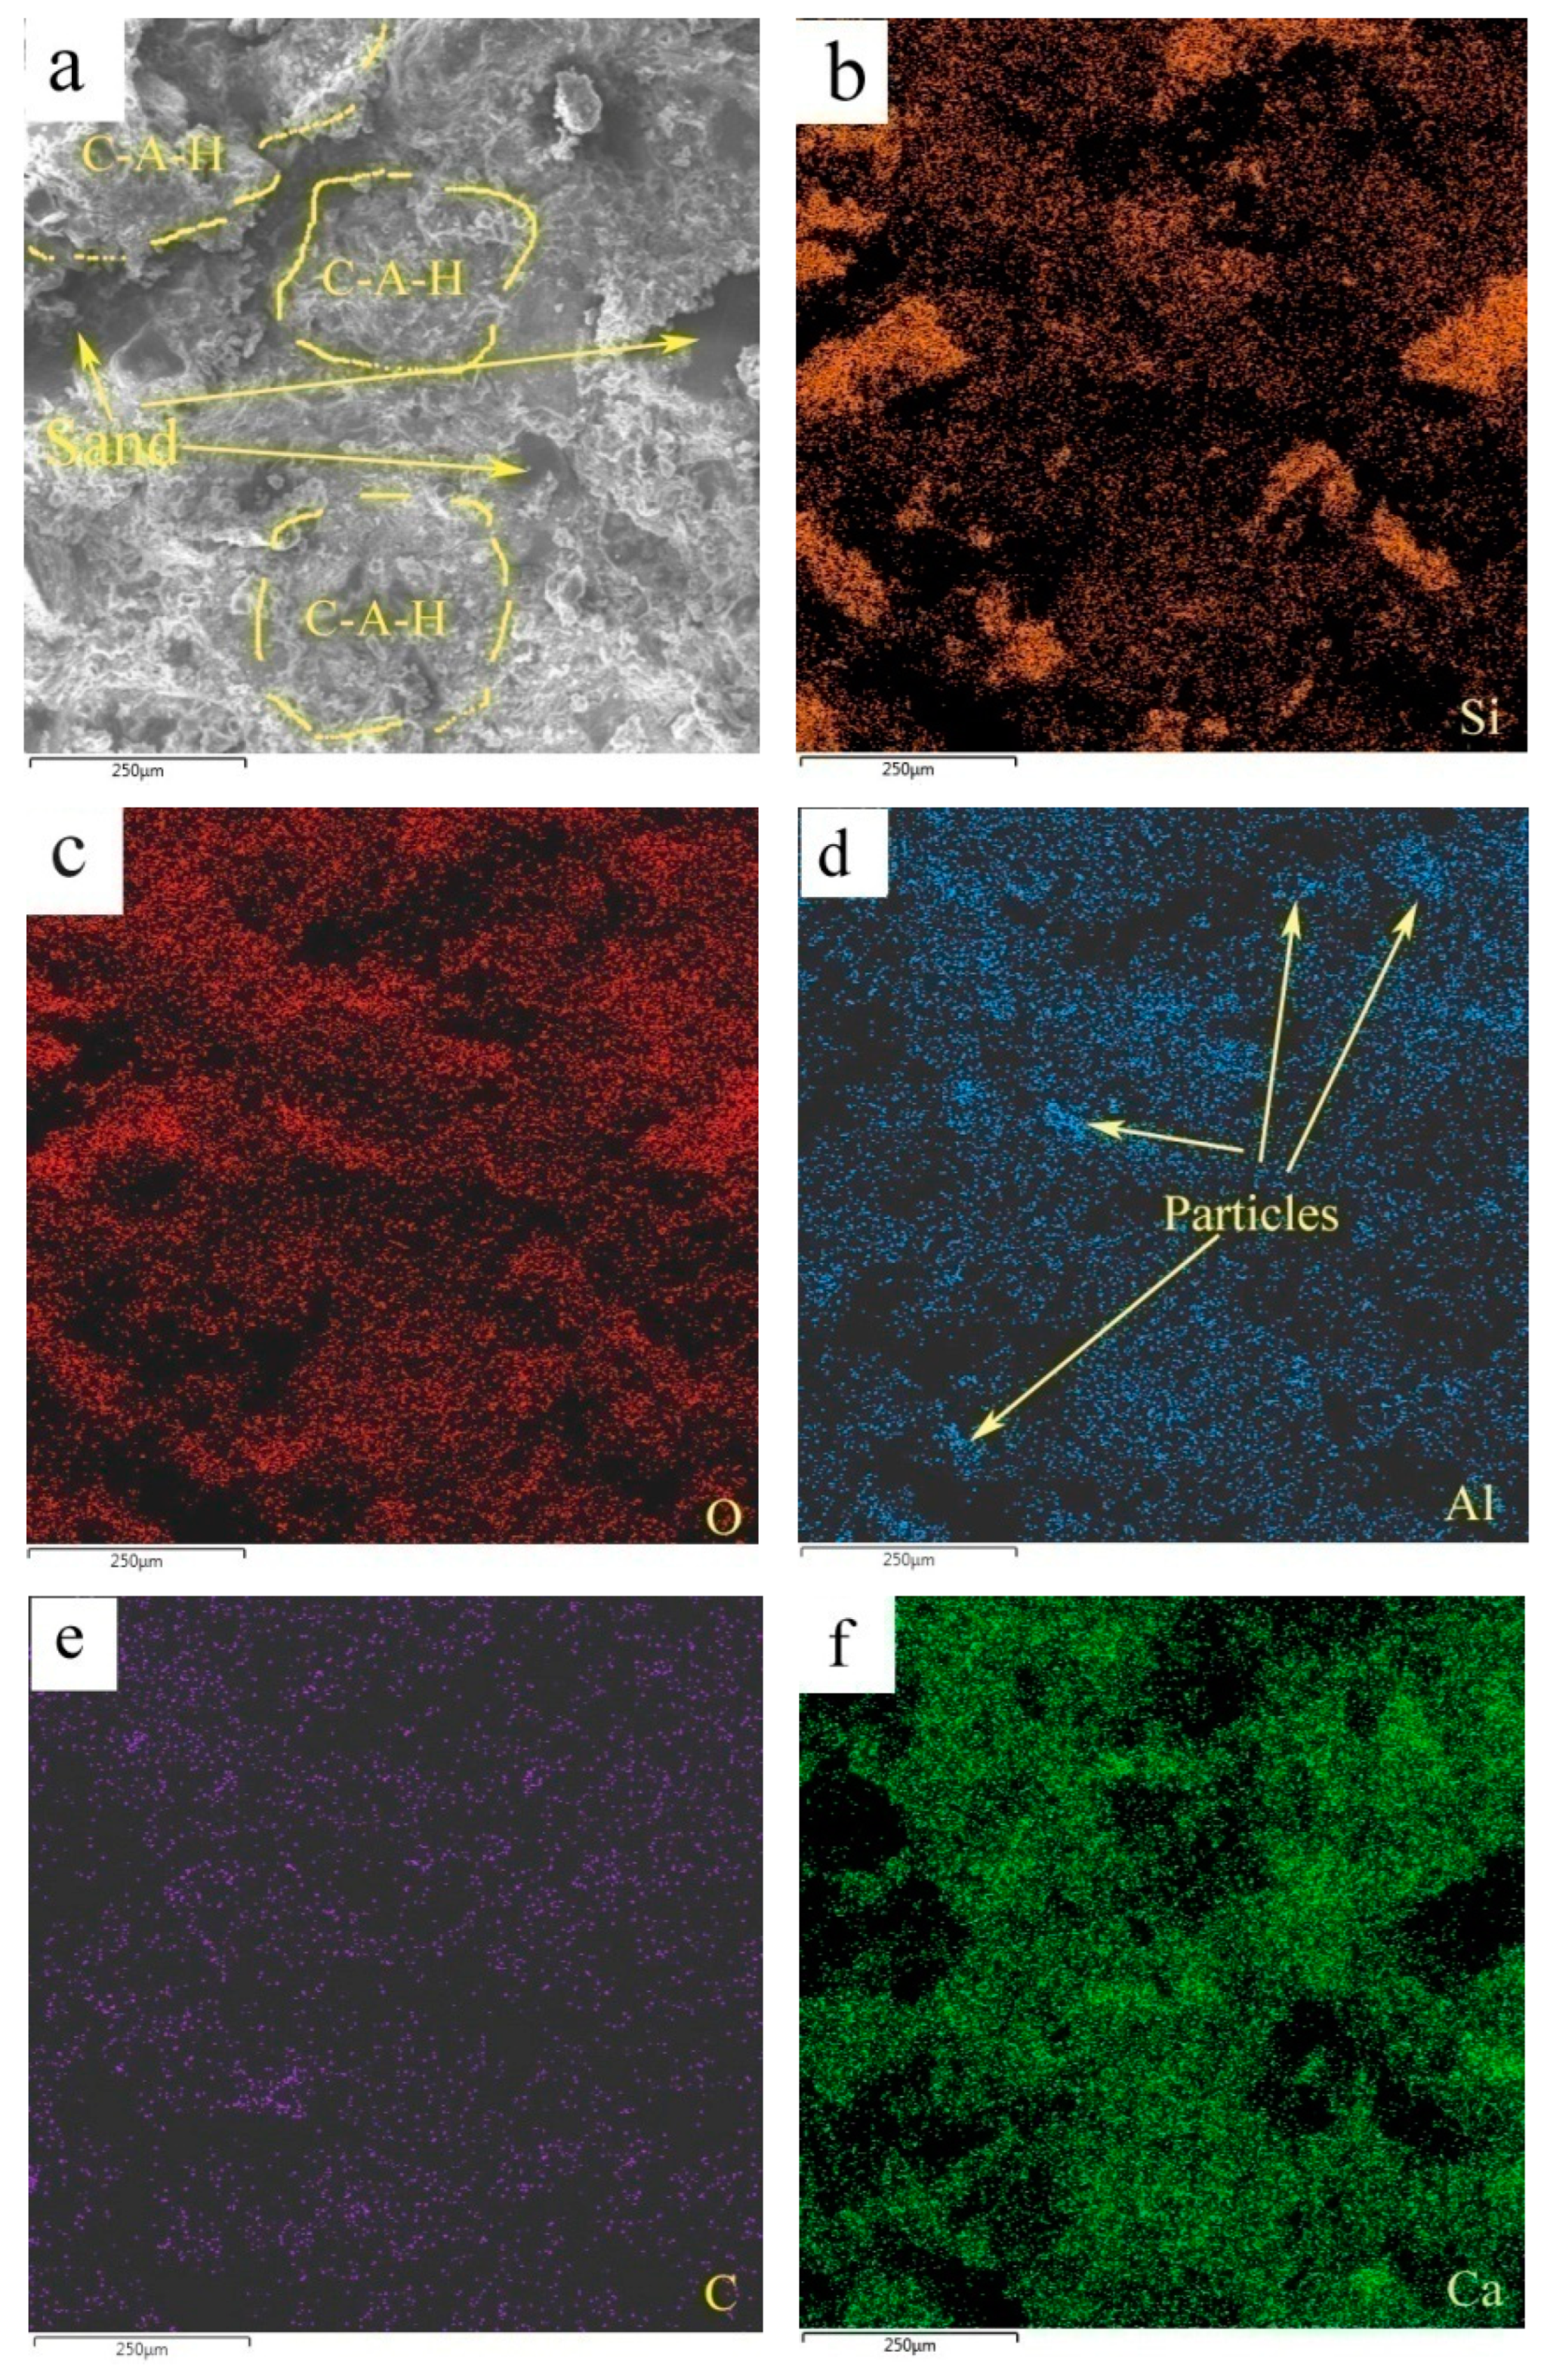
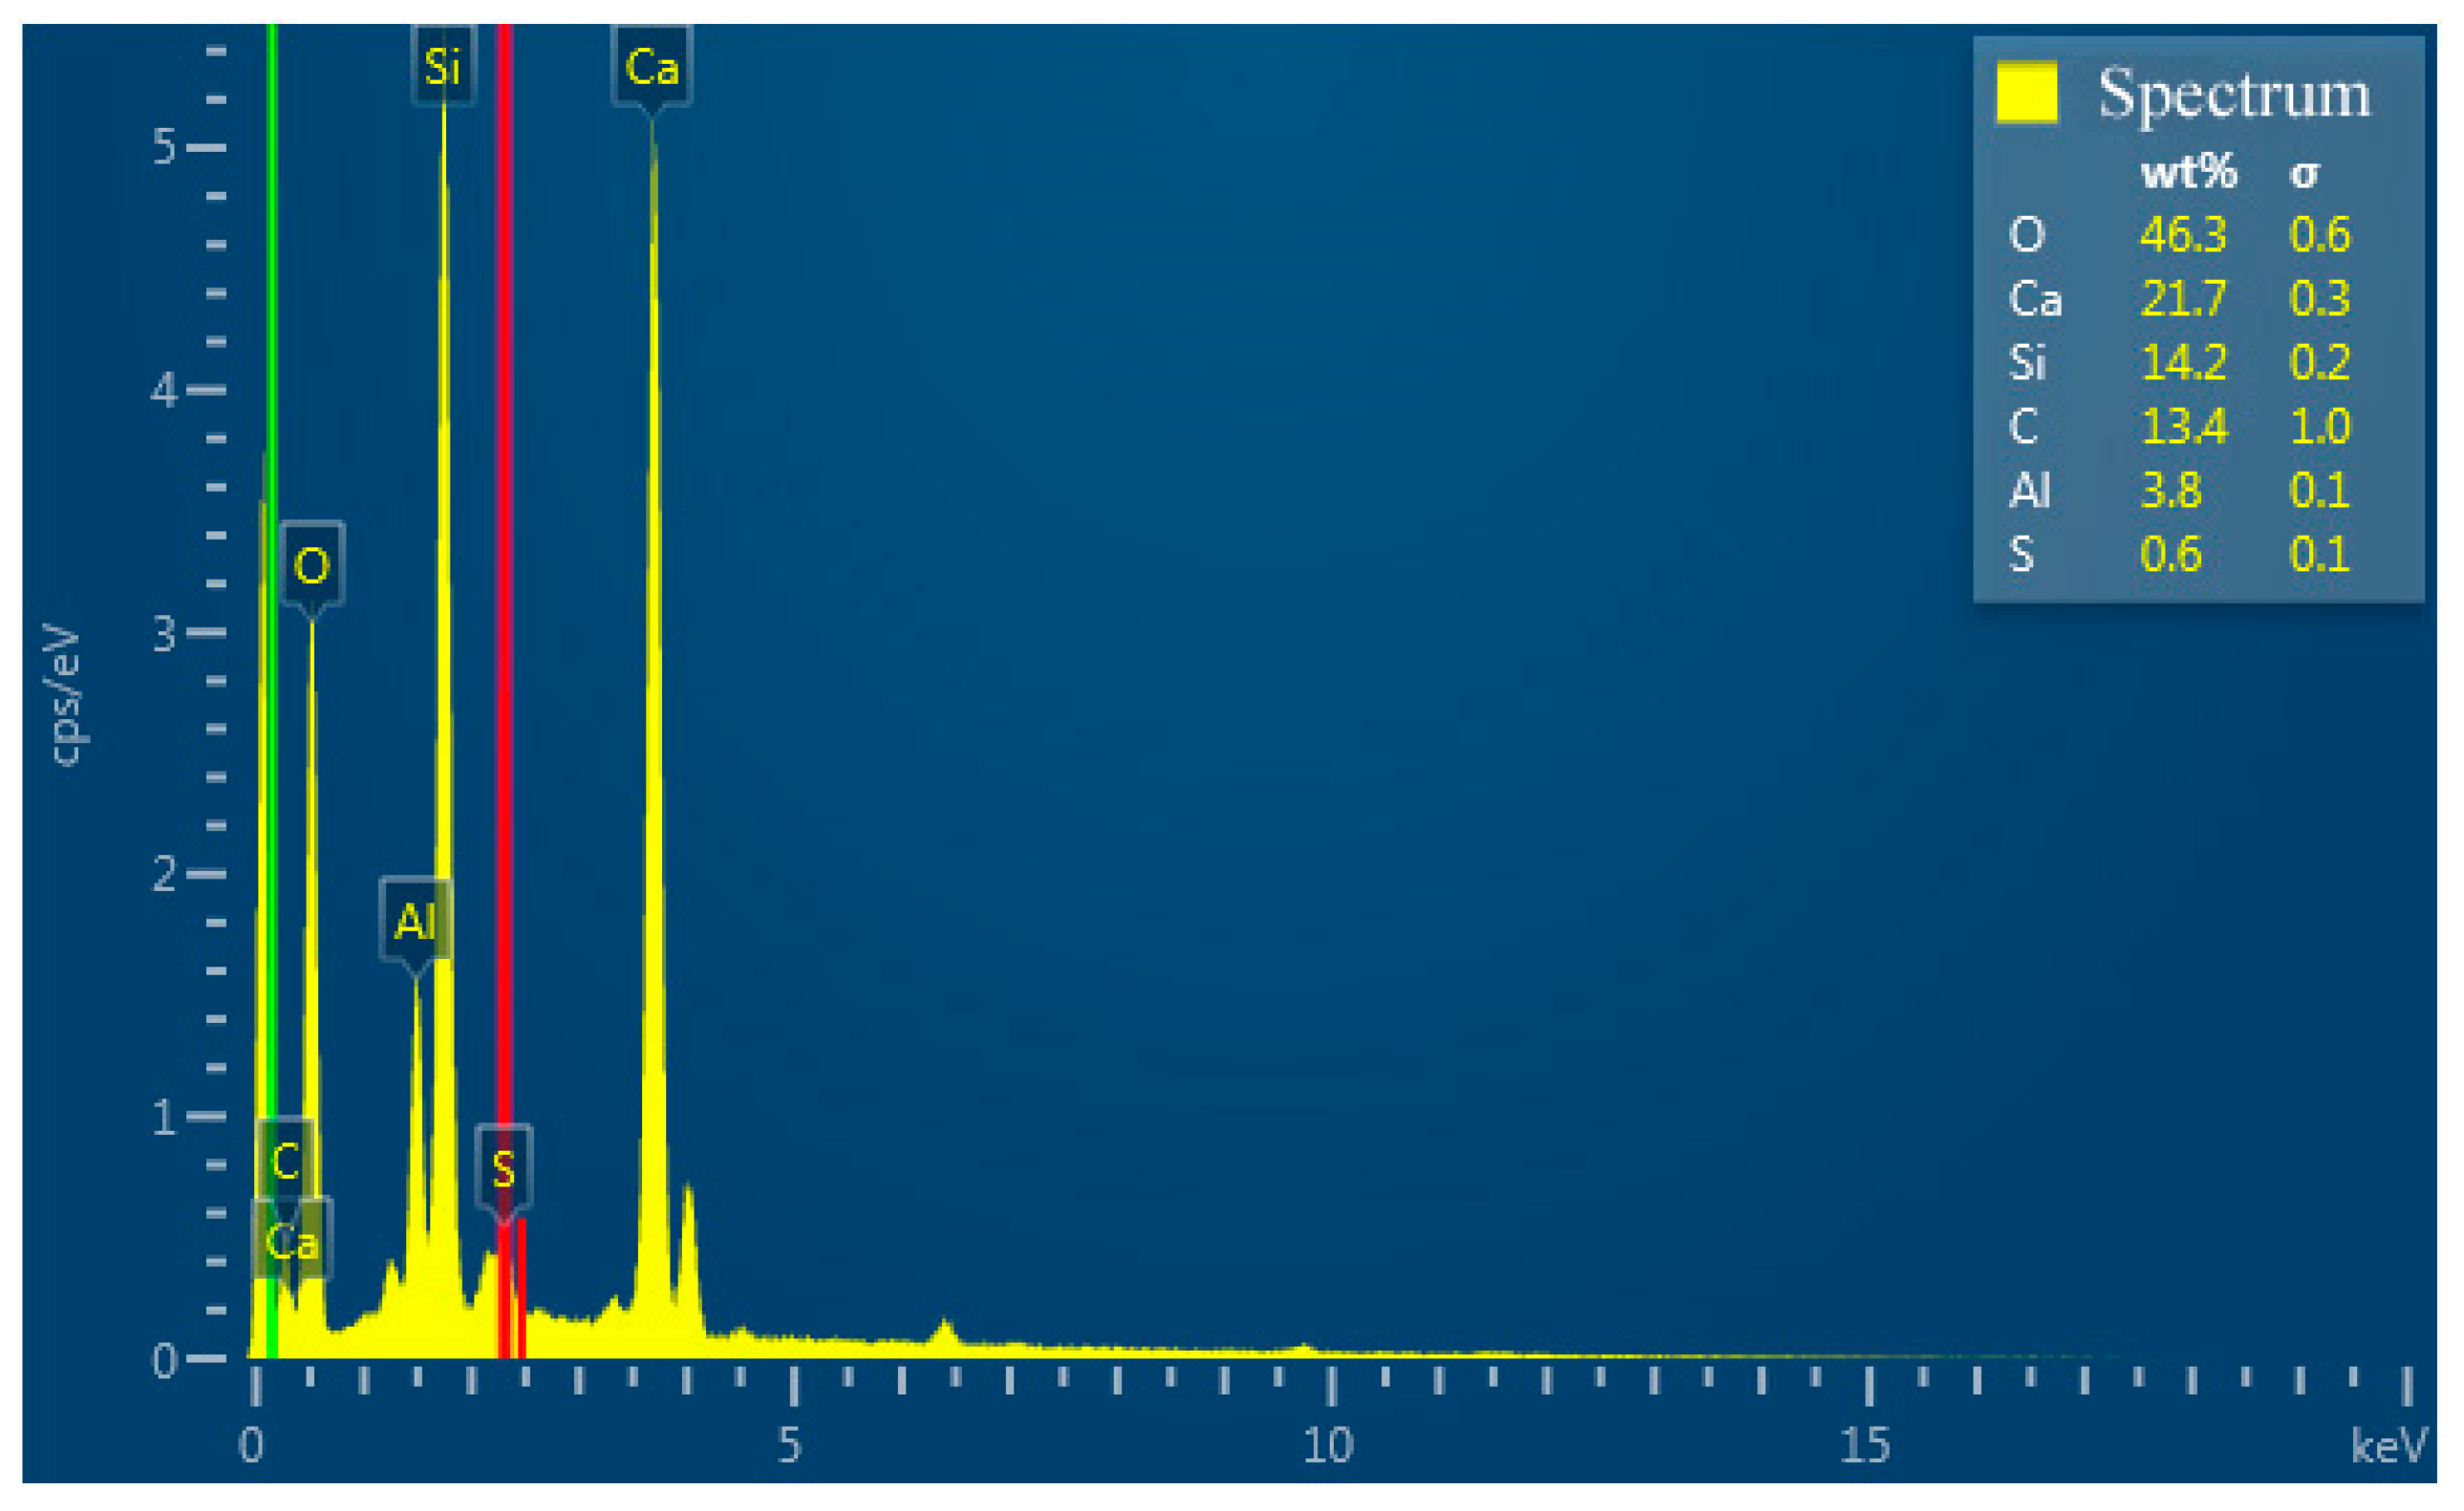
Figure 12 shows the elemental mappings of the mortar specimen fracture surface with HACG auxiliary cementitious admixture calcined at 850oC. The corresponding EDS pattern of the fracture surface is shown in Figure 13. The dark flat areas indicated by yellow arrows on the SEM image were apparently occupied by sand particles (Figure 12(a)), which can be easily confirmed by the mappings for Si and O elements (Figure 12(b) and (c)). The mapping for Al and C elements told the locations of big and small calcined HACG particles (Figure 12(d) and (e)), as indicated by yellow arrows, since these particles exhibited the feature of high contents of Al and C elements in HACG. However, Ca element was found almost absent at these locations (Figure 12(f)), suggesting that the HACG particles hardly involved in the hydration reaction, and made almost no contribution to the strengthening effect on mortar. Obviously, the number and size of HACG particles without involvement in the hydration reaction were less, and most Al-enriched areas were found to be distributed with Ca elements homogeneously, as indicated by yellow circles in Figure 12(a). This proves that HACG auxiliary cementitious admixture calcined at 850oC can be well hydrated to form C-A-(S)-H gel.
4. Conclusions

HACG powders mixed with 20wt.% CH were calcined at different temperatures to prepare HACG auxiliary cementitious admixture. The thermal transformation and calcining products of HACG-CH mixtures were analyzed. The effect of calcining temperature on the mechanical properties of HACG-cement mortar specimens was investigated. The conclusions are drawn as follows:
  • HACG-CH mixture underwent a series of transformations at different calcining temperatures. Kaolinite was dehydroxylated into metakaolin at 600oC, and further transformed into mullite at 900oC. CH was dehydroxylated to CaO at temperature below 600oC, and then a part of CaO reacted with CO2 generated from carbon combustion in HACG to form CaCO3 at 600oC, finally the resulting CaCO3 was decompose into CaO again in the temperature range of 800-900oC. Meanwhile, several types of hydratable products were generated from the reaction between active metakaolin and CaO, namely CA2 at 600oC, C2S and C12A7 at 800oC, and C3S at 900oC.
  • The activated HACG possess high reactivity, the active Al2O3 in HACG-CH mixture calcined at 800 and 850oC can reacted with CH to form C4AH19 during hydration process.
  • With elevating the calcining temperature, the flexural and compressive strength of HACG-cement mortar specimens increased until 850oC, and then decreased rapidly at 900oC. As compared with pure cement mortar specimens, the maximum 28-d flexural and compressive strength of HACG-cement mortar specimens increased by 5.4% and 38.2%, respectively.
  • The optimal calcination temperature for preparing HACG auxiliary cementitious admixture was 850oC.
  • The fracture mode of flexural strength specimen developed as follows: cleavage fracture at 600oC, tear fracture at 850oC and cleavage fracture again at 900oC.

Author Contributions

Jian An, Yongfu Zhu and Liang Li conceived and designed the experiments; Mingjun Zhang, Shigang Zhang, Fang Yang and He Zhang performed the tests; Mingjun Zhang performed XRD, SEM analysis; Mingjun Zhang, Yongfu Zhu and Liang Li analyzed the data; Jian An wrote the paper.

Funding

This research is fund by Jinneng Holding Coal Industry Group, China.

Acknowledgments

The authors wish to express their gratitude for the support from Jinneng Holding Coal Industry Group, China.

Conflicts of Interest

The authors declare no conflict of interest.

References

  1. Zhu, J.; Sun, B.; Zhang, J.; Wu, L.; Wang, L.; Han, Y.; Zhang, B. Research on China’s coal resources development layout under the goals of carbon peak and carbon neutrality. China Coal. 2023, 49, 44–50. [Google Scholar]
  2. Gao, S.; Zhao, G.; Zhou, L.; Yan, K. Utilization of coal gangue as coarse aggregates in structural concrete. Constr. Build. Mater. 2020, 268, 121212. [Google Scholar] [CrossRef]
  3. Zhang, Y.L.; Ling, T.C. Reactivity activation of waste coal gangue and its impact on the properties of cement-based materials –A review. Constr. Build. Mater. 2020, 234, 11724. [Google Scholar] [CrossRef]
  4. Li, Z.; Guo, T.; Chen, Y.; Zhao, X.; Chen, Y.; Yang, X.; Wang, J. Road performance analysis of cement stabilized gangue mixture. Mater. Res. Express 2021, 8, 125502. [Google Scholar] [CrossRef]
  5. Zhang, Q.; Wang, X. Performance of cemented coal gangue backfill. J. Cent. South Univ. Technol. 2007, 14, 216–219. [Google Scholar] [CrossRef]
  6. Gao, S.; Zhang, S.; Guo, L. Application of coal gangue as a coarse aggregate in green concrete production: A review. Materials, 2021, 14, 6803. [Google Scholar] [CrossRef]
  7. Li, L.; Long, G.; Bai, C.; Ma, K.; Ma, M.; Zhang, S. Utilization of coal gangue aggregate for railway roadbed construction in practice. Sustainability, 2020, 12, 4583. [Google Scholar] [CrossRef]
  8. Ribeiro, J.; da Silva, E.F.; Flores, D. Burning of coal waste piles from douro coalfield (Portugal): petrological, geochemical and mineralogical characterization. Int. J. Coal Geol. 2010, 81, 359–372. [Google Scholar] [CrossRef]
  9. Guo, W.K.; Chen, B.; Li, G.Y.; Liu, M.Y.; Chen, Q.; Zhang, X.R.; Li, S.X.; Chen, S.Y.; Feng, W.H.; Zhang, R.X.; Chen, M.; Shi, T.L. Ambient PM2.5 and related health impacts of coal and coal gangue. Environ. Sci. Technol. 2021, 55, 5763–5771. [Google Scholar] [CrossRef]
  10. Zhou, S.; Dong, J.; Yu, L.; Xu, C.; Jiao, X.; Wang, M. Effect of activated coal gangue in north China on the compressive strength and hydration process of cement. J. Mater. Civ. Eng. 2019, 31, 04019022. [Google Scholar] [CrossRef]
  11. Gu, B.; Wang, P. Analysis of factors affecting pozzolanic activity in thermal activated coal gangue. J. Build. Mater. 2009, 12, 6–11. [Google Scholar]
  12. Wang, A.G.; Zhu, Y.Y.; Xu, H.Y.; Liu, K.W.; Jing, Y.; Sun, D.S. Research progress on coal gangue aggregate for concrete. Bull. Chin. Ceram. Soc. 2019, 38, 2076–2086. [Google Scholar]
  13. Zhang, H.; Feng, M.; Ning, Z. Study of calcination activation of Datong coal gangue formed in C-P period. J. Shanxi Datong Unive. (Natural Science), 2009, 25, 66–76. [Google Scholar]
  14. Li, C.; Wan, J.; Sun, H.; Li, L. Investigation on the activation of coal gangue by a new compound method. J. Hazard. Mater. 2010, 179, 515–520. [Google Scholar] [CrossRef] [PubMed]
  15. Zhou, M.; Dou, Y.; Zhang, Y.; Zhang, Y.; Zhang, B. Effect of the variety and content of coal gangue coarse aggregate on the mechanical properties of concrete. Constr. Build. Mater. 2019, 220, 386–395. [Google Scholar] [CrossRef]
  16. Liu, C.; Deng, X.; Liu, J.; Hui, D. Mechanical properties and micro structures of hypergolic and calcined coal gangue based gepolymer recycled concrete. Constr. Build. Mater. 2019, 221, 691–708. [Google Scholar] [CrossRef]
  17. Frias, M.; Sanchez de Rojas, M.I.; Garcia, R.; Juan Valdes, A.; Medina, C. Effect of activated coal mining wastes on the properties of blended cement. Cem. Concr. Compos. 2012, 34, 678–683. [Google Scholar] [CrossRef]
  18. Chen, J.; Jia, J.; Zhang, L.; Zhu, M. Effect of hydration process on properties and microstructure of coal gangue admixture concrete. KSCE J. Civ. Eng. 2022, 26, 3520–3532. [Google Scholar] [CrossRef]
  19. Gong, C.; Li, D.; Wang, X. Mechanism of calcinations of coal gangue with calcium. J. Chin. Ceram. Soc. 2007, 35, 881–885. [Google Scholar]
  20. Zhao, Y.; Zhang, Z.; Ji, Y.; Song, L.; Ma, M. Experimental research on improving activity of calcinated coal gangue via increasing calcium content. Materials 2023, 16, 2705. [Google Scholar] [CrossRef]
  21. Gong, C.; Li, D. Mineral composition variation of calcined coal gangue doped with calcium and fluorite. J. Chin. Ceram. Soc. 2006, 34, 855–860. [Google Scholar]
  22. GB/T 17671, Test method for strength of hydraulic cement mortar, 2021.
  23. Cheng, H.; Yang, J.; Frost, R.L.; Wu, Z. Infrared transmission and emission spectroscopic study of selected Chinese palygorskites. Spectrochim. Acta 2011, A83, 518–524. [Google Scholar] [CrossRef] [PubMed]
  24. Xu, B.; Liu, Q.; Ai, B.; Ding, S.; Frost, R.L. Thermal decomposition of selected coal gangue. J. Them. Anal. Calrim. 2018, 131, 1413–1422. [Google Scholar] [CrossRef]
  25. Xue, H.; Dong, X.; Fan, Y.; Ma, X.; Yao, S. Study of structural transformation and chemical reactivity of kaolinite-based high ash slime during calcinations. Minerals 2023, 13, 466. [Google Scholar] [CrossRef]
  26. Li, Y.; Wang, W.; Yang, X. Analysis of thermal activation and phase transformation of coal-gangue. J. Chin. Ceram. Soc. 2007, 35, 1258–1269. [Google Scholar]
  27. Sabir, B.B.; Wild, S.; Bai, J. Metakaolin and calcined clays as pozzolans for concrete: a review. Cem. Concr. Compos. 2001, 26, 441–454. [Google Scholar] [CrossRef]
  28. Fernandez, R.; Martirena, F.; Scivener, K.L. The origin of the pozzolanic activity of calcined clay minerals: a comparison between kaolinite, illite and montmorillonite. Cem. Concr. Res. 2011, 41, 113–122. [Google Scholar] [CrossRef]
  29. Xu, X.; Lao, X.; Wu, J.; Zhang, Y.; Xu, X.; Li, K. Microstructural evolution, phase transformation, and variations in physical properties of coal series kaolin powder compact during firing. Appl. Clay Sci. 2015, 115, 76–86. [Google Scholar] [CrossRef]
  30. Wang, A.; Liu, P.; Mo, L.; Liu, K.; Ma, R.; Guan, Y.; Sun, D. Mechanism of thermal activation on granular coal gangue and its impact on the performance of cement mortars. J. Build. Eng. 2022, 45, 103616. [Google Scholar] [CrossRef]
  31. Hao, R.; Li, X.; Xu, P.; Liu, Q. Thermal activation and structural transformation mechanism of kaolinitic coal gangue from Jungar coalfield, Inner Mongolia, China. App. Clay Sci. 2022, 223, 106508. [Google Scholar] [CrossRef]
Figure 1. Raw HACG blocks (a) and ground powder (b).
Preprints 92734 g001
Figure 2. Particle size distribution of HACG powder (a) and weight loss rate after calcining at different temperatures.
Preprints 92734 g002
Figure 3. XRD pattern of as-received coal gangue.
Preprints 92734 g003
Figure 4. DTA and TG curves of mixed powders of coal gangue with CH addition Under Ar atmosphere and under air condition: (a) DTA in Ar. (b) TG in Ar, (c) DTA in air, (d) TG in air.
Preprints 92734 g004
Figure 5. XRD patterns of HACG-CH mixtures calcined at different temperatures: (a) 600oC, (b) 700oC, (c) 800oC, (d) 850oC, (e) 900oC.
Preprints 92734 g005
Figure 6. SEM images of mixture of coal gangue and CH calcined at different temperature: (a) original coal gangue powders, (b) 600oC, (c) 700oC, (d) 800oC, (e) 850oC, (f) 900oC.
Preprints 92734 g006
Figure 7. SEM images of mixture of CG and CH calcined at different temperatures: (a) 600oC, (b) 700oC, (c) 800oC, (d) 850oC, (e) 900oC.
Preprints 92734 g007
Figure 8. EDS patterns at certain indicated locations on the surfaces of mixtures of CG and OH calcined at different temperatures: (a) 600oC, (b) 700oC, (c) 800oC, (d) 850oC, (e) 900oC.
Preprints 92734 g008
Figure 9. The XRD analysis of hydration products originated from HACG auxiliary cementitious admixtures and cement.
Preprints 92734 g009
Figure 10. Flexural strength (a) and compressive strength (b) of HACG-cement mortar specimens vs. calcining temperature.
Preprints 92734 g010
Figure 11. SEM images of fracture surfaces of mortar specimens with HACG cementitious admixtures calcined at different temperatures: (a) 600oC, (b) 600oC, (c) 700oC, (d) 800oC, (e) 850oC, (f) 900oC.
Preprints 92734 g011aPreprints 92734 g011b
Figure 12. SEM image and elemental mappings ((b)-(f)) of fracture surface: (a) SEM image, (b) Si, (c) O, (d) Al, (e) C, (f) C.
Preprints 92734 g012
Figure 13. EDS pattern of fracture surface.
Preprints 92734 g013
Table 1. Chemical composition of used materials.
Material SiO2 Al2O3 Fe2O3 CaO MgO SO3 K2O Na2O TiO2 P2O5 Loss
Coal gangue 52.60 45.01 0.21 0.11 0.06 - 0.12 0.04 0.97 0.03 0.35
Cement 21.04 6.03 3.62 63.85 2.64 2.21 - - - - 0.21
Table 2. Chemical composition and product at indicated locations.
Temperature (oC) O Al Si S Ca Location Product
600 45.16 13.43 11.66 0.06 29.21 132 CaO
56.17 7.19 6.70 0.00 29.93 134 CaCO3
53.78 22.35 22.61 0.01 1.41 135 Metakaolin
700 49.80 19.46 18.03 0.00 12.69 128 CA2
50.42 7.36 5.87 0.00 36.32 129 CaCO3
58.00 17.30 17.79 0.00 6.78 131 Metakaolin +CaCO3
800 51.84 2.51 2.11 0.31 43.23 123 CaCO3
11.81 11.70 11.53 0.02 64.92 125 CaO
36.85 10.25 13.49 0.17 39.23 126 C2S
45.67 4.42 4.15 0.31 45.45 127 CaO
850 45.10 7.43 6.93 0.12 39.97 119 CaO
45.10 9.68 9.23 0.12 35.87 120 CaO
52.03 20.27 20.45 0.00 7.25 121 CA2
49.87 13.15 13.00 0.00 23.97 122 C12A7
900 55.13 2.30 2.26 0.24 33.60 136 CaCO3
45.70 9.12 9.75 0.09 35.43 137 CaO
40.56 23.67 26.11 0.00 9.65 138 CA2
51.56 11.18 13.47 0.00 23.74 140 C12A7
Table 3. Chemical compositions of fracture surfaces using CG admixtures calcined at different temperatures.
Temperature (oC) O Ca C Si Al S
600 50.2 18.2 14.2 12.8 4.1 0.6
700 47.8 13.9 15.8 20.1 2.1 0.3
800 44.9 20.1 12.9 18.0 3.7 0.5
850 46.3 21.7 13.4 14.2 3.8 0.6
900 48.9 16.7 16.8 13.4 3.5 0.7
Disclaimer/Publisher’s Note: The statements, opinions and data contained in all publications are solely those of the individual author(s) and contributor(s) and not of MDPI and/or the editor(s). MDPI and/or the editor(s) disclaim responsibility for any injury to people or property resulting from any ideas, methods, instructions or products referred to in the content.
Copyright: This open access article is published under a Creative Commons CC BY 4.0 license, which permit the free download, distribution, and reuse, provided that the author and preprint are cited in any reuse.
Prerpints.org logo

Preprints.org is a free preprint server supported by MDPI in Basel, Switzerland.

Subscribe

© 2024 MDPI (Basel, Switzerland) unless otherwise stated