Submitted:
11 December 2023
Posted:
12 December 2023
You are already at the latest version
Abstract
Keywords:
1. Introduction
2. Materials and Methods
2.1. Test Materials
2.2. Test Methods
2.2.1. Column Immersion Test
2.2.2. Electrochemical Impedance Spectroscopy Tests
3. Equivalent circuit model
3.1. Analysis of Conductive Pathways
3.2. Equivalent Circuit Model
4. Results and Analysis
4.1. Nyquist Plot Analysis
4.2. Bode Plot Analysis
4.3. Equivalent Circuit Parameter Analysis
5. Conclusions
Author Contributions
Funding
Data Availability Statement
Acknowledgments
Conflicts of Interest
References
- Yang, X.; Xi, G.; Yao, N.; Zhou, M.; Gao, X.; Chen, M.; Wang, X.; Pan, Z.; Wang, Z. Spatiotemporal distribution of residual ammonium in a rare-earth mine after in-situ leaching: A modeling study with scarce data. J Hydrol 2022, 615. [Google Scholar] [CrossRef]
- Xiao, Y.; Feng, Z.; Hu, G.; Huang, L.; Huang, X.; Chen, Y.; Long, Z. Reduction leaching of rare earth from ion-adsorption type rare earths ore with ferrous sulfate. Journal of Rare Earths 2016, 34, 917–923. [Google Scholar] [CrossRef]
- Huang, X.; Long, Z.; Wang, L.; Feng, Z. Technology development for rare earth cleaner hydrometallurgy in China. Rare Metals 2015, 34, 215–222. [Google Scholar] [CrossRef]
- Artiushenko, O.; da Silva, R.; Zaitsev, V. Recent advances in functional materials for rare earth recovery: A review. Sustainable Materials and Technologies 2023, 37. [Google Scholar] [CrossRef]
- Wang, X.; Tang, Y.; Lee, J.; Fu, G. Recent advances in rare-earth-based materials for electrocatalysis. Chem Catalysis 2022, 2, 967–1008. [Google Scholar] [CrossRef]
- Xiao, Y.; Feng, Z.; Huang, X.; Huang, L.; Chen, Y.; Wang, L.; Long, Z. Recovery of rare earths from weathered crust elution-deposited rare earth ore without ammonia-nitrogen pollution: I. leaching with magnesium sulfate. Hydrometallurgy 2015, 153, 58–65. [Google Scholar]
- Traore, M.; Gong, A.; Wang, Y.; Qiu, L.; Bai, Y.; Zhao, W.; Liu, Y.; Chen, Y.; Liu, Y.; Wu, H.; Li, S.; You, Y. Research progress of rare earth separation methods and technologies. Journal of Rare Earths 2023, 41, 182–189. [Google Scholar] [CrossRef]
- Jing, H.; Geng, L.; Qiu, S.; Zou, H.; Liang, M.; Deng, D. Research progress of rare earth composite shielding materials. Journal of Rare Earths 2023, 41, 32–41. [Google Scholar] [CrossRef]
- He, Q.; Qiu, J.; Chen, J.; Zan, M.; Xiao, Y. Progress in green and efficient enrichment of rare earth from leaching liquor of ion adsorption type rare earth ores. Journal of Rare Earths 2022, 40, 353–364. [Google Scholar] [CrossRef]
- Shen, L.; Zhou, H.; Shi, Q.; Meng, X.; Zhao, Y.; Qiu, G.; Zhang, X.; Yu, H.; He, X.; He, H.; Zhao, H. Comparative chemical and non-contact bioleaching of ion-adsorption type rare earth ore using ammonium sulfate and metabolites of Aspergillus niger and Yarrowia lipolytica to rationalise the role of organic acids for sustainable processing. Hydrometallurgy 2023, 216, 106019. [Google Scholar] [CrossRef]
- Lai, F.; Huang, L.; Gao, G.; Yang, R.; Xiao, Y. Recovery of rare earths from ion-absorbed rare earths ore with MgSO4 -ascorbic acid compound leaching agent. Journal of Rare Earths 2018, 36, 521–527. [Google Scholar] [CrossRef]
- Deng, Y.; Wan, Y.; Yu, H.; Kang, S.; Deng, Y.; Yang, J. Changes in Microfine Particle Migration of Ionic Rare Earth Ores during Leaching. Sustainability 2023, 15. [Google Scholar] [CrossRef]
- Lai, F.; Gao, G.; Huang, L.; Xiao, Y.; Yang, R.; Li, K. Compound leaching of rare earth from the ion-adsorption type rare earth ore with magnesium sulfate and ascorbic acid. Hydrometallurgy 2018, 179, 25–35. [Google Scholar]
- Ran, X.; Ren, Z.; Gao, H.; Zheng, R.; Jin, J. Kinetics of Rare Earth and Aluminum Leaching from Kaolin. Minerals 2017, 7. [Google Scholar] [CrossRef]
- Chi, R.; Tian, J.; Li, Z.; Peng, C.; Wu, Y.; Li, S.; Wang, C.; Zhou, Z. Existing State and Partitioning of Rare Earth on Weathered Ores. Journal of Rare earth 2005, 756-9+643. [Google Scholar]
- Chen, J.; Qiu, J.; Huang, L.; Chen, X.; Yang, Y.; Xiao, Y. Coordination–reduction leaching process of ion-adsorption type rare earth ore with ascorbic acid. Journal of Rare Earths 2023, 41, 1225–1233. [Google Scholar] [CrossRef]
- Xiao, Y.; Feng, Z.; Hu, G.; Huang, L.; Huang, X.; Chen, Y.; Li, M. Leaching and mass transfer characteristics of elements from ion-adsorption type rare earth ore. Rare Metals 2015, 34, 357–365. [Google Scholar] [CrossRef]
- Meng, X.; Zhao, H.; Zhao, Y.; Shen, L.; Gu, G.; Qiu, G. Heap leaching of ion adsorption rare earth ores and REEs recovery from leachate with lixiviant regeneration. Science of The Total Environment 2023, 898, 165417. [Google Scholar] [CrossRef]
- Guo, Z.; Zhou, J.; Zhou, K.; Jin, J.; Wang, X.; Zhao, K. Soil-water characteristics of weathered crust elution-deposited rare earth ores. Transactions of Nonferrous Metals Society of China 2021, 31, 1452–1464. [Google Scholar] [CrossRef]
- Wang, L.; Wang, C.; Li, L.; Yang, Y. Readsorption of rare earth elements during leaching process of ion-adsorption-type rare earth ore. Rare Metals 2018, 42, 2113–2120. [Google Scholar] [CrossRef]
- Xiao, Y.; Gao, G.; Huang, L.; Feng, Z.; Lai, F.; Long, Z. A discussion on the leaching process of the ion-adsorption type rare earth ore with the electrical double layer model. Minerals Engineering 2018, 120, 35–43. [Google Scholar]
- Yu, H.; Sun, D. Effect of NaCl solution on swelling of bentonite with different water contents. In NEW ADVANCES IN GEOTECHNICAL ENGINEERING 2018, 455–459. [Google Scholar]
- Alkan, M.; Karadaş, M.; Doğan, M.; Demirbaş, Ö. Zeta potentials of perlite samples in various electrolyte and surfactant media. Colloids and Surfaces A: Physicochemical and Engineering Aspects 2005, 259, 155–166. [Google Scholar] [CrossRef]
- Wu, Z.; Chen, Y.; Wang, Y.; Xu, Y.; Lin, Z.; Liang, X.; Cheng, H. Review of rare earth element (REE) adsorption on and desorption from clay minerals: Application to formation and mining of ion-adsorption REE deposits. Ore Geology Reviews 2023, 157. [Google Scholar] [CrossRef]
- Wang, L.; Liao, C.; Yang, Y.; Xu, H.; Xiao, Y.; Yan, C. Effects of organic acids on the leaching process of ion-adsorption type rare earth ore. Journal of Rare Earths 2017, 35, 1233–1238. [Google Scholar] [CrossRef]
- Xiao, Y.; Chen, Y.; Feng, Z.; Huang, X.; Huang, L.; Long, Z.; Cui, D. Leaching characteristics of ion-adsorption type rare earths ore with magnesium sulfate. T Nonferr Metal Soc 2015, 25, 3784–3790. [Google Scholar] [CrossRef]
- Feng, J.; Zhou, F.; Chi, R.; Liu, X.; Xu, Y.; Liu, Q. Effect of a novel compound on leaching process of weathered crust elution-deposited rare earth ore. Minerals Engineering 2018, 129, 63–70. [Google Scholar] [CrossRef]
- Hu, G.; Feng, Z.; Dong, J.; Meng, X.; Xiao, Y.; Liu, X. Mineral properties and leaching characteristics of volcanic weathered crust elution-deposited rare earth ore. Journal of Rare Earths 2017, 35, 906–910. [Google Scholar] [CrossRef]
- Yin, S.; Pei, J.; Jiang, F.; Li, S.; Peng, J.; Zhang, L.; Ju, S.; Srinivasakannan, C. Ultrasound-assisted leaching of rare earths from the weathered crust elution-deposited ore using magnesium sulfate without ammonia-nitrogen pollution. Ultrason Sonochem 2018, 41, 156–162. [Google Scholar] [CrossRef]
- Shi, Q.; Zhao, Y.; Meng, X.; Shen, L.; Qiu, G.; Zhang, X.; Yu, H.; He, X.; He, H.; Zhao, H. Column leaching of ion adsorption rare earth ore at low ammonium concentration. Journal of Materials Research and Technology 2022, 19, 2135–2145. [Google Scholar] [CrossRef]
- Rasoulnia, P.; Barthen, R.; Lakaniemi, A. A critical review of bioleaching of rare earth elements: The mechanisms and effect of process parameters. Critical Reviews in Environmental Science and Technology 2020, 51, 378–427. [Google Scholar] [CrossRef]
- Xie, F.; Yin, S.; Yuan, C.; Qi, Y.; Liang, J.; Zhu, Z.; Li, G. Study on the Influence Mechanism of Leaching Solution on Pore of Ionic Rare Earth Ore. Chinese Rare Earths, 2018, 39(06): 48-56.
- Zhang, J.; Zheng, F.; Liu, Z.; Hong, S.; Dong, B.; Xing, F. Nondestructive monitoring on hydration behavior of cement pastes via the electrochemical impedance spectroscopy method. Measurement 2021, 185. [Google Scholar] [CrossRef]
- Liu, Q.; Cheng, S.; Xiao, J.; Sun, C. Study of the relationship between the AC impedance spectrum of varied building solid waste materials and their microporous structure[J]. Journal of Building Materials: 1-11.
- Bragança, M.; Hasparyk, N.; Bronholo, J.; Silva, A.; Portella, K.; Kuperman, S. , Electrochemical impedance spectroscopy and ultrasound for monitoring expansive reactions and their interactions on cement composites. Construction and Building Materials 2021, 305. [Google Scholar] [CrossRef]
- Rao, R.; Sasmal, S. Nanoengineered smart cement composite for electrical impedance-based monitoring of corrosion progression in structures. Cement and Concrete Composites 2022, 126. [Google Scholar] [CrossRef]
- Wen, W.; Jia, L.; Xie, J.; Zhao, W.; Feng, H.; Cao, D.; Sun, F.; Han, P.; Bai, X.; He, B. Electrochemical response and effect evaluation of high belite sulphoaluminate cement combined with red mud-fly ash on solidification of Cu2+-contaminated kaolin. Case Studies in Construction Materials 2022, 17. [Google Scholar] [CrossRef]
- Barsoukov. Impedance Spectroscopy: Theory, Experiment, and Applications, 3rd ed.; Wiley-Interscience; Hoboken, USA, 2005.
- Shi. Impedance Spectroscopy of Concrete; China Railway Publishing House: Beijing, China, 2003. [Google Scholar]
- Cao. ; Zhang. Introduction to Electrochemical impedance spectroscopy.; Science Press: Beijing, China, 2002. [Google Scholar]
- Zhao, S.; Guo, B.; Peng, Y.; Mai, Y. An impedance spectroscopy study on the mitigation of clay slime coatings on chalcocite by electrolytes. Minerals Engineering 2017, 101, 40–46. [Google Scholar] [CrossRef]
- Elmelouky, A.; Mortadi, A.; Chahid, E.; Elmoznine, R. Impedance spectroscopy as a tool to monitor the adsorption and removal of nitrate ions from aqueous solution using zinc aluminum chloride anionic clay. Heliyon 2018, 4, e00536. [Google Scholar] [CrossRef]
- Han, P.; Zhang, Y.; Chen, F.; Bai, X. Interpretation of electrochemical impedance spectroscopy (EIS) circuit model for soils. Journal of Central South University 2015, 22, 4318–4328. [Google Scholar] [CrossRef]
- Sun, F.; Chen, Z.; Bai, X.; Wang, Y.; Liu, X.; He, B.; Han, P. Theoretical and experimental bases for the equivalent circuit model for interpretation of silty soil at different temperatures. Heliyon 2023, 9, e12652. [Google Scholar] [CrossRef]
- Cheng, J. Experimental study on the electrochemical characterization of kaolin and montmorillonite. Taiyuan University of Technology, Taiyuan, Shanxi, China, 2022.
- Niu, S.; Luo, J.; Chen, M.; Chen, Z.; Wang, X.; Bai, X.; Li, J. Experimental study of cement-based materials under sulfate attack environment using Electrochemical Impedance Spectroscopy. International Journal of Electrochemical Science 2023, 18. [Google Scholar] [CrossRef]
- Niu, S.; Wang, X.; Xing, J.; Li, J.; Xie, R.; Bai, X.; Han, P. Experimental Study of the Electrochemical Impedance Characteristics and Mechanical Properties of High Belite Sulfoaluminate Cement. International Journal of Electrochemical Science 2022, 17. [Google Scholar] [CrossRef]
- Wang, H.; Wang, X.; Wang, Y.; Wang, D.; Hu, K.; Zhong, W.; Guo, Z. Influence of ammonium sulfate leaching agent on engineering properties of weathered crust elution-deposited rare earth ore. Acta Geotechnica 2023. [CrossRef]
- Wang, X.; Zhuo, Y.; Zhao, K.; Zhong, W. Experimental measurements of the permeability characteristics of rare earth ore under the hydro-chemical coupling effect. RSC Adv 2018, 8, 11652–11660. [Google Scholar] [CrossRef]
- Gao, Z.; Rao, Y.; Shi, L.; Xiang, R.; Yang, Z. Effect of Magnesium Sulfate Solution on Pore Structure of Ionic Rare Earth Ore during Leaching Process. Minerals 2023, 13. [Google Scholar] [CrossRef]
- Zhou, L.; Wang, X.; Huang, C.; Wang, H.; Ye, H.; Hu, K.; Zhong, W. Development of pore structure characteristics of a weathered crust elution-deposited rare earth ore during leaching with different valence cations. Hydrometallurgy 2021, 201. [Google Scholar] [CrossRef]
- Zhang, X.; Gao, Z.; Rao, Y.; Shi, L.; Xu, W. Evolutionary Law of Pore Structure of Ion-Adsorbed Rare Earth Ore Leaching Process. Minerals 2023, 13, 322. [Google Scholar] [CrossRef]
- Shi, L.; Rao, Y.; Wang, D.; Zhang, M.; Huang, T.; Gao, Y. A Capillary Model for Predicting Saturated Hydraulic Conductivity of Ion-Adsorption Rare Earth Ore Based on Improved Kozeny–Carman Equation. Geofluids 2022, 2022, 1–10. [Google Scholar] [CrossRef]
- Luo, X.; Zhang, Y.; Zhou, H.; He, K.; Zhang, B.; Zhang, D.; Xiao, W. Pore structure characterization and seepage analysis of ionic rare earth orebodies based on computed tomography images. International Journal of Mining Science and Technology 2022, 32, 411–421. [Google Scholar] [CrossRef]
- Xie, R.; Xie, Y.; Li, B.; Han, P.; He, B.; Dou, B.; Bai, X. Electrochemical Impedance Spectroscopy of Sandy Soil Containing Cl-, SO42- and HCO3. International Journal of Electrochemical Science 2021, 16. [Google Scholar] [CrossRef]
- Long, P.; Wang, G.; Zhang, C.; Yang, Y.; Cao, X.; Shi, Z. Kinetics model for leaching of ion-adsorption type rare earth ores. Journal of Rare Earths 2020, 38, 1354–1360. [Google Scholar] [CrossRef]
- Wang, X.; Zhuo, Y.; Deng, S.; Li, Y.; Zhong, W.; Zhao, K. Experimental Research on the Impact of Ion Exchange and Infiltration on the Microstructure of Rare Earth Orebody. Advances in Materials Science and Engineering 2017, 1–8. [Google Scholar] [CrossRef]

| particle size /mm | <0.1 | 0.1~0.5 | 0.5~0.9 | 0.9~1.43 | 1.43~4 | >4 |
|---|---|---|---|---|---|---|
| percentage /% | 14.6 | 16.2 | 13.2 | 15.7 | 19.2 | 21.1 |
| Particle Size /mm | −0.15 | 0.15–0.25 | 0.25–0.45 | 0.45–0.9 | 0.9–1.43 | 1.43–4 | +4 |
|---|---|---|---|---|---|---|---|
| Rare Earth Content Distribution /% | 53.82 | 15.63 | 11.16 | 10.76 | 3.70 | 2.83 | 2.11 |
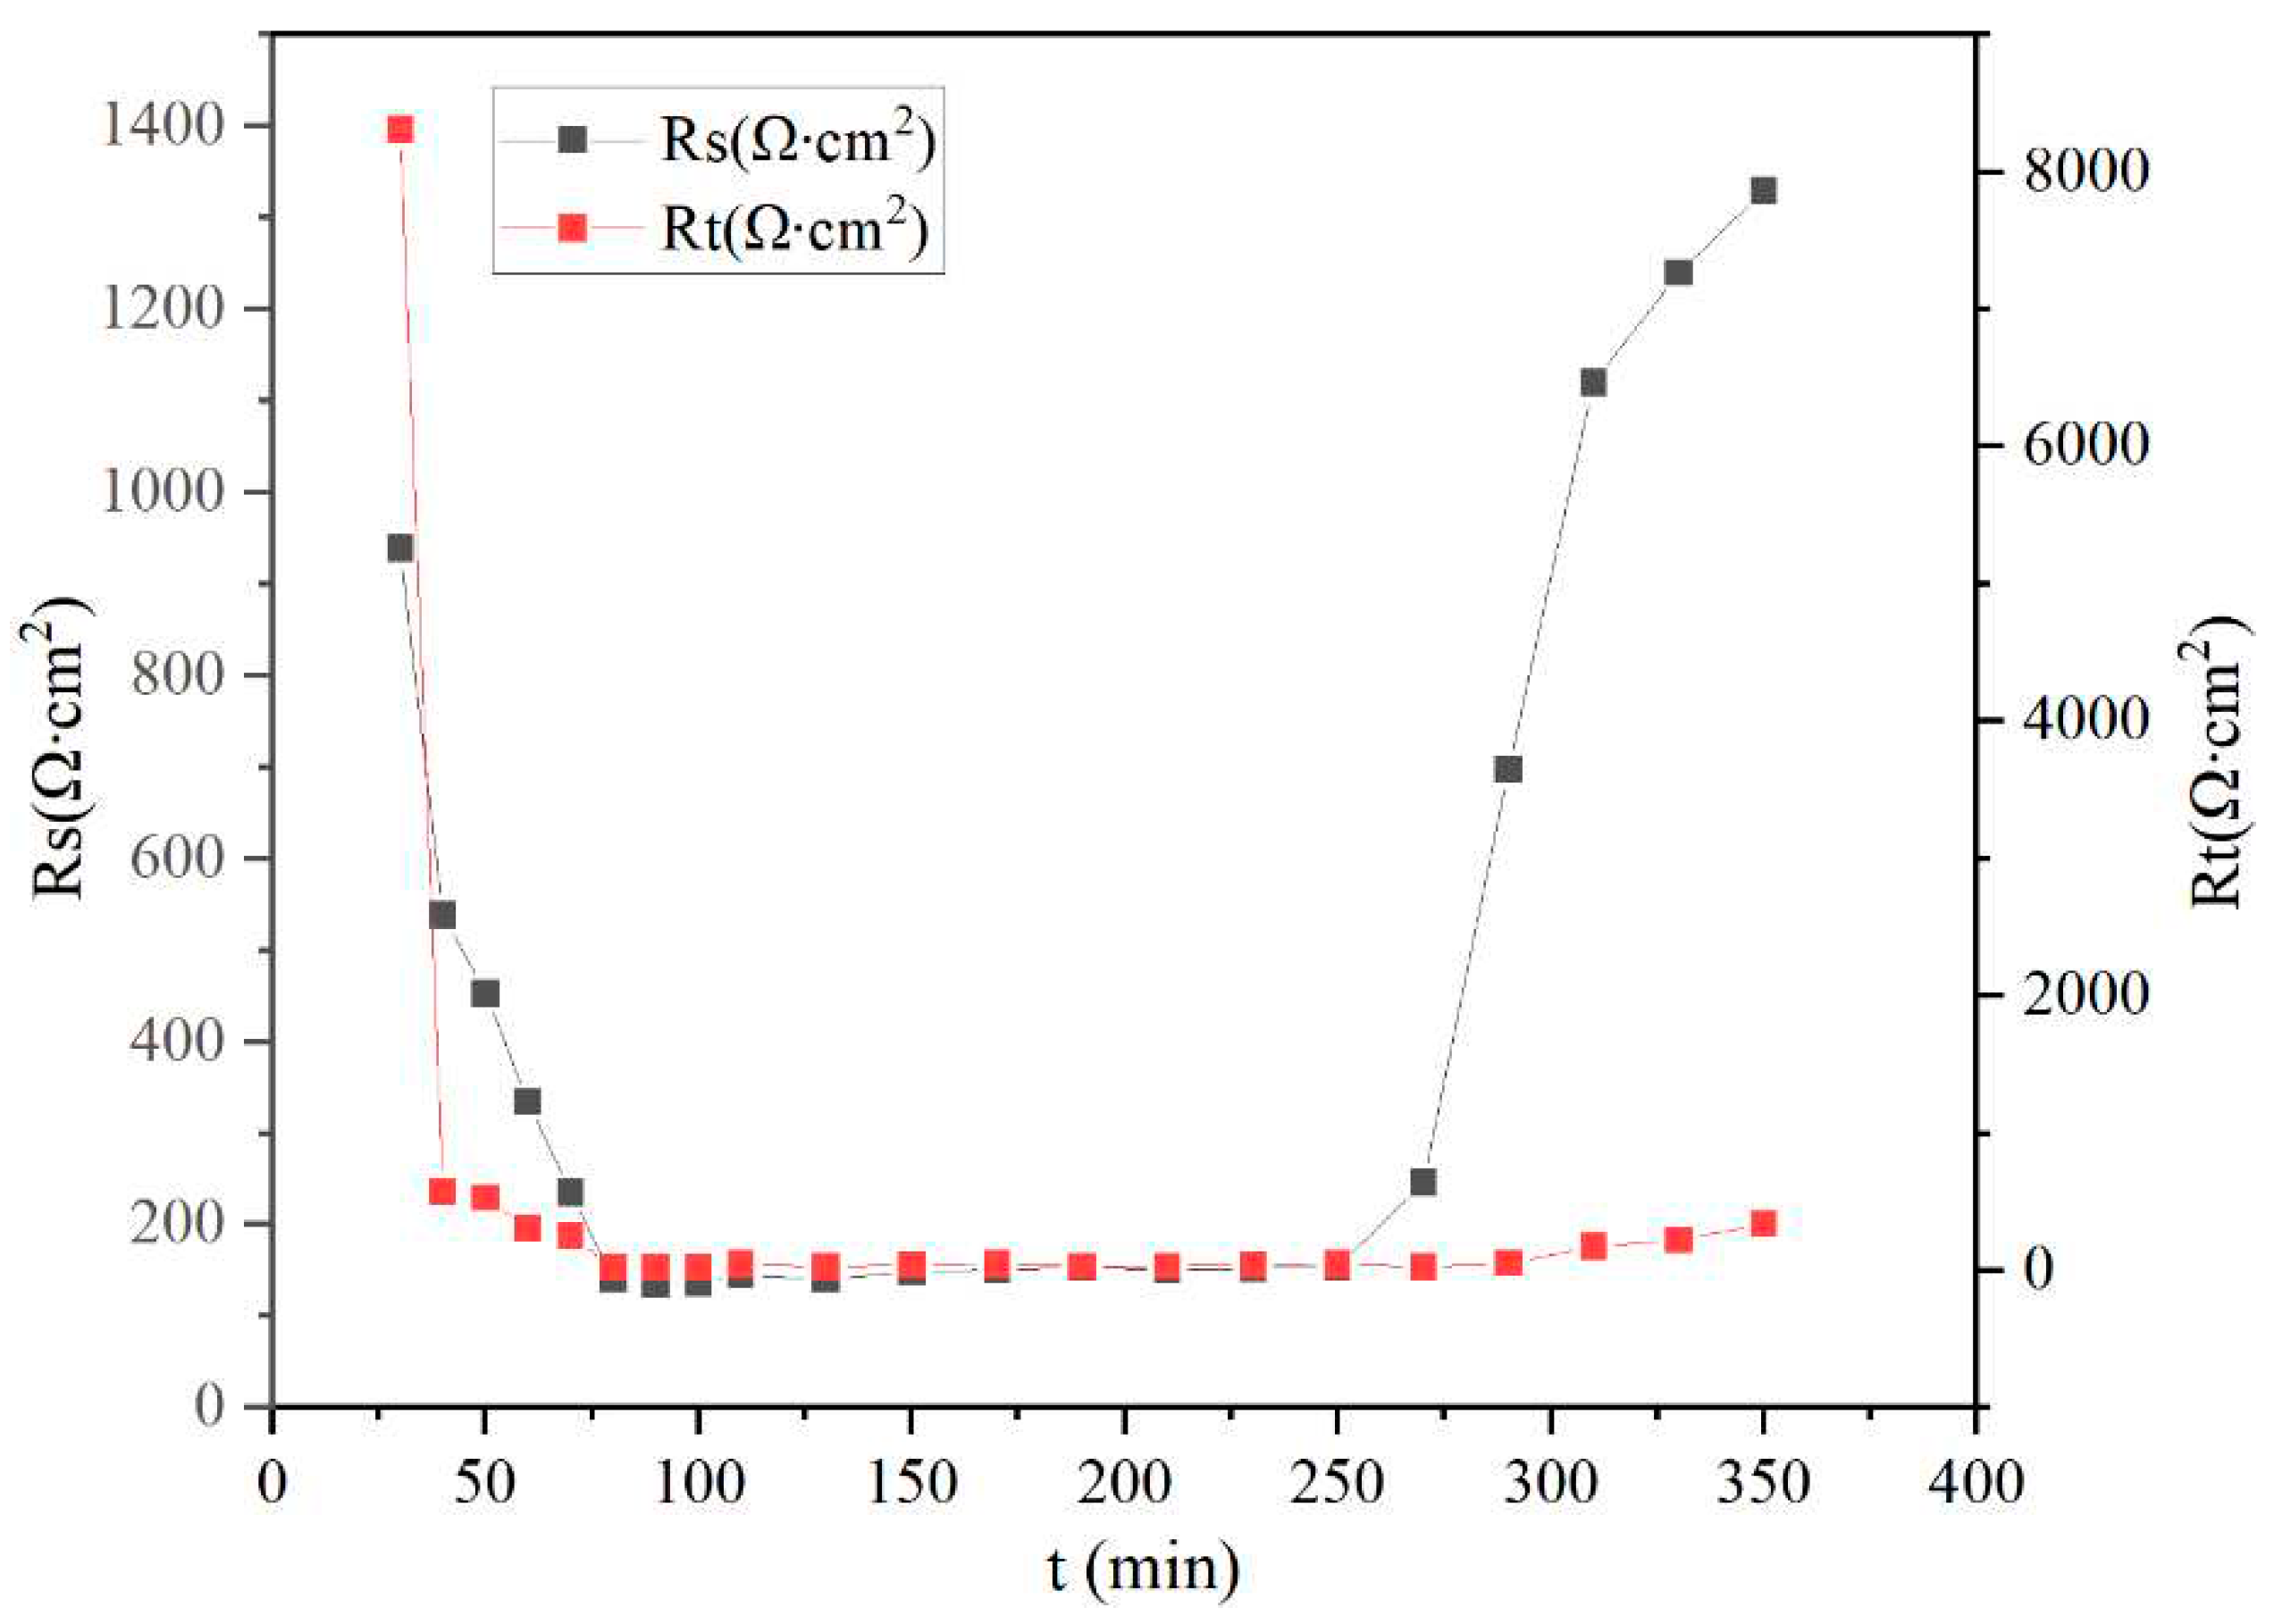
| Time(min) | Rs(Ω∙cm2) | Rt(Ω∙cm2) | Total error(%) |
|---|---|---|---|
| 30 | 939 | 8310 | 3.77 |
| 40 | 538 | 571.9 | 2.31 |
| 50 | 453 | 528 | 4.89 |
| 60 | 334 | 310 | 2.25 |
| 70 | 235 | 256 | 2.45 |
| 80 | 140 | 21 | 2.62 |
| 90 | 135 | 23.9 | 3.85 |
| 100 | 136 | 22.7 | 2.5 |
| 110 | 145 | 47 | 1.76 |
| 130 | 140 | 25.6 | 2.1 |
| 150 | 149 | 43.1 | 1.52 |
| 170 | 151 | 45.5 | 1.87 |
| 190 | 153 | 32.6 | 2.01 |
| 210 | 151 | 30.9 | 1.62 |
| 230 | 152 | 43.8 | 1.71 |
| 250 | 154 | 47 | 1.95 |
| 270 | 246 | 25.7 | 2.55 |
| 290 | 697 | 51.6 | 2.58 |
| 310 | 1120 | 174 | 2.43 |
| 330 | 1240 | 223 | 2.07 |
| 350 | 1330 | 338 | 1.86 |
Disclaimer/Publisher’s Note: The statements, opinions and data contained in all publications are solely those of the individual author(s) and contributor(s) and not of MDPI and/or the editor(s). MDPI and/or the editor(s) disclaim responsibility for any injury to people or property resulting from any ideas, methods, instructions or products referred to in the content. |
© 2023 by the authors. Licensee MDPI, Basel, Switzerland. This article is an open access article distributed under the terms and conditions of the Creative Commons Attribution (CC BY) license (http://creativecommons.org/licenses/by/4.0/).


