Preprint
Article

Area Exclosure Improved Honey Bee Flora Diversity and Regeneration ፡- the Case of Southern Tigrai, Northern Ethiopia

Altmetrics

Downloads

159

Views

72

Comments

0

Submitted:

12 December 2023

Posted:

13 December 2023

You are already at the latest version

Alerts
Abstract
Tigrai region is one of the potential beekeeping areas in Ethiopia, which is endowed with diversified honeybee plant species. However, its honeybee plants are deforested and degraded due to natural and anthropogenic pressures. Area exclosures (AEs) has been practicing for the last three decades restore degraded habitats of the plant species in Ethiopia. Empirical data on the effectiveness of AE is still limited for restoration of honey bee plant species; this study was conducted to assess the roles of AE for species composition, density, and diversity and regeneration status of honeybee floras. Sixty quadrats were installed, 36 in AE and 24 in CGL (communal grazing lands) using a systematic sampling method. The study showed that a total of 42 honey bee plant species belonging to 23 families in AE and 33 species belonging to 17 families in CGL were recorded. The study also indicated a significant increase in the abundance, diversity, regeneration and the structure of the honey bee plant species was found in the AEs. The list presented herein provides a guide to stakeholders in establishing of AE for the foraging resource of honeybee in order to enhance the abundance, diversity and regeneration and structure. Thus, AE has made a significant contribution to solving the shortage of honeybee forages in the beekeeping industry. Therefore, the development of beekeeping is integrated with conservation of natural resources.
Keywords: 
Subject: Biology and Life Sciences  -   Agricultural Science and Agronomy

1. Introduction

Globally, beekeeping plays an important role in food and nutrition security, socio-economy and ecosystem conservation through honey bee pollination services and products such as honey, beeswax and propolis (Porto et al., 2020). According to FAOSTAT data, Ethiopia managed more than seven million honey bee colonies and produced approximately 130,000 tons of honey, which places it among the ten largest honey producing countries in the world. The country is known for its broad physical and climatic ranges, which support the growth of diverse and unique flowering plants, as high as 7,000 species (Fichtl and Admassu, 1994).
The Tigray regional state is one of the regions in Ethiopia that could be suitable for beekeeping. This region is endowed with diversified and favorable agro climatic conditions to sustain more than 300,000 honey bee colonies (Central Statistical Agency, 2019).This region is known for its white honey production, which is popular in Ethiopia’s domestic markets and sold at a premium price due to its unique color, taste, flavor and aroma, contributing to regional economic development and people’s livelihoods. The Tigray white honey has also medicinal properties and its quality is within the acceptable limits of national and international standards, making it the most expensive honey produced in Ethiopia which is comparable to price in the west (Mekuanint and Meareg. 2019).
Natural vegetation, in general, and forest plants in particular, that cover the lands in Tigray, have been cut down, leaving no remnants that help to restore them (Ayalew 2006). The life cycle and productivity of honeybees in the region have been impacted by the loss of these natural plant species. The production of honey and other products by honey bees depends on the availability of diverse floral resources (Amsalu et al. 2003). However, their scarcity is a major limiting factor for beekeeping developments across Ethiopia (Haftom and Tesfay, 2012; Gidey et al. 2012; Adeday 2012; Gebremedhin et al. 2012; Gebreamlak et al. 2020). A deficiency in the quantity and quality of pollen and nectar can lead to a demographic decrease of bee colonies, leading to low colony populations (Keller et al. 2005), Haftom et al. 2017), affected honey bee health (Michener 2007).
To restore and enhance vegetation cover, Tigrai has implemented various intervention actions. Establishment of area exclosures (AE) in degraded habitats has been practiced for the past three decades to increase vegetation cover for honeybee production (Nyssen et al. 2007). AE also allows native vegetation to regenerate as a way to reduce soil erosion, increase infiltration, and provide several economic and ecological services for local communities. (Aerts et al. 2004); Emiru et al. 2007; Nyssen et al. 2007). Although the restoration roles of the AEs have been well studied across Tigray (Wolde et al. 2011a, 2011b, 2011c; Gebrewahd, 2014, Yayneshet 2011; Wolde, 2013; Birhane et al. 2017, Tsegay et al. 2019; Tesfay et al. 2019), there is still a limited study on their roles on honey bee flora restoration and conservation (Equar et al. 2016; Haftom et al. 2017). Hence, this study was conducted to assess the roles of AEs for 1) composition, diversity and population structure of honey bee flora tree species; and 2) examine roles of AE for natural regeneration of honey bee flora tree species in Tigrai.

2. Materials and Methods

2.1. Description of study area

The study was conducted in the Gra-Kahsu area exclosure, which is located in Alamata district, in the southern zone of Tigrai region, northern Ethiopia (Figure 1). Gra-Kahsu natural vegetation was designed to conserve long lasted unique natural features, historical interests and other natural values with legal and administrative supports on the upper part of Alamata town. Gra-Kahsu natural vegetation is endowed with different natural resources such as wildlife and other biodiversity, which contribute great potent source as important pillars for future local development. Adjacent to this Area exclosure (AE), there is communal grazing land (CGL) used by the community with no restriction to the access resource. Therefore, this study was conducted in these two land use systems, AE of the Gra-Kahsu natural vegetation having the restriction and rules of resource access and the nearby CGL having no restriction and rule of resource access. The common indigenous trees of the area are Acacia tortilis, Balanites aegyptiaca, Carissa spinarum, Grewia mollis, Olea africana, Pittosporum viridiflorum and Ziziphus spina-christi (Tesfay et al. 2018). The area is suitable for bee farming due to its good natural resources and climatic conditions. In addition, supporting practices for bee farming such as reforestation, area exclosure, and agroforestry have been implemented (Southern Zone BOARD 2018).

2.2. Field Survey Design and Vegetation Sampling

AE and CGL (Area exclosure and Communal grazing land) were the two land use systems where the study was conducted. The land use systems are separated by 1 km. It is assumed that the AE and CGL were identical in biophysical, climatic, and topographic conditions prior to the introduction of the AEs. The AEs are characterized by full restriction of people and animals to restore degraded lands, while nearby CGLs allow human and animal interference. Area coverage of AE in the study area was estimated to be 85 ha and for the CGL was about 38.3 ha (Southern Zone BOARD 2018).
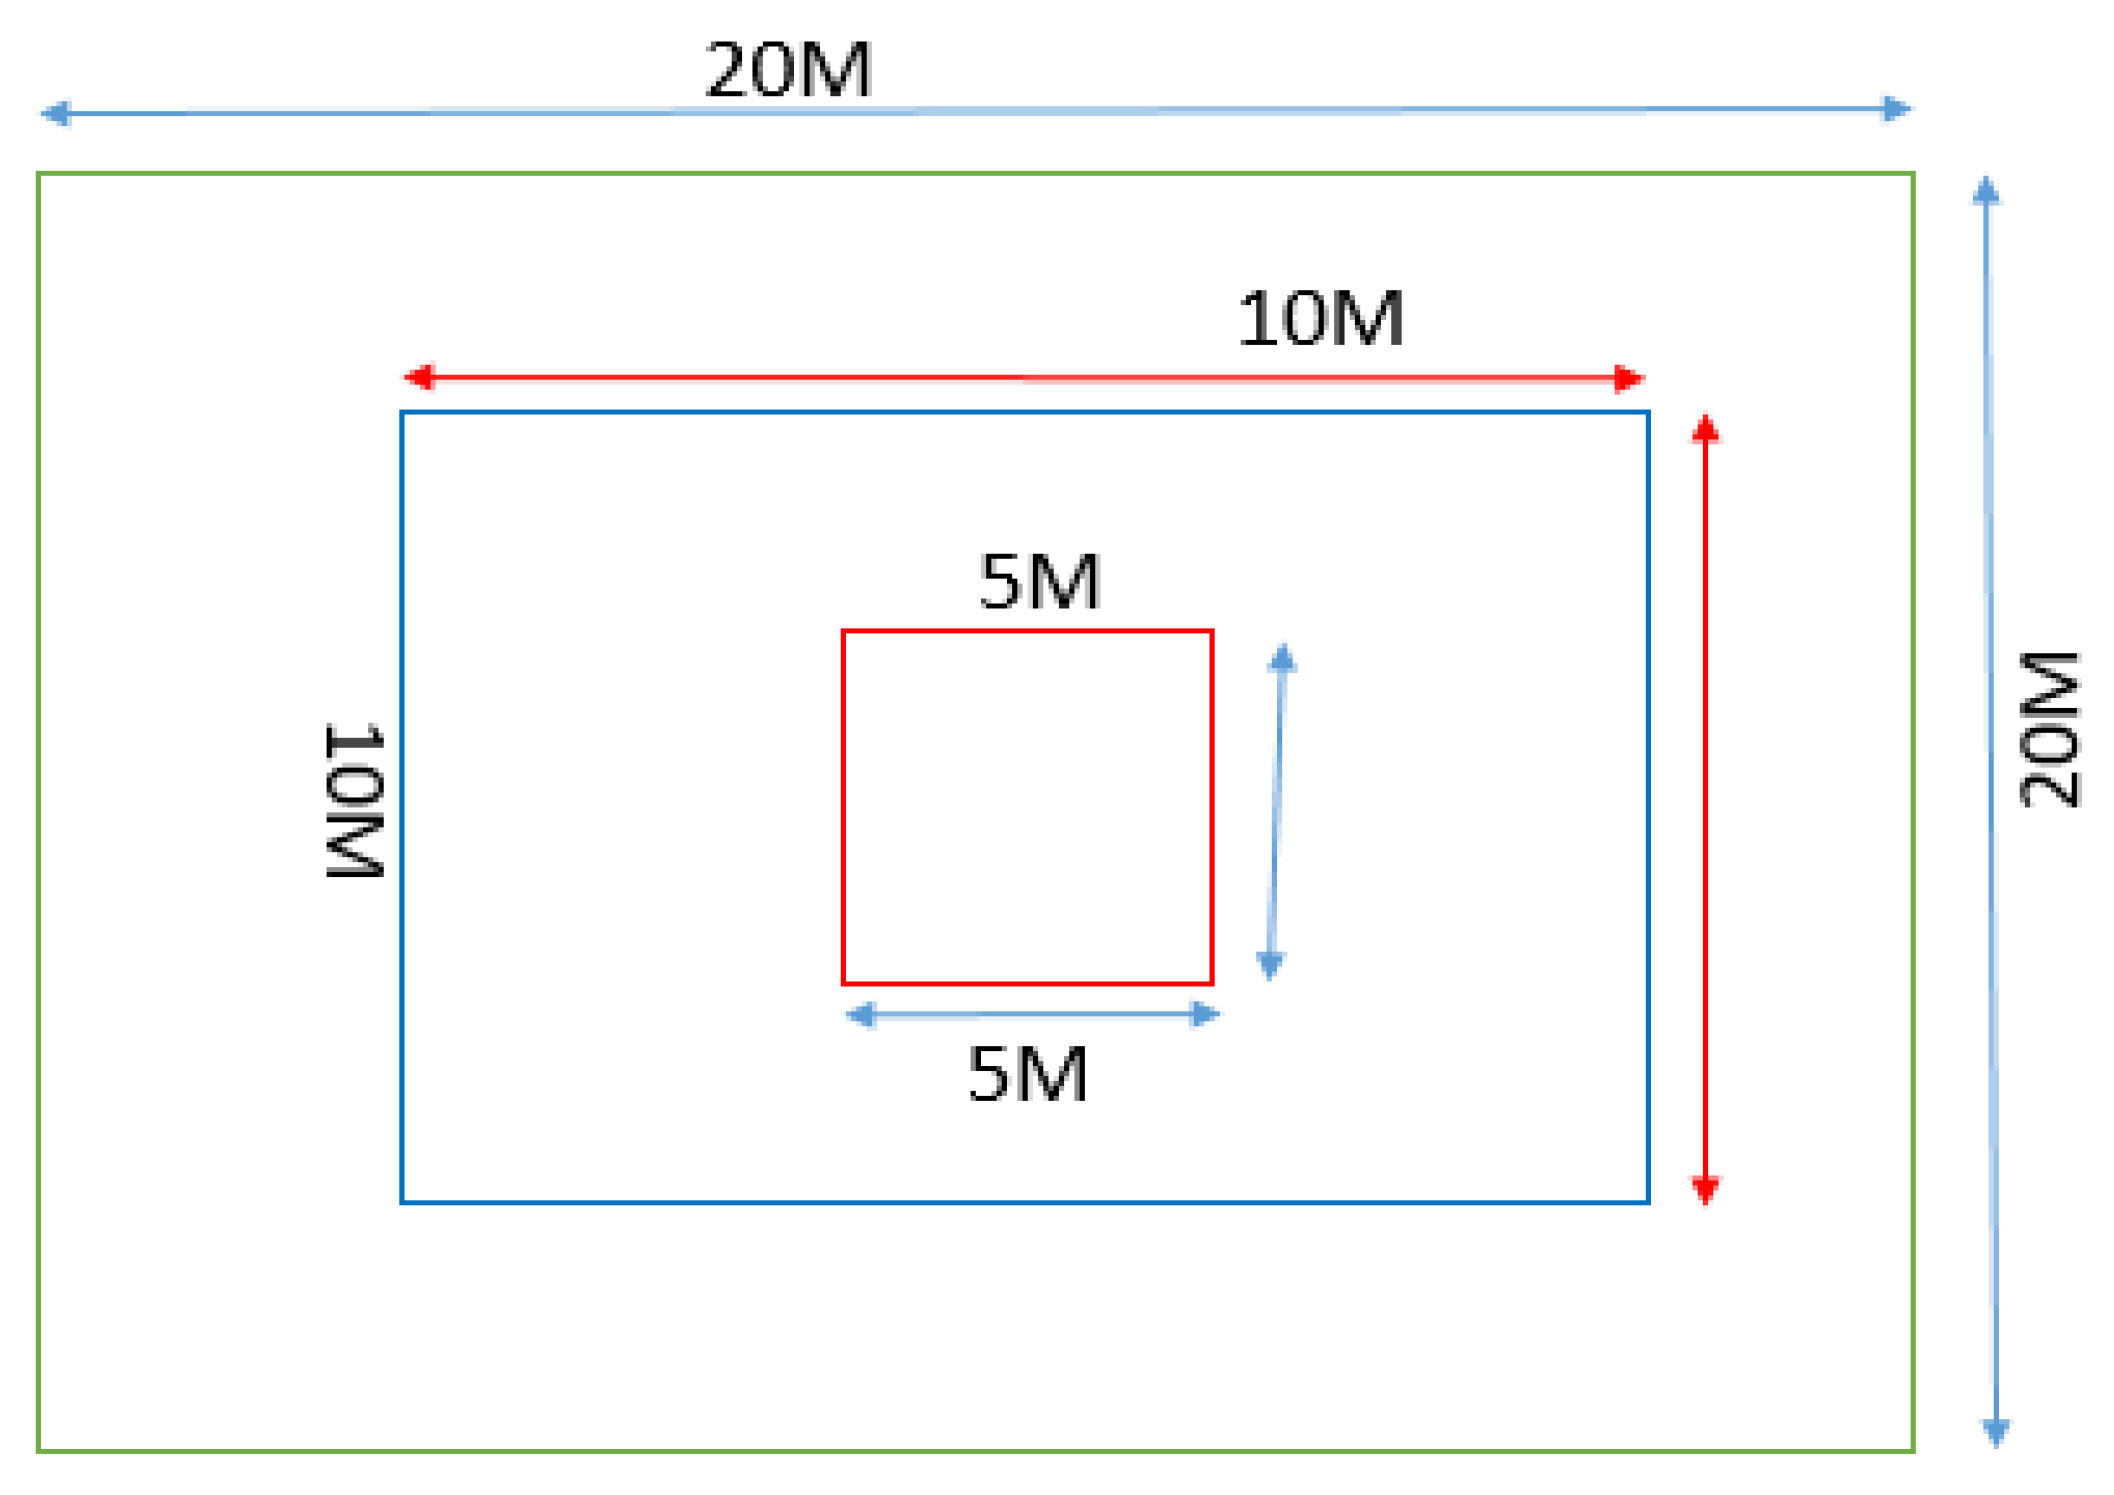
A systematic transect sampling technique was used. Along the transect lines, a total of 60 quadrats (36 and 24, respectively, for AE and CGL) measuring 20 m × 20 m for trees and 10 m ×10 m sub-quadrats for shrubs was used (Figure 2). Since the CGL was devoid of vegetation and spatially less heterogeneous compared to the AE, fewer quadrats were taken. The seedling and sapling were counted from five sub-quadrats (5 m × 5 m) established at the four corners and one in the center within the main quadrat (Figure 2). All trees in each plot were measured in diameter at breast height (DBH) or at the diameter at stump height (DSH). Individuals with ≥30 cm DBH were considered as an adult, saplings with 10 to 30 cm DBH and seedlings with < 10 cm DBH (Sarkar and Devi 2014). For identification of species in the field, vernacular names from key informants of the area were used. Identification was further made using Ethiopia and Eritrea Books of Flora (Edwards et al. 2000).

2.3. Preference Ranking

Preference ranking was used to select the best honey bee forage types in the study area. Preference ranking was performed using ten selected key informants for most important bee forage plants first on the basis of the number of flowers per plant and secondly on the bases of the degree of attractiveness to honey bees. Accordingly, ten bee forage plants were chosen to be ranked preferentially by the selected key informants on the bases of flower number per branch as well as per plant giving the highest value (i.e. 10) for best plant for bee forage, second highest value (i.e. 9) for the second best plants and the least value (i.e. 1) for plants with relatively low use for bee forage as compared to other plants (Martin 1995).

2.4. Data Analysis

The abundance of honey bee plant species was calculated as the total number of all individual species in all quadrates in each study land use. Density, relative density, frequency and relative frequency were also calculated following Misra (1974) formula. Similarly, the diversity values for the plant species were determined using diversity indices, species richness and evenness (Krebs 1999; Magurran 1996). The population structure of the species was assessed using histogram constructed by using the density of species (Y-axis) categorized into five diameters classes (X-axis). Regeneration statues of the species were analyzed by comparing saplings and seedlings with that of mature trees (Dhaulkhandi et al. 2008). Significant differences in species richness, evenness and diversity between the land uses systems were compared using the t-test was used to determine if there were. Significant difference was considered at p< 0.05. For qualitative analysis, descriptive statistic was used. R-software version 4.1.0 was used for the data analysis (The R Core Team 2021).

3. Results and discussion

3.1. Major honey bee plants

In this study, ten plants, Becium grandiflorum, Cordia africana, Eucalyptus camaldulensis, Euclea schimperi, Ziziphus spina Christi, Carissa edulis, Olea africana, Schinus mole, Lucas Abyssinia and Acacia abyssinica were selected as major honey bee plants and got higher priority over other bee flora in the study area. B. grandiflorum to be the most preferable bee flora species followed by L. abyssinica, C. africana and Ziziphus spina christi in the study area (Table 1). Therefore, the honey produced in the study area can be attached to these most frequently visited forage plants. Similar forage plants have been reported from Kola Tembien district, major honey bee flora plants found were C. africana, E. camaldulenesis and S. mole (Tewelde 2007). Haftom et al (2013) and Atsbaha et al (2015) also reported as B. grandiflorum and C. africana are among the major honeybee plants in Tigrai region. Similarly, in Eastern zone of Tigrai region, C. africana was also placed on the major honeybee plants (Yetimwork et al. 2015). Correspondingly, B. grandiflorum, E. camaldulenesis, L. abyssinica, C. africana, E. schimperi and Olea africana are the major honey bee flora in the Eastern zone of Tigrai region (Haftom et al.2013). Ziziphus spina-christi, Acacia albida, Acacia etbaica, Acacia tortilis and E. camaldulensis serve as honeybee forage in the Southern Tigrai (Tesfay, 2018). Also, species like, A. etbaica, A. asak, A. seyal, A. tortilis, Balanites aegyptiaca, Carissa spinarum, Dodonaoea angustifolia, Maytenus undata, Pterollobium stellatum and Ziziphus spina-christi were identified as major honey bee flora in the South Tigrai, north Ethiopia (Tesfay et al. 2020). Species like, B. grandiflorum, C. africana, E. camaldulenesis, L. abyssinica, O. africana and Z. spina christi were consider as a major honey bee plants in different areas of Tigray region. This might be attributed to the adaptation potential of the species to wider agro-ecologies. Such species might be good nectar and pollen source and grow abundantly with a relatively long and different blooming seasons.

3.2. Species composition

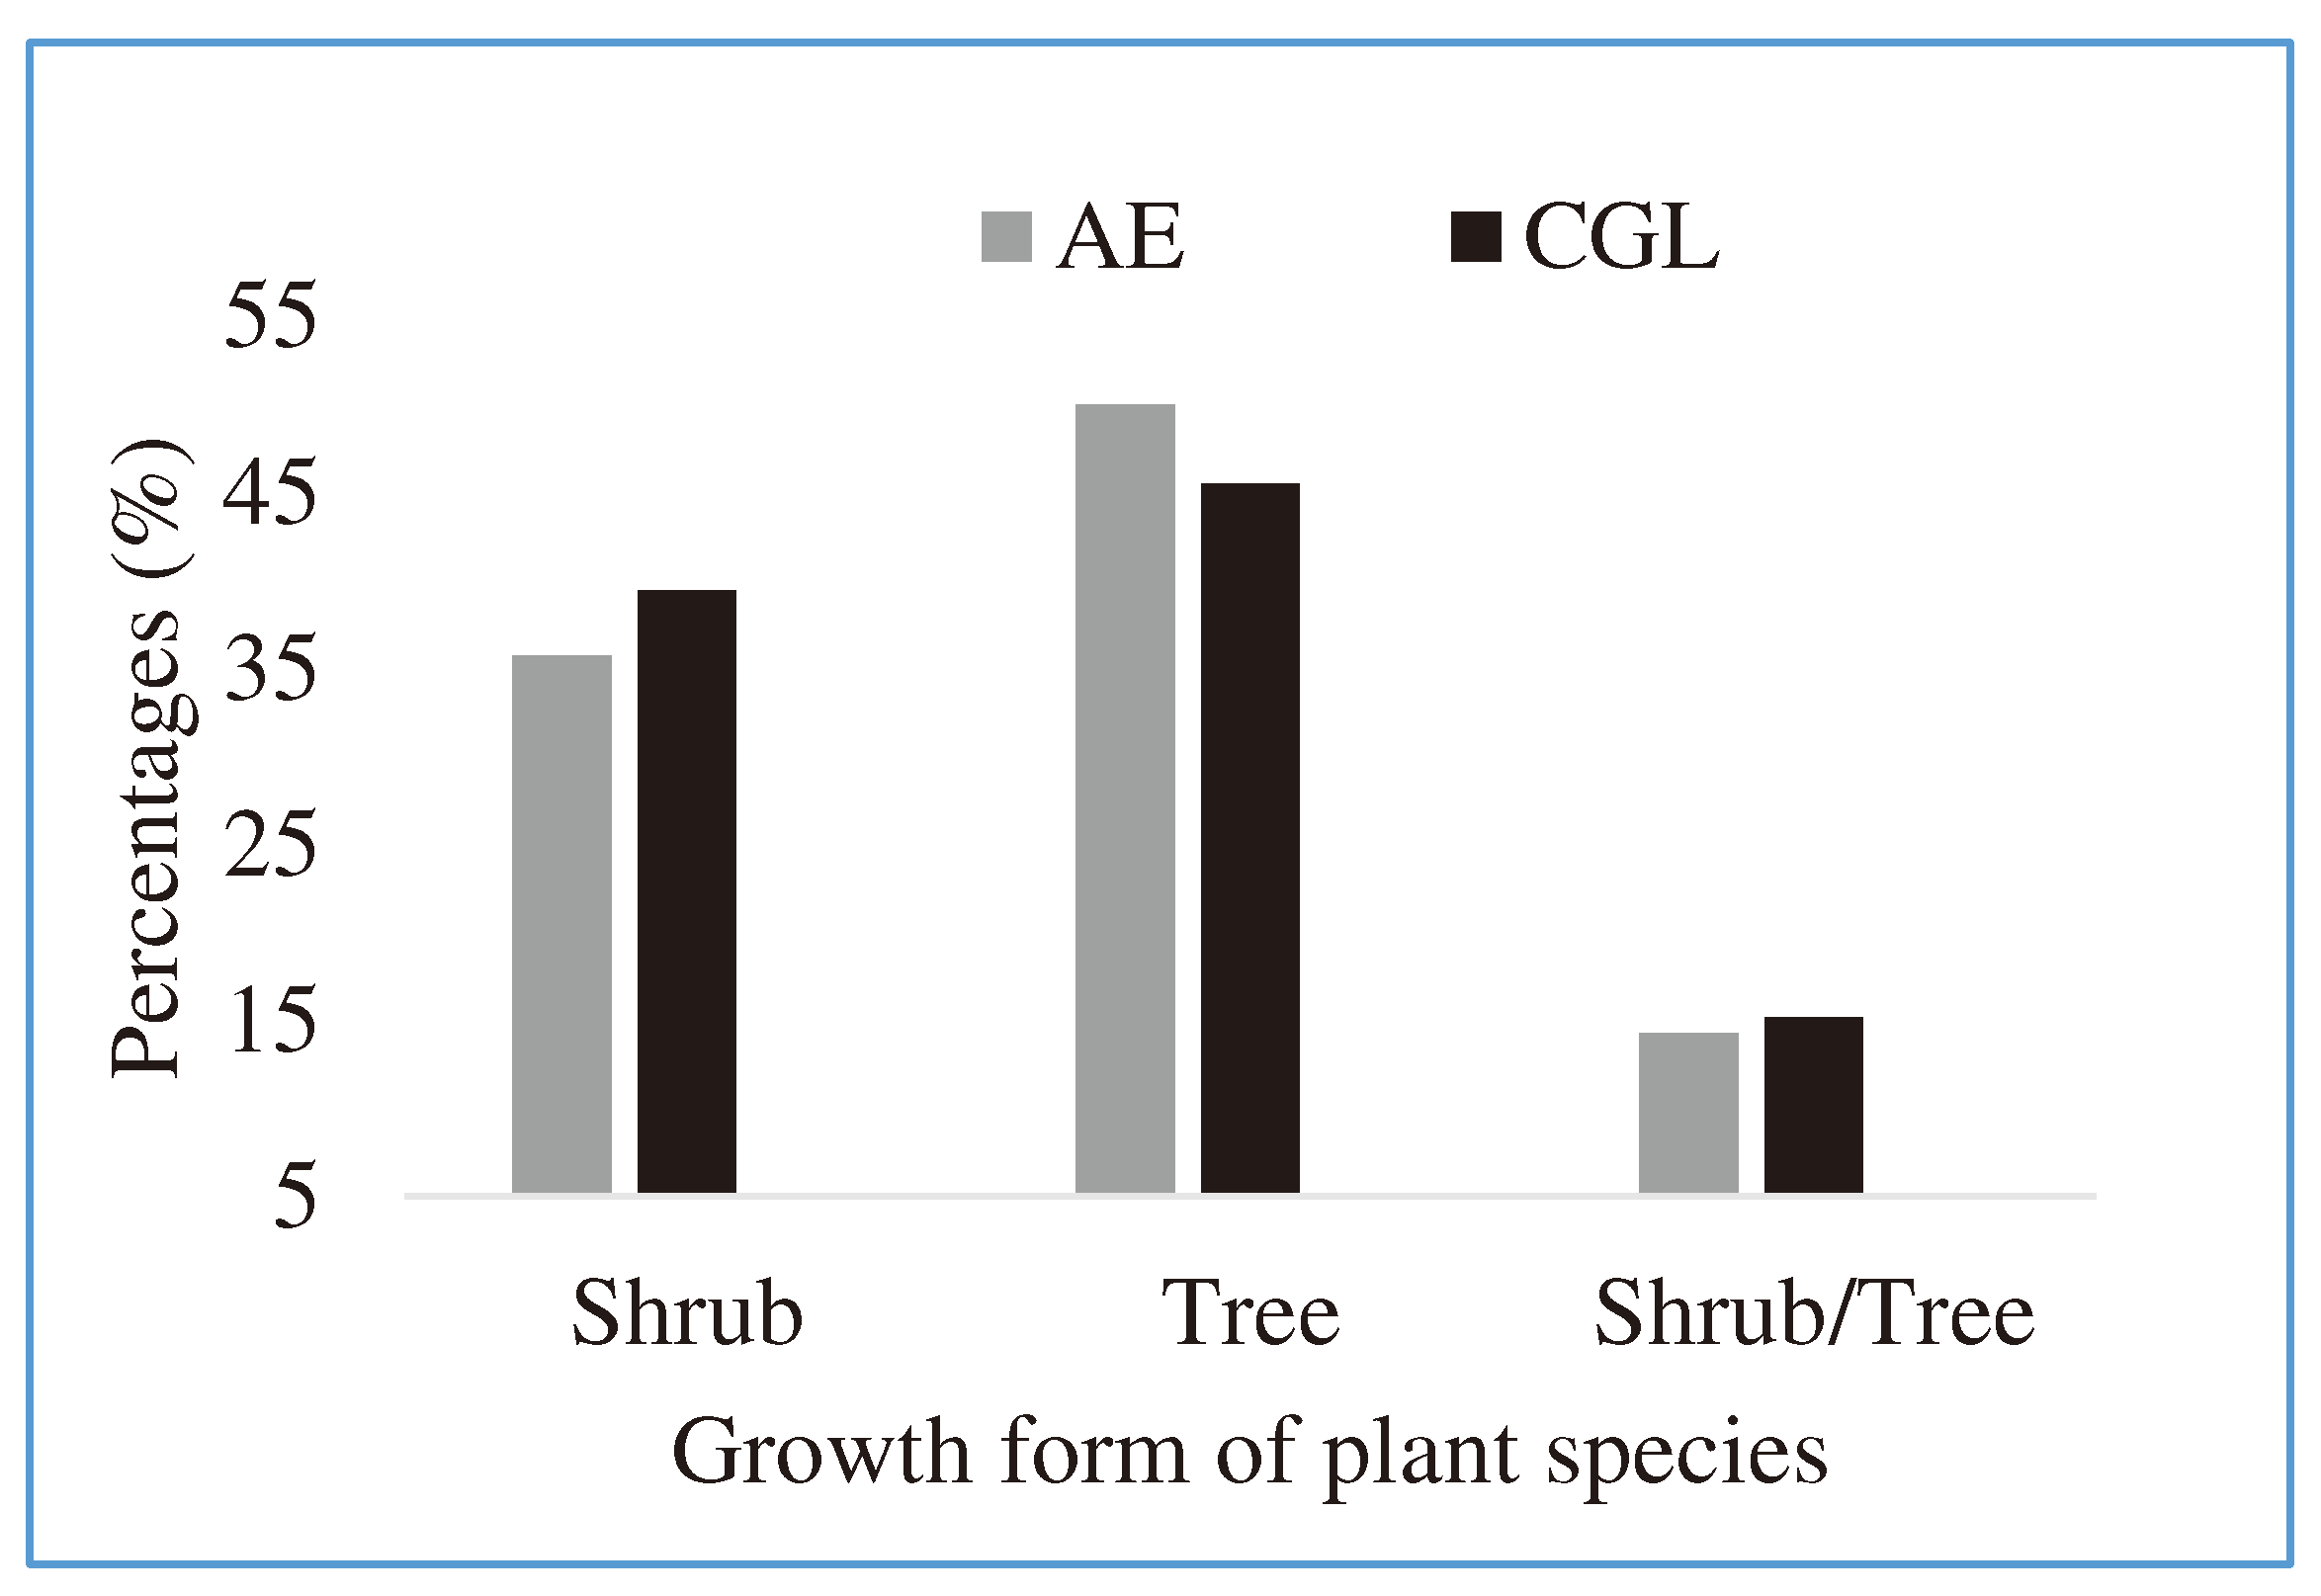
The study recorded a total of 62 and 51 different woods and shrub species in the AE and the CGL, respectively. In the AEs, 42 honey bee floras belonging to 23 families were identified (Table 2). Life form species were classified into 50 % trees, 35.7% shrubs and 14.3 % tree/shrubs (Figure 3). Contrarily, 33 plant species belonging to 17 families were identified as honey bee plants in the CGL, comprising, 45.5% trees, 39.4 shrubs and 15.2 % tree/shrubs (Figure 3). These are in line with Yirga and Teferi (2010) and Mewcha and Yamane (2016) who found enormous honeybee flora plants with shrub plant forms. The floristic compositions of the AEs were 12% higher than the CGL sites, which may be associated with the interference and modification of humans and animals inside the CGL, leading to decline species composition. These are in agreements with Haftom and Yaynishet (2012) that showed that humans were the major pushing factors in bee flora composition and structure changes.

3.3. Density and abundance

The results of the study indicated that the total number of honey bee flora was higher in the AEs than the CGLs (Table 2). In the AE Euclea racemosa, Carissa edulis, Eucalyptus camaldulensis and Acacia abyssinica have been the most frequently available bee flora. On the other hand, Euclea racemosa Carissa edulis and Grewia mollis have been the most frequently registered bee flora in the CGL. The abundance of honey bee flora in AE and CGL was 1316 and 442 respectively (Table 2). The results showed that the abundance of honey bee forages in the CGL is low. This was due to the uprooting of the plants for different uses such as medicinal, fuel wood, farming tools and house constructions. In addition, livestock pressures could also be a possible thereat for the species population decline (Haftom and Yaynishet 2012). In the AEs the most abundant of honey bee flora were Acacia abyssinica, Carissa edulis, Euclea racemose, Eucalyptus camaldulensis and Dodonoae angustifoha. The three most abundant species in the CGL were Carissa edulis (28), Acacia abyssinica (32), and Euclea racemose (39) (Table 2). Similarly, Ptrollobium stellatum (208.33 individuals per hectare) and Gomphocarpus fruticosus (237.5 individuals per hectare) were the highest density species in the AE and CGL, respectively (Table 2).

3.4. Population structure

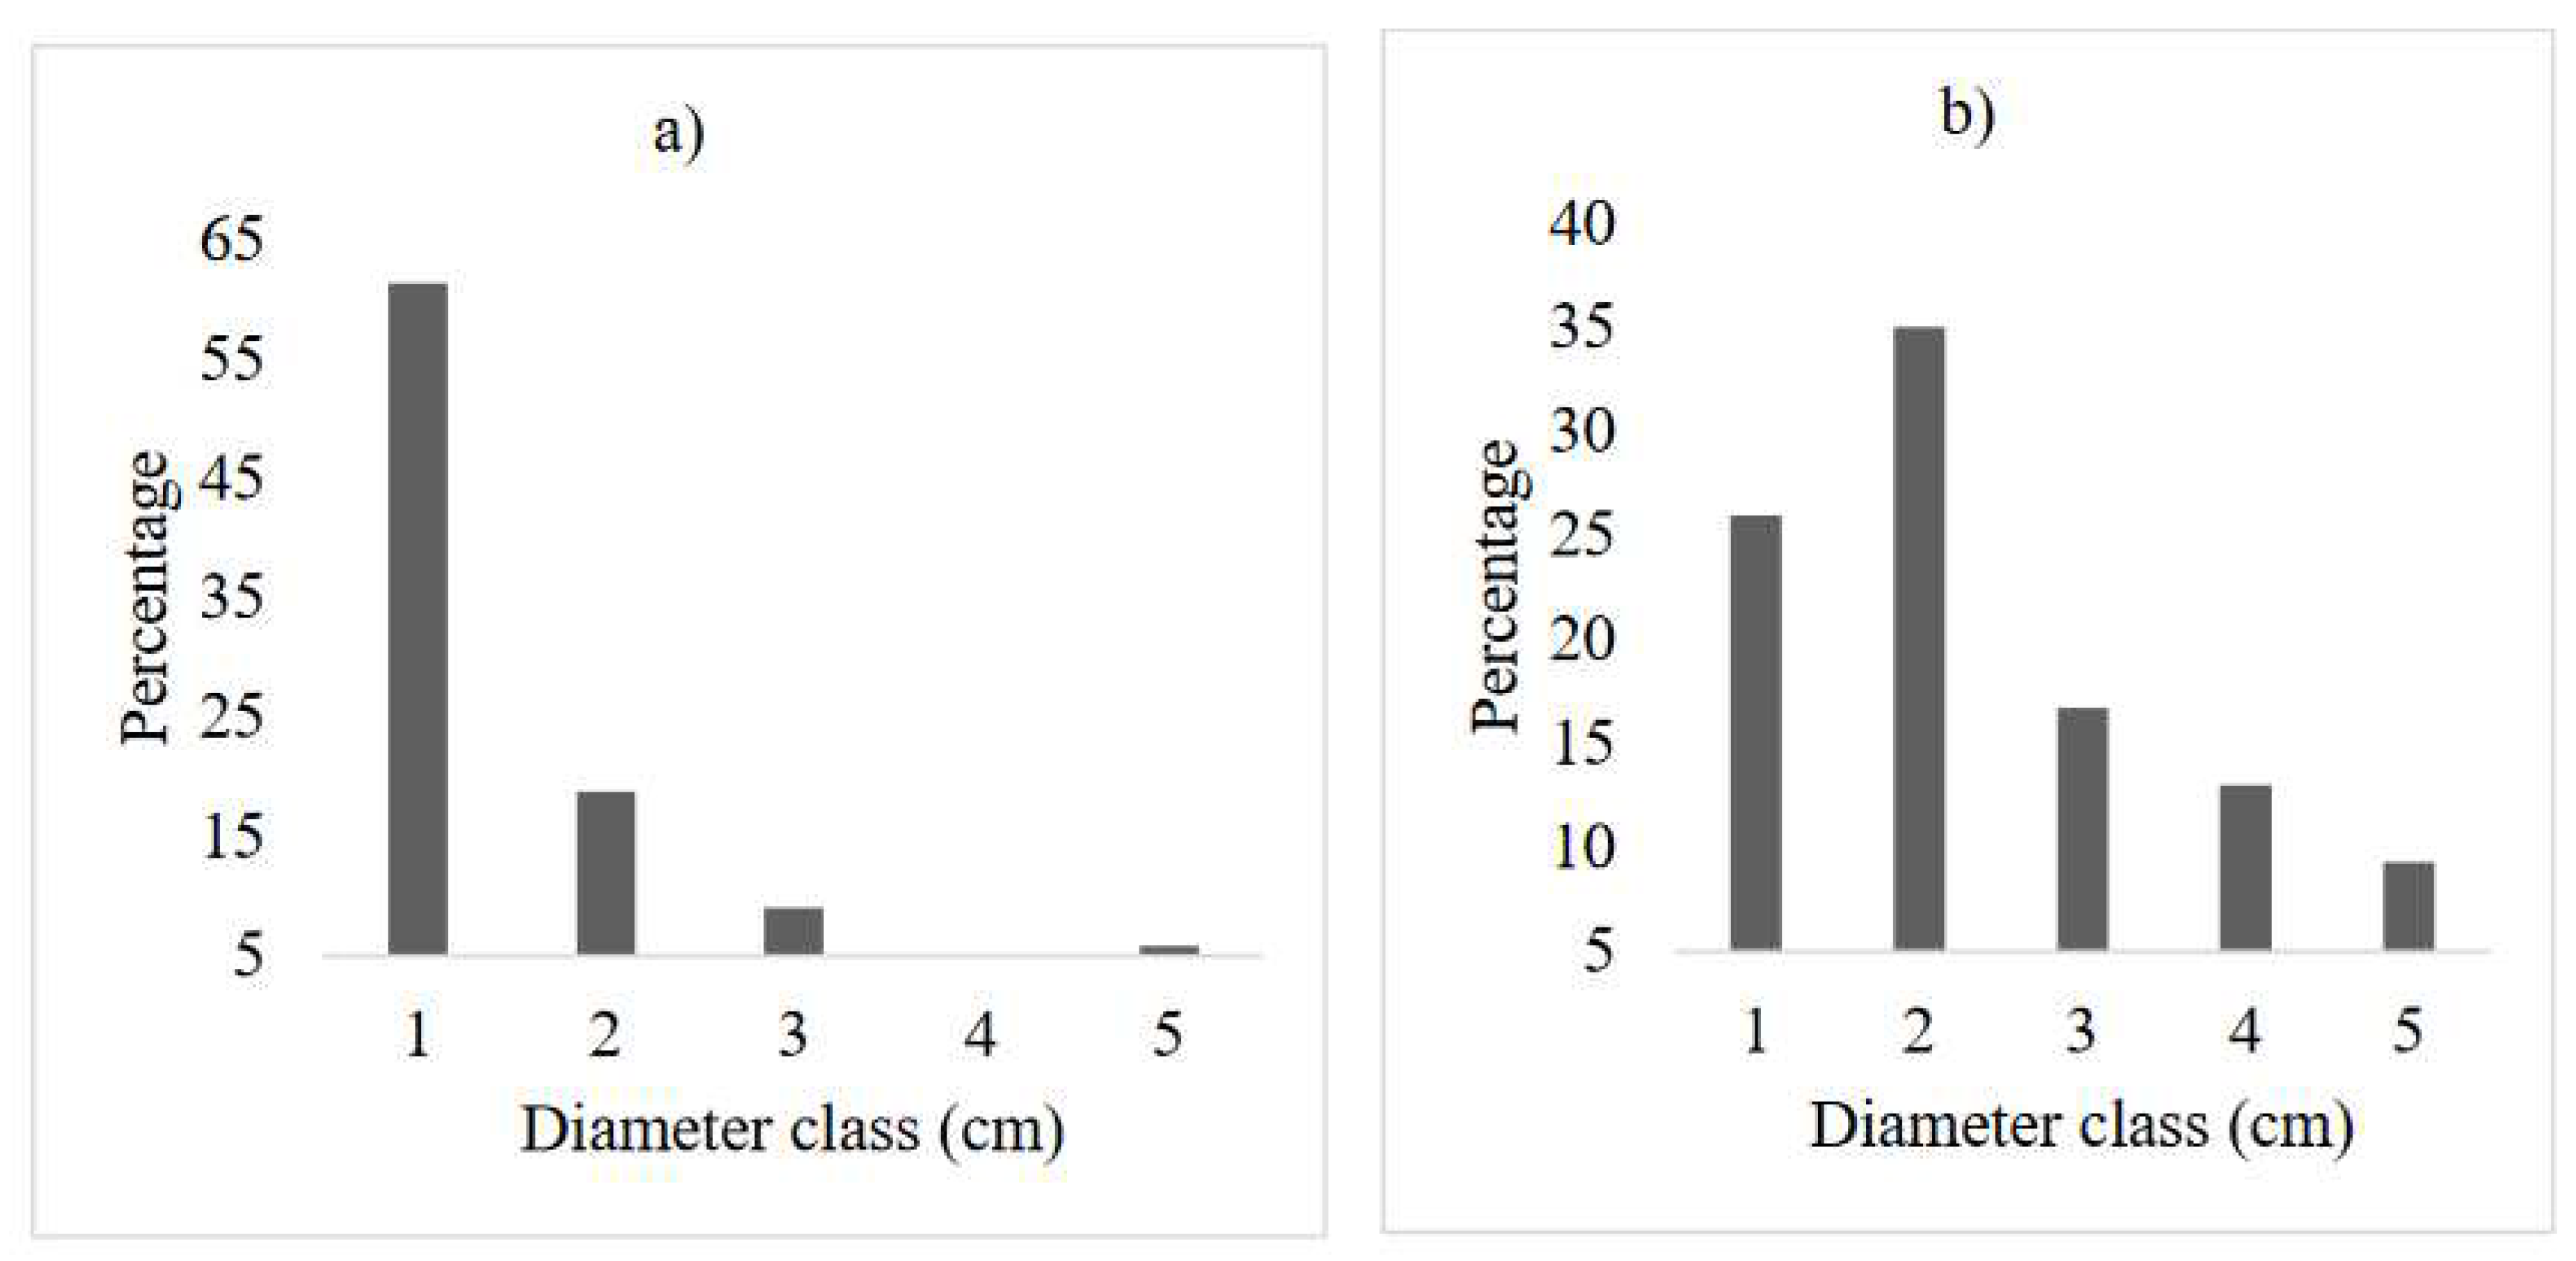
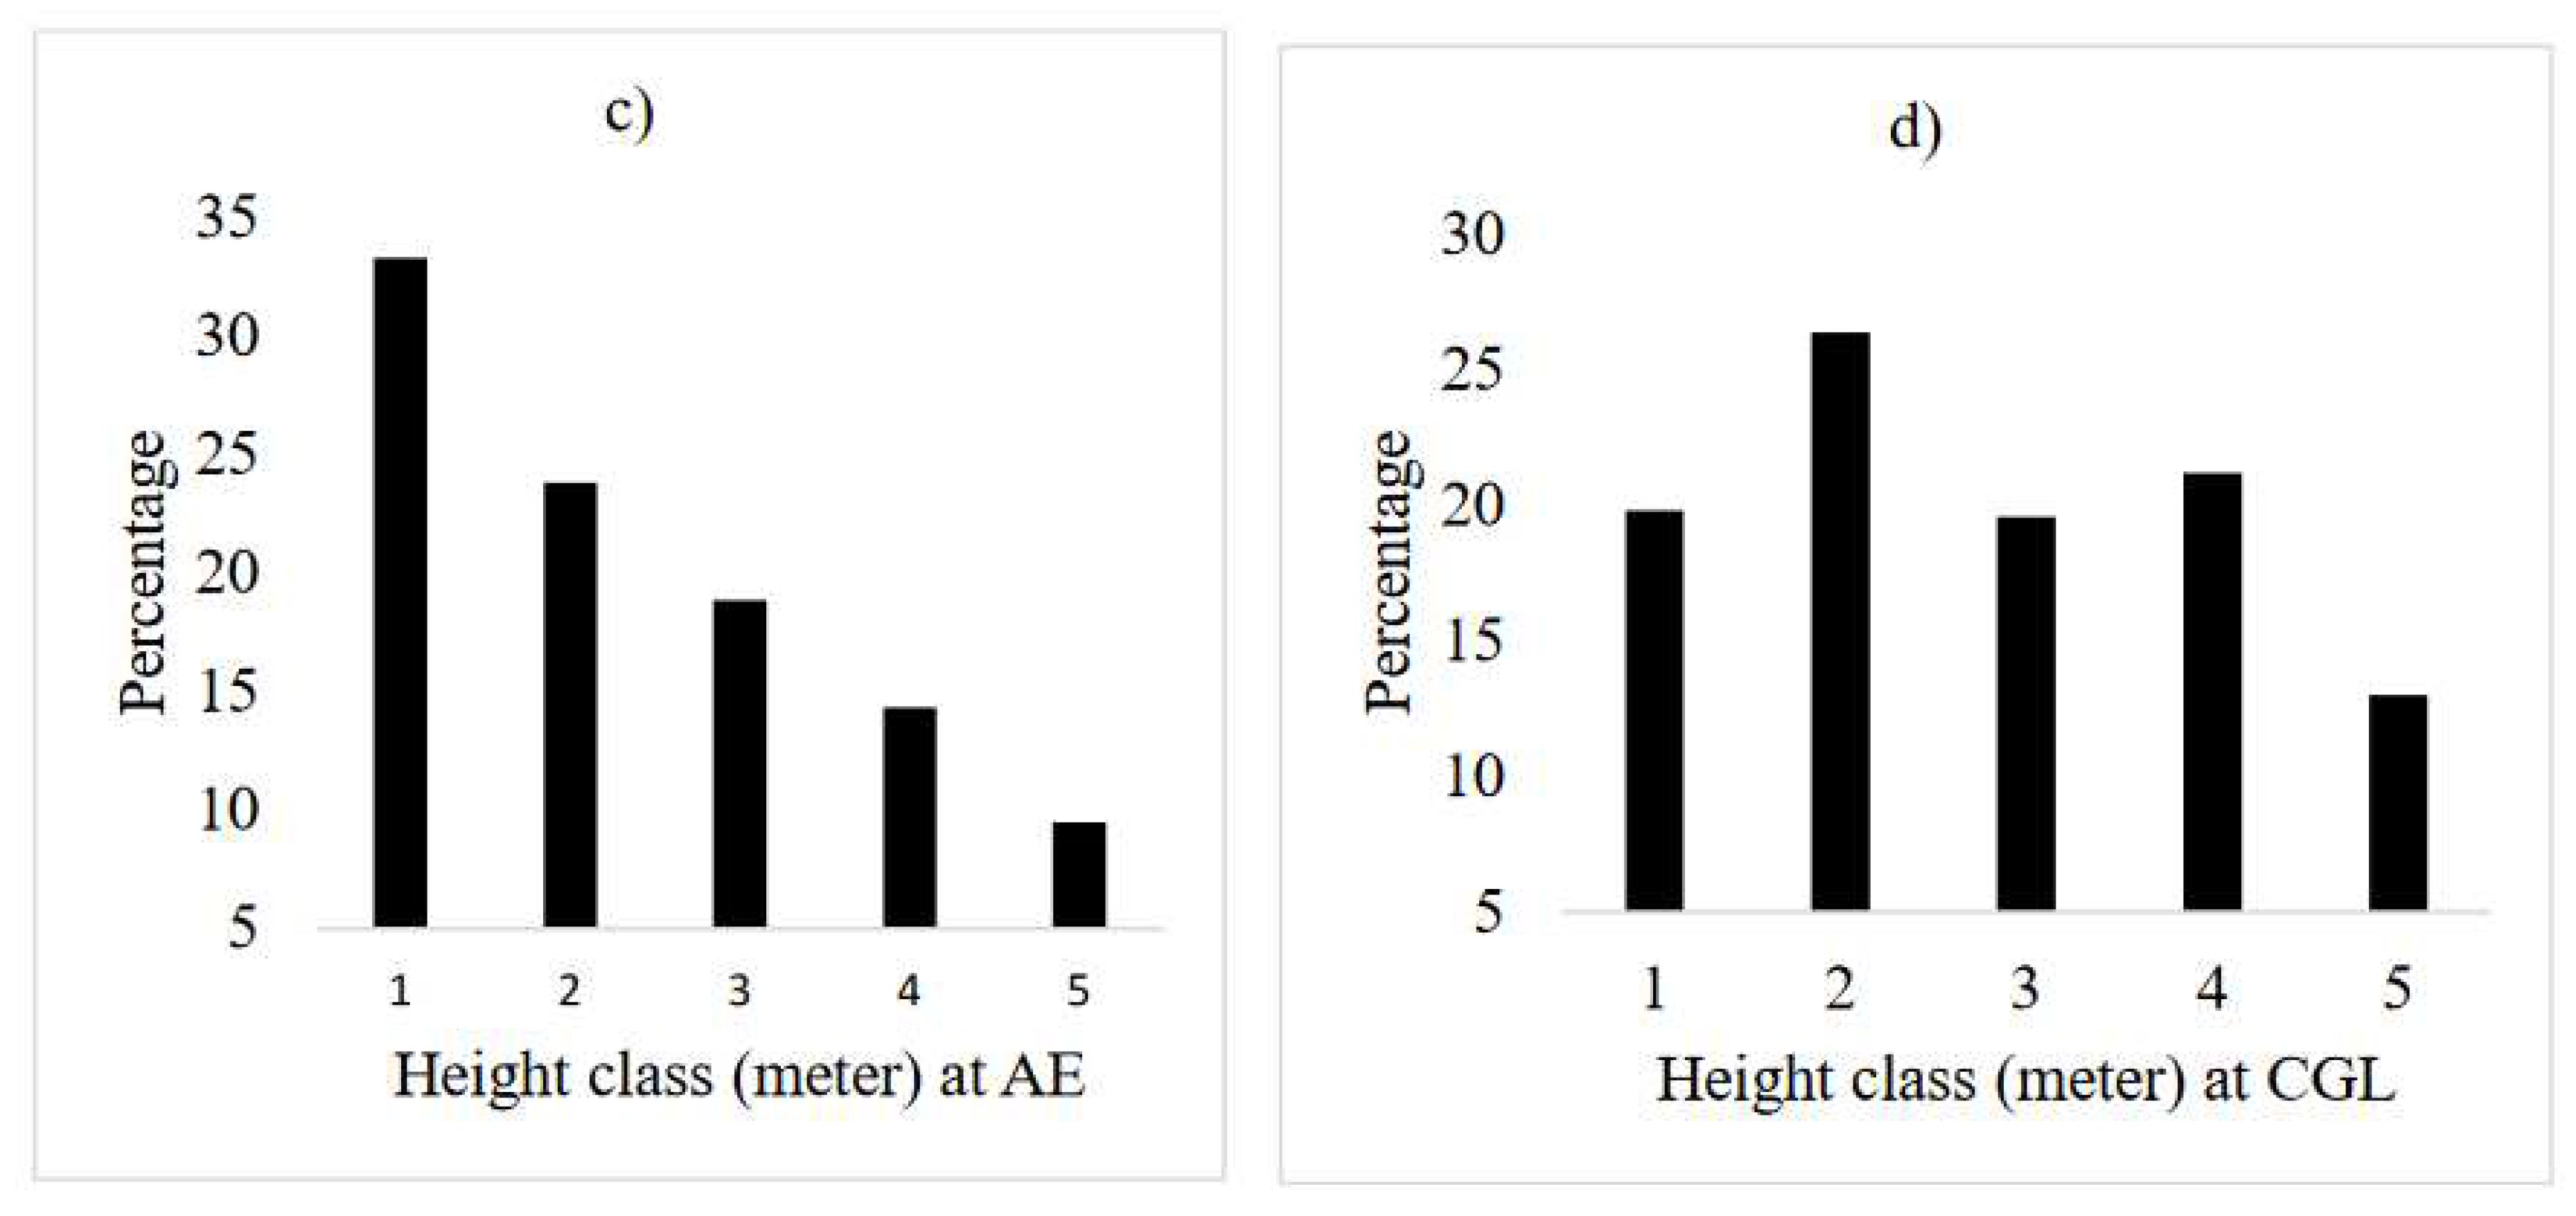
The diameter class distribution of honey bee flora in the AE reflected reversed J-shape (L-shape). The study revealed that the number of honey bee flora decreases at higher diameter classes. In this respect, 80% of the total frequency lies between the first and second diameter classes, whereas, about 9% of the frequency was found to be in the middle diameter classes (10.1-15 cm) (Figure 4a). The higher number of honey bee plants at lower diameter classes shows the potential of AE to restore degraded lands. However, the diameter distribution for the CGL shows a bell-shape, which showed there was a higher number of individuals in the middle diameter classes, but decrease towards the lower and higher diameter classes (Figure 3b). According to Feyera et al. (2007), the bell-shape pattern indicates a poor reproduction and recruitment of species. The possible reason for decreasing of individuals within the larger diameter class (>20.1cm) might be due to illegal cutting. Unmanaged selective removal of big trees could also interrupt the continuous replacement of species (Mastewal et al. 2006). Humans modify the structure of bee flora (Haftom and Yaynishet 2012), but protection like AE establishment may assist in improving the structure honey bee flora species (Mewcha and Yemane 2016). Similarly, the proportion distribution of bee flora individuals in different height classes also showed a similar pattern with diameter classes at the AE (Figure 5c). While, the height class distribution for the CGL shows an irregular population distribution (Figure 5d). A reversed J-shape distribution of height/diameter classes in AE indicated a continuous and good regeneration of bee flora species. In contrast, bell-shape and an irregular population distribution of the species in the CGL indicated a hampered regeneration (Couralet et al. 2005) might be due to either selective removal by humans for domestic purposes or being vulnerable to extreme disturbances of lower diameter class tree species in CGL, seedling development to higher diameter classes was hindered (Emiru et al. 2007, Tesfay et al. 2019).
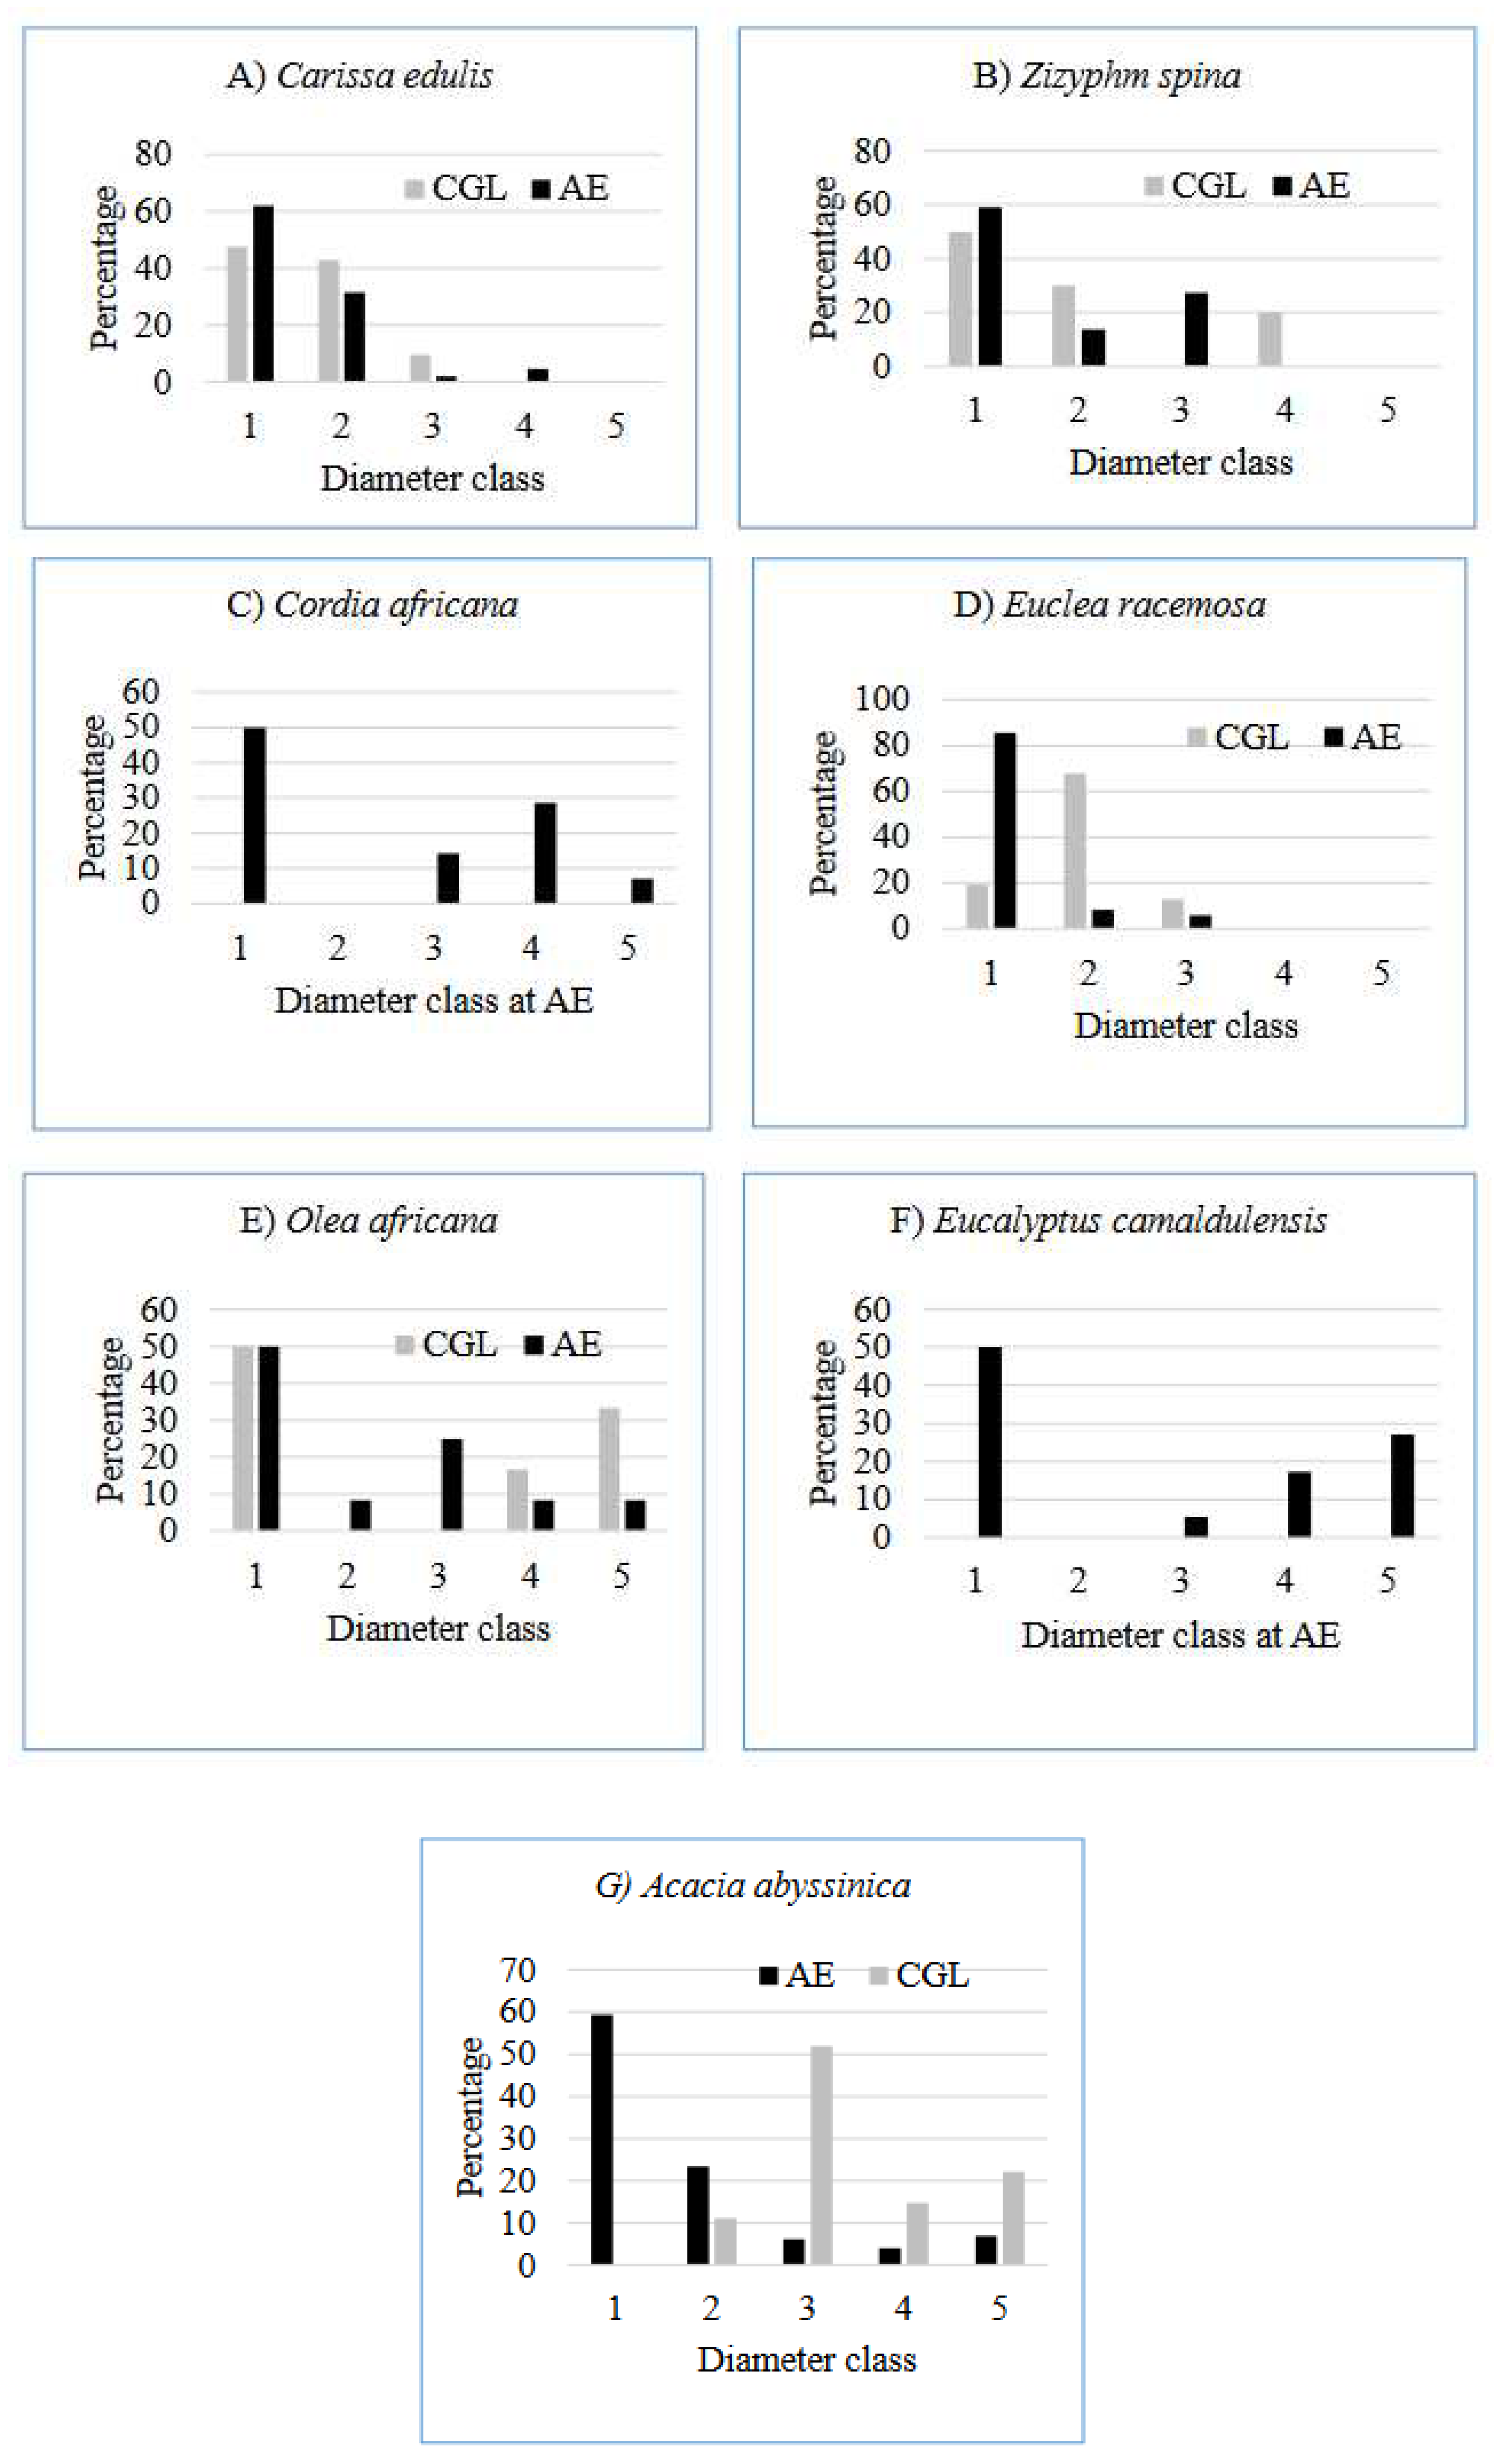
Analysis of the population structure (diameter class) of the top ten most selected shown four representative patterns implying different population dynamics among species. The first pattern was represented by Euclea racemosa at CGL (Figure 6D). It shows lower numbers of individuals in the first diameter class followed by higher number of individuals in the second and third diameter class and absence of individuals in the middle and higher diameter classes. This type of population structure suggests poor reproduction and recruitment status. This could be attributed to poorly developed soil, and human disturbance (Zegeye et al. 2011). In addition, free grazing and browsing of domestic animals, which is very common in the CGL, could have a negative effect on seedling establishment and survival in these species in the CGL. The second pattern was represented by Euclea racemosa at AE (Figure 6D). It indicates a higher number of individuals in first diameter class followed by the very low number of individuals in the second diameter class and absence of individuals in the other diameter classes. This type of population structure suggests better reproductive status (Hundera and Gadissa 2008, Lulekal et al. 2008).
The third pattern was represented by Carissa edulis at AE and CGL (Figure 6A) and Acacia abyssinica at AE (Figure 6G). It exhibits a higher number of individuals in the first diameter class and gradually declining numbers with increasing diameter classes. It represents an inverted J-shape distribution. This kind of population structure implies a good reproduction and recruitment status of the species (Zegeye et al. 2011, Gurmessa et al. 2012, Fisaha et al. 2013, Tadele et al. 2014, Ayalew et al. 2018). The fourth pattern was represented by Cordia africana (Figure 6C) and Olea africana (Figure 6E). It shows a higher number of individuals in the first diameter class and an irregular pattern in successive diameter classes. This type of population structure implies good reproduction but hampered recruitment and selective cutting of medium and large sized individuals for different purposes.
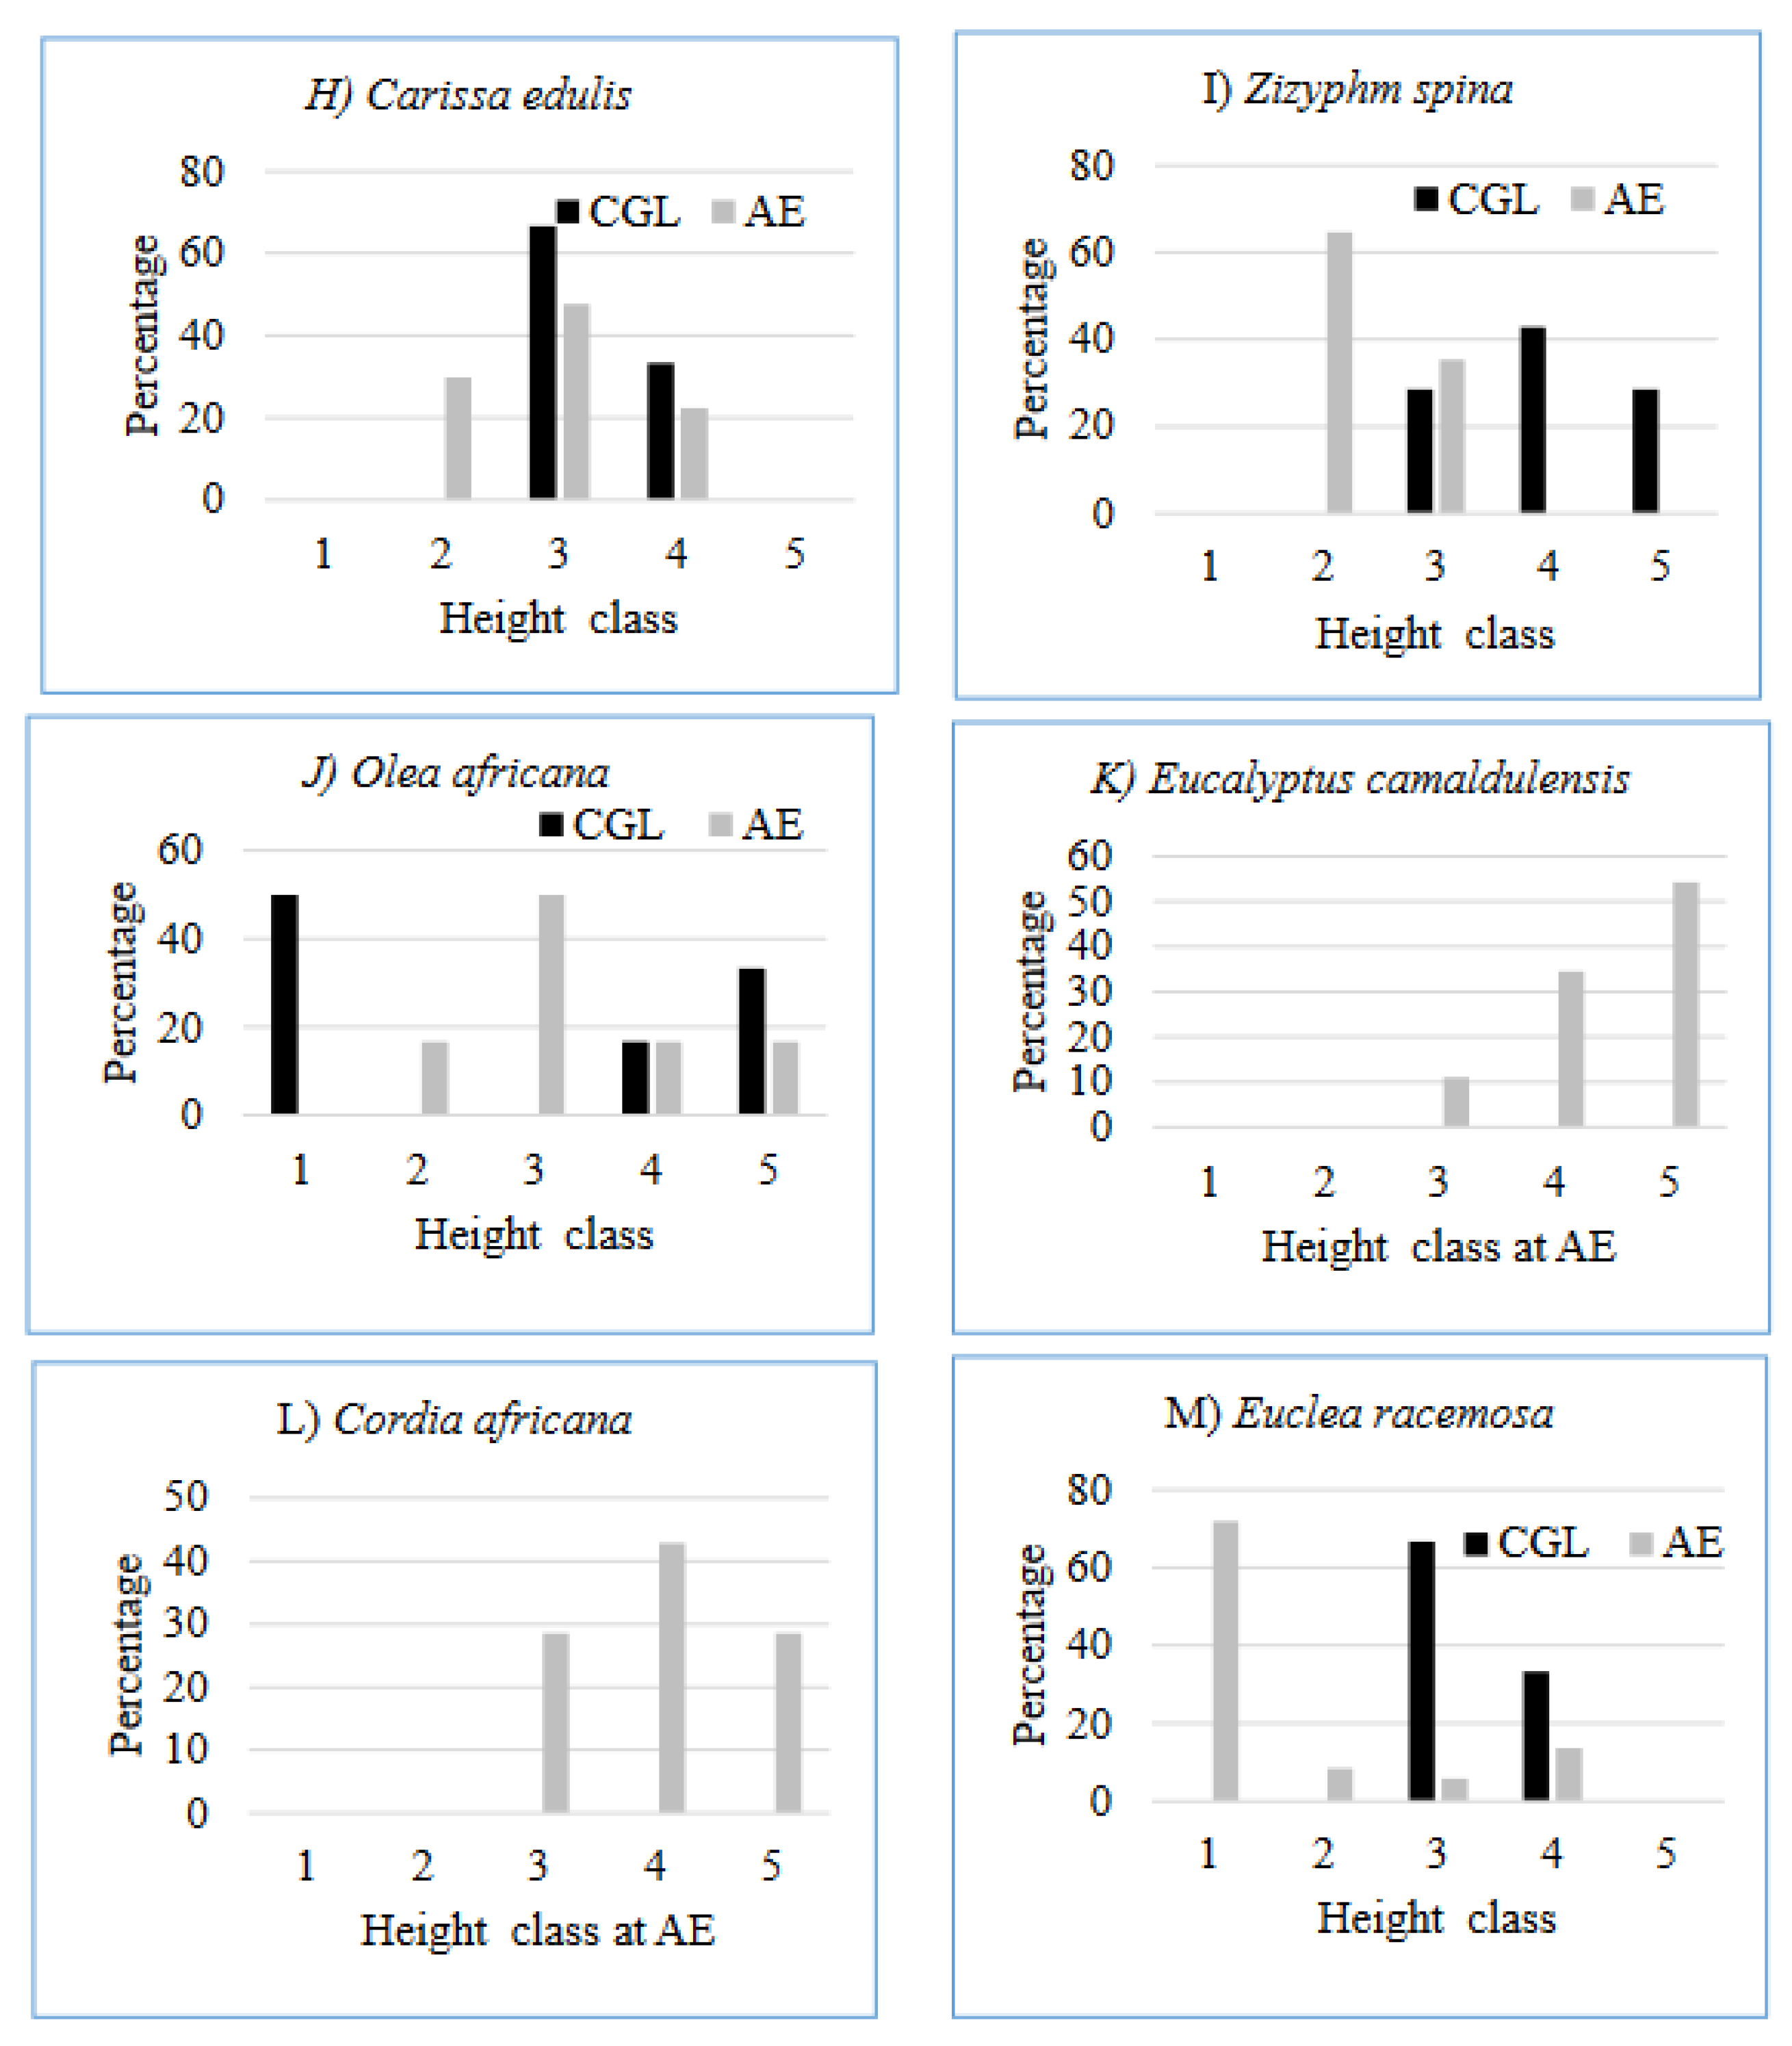
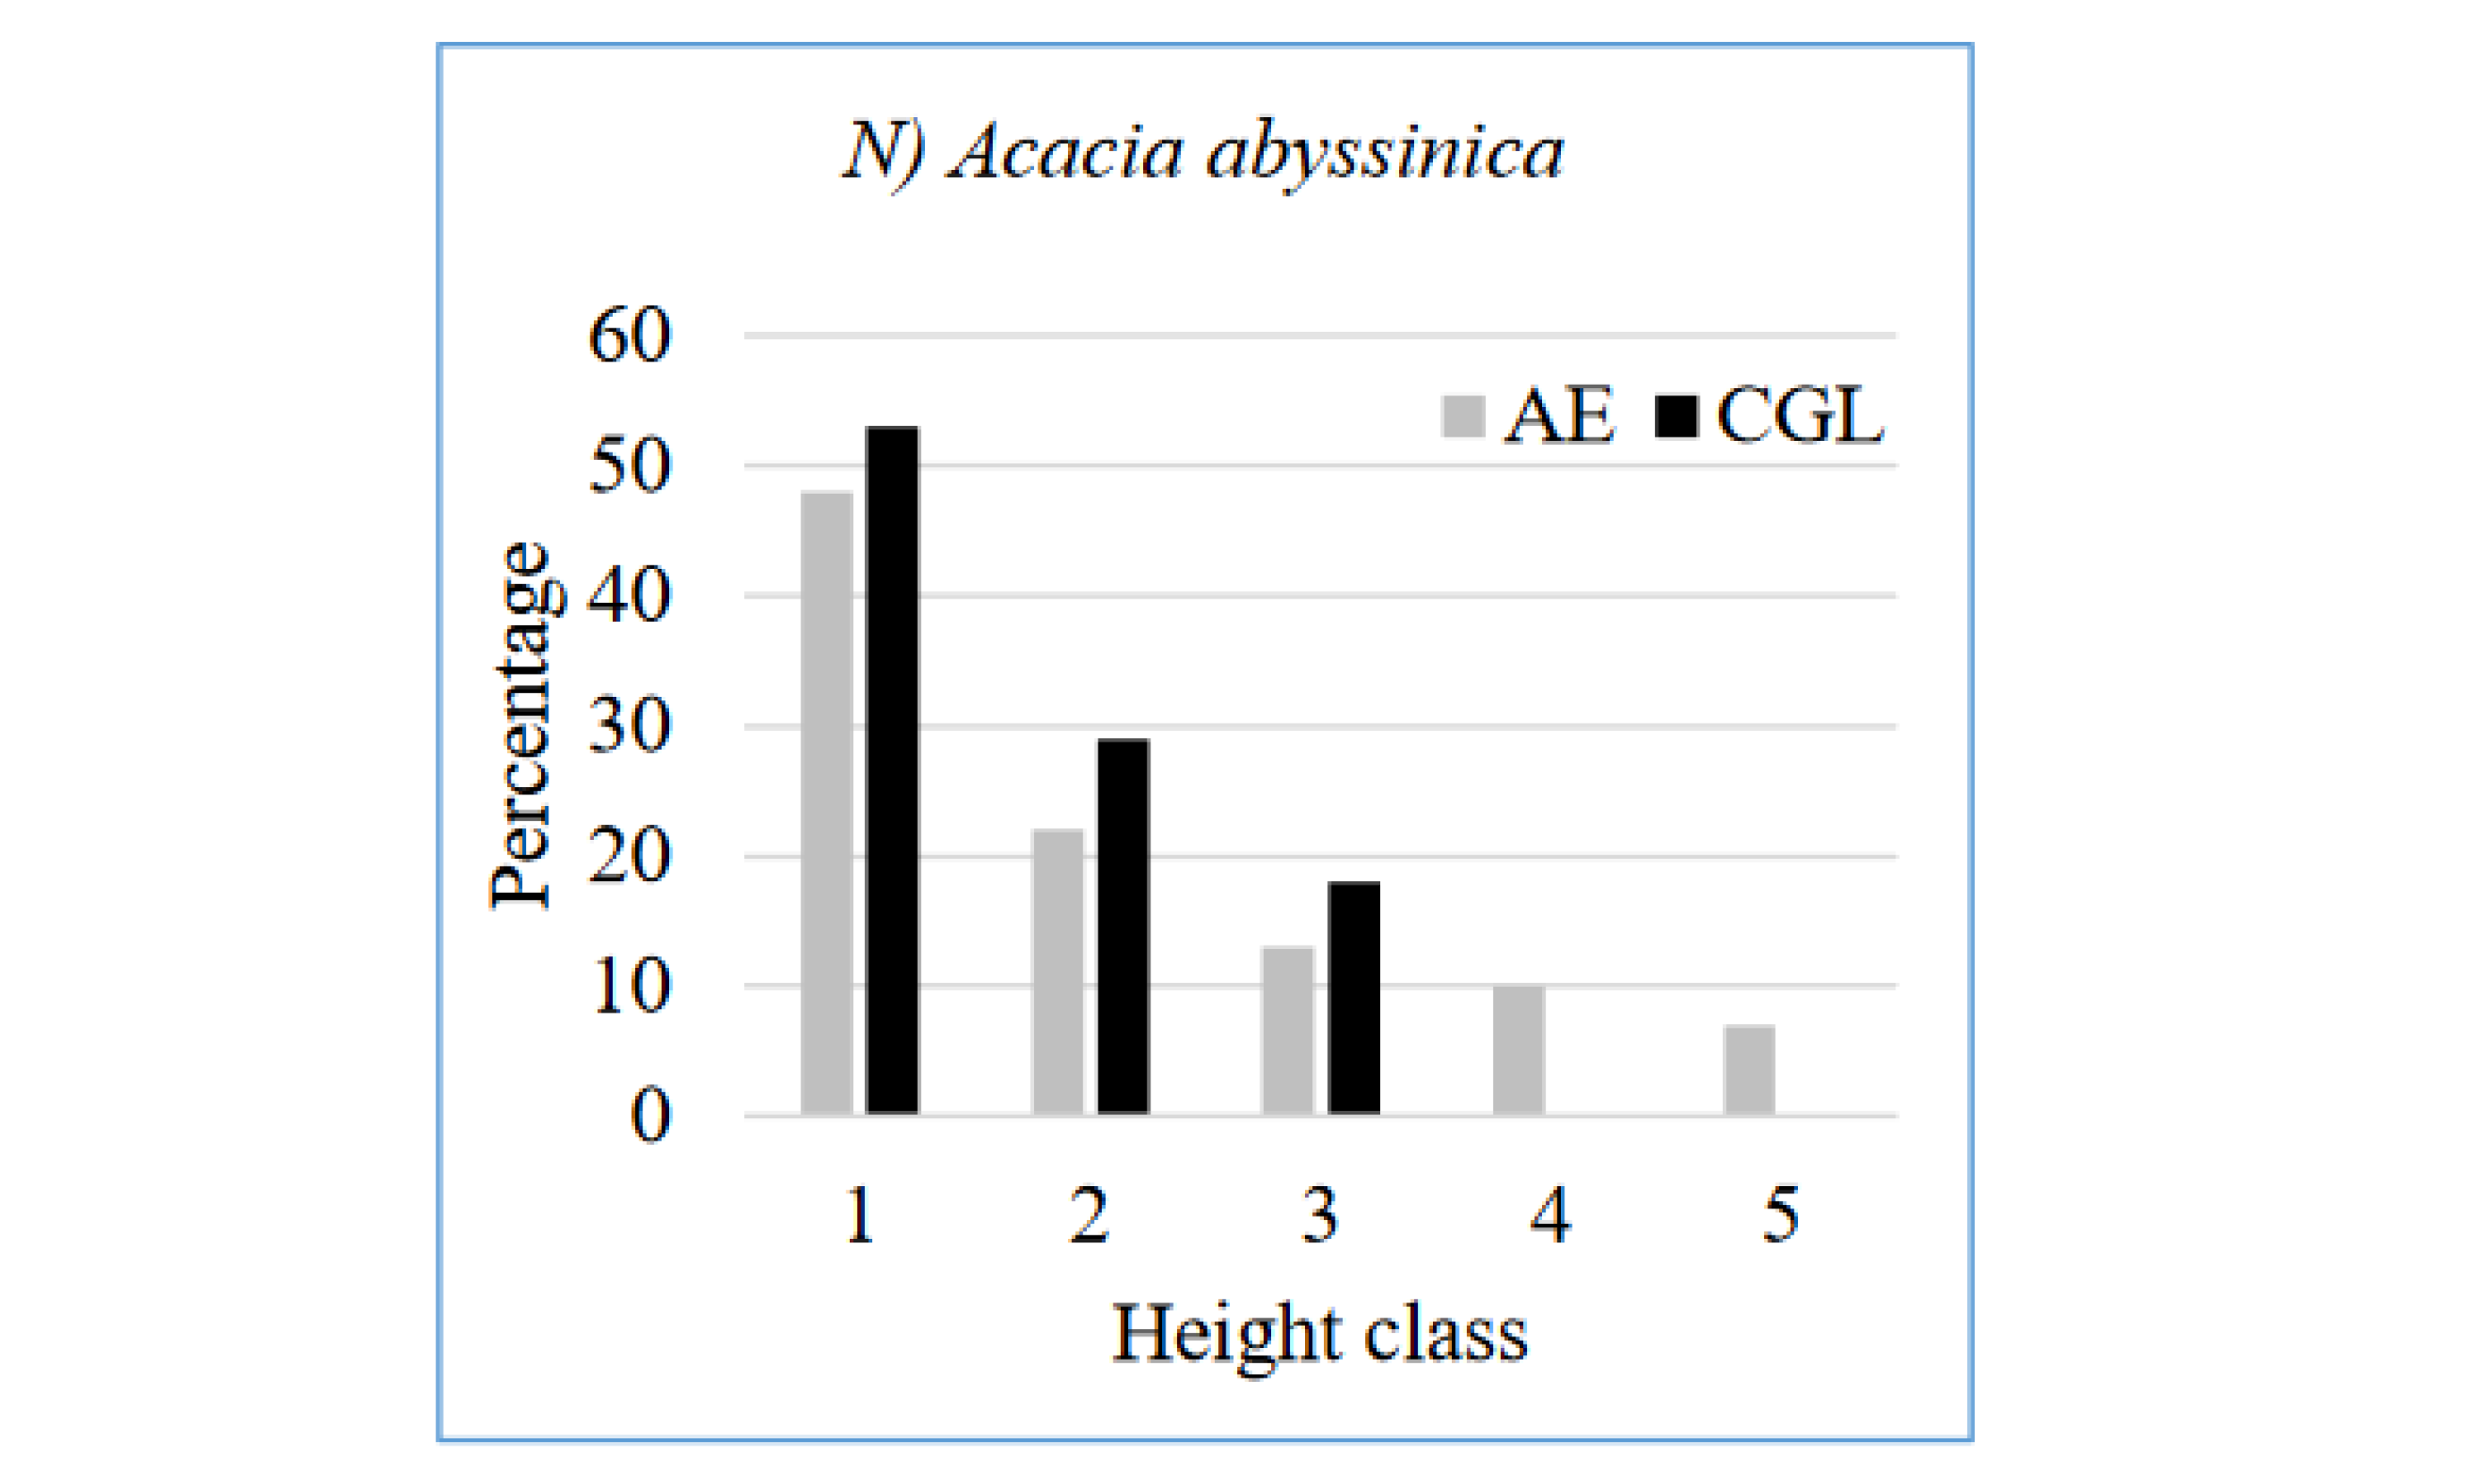
The different honey bee floras encountered in the study area have a different structure of height class. The height class distribution of Euclea racemosa (Figure 7M) and Acacia abyssinica (Figure 7N) at the AE reflected reversed J-shape, since, there are few numbers of individuals in the lower height class but the number gradually increases to the upper classes so that the higher height class has a large number of individuals. It indicates active and uniform regeneration (Emiru et al. 2007). Eucalyptus camaldulensis at the AE has broken J shape height class distribution (Figure 7K). These trends are indications of normal regeneration status progressing towards stable population structures, provided that the sites are protected from further human and animal interferences. On the other hand, in CGL site, some species, e.g. Eucalyptus camaldulensis and Cordia africana not presence/recorded in the height class, which may indicate the possibility of local disappearance in the event of death of the existing few individuals. This calls for interventions aimed at facilitating preservation of such species, e.g. through enrichment plantation of their seedlings (Tefera et al. 2005). Olea africana has a U shape pattern at CGL (Figure 7J), since, the number of individuals higher at first class then it starts to decrease up to being zero in the second and third class and then the number starts to increase from the fourth class onwards. Among different plant species, there are variations in height class distribution patterns. These different distribution patterns of species occurred due to the selective removal of individuals at a specific size (Ayalew et al. 2018).

3.5. Regeneration status of honey bee floras

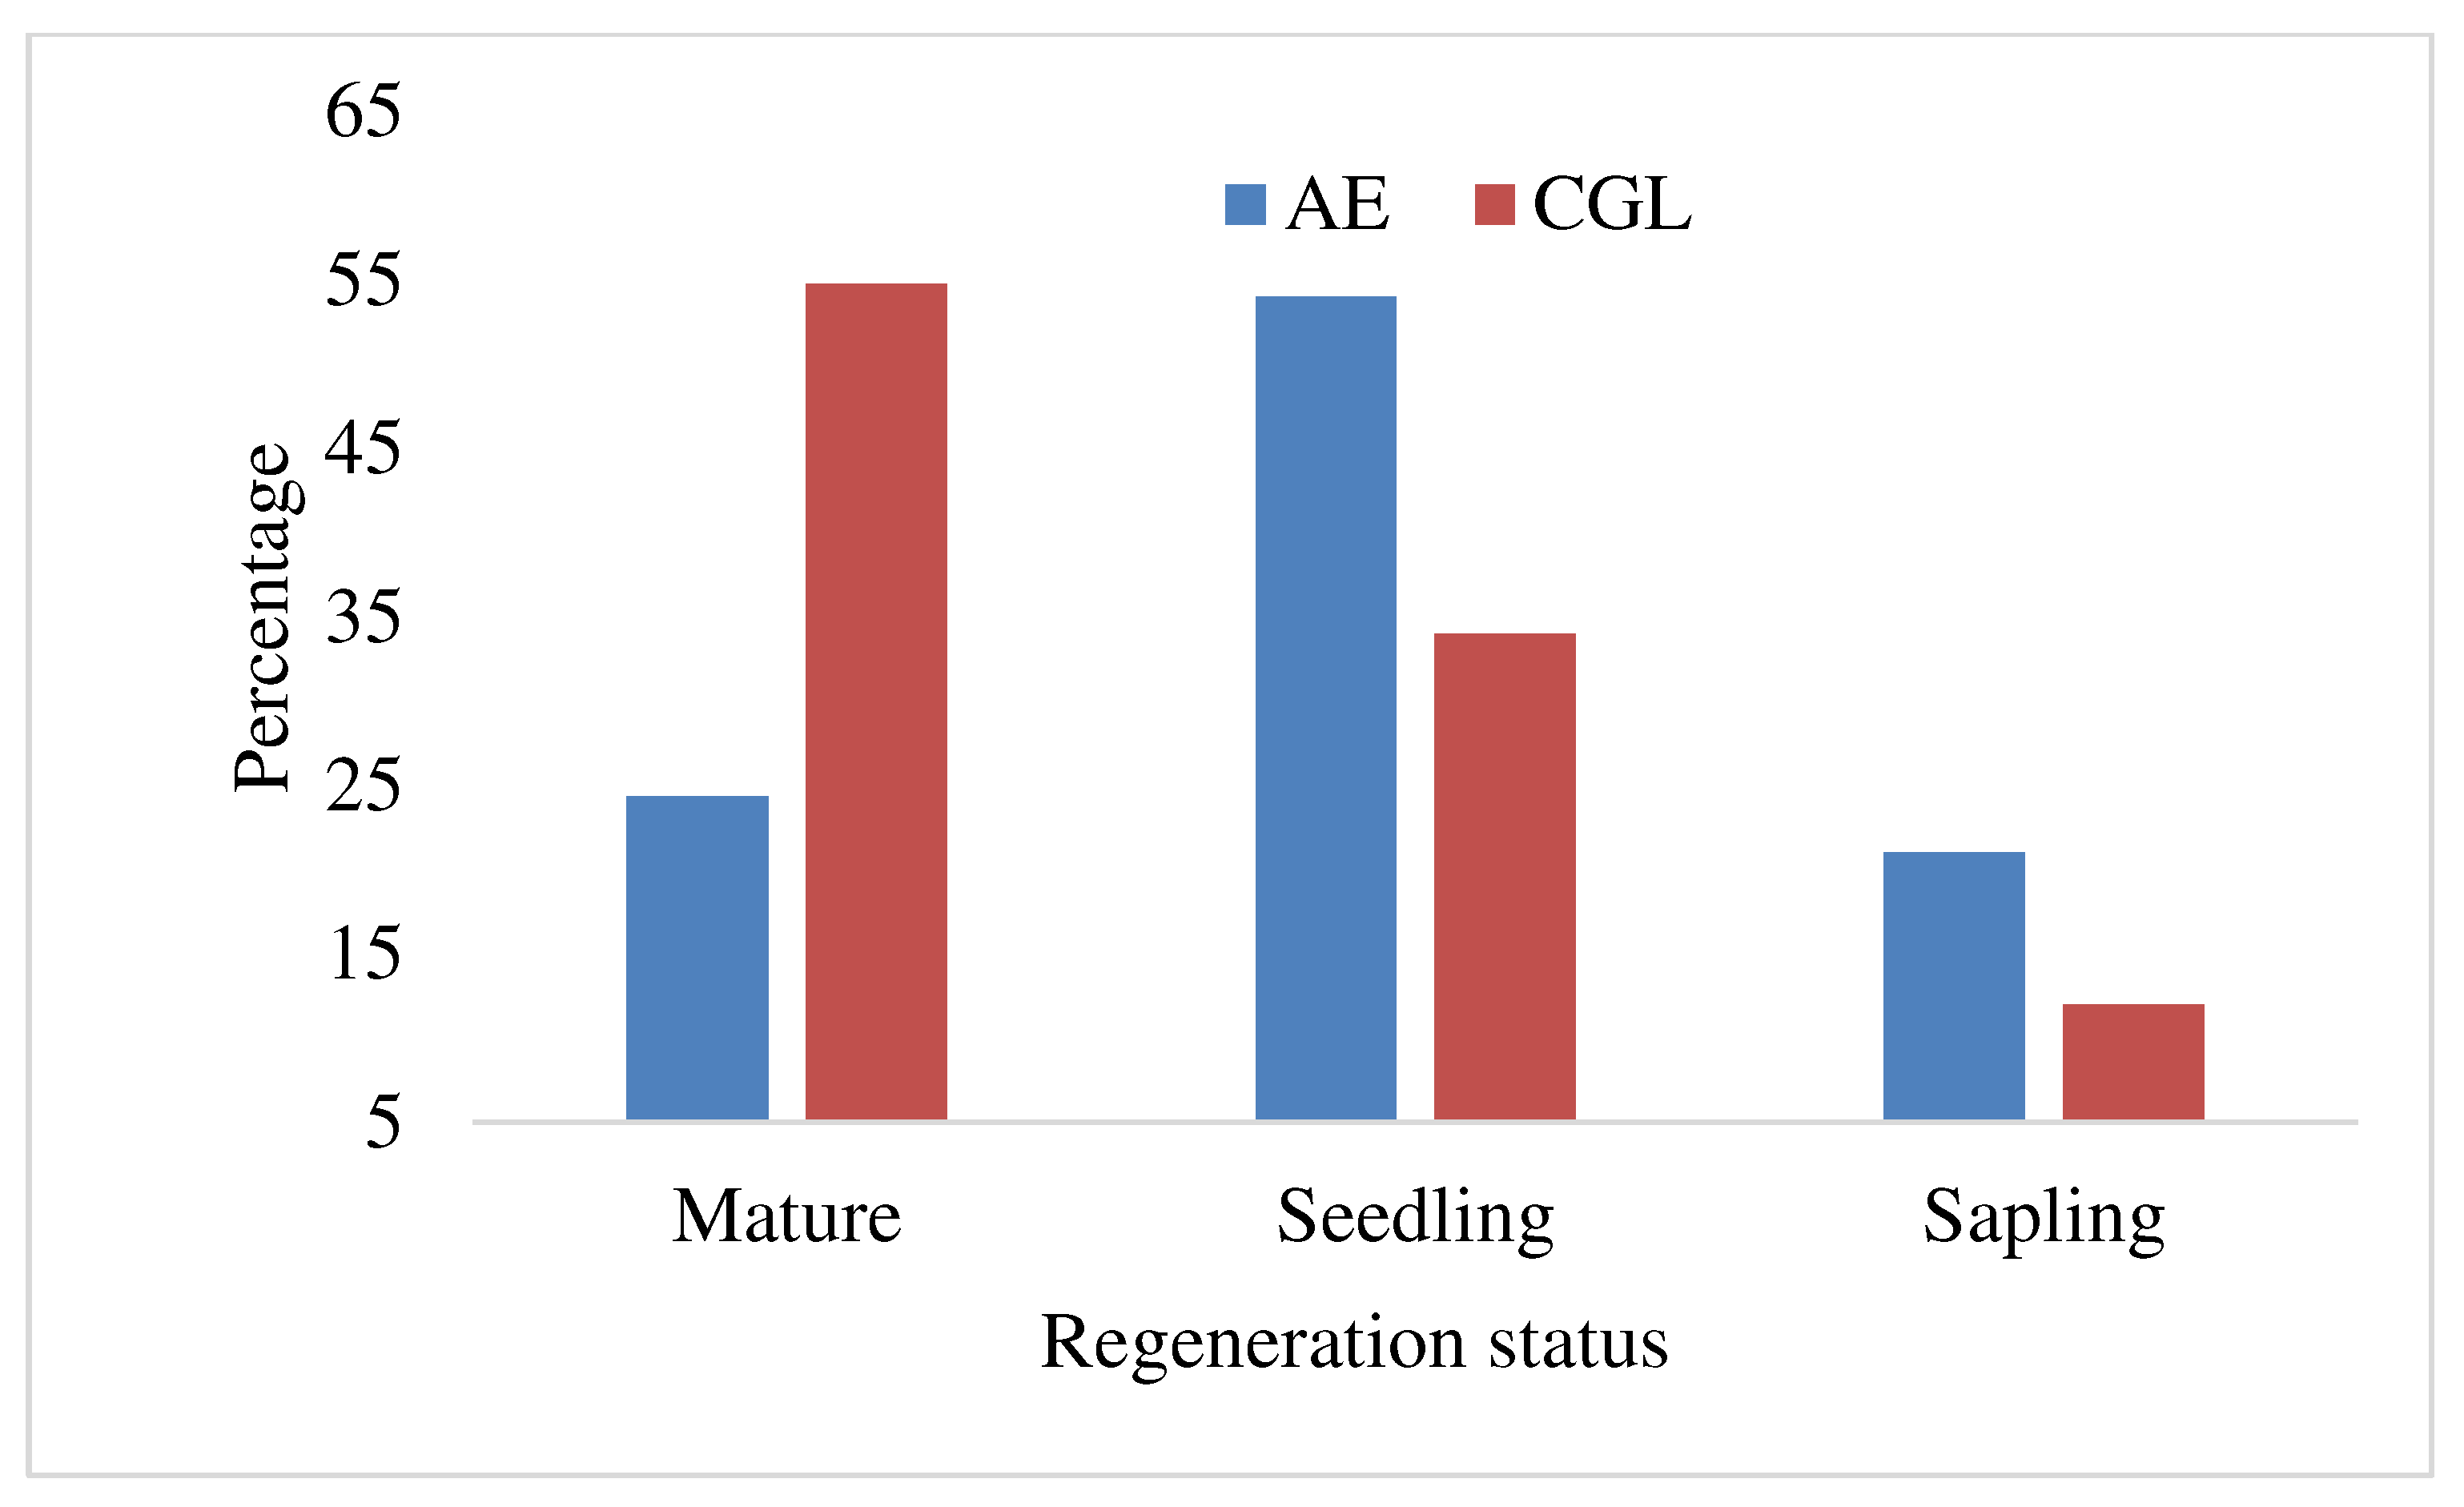
The regeneration status of honey bee flora in the AE is considered as well because of the presence of seedlings higher than saplings and mature trees (Figure 8). According to Sultan and Mohammed (2013) presence higher seedlings than saplings and mature trees, is an indication of the successful regeneration status of tree species. However, the regeneration status of CGL can be considered as found in fair condition. This was observed as the proportion of regenerating was lower than sapling and mature trees (Figure 8). The high proportion of seedlings in the AE showed the potential for the restoration of a honey bee flora. However, the lower proportion of seedlings in CGL areas shows restricted tree seedlings recruitments presumably due to effects of livestock grazing. This is because in this area tree seedlings are being grazed and browsed or trampled by livestock, leading to failure in their natural regeneration patterns (Stern et al. 2002, Jimenez et al. 2005, Teich et al. 2005 and Teshome et al. 2015). When this happens in the long term, the mortality of old trees is not replaced by the new recruitments causing changes in plant age structure which may be skewed towards ageing individual trees (Kikoti et al. 2015). Also Smit et al. (2006) pointed out that livestock grazing destroys seeds including the newly established seedlings thus undermining natural regeneration of trees. The density of seedlings in AE sites is far more than the CGL indicating the effect of AE to promote honey bee flora density. It is supported by a study that states disturbance causes reduction in plant density and impairs the natural regeneration including the development of seedlings (Blay 2002).

3.6. Species diversity, richness and evenness in the study land uses

The value of the Shannon diversity index and evenness of bee flora in the AE were 2.12 and 0.94, respectively (Table 3). However, the low Shannon diversity index (1.56) and evenness (0.91) indicating in the CGL. Low evenness of woody species in CGL reveals that the areas were dominated with few species and this could be attributed to excessive disturbance and selective cutting of trees (Alemayehu 2002) resulted in the dominance of a few species. This could result from repeated habitat disturbances in the CGL due to frequent and intensive interference of both humans and livestock for grazing and other communal uses. On the other hand, the average number of species richness per plot is higher in the AE than in the CGL, indicating more diversity in the AE. This indicated that the type of management practices influenced species richness. The difference observed in bee flora diversity between the two land use systems showed the positive effect of protection, natural vegetation through proper conservation strategies like AE. Similarly, encouraging results have been reported from studies made on AE established in Tigrai, Ethiopia (Equar et al. 2016 and Haftom et al. 2017). This study indicated AE was a good source of honey bee flora with diversified important bee forages than the CGL. In line with this research result, studies state that land management options through natural regeneration enhanced species diversity (SER 2008). Moreover, other studies have shown that disturbance like free grazing is agreed to be the main threat to species diversity, ecosystem structure and function. AE are free from human interference and this creates better opportunity natural regeneration of species as well as good vegetation cover; most probably this may be the main reason for higher species diversity in AE. The previous study conducted by Tefera (2002) and Alemtsehay (2011) similarly finds out that, higher value of Shannon diversity indices in AE, and noted that AE have more species and important for the conservation of important plant genetic resources.

4. Conclusions

The comparison made between AE and adjacent CGL showed that composition, density, richness and diversity of honey bee flora were significantly higher in the AE. The present study has demonstrated that frequent and intensive interference of both humans and livestock prevention is an important means of rehabilitating and renovating honey bee flora species. This is indicative of the role of AE, exclusion of livestock grazing and human interference from selected areas, as an important policy instrument to allow the recovery degraded honey bee flora provided that they are properly protected and managed. Honeybee floras with poor reproduction and hampered such as E. racemose, E. camaldulensis and C. africana should be given the first priority for conservation measures.

Author Contributions

Conceptualization, T.A.; methodology, T.A., T.G., H.G.; software, T.A.; validation, T.A., H.G.; formal analysis, T.A., H.G.; investigation, T.A., T.G., H.G., and G.B.; resources, T.A., T.G., H.G., and G.B.; data curation, T.A., T.G., H.G., and G.B.; writing—review and editing, T.A., T.G., H.G., G.B.; visualization, G.B.; supervision, G.B.; project administration, T.A.; funding acquisition, T.A. All authors have read and agreed to the published version of the manuscript.

Funding

This research received no external funding.

Data Availability Statement

The datasets used and/or analyzed during the current study are available from the corresponding author upon reasonable request.

Acknowledgments

We would like to acknowledge Tigrai Agricultural Research Institute for financial support to do the research. Informants of the study area in particular, and the local communities in general, the scouts, Southern Zone of Office of Agriculture and Rural Development, all staff members of the natural resource managements are thanked for their various supports. Heartfelt appreciation also goes to Muez Mehari for his support towards analysis of the R-software. We are also very grateful to Gebrecherkos Yeebyo and Rahyel Kiros for their technical contribution.

Conflicts of Interest

The authors declare that they have no competing interests.

Appendix A

Table A1. Major honeybee flora of the study sites with their life form.
Vernacular name Scientific name of the plant Life form/Habit Land use system
Tsada-grar Acacia abyssinica Hochst. ex Benth Tree B
Wancho Acacia seyal Tree B
Karora Acacia tortilis (Forssk.) Hayne Tree B
Sabansa Accacia asak Tree B
Seraw Accacia etbaica Tree B
Morez Acokanthera schimperi Shrub/Tree AE
Tetem-agazen Astragalus atropilosulus Shrub B
Bedeno Balanites aegpytiaca Tree B
Tebeb Becium grandiflorum (Lam.) Shrub B
Htsawts Calpurnia aurea (Ait) Benth Shrub B
Agam Carissa edulis (Forssk.) Vahl Shrub B
Keyh–om Cassipourea malosana (Baker) Alston Tree AE
Moto-koma Celtis africana Burm. f. Tree AE
Tsaeda-kotsilo Conyza hypoleuca A.Rich Shrub B
Awhi Cordia Africana Tree AE
Tahses Dodonoae angustifoha Shrub AE
Mongolhats Dovyalis abyssinica (A.Rich.) Warb. Shrub/Tree B
Key-bahrzaf Eucalyptus camaldulensis Dehnh Tree AE
Tsaeda-Bahrzaf Eucalyptus globulus Labill Tree AE
Kuleow Euclea racemosa subsp. schimperi (A.DC.) Dandly Shrub B
Kinchib Euphorbia tirucalli Tree B
Oda Ficus sycomorus L Tree B
Anchie Gomphocarpus fruticosus Shrub B
Meleglega Grewia ferruginea Hochst.exA.Rich Shrub/Tree B
Rowey Grewia mollis juss Shrub/Tree B
Swakerni Lucas Abissinica Shrub B
Atsats Maytenus undata (Thunb.) Blakelock Tree B
Kachmo Myrsin Africana Shrub B
Awlie Olea Africana Tree B
Kerets Osyris quadripartite Tree B
Chiendog Otostegia integrifolia Benth. Shrub B
Mayliho Pittosporum viridiflorum Sims Tree B
Tsehag Psydrax schimperiana (A.Rich.) Bridson Shrub B
Konteftefe Ptrollobium stellatum Shrub B
Tetaelo Rhus glutinosa A.Rich. Shrub/Tree B
Atami Rhus natalensis Krauss Shrub/Tree B
Hohot Rumex nervosus Vahl Shrub B
Agam-kinchil Sageretia thea (Osbeck) M. C. Johnston Shrub B
Tikur-berbere Shinus molle Tree AE
Girawa Vernonia amygdalina Del. Tree B
Kunkura/Gaba Zizyphm spina christi Tree B
Kunkurahdo Zizyphus mucronata Tree AE
B= record at both land use system, and AE= record only at area exclosure.

References

  1. Aerts, R., Wagendrop, T., November, E., Mintesinot B., Deckers, J., Muys, B. 2004. Ecosystem thermal buffer capacity as an indicator of the restoration status of protected areas in the Northern Ethiopian Highlands. Restoration Ecology, 12: 586-596. [CrossRef]
  2. Alemayehu Wassie. 2002. Opportunities, constraints and prospective of Ethiopian orthodox tewahido churches in conserving forest and resources: the case of churches in South Gonder, Northern Ethiopia. Master’s Thesis, Swedish University of Agricultural.
  3. Alemtsehay Teklay. 2011. Seasonal Availability of Common Bee Flora in Relation to Land Use and Colony Performance in Gergera Watershed Atsbi Wenberta District Eastern zone of Tigrai, Ethiopia, MSc Thesis, Hawassa University, Wondo Genet College Of Forestry And Natural Resources, Wondo Genet, Ethiopia.
  4. Amsalu Bezabeh, Nuru Adgaba and Radloff, H. 2003. Multivariate morphometric analysis of honeybees in the Ethiopian region Apidolgie 35: 71-81. [CrossRef]
  5. Atsbaha H, Taye T and Kebede D. 2015. Assessment of honey production system, constraints and opportunities in three selected Districts of Tigray Region, Ethiopia. Basic Research Journal of Agricultural Science and Review, 4(10), 304-315.
  6. Ayalew Kassaye. 2006. The loss of some natural plant species in Tigrai and the concern to the living conditions of honeybees. Loss of natural plants: Proceedings of the 5th Annual National Conference of Ethiopian Beekeepers Association. 8-15.
  7. Ayalew Sebsibe, Feleke Woldeyes and Simon Shibru. 2018. Woody Vegetation Composition, Structure, and Community Types of Doshke Forest in Chencha, Gamo Gofa Zone, Ethiopia, International Journal of Biodiversity. [CrossRef]
  8. Birhane, E., Mengistu, T., Seyoum, Y., Hagazi, N., Putzel, L., Rannestad, M. M., and Kassa, H. 2017. Exclosures as forest and landscape restoration tools: lessons from Tigrai Region, Ethiopia. International Forestry Review. 8-14. [CrossRef]
  9. Blay, D. 2002. Rehabilitation of degraded lands in humid zones of Africa. Forest research Institute of Ghana University. Kumasi, Ghana.
  10. Bot, A. & Benites, J. 2005. The Importance of soil organic matter: key to drought-resistant soil and sustainable food production. FAO soils Bulletin, Rome, Italy. Pp 5-48.
  11. Central Statistical Agency. 2019. Agricultural Sample Survey 2018/19 [2011 E.C.], Report on livestock and livestock characteristics. Addis Ababa, Ethiopia.
  12. Couralet, C. Sass-klaessen, U., Sterck, F.J., Tesfaye Bekele, & Zuidema P.A. 2005. Combining dendrochonology and matrix modeling in demographic studies: an evaluation for Juniperus procera in Ethiopia. Forest Ecology and Management, 216:317-330. [CrossRef]
  13. Dhaulkhandi, M., Dobhal, A., Bhatt, S and Kumar, M. 2008. Community structure and regeneration potential of natural forest site in Gangotri, India. Journal of Basic and Applied Sciences, 4: 49-52.
  14. Edwards, S., Mesfin Tadesse, Sebsebe Demissew and Hedberg, I. (eds.) 2000. Flora of Ethiopia and Eritrea, Vol. 2. Part 1. The National Herbarium, Addis Ababa University, Addis Ababa and Department of Systematic Botany, Uppsala University, Uppsal.
  15. Emiru Birhane, Demel Teketay and Barklund, P. 2007. Enclosures to Enhance Woody Species Diversity in The Dry Lands of Eastern Tigray, Ethiopia, East African Journal of Sciences, 1 (2) 136-147. [CrossRef]
  16. Equar Gebru, Abraha Berhanu, Lemma Hayal, Amare Solomon and Asmelash Tsehaye. 2016. Honey bee flora diversity and their impact on honey production in Tigrai region of Ethiopia, Livestock Research for Rural Development 28 (7).
  17. Feyera Senbeta, Tadesse Woldemariam, Sebsebe Demissew and Denich Manfred. 2007. Floristic diversity and composition of Sheko forest, Southwest Ethiopia. Ethiopian Journal of Biological Sciences, 6: 11-42.
  18. Fichtl R and Admasu A.1994. Honeybee flora of Ethiopia. The national herbarium, Addis Ababa university, Deutscher Entwicklungsdienst (DED). Margraf Verlag, Germany.
  19. Fisaha G, Hundera K & Dalle G. 2013. Woody plants’ diversity, structural analysis and regeneration status of Wof Washa natural forest, north-east Ethiopia. African Journal of Ecology 51: 599-608. [CrossRef]
  20. Gebrewahd Amha. 2014. Herbaceous vegetation restoration potential and soil physical condition in a mountain grazing land of Eastern Tigrai, Ethiopia. Journal of Agriculture and Environment for International Development, 108(1): 81 – 106.
  21. Girmay Tesfay, Girmay Gebresamual, Alem Gebretsadik and Hailemariam Tekie. 2014. Participatory rural appraisal report: Raya-Alamata Wereda, Tigray region. CASCAPE working paper 2.6.4.
  22. Gurmessa F, Soromessa T & Kelbessa E. 2012. Structure and regeneration status of Komto Afromontane moist forest, East Wollega Zone, west Ethiopia. Journal of Forestry Research 23(2): 205−216.
  23. Haftom G, Zelealem Tesfay, Girmay Murutse and Awet Estifanos A 2013: Seasonal honeybee forage availability, swarming, absconding and honey harvesting in Debrekidan and Begasheka Watersheds of Tigray, Northern Ethiopia. Livestock Research for Rural Development 25(61). http://www.lrrd.org/lrrd25/4/haft25061.htm.
  24. Haftom Gebremedhn and Yaynishet Tesfay. 2012. Identification and evaluation propagation techniques of Hypoestes forskaolii (Grbia) as bee fodder for smallholder farmers, Livestock Research for Rural Development 24.
  25. Haftom Gebremedhn, Girmay Darcha and Kinfe Mezgebe. 2017. Distribution and abundance of Hypoestes forskaolii (Vahl) in the exclosures of Tigrai, northern Ethiopia, Livestock Research for Rural Development 29 (8).
  26. Hundera K & Gadissa T. 2008. Vegetation composition and structure of the Belete forest, Jimma zone, south western Ethiopia. Ethiop. J. Biol. Sci. 7(1): 1-15.
  27. Jimenez, J., Jurado, E., Aguirre, O. and Estrada, E. 2005. Effect of Grazing on Restoration of Endemic Dwarf Pine (Pinus culminicola Andresen et Beaman) Populations in Northeastern Mexico. Restoration Ecology, 13, 103-107. [CrossRef]
  28. Kebede T and Lemma T. 2007. Study of honey production system in Adami tulu jido Kombolcha district in mild rift valley of Ethiopia. Adami tulu Agricultural Research center, Zeway, Ethiopia. Retrieved from:. http://www.ird.org/irrd/giii/kebe/9162.htm19(11).
  29. Keller I, Fluri P and Imdorf A. 2005. Pollen nutrition and colony development in honey bees, Part II, Bee World 86: 27-34. [CrossRef]
  30. idane Welde, Tesfay Atsbha, Yemane Nega, Adehanom Baraki, Hagos kidane, Ykaelo Teklay, Hagos Hailu, Dawit Hadera, G/giwergis Aredahegn, Gebre Hadgu and Desalegn Emuru. (2016). Survey Report On: Participatory Agricultural Production Constraints Appraisal in AGP-I Districts of Sothern Tigray. Alamata Agricultural Research Center.
  31. Kikoti, I.A., Mligo, C. and Kilemo, D.B. 2015. The Impact of Grazing on Plant Natural Regeneration in Northern Slopes of Mount Kilimanjaro, Tanzania. Open Journal of Ecology, 5, 266-273. [CrossRef]
  32. Krebs, C.J. 1999. Ecological methodology. 2nd edition. University of British Colombia, Harper Collins, New York.
  33. Lulekal E, Kelbessa E, Bekele T & Yineger H. 2008. Plant species composition and structure of the Mana Angetu moist Montane forest, south-eastern, Ethiopia. Journal of East African Natural History 97(2): 165–185. [CrossRef]
  34. MacDicken, K.G. 1997. A guide to monitoring carbon storage in forestry and agro-forestry projects in forest carbon monitoring program: Winrock international institute for agricultural development, Arlington, Virginia.
  35. Magurran, A.E. 1996. Ecological diversity and its measurement: Chapman and Hall. London.
  36. Martin G J. 1995. Ethnobotany A method manua Royal botanical garden, Chapman and Hall, Kew, London 116-120.
  37. Mastewal, Y., Kindeya, G., M. Stein, & Wolde, M. 2006. Impact of Area Enclosures on Density, Diversity, and Population Structure of Woody Species: the Case of May Ba’ati-Douga Tembien, Tigray, Ethiopia. Ethiopian Journal of Natural Resources 8 (1): 99 – 121.
  38. Mekuanint Lewoyehu, Meareg Amare. 2019. Comparative Assessment on Selected Physicochemical Parameters and Antioxidant and Antimicrobial Activities of Honey Samples from Selected Districts of the Amhara and Tigray Regions, Ethiopia, International Journal of Food Science. [CrossRef]
  39. Mewcha Berhe and Yemane G.Egziabher. 2016. Quality honey forage sources in the highlands of semi-arid zone, northern Ethiopia, Journal of the drylands, 6(2): 546 – 559.
  40. Michener, C.D. 2007. The bees of the world, 2nd edition, The Johns Hopkins University Press, Baltimore and London, USA and UK 12-19.
  41. Misra, K.C. 1974. Manual of plant ecology. Oxford and IBH publishing Co., New Delhi. 376p.
  42. Nyssen J, Descheemaeker K, Nigussie H, Mitiku H, Deckers J and Poesen J (eds). 2007. Lessons learnt from 10 years research on soil erosion and soil and water conservation in Tigrai, Tigrai Livelihood papers no.7, Mekelle: Zala-Daget Project, Mekelle University, K.U.Leuven, Relief Society of Tigrai, Africamuseum and Tigrai Bureau of Agriculture and Rural Development, 53 p. ISBN 978-90-8826-027-8.
  43. Porto, R. G., de Almeida, R. F., Cruz-Neto, O., Tabarelli, M., Viana, B. F., Peres, C. A., & Lopes, A. V. 2020. Pollination ecosystem services: A comprehensive review of economic values, research funding and policy actions. Food Security, 12(6), 1425–1442. [CrossRef]
  44. R Development Core Team. 2021. R: A language and environment for statistical computing. R Foundation for Statistical Computing, Austria, URL. http://www.Rproject.org/.
  45. Said F, Inayatullah M, Ahmad S. 2015. Foraging behavior of the Himalayan Honeybee, Apis cerana (Hymenoptera: Apidae) associated with sunflower (Helianthus annuus L.) at Peshawar District of Khyber Pakhtunkhwa (KP). J Entomol Zool Stud; 3(3): 203-7.
  46. Sarkar, M., and Devi, A. 2014. Assessment of diversity, population structure and regeneration status of tree species in Hollongapar Gibbon Wildlife Sanctuary, Assam, Northeast India. Tropical Plant Research, 1, 26-36.
  47. SER (Society for Ecological Restoration International Science and policy working group). 2008. Opportunities for integrating ecological restoration and biological conservation within the ecosystem approach. Society for Ecological Restoration International.
  48. Smit, C., Gusberti, M. and Müller-Schärer, H. 2006. Safe for Saplings; Safe for Seeds? Forest Ecology and Management, 237, 471-477. [CrossRef]
  49. Southern Zone BOARD. 2018. Natural resources core process, annual report. Southern Zone of Office of Agriculture and Rural Development, Unpublished, Tigrigna version.
  50. Stern, M., Quesada, M. and Stoner, K.E. 2002. Changes in Composition and Structure of a Tropical Dry Forest Following Intermittent Cattle Grazing. International Journal of Tropical Biology, 50, 1021-1034.
  51. Sultan M and Berhanu A. 2013. Floristic composition and structure of Yegof mountain forest, South Wollo, Ethiopia. Ethiopian Journal of. Sciences and Technology, I (1): 33-45.
  52. Tadele D, Lulekal E, Damtie D & Assefa A. 2014. Floristic diversity and regeneration status of woody plant in Zengena forest, a remnant montane forest patch in northwestern Ethiopia. Journal of Forestry Research 25(2): 329-336. [CrossRef]
  53. Tefera Mengistu, Demel Teketay, Hulten H. and Yonas Yemshaw. 2005. The role of enclosure in the recovery of woody vegetation in degraded dry land hillsides of central and northern Ethiopia. Journal of Arid Environments, 60(2): 259-281. [CrossRef]
  54. Teich, I., Cingolani, A.M., Renison, D., Hensen, I. and Giorgis, M.A. 2005. Do Domestic Herbivores Retard Polylepis australis Bitt. Woodland Recovery in the Mountains of Cordoba Argentina? Forest Ecology and Management, 219, 229-241. [CrossRef]
  55. Tesfay Atsbha and Solomon Wayu. 2020. Utilization of indigenous tree and shrub species as animal feed resources in south Tigray, north Ethiopia, and implication for sustainable livestock production, Amaz. Jour. of Plant Resear. 4(3):594-608. [CrossRef]
  56. Tesfay Atsbha, Anteneh Belayneh Desta, Tessema Zewdu. 2019. Woody species diversity, population structure, and regeneration status in the Gra-Kahsu natural vegetation, southern Tigrai of Ethiopia. Heliyon, 5 (2019) e01120. [CrossRef]
  57. Tesfay Atsbha. 2018. Socioeconomic implication of protecting natural vegetation: The case of Gra-Kahsu protecting natural vegetation In Southern Tigray, Northern Ethiopia, International Journal of Biodiversity and Conservation, 10(11), 486-496. [CrossRef]
  58. Teshome Gemechu, Teshome Soromessa and Ensermu Kelbessa. 2015. Structure and regeneration of Gendo Moist Montane forest, East Wellega Zone, Western Ethiopia. Journal of Environment and Earth Science, 5:15.
  59. Tewelde G. 2007. Study on identification and establishment floral calendar of honeyplants in Atakilty Kebele, Tigray, Ethiopia. School of Graduate Studies Thesis Degree. Addis Ababa University, Ethiopia. 72pag.
  60. Tiwari, G.P.K., Tadele, K., Aramde, F and Tiwari, S.C. 2010. Community structure and regeneration potential of ShorearobustaForest in sub-tropical Submontane Zone of Garhwal Himalaya, India. Nature and Science, 8:70-74.
  61. Tsegay G, Tessema ZK, Negasi S, Emiru B. 2019. Carbon sequestration and soil restoration potential of grazing lands under exclosure management in a semi-arid environment of northern Ethiopia. Ecol Evol 9:6468–6479. [CrossRef]
  62. Wolde M, Aynekulu E. 2011a. Enclosure land management for restoration of the soils in degraded communal grazing lands in northern Ethiopia. Land Degradation and Development, 24:528-538. [CrossRef]
  63. Wolde M, Veldkamp E, Mesfin T, Olschewski R. 2011c. Economic valuation of land restoration: The case of exclosures established on communal grazing lands in Tigrai, Ethiopia. Land degradation and development, 22:334-344. [CrossRef]
  64. Yayneshet Tesfay. 2011. Restoration of degraded semi-arid communal grazing land vegetation using the enclosure model. Mekelle University, Mekelle, Ethiopia. International Journal of Water Resources and Arid Environments, 1(5): 382-386.
  65. Yetimwork Gebremeskel, Berhan Tamir and Desalegn Begna. 2015. Honeybee production trend, potential and constraints in Eastern Zone of Tigray, Ethiopia Agric. Biol. J. N. Am., 6(1): 22-29. [CrossRef]
  66. Yirga G and Teferi M. 2010. Participatory Technology and Constraints Assessment to Improve the Livelihood of Beekeepers in Tigray Region, northern Ethiopia. MEJS 2: 76-92. [CrossRef]
  67. Zegeye H, Teketay D & Kelbessa E. 2011. Diversity and regeneration status of woody species in Tara Gedam and Abebaye forests, northwestern Ethiopia. Journal of Forestry Research 22(3): 315-328. [CrossRef]
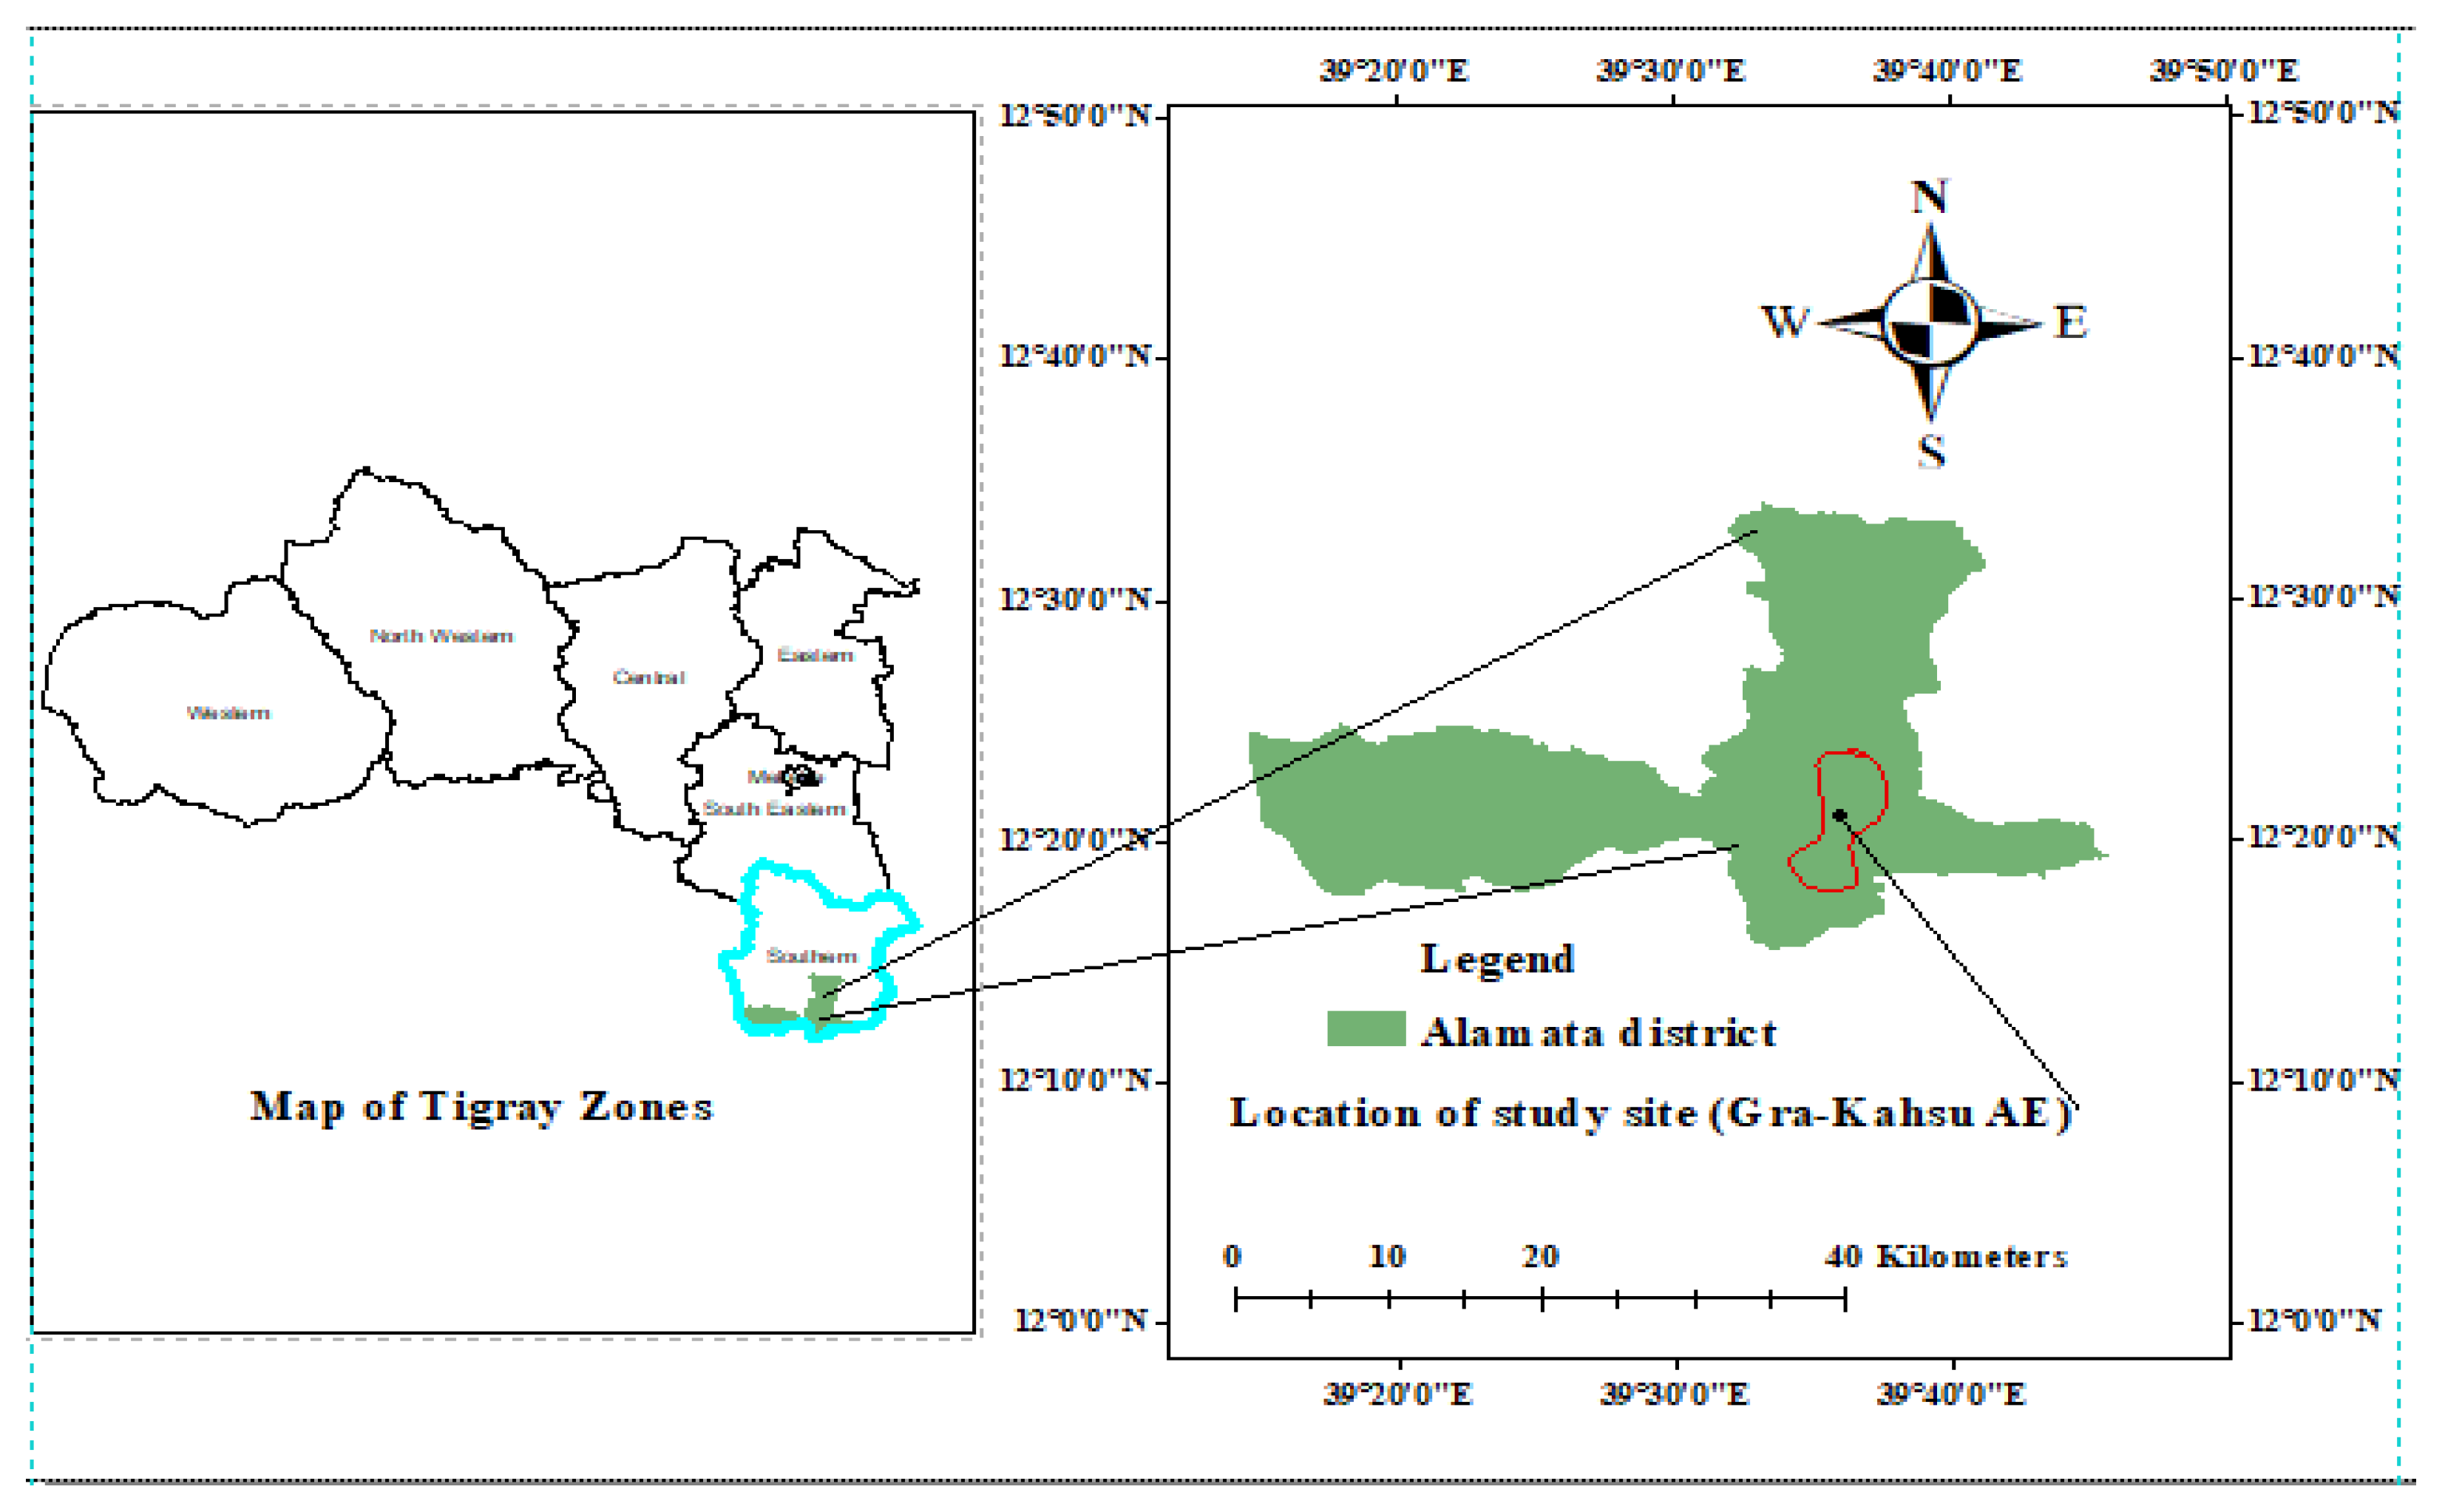
Figure 1. Location of study site (area).
Preprints 93089 g001
Figure 2. Diagram illustrating quadrat position in the study area.
Preprints 93089 g002
Figure 3. Proportion of shrubs, trees and shrubs/trees in the AE and CGL.
Preprints 93089 g003
Figure 4. Diameter class frequency distribution of bee flora: a) AE and b) CGL. (DBH class: 1. ≤ 5 cm; 2. 5.1- 10 cm; 3. 10.1-15 cm; 4. 15.1- 20 cm; 5. ≥20.1 cm).
Preprints 93089 g004
Figure 5. Height class frequency distribution of bee flora species at the AE and CGL (Height class: - 1.≤ 2 m; 2. 2.1-5 m; 3. 5.1- 10 m; 4. 10.1- 15 m; 5. ≥15.1m).
Preprints 93089 g005
Figure 6. Distribution of diameter class of bee flora species in the AE and CGL (Class: 1. ≤ 5 cm; 2. 5.1- 10 cm; 3. 10.1-15 cm; 4. 15.1- 20 cm; 5. ≥20.1 cm).
Preprints 93089 g006
Figure 7. Distribution of height class of selected bee flora species at the AE and CGL (Class: 1. ≤ 5 cm; 2. 5.1- 10 cm; 3. 10.1-15 cm; 4. 15.1- 20 cm; 5. ≥20.1 cm).
Preprints 93089 g007aPreprints 93089 g007b
Figure 8. Regeneration status of bee flora species at AE and CGL.
Preprints 93089 g008
Table 1. Preference ranking of ten selected bee floras on bee attractiveness.
Species Respondents Weight Index (%) Rank
1 2 3 4 5 6 7 8 9 10
Becium grandiflorum 7 1 1 1 0 0 0 0 0 0 94 15.36 1
Leucas abyssinica 3 4 1 1 1 0 0 0 0 0 87 14.22 2
Cordia africana 1 2 3 3 0 0 0 0 1 0 75 12.25 3
Ziziphus spina 2 2 1 0 1 2 1 0 1 0 68 11.11 4
Eucalyptus camaldulensis 0 0 2 3 1 1 0 0 1 2 52 8.50 6
Carissa edulis 0 1 1 1 2 1 1 2 0 1 52 8.50 6
Euclea schimperi 0 2 0 2 0 1 0 2 1 2 47 7.68 8
Olea africana 1 0 2 0 0 1 2 2 1 1 48 7.84 7
Schinus mole 2 1 0 2 1 0 2 0 2 0 61 9.97 5
Acacia abyssinica 0 0 0 0 1 1 1 2 2 3 28 4.58 9
Table 2. Abundance, Frequency, Relative frequency, Density and Relative Density of bee flora of the AE and CGL.
Scientific name Family Abundance Frequency Relative frequency Density Relative Density
AE CGL AE CGL AE CGL AE CGL AE CGL
Acacia abyssinica Fabaceae 58 32 44.44 41.67 2.99 5.59 90.63 80.00 4.41 7.24
Acacia seyal Fabaceae 32 13 52.78 16.67 3.54 2.23 42.11 81.25 2.43 2.94
Acacia tortilis Fabaceae 45 28 50.00 37.50 3.36 5.03 62.50 77.78 3.42 6.33
Acacia asak Fabaceae 42 15 50.00 12.50 3.36 1.68 58.33 125.00 3.19 3.39
Acacia etbaica Fabaceae 46 29 52.78 33.33 3.54 4.47 60.53 90.63 3.50 6.56
Acokanthera schimperi Apocynaceae 19 - 19.44 - 1.31 - 67.86 - 1.44 -
Astragalus atropilosulus Fabaceae 38 8 30.56 25.00 2.05 3.35 86.36 33.33 2.89 1.81
Balanites aegpytiaca Balanitaceae 25 5 47.22 8.33 3.17 1.12 36.76 62.50 1.90 1.13
Becium grandiflorum Lamiaceae 6 3 8.33 33.33 0.56 4.47 50.00 9.38 0.46 0.68
Calpurnia aurea Fabaceae 27 4 33.33 12.50 2.24 1.68 56.25 33.33 2.05 0.90
Carissa edulis Apocynaceae 67 28 63.89 50.00 4.29 6.70 72.83 58.33 5.09 6.33
Cassipourea malosana Rhizophoracea 38 - 55.56 - 3.73 - 47.50 - 2.89 -
Celtis africana Ulmaceae 7 - 27.78 - 1.87 - 17.50 - 0.53 -
Conyza hypoleuca Asteraceae 17 12 22.22 50.00 1.49 6.70 53.13 58.33 1.29 6.33
Cordia Africana Boraginaceae 7 - 22.22 - 1.49 - 21.88 - 0.53 -
Dodonoae angustifoha Sapindaceae 51 - 69.44 - 4.66 - 51.00 - 3.88 -
Dovyalis abyssinica Flacourtiaceae 15 6 38.89 16.67 2.61 2.23 26.79 37.50 1.14 1.36
Eucalyptus camaldulensis Myrtaceae 72 - 47.22 - 3.17 - 105.88 - 5.47 -
Eucalyptus globulus Myrtaceae 17 - 19.44 - 1.31 - 60.71 - 1.29 -
Euclea racemosa Ebenaceae 132 39 80.56 62.50 5.41 8.38 113.79 65.00 10.03 8.82
Euphorbia tirucalli Euphorbiaceae 31 6 55.56 8.33 3.73 1.12 38.75 75.00 2.36 1.36
Ficus sycomorus Moraceae 15 13 13.89 16.67 0.93 2.23 75.00 81.25 1.14 2.94
Gomphocarpus fruticosus Asclepiadaceae 28 19 33.33 8.33 2.24 1.12 58.33 237.50 2.13 4.30
Grewia ferruginea Tiliaceae 9 14 8.33 12.50 0.56 1.68 75.00 116.67 0.68 3.17
Grewia mollis juss Tiliaceae 26 20 33.33 45.83 2.24 6.15 54.17 45.45 1.98 4.52
Lucas Abissinica Lamiaceae 25 15 19.44 25.00 1.31 3.35 89.29 62.50 1.90 3.39
Maytenus undata Celastraceae 24 18 41.67 16.67 2.80 2.23 40.00 112.50 1.82 4.07
Myrsine Africana Myricinaceae 16 3 19.44 8.33 1.31 1.12 57.14 37.50 1.22 0.68
Olea africana Oleaceae 12 3 19.44 8.33 1.31 1.12 42.86 37.50 0.91 0.68
Osyris quadripartite Santalaceae 18 17 25.00 12.50 1.68 1.68 50.00 141.67 1.37 3.85
Otostegia integrifolia Lamiaceae 32 9 30.56 29.17 2.05 3.91 72.73 32.14 2.43 2.04
Pittosporum viridiflorum Pittosporaceae 16 4 25.00 33.33 1.68 4.47 44.44 12.50 1.22 0.90
Psydrax schimperiana Rubiaceae 34 8 30.56 16.67 2.05 2.23 77.27 50.00 2.58 1.81
Ptrollobium stellatum Fabaceae 50 18 16.67 29.17 1.12 3.91 208.33 64.29 3.80 4.07
Rhus glutinosa Anacardiaceae 32 19 44.44 29.17 2.99 3.91 50.00 67.86 2.43 4.30
Rhus natalensis Anacardiaceae 45 7 52.78 12.50 3.54 1.68 59.21 58.33 3.42 1.58
Rumex nervosus Polygonaceae 5 3 8.33 8.33 0.56 1.12 41.67 37.50 0.38 0.68
Sageretia thea Rhamnaceae 43 7 44.44 20.83 2.99 2.79 67.19 35.00 3.27 1.58
Shinus molle Anacardiaceae 5 - 5.56 - 0.37 - 62.50 - 0.38 -
Vernonia amygdalina Asteraceae 42 - 33.33 - 2.24 - 87.50 - 3.19 -
Zizyphm spina christi Rhamnaceae 13 13 36.11 29.17 2.43 3.91 25.00 46.43 0.99 2.94
Zizyphus mucronata Rhamnaceae 34 4 55.56 12.50 3.73 168 42.50 33.33 2.58 0.90
1316 442
Table 3. Maximum, minimum, mean and standard deviation of honey bee diversity, species richness and evenness of AE and CGL.
Land use system Maximum Minimum Mean Standard deviation t-Statistic P value
Diversity index AE 2.83 0.64 2.12a 0.51 4.63 <0.001
CGL 2.19 0.81 1.56b 0.38
Species richness AE 20 2 11.11a 4.83 4.88 <0.001
CGL 12 3 5.96b 2.24
Evenness AE 0.99 0.85 0.93a 0.03 2.72 0.009
CGL 0.98 0.73 0.91b 0.05
Disclaimer/Publisher’s Note: The statements, opinions and data contained in all publications are solely those of the individual author(s) and contributor(s) and not of MDPI and/or the editor(s). MDPI and/or the editor(s) disclaim responsibility for any injury to people or property resulting from any ideas, methods, instructions or products referred to in the content.
Copyright: This open access article is published under a Creative Commons CC BY 4.0 license, which permit the free download, distribution, and reuse, provided that the author and preprint are cited in any reuse.
Prerpints.org logo

Preprints.org is a free preprint server supported by MDPI in Basel, Switzerland.

Subscribe

© 2024 MDPI (Basel, Switzerland) unless otherwise stated