Submitted:
12 December 2023
Posted:
13 December 2023
You are already at the latest version
Abstract
Keywords:
1. Introduction
2. Materials and Methods
2.1. Establishment of the T. urticae and predatory mite populations
2.2. Fitness experiment for the four predatory mite species
2.3. Functional response experiment
2.4. Predator interference by different densities of predatory mites
3. Results
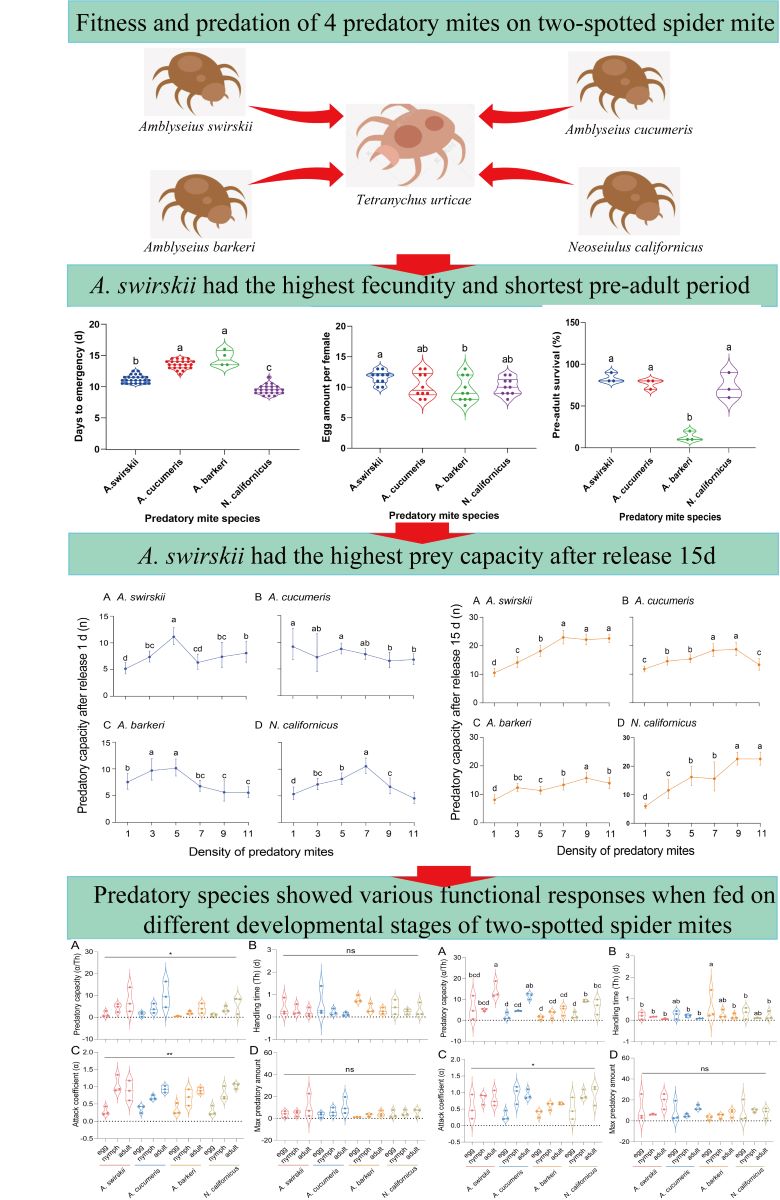
3.1. Compared to other mites in the highland area N. californicus had the fastest developmental rate
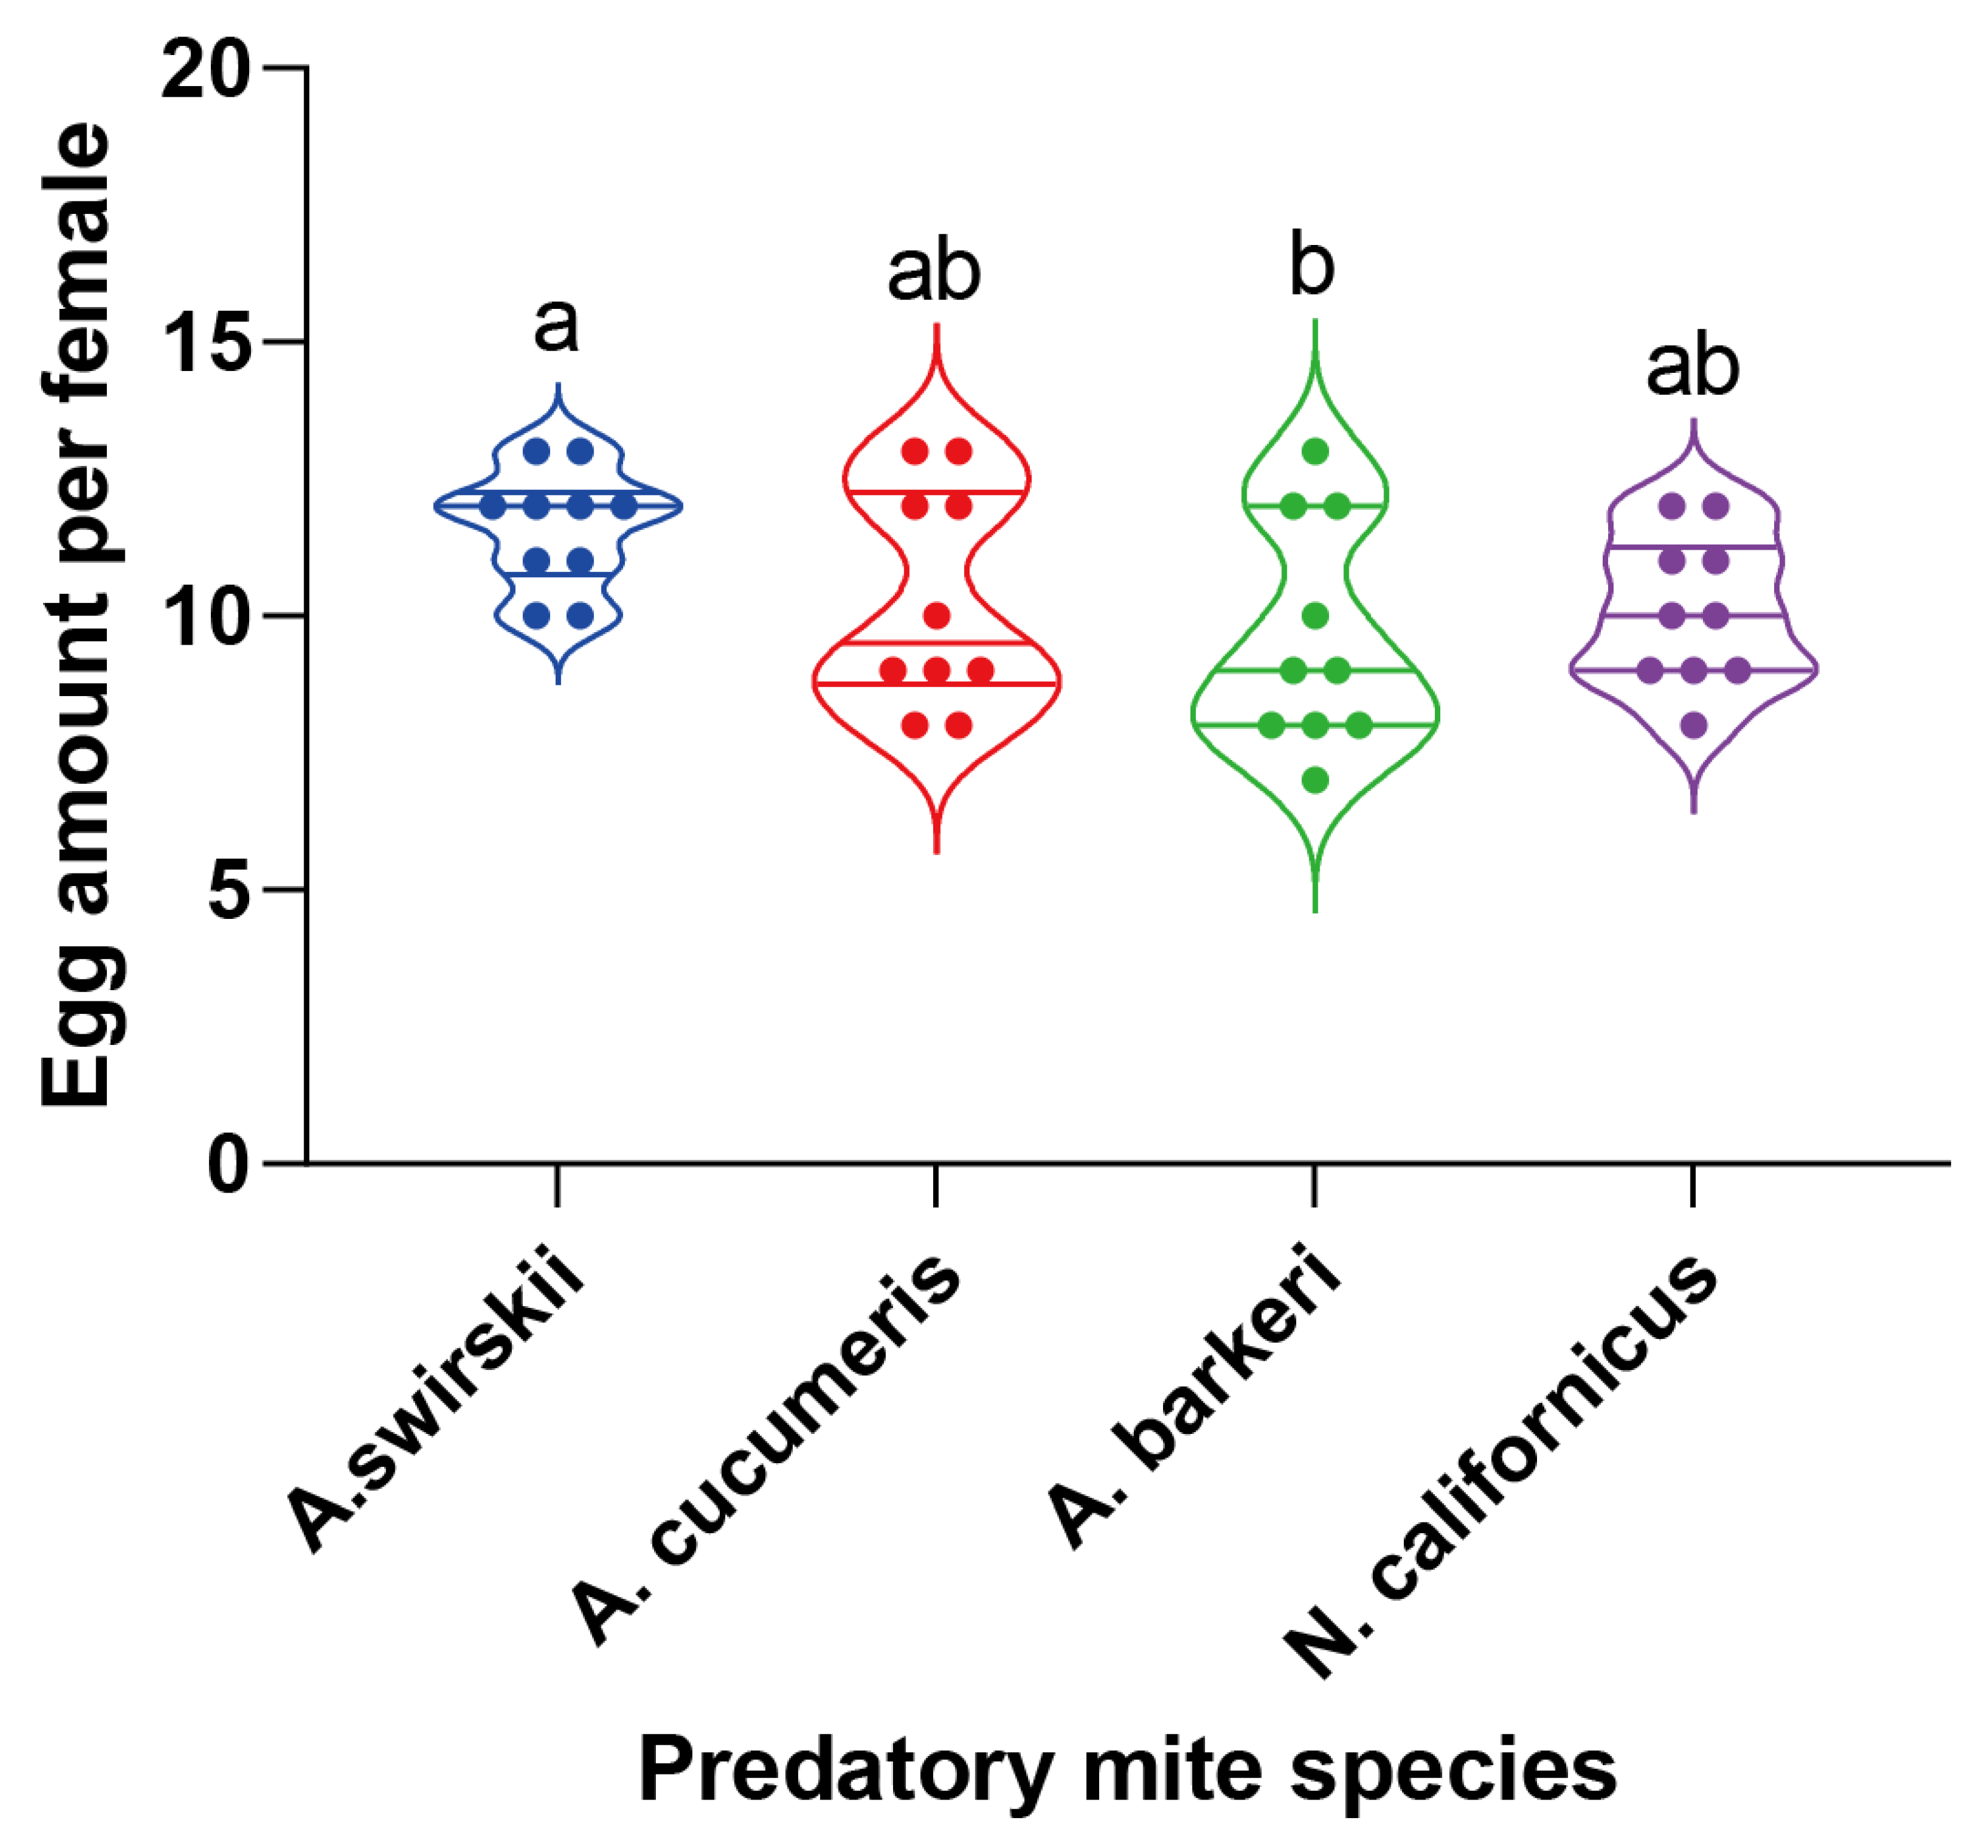
3.2. A. barkeri had relatively less fecundity than A. swirskii
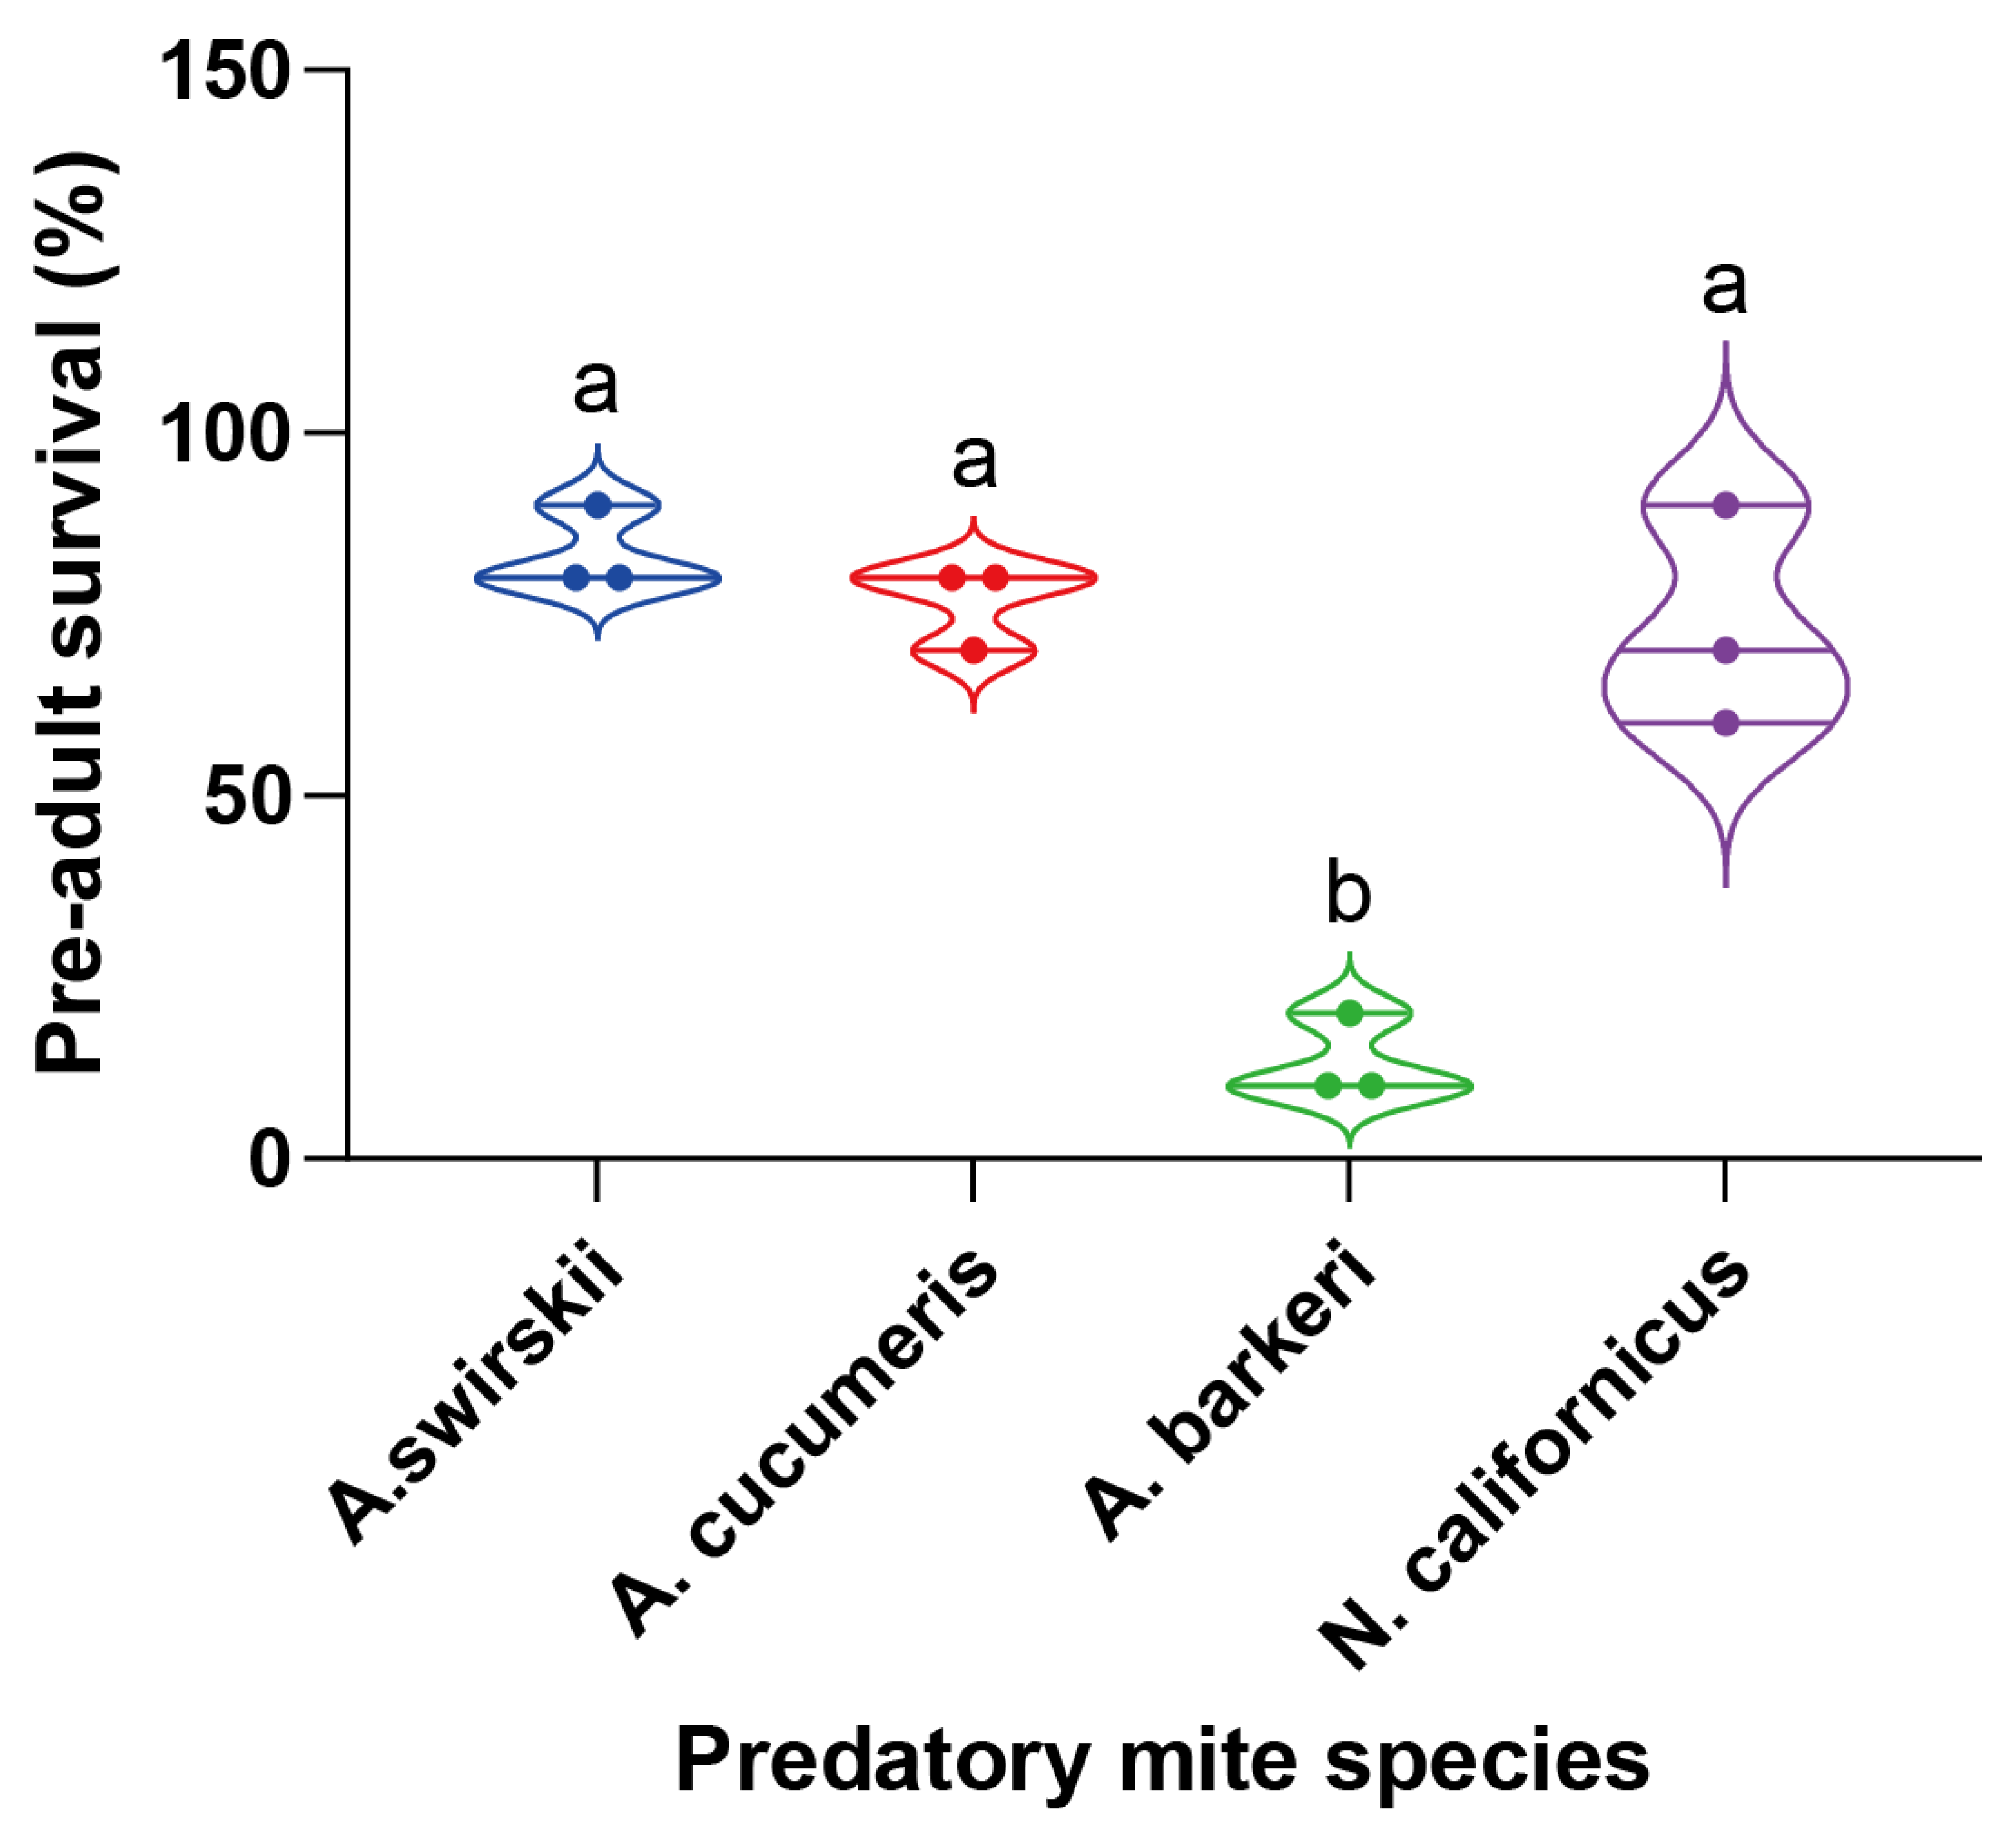
3.3. Most A. barkeri mites died before emergence in Tibet
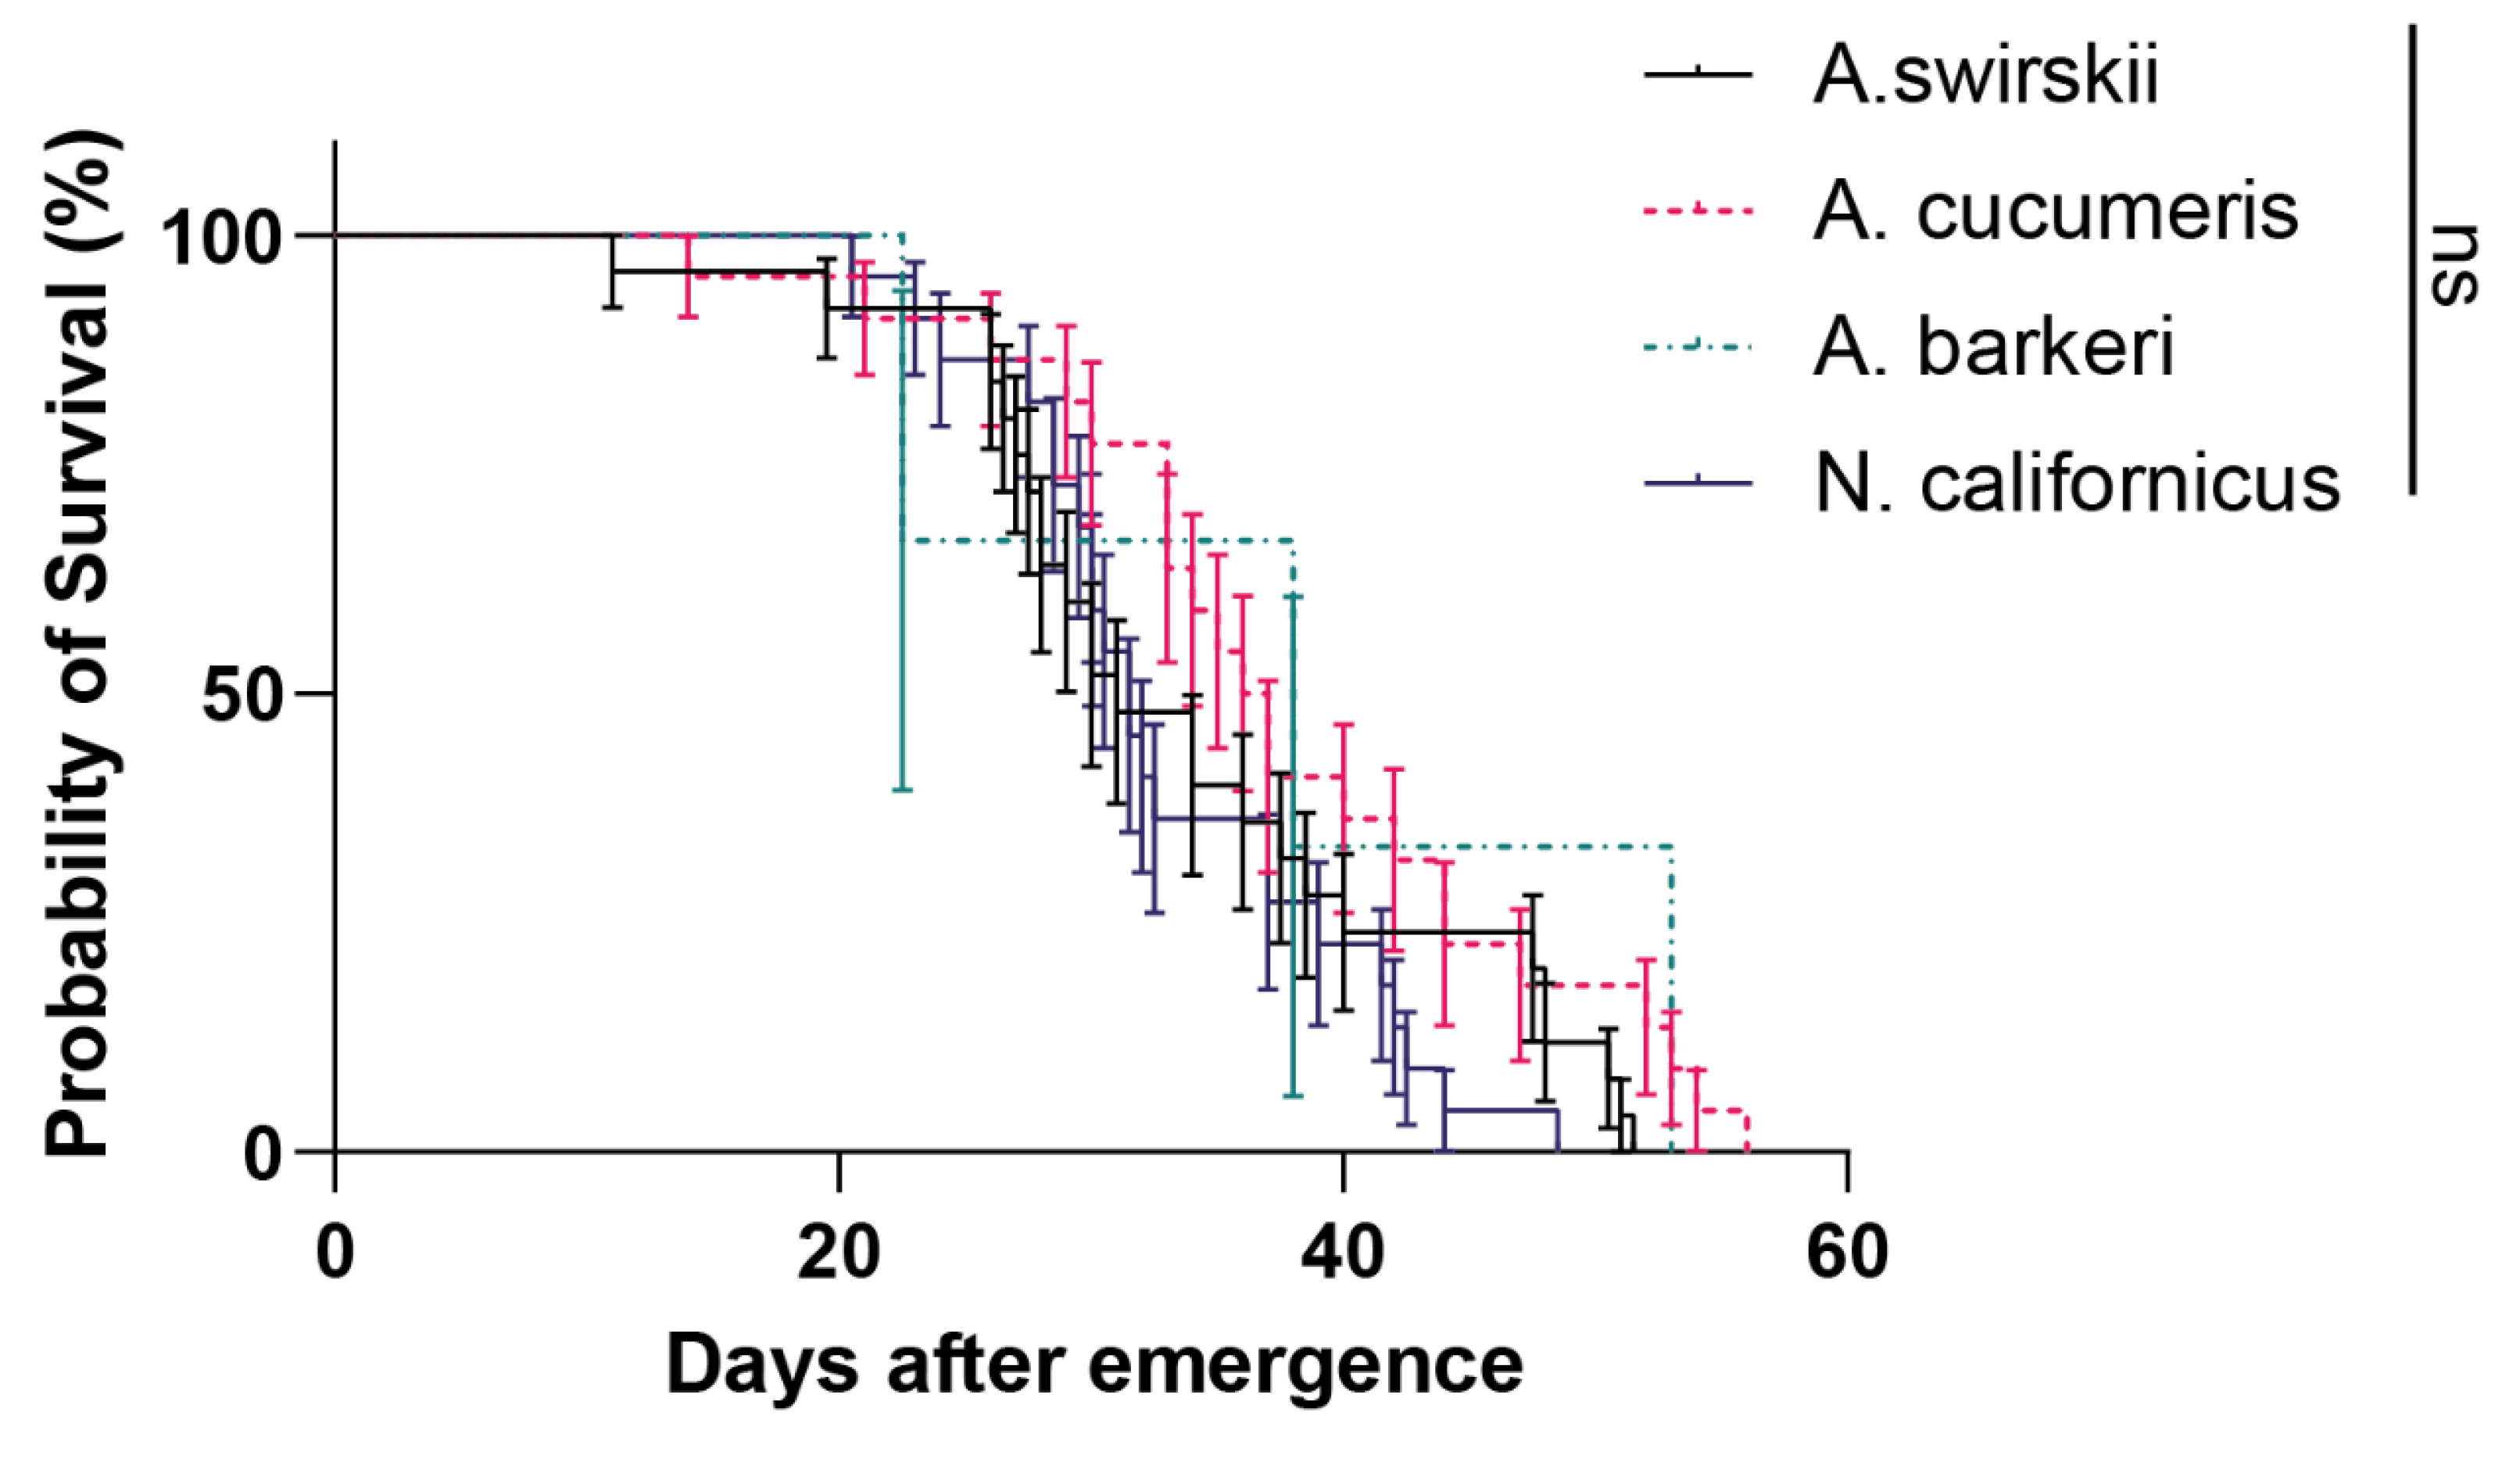
3.4. All four predatory mite species shared similar longevities in high altitudes
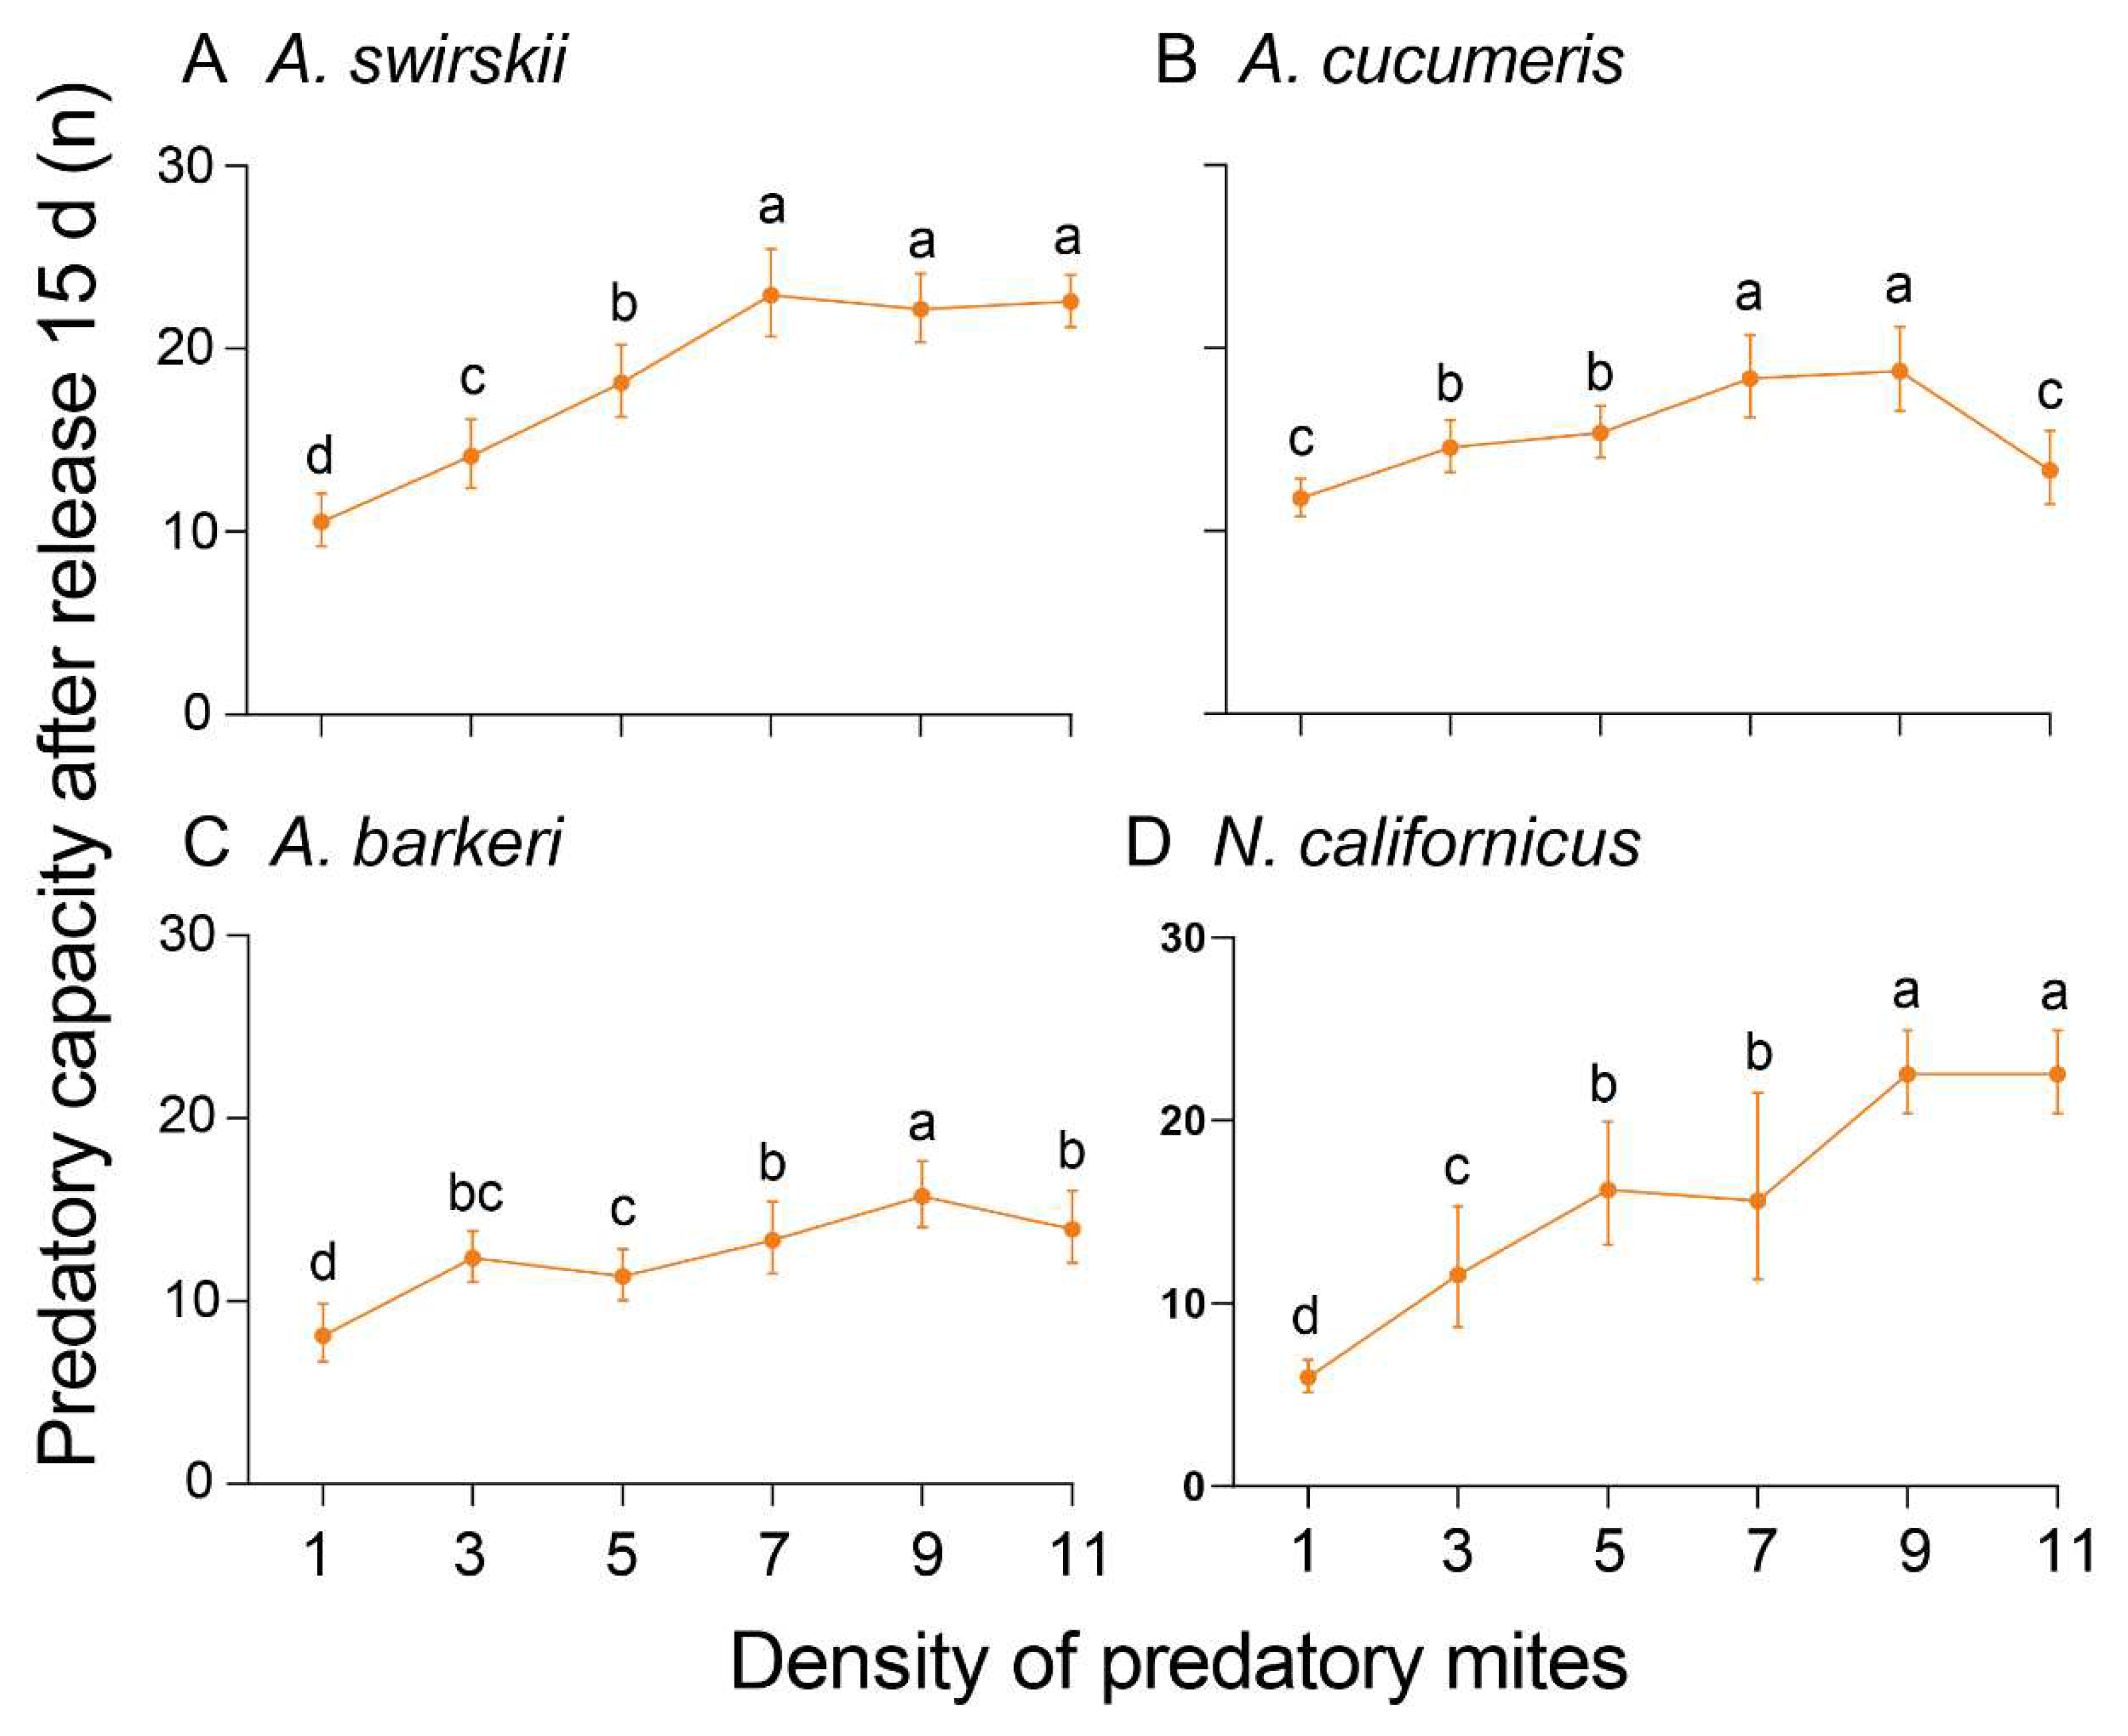
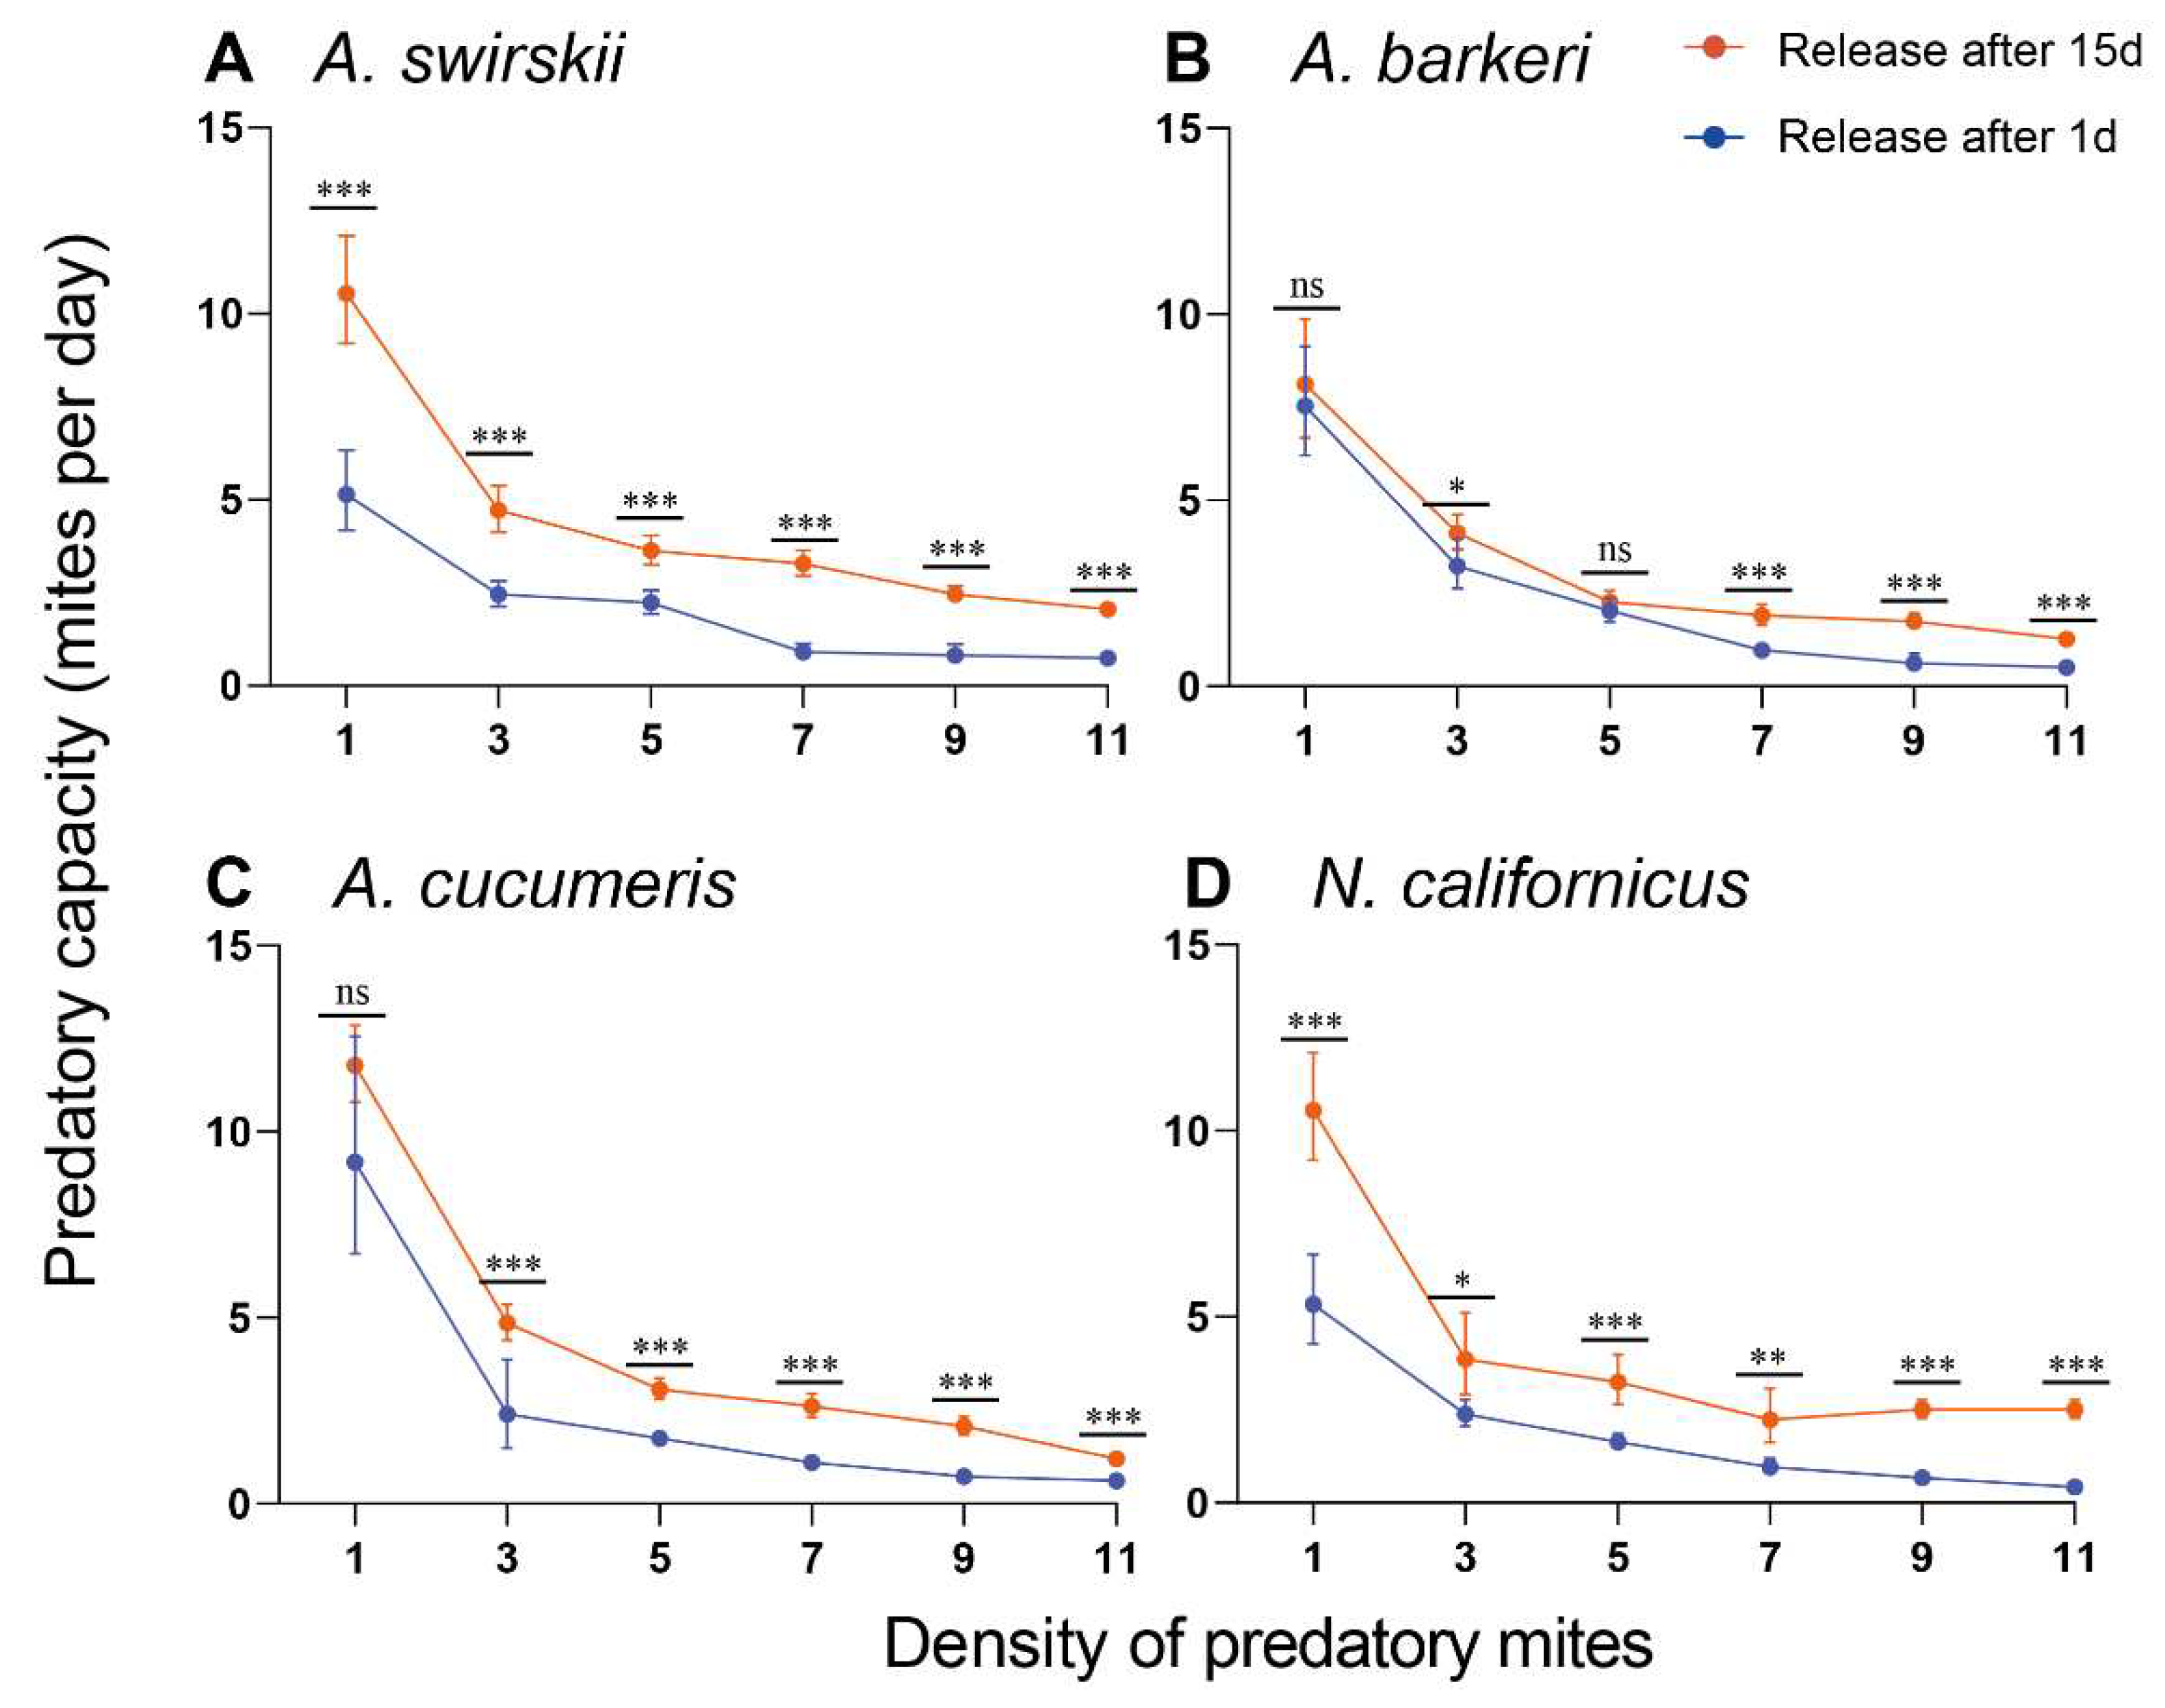
3.5. The predatory capacity of predatory mites varied at different densities under different release times
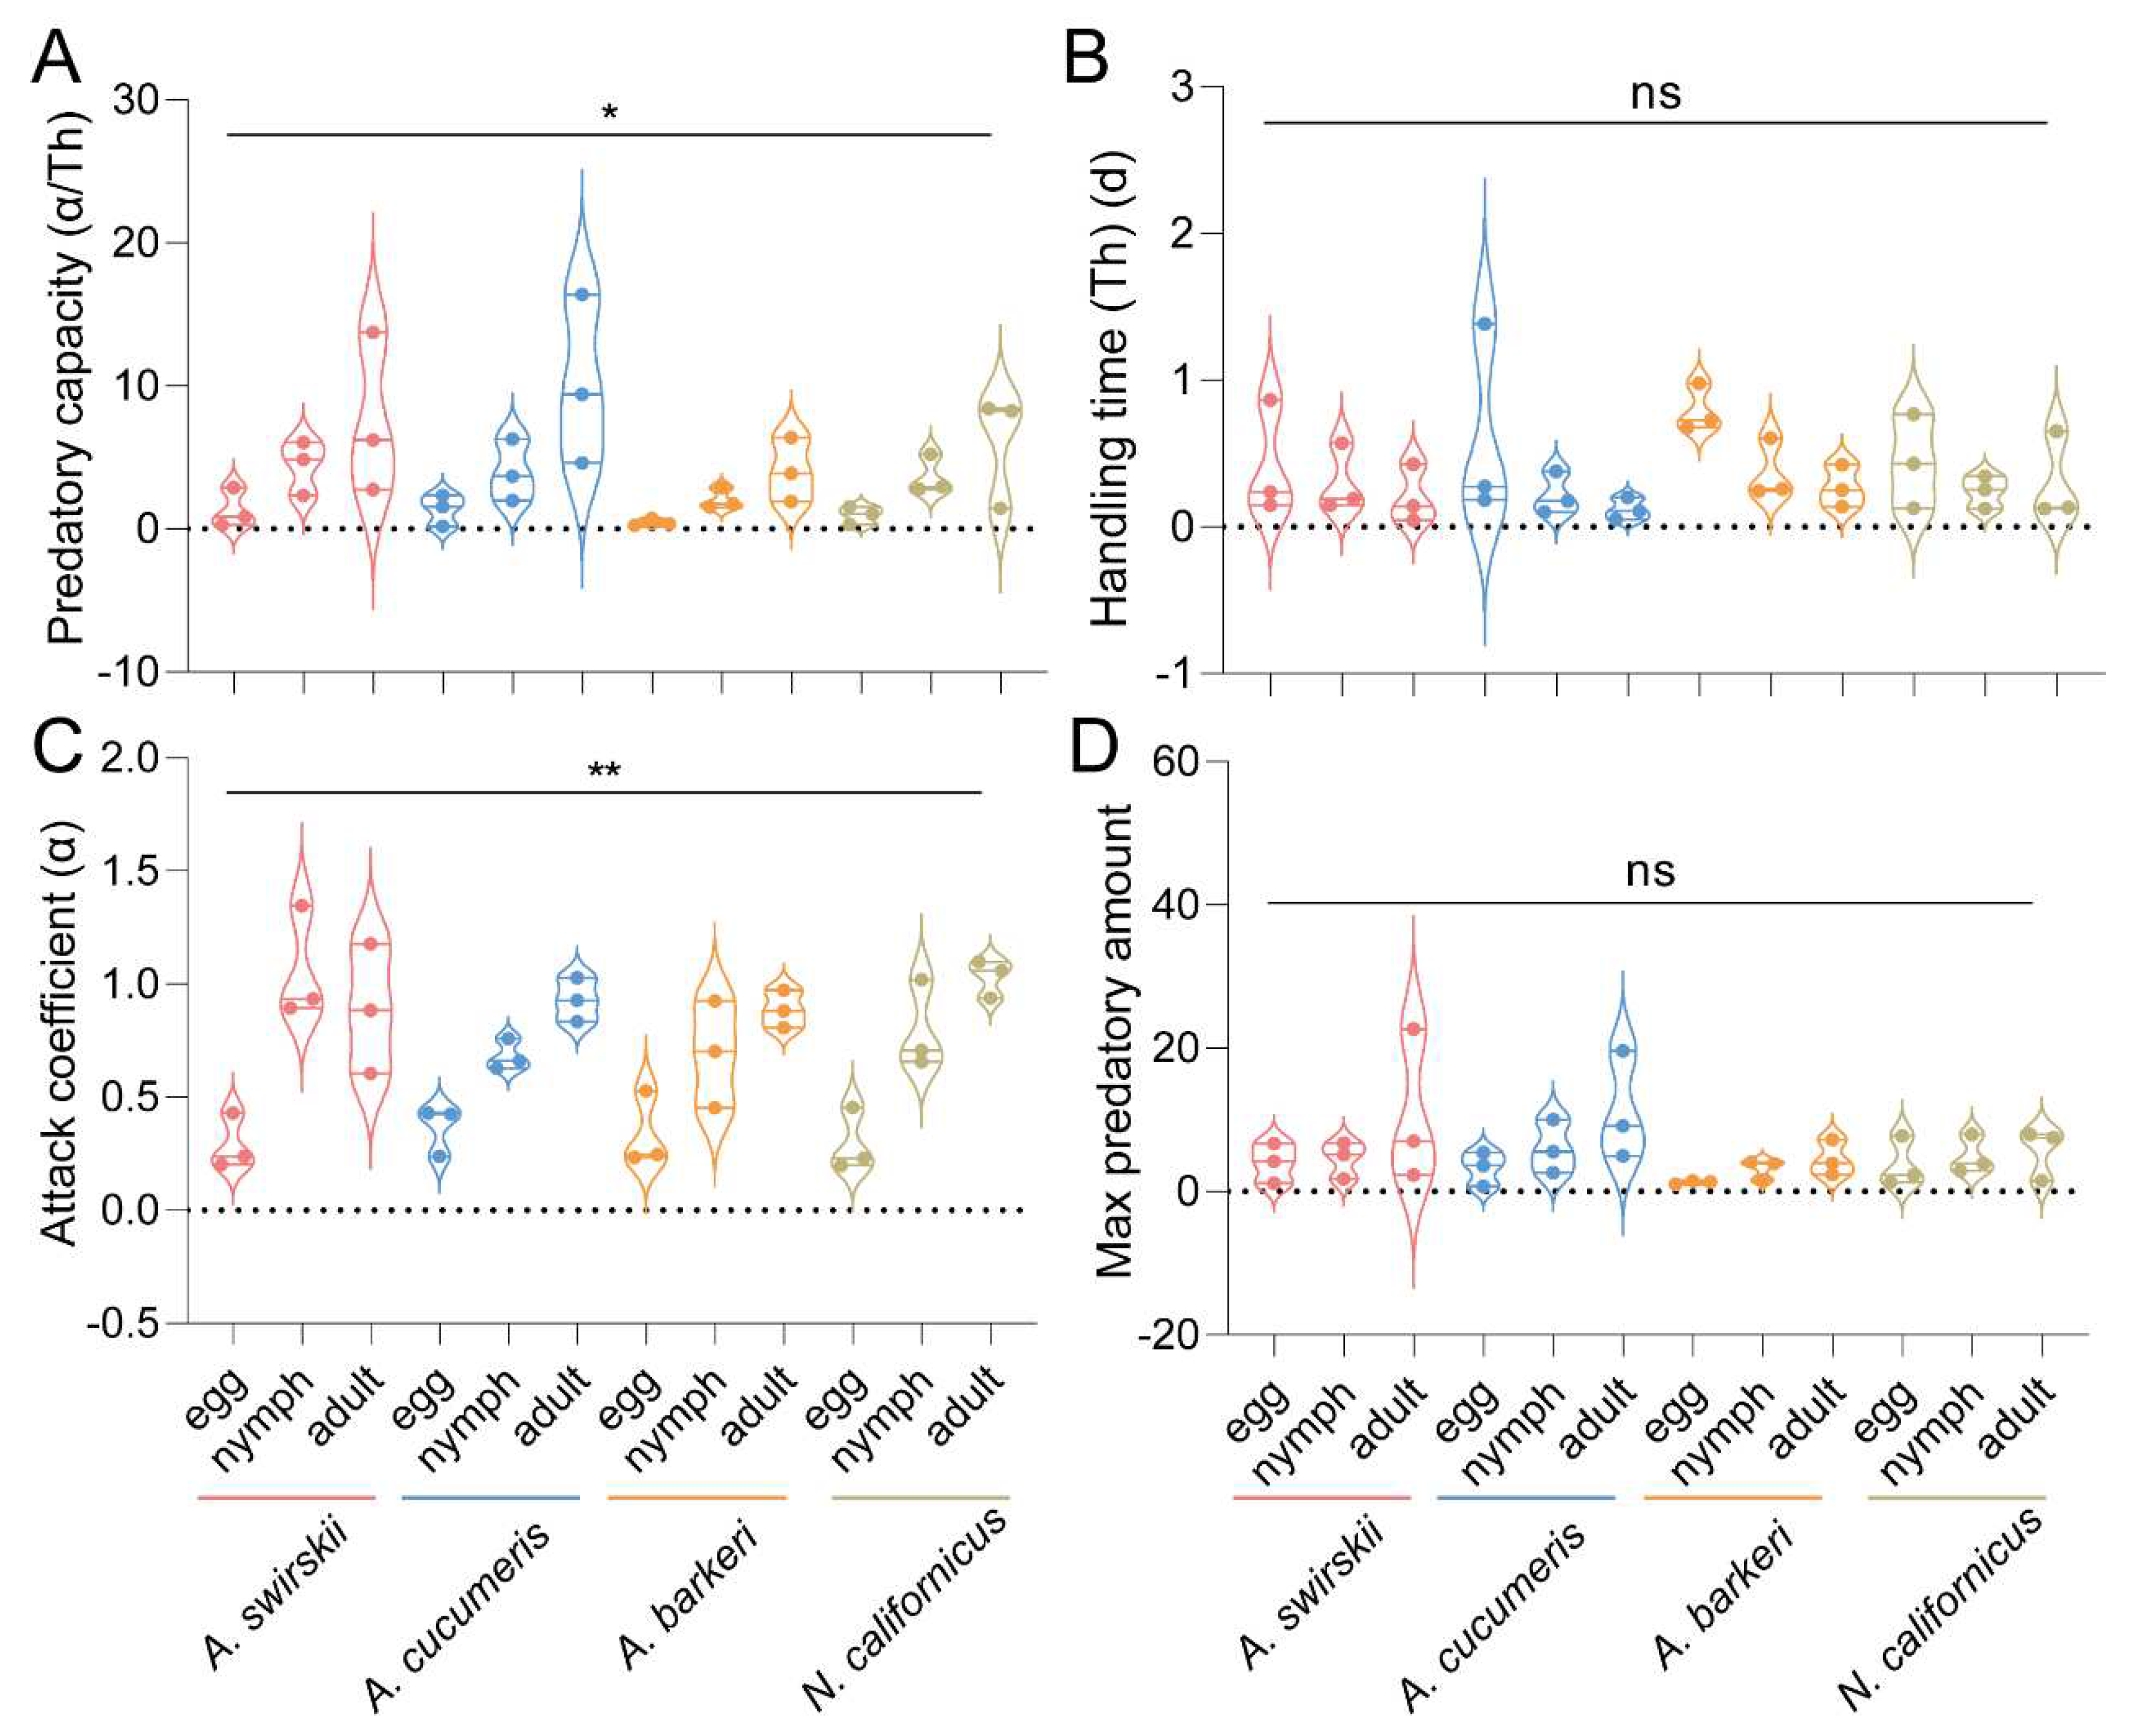
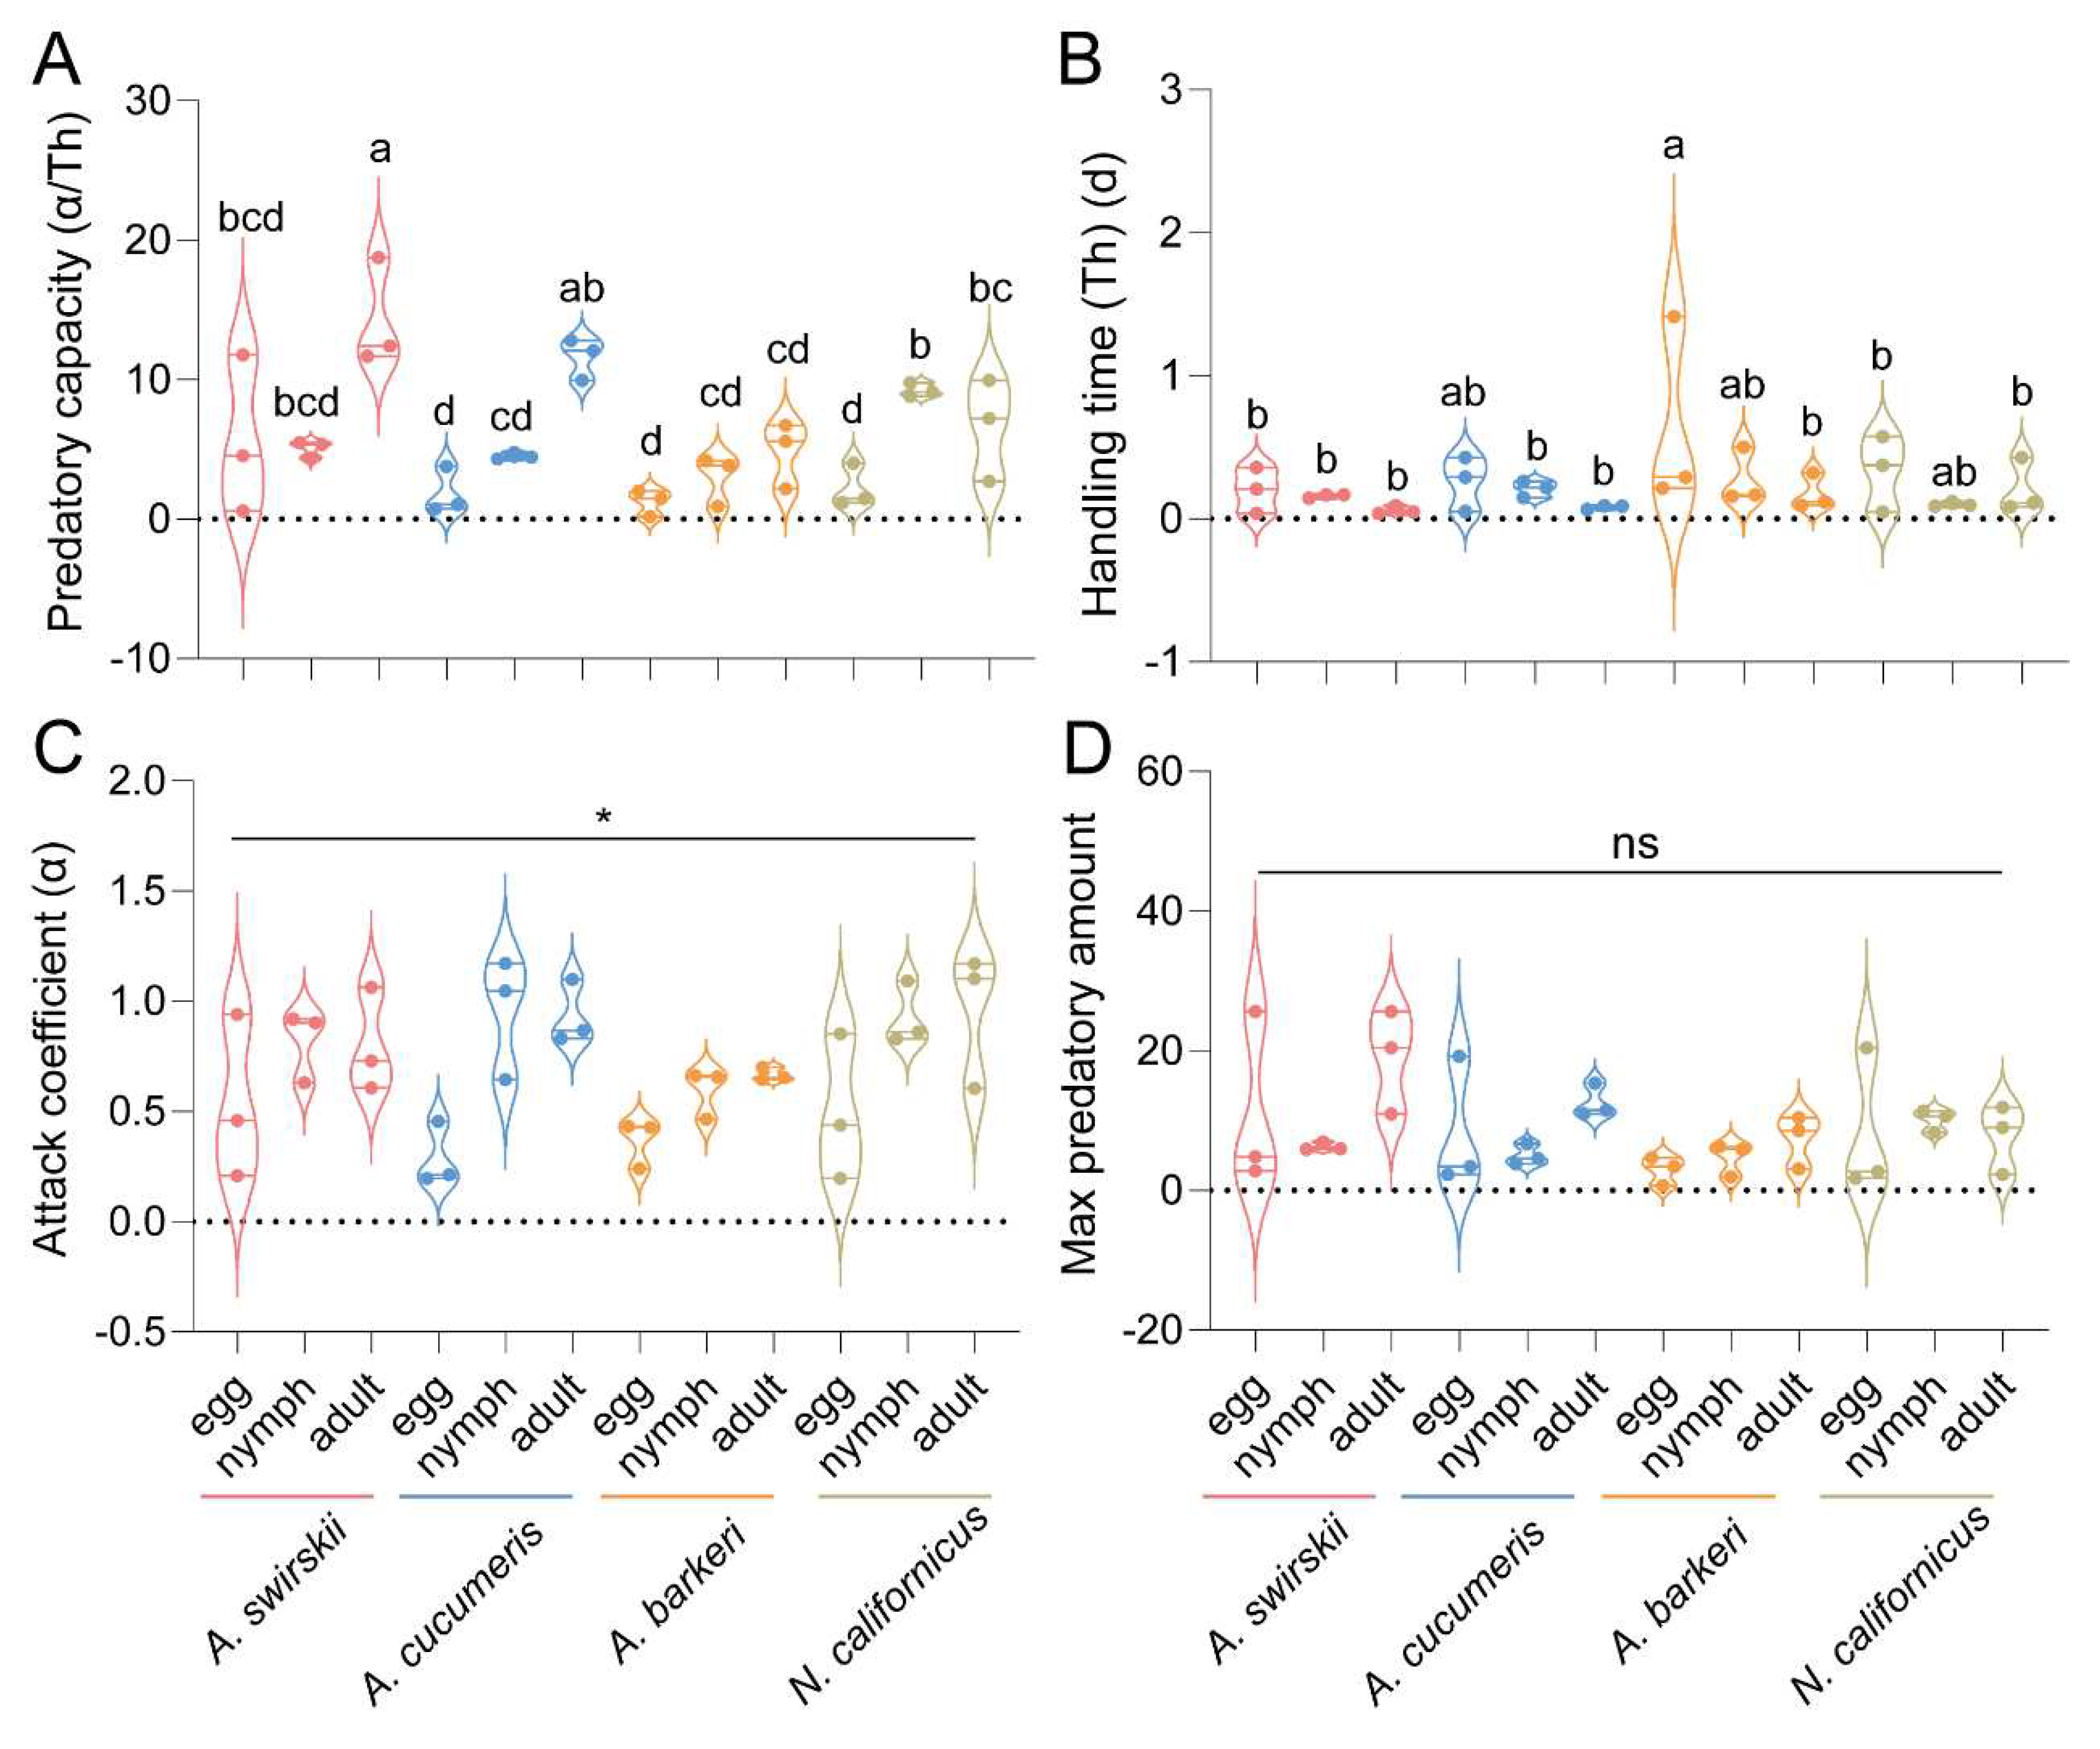
3.6. Four predatory species showed various functional responses at different developmental stages of two-spotted spider mites, whether at 1 d or 15 d after release
4. Discussion
Supplementary Materials
Author Contributions
Funding
Institutional Review Board Statement
Informed Consent Statement
Data Availability Statement
Acknowledgments
Conflicts of Interest
References
- Migeon, A.; Nouguier, E.; Dorkeld, F. Spider Mites Web: A comprehensive database for the Tetranychidae. Trends Acarol. 2011, 557–560. [Google Scholar]
- Van Leeuwen, T.; Tirry, L.; Yamamoto, A.; Nauen, R.; Dermauw, W. The economic importance of acaricides in the control of phytophagous mites and an update on recent acaricide mode of action research. Pestic. Biochem. Physiol. 2015, 121, 12–21. [Google Scholar] [CrossRef] [PubMed]
- Grbić, M.; Van Leeuwen, T.; Clark, R.M.; Rombauts, S.; Rouzé, P.; Grbić, V.; et al. The genome of Tetranychus urticae reveals herbivorous pest adaptations. Nature 2011, 479, 487–492. [Google Scholar] [CrossRef] [PubMed]
- Van Leeuwen, T.; Dermauw, W.; Grbic, M.; Tirry, L.; Feyereisen, R. Spider mite control and resistance management: Does a genome help? Pest Manag. Sci. 2013, 69, 156–159. [Google Scholar] [CrossRef] [PubMed]
- Ge, C.; Ding, X.L.; Zhang, J.P.; Hong, X.Y. Tetranychus urticae (green form) on Gossypium hirsutum in China: two records confirmed by aedeagus morphology and RFLP analysis. Syst. Appl. Acarol. 2013, 18, 239–244. [Google Scholar]
- Lu, W.; Wang, M.; Xu, Z.; Shen, G.; Wei, P.; Li, M.; Reid, W.; He, L. Adaptation of acaricide stress facilitates Tetranychus urticae expanding against Tetranychus cinnabarinus in China. Ecol Evol. 2017, 7, 1233–1249. [Google Scholar] [CrossRef]
- Dai, W.A.; Yang, J.; Luo, B.; Chen, H.Q.; Zhou, J.; Luo, Y.; Wang, Y.X. Regularity of outbreak and prevention of carmine spider mite in Tibet. Tibet Journal of Agricultural Sciences 2011, 33, 27–29. (in Chinese). [Google Scholar]
- Cock, M.J.W.; van Lenteren, J.C.; Brodeur, J.; Barratt, B.I.P.; Bigler, F.; Bolckmans, K.; Consoli, F.I.; Haas, F.; Mason, P.G.; Parra, J.R.P. Do new access and benefit sharing procedures under the convention on biological diversity threaten the future of biological control? Biocontrol 2010, 55, 199–218. [Google Scholar] [CrossRef]
- Calvo, F.J.; Knapp, M.; van Houten, Y.M.; Hoogerbrugge, H.; Belda, J.E. Amblyseius swirskii: what made this predatory mite such a successful biocontrol agent? Exp. Appl. Acarol. 2015, 65, 419–433. [Google Scholar] [CrossRef]
- McMurtry, J.A.; Croft, B.A. Life-styles of phytoseiid mites and their roles in biological control. Annu. Rev. Entomol. 1997, 42, 291–321. [Google Scholar] [CrossRef]
- Badii, M.H.; Hernández-Ortiz, E.; Flores, A.E.; Landeros, J. Prey stage preference and functional response of Euseius hibisci to Tetranychus urticae (Acari: Phytoseiidae, Tetranychidae). Exp. Appl. Acarol. 2004, 34, 263–273. [Google Scholar] [CrossRef] [PubMed]
- Blackwood, J.S.; Schausberger, P.; Croft, B.A. Prey-stage preference in generalist and specialist phytoseiid mites (Acari: Phytoseiidae) when offered Tetranychus urticae (Acari: Tetranychidae) eggs and larvae. Environ. Entomol. 2001, 30, 1103–1111. [Google Scholar] [CrossRef]
- Liburd, O.E.; White, J.C.; Rhodes, E.M.; Browdy, A.A. The residual and direct effects of reduced-risk and conventional miticides on two-spotted spider mites, Tetranychus urticae (Acari: Tetranychidae), and predatory mites (Acari: Phytoseiidae). Fla. Entomol. 2007, 90, 249–257. [Google Scholar] [CrossRef]
- Zheng, D.; Zhao, DS. Characteristics of natural environment of the Tibetan Plateau. Science and Technology Review 2017, 35, 13–22. (in Chinese). [Google Scholar]
- Cui, S.F.; Wang, L.; Qiu, J.P.; Liu, Z.C.; Geng, X.Q. Comparative metabolomics analysis of Callosobruchus chinensis larvae under hypoxia, hypoxia /hypercapnia and normoxia. Pest Manag. Sci. 2017, 73, 1267-1276. [Google Scholar] [CrossRef] [PubMed]
- Zhang, Z.Y.; Chen, B.; Zhao, D.J.; Kang, L. Functional modulation of mitochondrial cytochrome c oxidase underlies adaptation to high-altitude hypoxia in a Tibetan migratory locust. Proc. Royal Soc. B. 2013, 280, 20122758. [Google Scholar] [CrossRef] [PubMed]
- Liu, Y.; Zhao, H.; Luo, Q.; Yang, Y.; Zhang, G.; Zhou, Z.; Naeem, M.; An, J. De novo transcriptomic and metabolomic analyses reveal the ecological adaptation of high-altitude Bombus pyrosoma. Insects 2020, 11, 631. [Google Scholar] [CrossRef]
- Barber, A.; Campbell, C.A.M.; Crane, H.; Lilley, R.; Tregidga, E. Biocontrol of two-spotted spider mite Tetranychus urticae on dwarf hops by the phytoseiid mites Phytoseiulus persimilis and Neoseiulus californicus. Biocontrol Sci. Technol. 2003, 13, 275–284. [Google Scholar] [CrossRef]
- Fraulo, A.B.; McSorley, R.; Liburd, O.E. Effects of the biological control agent Neoseiulus californicus (Acari: Phytoseiidae) on arthropod community structures in north Florida strawberry fields. Fla. Entomol. 2008, 91, 336–345. [Google Scholar] [CrossRef]
- Elmoghazy, M.M.E.; El-Seidy, E.M.A.; Romeith, A.H.M. Integrated control of the two-spotted spider mite Tetranychus urticae Koch (Acari: Tetranychidae) on faba bean Vicia faba (L.) in an open field at Behaira Governorate, Egypt. Int. J. Environ. Sci. Eng. 2011, 2, 93–100. [Google Scholar]
- Escudero, L.A.; Ferragut, F. Life-history of Neoseiulus californicus and Phytoseiulus persimilis (Acari: Phytoseiidae) on four spider mite species as prey, with special reference to Tetranychus evansi (Acari: Tetranychidae). Biol. Control 2005, 32, 378–384. [Google Scholar] [CrossRef]
- Toldi, M.; Ferla, N.J.; Dameda, C.; Majelo, F. Biology of Neoseiulus californicus feeding on two-spotted spider mite. Biotemas. 26, 105–111. [CrossRef]
- McMurtry, J.A.; De Moraes, G.J.; Sourassou, N.F. Revision of the lifestyles of phytoseiid mites (Acari: Phytoseiidae) and implications for biological control strategies. Syst. Appl. Acarol. 2013, 18, 297–320. [Google Scholar] [CrossRef]
- Ovalle, T.M.; Vásquez-Ordóñez, A.A.; Jimenez, J.; Parsa, S.; Cuellar, W.J.; L opez-Lavalle, L.A.B. A simple PCR-based method for the rapid and accurate identification of spider mites (Tetranychidae) on cassava. Sci. Rep. 2020, 10, 19496. [Google Scholar] [CrossRef]
- Sun, B.; Zhang, Y.K.; Xue, X.F.; Li, Y.X.; Hong, X.Y. Effects of Wolbachia infection in Tetranychus urticae (Acari: Tetranychidae) on predation by Neoseiulus cucumeris (Acari: Phytoseiidae). Syst. Appl. Acarol. 2015, 20, 591–602. [Google Scholar]
- Holling, C.S. Some characteristics of simple types of predation and parasitism. Can. Entomol. 1959, 91, 385–398. [Google Scholar] [CrossRef]
- Ilias, A.; J. ; Tsagkarakou, V.A. Global distribution and origin of target site insecticide resistance mutations in Tetranychus urticae. Insect Biochem. Mol. Biol. 2014, 48, 17–28. [Google Scholar] [CrossRef]
- Wang, L.; Zhang, Y.J.; Xie, W.; Wu, Q.J.; Wang, S.L. A bioassay for evaluation of the resistance of Tetranychus urticae (Acari: Tetranychidae) to selected acaricides. Syst. Appl. Acarol. 2015, 20, 579–590. [Google Scholar]
- Kwon, D.H.; Song, D.Y.; Kang, S.; Ahn, J.J.; Lee, J.H.; Choi, B.R.; Lee, S.W.; Kim, J.H.; Lee, S.H. Residual contact vial bioassay for the on-site detection of acaricide resistance in the two-spotted spider mite. J. Asia-Pacific Entomol. 2010, 13, 333–337. [Google Scholar] [CrossRef]
- Xu, D.D.; He, Y.Y.; Zhang, Y.J.; Xie, W.; Wu, Q.J.; Wang, S.L. Status of pesticide resistance and associated mutations in the two-spotted spider mite, Tetranychus urticae, in China. Pestic. Biochem. Physiol. 2018, 150, 89–96. [Google Scholar] [CrossRef]
- Vassiliou, V.A.; Kitsis, P. Acaricide resistance in Tetranychus urticae (Acari: Tetranychidae) populations from Cyprus. J. Eco. Entomol. 2013, 106, 1848–1854. [Google Scholar] [CrossRef]
- Wang, X.G.; Xiang, X.; Yu, H.L.; Liu, S.H.; Yin, Y.; Cui, P.; Wu, Y.Q.; Yang, J.; Jiang, C.X.; Yang, Q.F. Monitoring and biochemical characterization of beta-cypermethrin resistance in Spodoptera exigua (Lepidoptera: Noctuidae) in Sichuan Province, China. Pestic. Biochem. Physiol. 2018, 146, 71–79. [Google Scholar] [CrossRef]
- Fan, R.Y.; Wang, B.H.; Zai, Q.; Wang, W.F.; Zhao, Y.Q.; Wei, Q.; et al. Composition and occurrence of wheat pests and green control technology in Tibet. Tibet Journal of Agricultural Science 2019, 41, 133–137. (in Chinese). [Google Scholar]
- 34. Deqingzhuoga, Xiang, D.; Nima, Y.Z.; Wang, Z.; Chen, H.Q. Study on the characteristics and green prevention and control technology of vegetable pests in plateau. Tibet Journal of Agricultural Science 2019, 4, 81–84. (in Chinese).
- Xiang, D.; Huang, H.J.; Wang, Z. ; Deqingzhuoga. Preliminary report on control effect of several predator mites on leaf mites of fruit trees. Tibet Journal of Agricultural Science 2019, 2, 39–42. (in Chinese). [Google Scholar]
- Atkinson, D.; Sibly, R.M. Why are organisms usually bigger in colder environments? Making sense of a life history puzzle. Trends. Ecol. Evol. 1997, 12, 235–239. [Google Scholar] [CrossRef]
- Dahlhoff, E.P.; Dahlhoff, V.C.; Grainger, C.A.; Zavala, N.A.; Otepola-Bello, D.; Sargent, B.A.; Roberts, K.T.; Heidl, S.J.; Smiley, J.T.; Rank, N.E. Getting chased up the mountain: High elevation may limit performance and fitness characters in a montane insect. Funct. Ecol. 2019, 33, 809–818. [Google Scholar] [CrossRef]
- Gaston, K.J.; Chown, S.L.; Evans, K.L. Ecogeographical rules: Elements of a synthesis. J. Biogeogr. 2008, 35, 483–500. [Google Scholar] [CrossRef]
- Greenslade, A.F.C.; Chapman, J.W.; Reynolds, D.R. High-altitude migration of Psylloidea (Hemiptera) over England. Entomol. Gaz. 2021, 72, 189–198. [Google Scholar] [CrossRef]
- McCulloch, G.A.; Waters, J.M. Does wing reduction influence the relationship between altitude and insect body size? A case study using New Zealand's diverse stonefly fauna. Ecol. Evol. 2018, 8, 953–960. [Google Scholar] [CrossRef]
- Dahlhoff, E.P.; Dahlhoff, V.C.; Grainger, C.A.; Zavala, N.A.; Otepola-Bello, D.; Sargent, B.A.; Roberts, K.T.; Heidl, S.J.; Smiley, J.T.; Rank, N.E. Getting chased up the mountain: High elevation may limit performance and fitness characters in a montane insect. Funct. Ecol. 2019, 33, 809–818. [Google Scholar] [CrossRef]
- Guo, Y.; Lv, J.; Jiang, X.; Wang, B.; Gao, Y.; Wang, E.; Xu, X. Intraguild predation between Amblyseius swirskii and two native Chinese predatory mite species and their development on intraguild prey. Sci Rep. 2016, 6, 22992. [Google Scholar] [CrossRef]
- Midthassel, A.; Leather, S.R.; Wright, D.J.; Baxter, I.H. Compatibility of Amblyseius swirskii with Beauveria bassiana: two potentially complimentary biocontrol agents. BioControl 2016, 61, 437–447. [Google Scholar] [CrossRef]
- Khanamani, M.; Fathipour, Y.; Talebi, A.A.; Mehrabadi, M. Linking pollen quality and performance of Neoseiulus californicus (Acari: Phytoseiidae) in two-spotted spider mite management programmes. Pest Manag. Sci. 2017, 73, 452–461. [Google Scholar] [CrossRef]
- Maroufpoor, M.; Ghoosta, Y.; Pourmirza, A.A. Life table parameters of Neoseiulus californicus (Acari: Phytoseiidae), on the European red mite, Panonychus ulmi (Acari: Tetranychidae) in laboratory condition. Persian J. Acarol. 2013, 2, 265–276. [Google Scholar]
- Rahmani, H.; Fathipour, Y.; Kamali, K. Life history and population growth parameters of Neoseiulus californicus (Acari: Phytoseiidae) fed on Thrips tabaci (Thysanoptera: Thripidae) in laboratory conditions. Syst. Appl. Acarol. 2009, 14, 91–100. [Google Scholar] [CrossRef]
- Ghazy, N.A.; Suzuki, T.; Amano, H. Development and reproduction of Neoseiulus californicus (Acari: Phytoseiidae) and Tetranychus urticae (Acari: Tetranychidae) under simulated natural temperature. Environ. Entomol. 2018, 47, 1005–1012. [Google Scholar] [CrossRef]
- Marafeli, P.P.; Reis, P.R.; Silveira, E.C.; Souza-Pimentel, G.C.; de Toledo, M.A. Life history of Neoseiulus californicus (McGregor, 1954) (Acari: Phytoseiidae) fed with castor bean (Ricinus communis L.) pollen in laboratory conditions. Braz, J, Biol. 2014, 74, 691–697. [Google Scholar] [CrossRef]
- Greco, N.M.; Sánchez, N.E.; Liljesthröm, G.G. Neoseiulus Californicus (Acari: Phytoseiidae) as a potential control agent of Tetranychus urticae (Acari: Tetranychidae): effect of pest/predator ratio on pest abundance on strawberry. Exp. Appl. Acarol. 2005, 37, 57–66. [Google Scholar] [CrossRef] [PubMed]
- Olaniyi, O.G.; Rhodes, E.M.; Chase, C.A.; Liburd, O.E. The effect of summer cover crops and strawberry cultivars on the two-spotted spider mite, Tetranychus urticae (Acari: Tetranychidae) and the predatory mite, Neoseiulus californicus (Acari: Phytoseidae) in organic strawberry production systems in Florida. J. Econ. Entomol. 2021, 114, 2135–2146. [Google Scholar] [CrossRef]
- Vangansbeke, D.; Nguyen, D.T.; Audenaert, J.; Verhoeven, R.; Gobin, B.; Tirry, L.; Clercq, P.D. Prey consumption by phytoseiid spider mite predators as affected by diurnal temperature variations. BioControl 2015, 60, 595–603. [Google Scholar] [CrossRef]


| Predatory mite species |
Tetranychus urticae (green) stage |
Functional response model (Na=) |
R2 | Chi-sqaure value |
|---|---|---|---|---|
| Amblyseius swirskii | adult | 0.238N0/(1+0.206 N0) | 0.992 | 28.547 |
| nymph | 1.346 N0/(1+0.751 N0) | 0.751 | 16.336 | |
| egg | 1.178 N0/(1+0.506 N0) | 0.767 | 17.043 | |
| Amblyseius cucumeris | adult | 0.238 N0/(1+0.329 N0) | 0.783 | 17.794 |
| nymph | 0.759 N0/(1+0.289 N0) | 0.925 | 24.793 | |
| egg | 0.928 N0/(1+0.186 N0) | 0.922 | 24.672 | |
| Amblyseius barkeri | adult | 0.246 N0/(1+0.241 N0) | 0.988 | 28.335 |
| nymph | 0.925 N0/(1+0.561 N0) | 0.873 | 22.091 | |
| egg | 0.808 N0/(1+0.343 N0) | 0.879 | 22.382 | |
| Neoseiulus californicus | adult | 0.246 N0/(1+0.241 N0) | 0.985 | 28.145 |
| nymph | 0.925 N0/(1+0.561 N0) | 0.965 | 27.032 | |
| egg | 0.808 N0/(1+0.343 N0) | 0.826 | 19.776 |
| Predatory mite species |
Tetranychus urticae (green) stage |
Functional response model (Na=) |
R2 | Chi-sqaure value |
|---|---|---|---|---|
| Amblyseius swirskii | adult | 0.204N/(1+0.048N) | 0.977 | 27.677 |
| nymph | 0.894N/(1+0.132N) | 0.893 | 23.111 | |
| egg | 0.605N/(1+0.027N) | 0.965 | 27.033 | |
| Amblyseius cucumeris | adult | 0.430N/(1+0.079N) | 0.963 | 26.894 |
| nymph | 0.629N/(1+0.063N) | 0.963 | 26.887 | |
| egg | 0.835N/(1+0.043N) | 0.986 | 28.169 | |
| Amblyseius barkeri | adult | 0.235N/(1+0.160N) | 0.978 | 27.745 |
| nymph | 0.453N/(1+0.117N) | 0.949 | 26.092 | |
| egg | 0.973N/(1+0.244N) | 0.875 | 22.189 | |
| Neoseiulus californicus | adult | 0.199N/(1+0.026N) | 0.973 | 27.444 |
| nymph | 1.020N/(1+0.352N) | 0.760 | 16.744 | |
| egg | 1.098N/(1+0.146N) | 0.912 | 24.111 |
| Predatory mite species |
Tetranychus urticae (green) stage |
Functional response model (Na=) |
R2 | Chi-sqaure value |
|---|---|---|---|---|
| Amblyseius swirskii | adult | 0.431N/(1+0.064N) | 0.961 | 26.774 |
| nymph | 0.935N/(1+0.180N) | 0.941 | 25.690 | |
| egg | 0.885N/(1+0.126N) | 0.946 | 25.925 | |
| Amblyseius cucumeris | adult | 0.426N/(1+0.117N) | 0.916 | 24.335 |
| nymph | 0.662N/(1+0.118N) | 0.907 | 23.869 | |
| egg | 1.028N/(1+0.112N) | 0.920 | 24.533 | |
| Amblyseius barkeri | adult | 0.529N/(1+0.385N) | 0.886 | 22.573 |
| nymph | 0.703N/(1+0.172N) | 0.914 | 24.212 | |
| egg | 0.882N/(1+0.122N) | 0.940 | 25.616 | |
| Neoseiulus californicus | adult | 0.445N/(1+0.196N) | 0.919 | 24.501 |
| nymph | 0.657N/(1+0.083N) | 0.934 | 25.321 | |
| egg | 1.059N/(1+0.133N) | 0.917 | 24.369 |
| Predatory mite species | Tetranychus urticae (green) | Functional response equation | R2 | Chi-sqaure value |
|---|---|---|---|---|
| Amblyseius swirskii | adult | 0.209N/(1+0.075N) | 0.982 | 27.993 |
| nymph | 0.631N/(1+0.091N) | 0.939 | 25.573 | |
| egg | 1.064N/(1+0.097N) | 0.929 | 25.036 | |
| Amblyseius cucumeris | adult | 0.214N/(1+0.063N) | 0.995 | 28.684 |
| nymph | 0.645N/(1+0.096N) | 0.915 | 24.256 | |
| egg | 0.867N/(1+0.075N) | 0.979 | 27.810 | |
| Amblyseius barkeri | adult | 0.240N/(1+0.340N) | 0.784 | 17.827 |
| nymph | 0.466N/(1+0.234N) | 0.899 | 23.455 | |
| adult | 0.701N/(1+0.225N) | 0.914 | 24.222 | |
| Neoseiulus californicus | adult | 0.853N/(1+0.491N) | 0.844 | 20.699 |
| nymph | 1.093N/(1+0.131N) | 0.921 | 24.613 | |
| adult | 1.170N/(1+0.503N) | 0.820 | 19.477 |
| Predatory mite species | Tetranychus urticae (green) | Functional response equation | R2 | Chi-sqaure value |
|---|---|---|---|---|
| Amblyseius swirskii | adult | 0.459N/(1+0.018N) | 0.913 | 24.517 |
| nymph | 0.919N/(1+0.154N) | 0.934 | 25.315 | |
| egg | 0.731N/(1+0.029N) | 0.930 | 25.067 | |
| Amblyseius cucumeris | adult | 0.196N/(1+0.010N) | 0.968 | 27.169 |
| nymph | 1.171N/(1+0.308N) | 0.821 | 19.563 | |
| egg | 1.099N/(1+0.100N) | 0.977 | 27.654 | |
| Amblyseius barkeri | adult | 0.428N/(1+0.092N) | 0.956 | 26.504 |
| nymph | 0.663N/(1+0.105N) | 0.930 | 25.101 | |
| adult | 0.644N/(1+0.062N) | 0.939 | 25.545 | |
| Neoseiulus californicus | adult | 0.197N/(1+0.010N) | 0.963 | 26.912 |
| nymph | 0.861N/(1+0.076N) | 0.988 | 28.329 | |
| adult | 1.104N/(1+0.123N) | 0.898 | 23.367 |
| Predatory mite species | Tetranychus urticae (green) | Functional response equation | R2 | Chi-sqaure value |
|---|---|---|---|---|
| Amblyseius swirskii | adult | 0.940N/(1+0.195N) | 0.918 | 24.449 |
| nymph | 0.903N/(1+0.153N) | 0.917 | 24.385 | |
| egg | 0.608N/(1+0.030N) | 0.947 | 26.031 | |
| Amblyseius cucumeris | adult | 0.455N/(1+0.195N) | 0.910 | 24.001 |
| nymph | 1.046N/(1+0.228N) | 0.852 | 21.062 | |
| egg | 0.833N/(1+0.054N) | 0.950 | 26.173 | |
| Amblyseius barkeri | adult | 0.432N/(1+0.126N) | 0.927 | 24.914 |
| nymph | 0.657N/(1+0.112N) | 0.959 | 26.676 | |
| adult | 0.653N/(1+0.076N) | 0.907 | 23.858 | |
| Neoseiulus californicus | adult | 0.438N/(1+0.164N) | 0.913 | 24.186 |
| nymph | 0.830N/(1+0.078N) | 0.903 | 23.628 | |
| adult | 0.605N/(1+0.051N) | 0.864 | 21.650 |
Disclaimer/Publisher’s Note: The statements, opinions and data contained in all publications are solely those of the individual author(s) and contributor(s) and not of MDPI and/or the editor(s). MDPI and/or the editor(s) disclaim responsibility for any injury to people or property resulting from any ideas, methods, instructions or products referred to in the content. |
© 2023 by the authors. Licensee MDPI, Basel, Switzerland. This article is an open access article distributed under the terms and conditions of the Creative Commons Attribution (CC BY) license (http://creativecommons.org/licenses/by/4.0/).


