Submitted:
12 December 2023
Posted:
13 December 2023
You are already at the latest version
Abstract
Keywords:
1. Introduction
2. Compressive strength of CRC
3. Experimental Investigation
3.1. Materials
3.1.1. Concrete
3.1.2. Textile CFRP reinforcement
3.2. Test setup and procedure
- Test specimens
- Test series
3.3. Instrumentation
4. Results and discussion
4.1. Uniaxial compressive tests
4.2. Biaxial compression-tension tests
4.2.1. Phenomenology
- Influence of transverse tension on compressive strength
- Difference in tensile strain between concrete and yarn
4.2.2. Sequential / proportional loading
4.2.3. Influence of concrete cover and position of CFRP grids in cross section
4.2.4. Influence of reinforcement ratio
4.2.5. Influence of skewed reinforcement
5. Constitutive law

6. Conclusion and outlook
- -
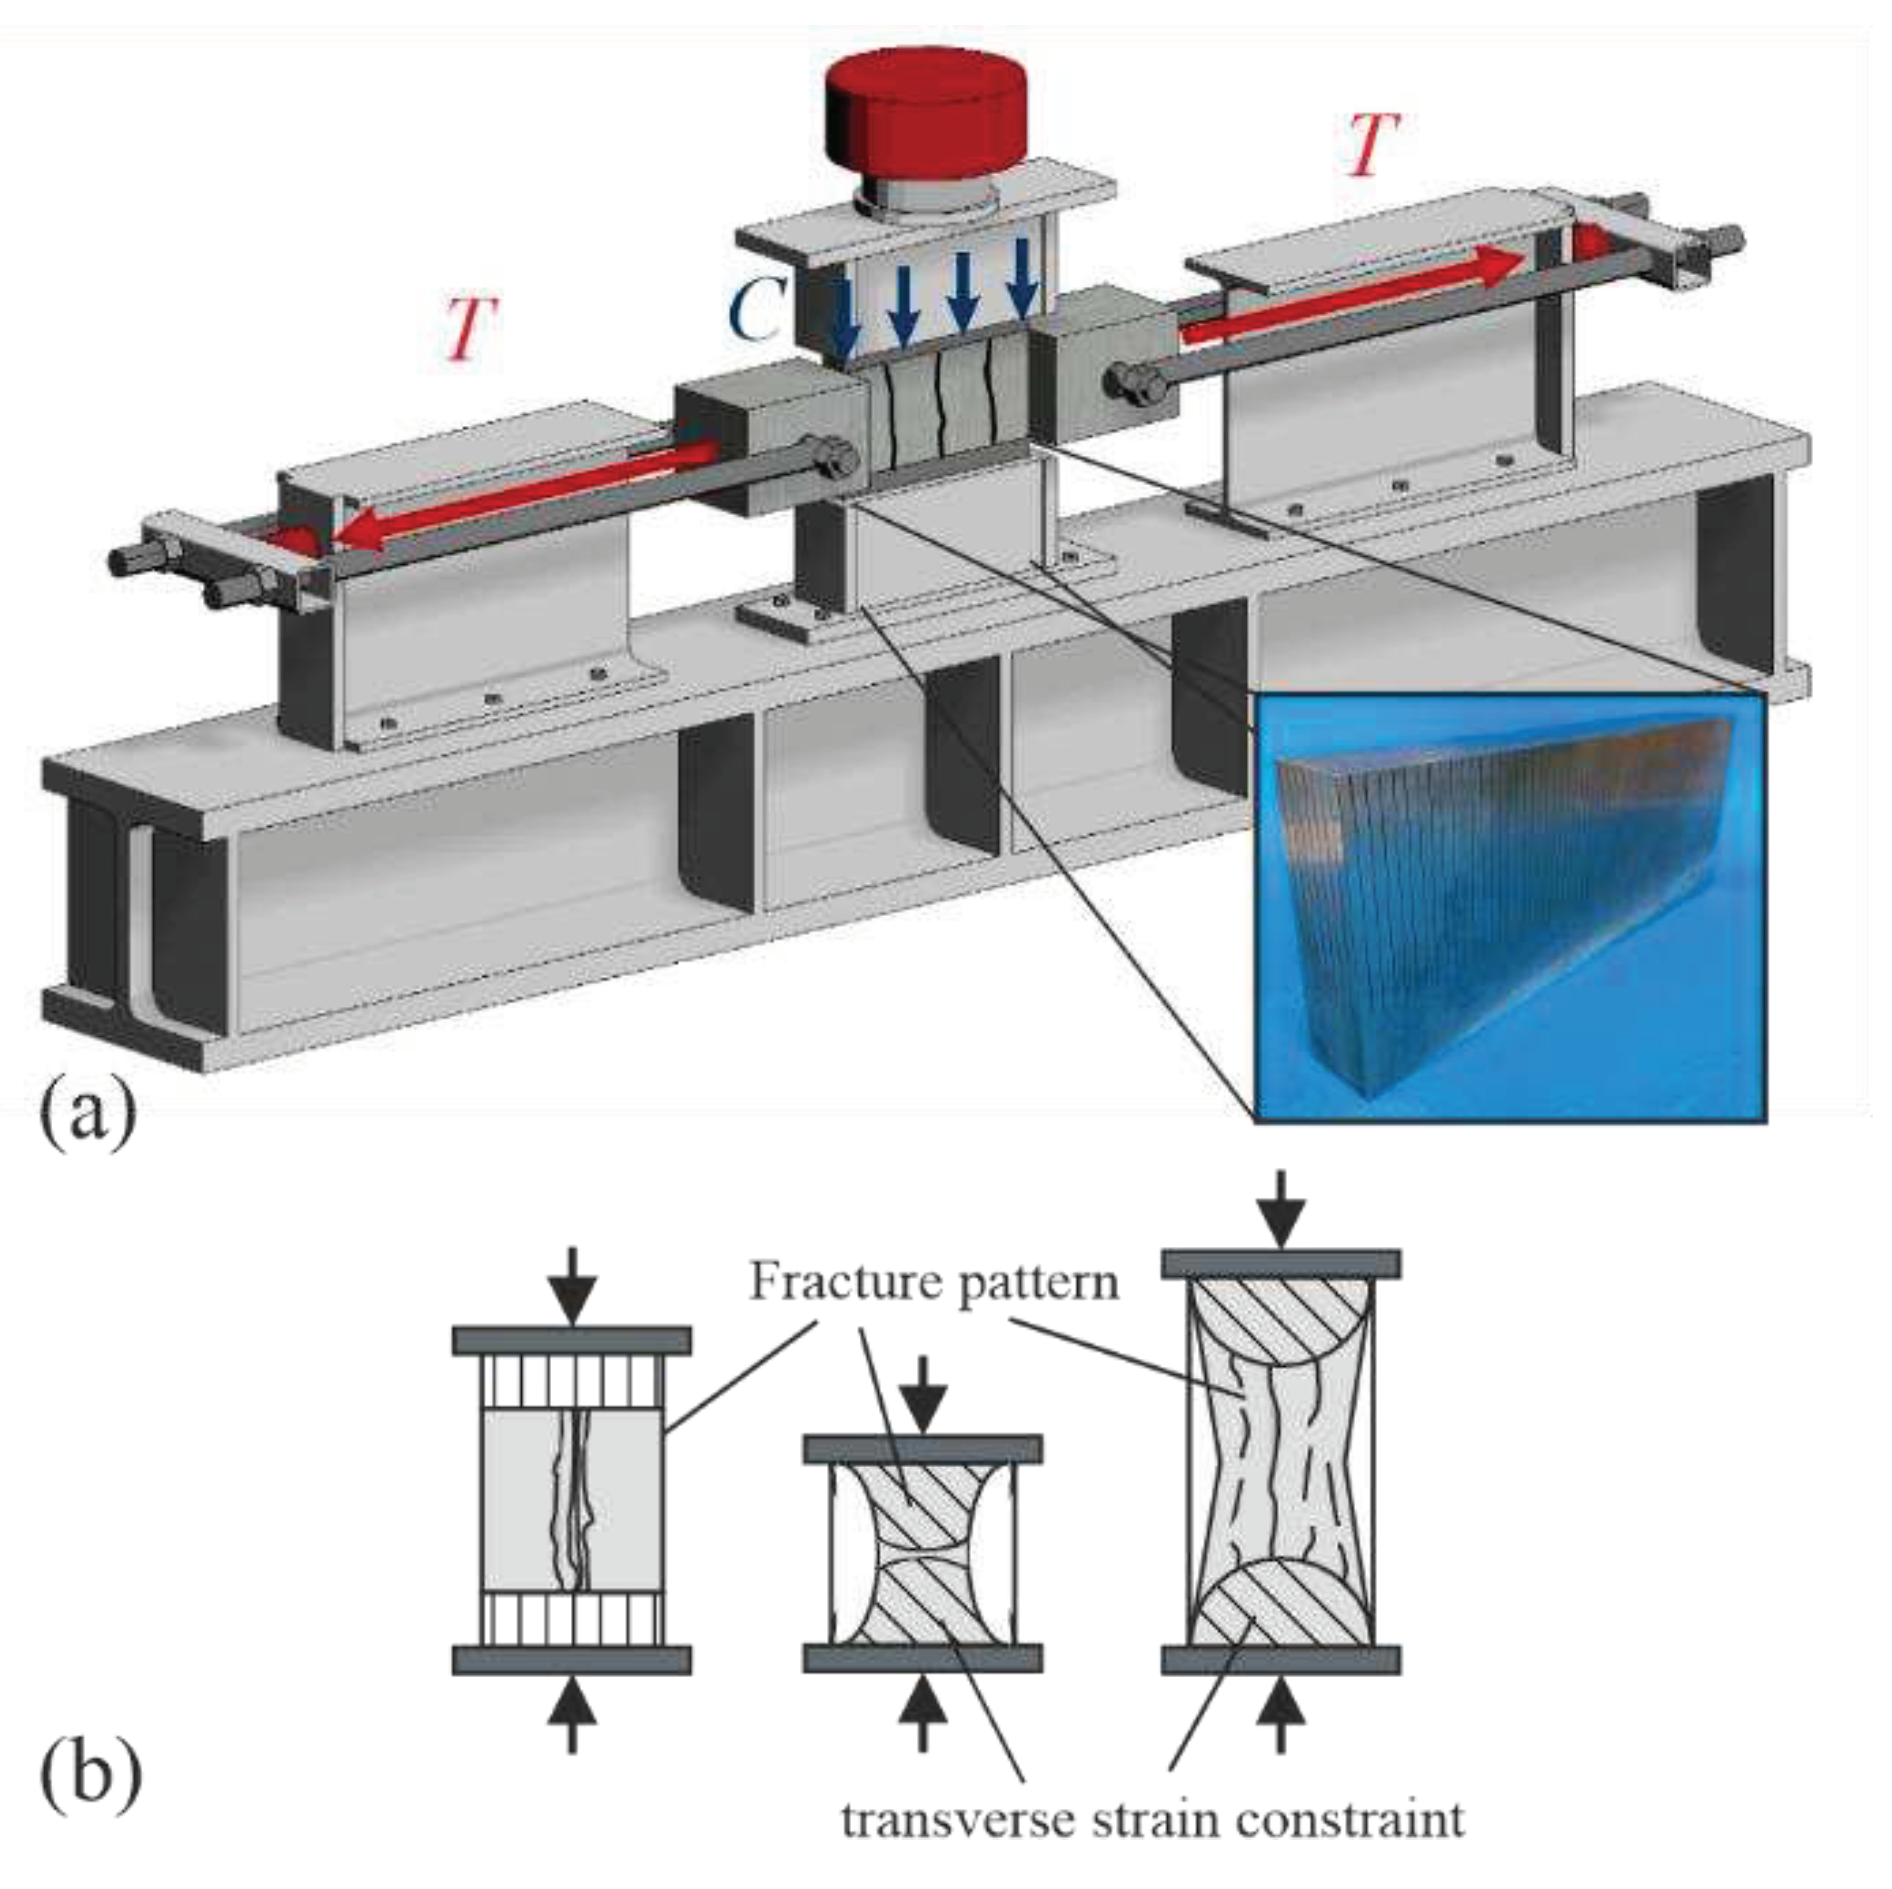
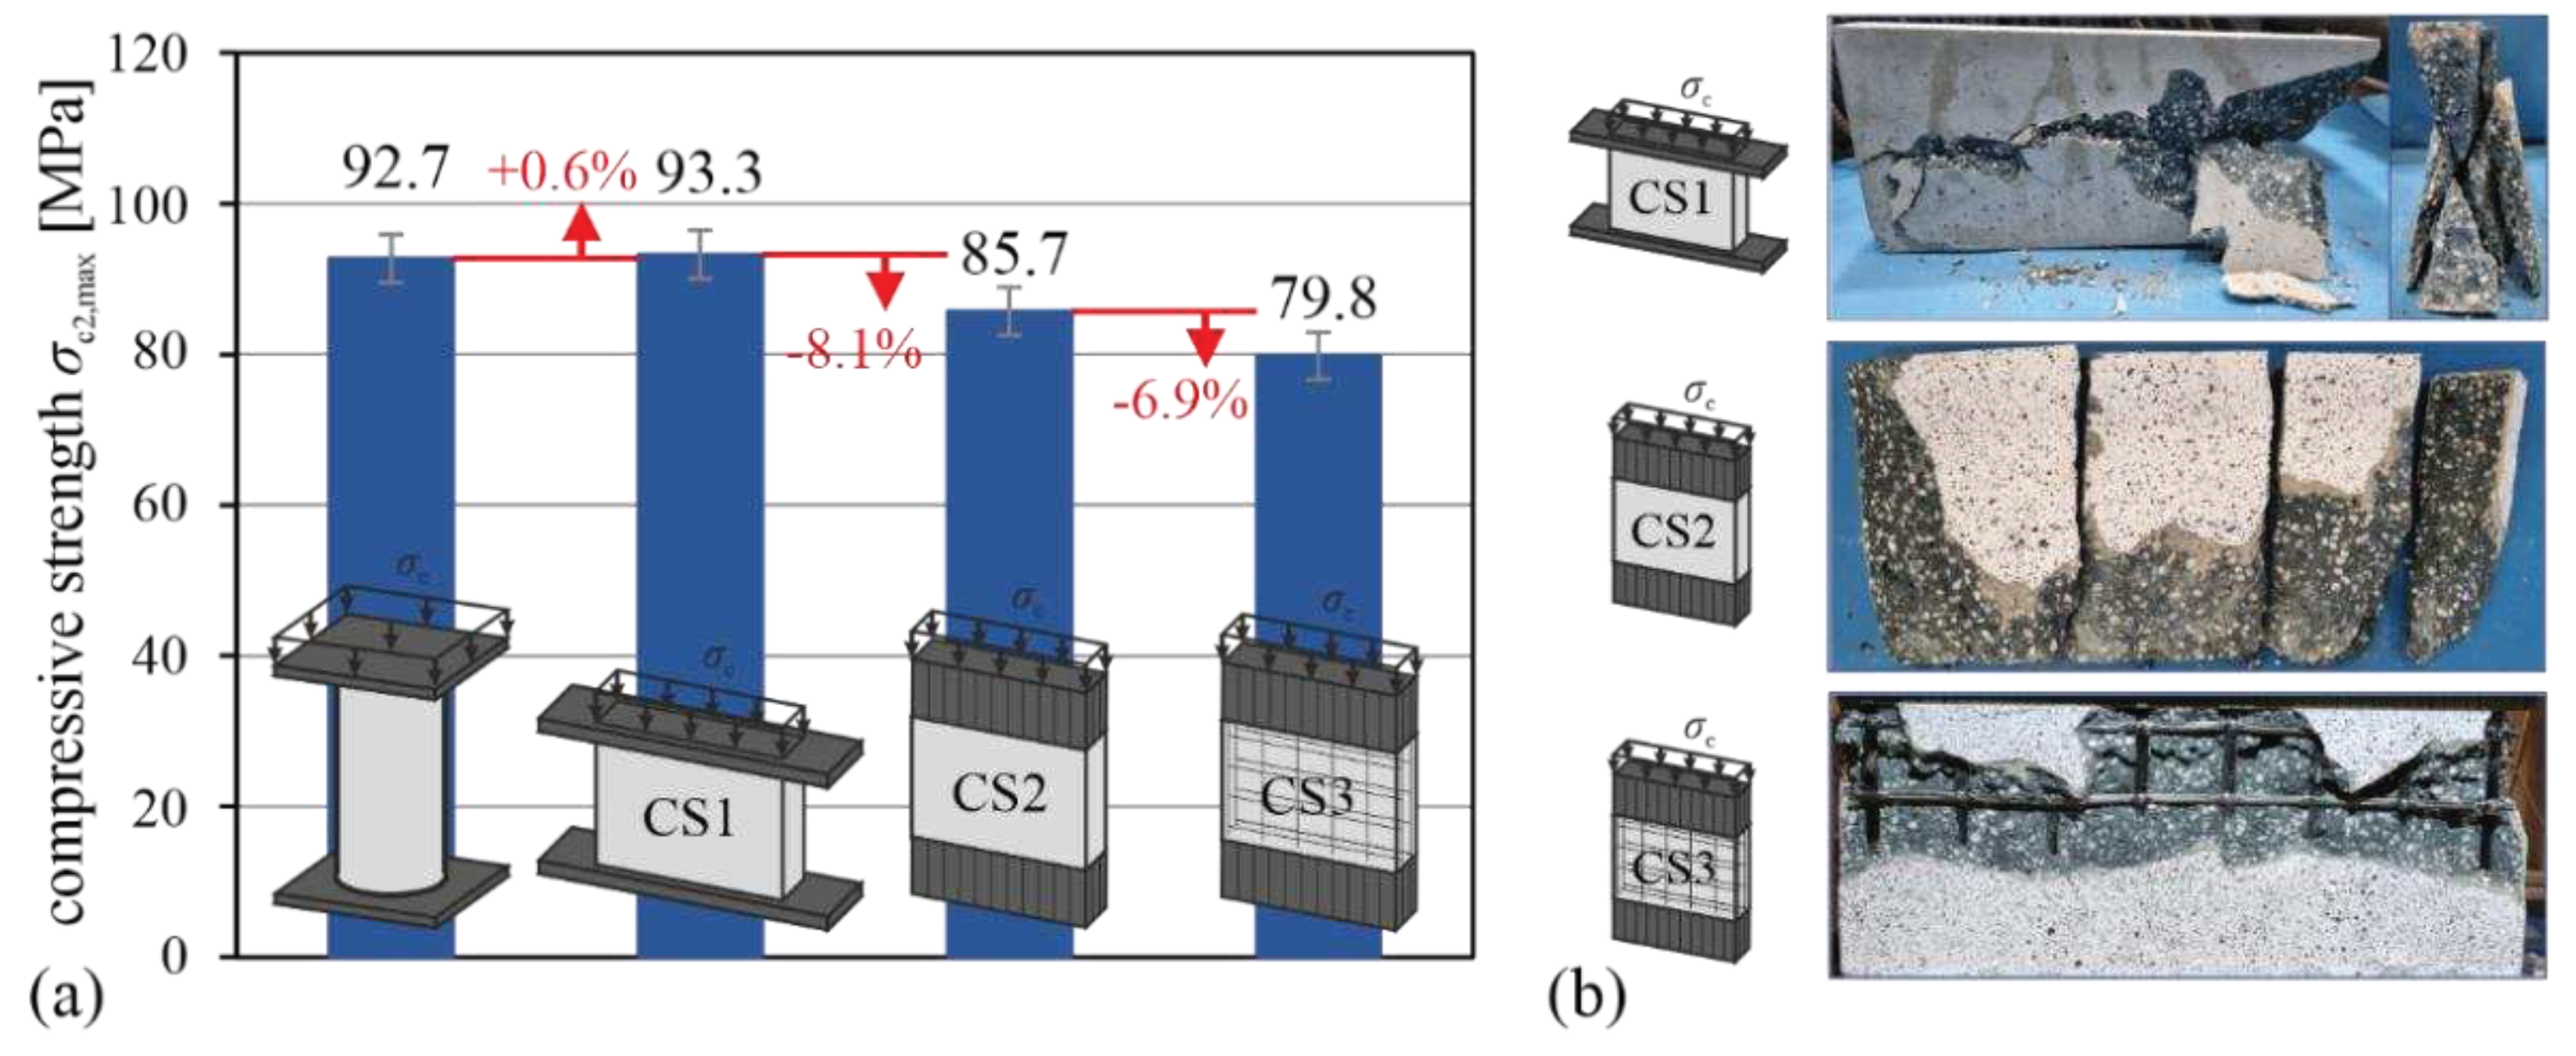
- In contrast to the biaxial loading test setups reported in literature, brush bearing platens were used to apply the compressive load, resulting in a reduced uniaxial compressive strength compared to panels loaded with conventional steel plates, and a significantly different fracture pattern due to the reduced lateral restraint.
- -
- The presence of the CFRP reinforcements, which are sensitive to lateral pressure and have reduced transverse Young’s modulus compared to concrete, resulted in a reduction of uniaxial compressive strength.
- -
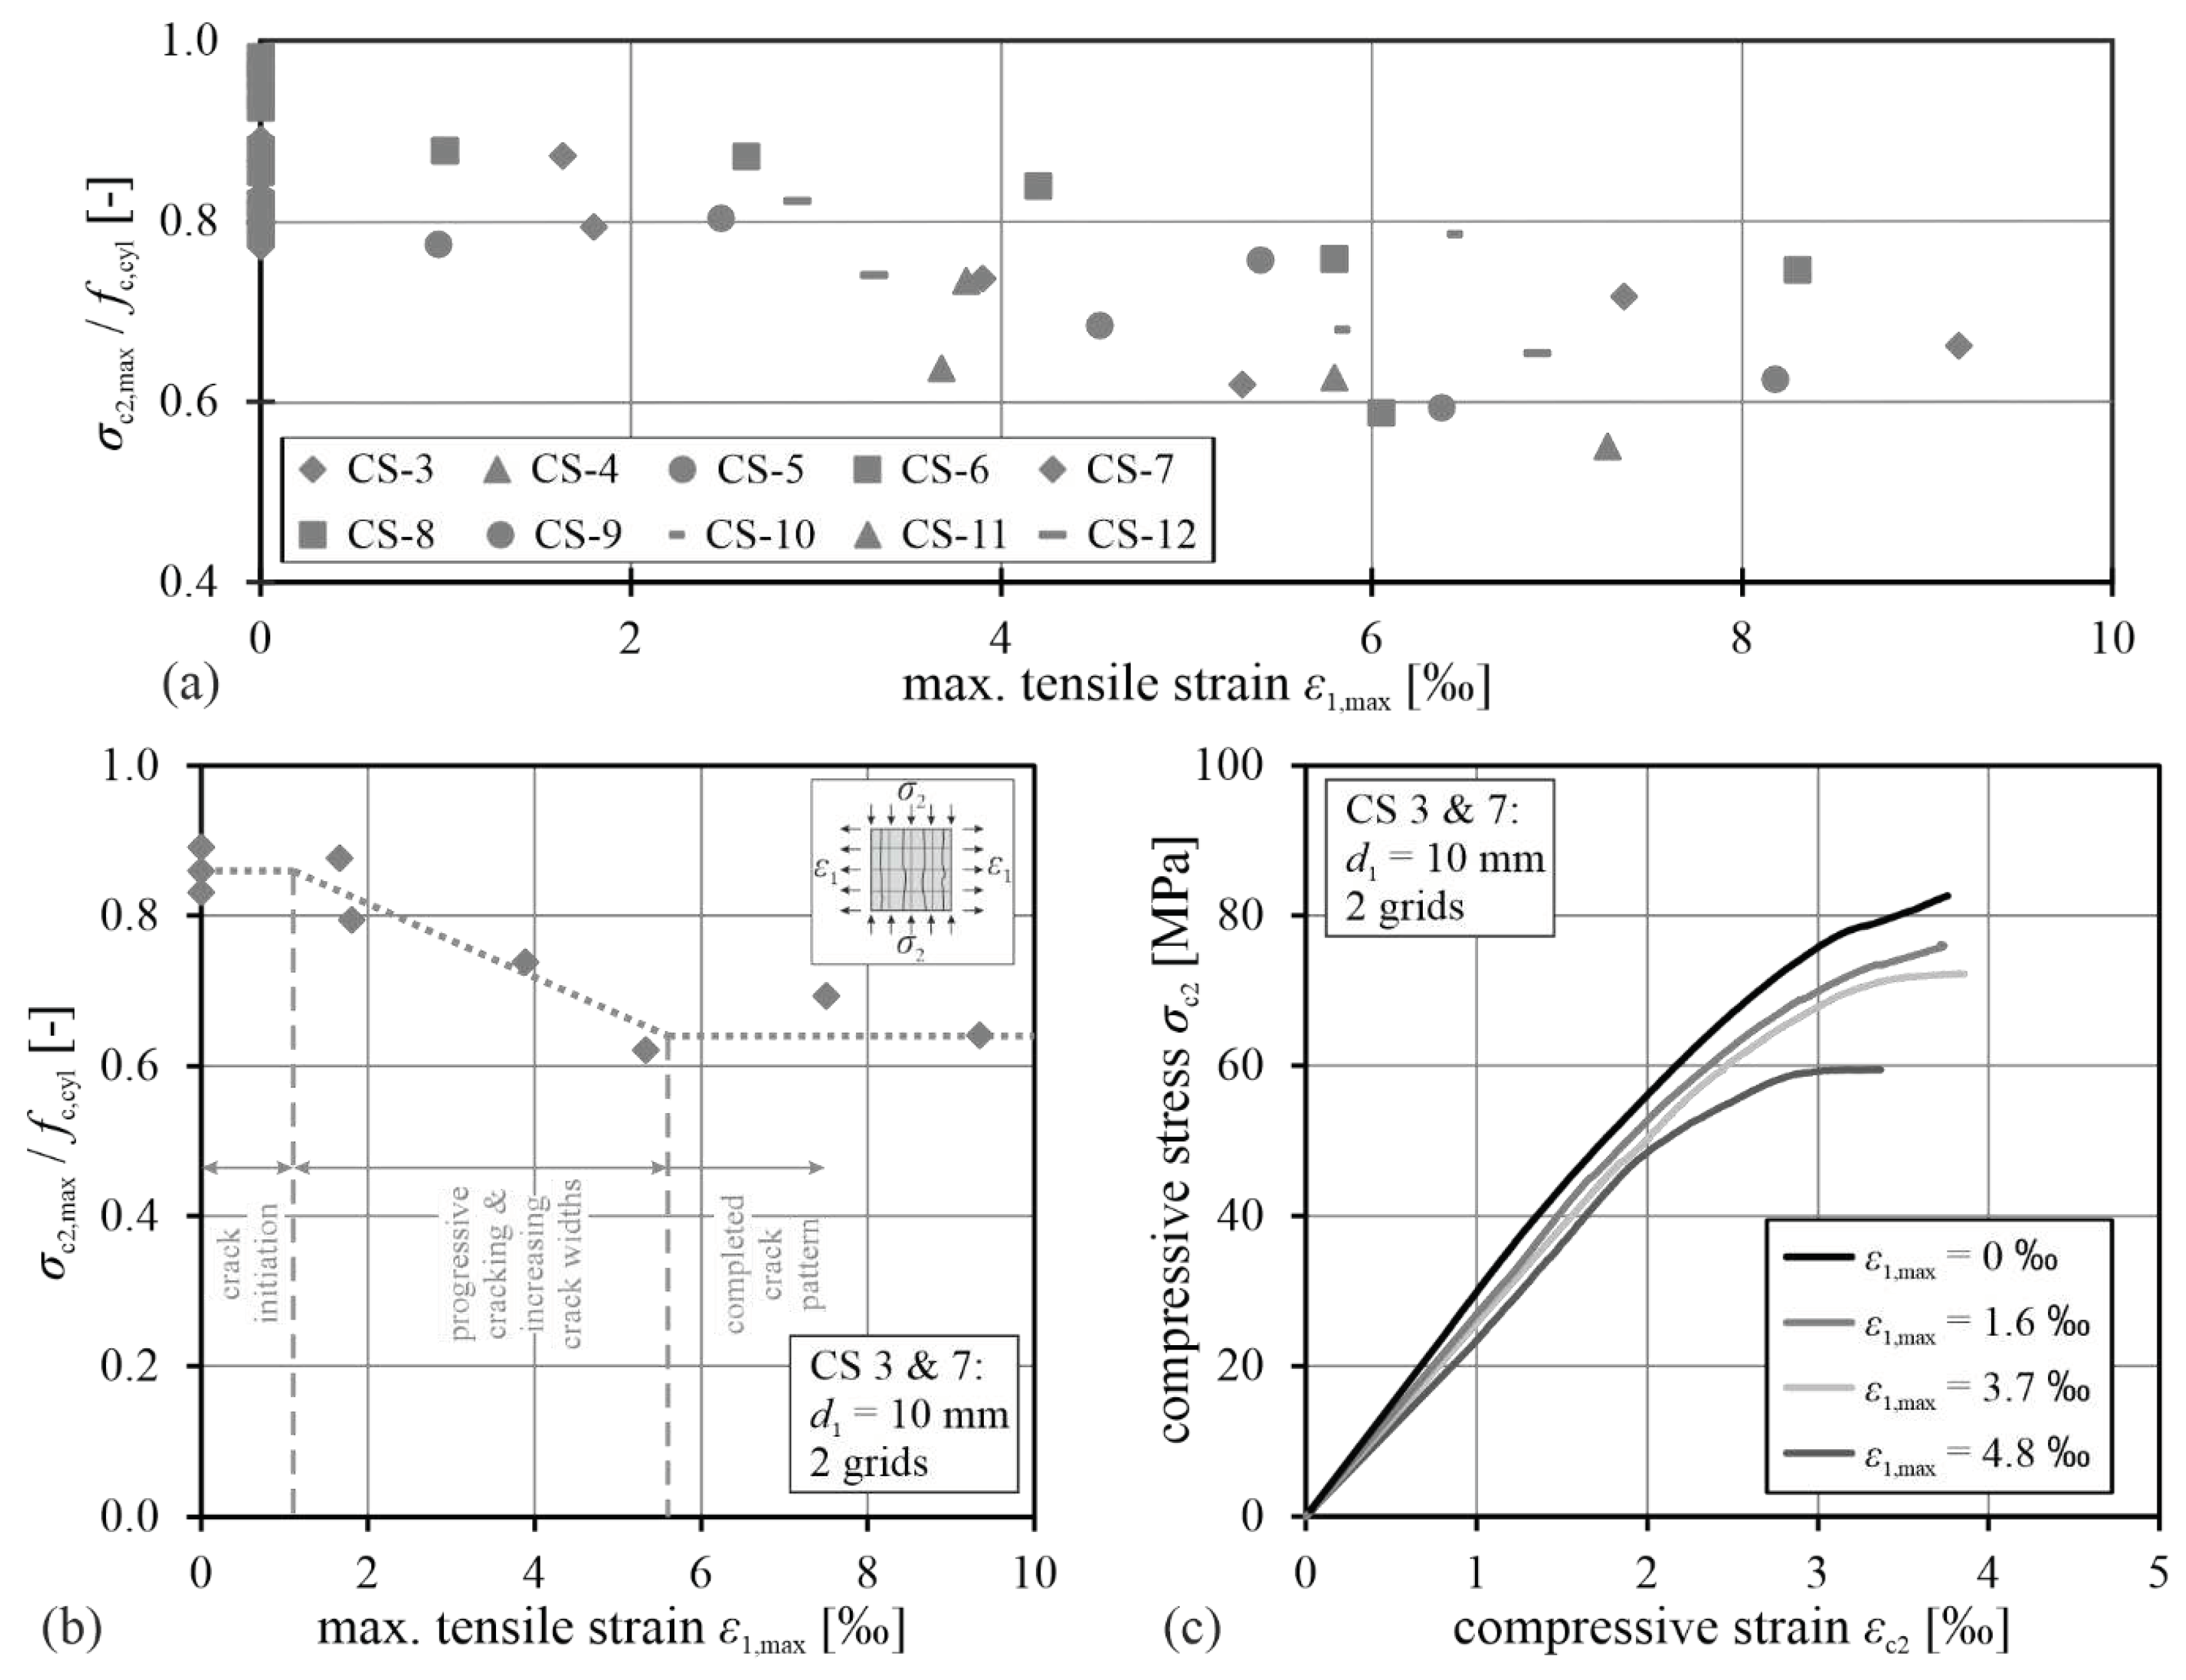
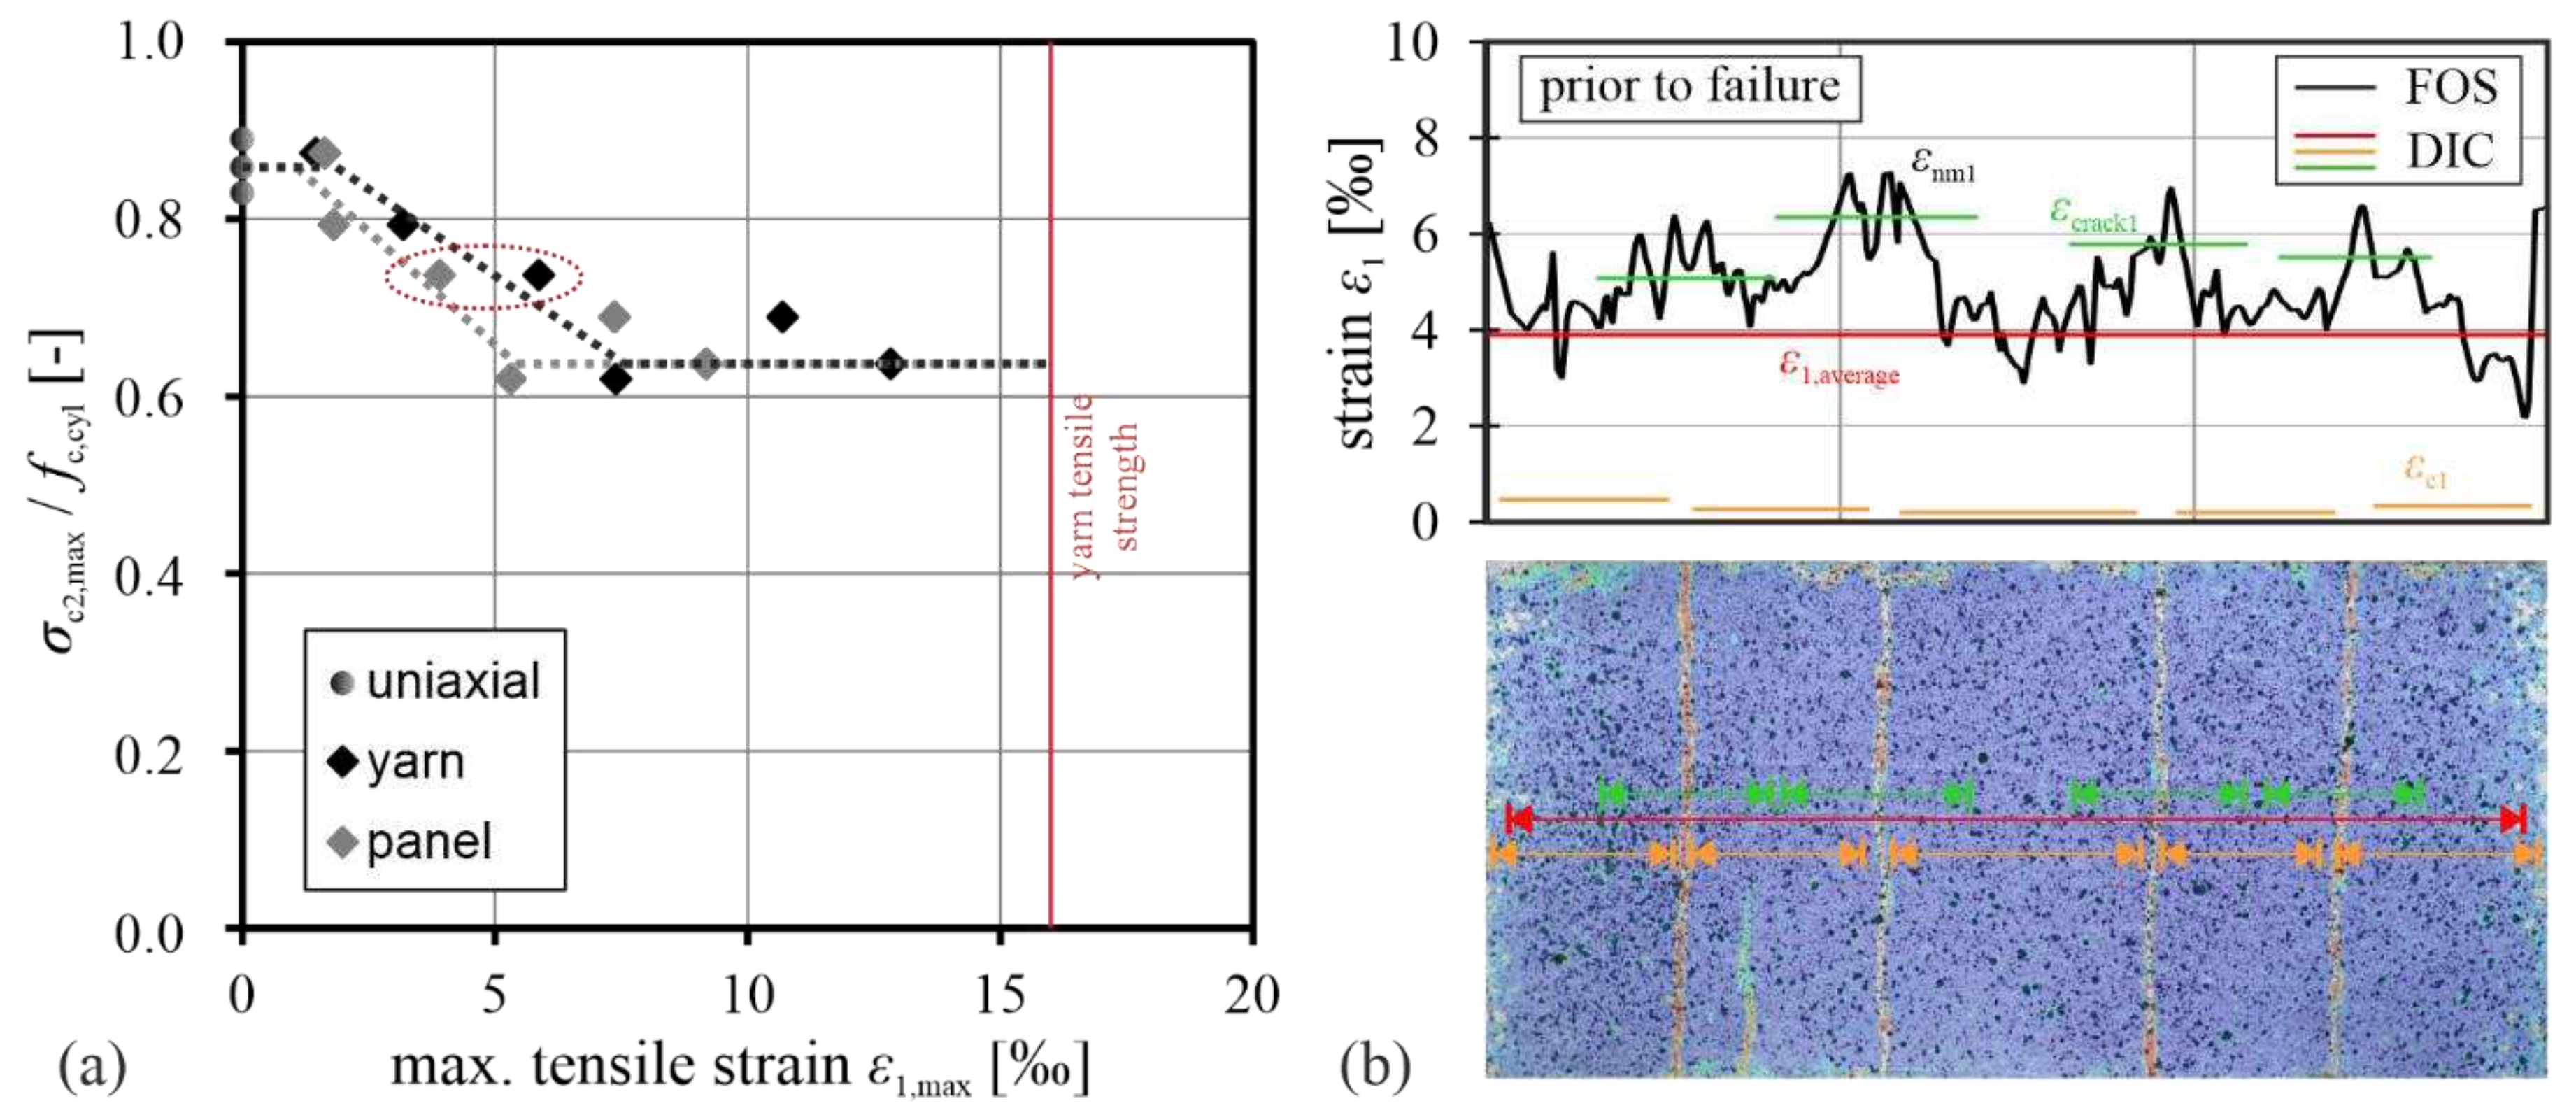
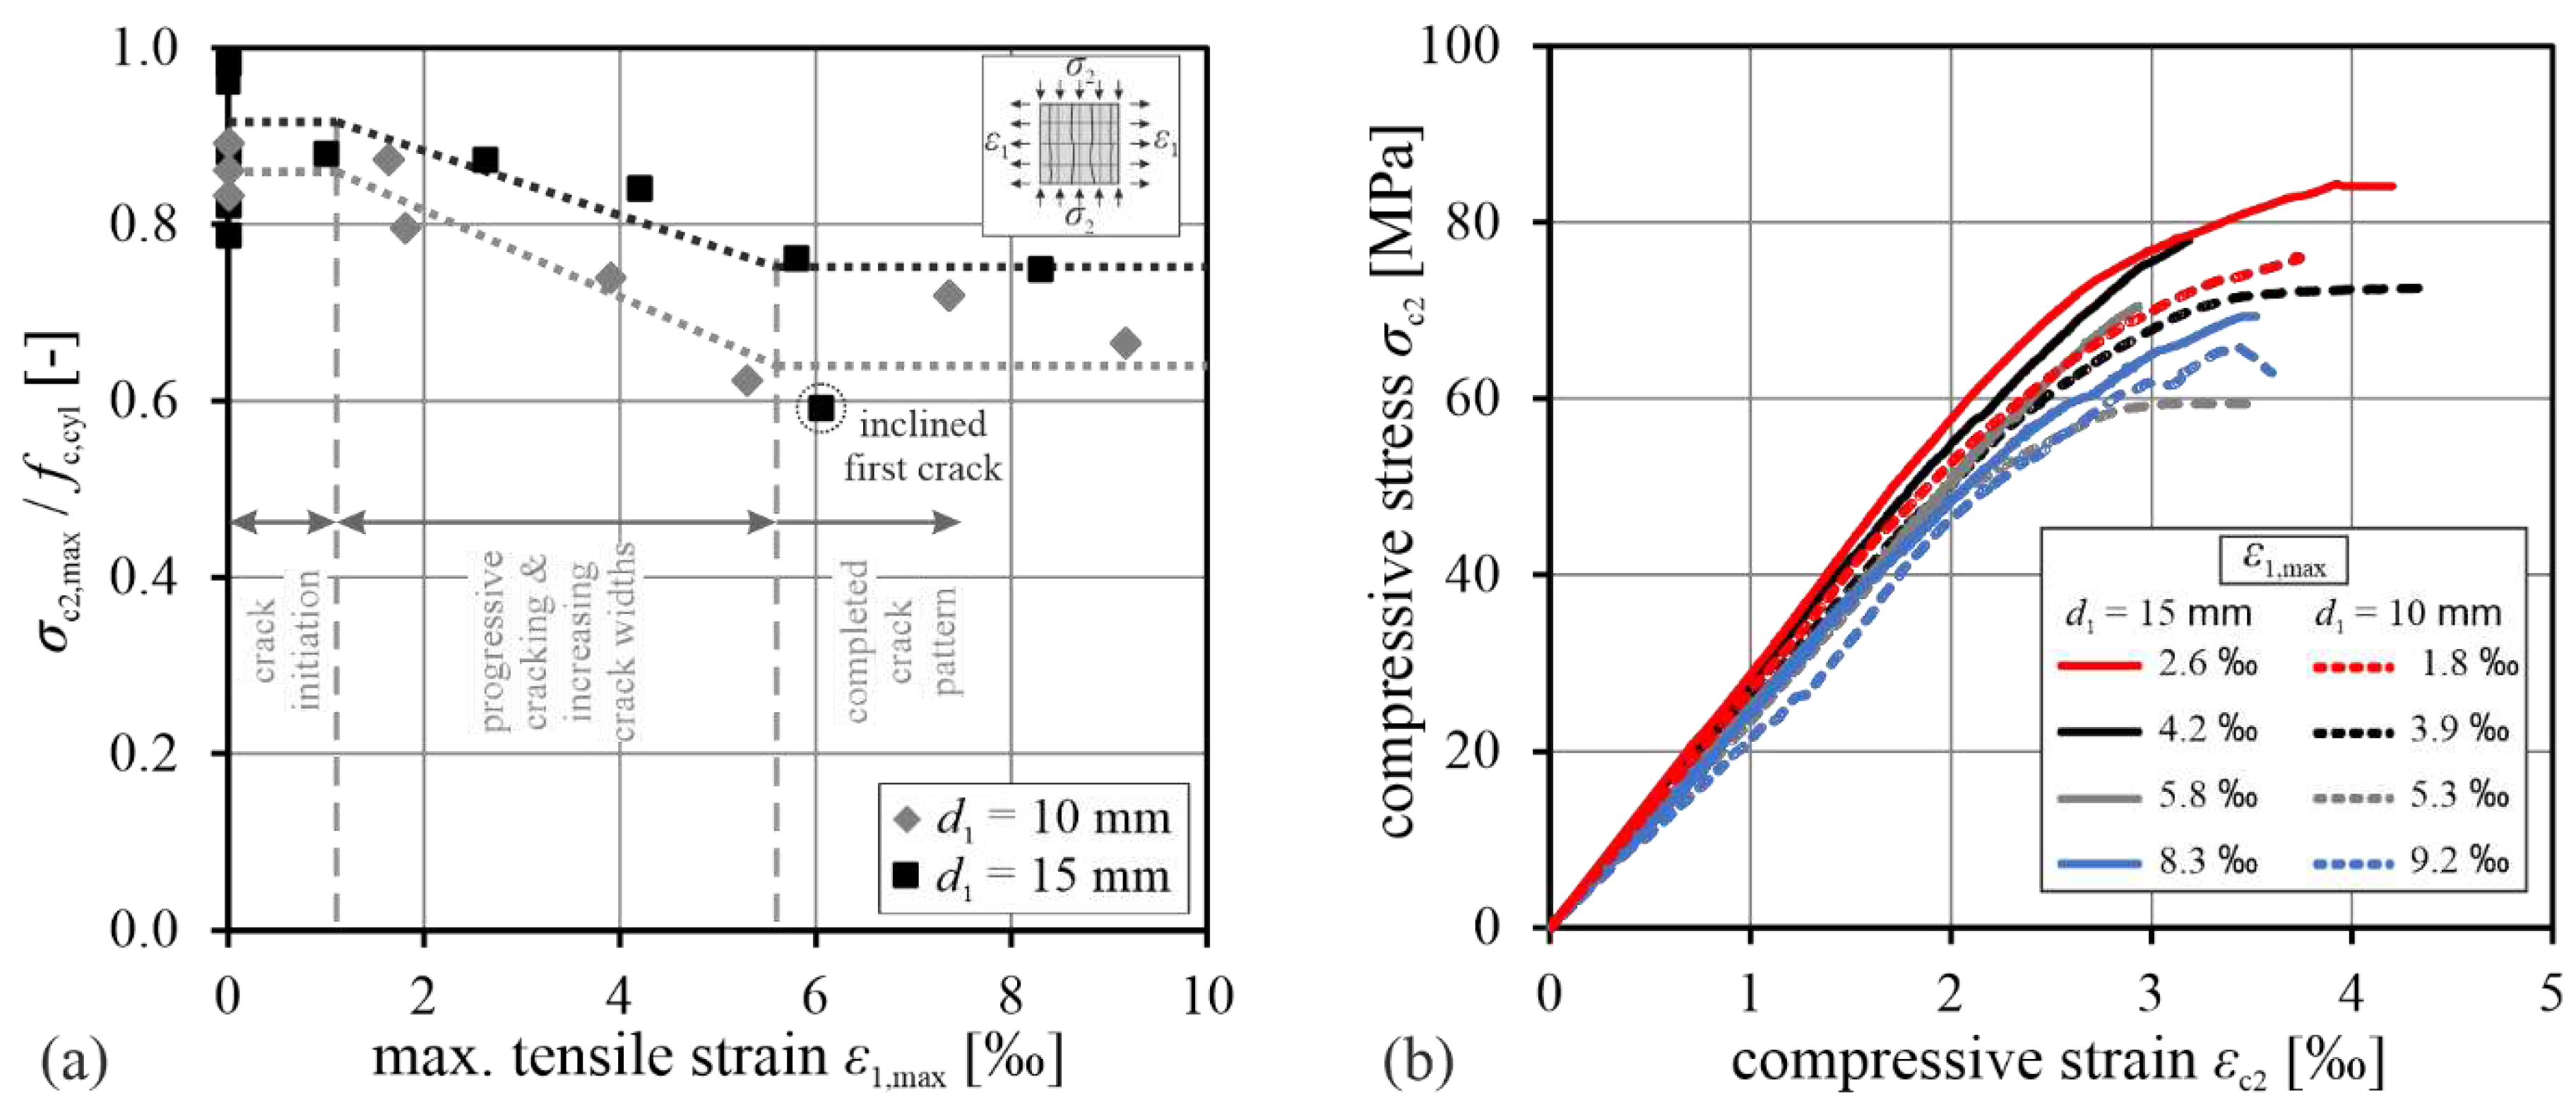
- The reduction in compressive strength of the fine-grained CRC panels is mainly influenced by the crack state. For uncracked reinforced concrete, no additional reduction was observed except that due to the loading conditions (rigid plates / brush bearing platens) and the presence of the yarns. Instead, for progressive cracking, a larger reduction in strength was observed at higher average transverse tensile strains in the concrete until complete cracking occurred and no further reduction in compressive strength resulted. Similar behaviour as a function of the cracking state was also observed by Fehling et al. [51] for steel reinforced concrete.
- -
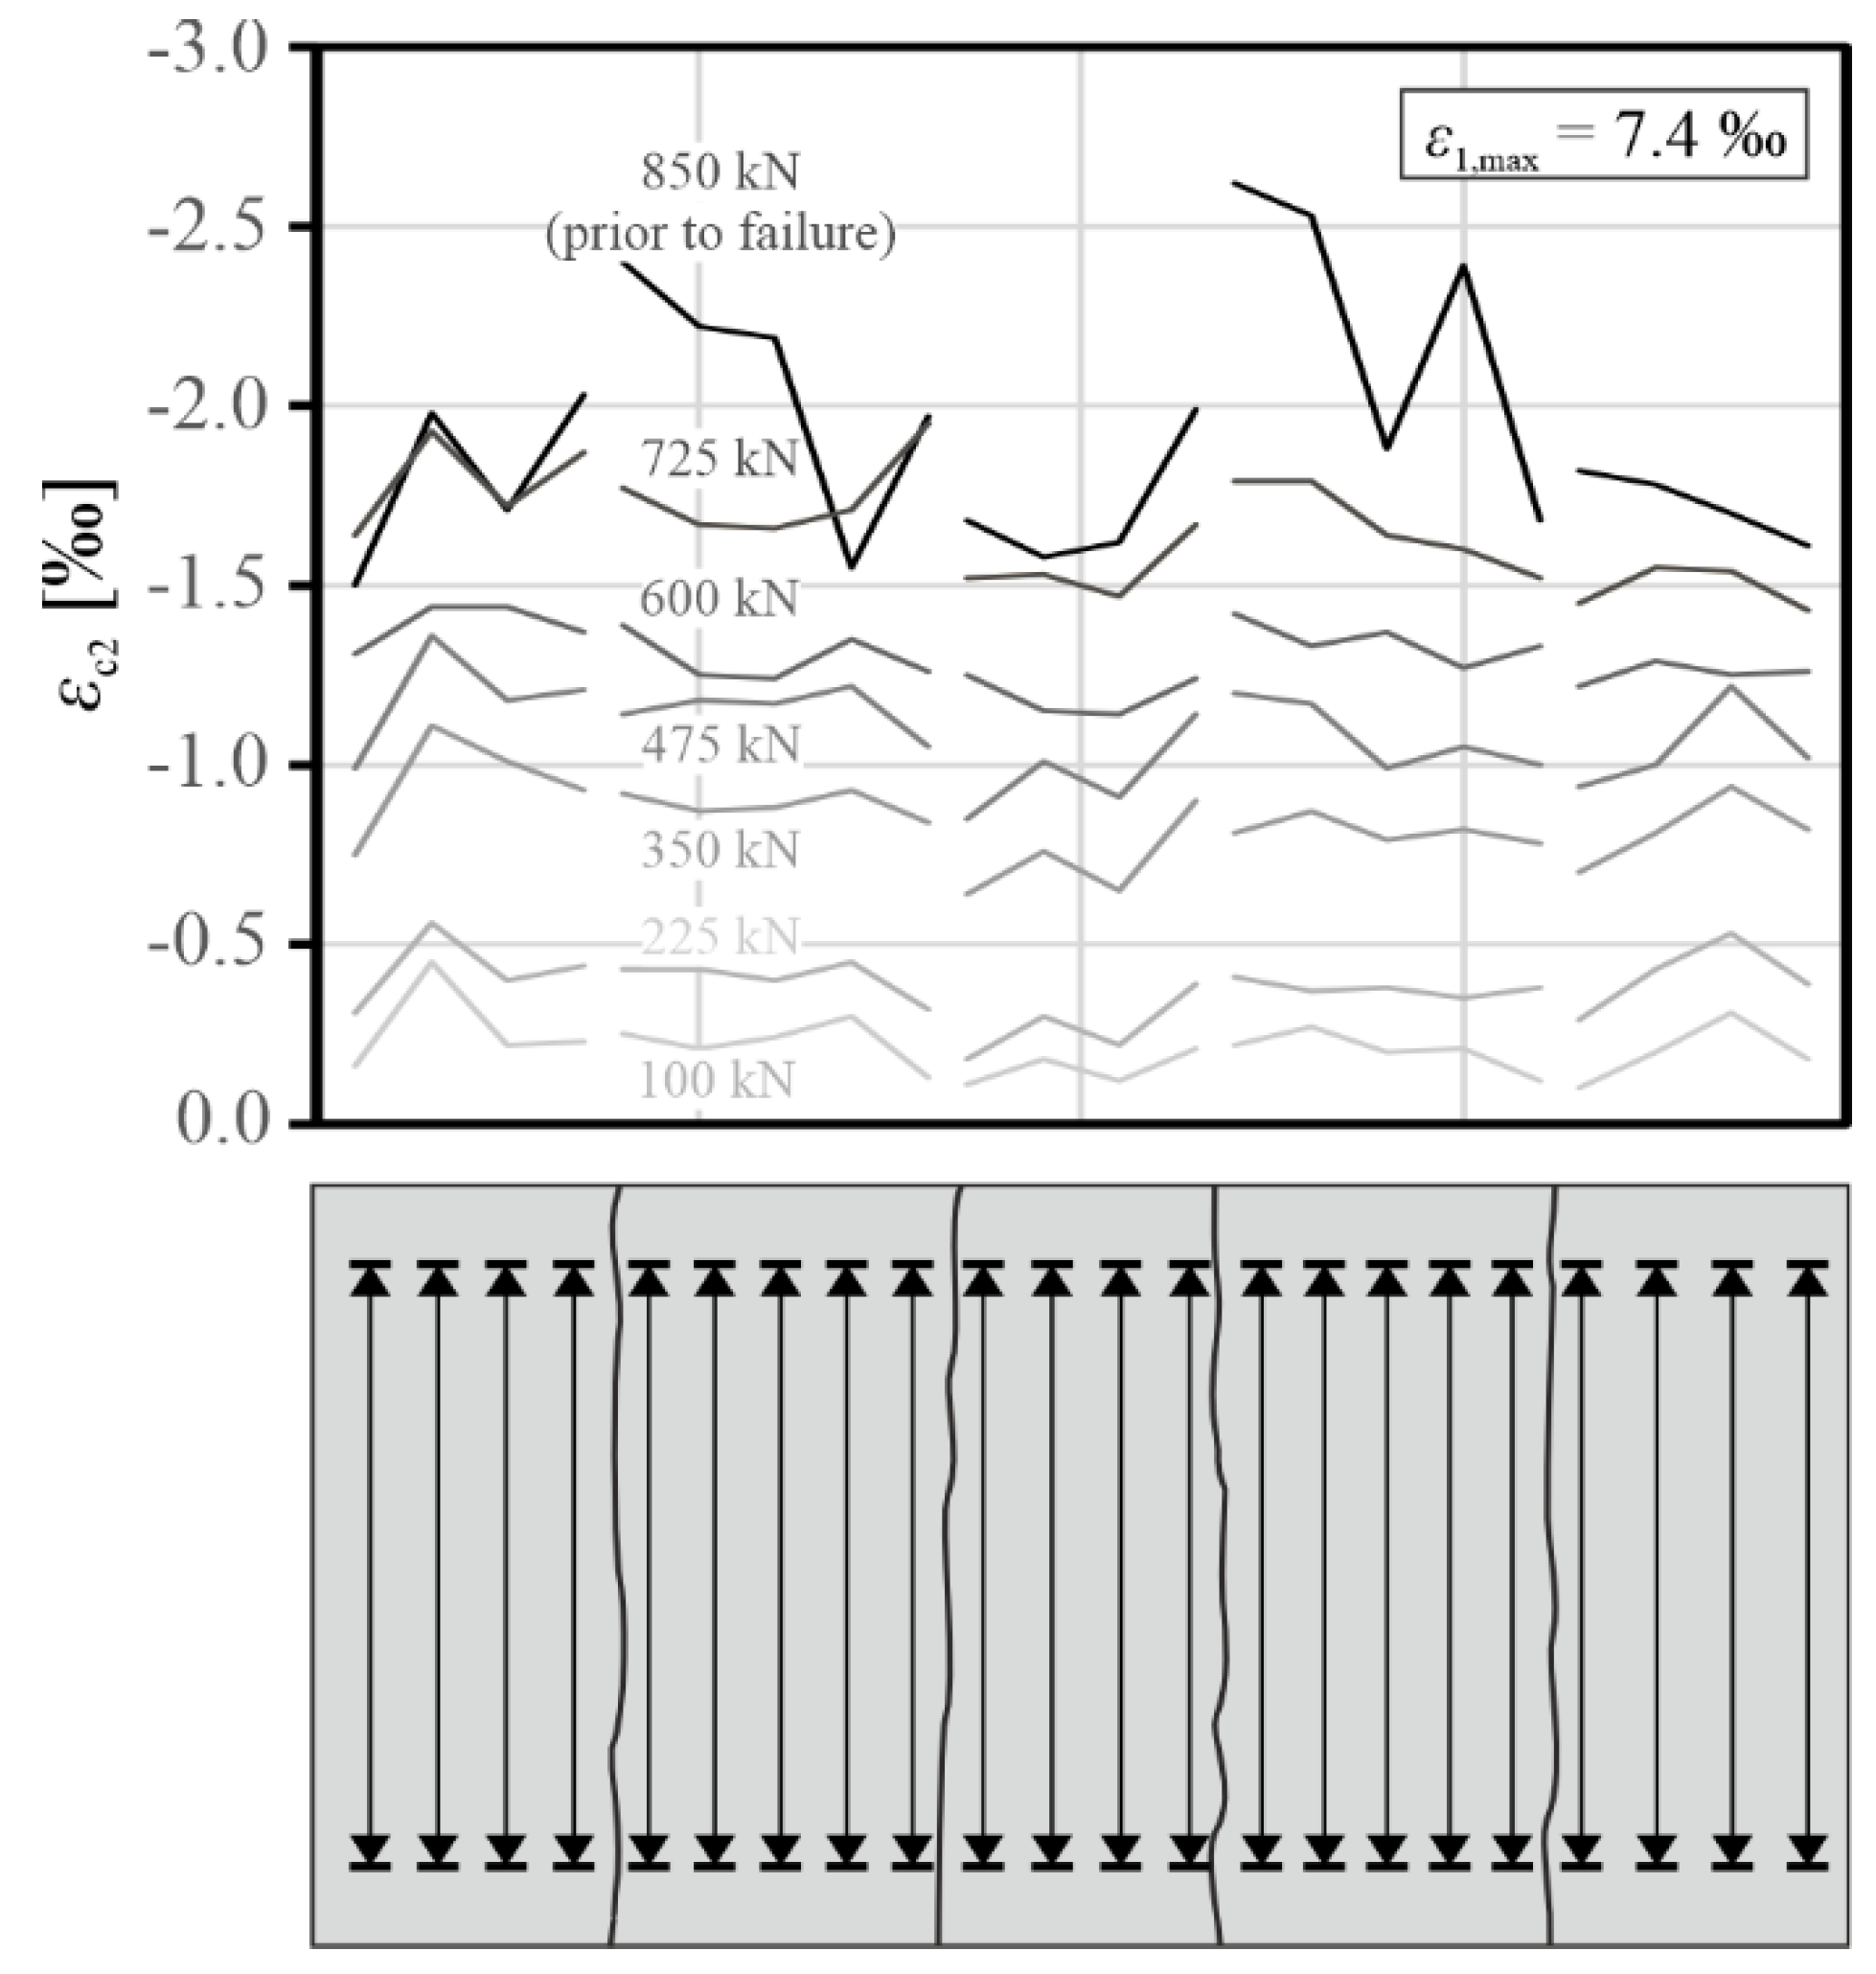
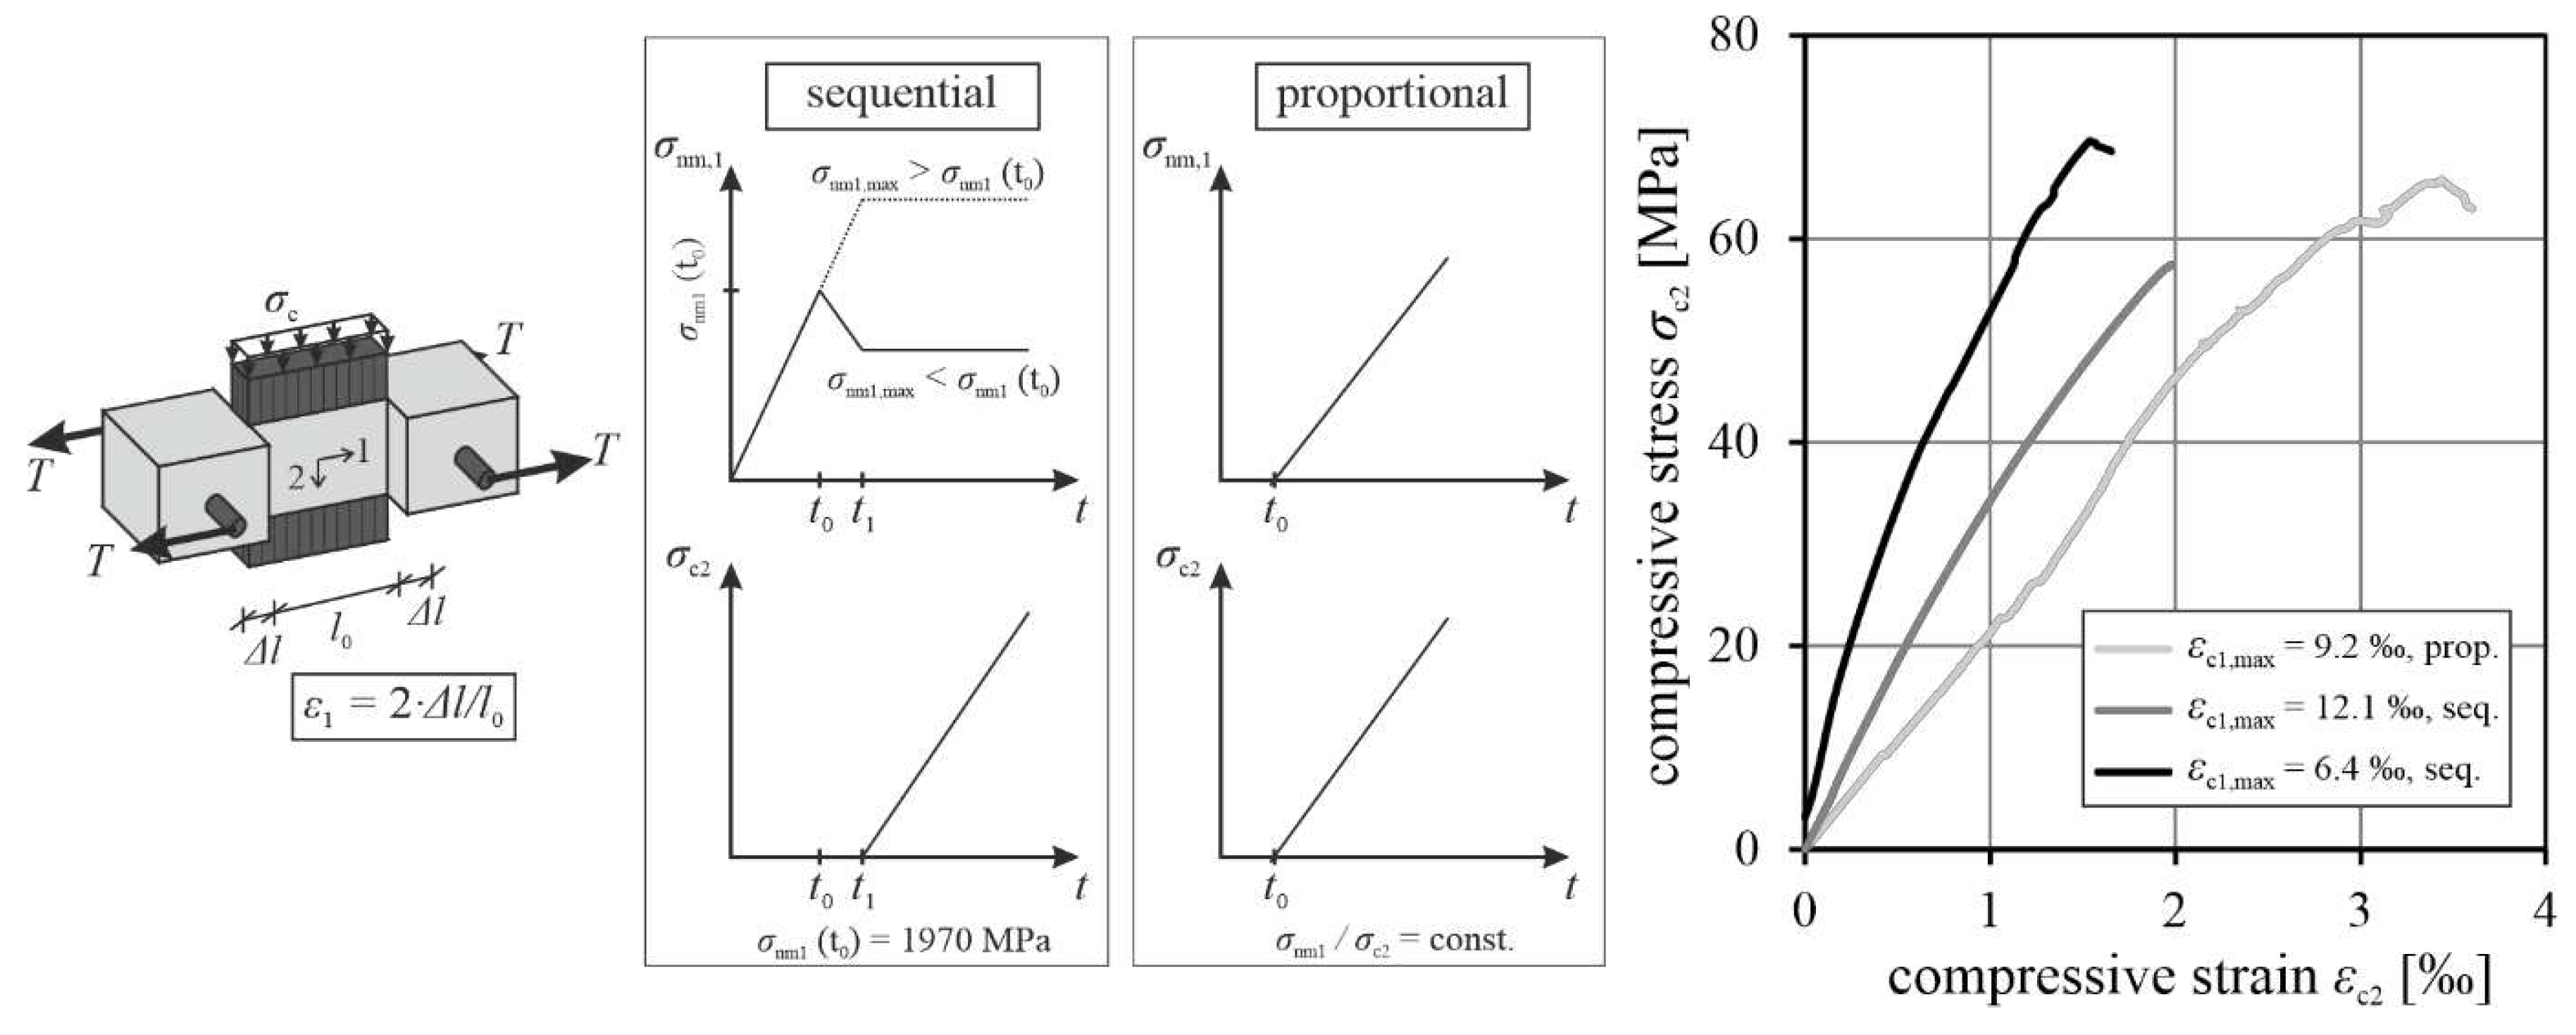
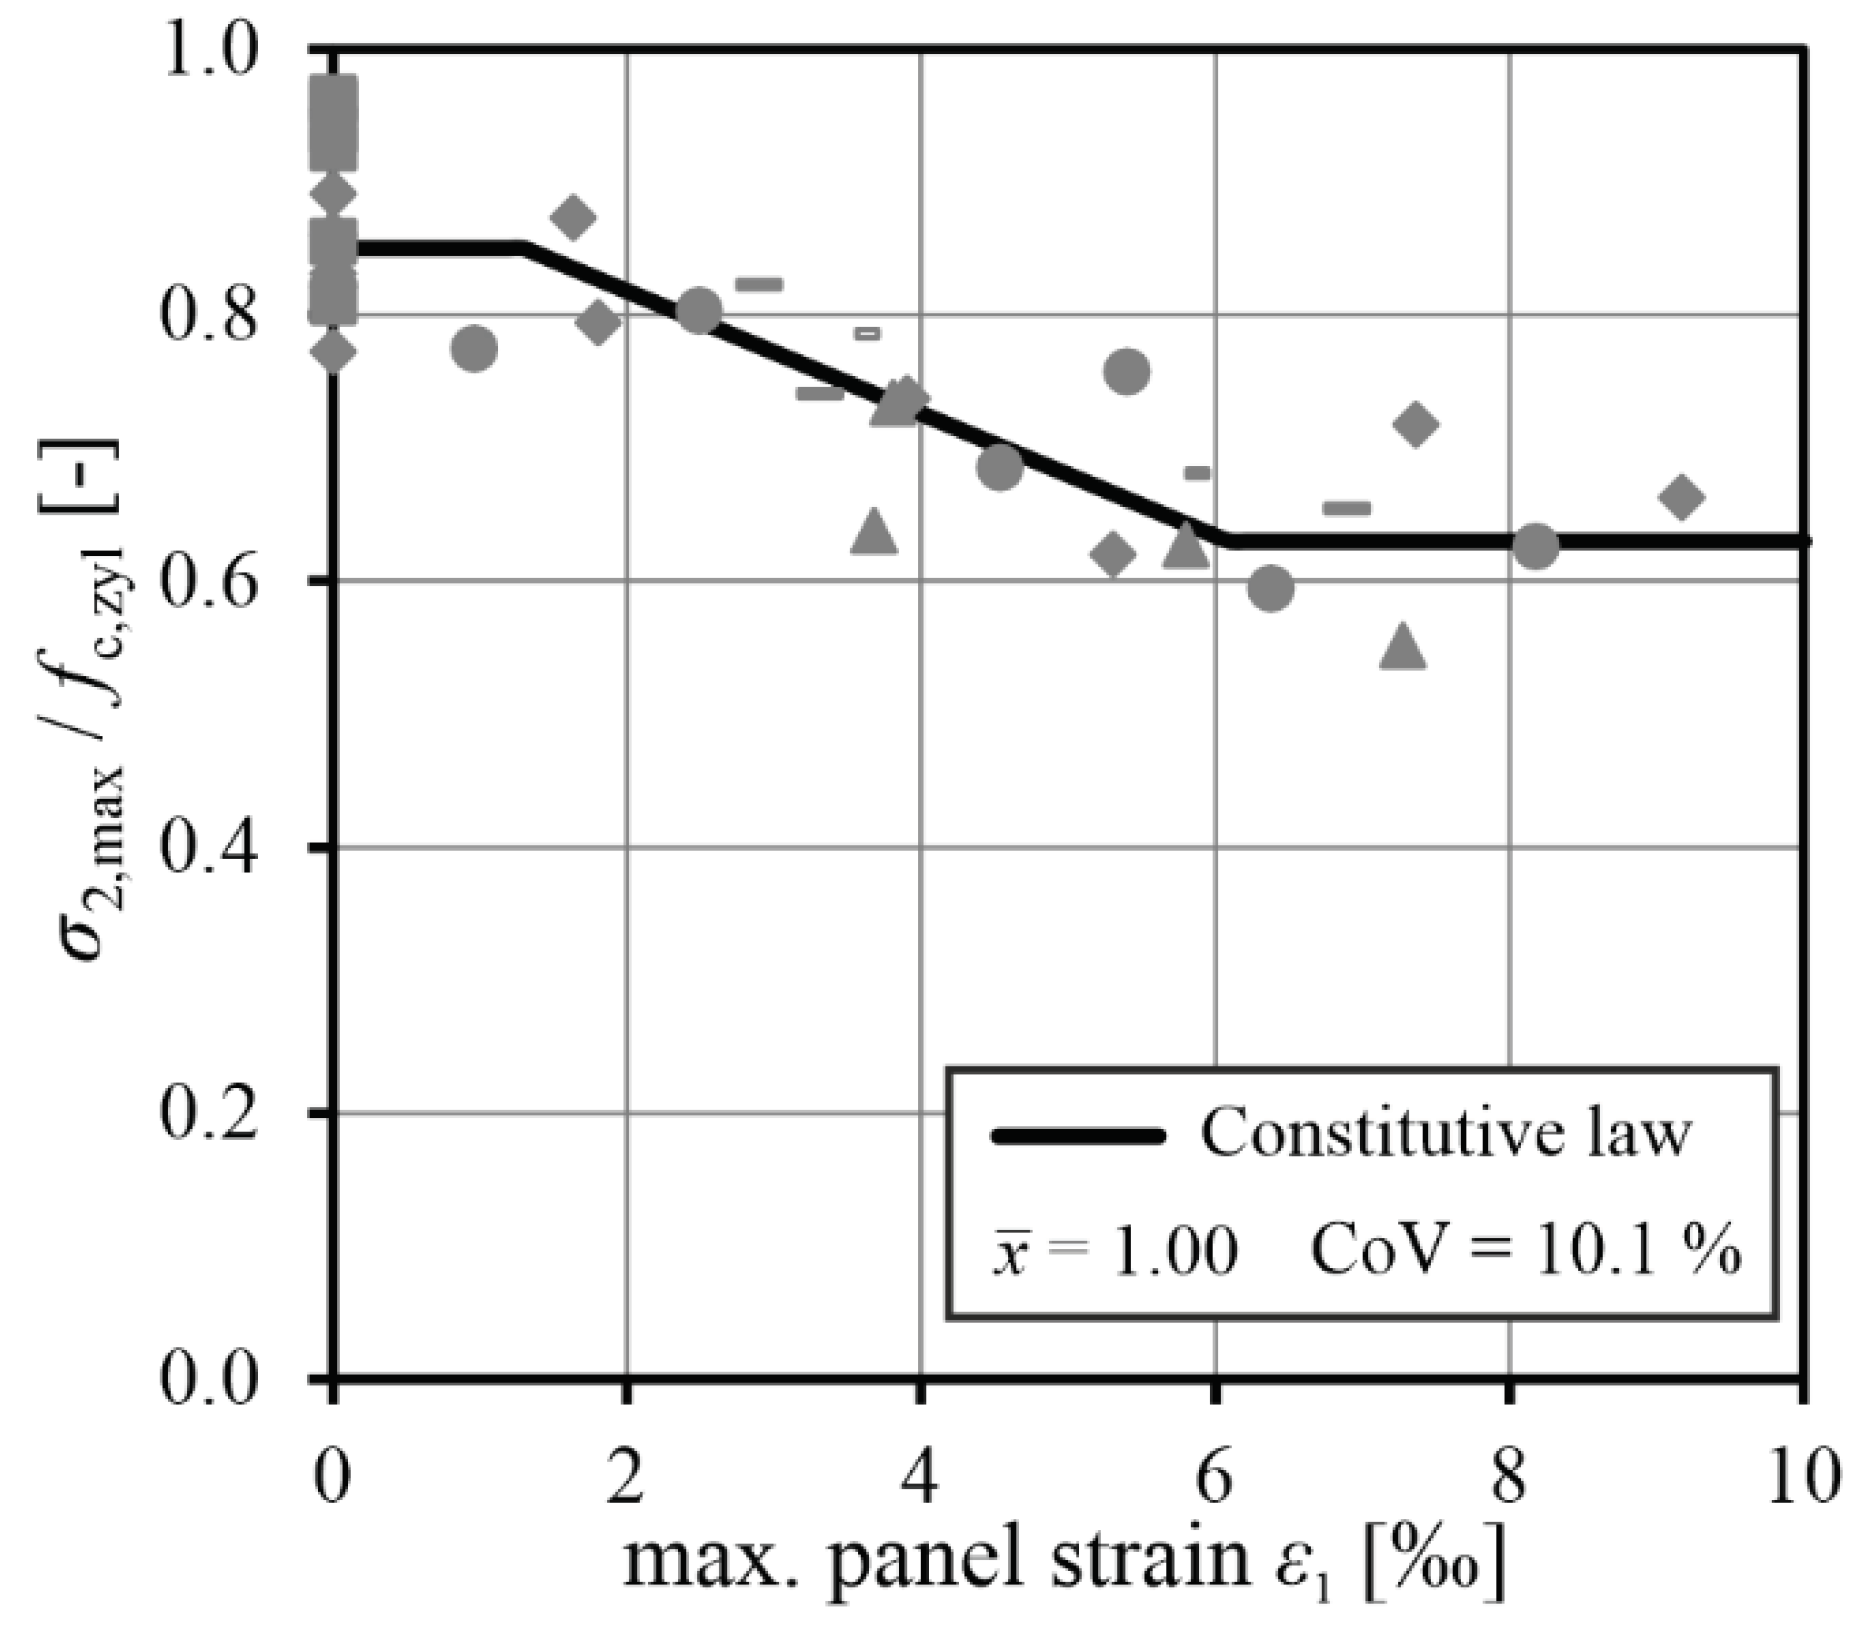
- The described compression softening behaviour was also observed in the stress-strain diagrams of the specimens under biaxial loading. Higher average transverse tensile stresses result in softer compressive stiffness and lower compressive strength.
- -
- In general, the effect of compression softening was found to be less severe in CRC compared to steel reinforced concrete.
- -
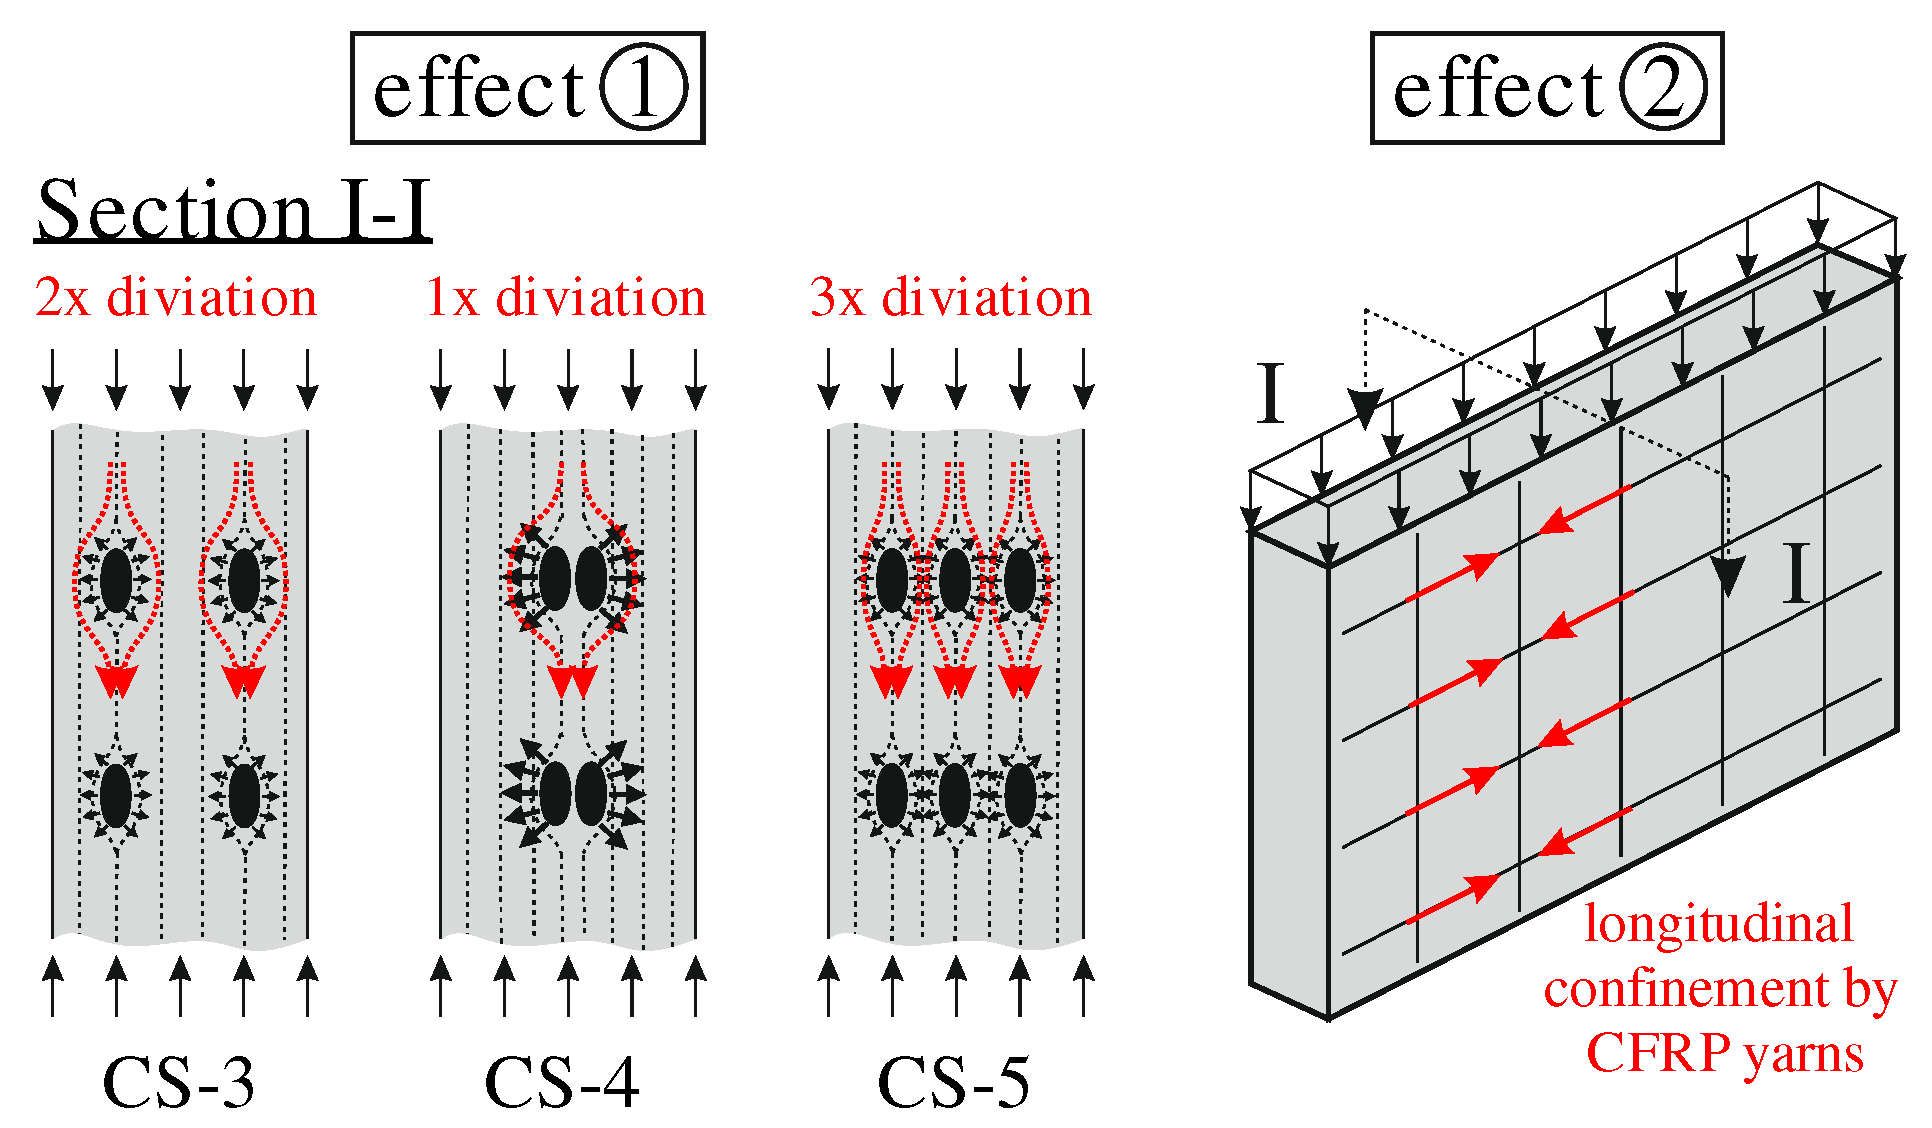
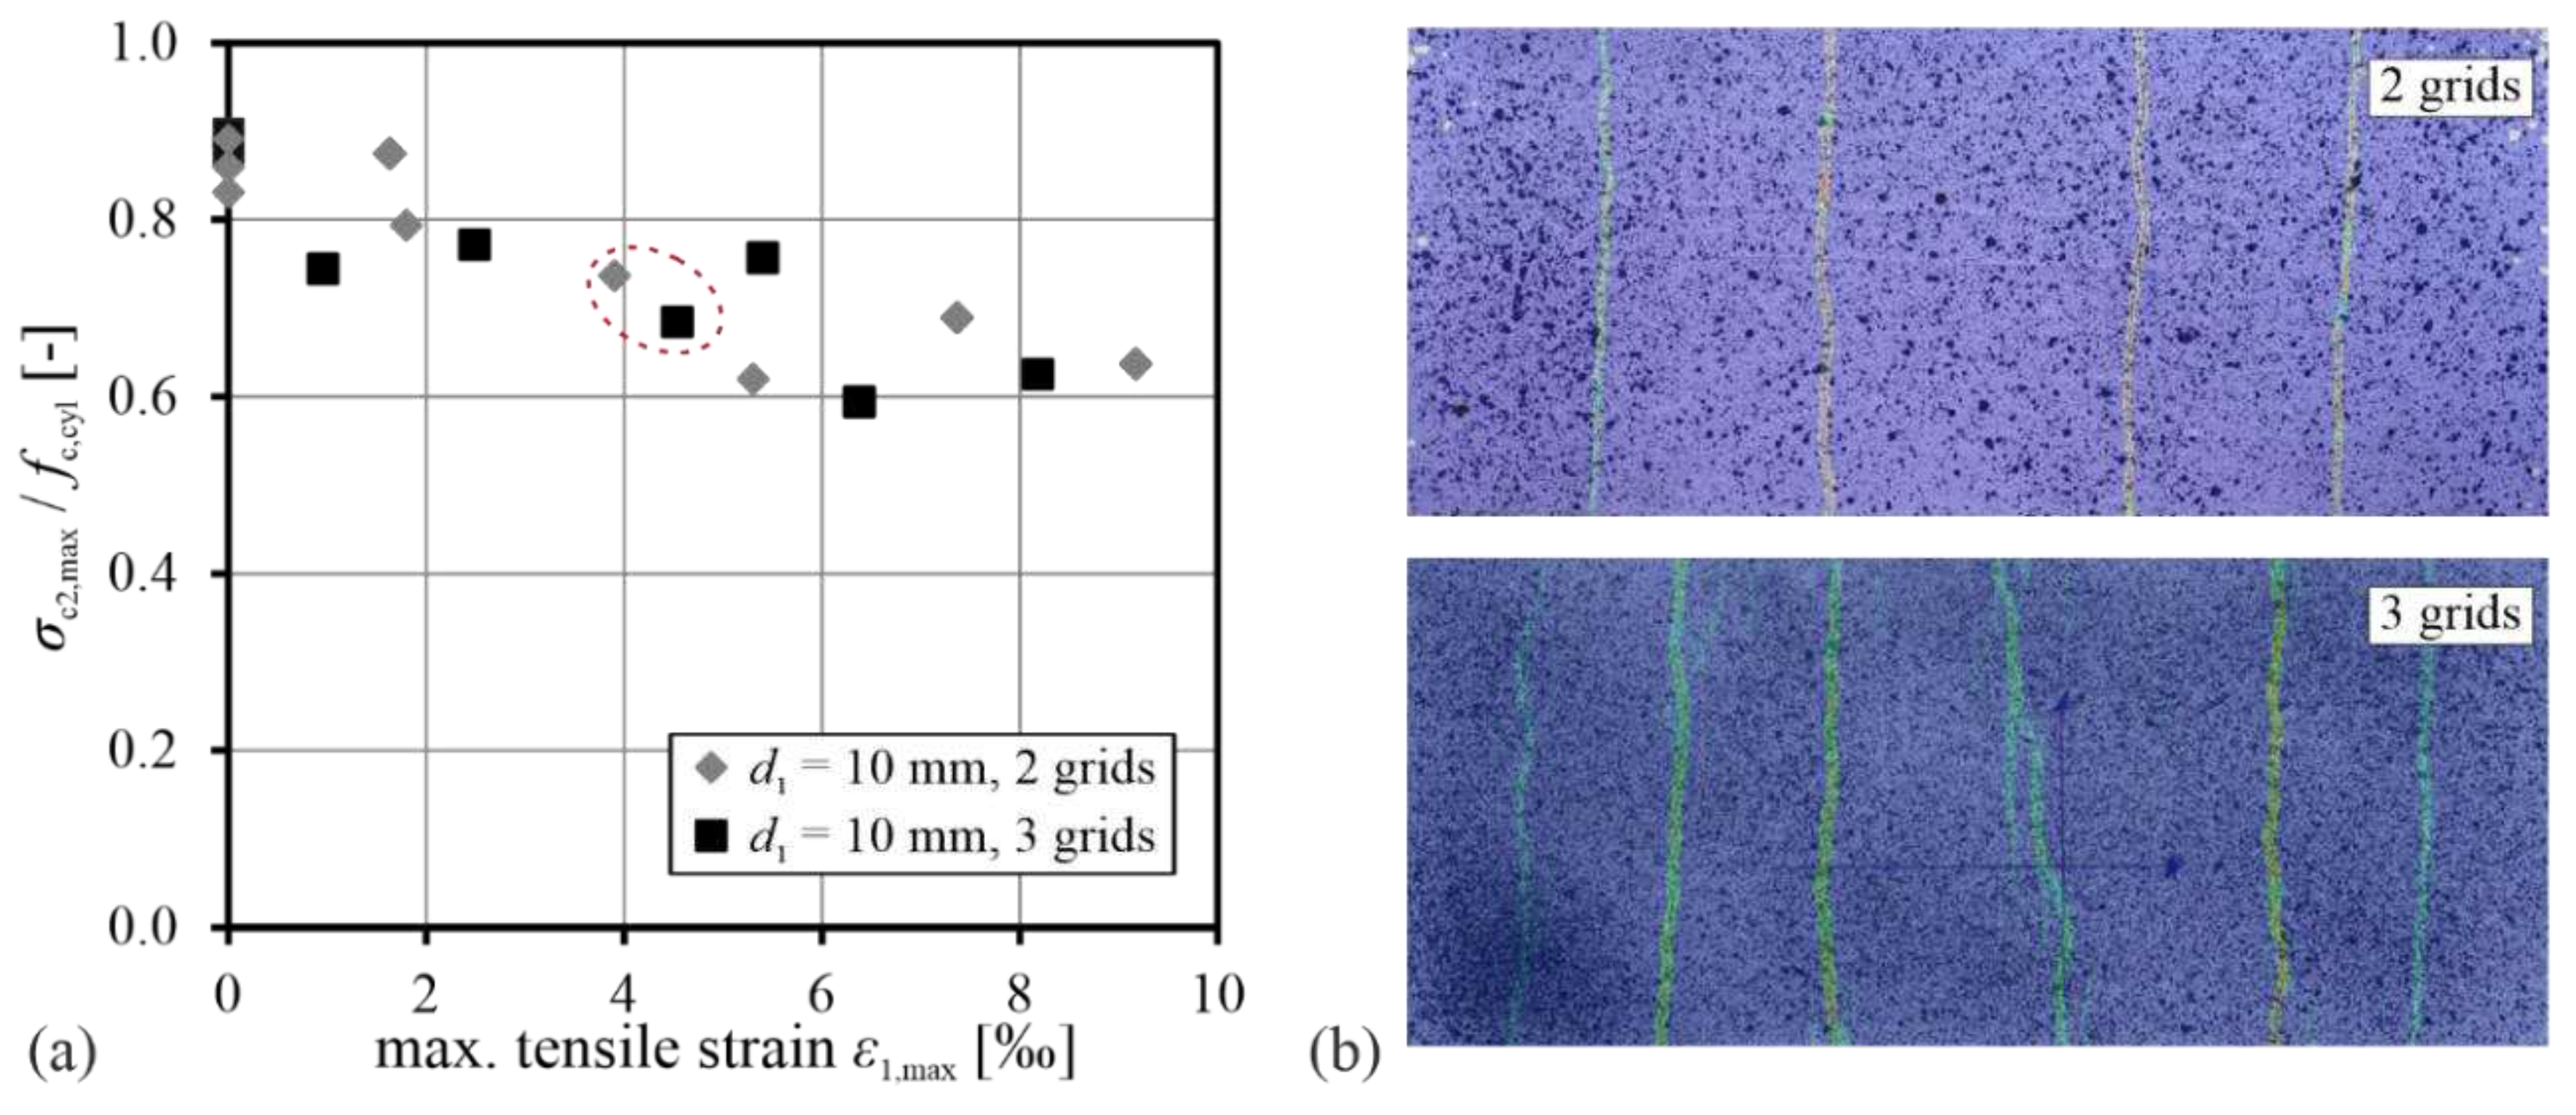
- The compression softening behaviour strongly depends on the position of the CFRP grids within the concrete cross section. Configurations that lead to minimal deviation of concrete stresses around the weaker CFRP grids lead to stiffer compressive behaviour and higher compressive strengths. At the same time, a higher reinforcement ratio may lead to better confinement of the specimen which is also beneficial for compressive strength.
- -
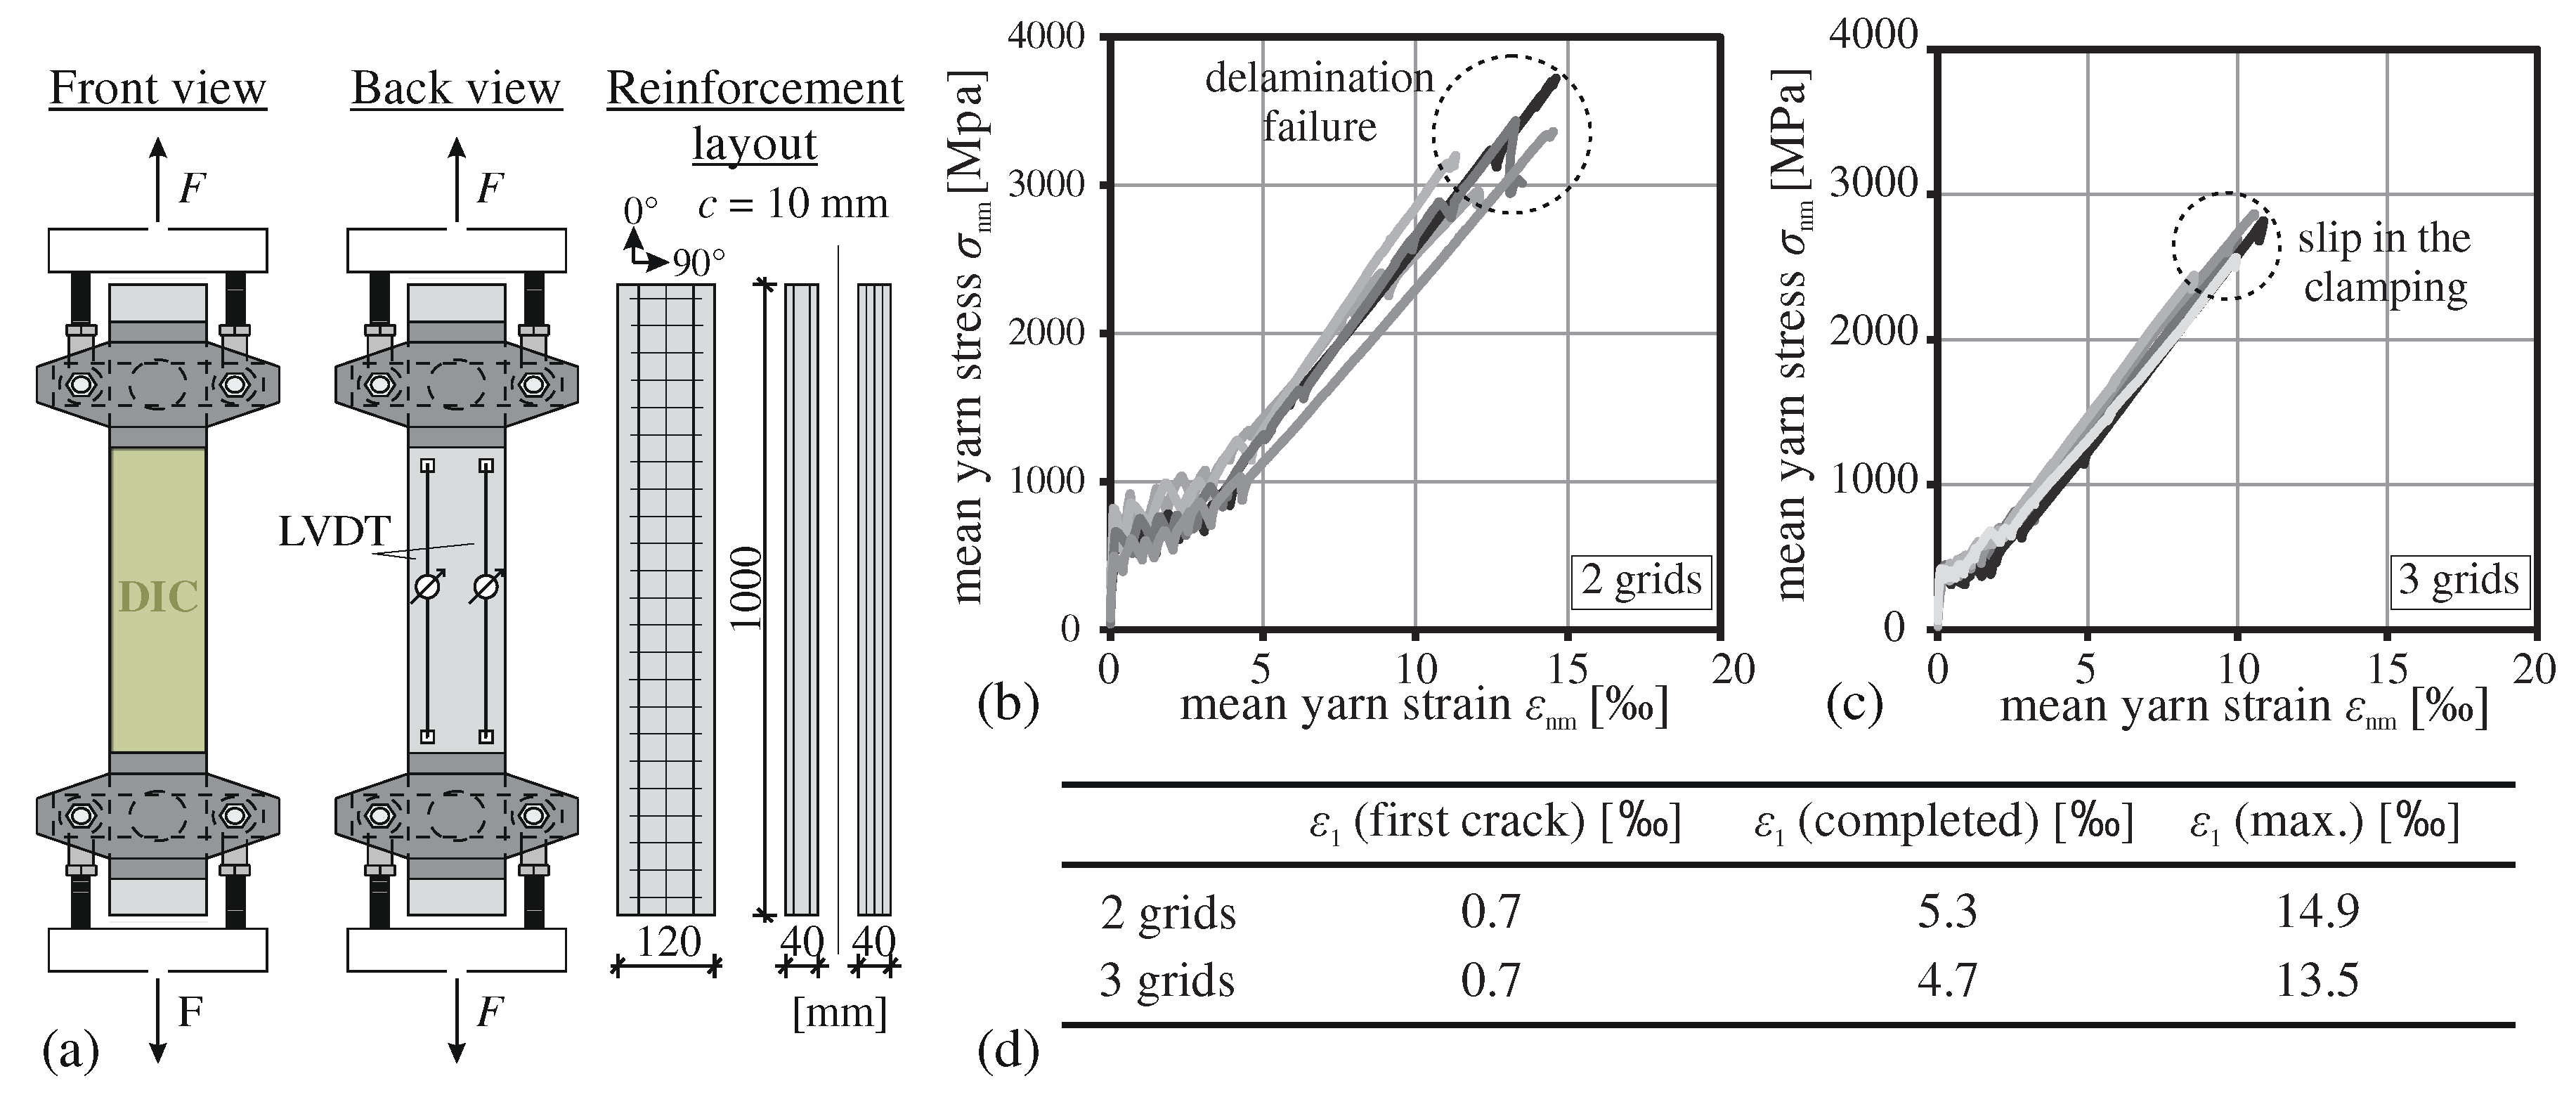
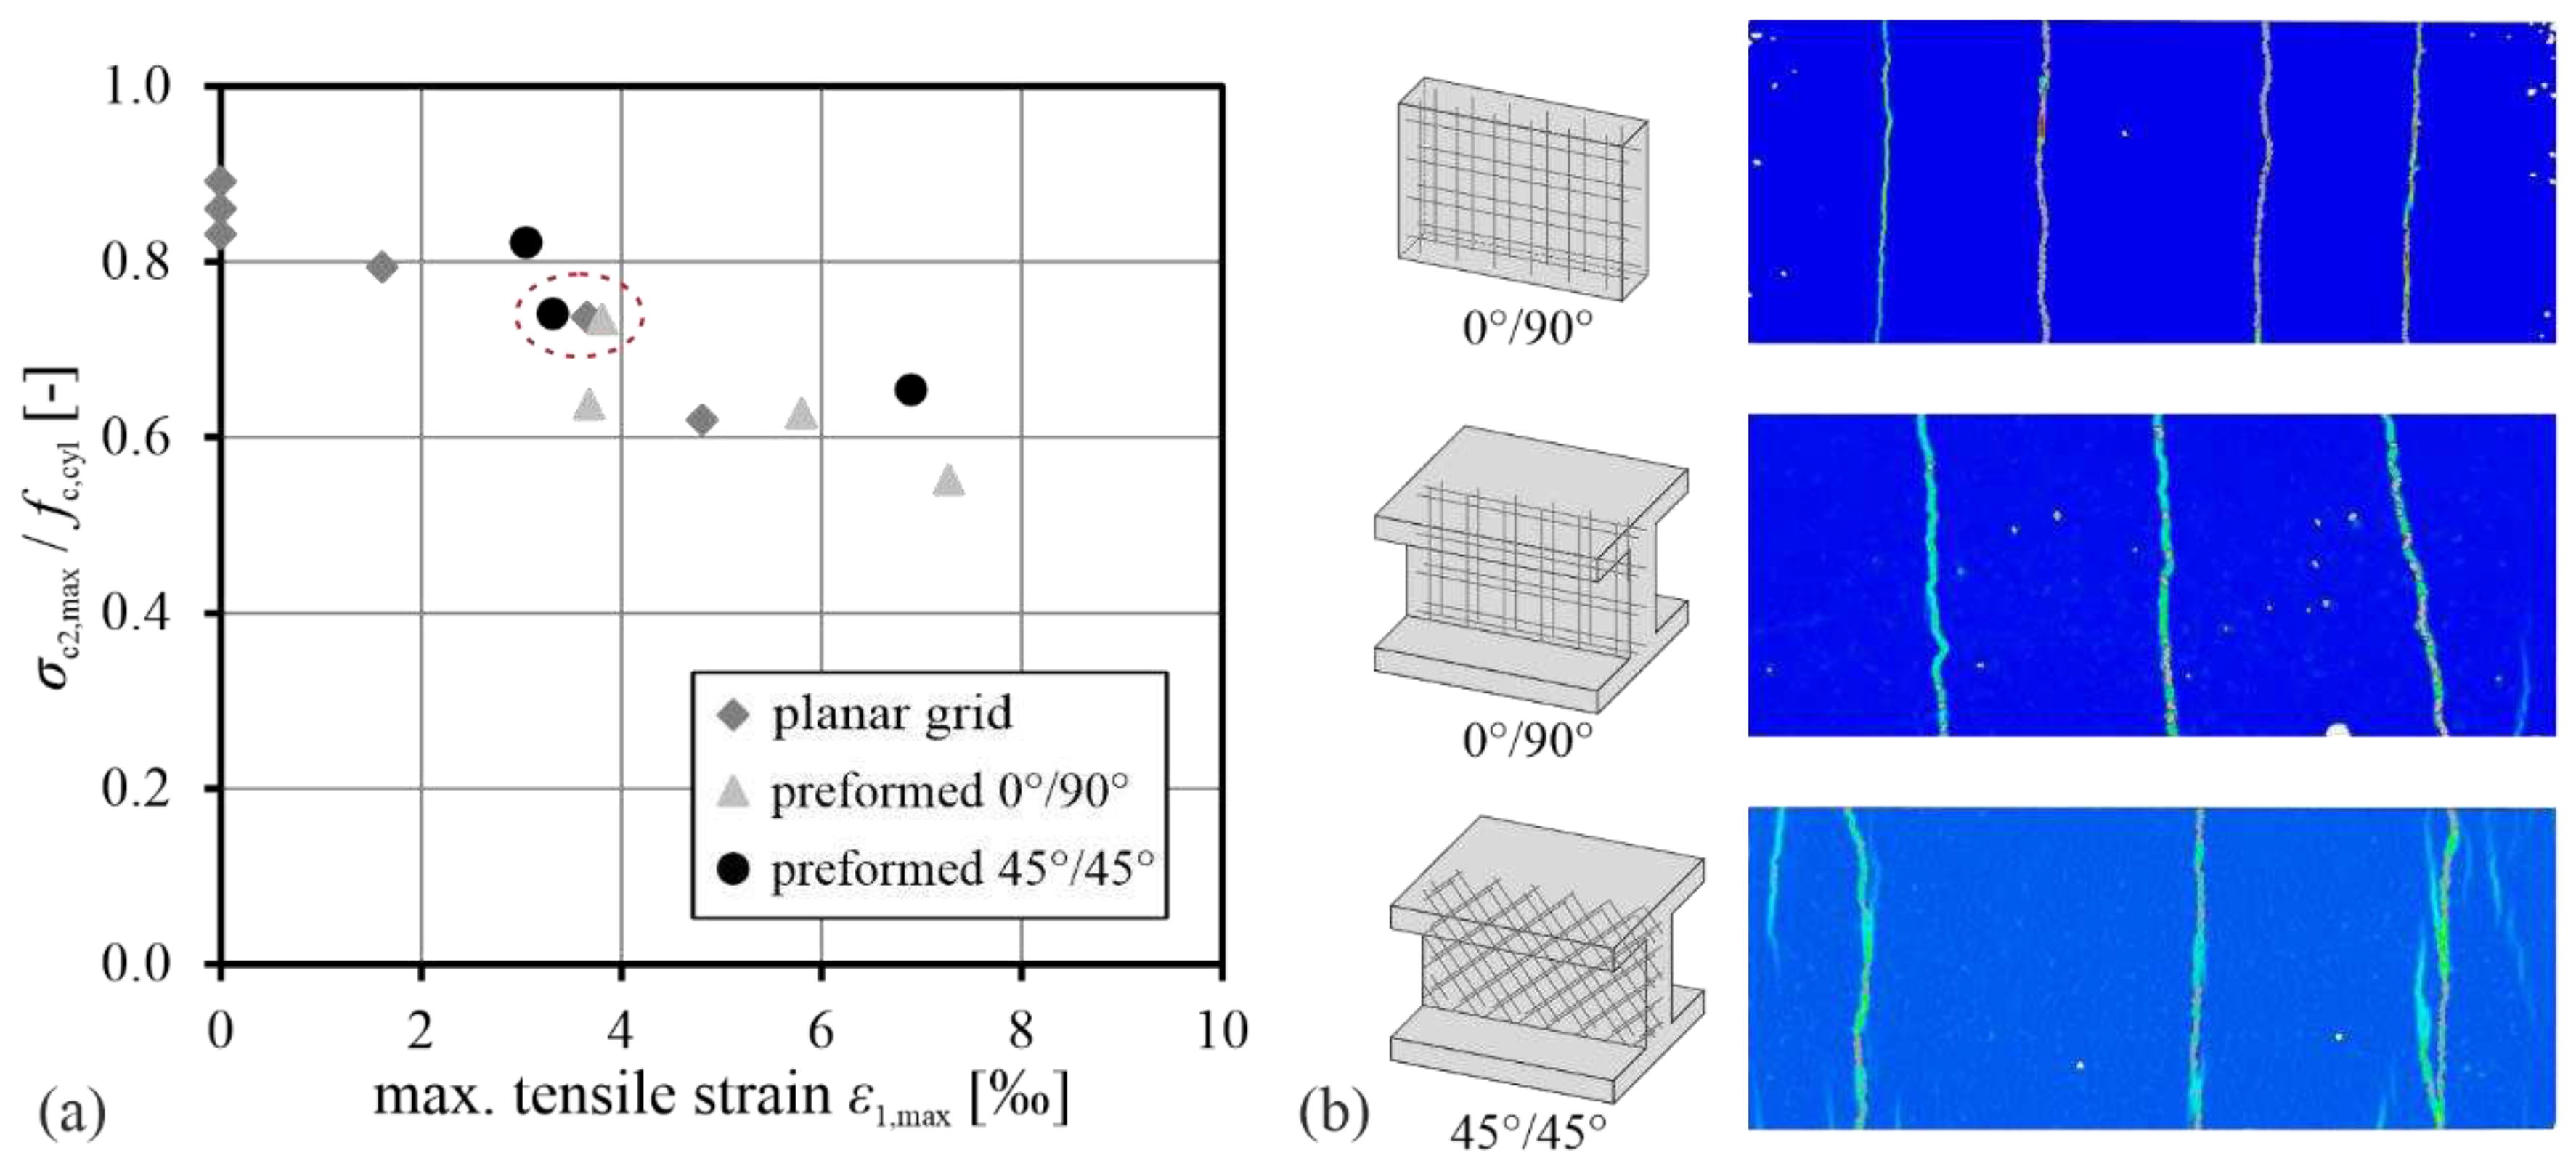
- In the tests with yarns oriented at 45° to the direction of the compressive force, both yarns showed the same strains in the warp and weft directions of the mesh. The tests did not show any additional reduction due to the orientation of the cracks parallel to the direction of the compressive forces, as in the tests with yarns oriented in the direction of the forces. These crack inclinations have also been found in slender beams tested by other researchers (e.g., [39]). However, the influence of other crack inclinations and different strains in the warp and weft yarns require further investigation.
- -
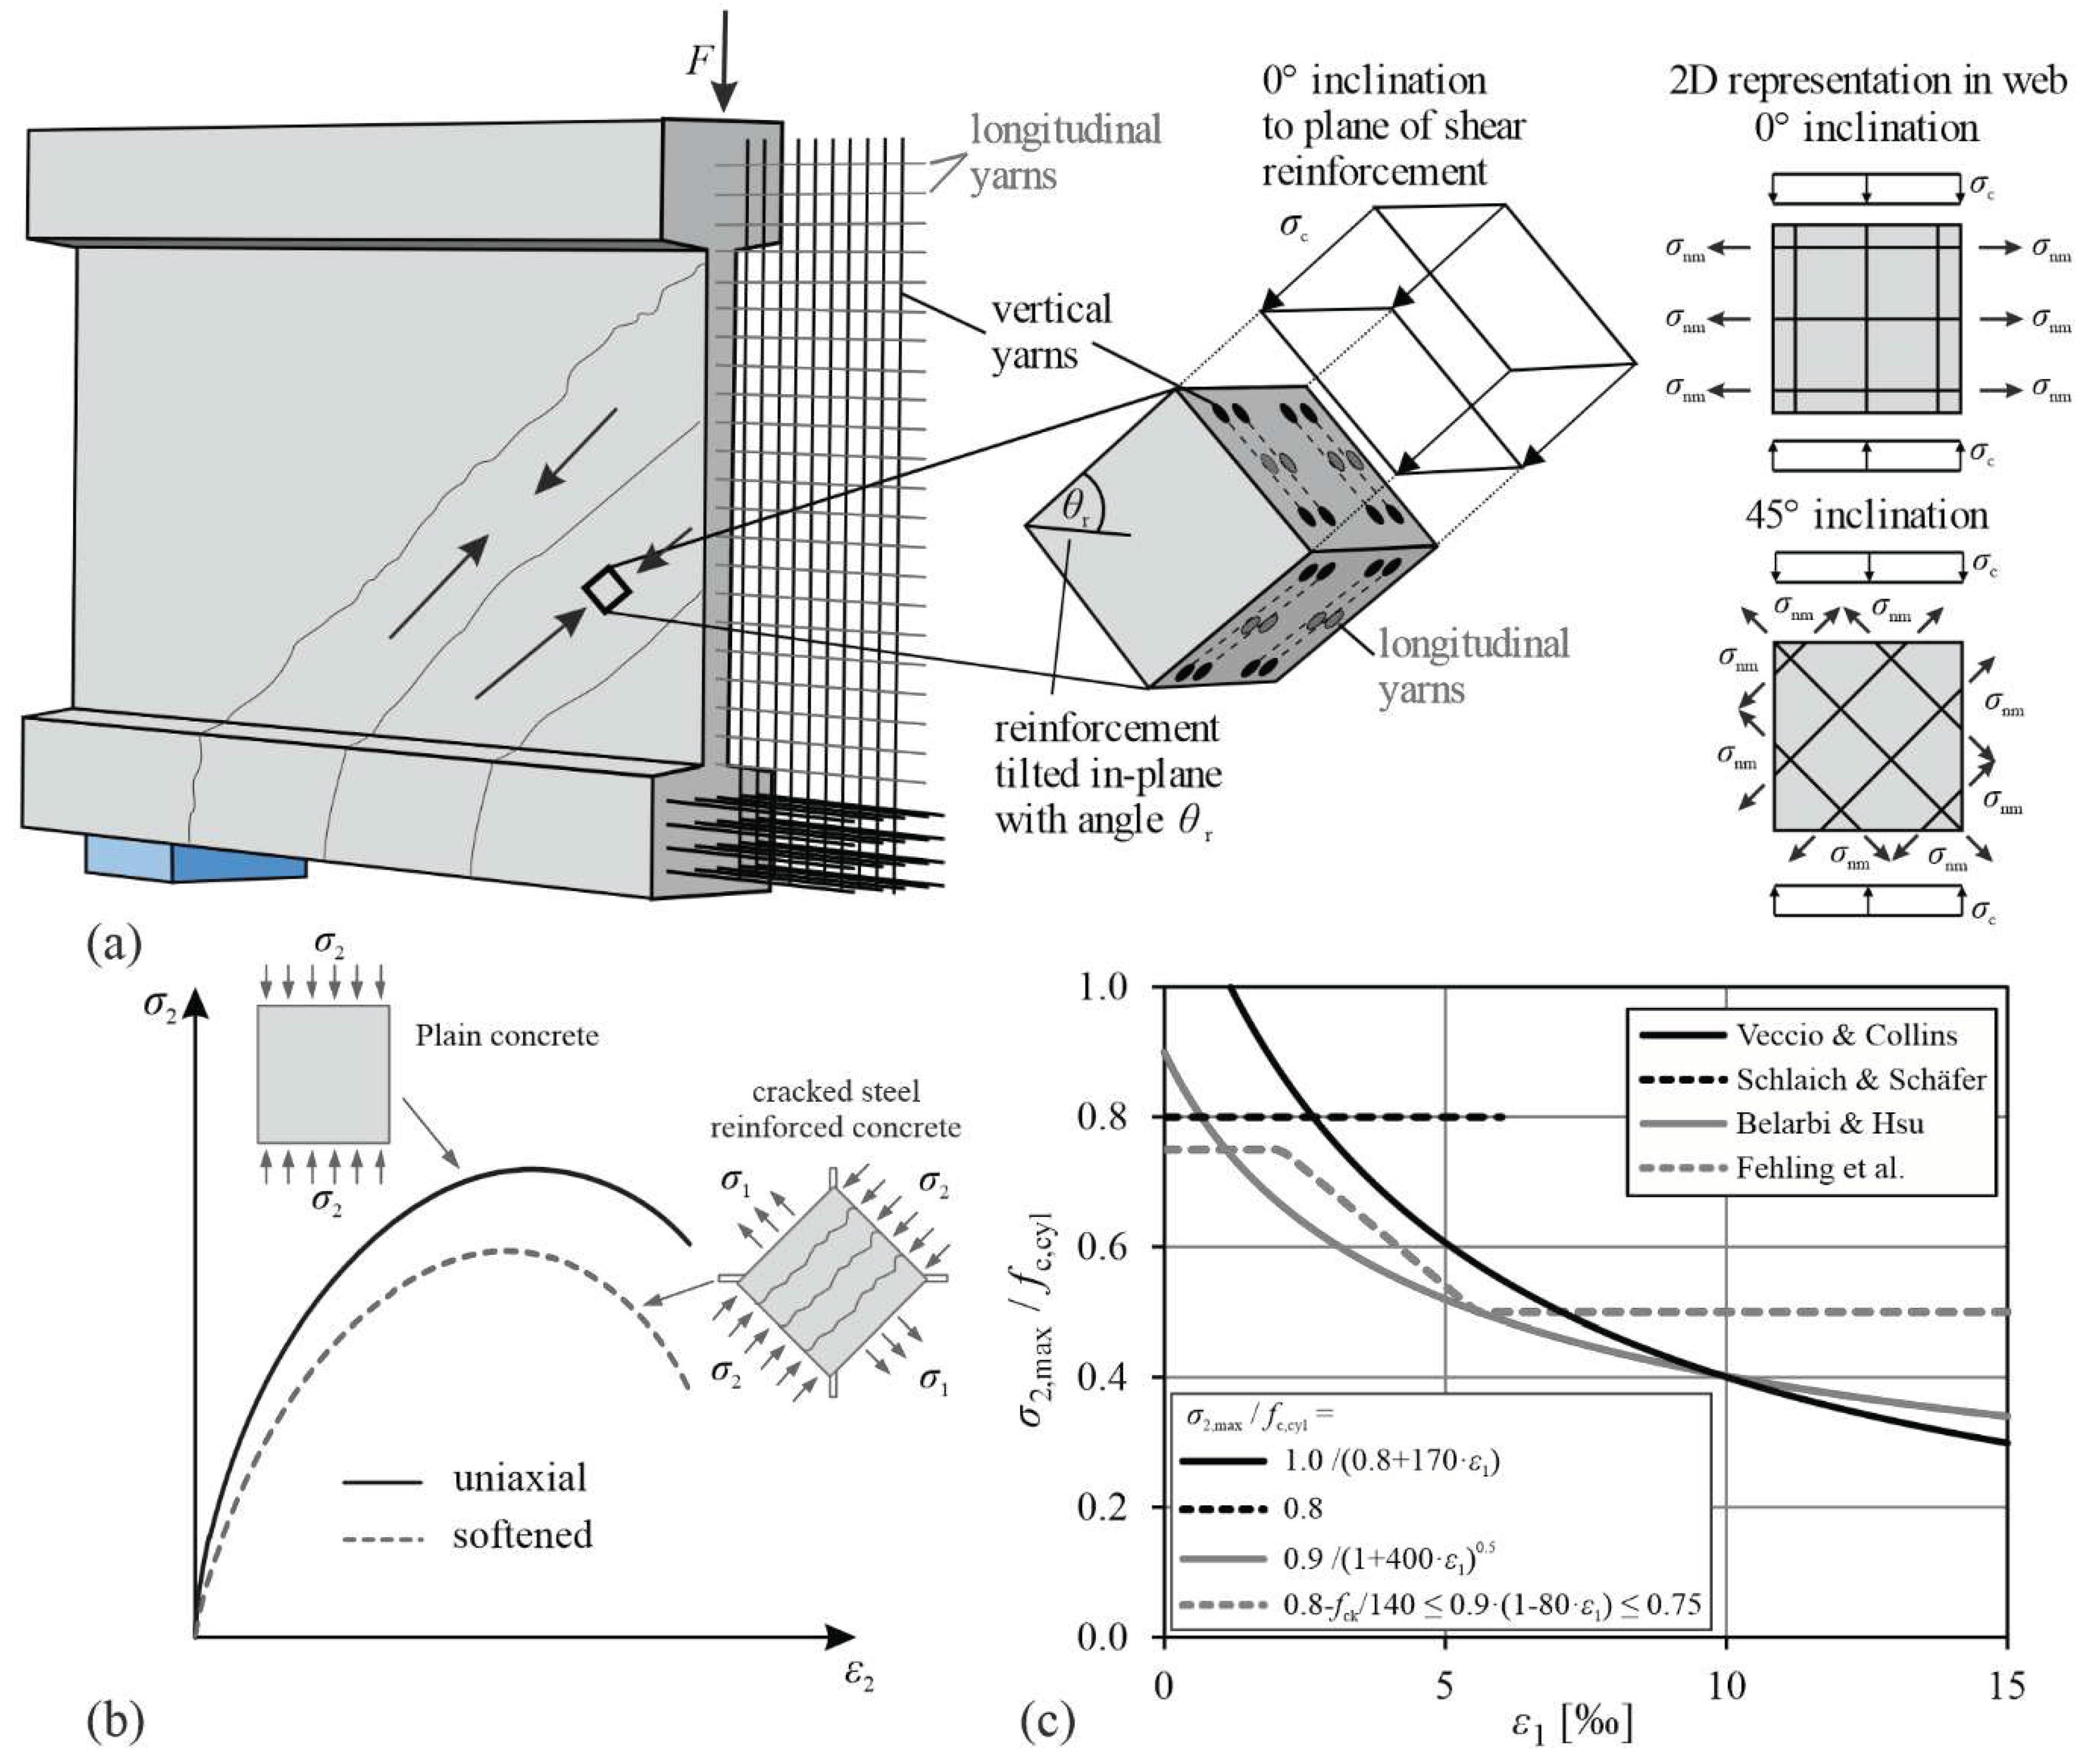
- The compression softening behaviour can be described by a three-branched constitutive law as a function of the transverse tensile panel strain εCRC1 applied with a lower limit of 0.64·fc,cyl.
Acknowledgements
References
- Hawkins W, Orr J, Shepherd P, Ibell T. Design, Construction and Testing of a Low Carbon Thin-Shell Concrete Flooring System. Structures 2019;18:60–71. [CrossRef]
- Hegger J, Curbach M, Stark A, Wilhelm S, Farwig K. Innovative design concepts: Application of textile reinforced concrete to shell structures. Structural Concrete 2018;19(3):637–46. [CrossRef]
- Heid A-C von der, Bosbach S, Hegger J. Production and Performance of Sandwich Elements with Textile Reinforced Facings Prestressed with CFRP. In: Zhao B, Lu X, editors. Concrete Structures for Resilient Society: Proceedings of the fib Symposium 2020; 2020, p. 280–287.
- Kromoser B, Preinstorfer P, Kollegger J. Building lightweight structures with carbon-fiber-reinforced polymer-reinforced ultra-high-performance concrete: Research approach, construction materials, and conceptual design of three building components. Structural Concrete 2019;20(2):730–44. [CrossRef]
- Scheerer S, Chudoba R, Garibaldi MP, Curbach M. Shells Made of Textile Reinforced Concrete - Applications in Germany. Journal IASS 2017;58(1):79–93. [CrossRef]
- Scholzen A, Chudoba R, Hegger J. Thin-walled shell structures made of textile-reinforced concrete: Part I: Structural design and construction. Structural Concrete 2015;16(1):106–14. [CrossRef]
- Sharei E, Scholzen A, Hegger J, Chudoba R. Structural behavior of a lightweight, textile-reinforced concrete barrel vault shell. Composite Structures 2017;171:505–14. [CrossRef]
- Spartali H, van der Woerd JD, Hegger J, Chudoba R. Stress redistribution capacity of textile-reinforced concrete shells folded utilizing parameterized waterbomb patterns. In: IASS 2022, p. 96–106.
- Stark A, Classen M, Knorrek C, Camps B, Hegger J. Sandwich panels with folded plate and doubly curved UHPFRC facings. Structural Concrete 2018;19(6):1851–61. [CrossRef]
- Woerd JD van der, Bonfig C, Chudoba R, Hegger J. Construction of a vault using folded segments made out of textile reinforced concrete by fold-in-fresh. In: Bögle A, Grohmann M, editors. Interfaces: architecture.engineering.science: Proceedings of the IASS Annual Symposium 2017; 2017.
- Beckmann B, Bielak J, Bosbach S, Scheerer S, Schmidt C, Hegger J et al. Collaborative research on carbon reinforced concrete structures in the CRC / TRR 280 project. Civil Engineering Design 2021;3(3):99–109. [CrossRef]
- Kupfer, H. Das Verhalten des Betons unter mehrachsiger Kurzzeitbelastung unter besonderer Beruecksichtigung der zweiachsigen Beanspruchung. In: Deutscher Ausschuss für Stahlbeton, editor. DAfStb-Heft 229. Beuth; 1973, p. 1–95.
- Curbach M, Scheerer S, Speck K, Hampel T. Experimentelle Analyse des Tragverhaltens von Hochleistungsbeton unter mehraxialer Beanspruchung: DAfStb-Heft 578. DAfStb: Beuth; 2011.
- Stark A, Classen M, Hegger J. Bond behaviour of CFRP tendons in UHPFRC. Engineering Structures 2019;178:148–61. [CrossRef]
- Molter, M. Zum Tragverhalten von textilbewehrtem Beton [Dissertation]. Aachen: RWTH Aachen University; 2005.
- Voss, S. Ingenieurmodelle zum Tragverhalten von textilbewehrtem Beton [Dissertation]. Aachen: RWTH Aachen University; 2008.
- Bielak, J. Shear in slabs with non-metallic reinforcement [Dissertation]. Aachen: RWTH Aachen University; 2021.
- Bochmann, J. Carbonbeton unter einaxialer Druckbeanspruchung [Dissertation]. Dresden: TU Dresden; 2019.
- Bochmann J, Curbach M, Jesse F. Influence of artificial discontinuities in concrete under compression load-A literature review. Struct Concrete 2018;19(2):559–67. [CrossRef]
- Reichenbach S, Preinstorfer P, Hammerl M, Kromoser B. A review on embedded fibre-reinforced polymer reinforcement in structural concrete in Europe. Construction and Building Materials 2021;307:124946. [CrossRef]
- Brameshuber W (ed.). State-of-the-Art report of RILEM Technical Committee TC 201-TRC 'Textile Reinforced Concrete'. Bagneux: RILEM Publ; 2006.
- Bielak J, Hegger J. Schalentragwerke aus Spritzbeton mit textiler Bewehrung: aktuelle Entwicklungen bei Bemessungs-, Herstell- und Prüfmethodik. In: Kusterle W, editor. Proceedings der Spritzbeton Tage 2018; 2018.
- Moccia F, Yu Q, Fernández Ruiz M, Muttoni A. Concrete compressive strength: From material characterization to a structural value. Struct Concrete 2021;22(S1):634–54. [CrossRef]
- Betz, P. Carbonbeton unter Druck - Einfluss von Querdruck und Querzug. In: Deutscher Ausschuss für Stahlbeton, editor. 61. Forschungskolloquium des Deutschen Ausschusses für Stahlbeton; 2022, p. 169–174.
- Feng D-C, Wu G, Lu Y. Finite element modelling approach for precast reinforced concrete beam-to-column connections under cyclic loading. Engineering Structures 2018;174:49–66. [CrossRef]
- Belarbi A, Hsu TTC. Constitutive laws of reinforced concrete in biaxial tension-compression. Houston, Texas; 1991.
- Bhide SB, Collins MP. Influence of Axial Tension on the Shear Capacity of Reinforced Concrete Members. ACI SJ 1989;86(5):570–81.
- Gehri N, Mata-Falcón J, Kaufmann W. Refined extraction of crack characteristics in large-scale concrete experiments based on digital image correlation. Engineering Structures 2022;251:113486. [CrossRef]
- Vecchio F, Collins MP. The response of reinforced concrete to in-plane shear and normal stresses. Toronto, Ontario, Canada: University of Toronto, Dept. of Civil Engineering; 1982.
- Eibl J, Neuroth U. Untersuchungen zur Druckfestigkeit von bewehrtem Beton bei gleichzeitig wirkendem Querzug; 1988.
- Fehling E, Leutbecher T, Röder F-K, Stürwald S. Structural behavior of UHPC under biaxial loading. In: Fehling E, Schmidt M, Stürwald S, editors. Ultra High Performance Concrete (UHPC) Proceedings of the Second International Symposium on Ultra High Performance Concrete Kassel; 2008, p. 569–576.
- Kollegger J, Mehlhorn G. Experimentelle Untersuchungen zur Bestimmung der Druckfestigkeit des gerissenen Stahlbetons bei einer Querzugbeanspruchung: DAfStb-Heft 413. Berlin: Beuth; 1990.
- Robinson JR, Demorieux J-M. Essais de traction-compression sur modeles d’ame de poutre en béton armé [Bericht]; 1968.
- Schlaich J, Schäfer K. Zur Druck-Querzug-Festigkeit des Stahlbetons. BuSt 1983;78(3):73–8. [CrossRef]
- Bosbach S, Bielak J, Schmidt C, Hegger J, Classen M. Influence of Transverse Tension on the Compressive Strength of Carbon Reinforced Concrete. In: Cardoso DCT, Harries KA, editors. Proceedings of 11th International Conference on Fiber-Reinforced Polymer (FRP) Composites in Civil Engineering (CICE 2023); 2023.
- CEN/TC 250/SC 2/WG 1. prEN 1992-1-1/2021-09: Eurocode 2: Design of Concrete Structures - Part 1-1: General rules for buildings, bridges and civil engineering structures. stable version by Project Team SC2.T1; 2021.
- Hegger J, Voss S. Textile reinforced concrete under biaxial loading. In: Prisco M Di, Felicetti R, Plizzari GA, editors. Proceedings of 6th RILEM Symposium on Fibre-Reinforced Concretes (FRC). Bagneux, France: Rilem publications; 2004, p. 1463–1472.
- Zomorodian, M. Behaviour of FRP strengthened concrete panel elements subjected to pure shear [Dissertation]. Houston, Texas: University of Houston; 2015.
- Bielak J, Schmidt M, Hegger J, Jesse F. Structural Behavior of Large-Scale I-Beams with Combined Textile and CFRP Reinforcement. Applied Sciences 2020;10(13). [CrossRef]
- Betz P, Marx S, Curbach M. Einfluss von Querzugspannungen auf die Druckfestigkeit von Carbonbeton. Beton und Stahlbetonbau 2023;118(7):524–33. [CrossRef]
- Schneider K, Butler M, Mechtcherine V. Carbon Concrete Composites C3 - Nachhaltige Bindemittel und Betone für die Zukunft. BuSt 2017;112(12):784–94. [CrossRef]
- Bielak J, Schöneberg J, Classen M, Hegger J. Shear capacity of continuous concrete slabs with CFRP reinforcement. Construction and Building Materials 2022;320. [CrossRef]
- Bielak, J. On the role of dowel action in shear transfer of CFRP textile-reinforced concrete slabs. Composite Structures 2023;311:116812. [CrossRef]
- Deutsches Institut für Normung e.V. Prüfung von Festbeton- Teil 3: Druckfestigkeit von Probekörpern: Deutsche Fassung EN 12390-3:2019;91.100.30(DIN EN 12390-3:2019-10). Berlin: Beuth; 2019. [CrossRef]
- Deutsches Institut für Normung e.V. Prüfung von Festbeton – Teil 13: Bestimmung des Elastizitätsmoduls unter Druckbelastung (Sekantenmodul): Deutsche Fassung EN 12390-13:2021;91.100.30(DIN EN 12390-13:2021-09). Berlin: Beuth; 2021.
- Deutsches Institut für Normung e.V. Prüfverfahren für Zement - Teil 1: Bestimmung der Festigkeit: Deutsche Fassung EN 196-1:2016;91.100.10(DIN EN 196-1:2016-11). Berlin: Beuth; 2016.
- Deutscher Ausschuss für Stahlbeton. DAfStb-Richtlinie Betonbauteile mit nichtmetallischer Bewehrung - Entwurf vom 06. September 2022: D194. Berlin: Beuth; 2022.
- Bosbach S, Hegger J, Classen M. Dowel action of textile CFRP shear reinforcement in carbon reinforced concrete. Construction and Building Materials 2023(under review).
- Bergmann S, Classen M, Hegger J. Experimental study on the shear behavior of multi-span CFRP reinforced beams with shear reinforcement subjected to concentrated and distributed loading. Buildings 2023 (under review).
- Schütze E, Bielak J, Scheerer S, Hegger J, Curbach M. Einaxialer Zugversuch für Carbonbeton mit textiler Bewehrung. BuSt 2018;113(1):33–47. [CrossRef]
- Fehling E, Leutbecher T, Röder F-K. Zur Druck-Zug-Festigkeit von Stahlbeton und stahlfaserverstärktem Stahlbeton. BuSt 2009;104(8):471–84. [CrossRef]
- Becks H, Bielak J, Hegger J. Interaction of normal and shear loads in carbon reinforced slab segments. In: IABSE, editor. Proceedings of IABSE Congress: Structural Engineering for Future Societal Needs; 2021, p. 1233–1241.
- Kupfer H, Hilsdorf HK, Ruesch H. Behavior of Concrete Under Biaxial Stresses. ACI Journal 1969:656 bis 666.
- Gerstle KH, Aschl H, Bellotti R, Beracchi P, Kotsovos MD, Ko H-Y et al. Behaviour of Concrete under Multiaxial Stress States. Journal of the Engineering Mechanics Division 1980;Vol. 106(No. EM6).
- Deutsches Institut für Normung e.V. Prüfung von Festbeton - Teil 1: Form, Maße und andere Anforderungen für Probekörper und Formen: Deutsche Fassung EN 12390-1:2012;91.100.30(DIN EN 12390-1:2012-12). Berlin: Beuth; 2012.
- Bielak J, Spelter A, Will N, Claßen M. Verankerungsverhalten textiler Bewehrungen in dünnen Betonbauteilen. BuSt 2018;113(7):515–24. [CrossRef]
- Becks H, Baktheer A, Marx S, Classen M, Hegger J, Chudoba R. Monitoring concept for the propagation of compressive fatigue in externally prestressed concrete beams using digital image correlation and fiber optic sensors. Fatigue & Fracture of Engineering Materials & Structures 2023;46(2):514–26. [CrossRef]
- Becks H, Bielak J, Camps B, Hegger J. Application of fiber optic measurement in textile-reinforced concrete testing. Struct Concrete 2021. [CrossRef]
- Janiak T, Becks H, Camps BH, Hegger J. A unified approach to the evaluation of distributed fibre optic sensors in structural concrete. Materials and Structures 2023(accepted).
- European Standard. Eurocode 2: Design of concrete structures – Part 1-1: General rules and rules for buildings. Incl. Corrigendum 1: EN 1992-1-1:2004/AC:2008, incl. Corrigendum 2: EN 1992-1-1:2004/AC:2010, incl. Amendment 1: EN 1992-1-1:2004/A1:2014(EN 1992-1-1:2004/A1); 2014.
- Miyahara T, Kawakami T, Maekawa K. Nonlineat behavior of cracked reinforced concrete plate element. Concrete Library of JSCE 1988(11).
- Schießl, A. Die Druckfestigkeit von gerissenen Scheiben aus Hochleistungsbeton und selbstverdichtendem Beton unter besonderer Berücksichtigung des Einflusses der Rissneigung. Deutscher Ausschuss für Stahlbeton 2005(548).
- Maekawa, K. The deformational behavior and constitutive equation of concrete based on the elasto-plastic and fracture model [Dissertation]. Tokyo: University of Tokyo; 1985.
- Roos, W. Zur Druckfestigkeit des gerissenen Stahlbetons in scheibenförmigen Bauteilen bei gleichzeitig wirkender Querzugbelastung [Dissertation]. München: Technische Universität München; 1995.
- Kaufmann W, Marti P. Structural Concrete: Cracked Membrane Model. J. Struct. Eng. 1998;124(12):1467–75. [CrossRef]
- Classen M, Hegger J. Shear Tests on Composite Dowel Rib Connectors in Cracked Concrete. ACI SJ 2018;115(3). [CrossRef]
- Ungermann J, Adam V, Classen M. Fictitious Rough Crack Model (FRCM): A Smeared Crack Modelling Approach to Account for Aggregate Interlock and Mixed Mode Fracture of Plain Concrete. Materials 2020;13(12):2774. [CrossRef]


| Ingredient | Density | Content | Ratio | ||
|---|---|---|---|---|---|
| [kg/m3] | [kg/m3] | [%] | |||
| Cementitious binder compound BMC CEM II/C-M Deuna | 2962 | 707 | 29,9 | ||
| Water | 1000 | 165 | 7,0 | ||
| Fine quartz sand | F38 S | 2650 | 294 | 12,4 | |
| Quartz sand | 0.1–0.5 mm | 2650 | 243.2 | 10,3 | |
| Quartz sand | 0.5–1.0 mm | 2650 | 201.4 | 8,5 | |
| Quartz sand | 1.0–2.0 mm | 2650 | 148.9 | 6,3 | |
| Quartz fine gravel | 2.0–4.0 mm | 2650 | 593.5 | 25,1 | |
| Superplasticizer MC-VP-16–0205-02 | 1070 | 15 | 0,5 | ||
| Type of reinforcement | Material | Cross section* | Distance between roving axes | Tensile strength | Young’s Modulus | ||||
|---|---|---|---|---|---|---|---|---|---|
| [mm²/m] | [mm] | [MPa] | [GPa] | ||||||
| 0° | 90° | 0° | 90° | 0° | 90° | 0° | 90° | ||
| Planar grid | CFRP | 95 | 95 | 38 | 38 | 3710 | 3490 | 231 | 244 |
| Preformed grid | CFRP | 95 | 95 | 38 | 38 | 2600 | 1930 | 219 | 191 |
| Test series | # of tests | type of loading | d1 | ρ | grid orientation | investigated influence |
|---|---|---|---|---|---|---|
| [mm] | [%] | [mm] | ||||
| CS-1 | 3 | uniaxial compression | plain concrete | panel geometry | ||
| CS-2 | 3 | uniaxial compression via steel platens | plain concrete | load introduction | ||
| CS-3 | 3 | uniaxial compression | 10 | 0.5 | 0°/90° | presence of grids |
| CS-4 | 5 | uniaxial compression | 15 | 0.5 | 0°/90° | concrete cover |
| CS-5 | 3 | uniaxial compression | 10 | 0.75 | 0°/90° | reinforcement ratio |
| CS-6 | 3 | uniaxial compression | 10 | 1.00 | 0°/90° | reinforcement ratio |
| CS-7 | 6 | biaxial proportional | 10 | 0.5 | 0°/90° | σnm1 / σc2 = 3.9 … 44.9 |
| CS-8 | 6 | biaxial proportional | 15 | 0.5 | 0°/90° | σnm1 / σc2 = 3.9 … 38.7 |
| CS-9 | 6 | biaxial proportional | 10 | 0.75 | 0°/90° | σnm1 / σc2 = 4 … 36.7 |
| CS-10 | 3 | biaxial sequential | 10 | 0.5 | 0°/90° | σnm1,seq = 901 … 2345 MPa |
| CS-11 | 4 | biaxial proportional | 10 | 0.5 | 0°/90° preformed | σnm1 / σc2 = 14.7 … 38.4 |
| CS-12 | 3 | biaxial proportional | 10 | 0.5 | 45°/45° preformed | σnm1 / σc2 = 14.5 … 27.9 |
| Test series | d1 | ρ | fc,cyl | σc2,max1 | σc2,max / fc,cyl |
|---|---|---|---|---|---|
| [mm] | [%] | [MPa] | [MPa] | [-] | |
| CS-1 | - | - | 92.7 | 93.3 | 1.01 |
| CS-2 | - | - | 92.7 | 85.7 | 0.92 |
| CS-3 | 10 | 0.5 | 92.7 | 79.8 | 0.86 |
| CS-4 | 15 | 0.5 | 96.2 | 85.4 | 0.89 |
| CS-5 | 10 | 0.75 | 96.4 | 92.0 | 0.95 |
| CS-6 | 10 | 1.00 | 96.2 | 83.0 | 0.86 |
| Specimen | c | fc,cyl | Fmax | σc2,max1 | σc2,max / fc,cyl | σnm1 / σc2 | ε1,max2 |
|---|---|---|---|---|---|---|---|
| [-] | [mm] | [MPa] | [kN] | [MPa] | [-] | [-] | [%] |
| CS-7-1 | 10 | 93.5 | 891 | 74.2 | 0.79 | 9.9 | 1.6 |
| CS-7-2 | 10 | 93.5 | 827 | 68.9 | 0.74 | 19.6 | 3.7 |
| CS-7-3 | 10 | 93.5 | 696 | 58.0 | 0.62 | 29.3 | 4.8 |
| CS-7-4 | 10 | 96.4 | 1010 | 84.2 | 0.87 | 3.9 | 1.6 |
| CS-7-5 | 10 | 99.1 | 789 | 65.7 | 0.66 | 44.9 | 9.2 |
| CS-7-6 | 10 | 99.1 | 853 | 71.1 | 0.72 | 34.6 | 7.4 |
| CS-8-1 | 15 | 96.4 | 1016 | 84.7 | 0,88 | 3.9 | 1.0 |
| CS-8-2 | 15 | 96.4 | 1009 | 84.1 | 0.87 | 8.7 | 2.6 |
| CS-8-3 | 15 | 96.4 | 687 | 56.7 | 0.59 | 38.7 | 6.1 |
| CS-8-4 | 15 | 92.9 | 971 | 78.0 | 0.84 | 17.4 | 3.8 |
| CS-8-5 | 15 | 92.9 | 884 | 70.5 | 0.76 | 26.4 | 5.5 |
| CS-8-6 | 15 | 92.9 | 884 | 69.3 | 0.75 | 36.1 | 7.7 |
Disclaimer/Publisher’s Note: The statements, opinions and data contained in all publications are solely those of the individual author(s) and contributor(s) and not of MDPI and/or the editor(s). MDPI and/or the editor(s) disclaim responsibility for any injury to people or property resulting from any ideas, methods, instructions or products referred to in the content. |
© 2023 by the authors. Licensee MDPI, Basel, Switzerland. This article is an open access article distributed under the terms and conditions of the Creative Commons Attribution (CC BY) license (http://creativecommons.org/licenses/by/4.0/).


