Submitted:
13 December 2023
Posted:
13 December 2023
You are already at the latest version
Abstract
Keywords:
1. Introduction
2. Classification of cooling systems for astronomy
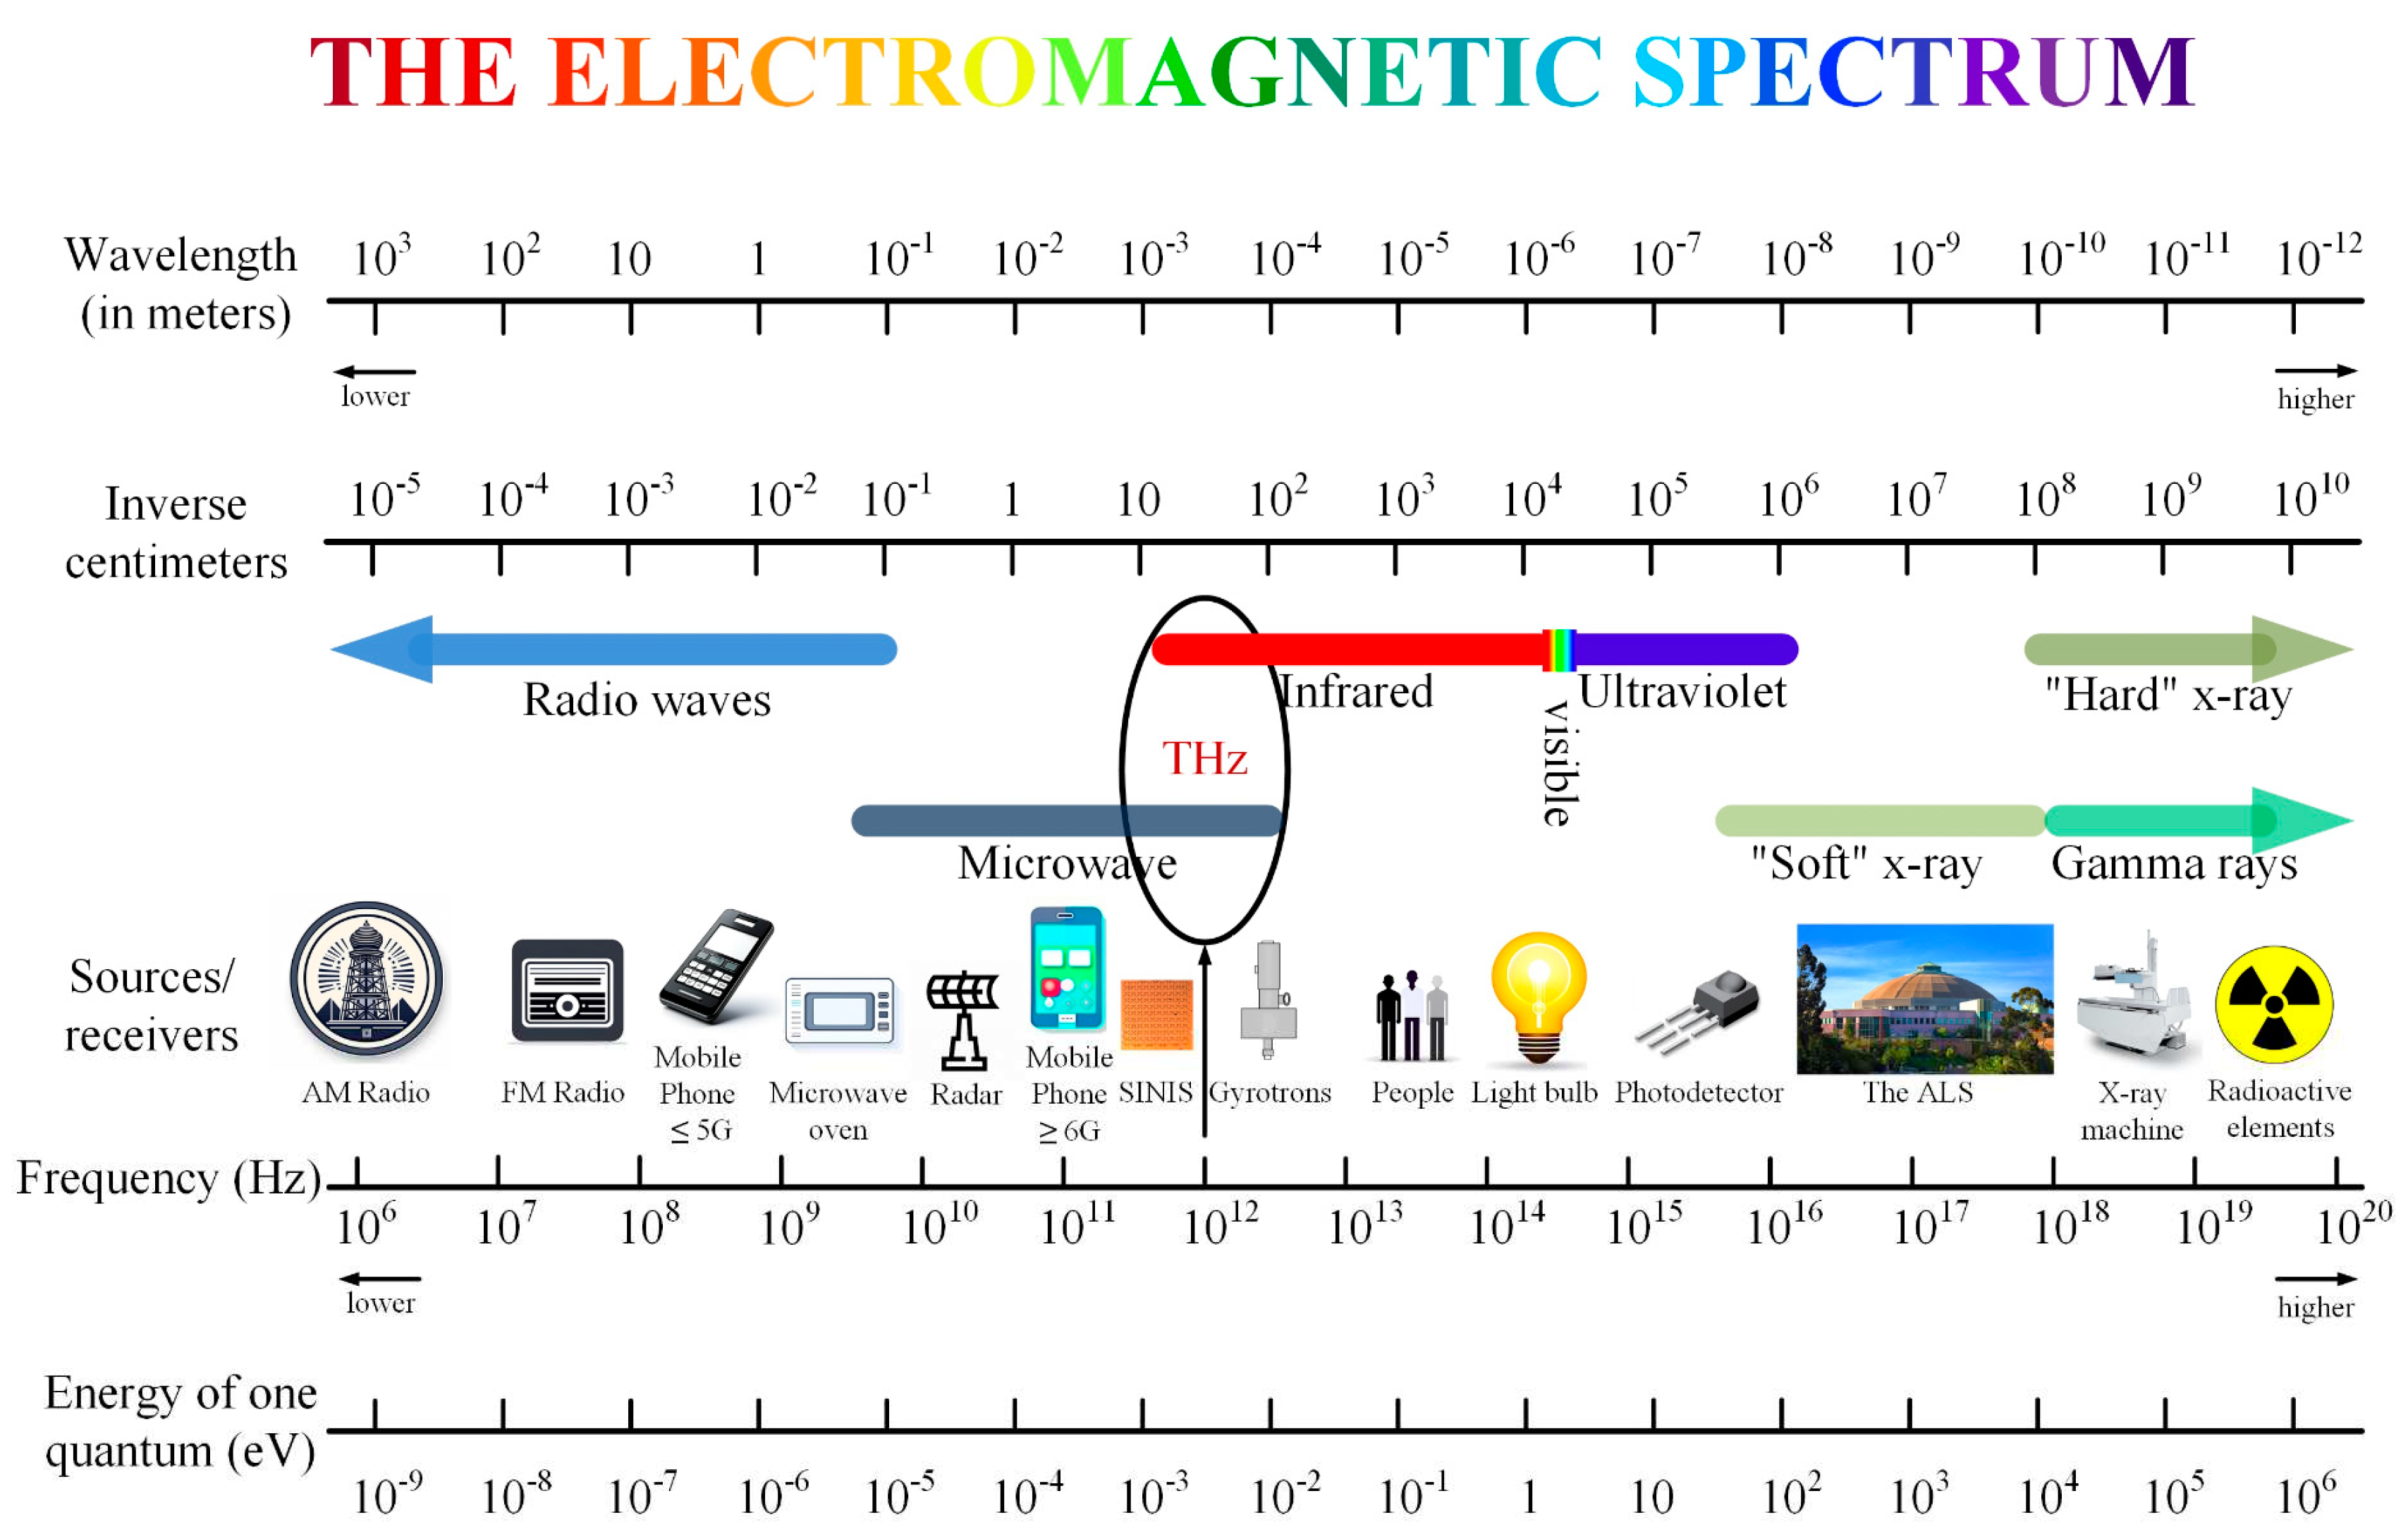
2.1. Frequency range of astronomical instruments and their cooling problems
2.2. Temperature levels of cooling for astronomical receivers
2.3. Temperature scales
2.4. The main types of cryosystems for astronomy
2.4.1. Dewars or cryoaccumulators and liquid nitrogen cooling solutions
- gaseous (cold flow of gases N2, H2 and He);
- solid (carbon dioxide);
- liquefied gas (nitrogen < 77 K, hydrogen - <20 K, helium - <4 K).
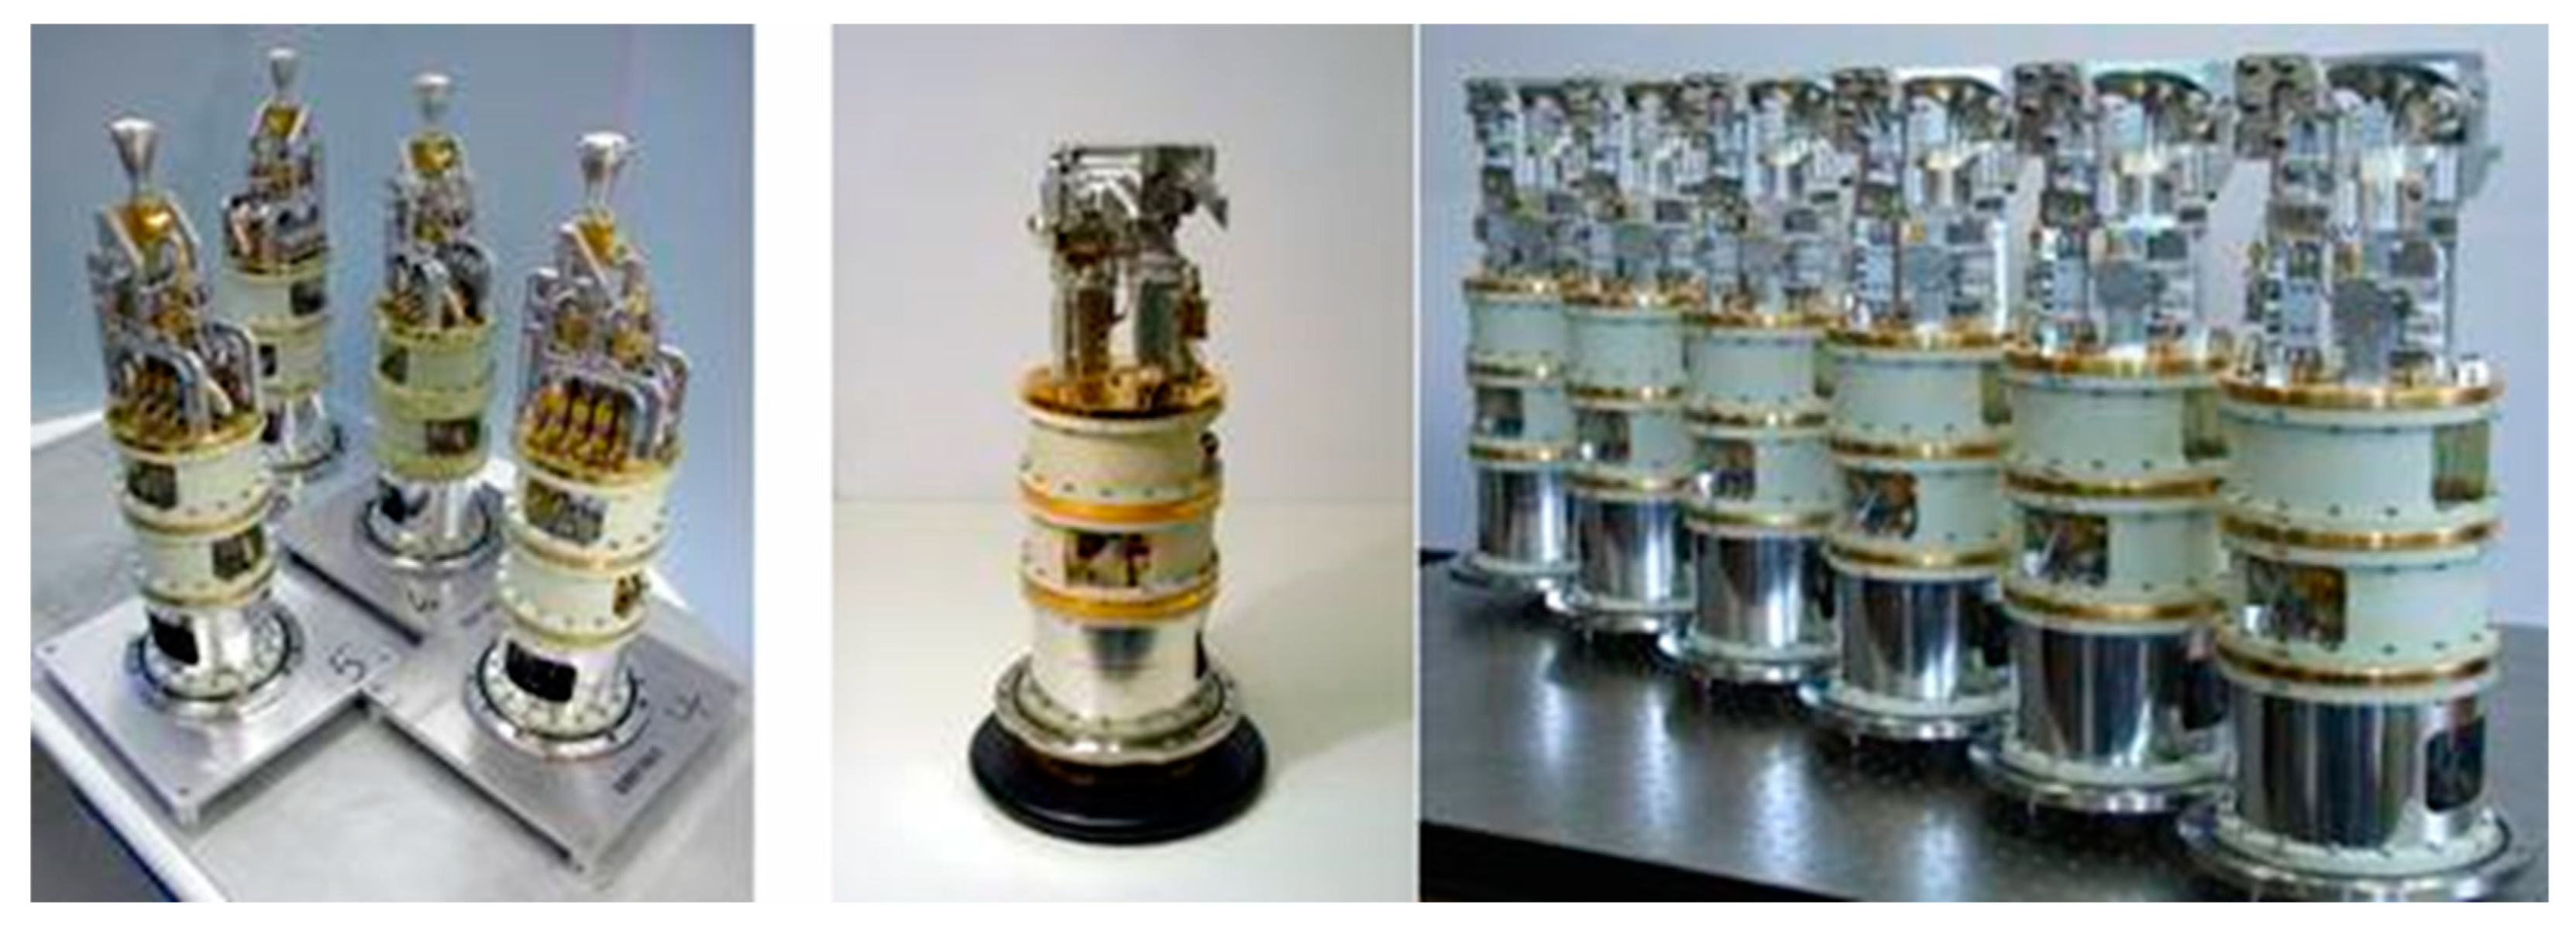
2.4.2. Hydrogen level refrigerators for astronomy and telecommunications
2.4.3. Cooling systems of helium level
2.4.5. Cryosorption cryostats
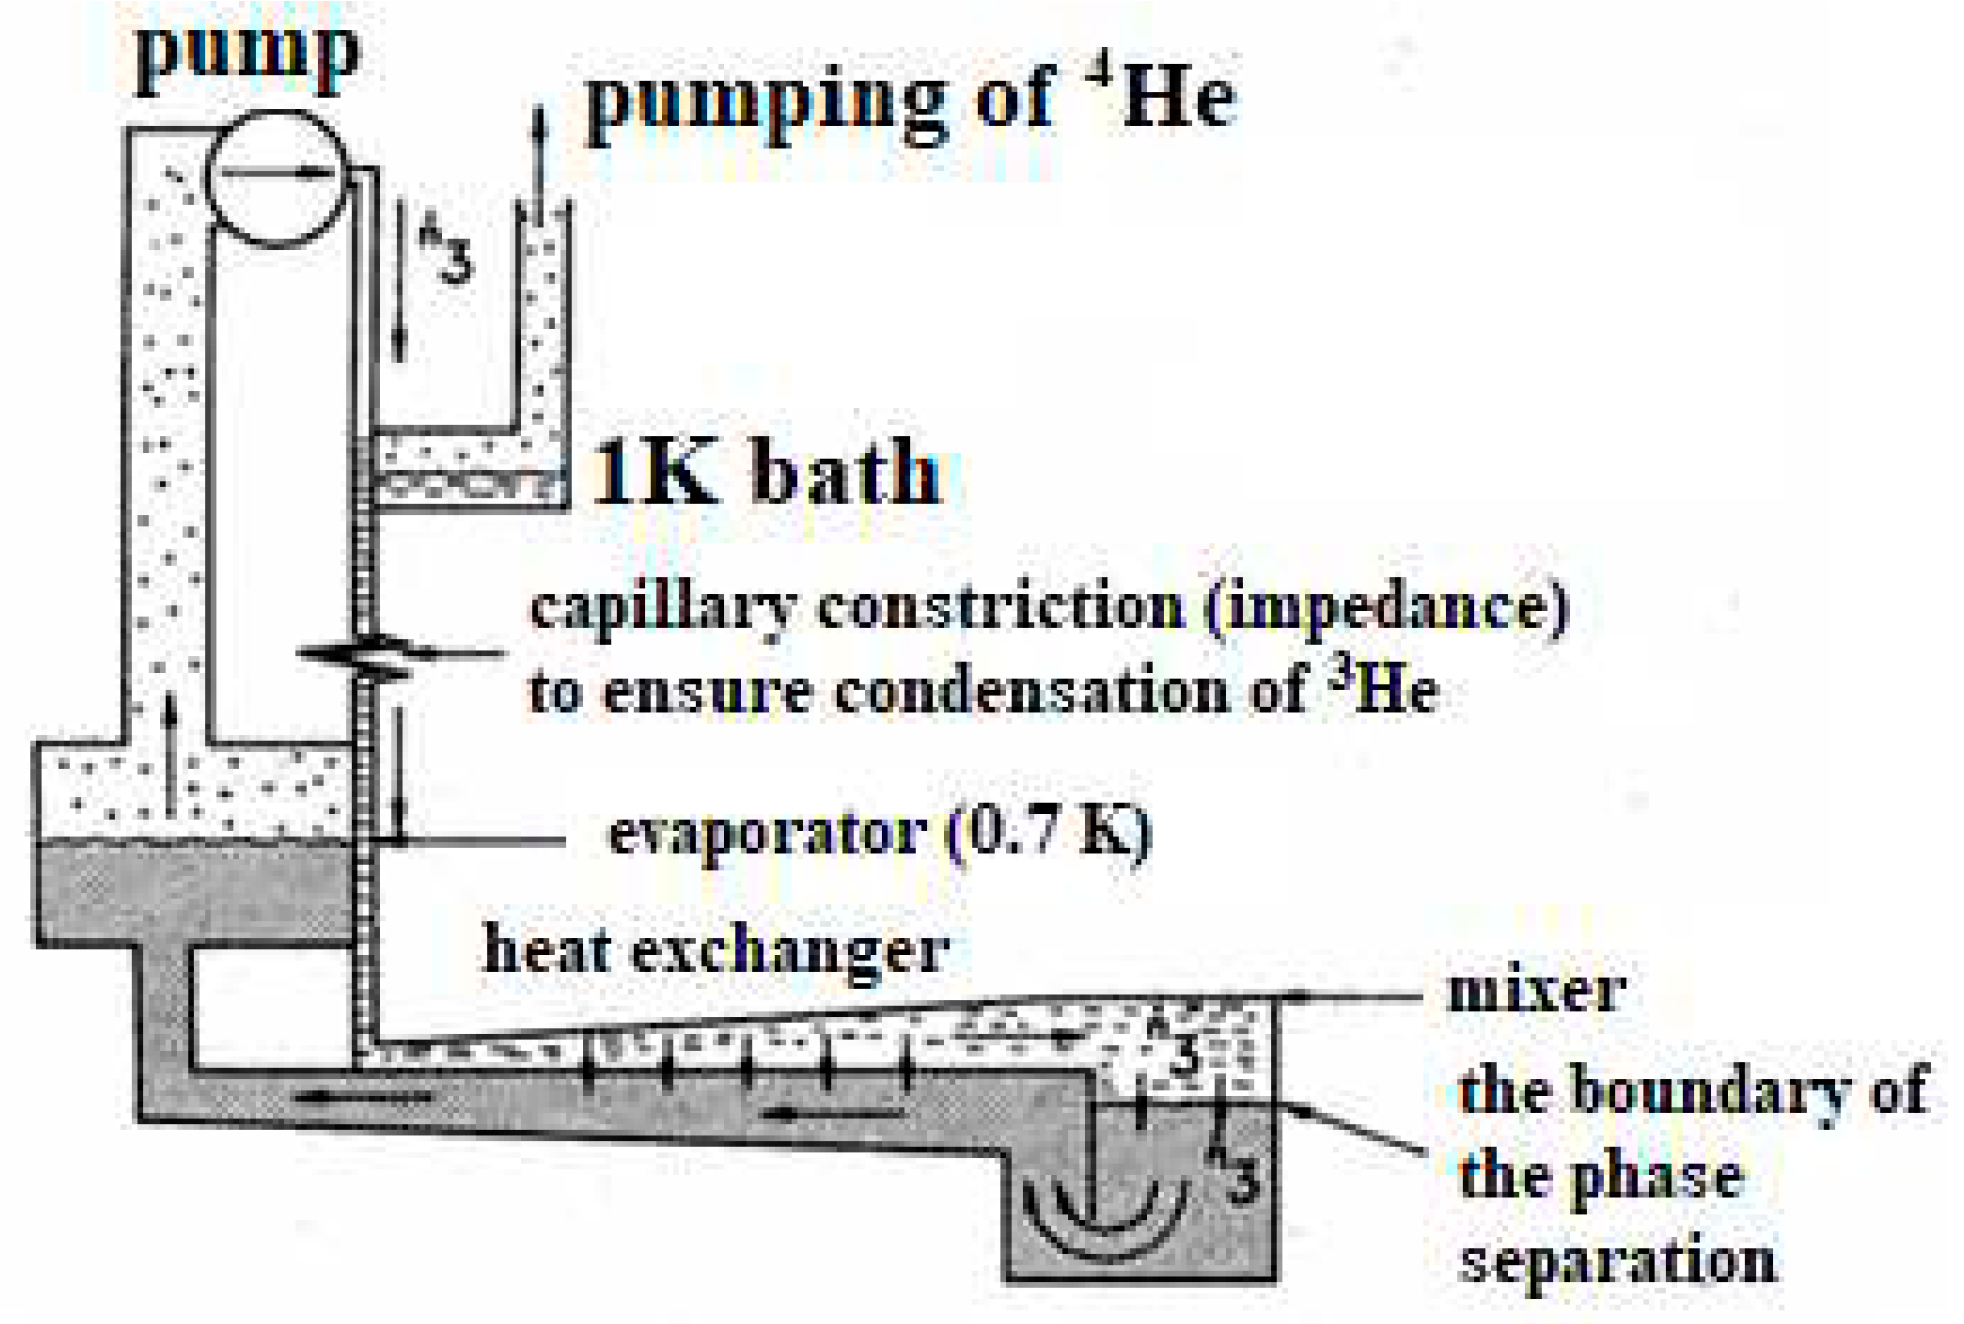
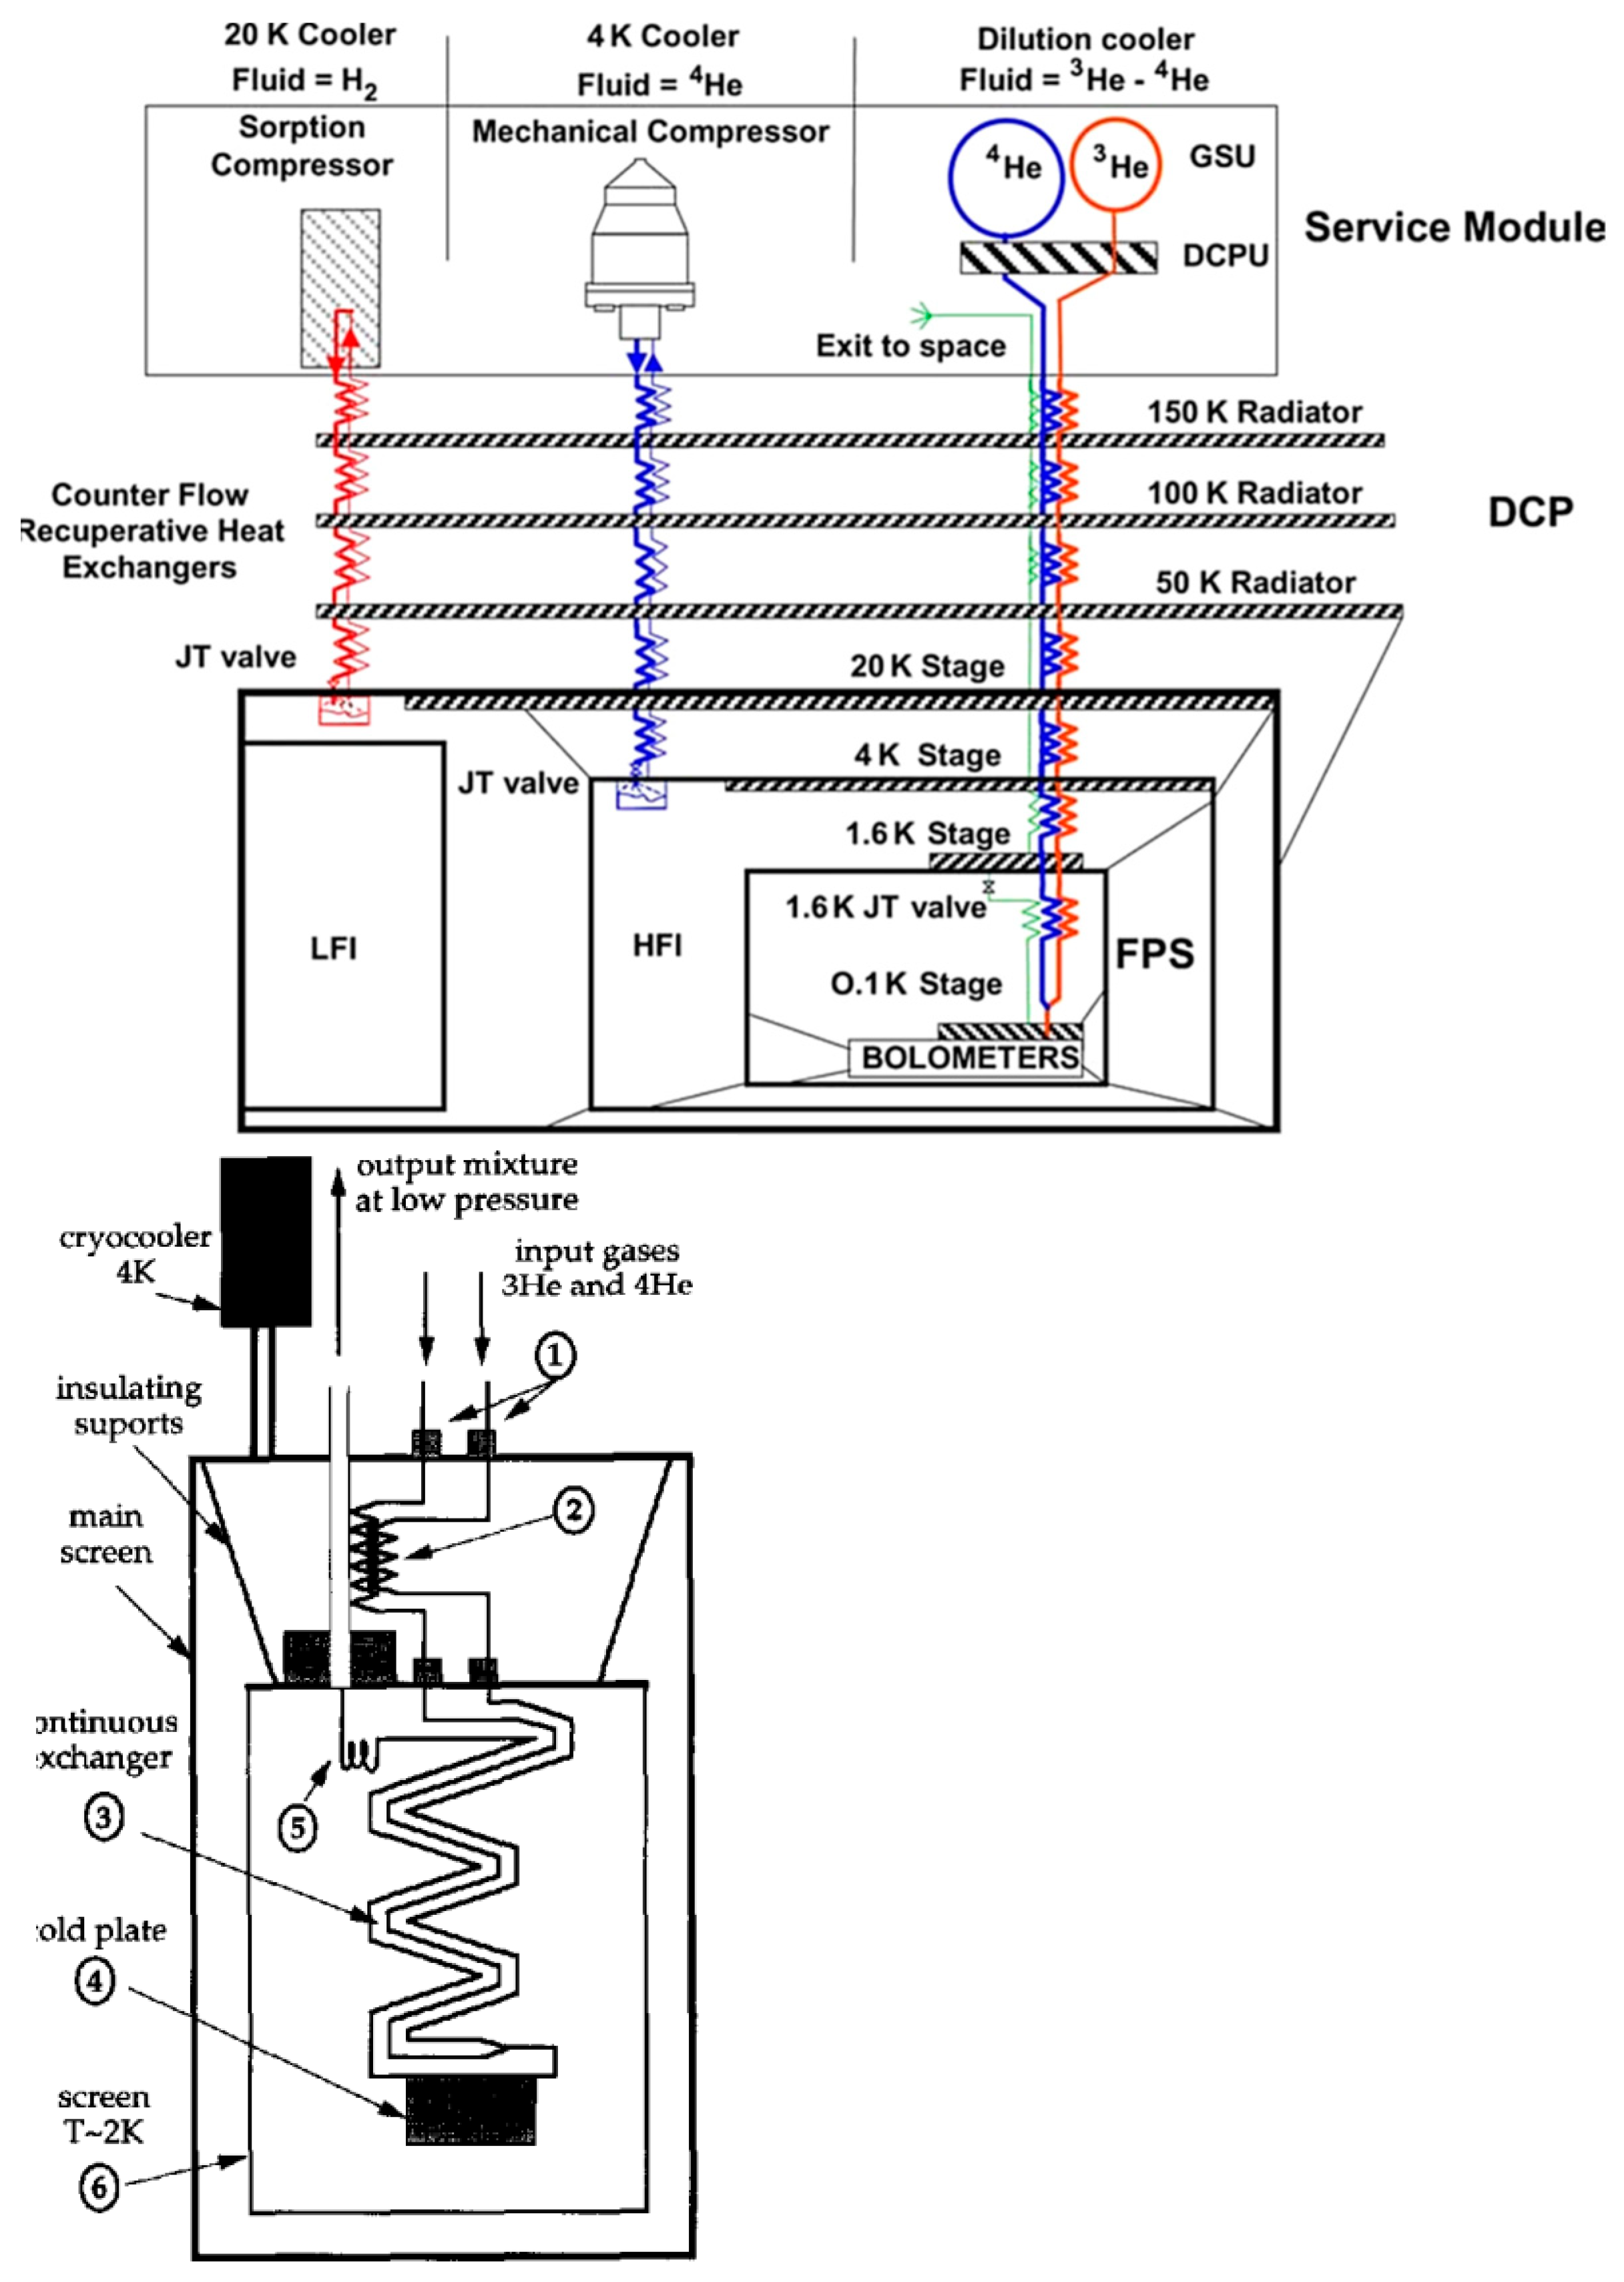
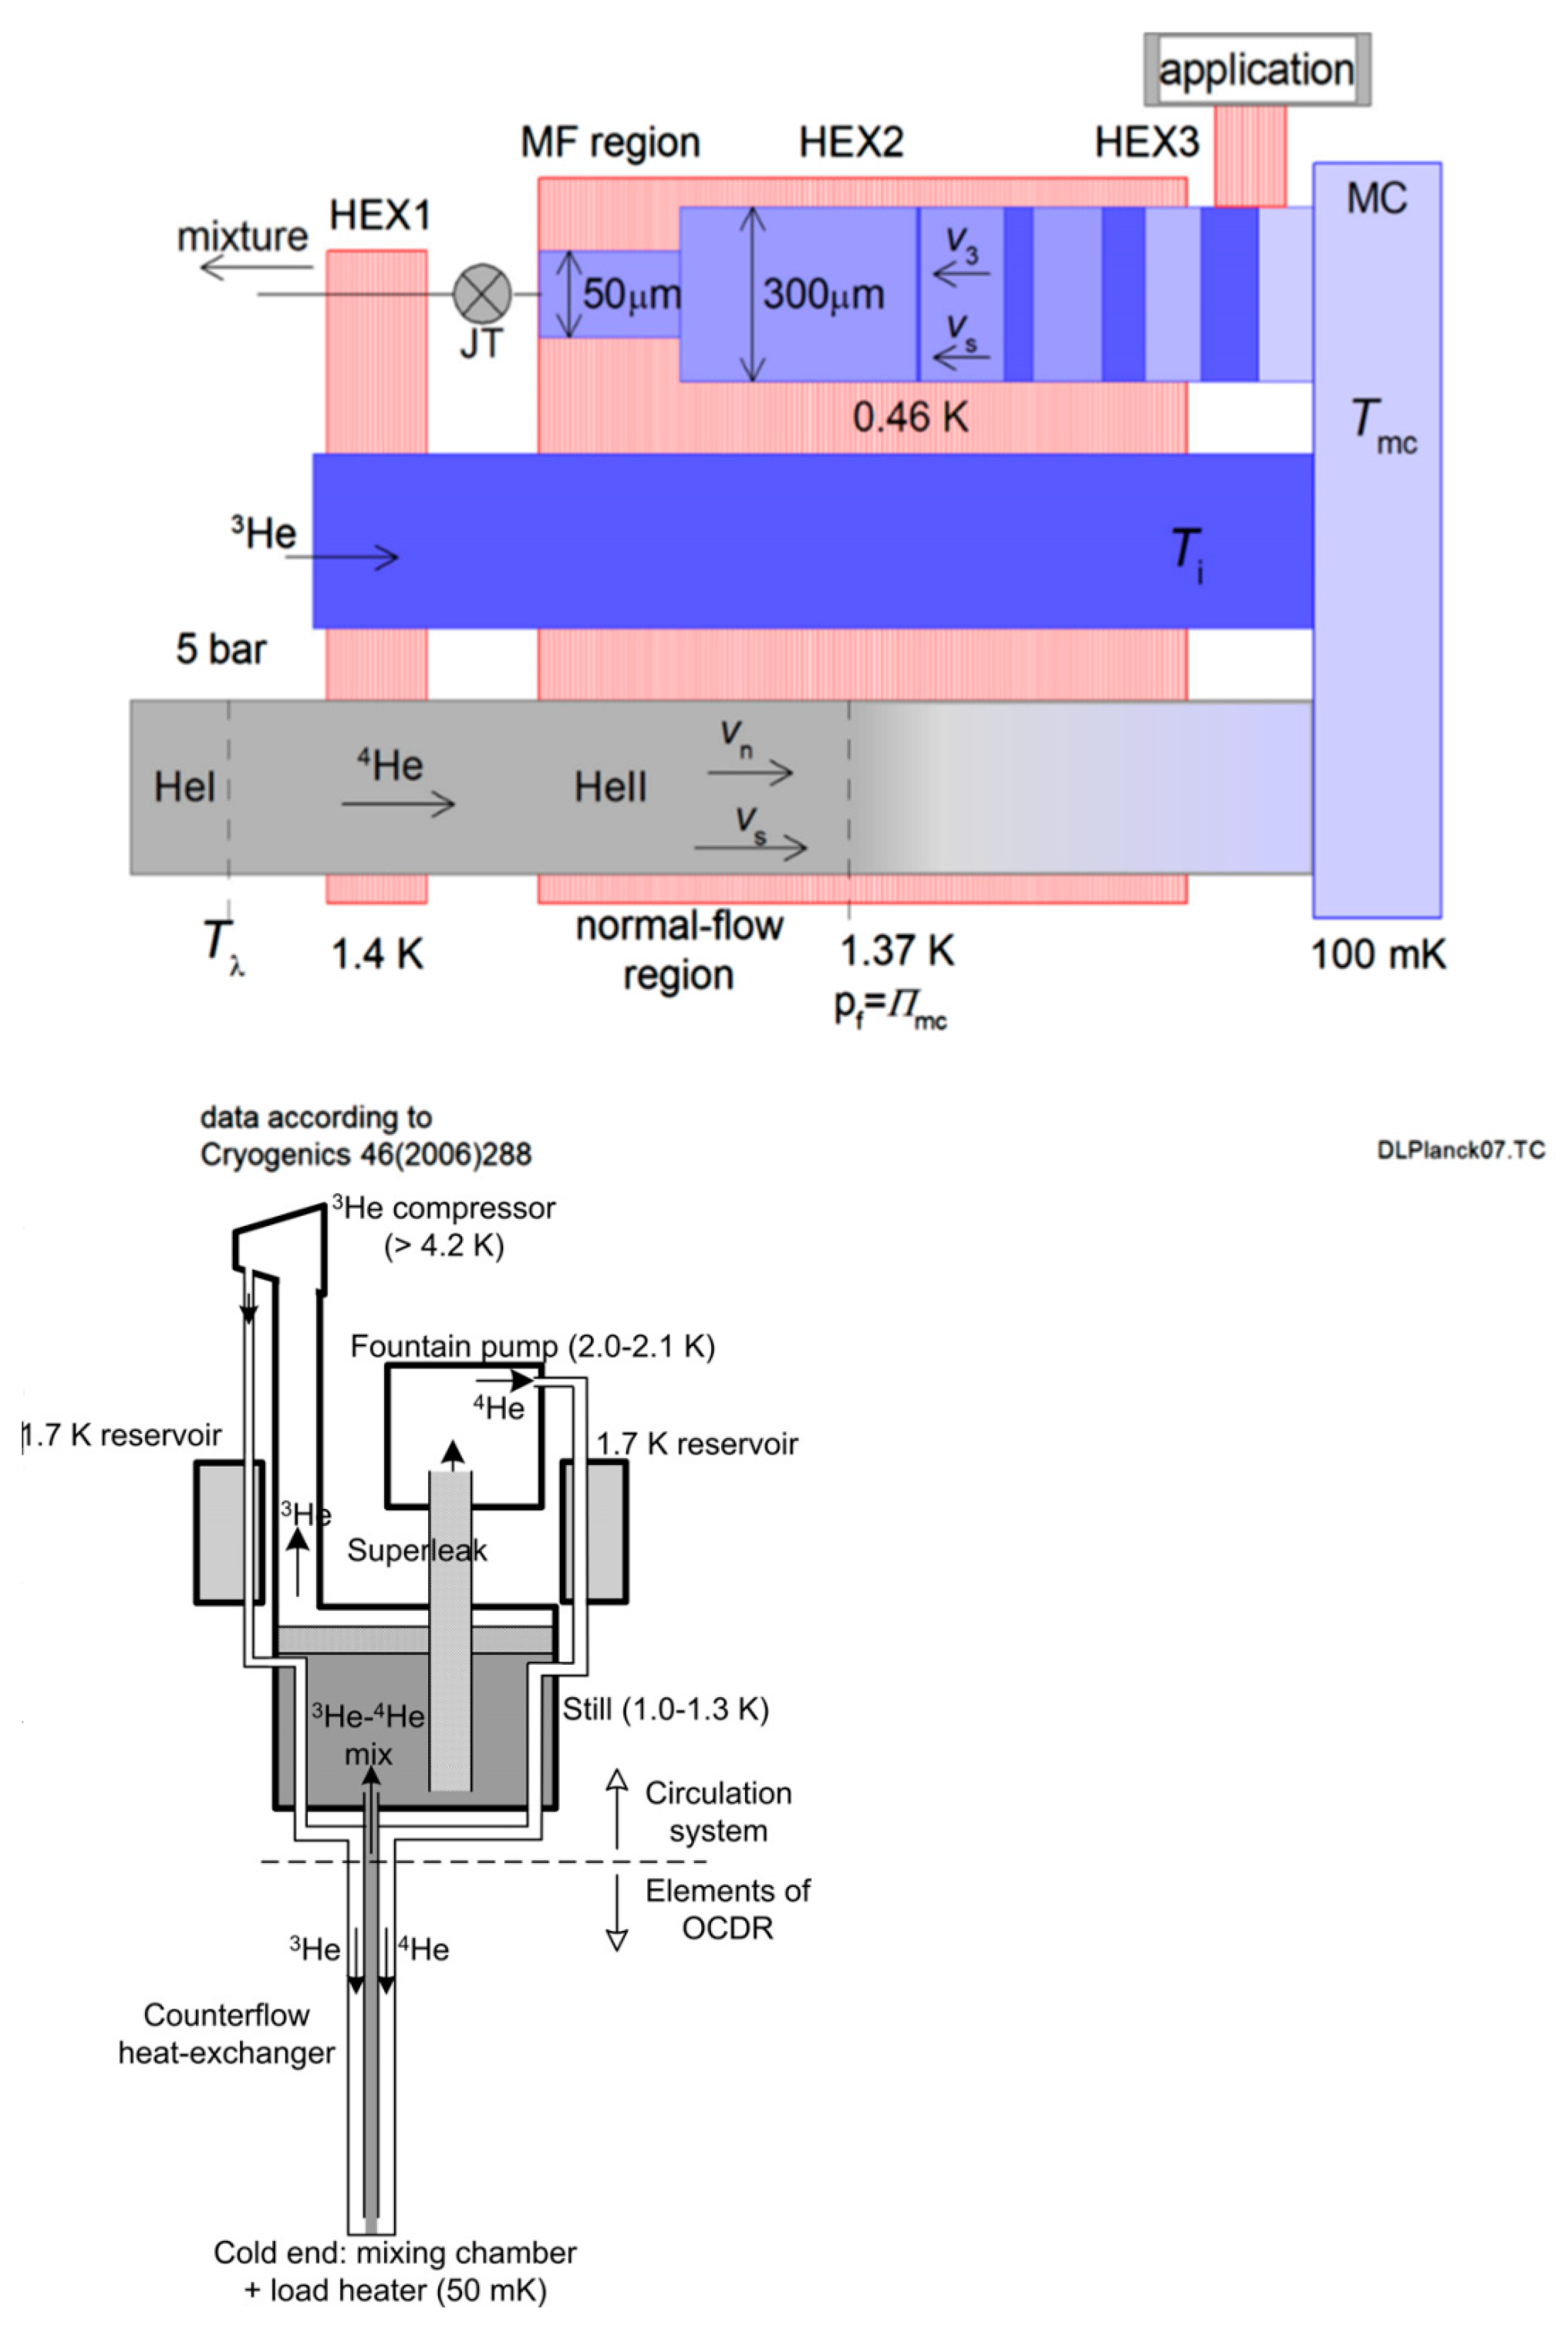
2.4.6. Dilution cryostats
2.4.7. SubK systems for balloon missions
3. Specific features of cryogenic system technology for astronomical instruments
3.1. Cryogenic interface and basic elements of cryo design calculation
3.2. Vacuum interface
3.3. Mechanical interface
3.4. Optical interface
3.5. DC, RF and digital interfaces
4. Development of cryogenic systems for astronomy: technical solutions of combined optical & radiophysycal problems
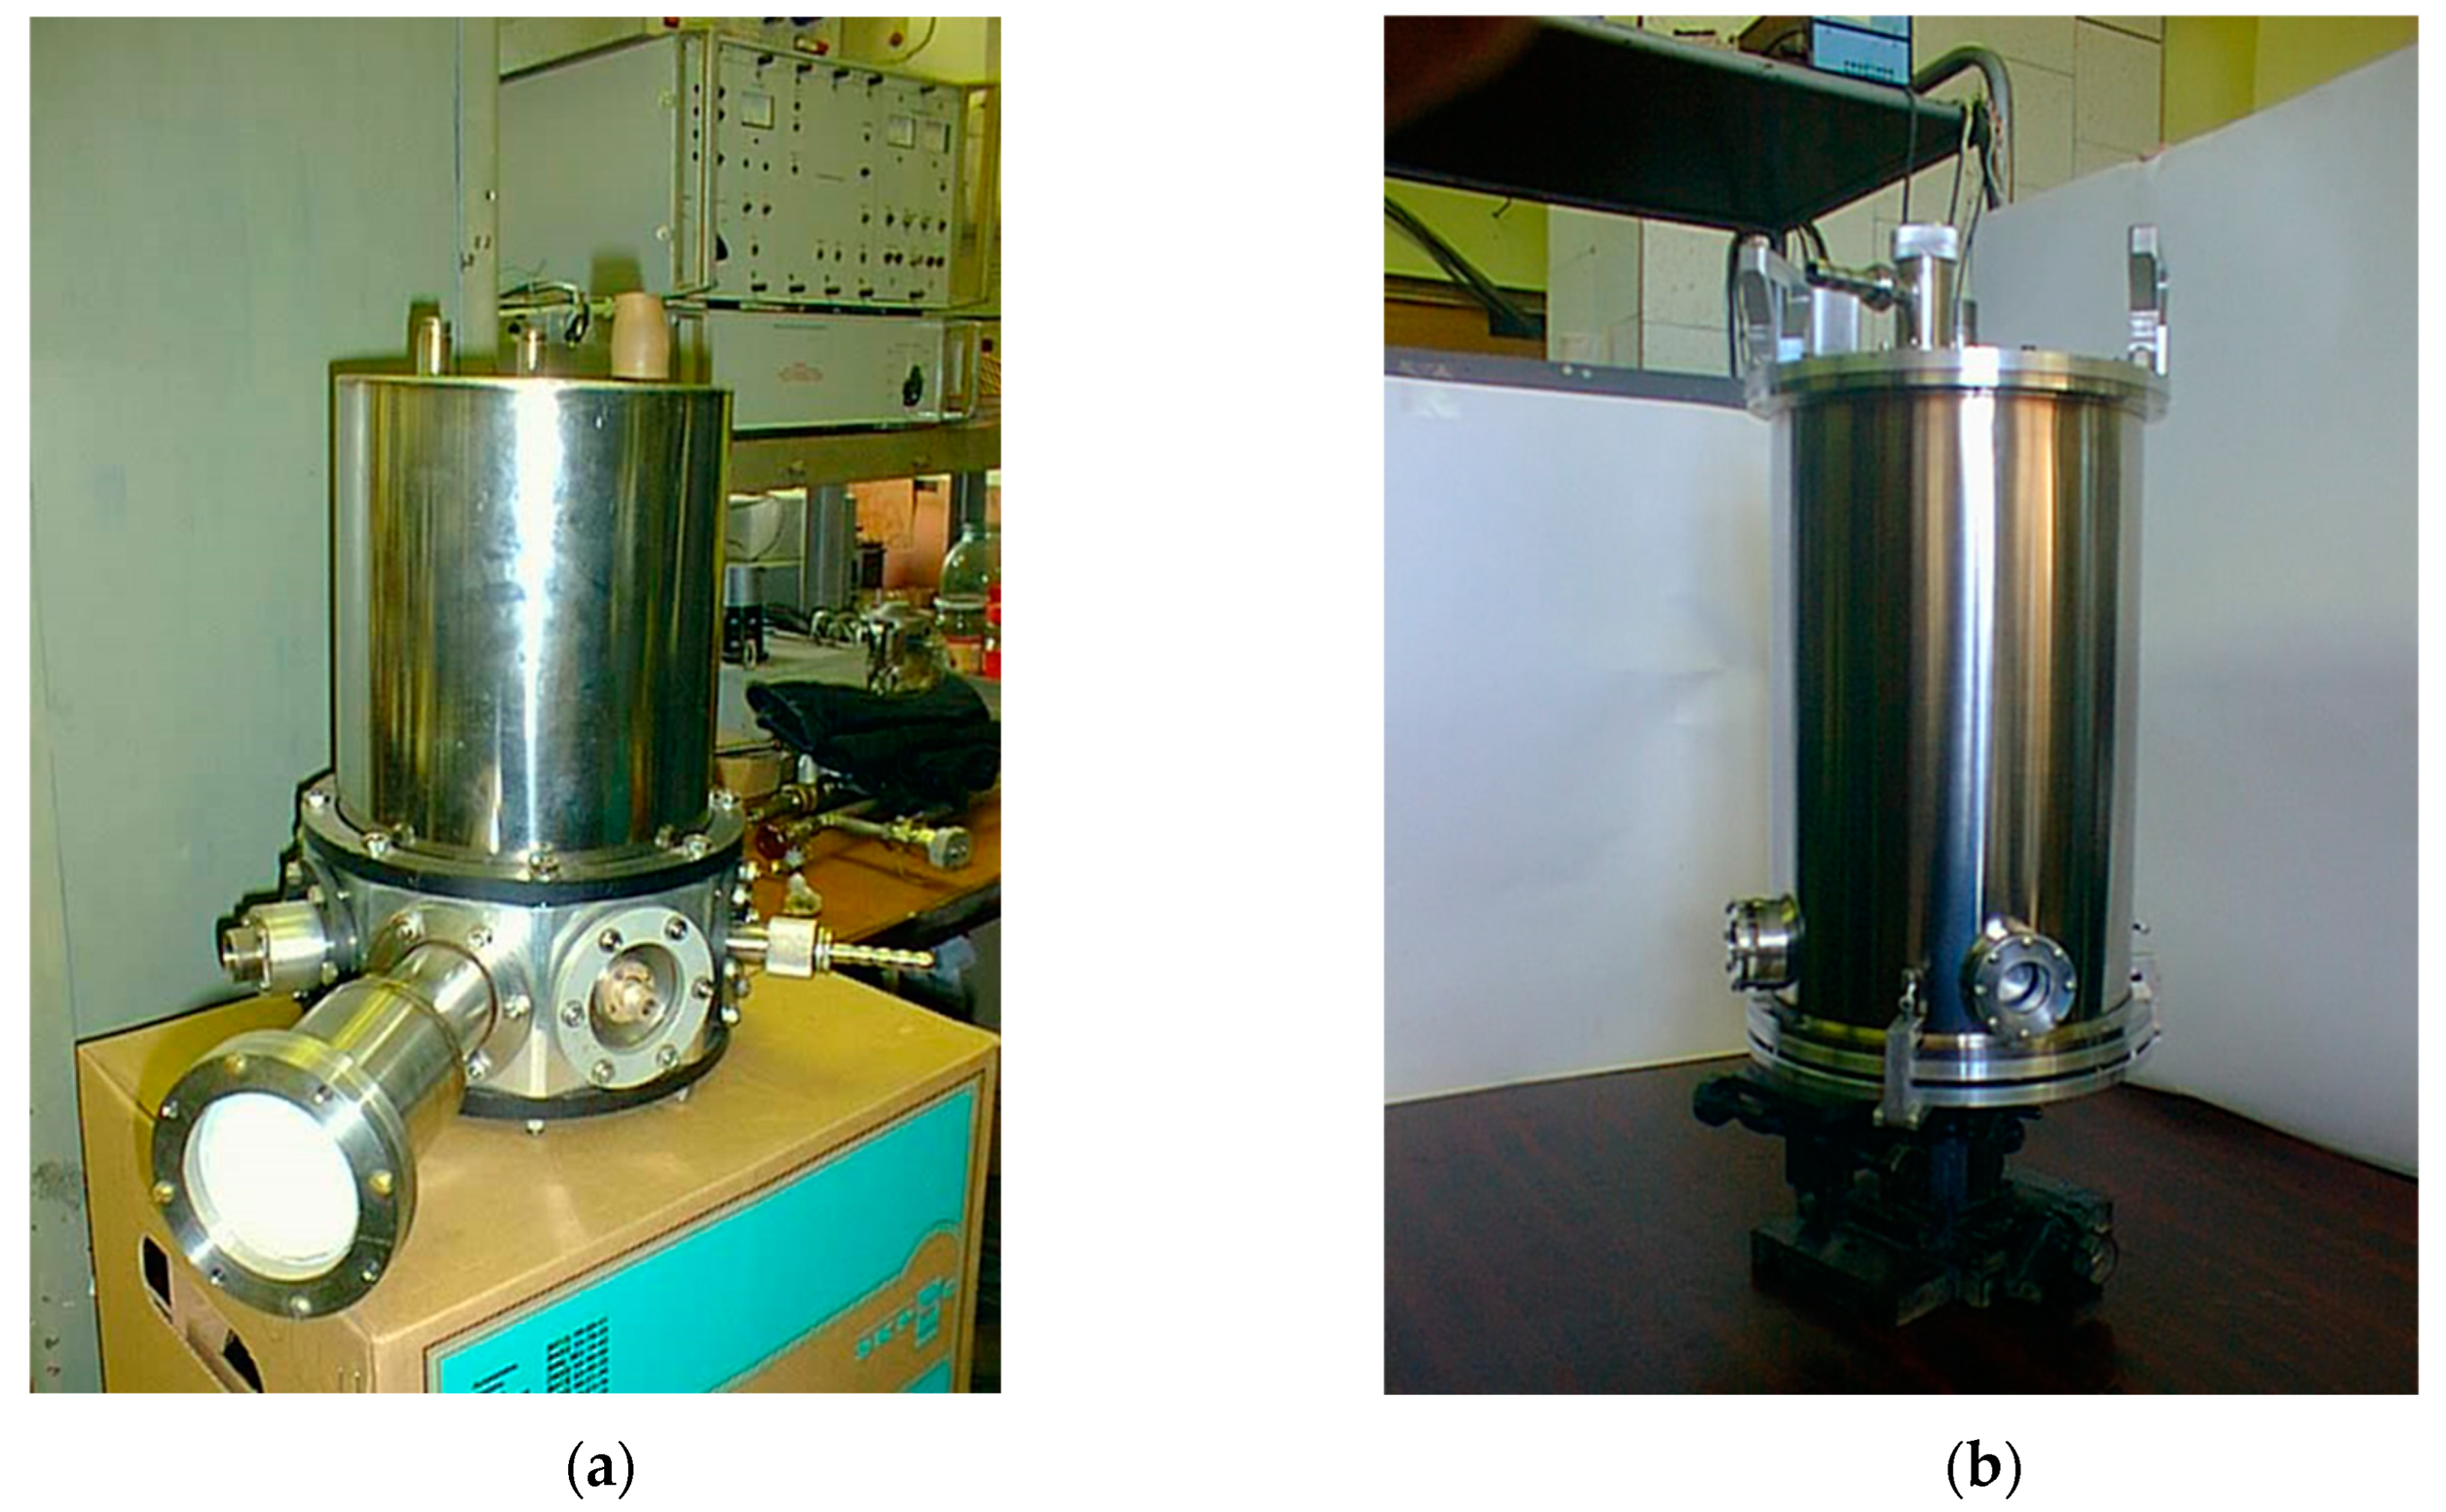
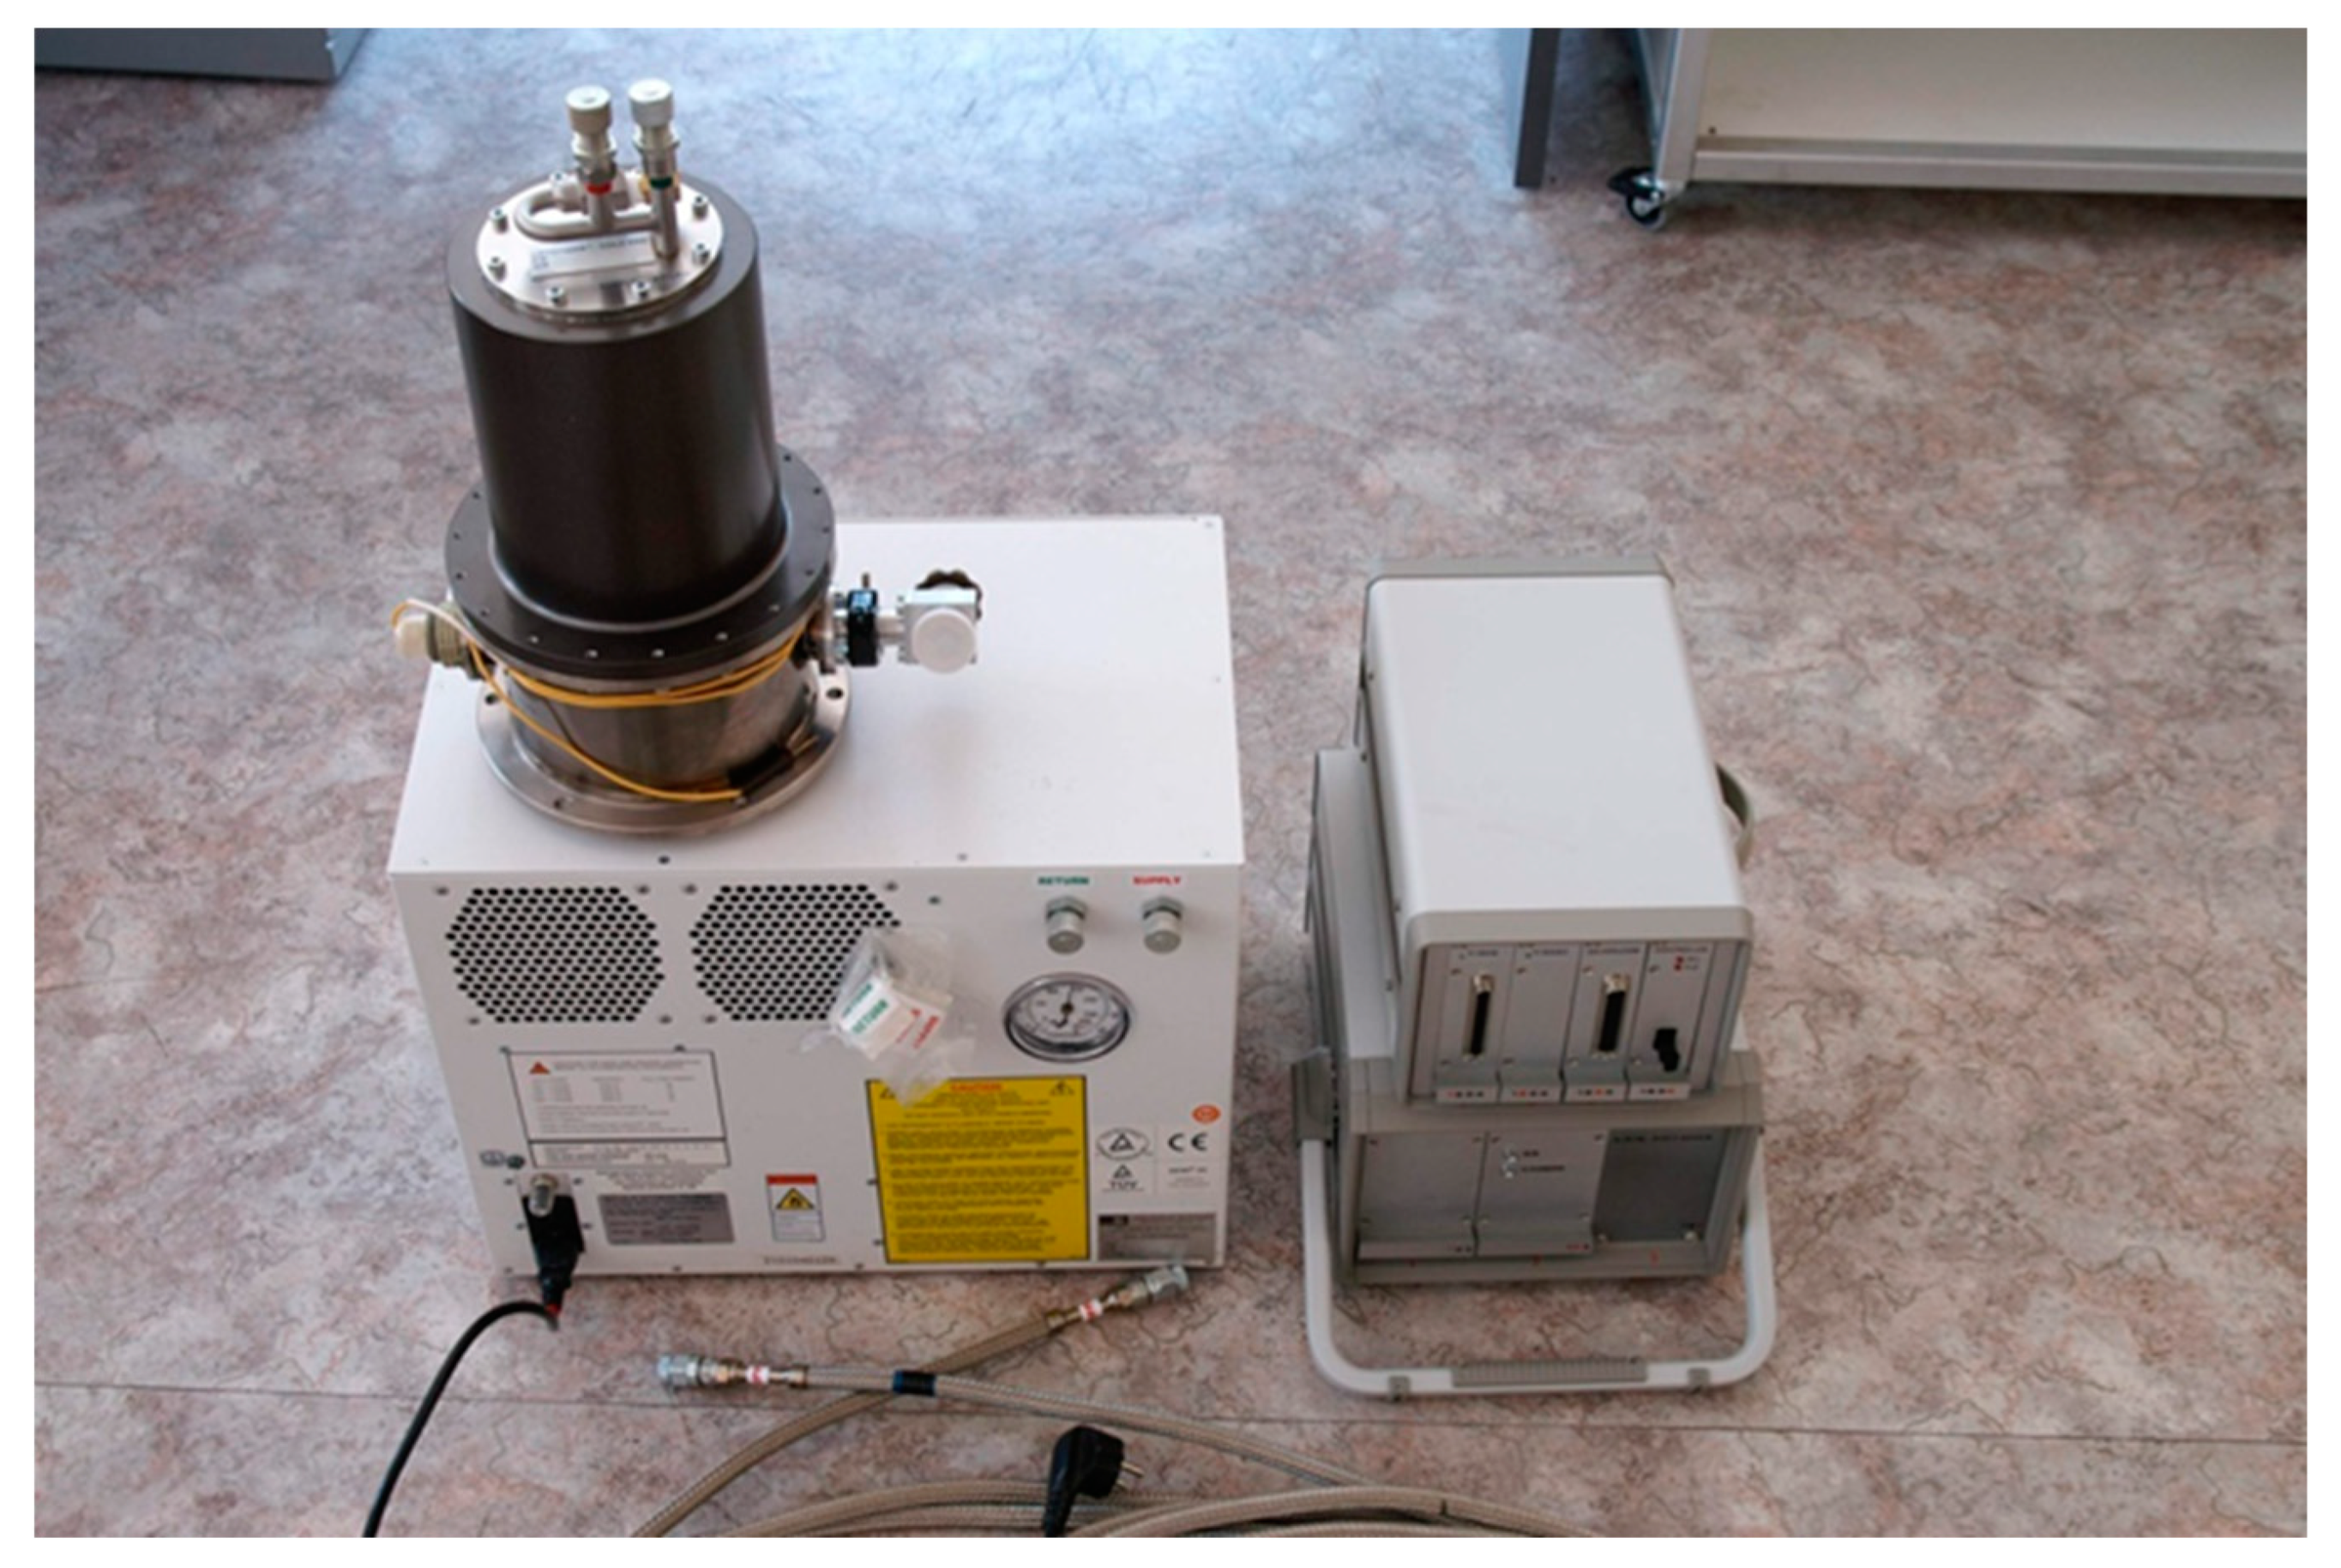
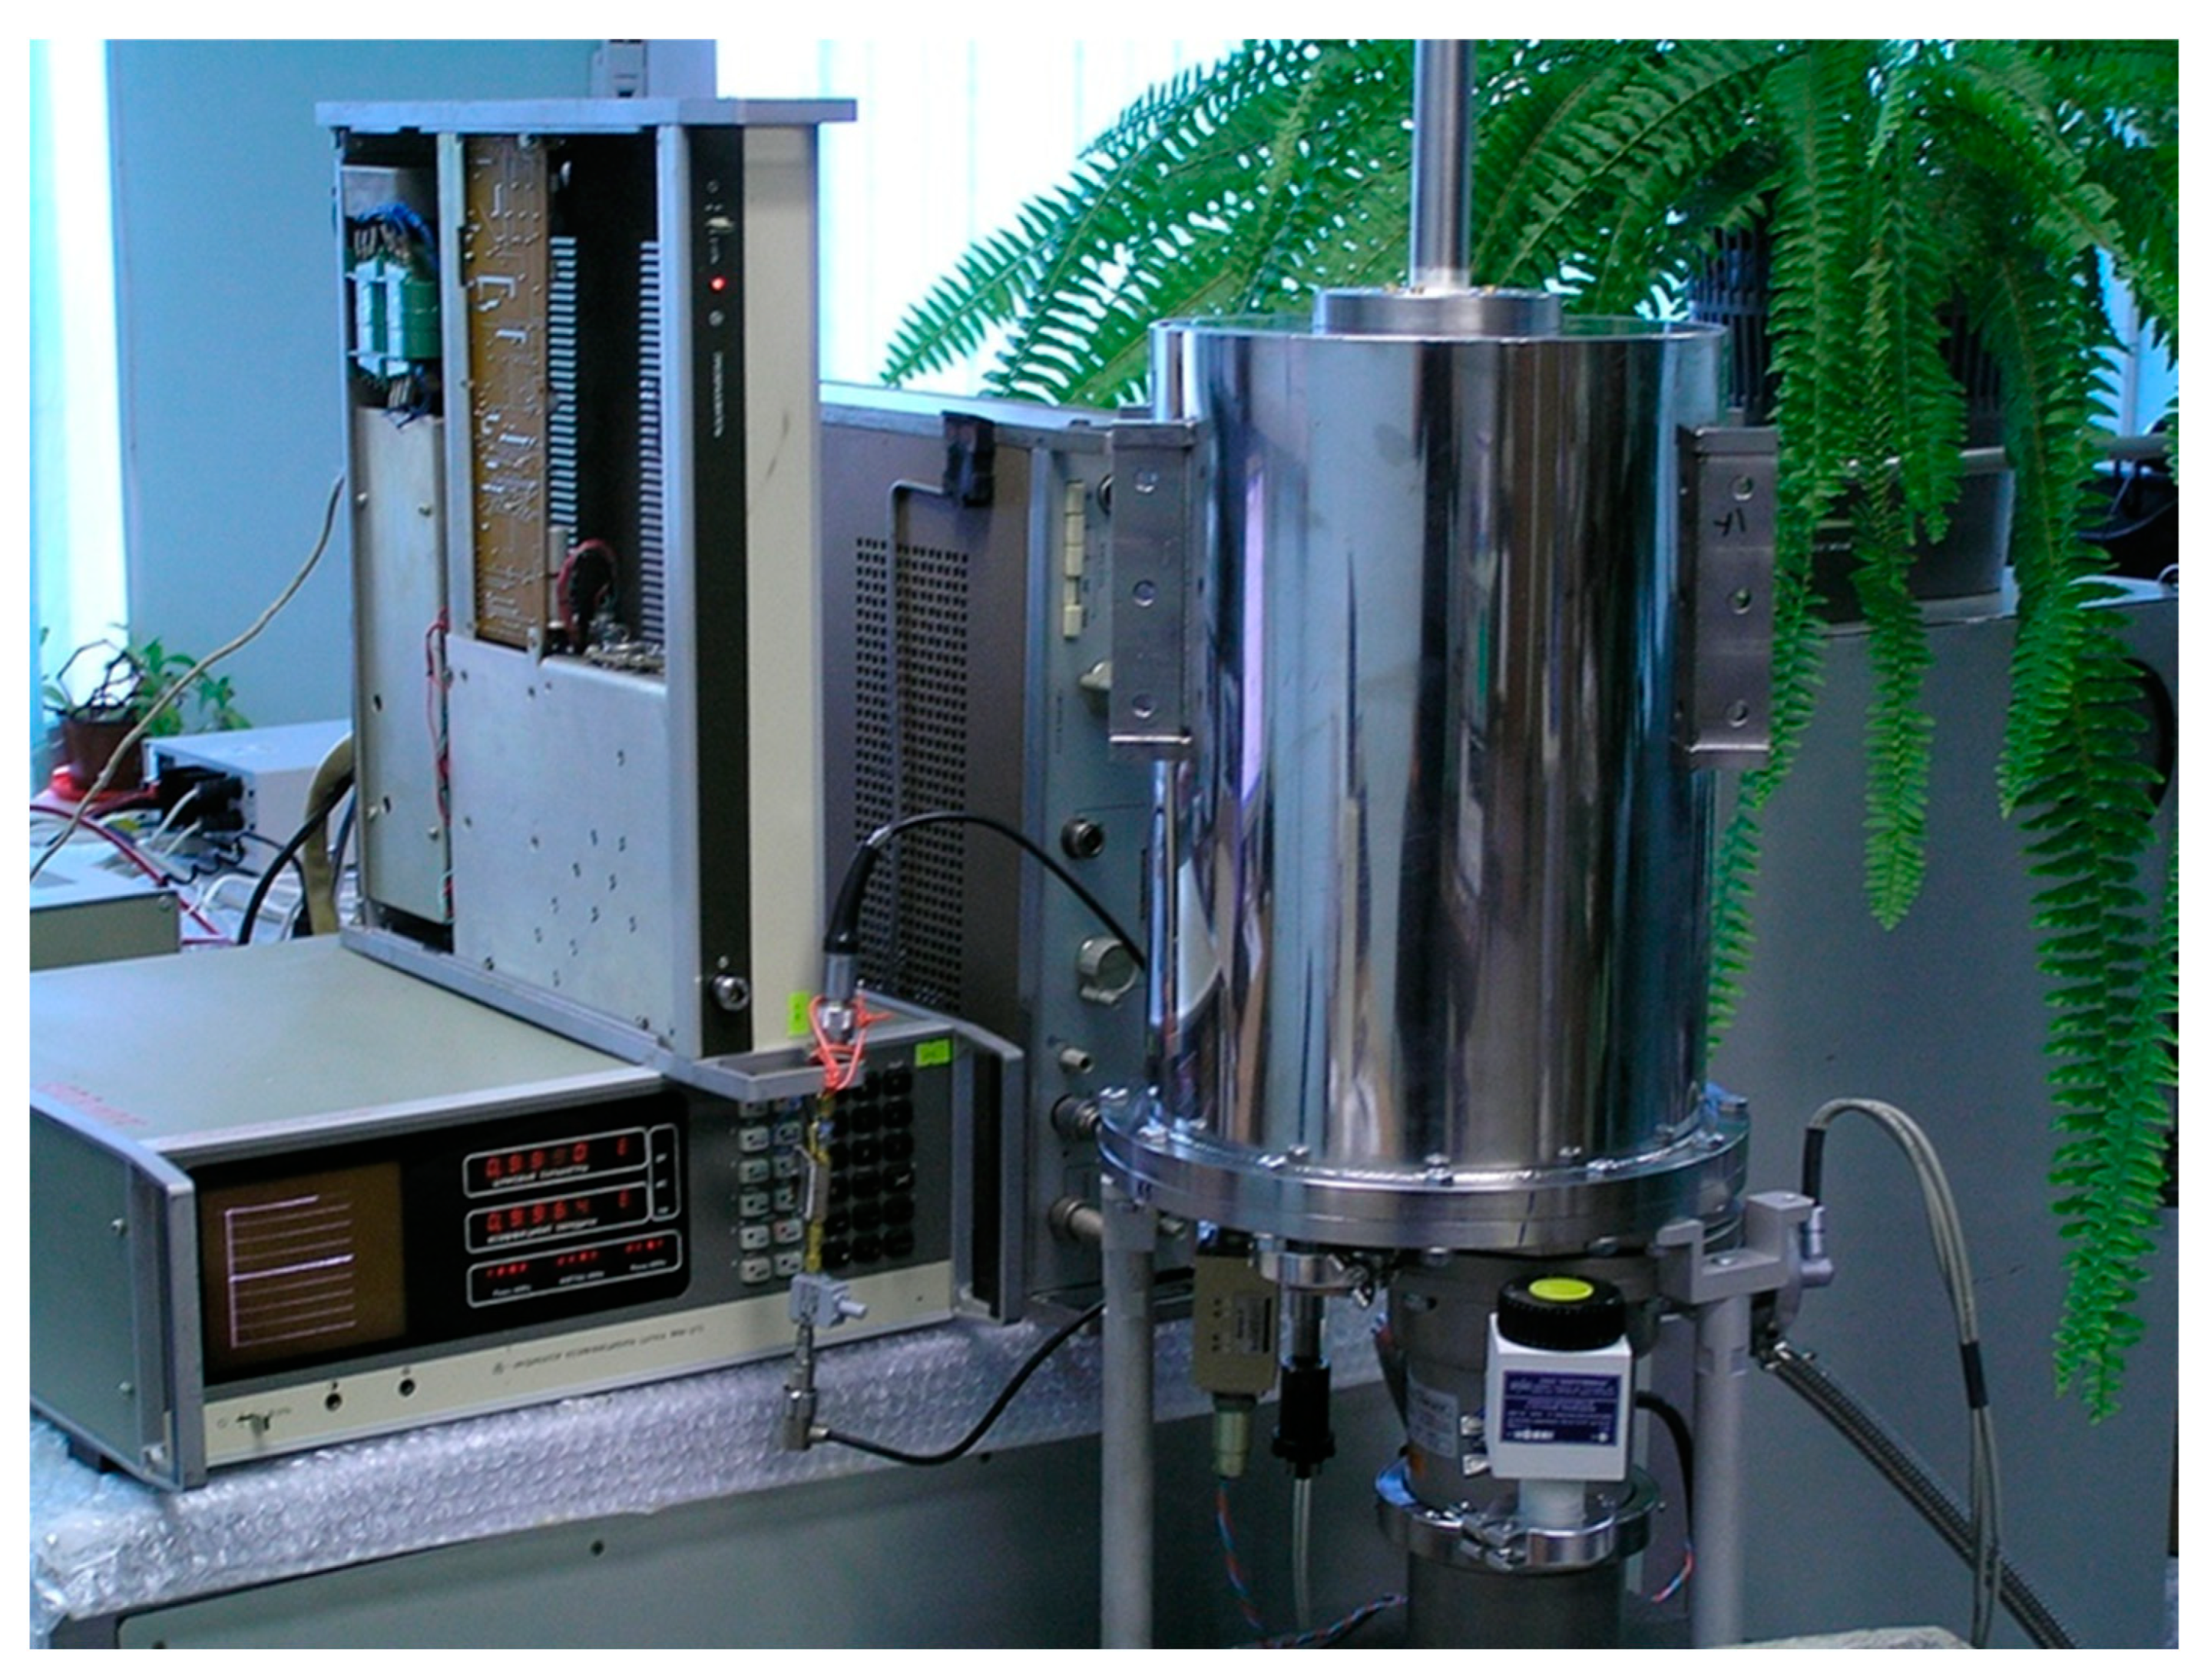
4.1. 4K Cryostating systems
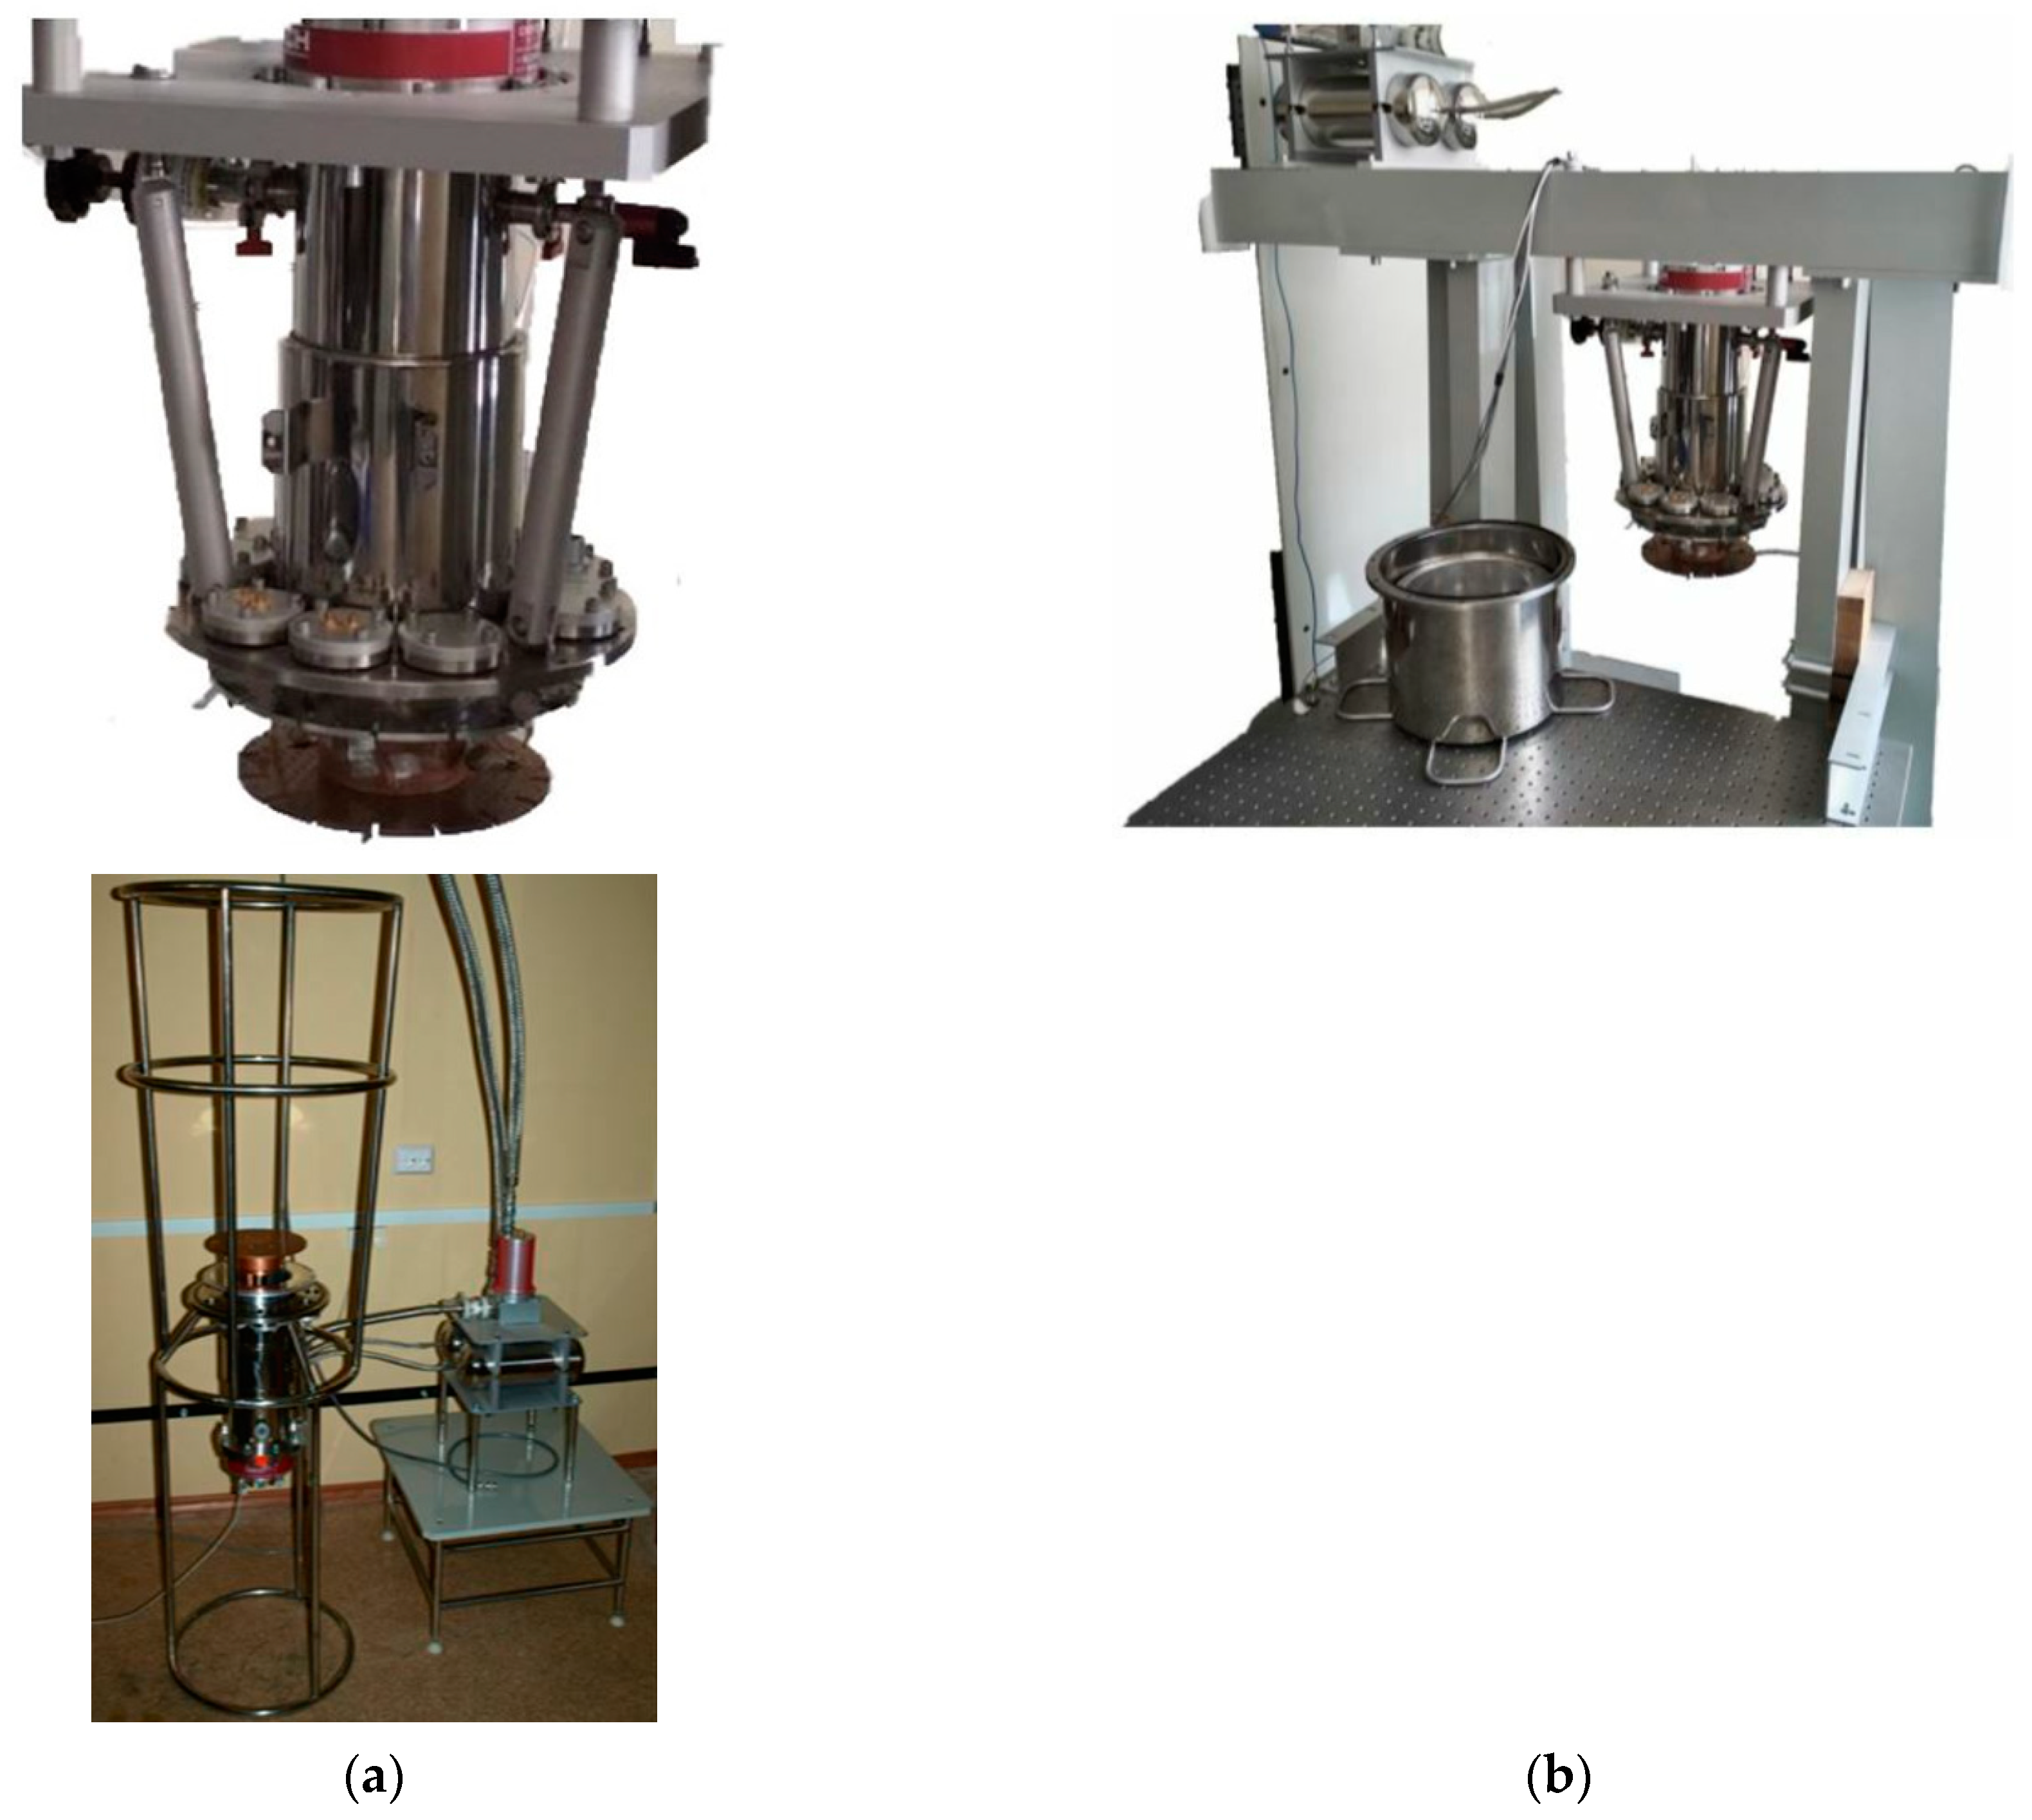
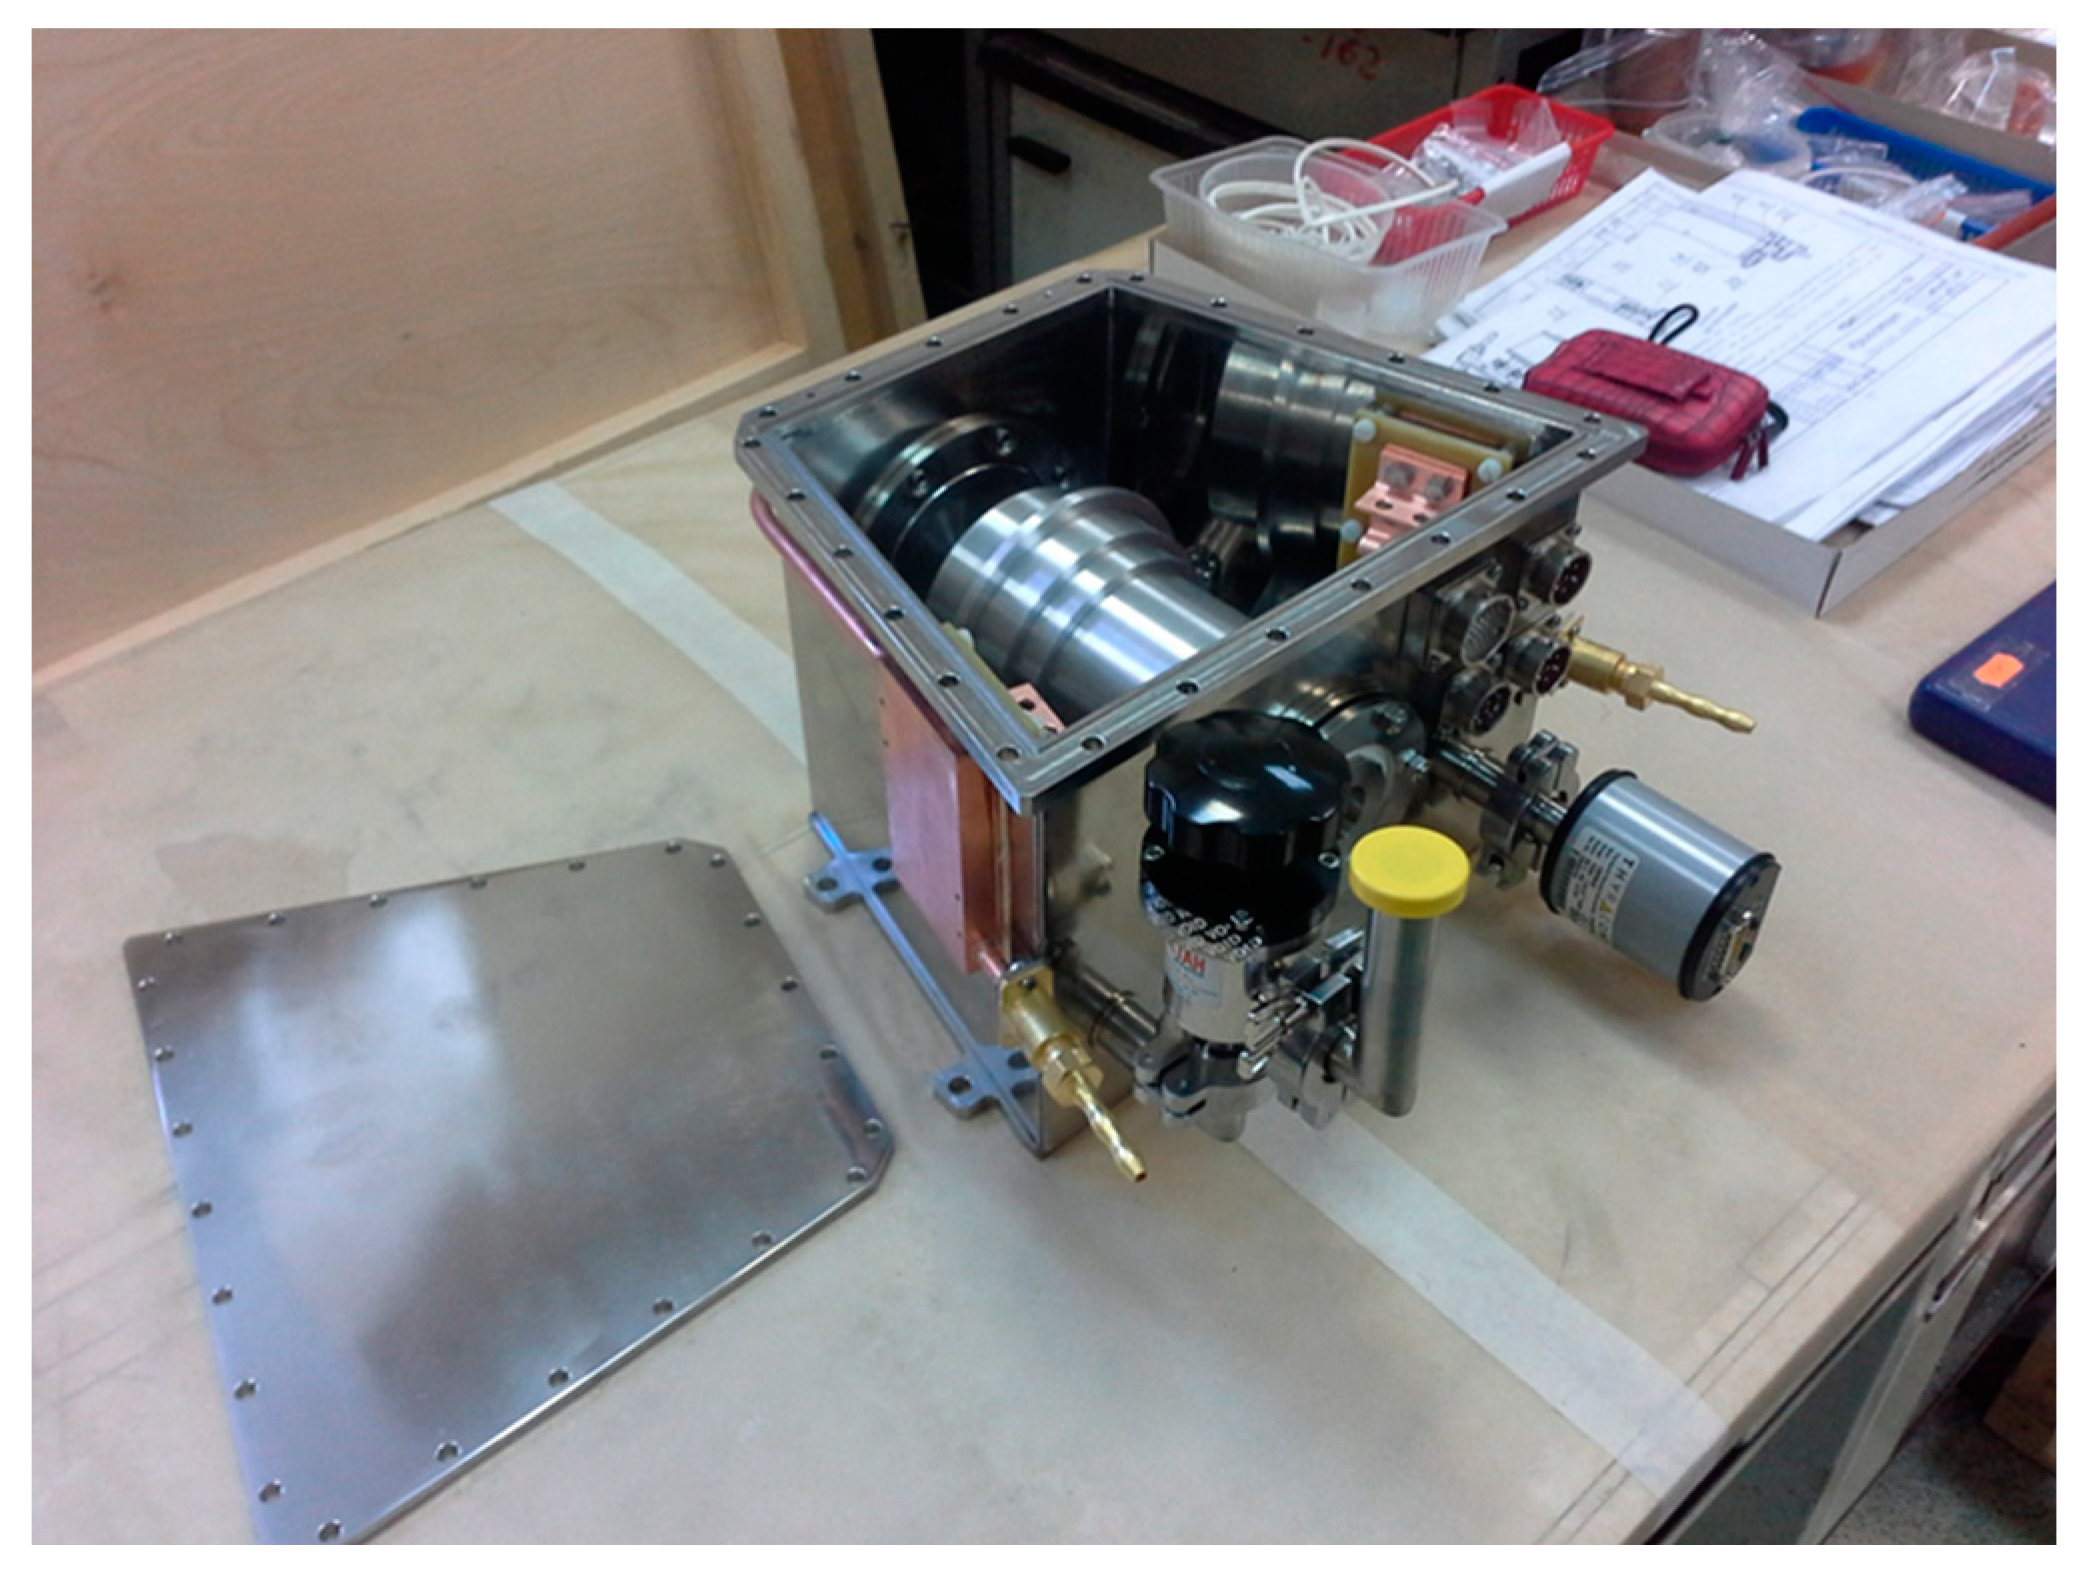
- Operating temperature 4К ± 0,1К;
- Heat load - 1 W;
- Vacuum level 10-4 mbar;
- Closed-cycle microcryogenic system (MCS) RDK-408D2 (SHI),
- 2 flanges for the installation of optical windows with a diameter of 25 mm;
- Flange KF D25 for pumping;
- Input of electrical and RF signals;
- Size of the working cavity: diameter 185 mm, height 70 mm, dimensions - not more than 1600 mm;
- Diameter not less than 700 mm;
- The presence of an interface for reducing the influence of temperature fluctuations with the possibility of observations with disabled MCS ;
- Availability of optical windows;
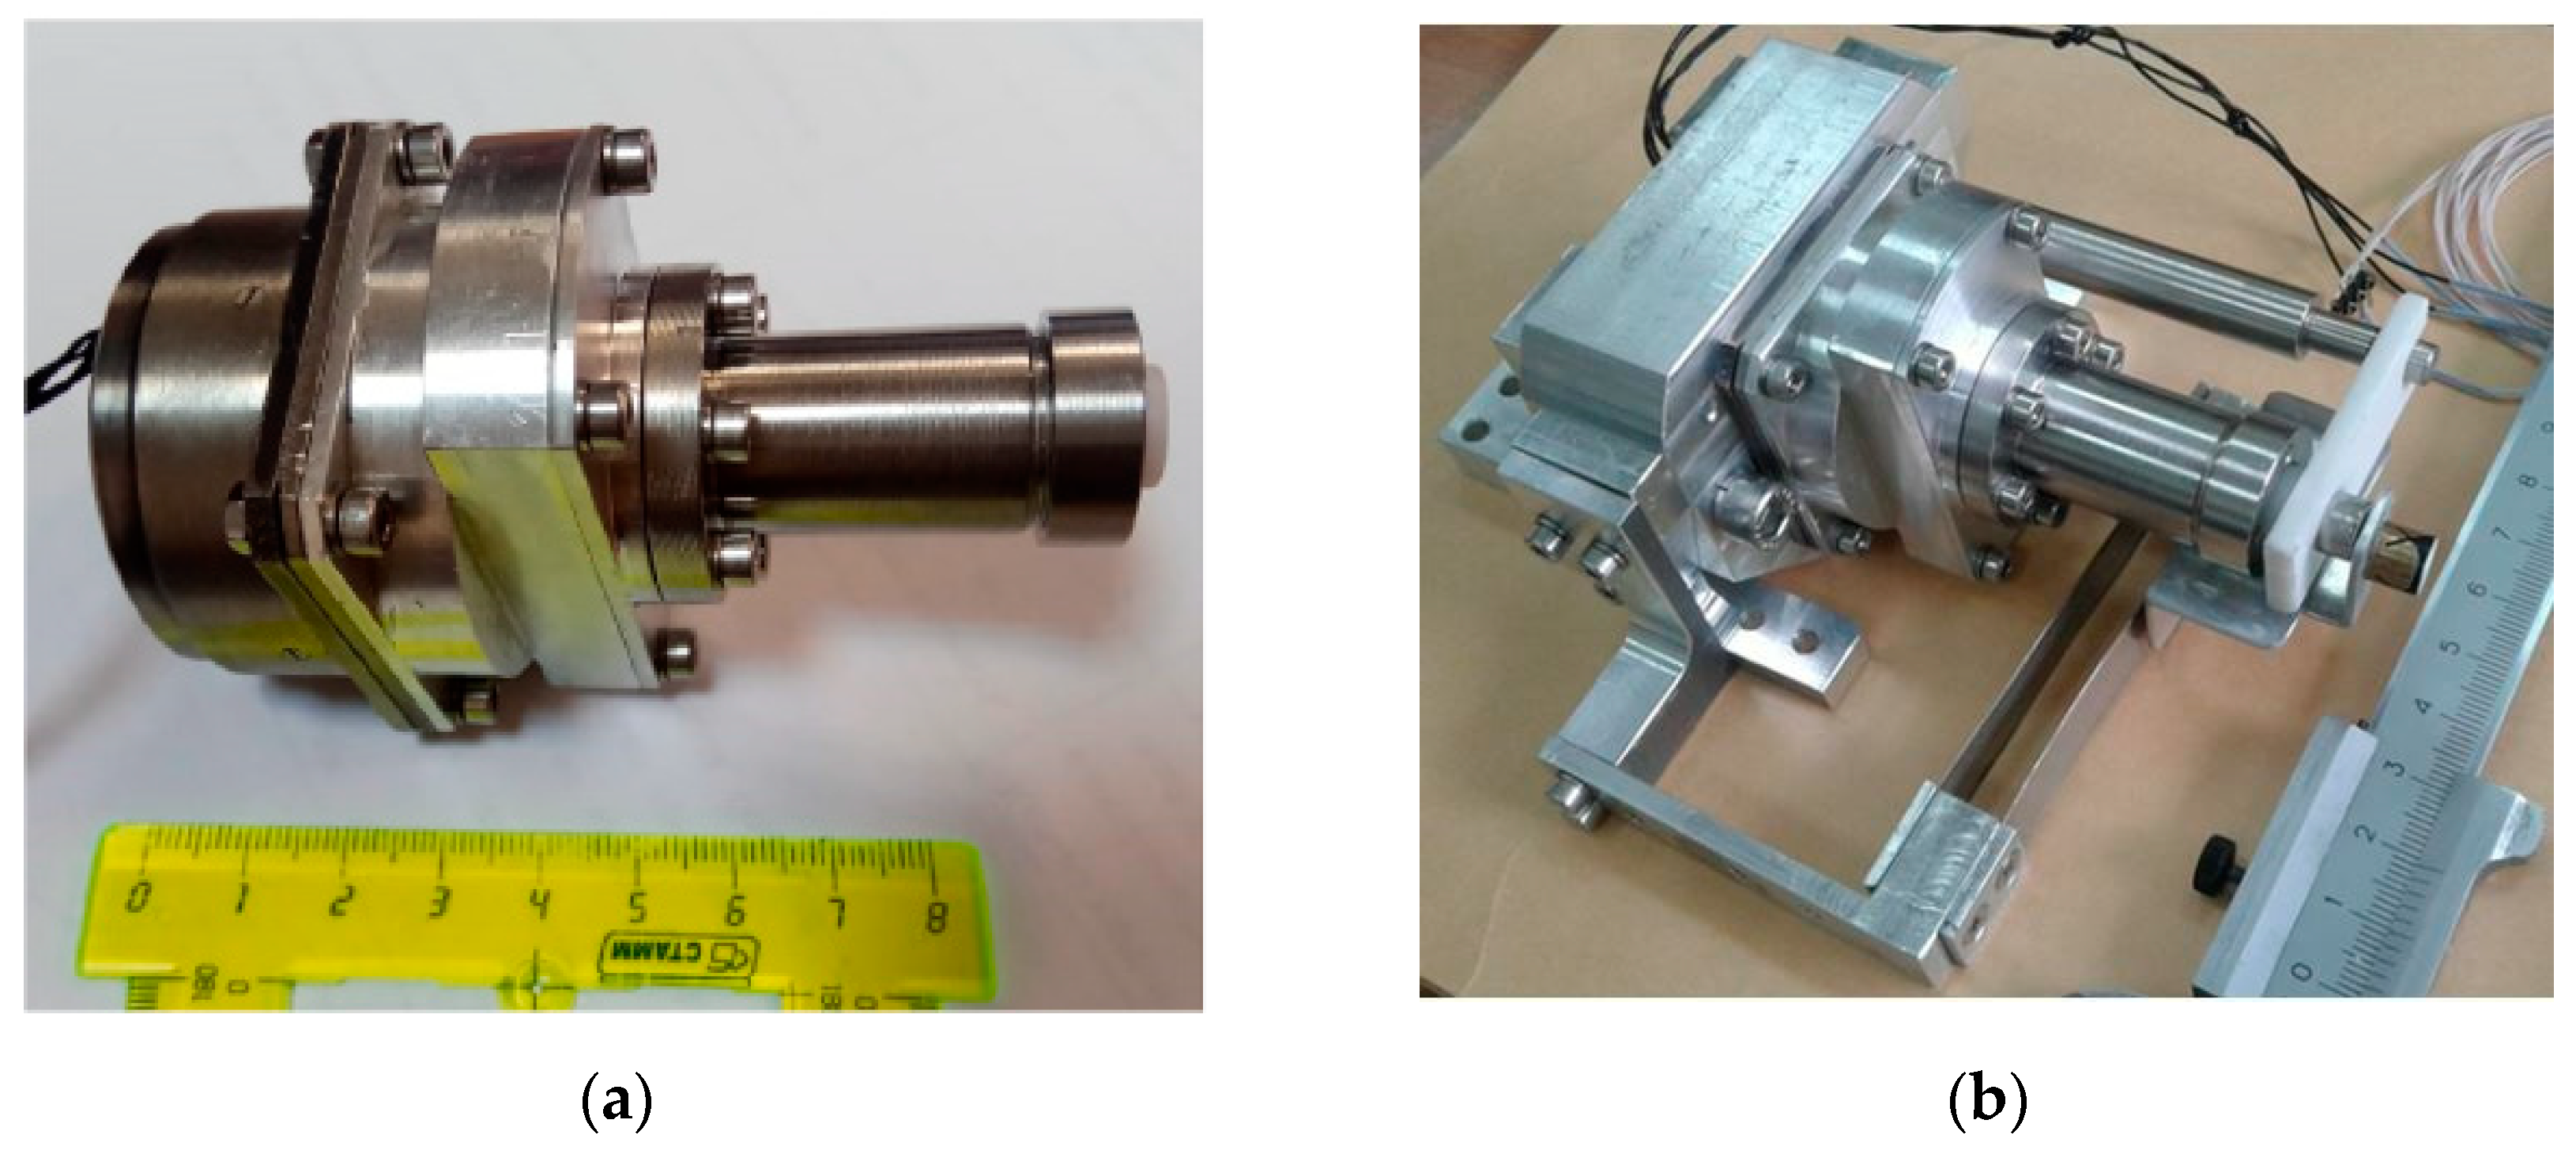
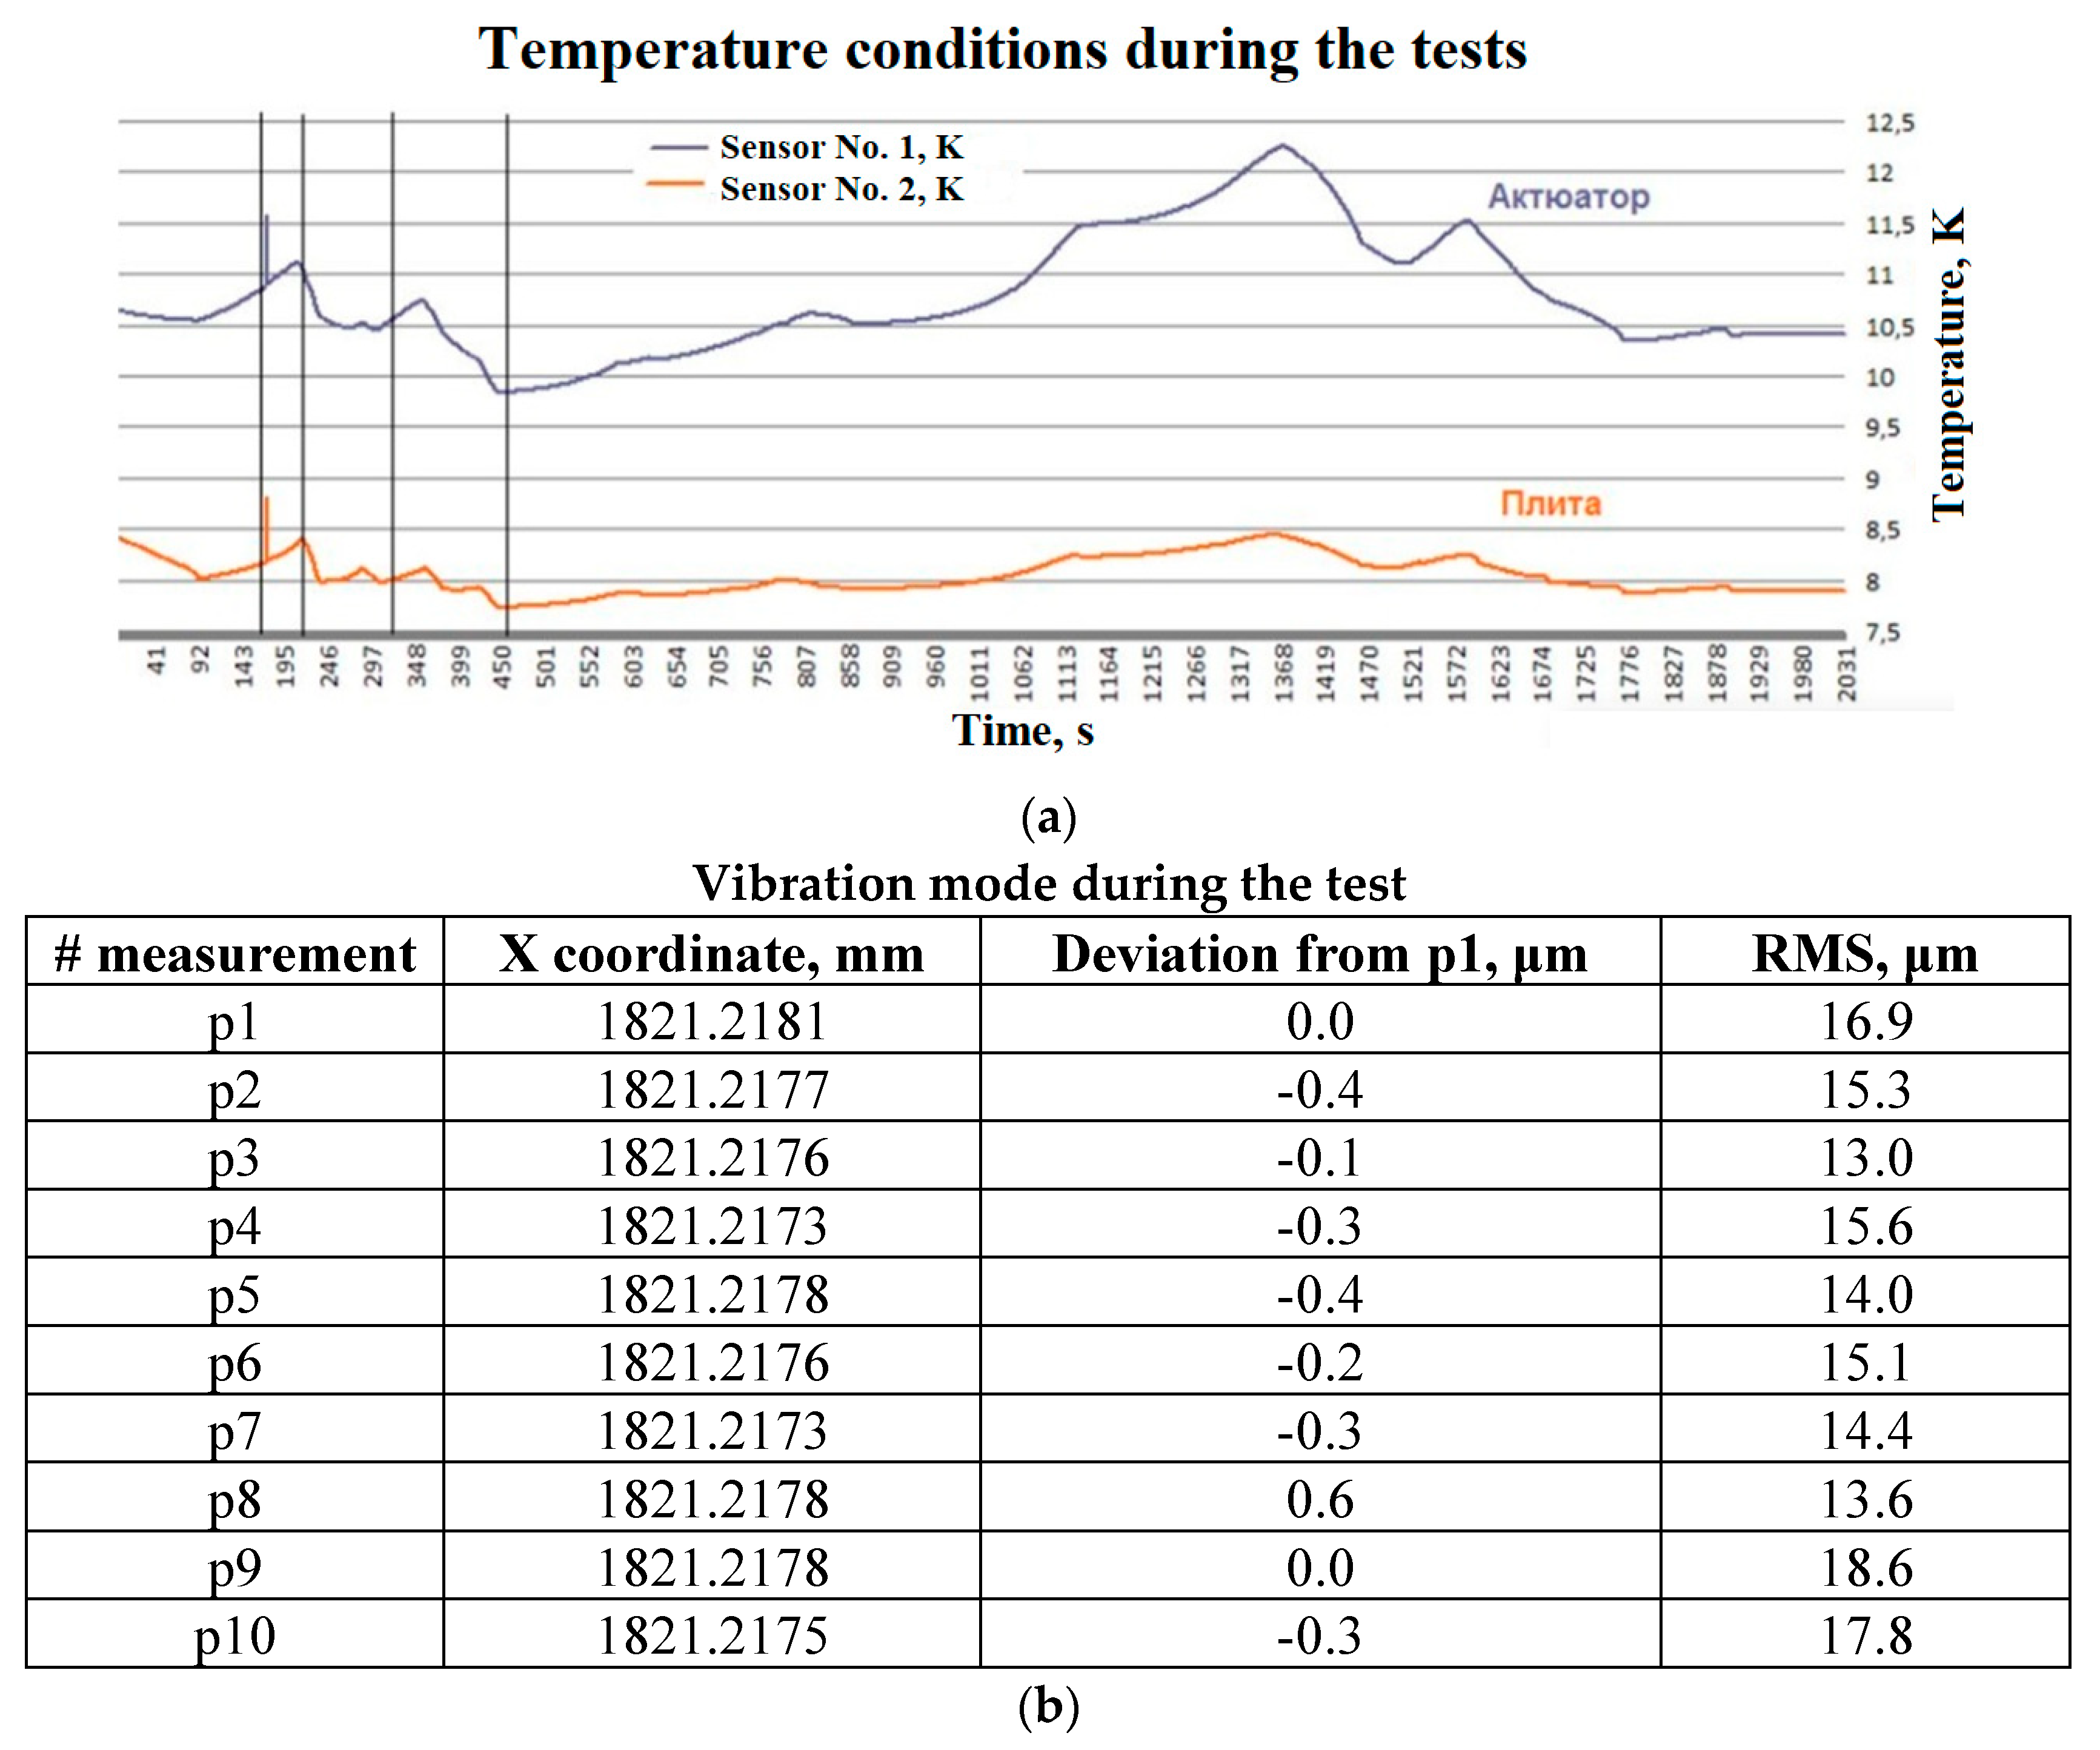
4.1.2. Solving of the problem of vibrations and temperature fluctuations of cryogenic refrigerators
- Accelerometers B&K 4371 - 2;
- Charge amplifiers B&K 2651 - 2;
- Power supply B&K 2805;
- 2 channel ADC M-AUDIO Transit;
- all mechanisms are disabled (recording duration ~ 60 s);
- all the main mechanisms (pumps, compressors) are turned on, the cooler is turned off (recording duration ~ 60 s);
- all the main mechanisms (pumps, compressors) are on, the cooler is on (recording duration ~ 30 s).
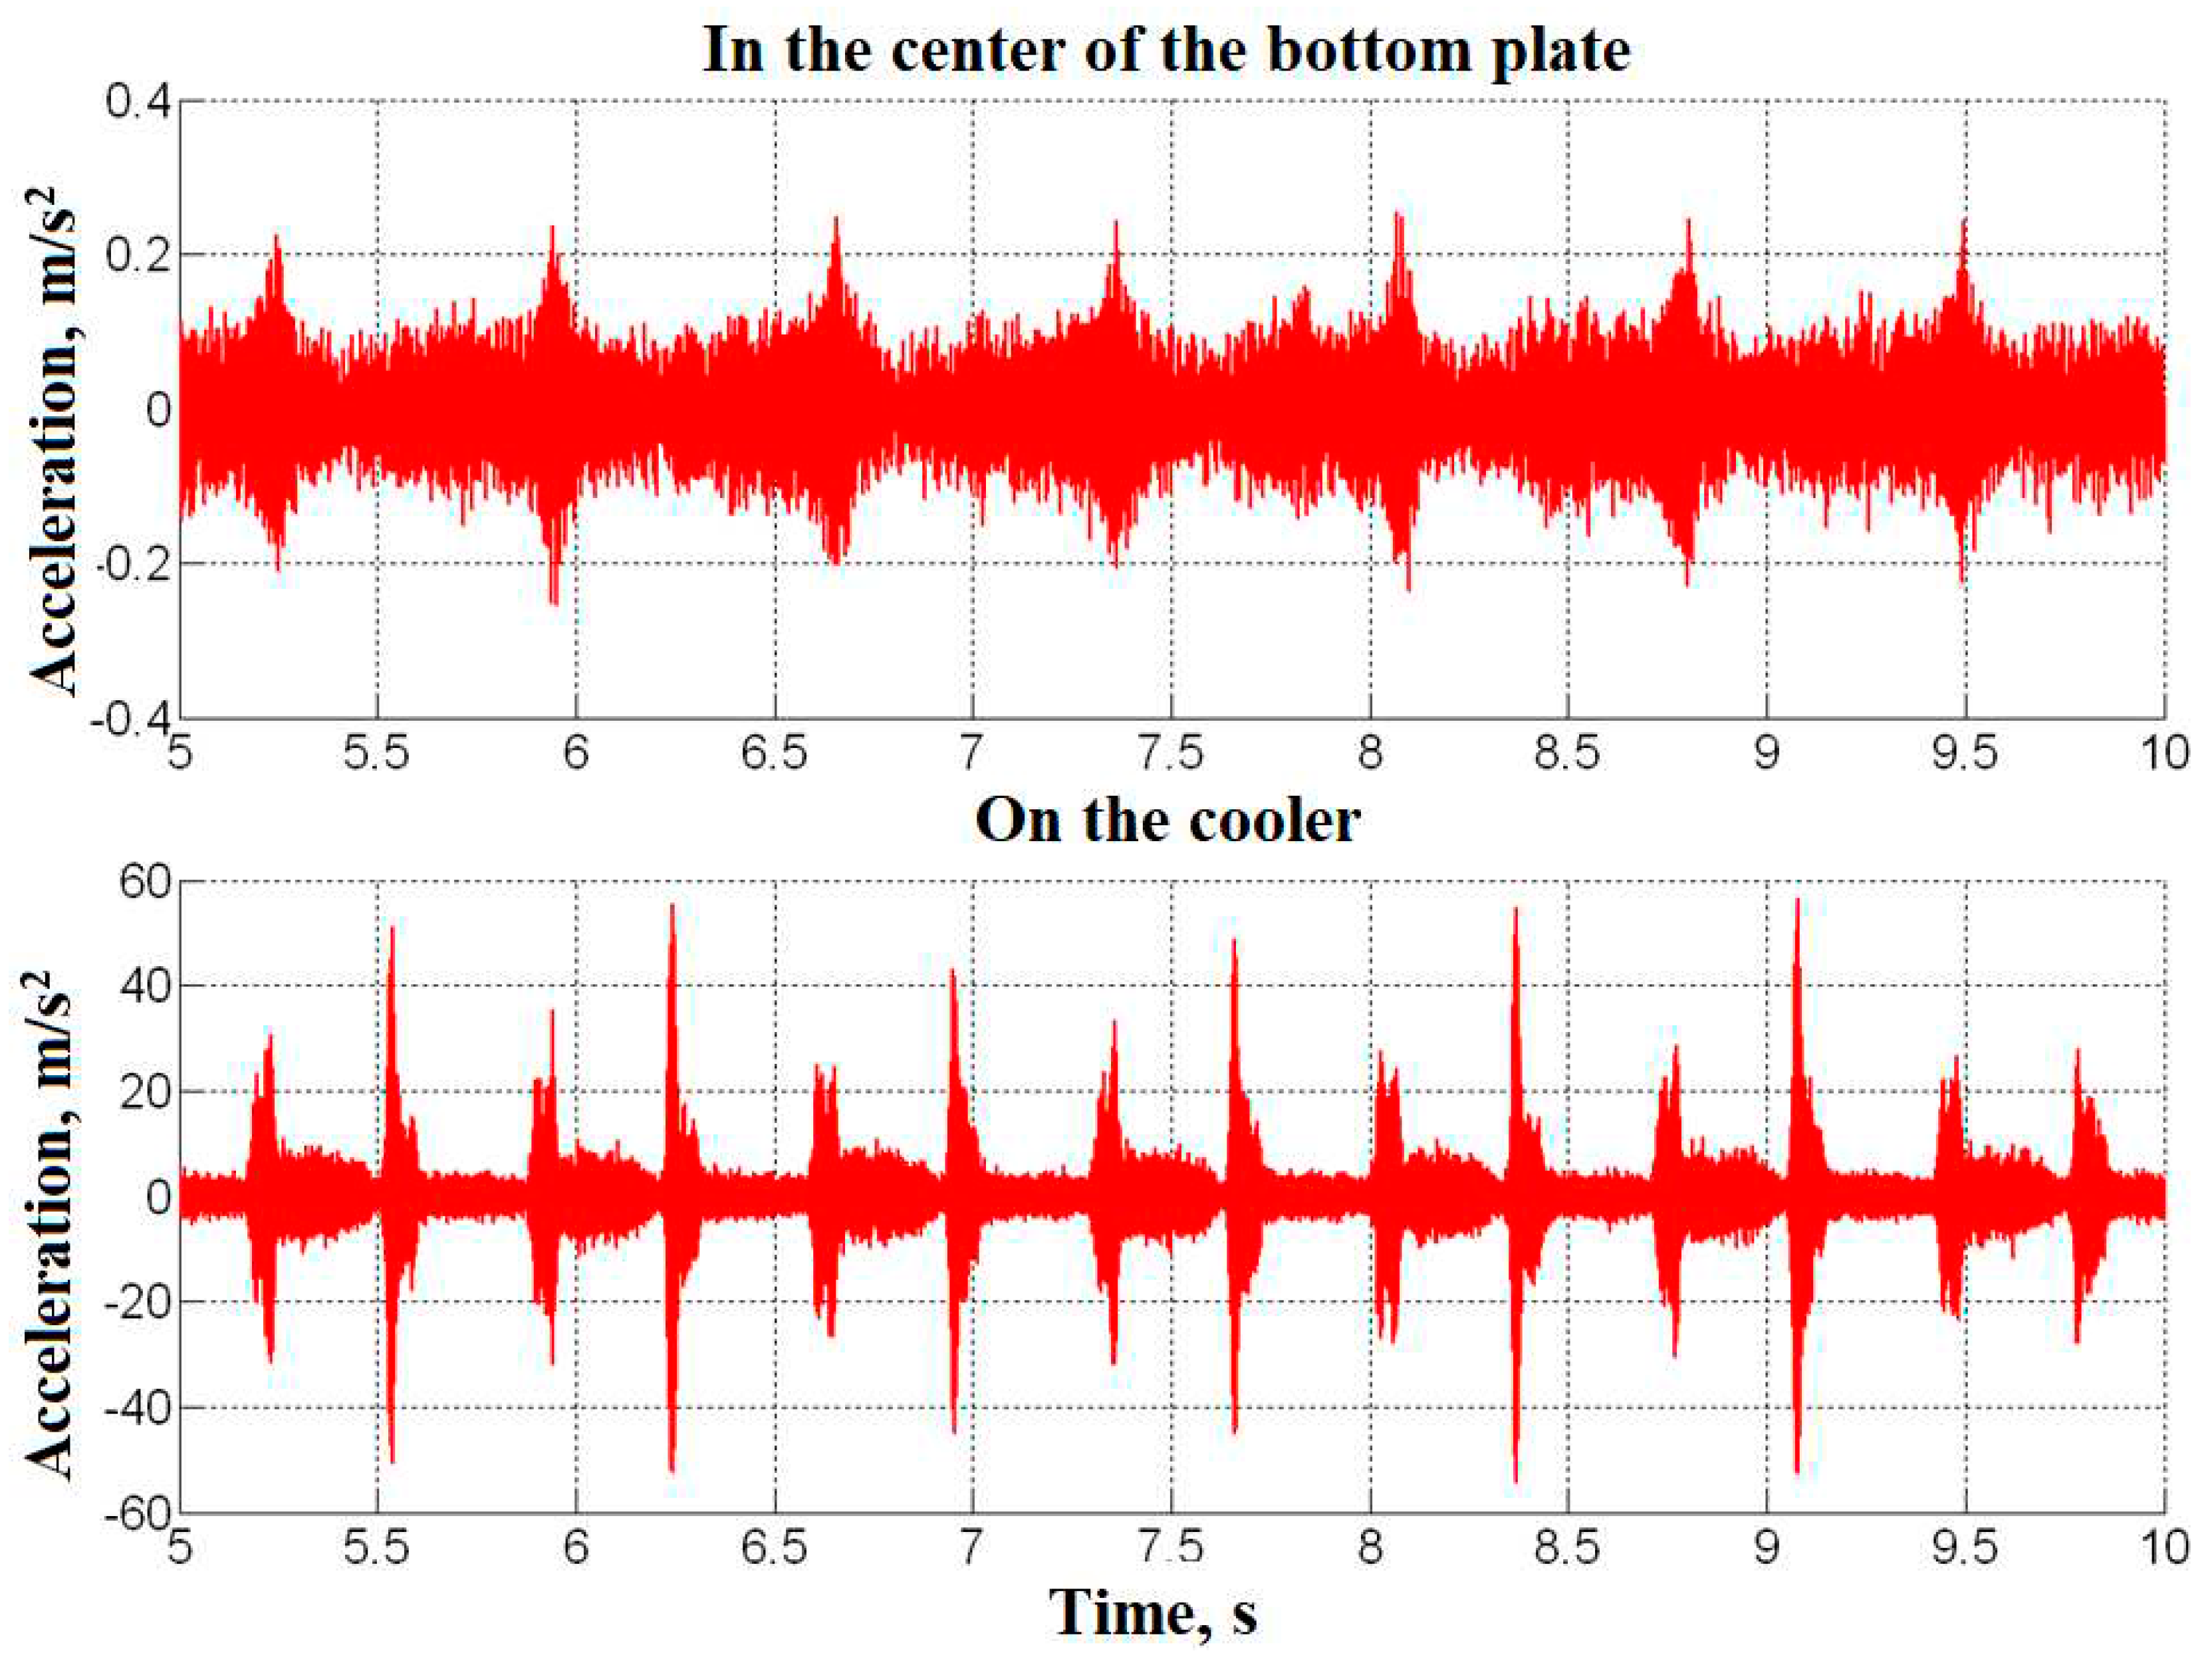
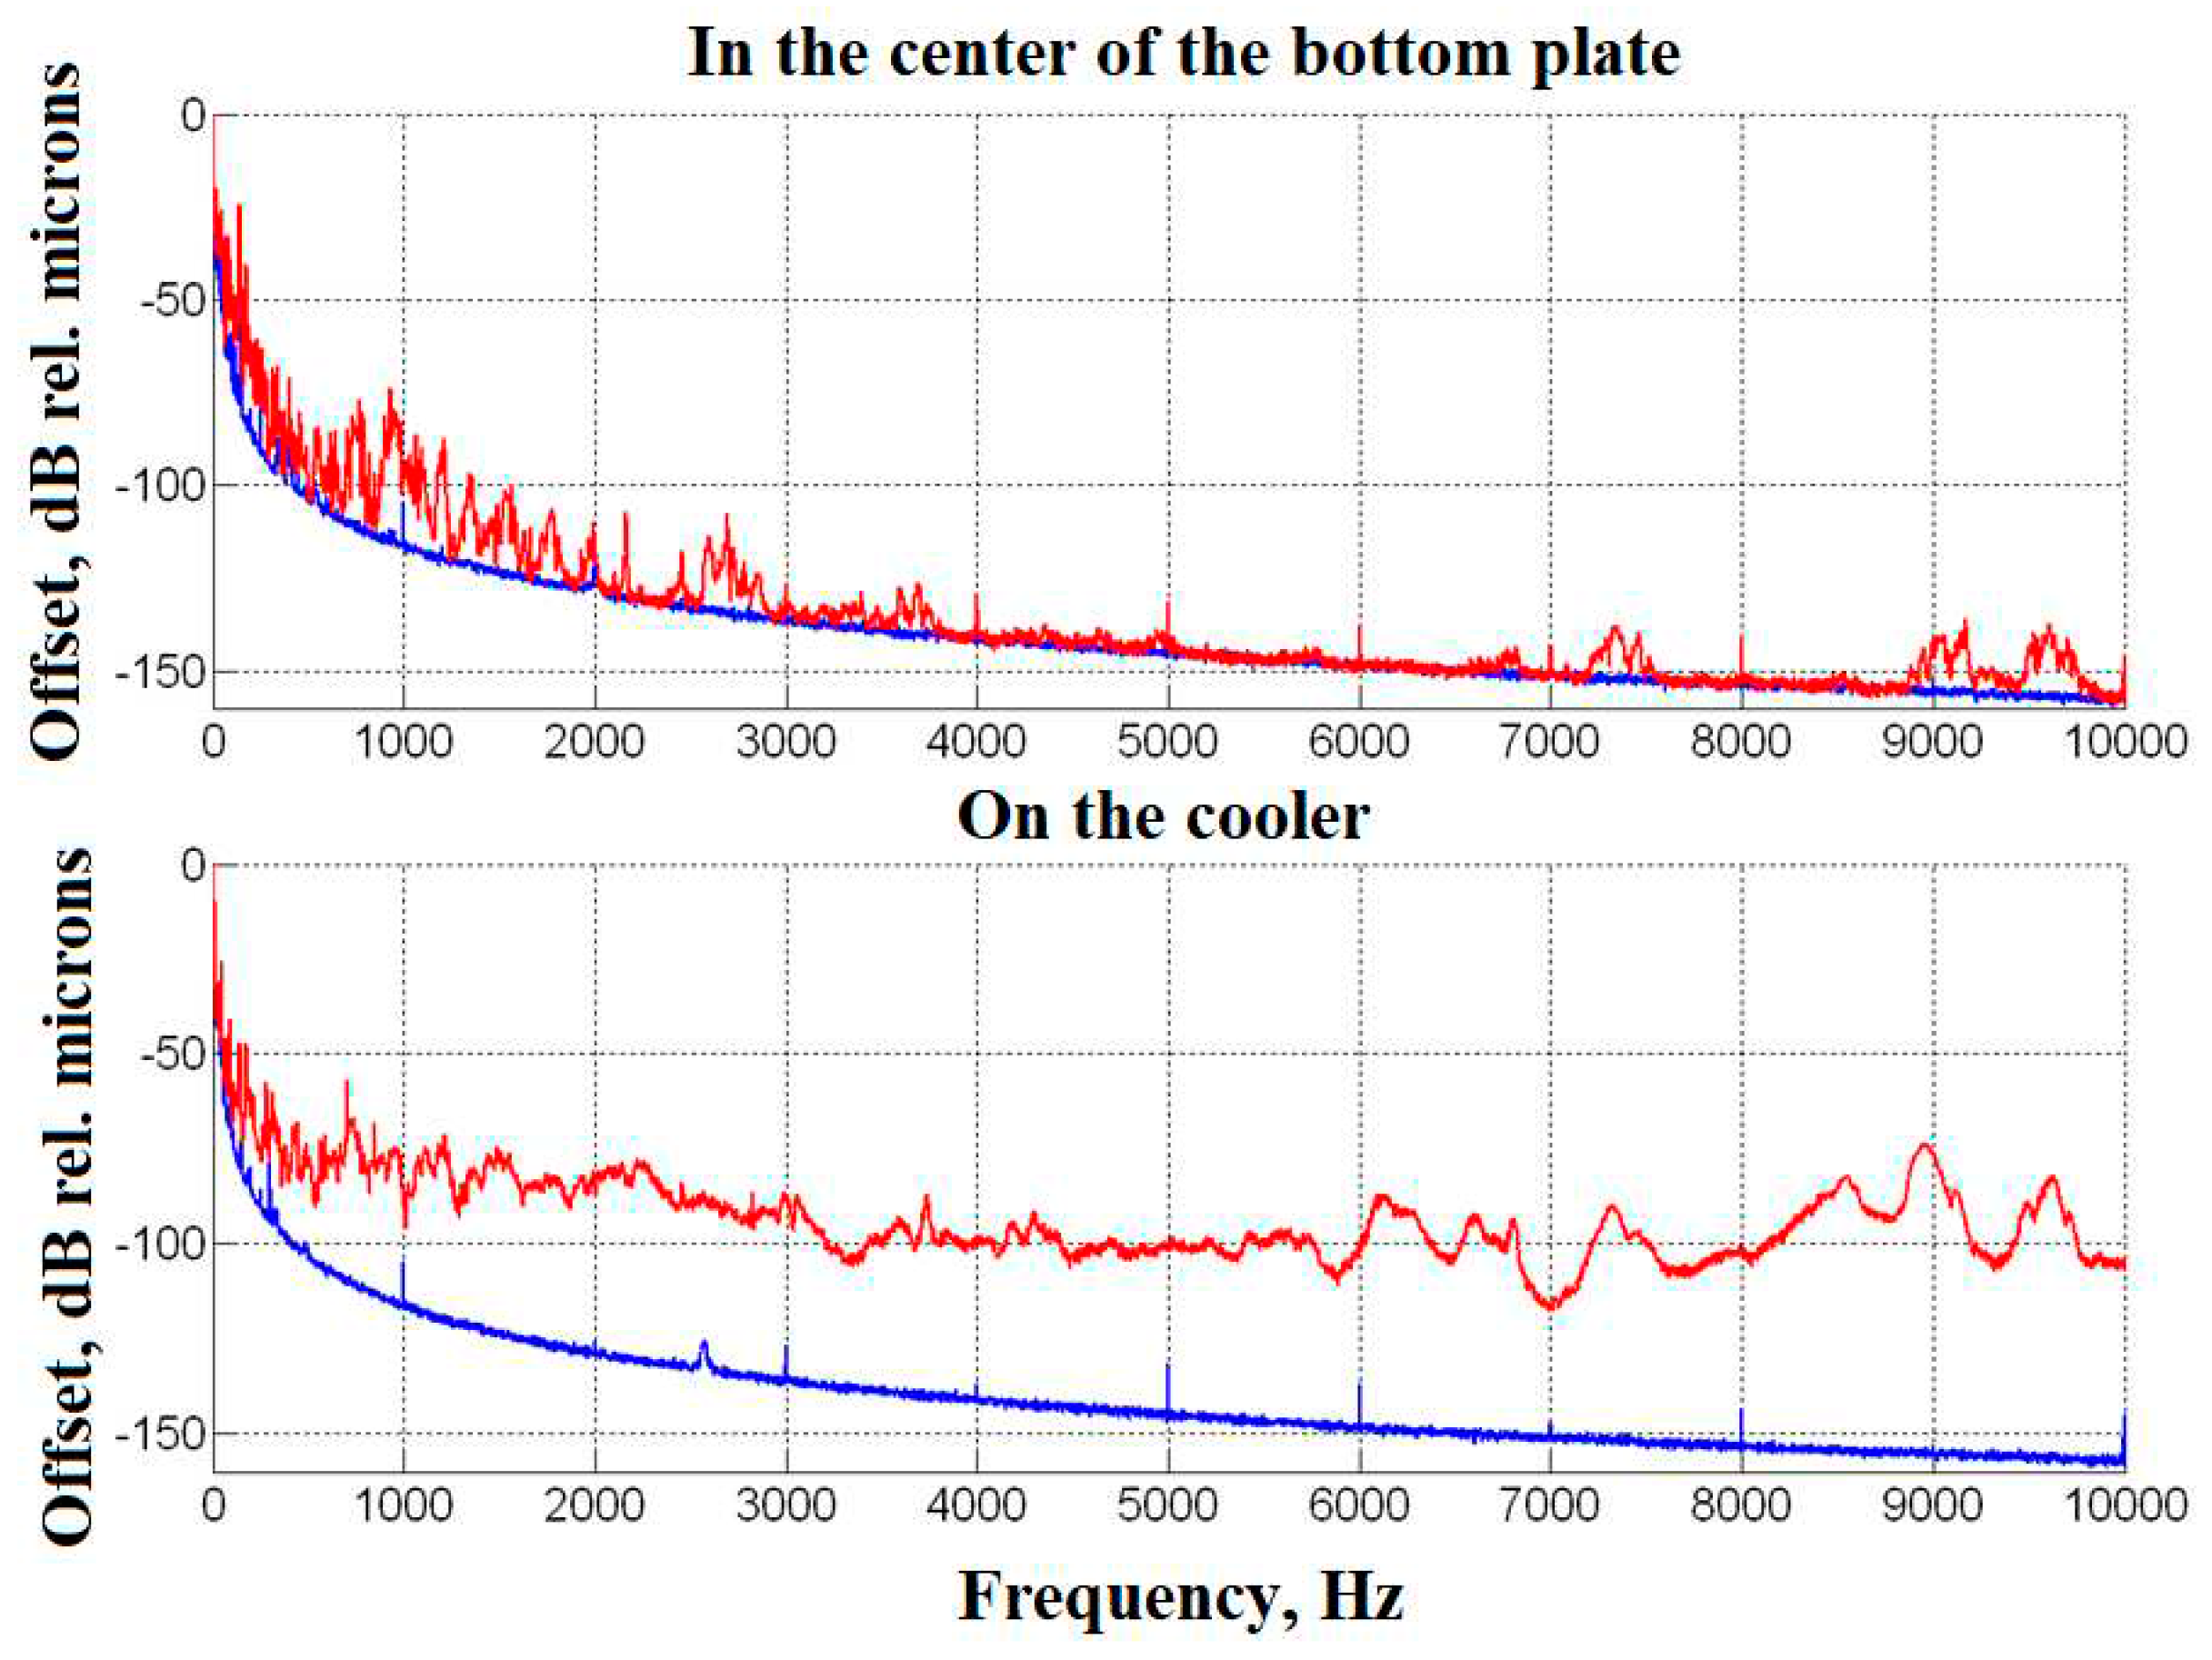
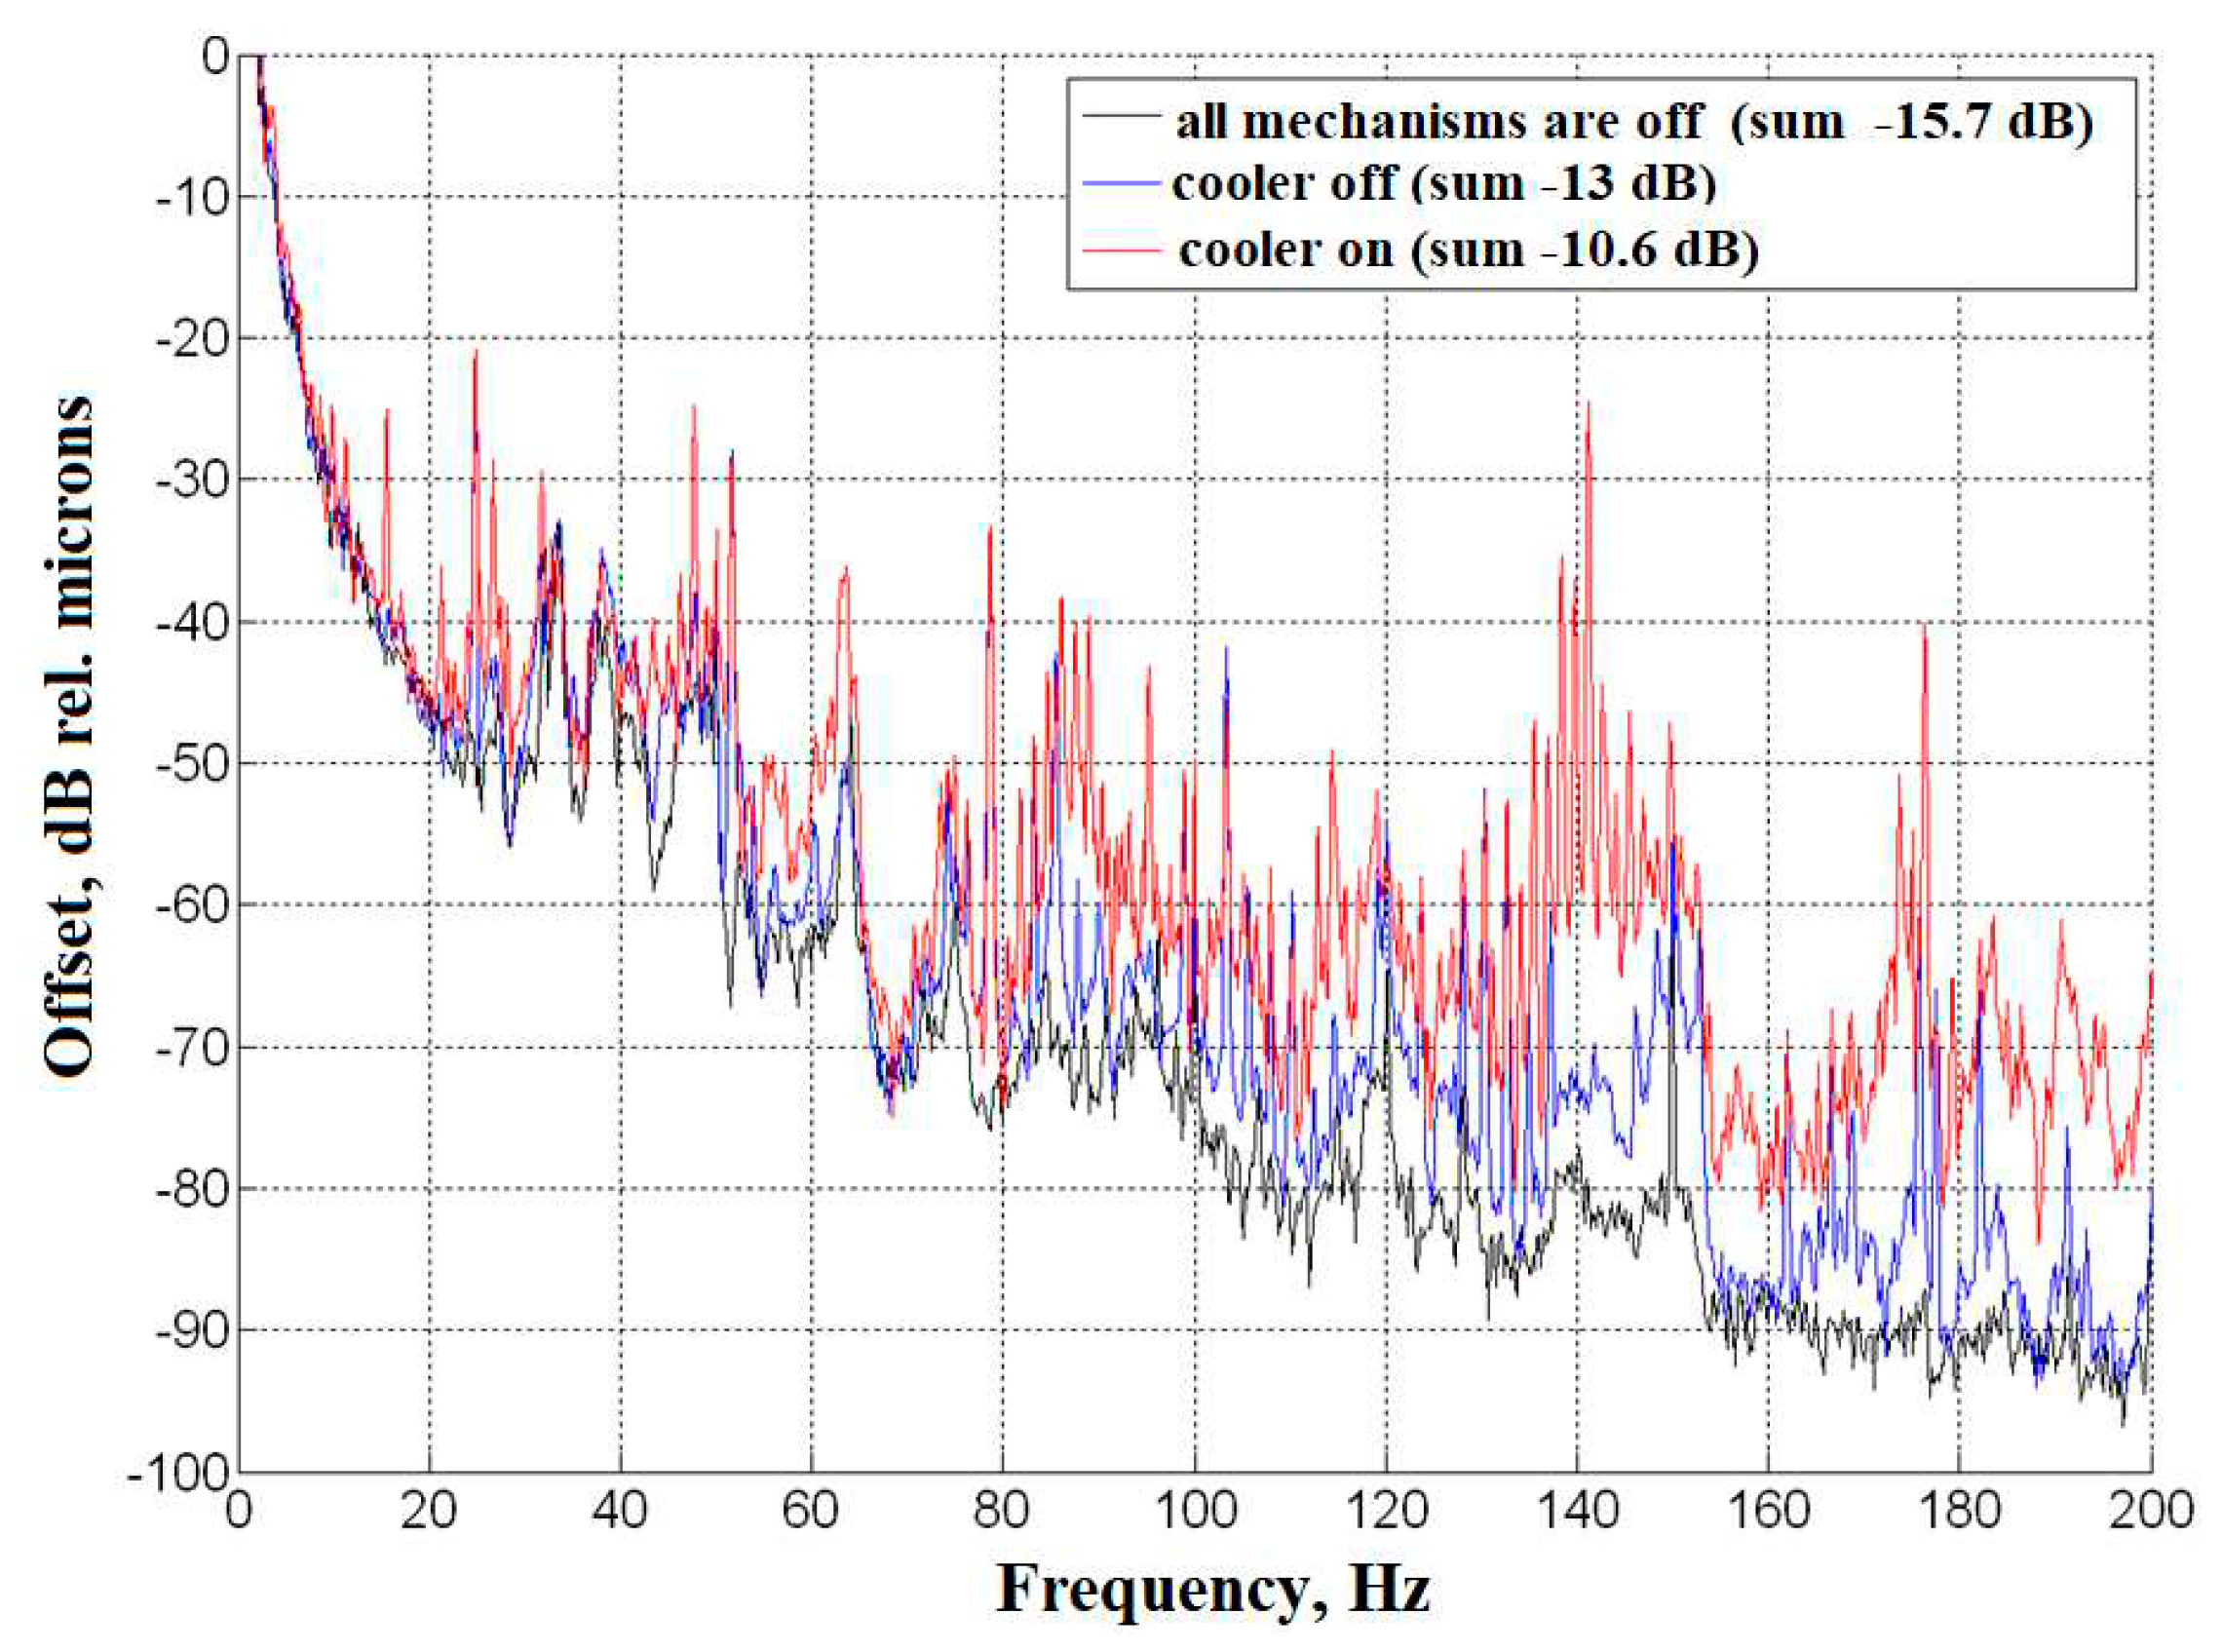
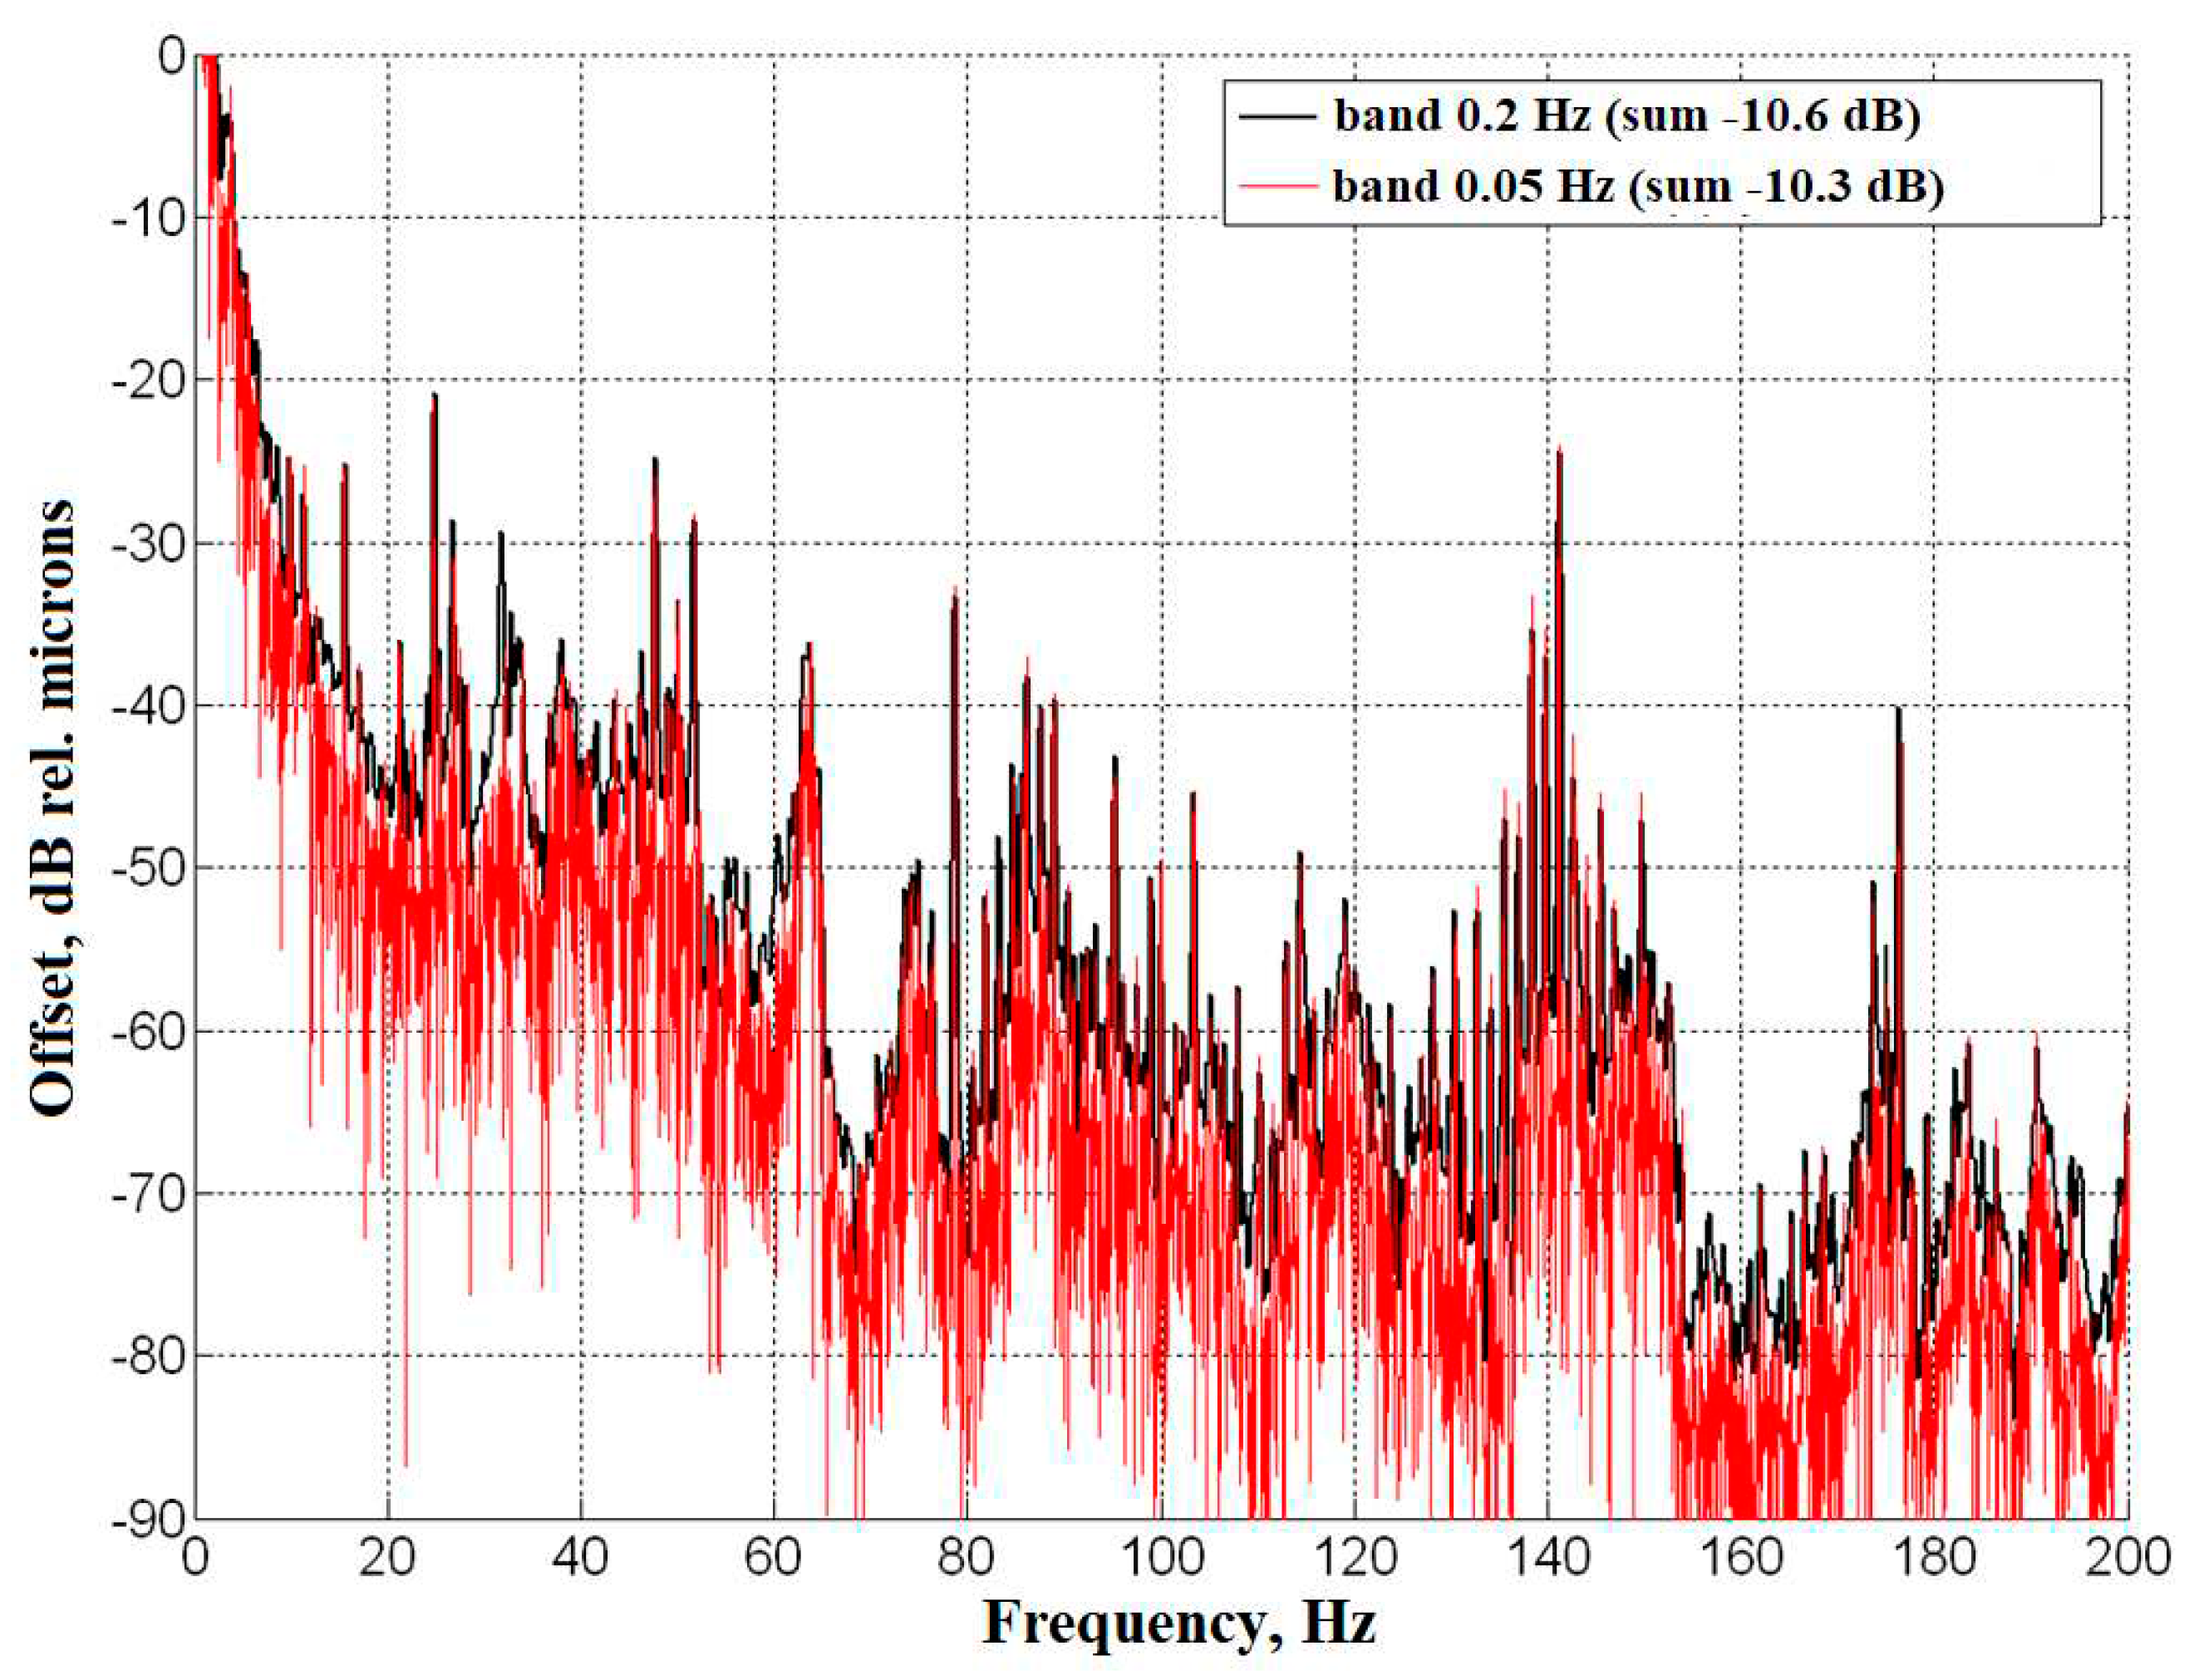
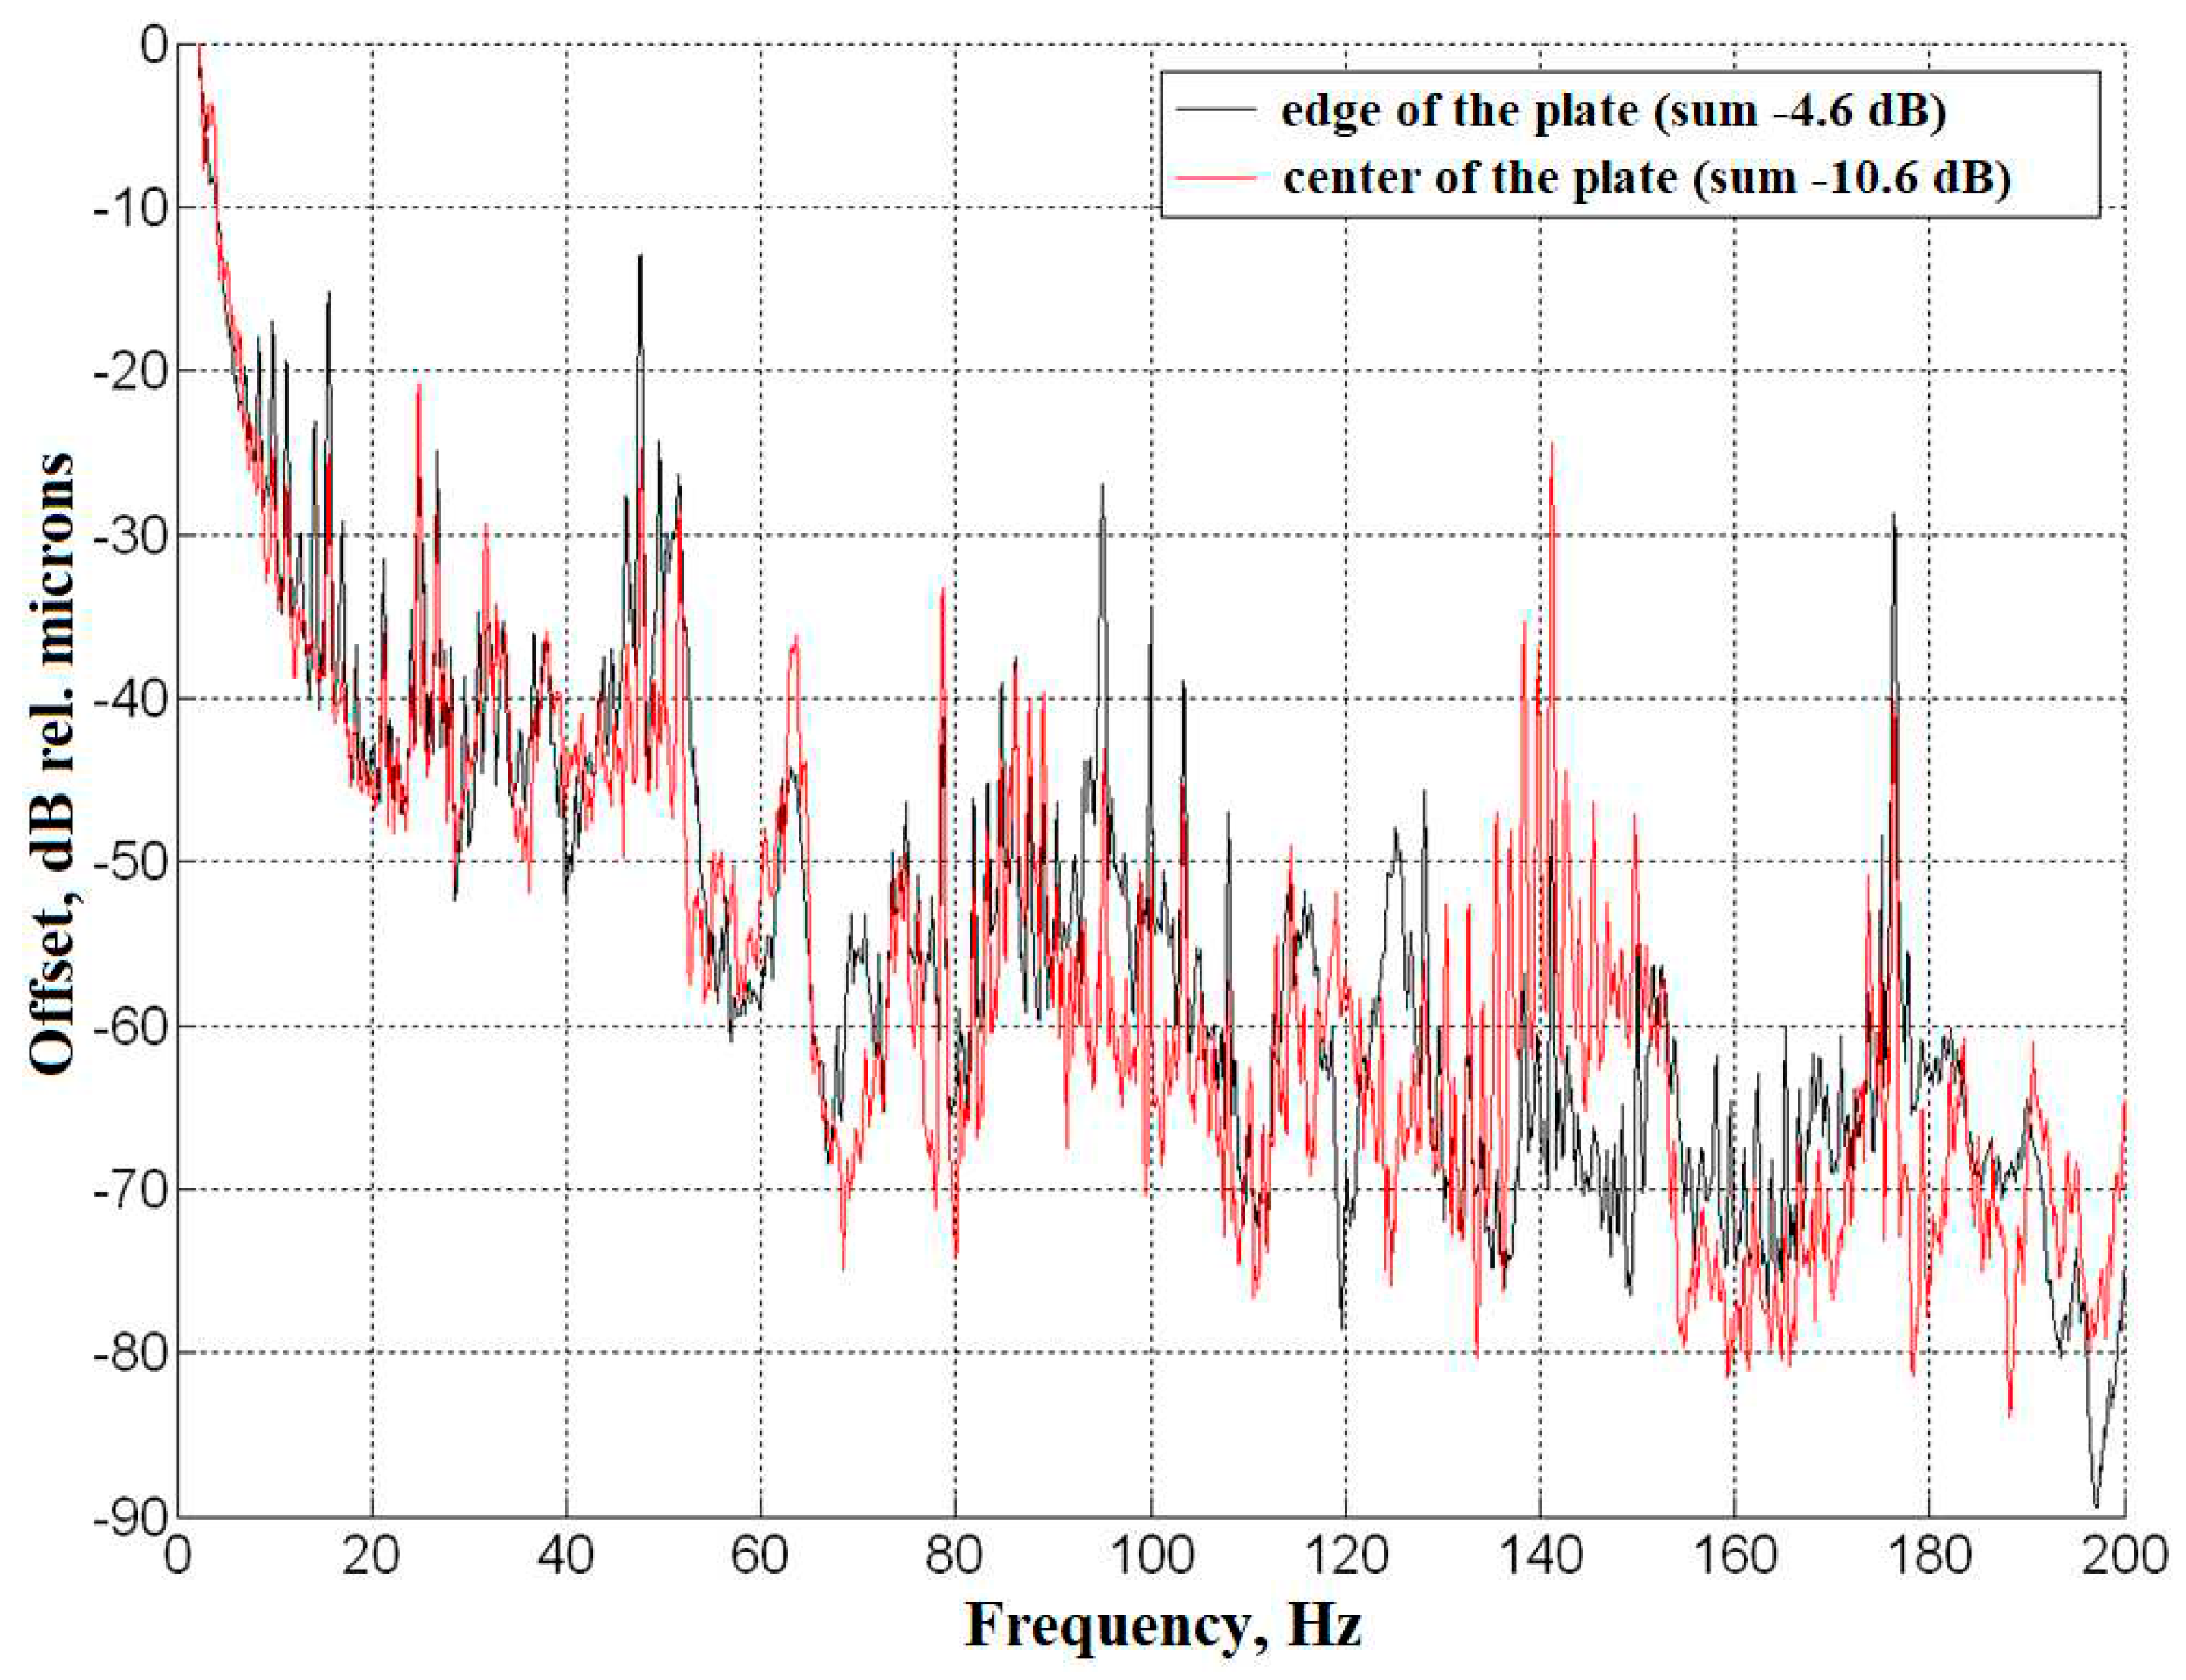
- vibrations in the working area are determined by the periodic action of the cooler, the width of the discrete components of vibrations is obviously < 0.1 Hz;
- vibration displacement levels on narrow-band components at control points on the lower plate in the working area of the installation do not exceed 0.22 microns (< 0.1 μm in the center of the plate). The integral level of vibration displacement in the 8-200 Hz band is in the range of 0.3-0.6 μm for different points of the plate;
- to provide measurements in the frequency range of 0-5 Hz, it is recommended to use a laser vibrometer. It is also recommended to evaluate its capabilities for measurements at operating temperatures. Achievable measurable levels using standard laser vibrometers will be no worse than 100 nm up to zero frequencies;
- to develop recommendations for reducing the vibration level of the structure in the working area of the installation, a more detailed measurement of the vibration acoustic characteristics of the stand (transmission coefficients from the source to the working area) should be carried out and measures for vibration isolation of the installation as a whole should be developed. For the following measurements, use a measuring path with a lower noise level;
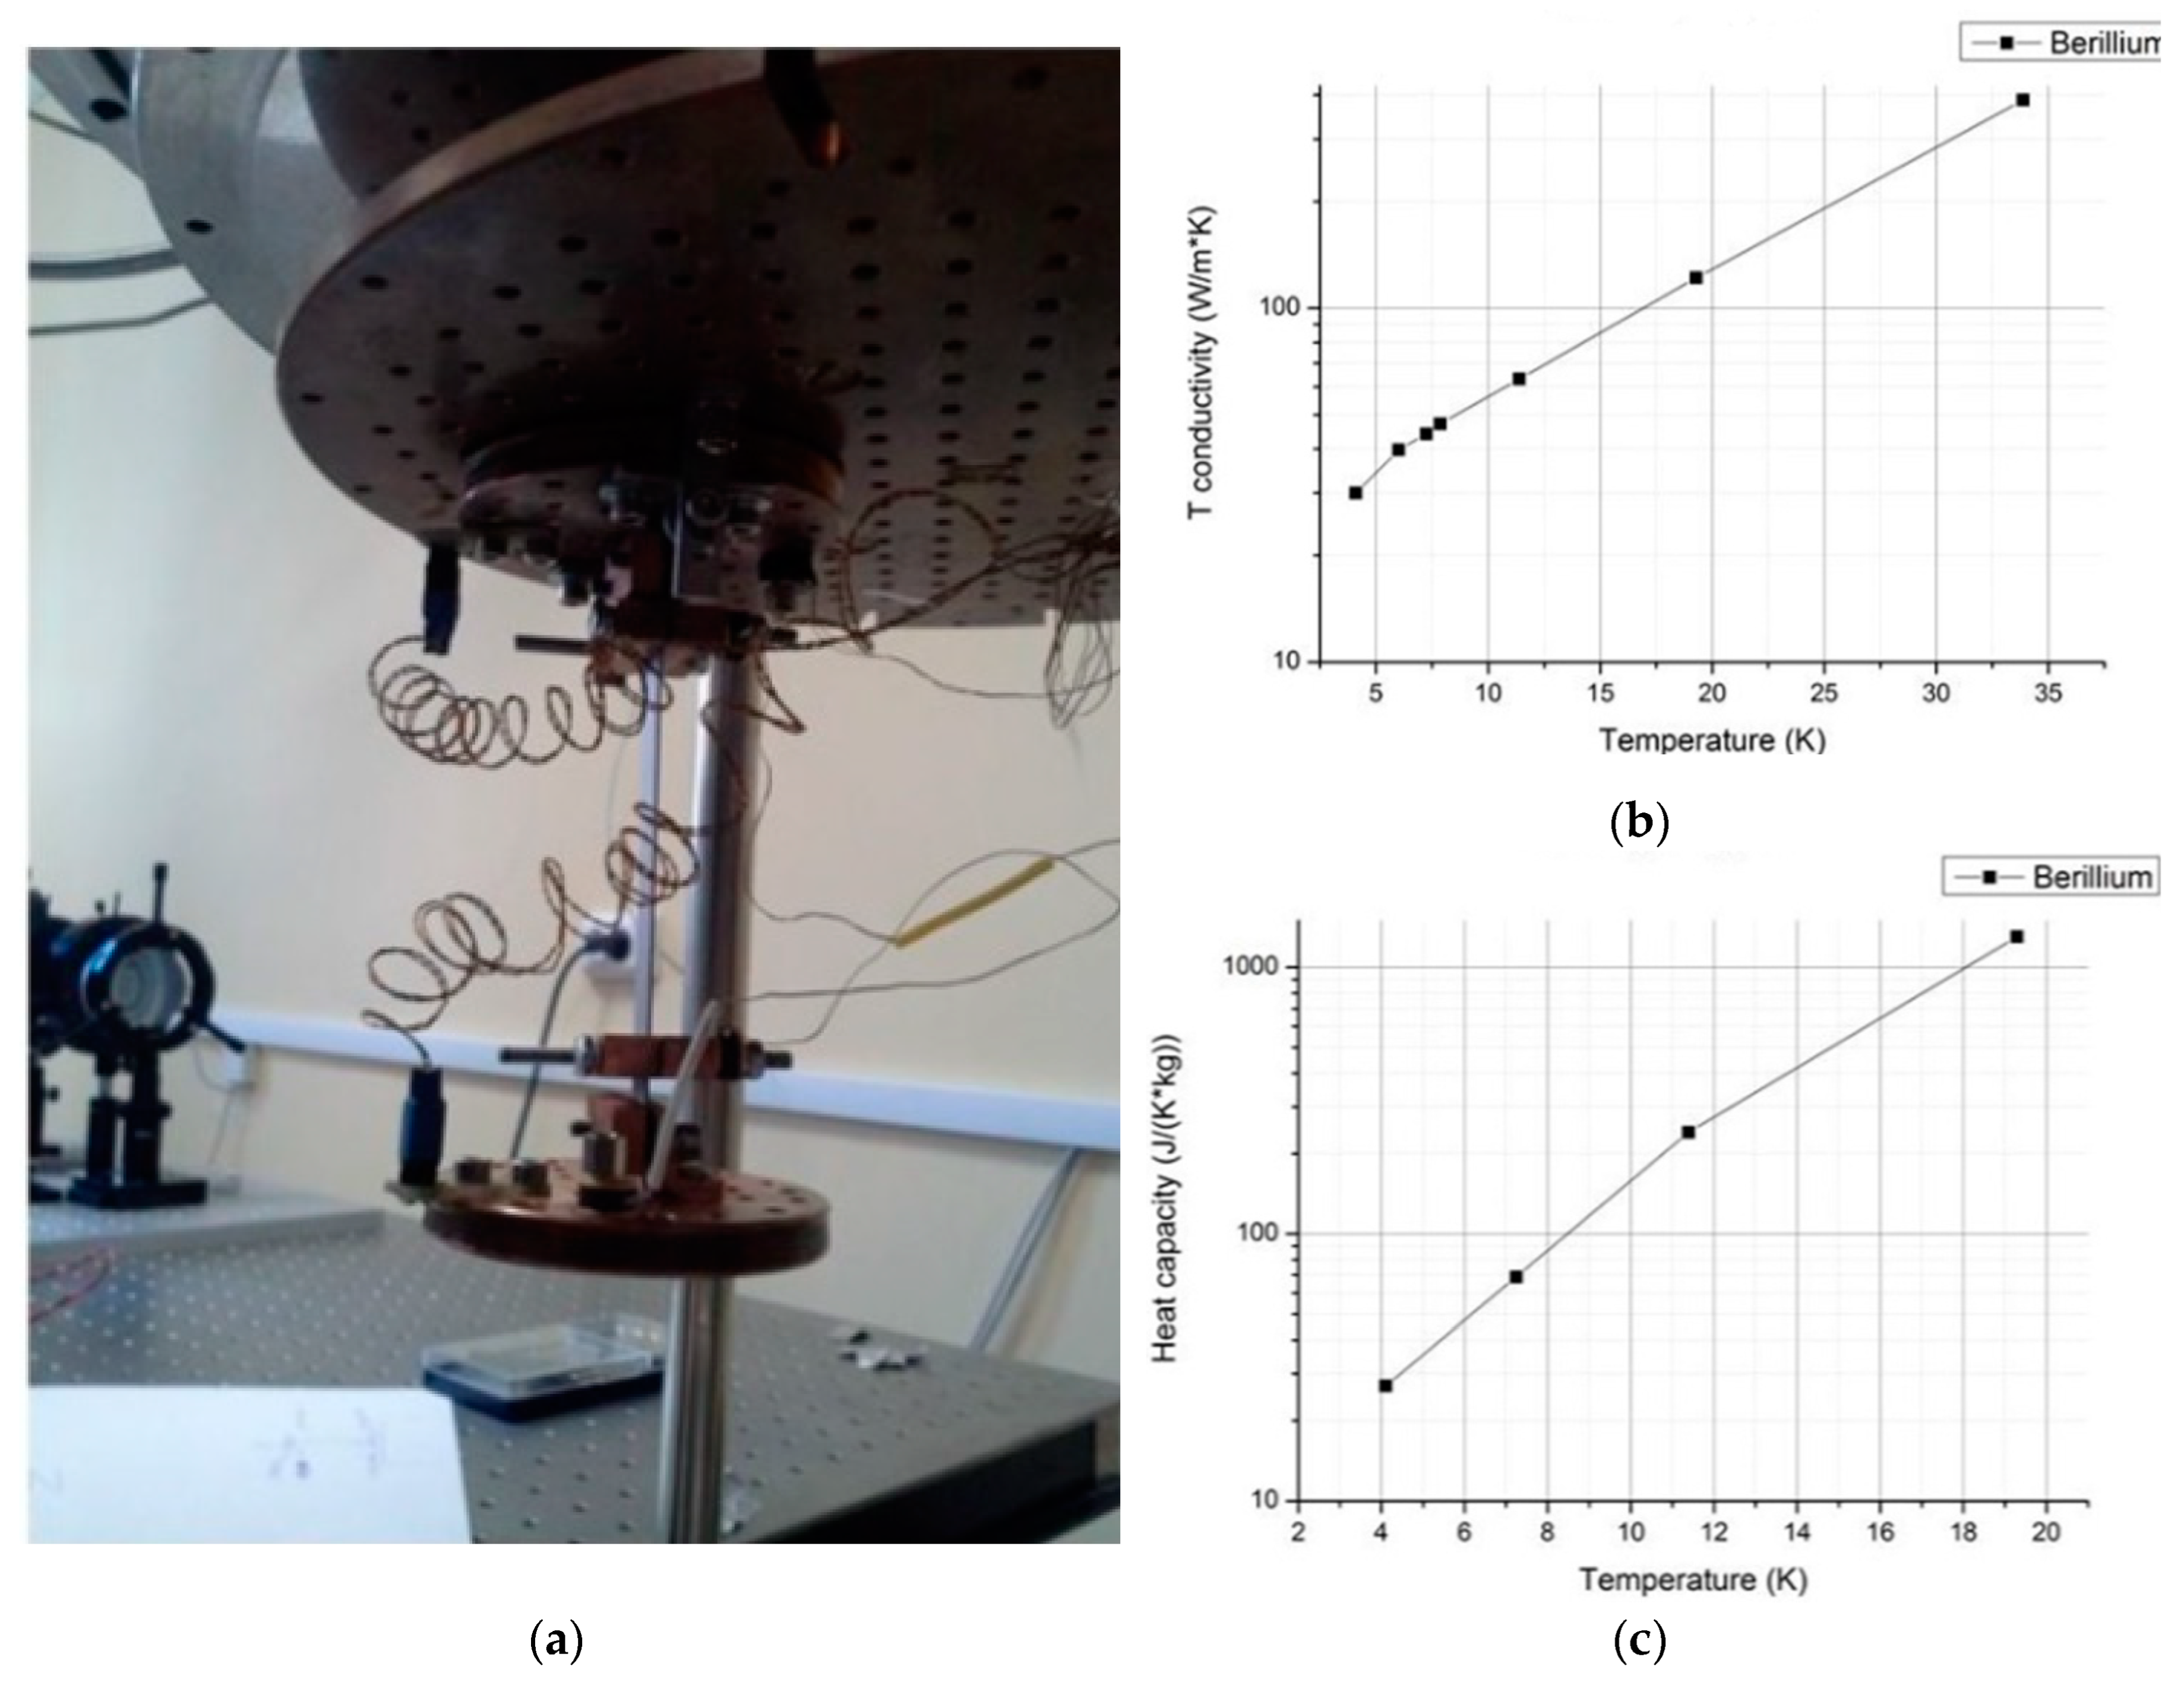
- of course, for the final verification of the data obtained, it is useful to conduct a test during cooling, for this it is necessary to provide thermal and vacuum isolation of measuring equipment, since individual parameters, in particular, heat capacity, thermal conductivity, sound propagation velocity in the medium can vary depending on temperature.
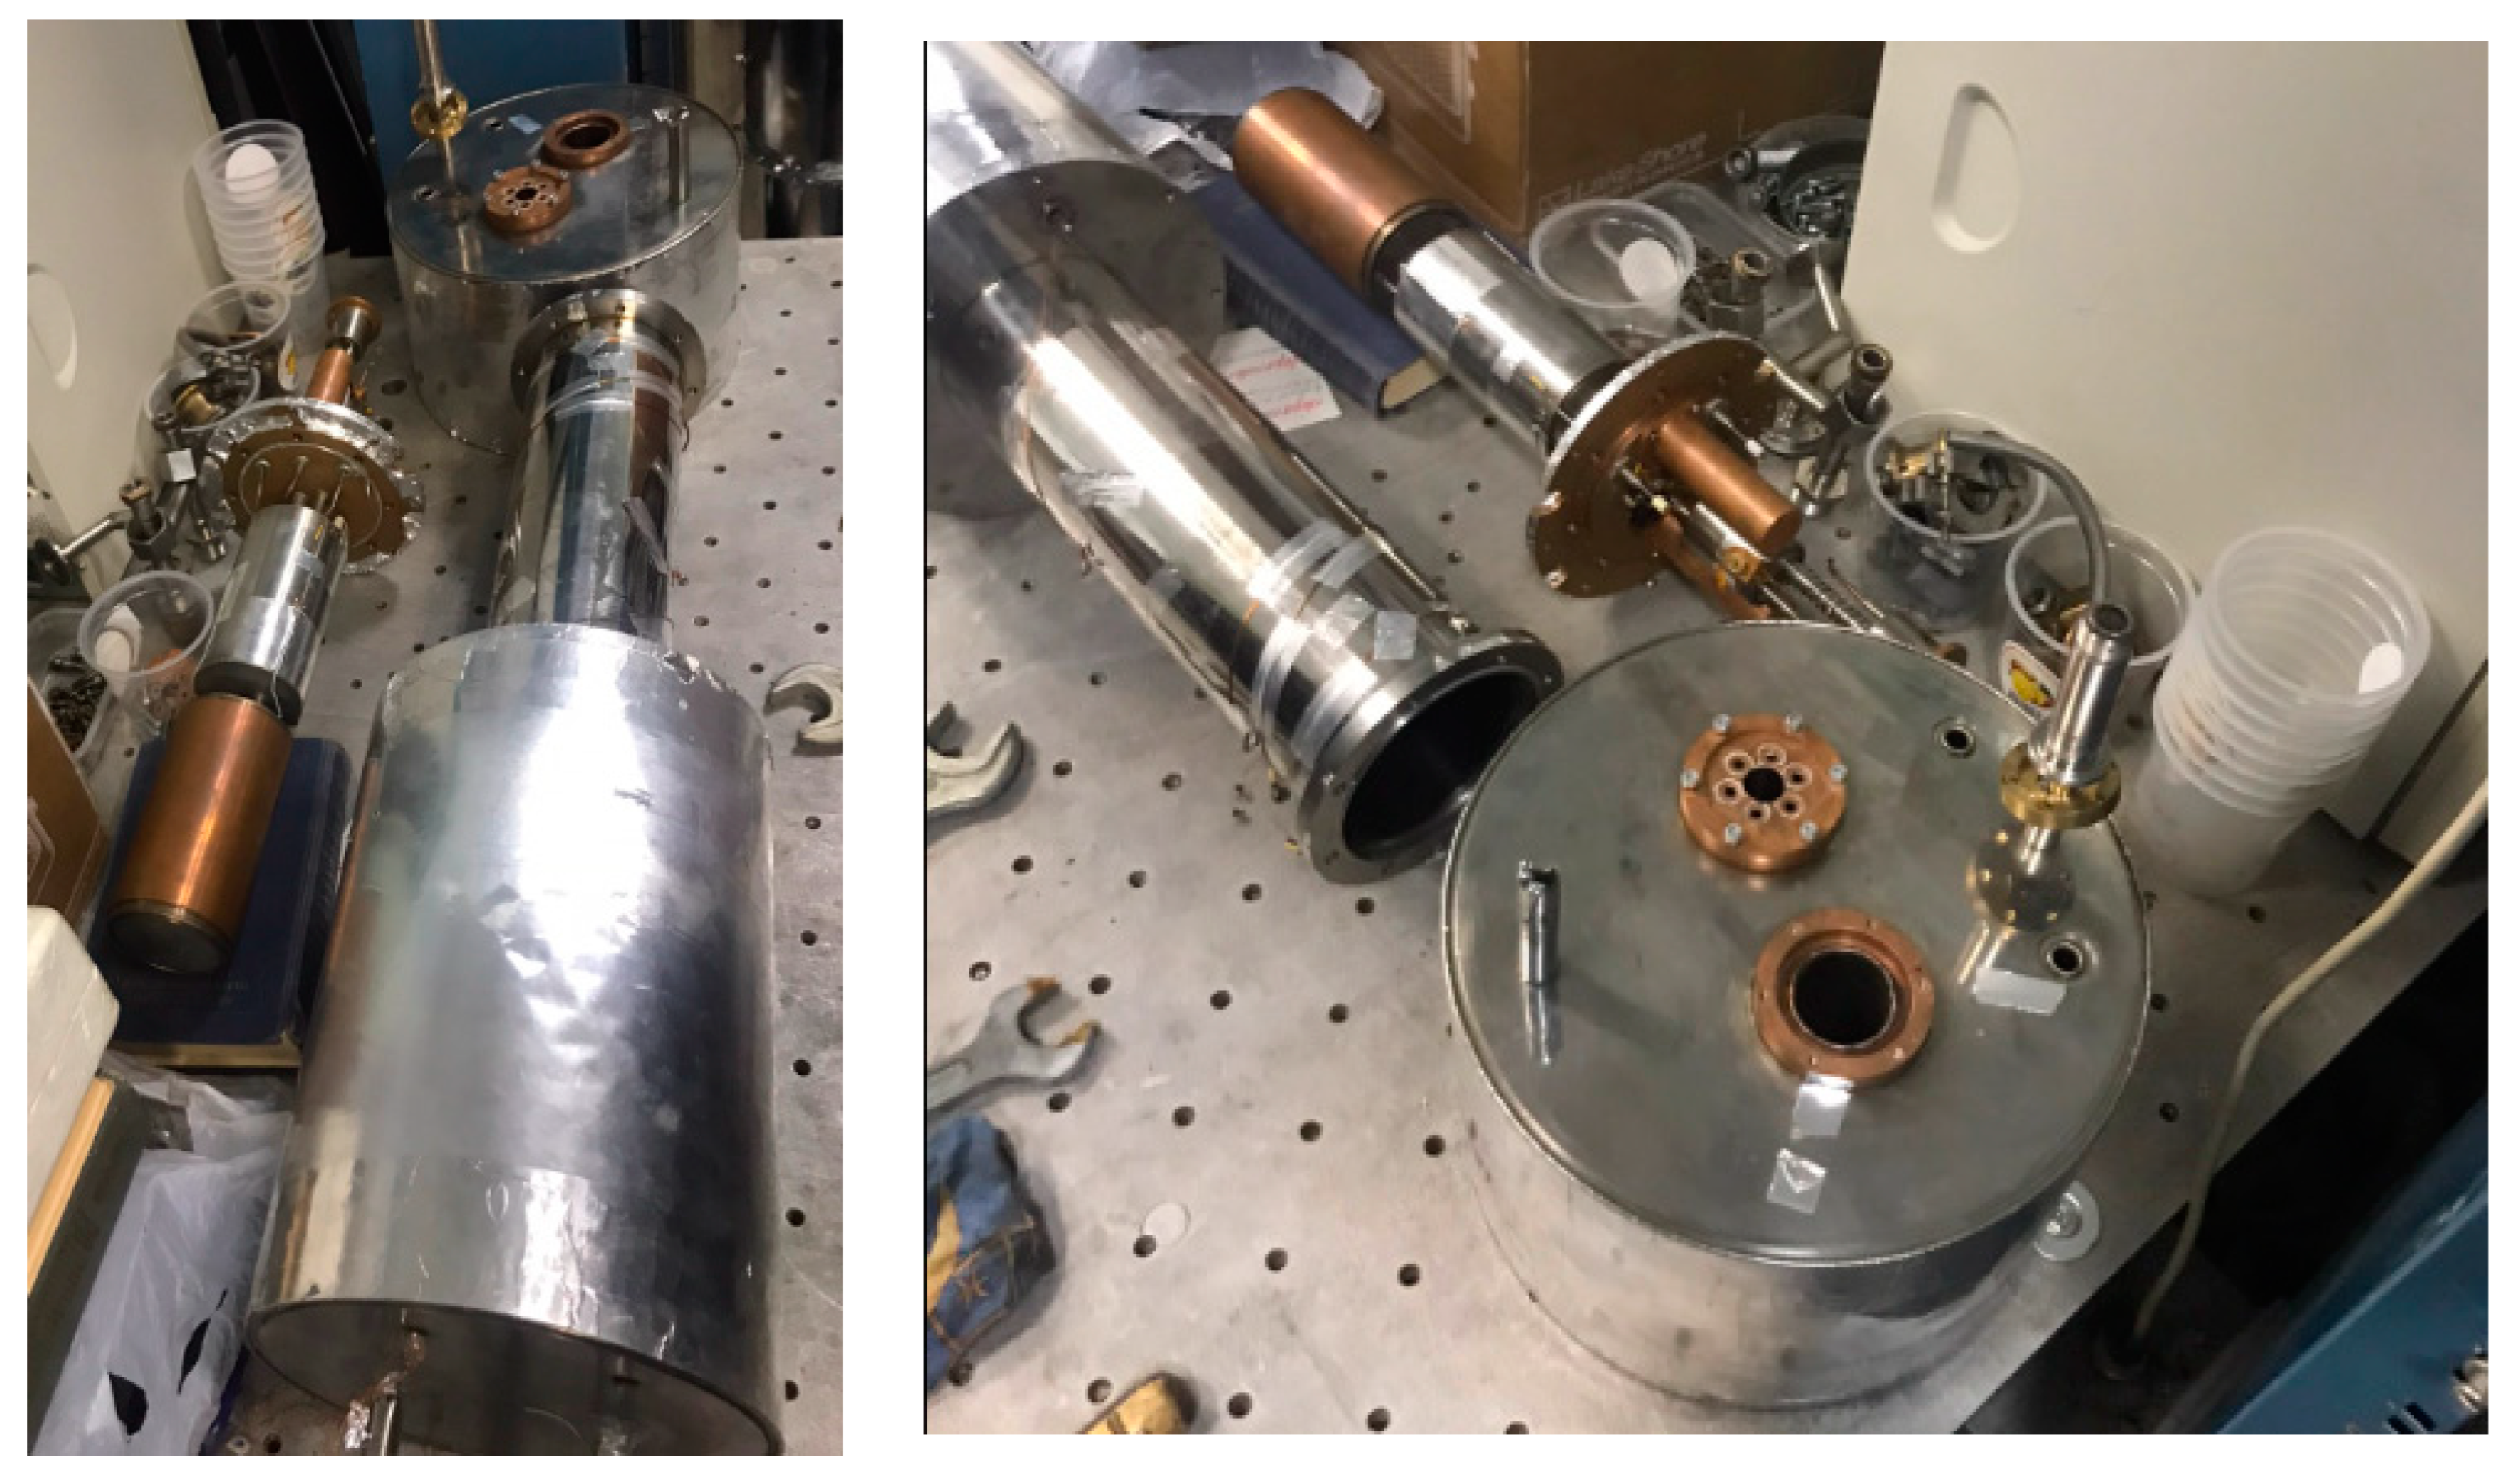
4.1.3. Antivibration 4K cryostating system
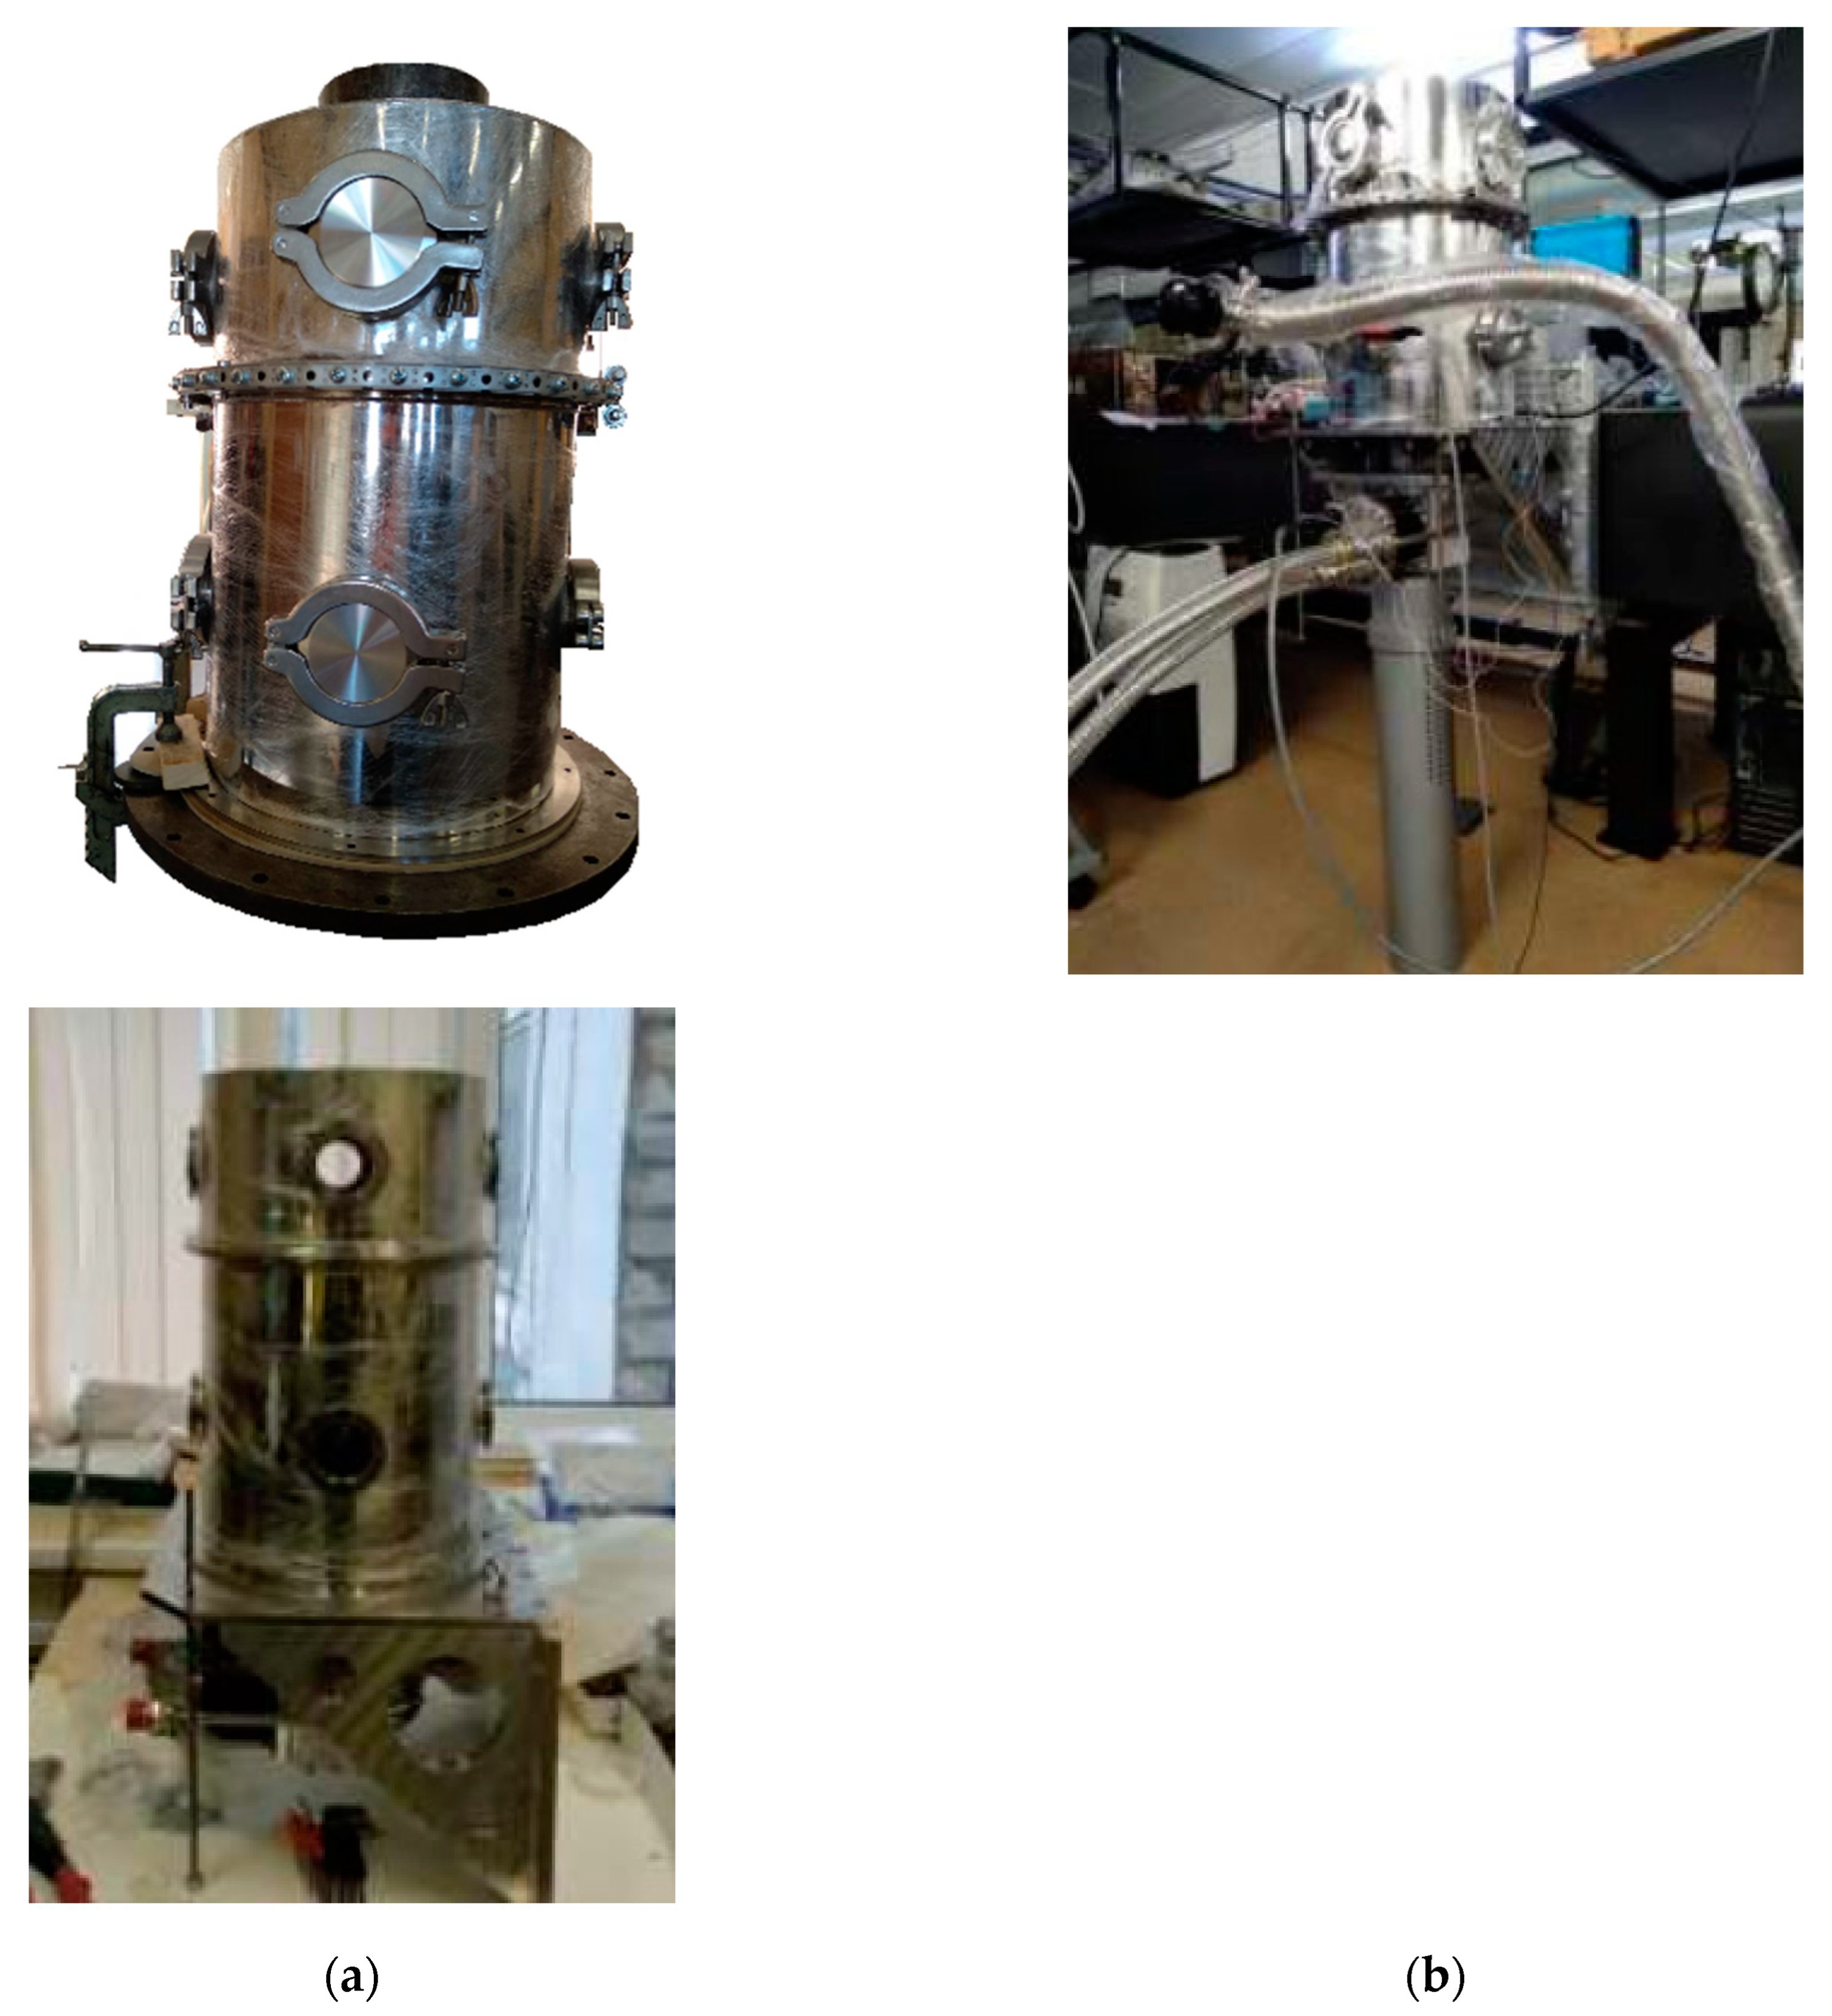
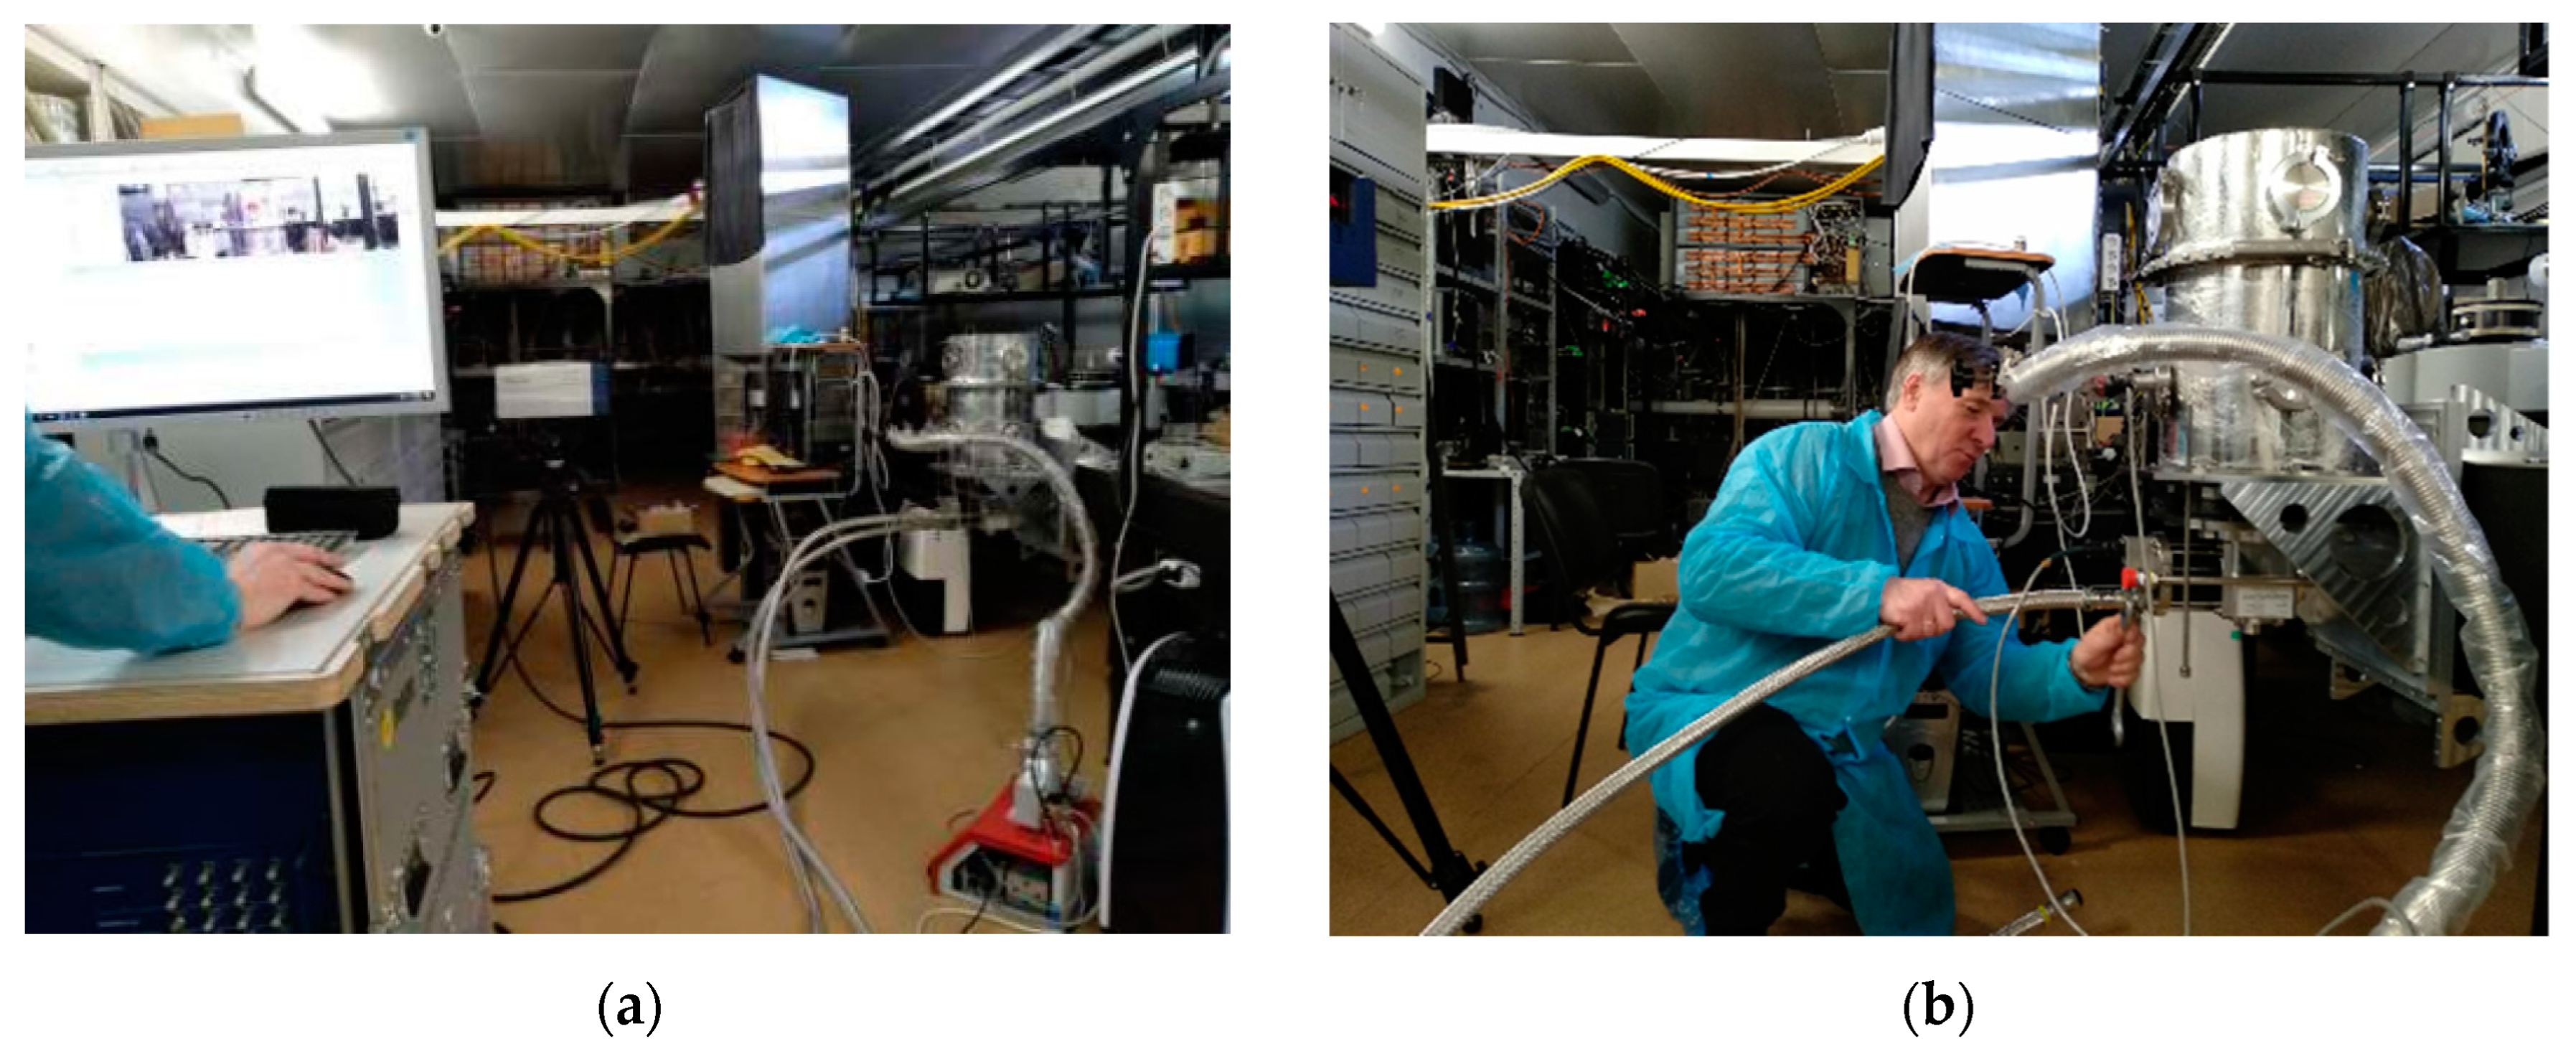
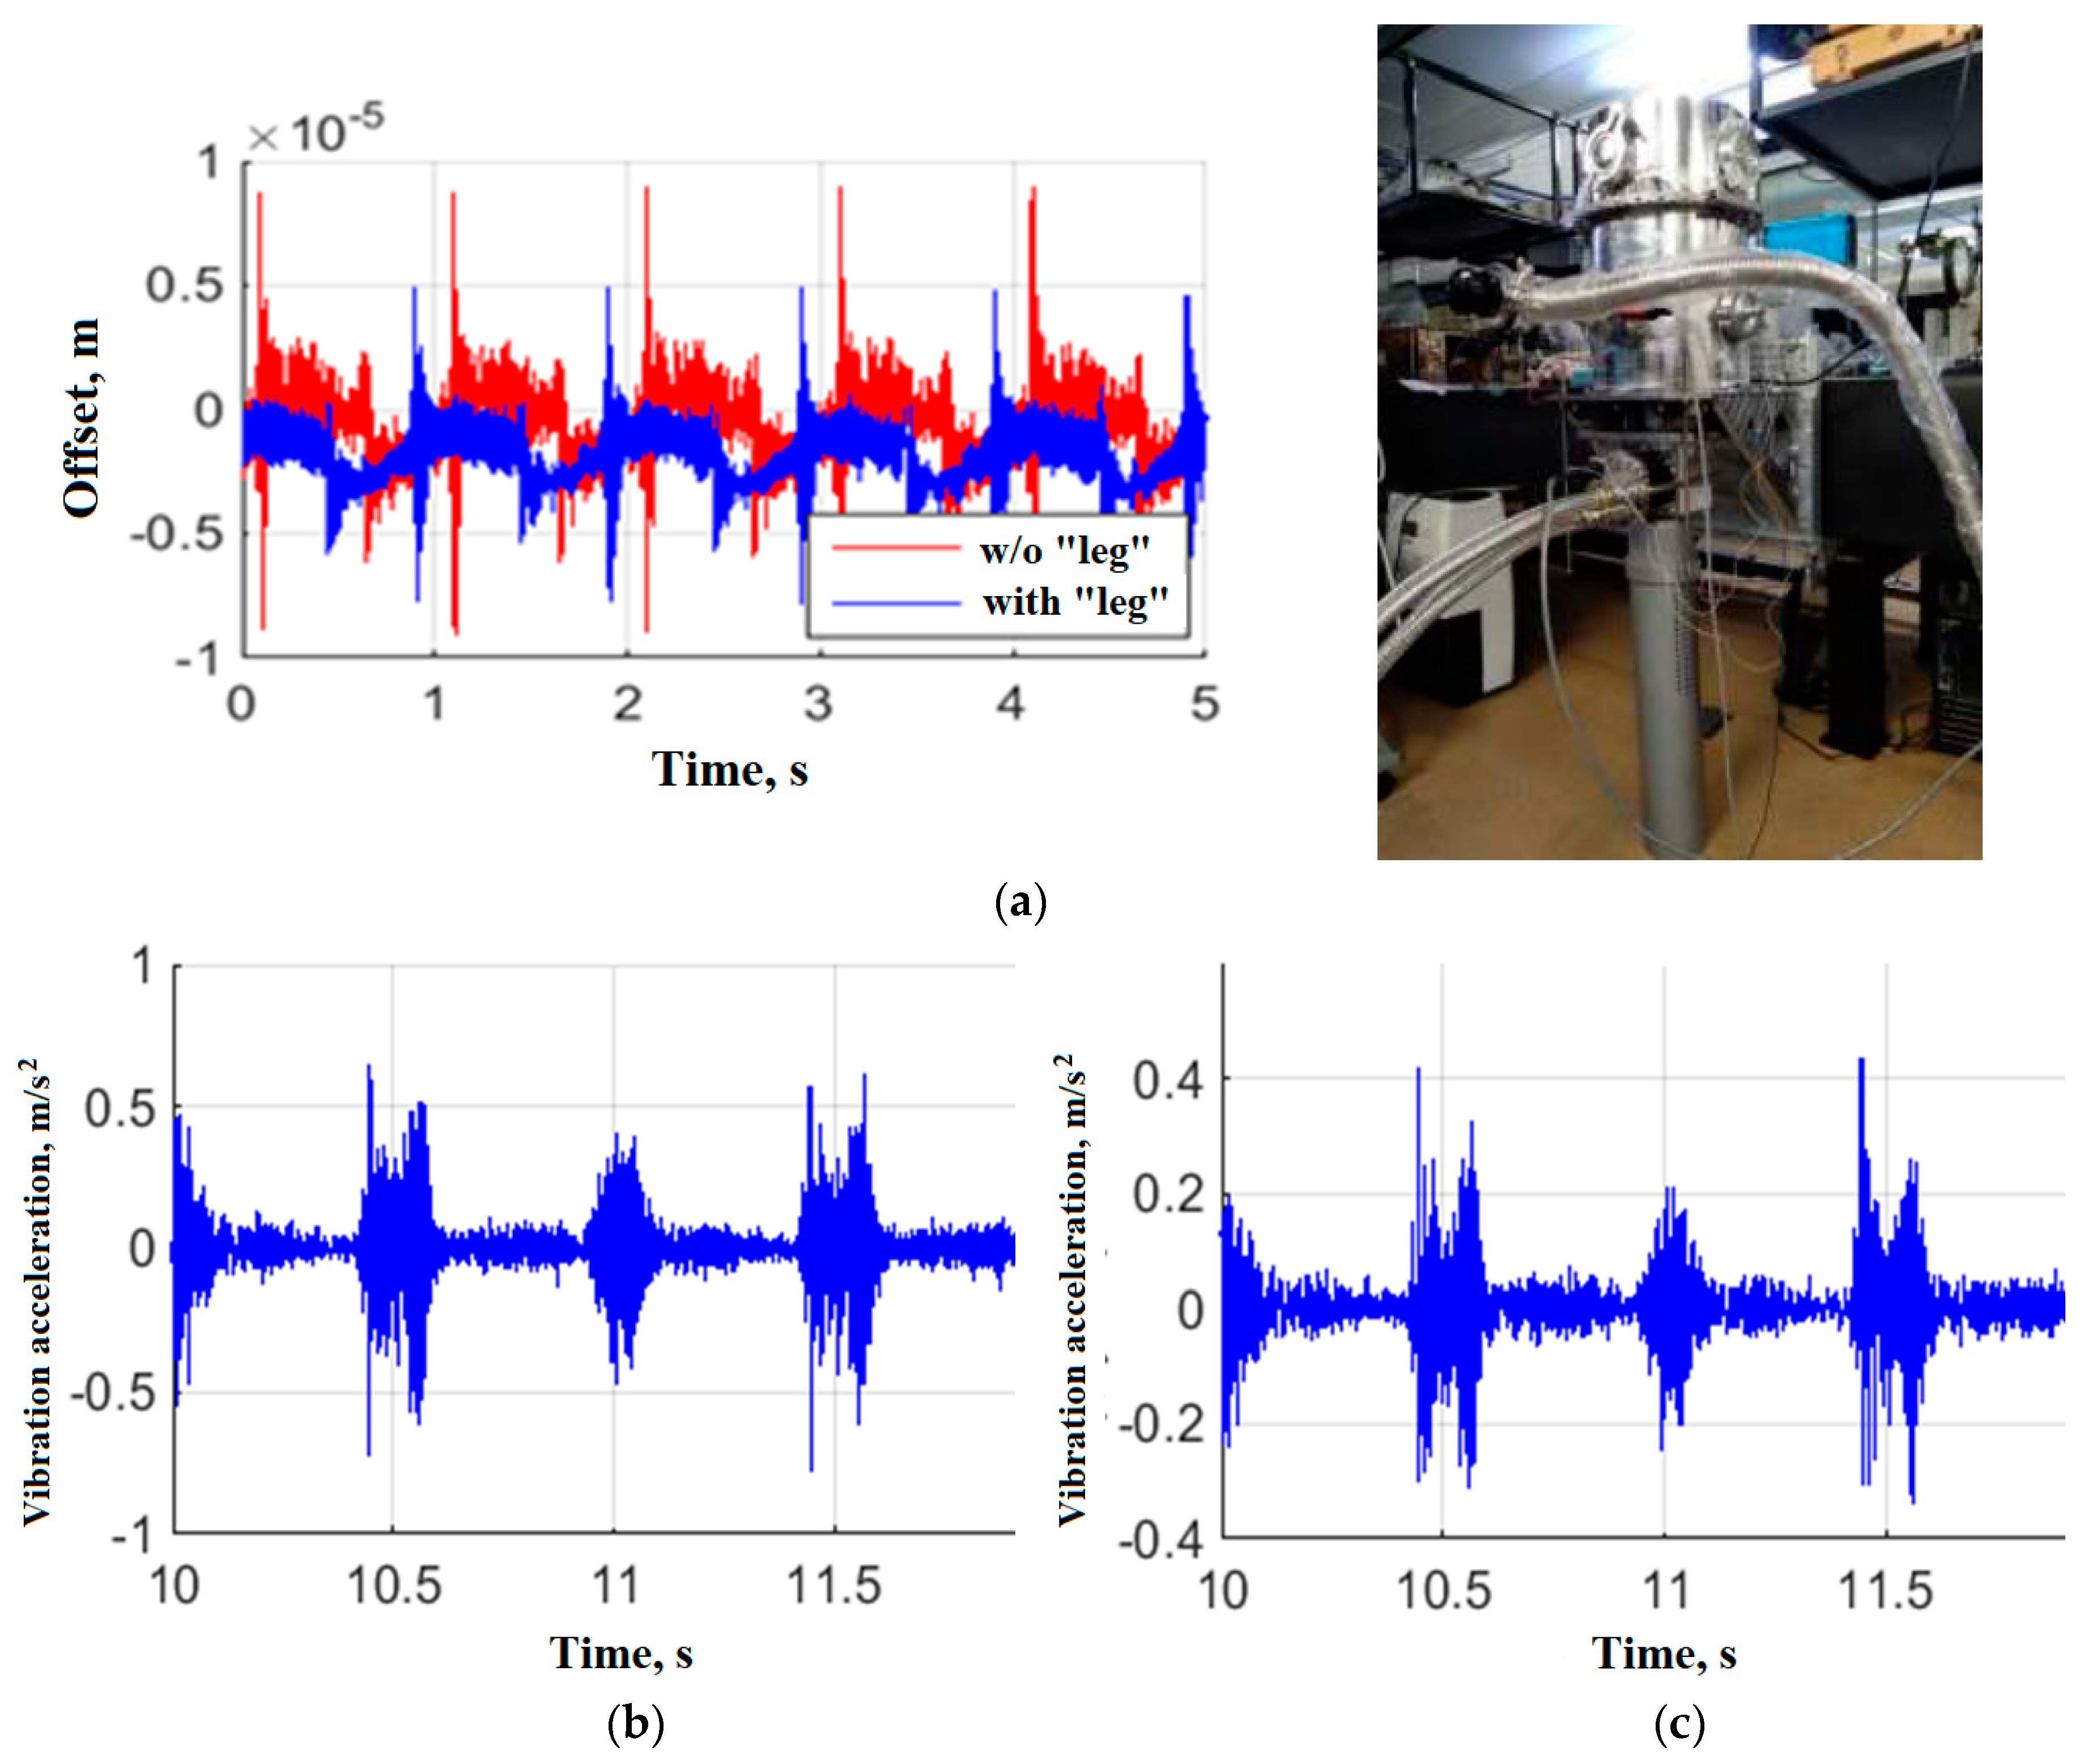
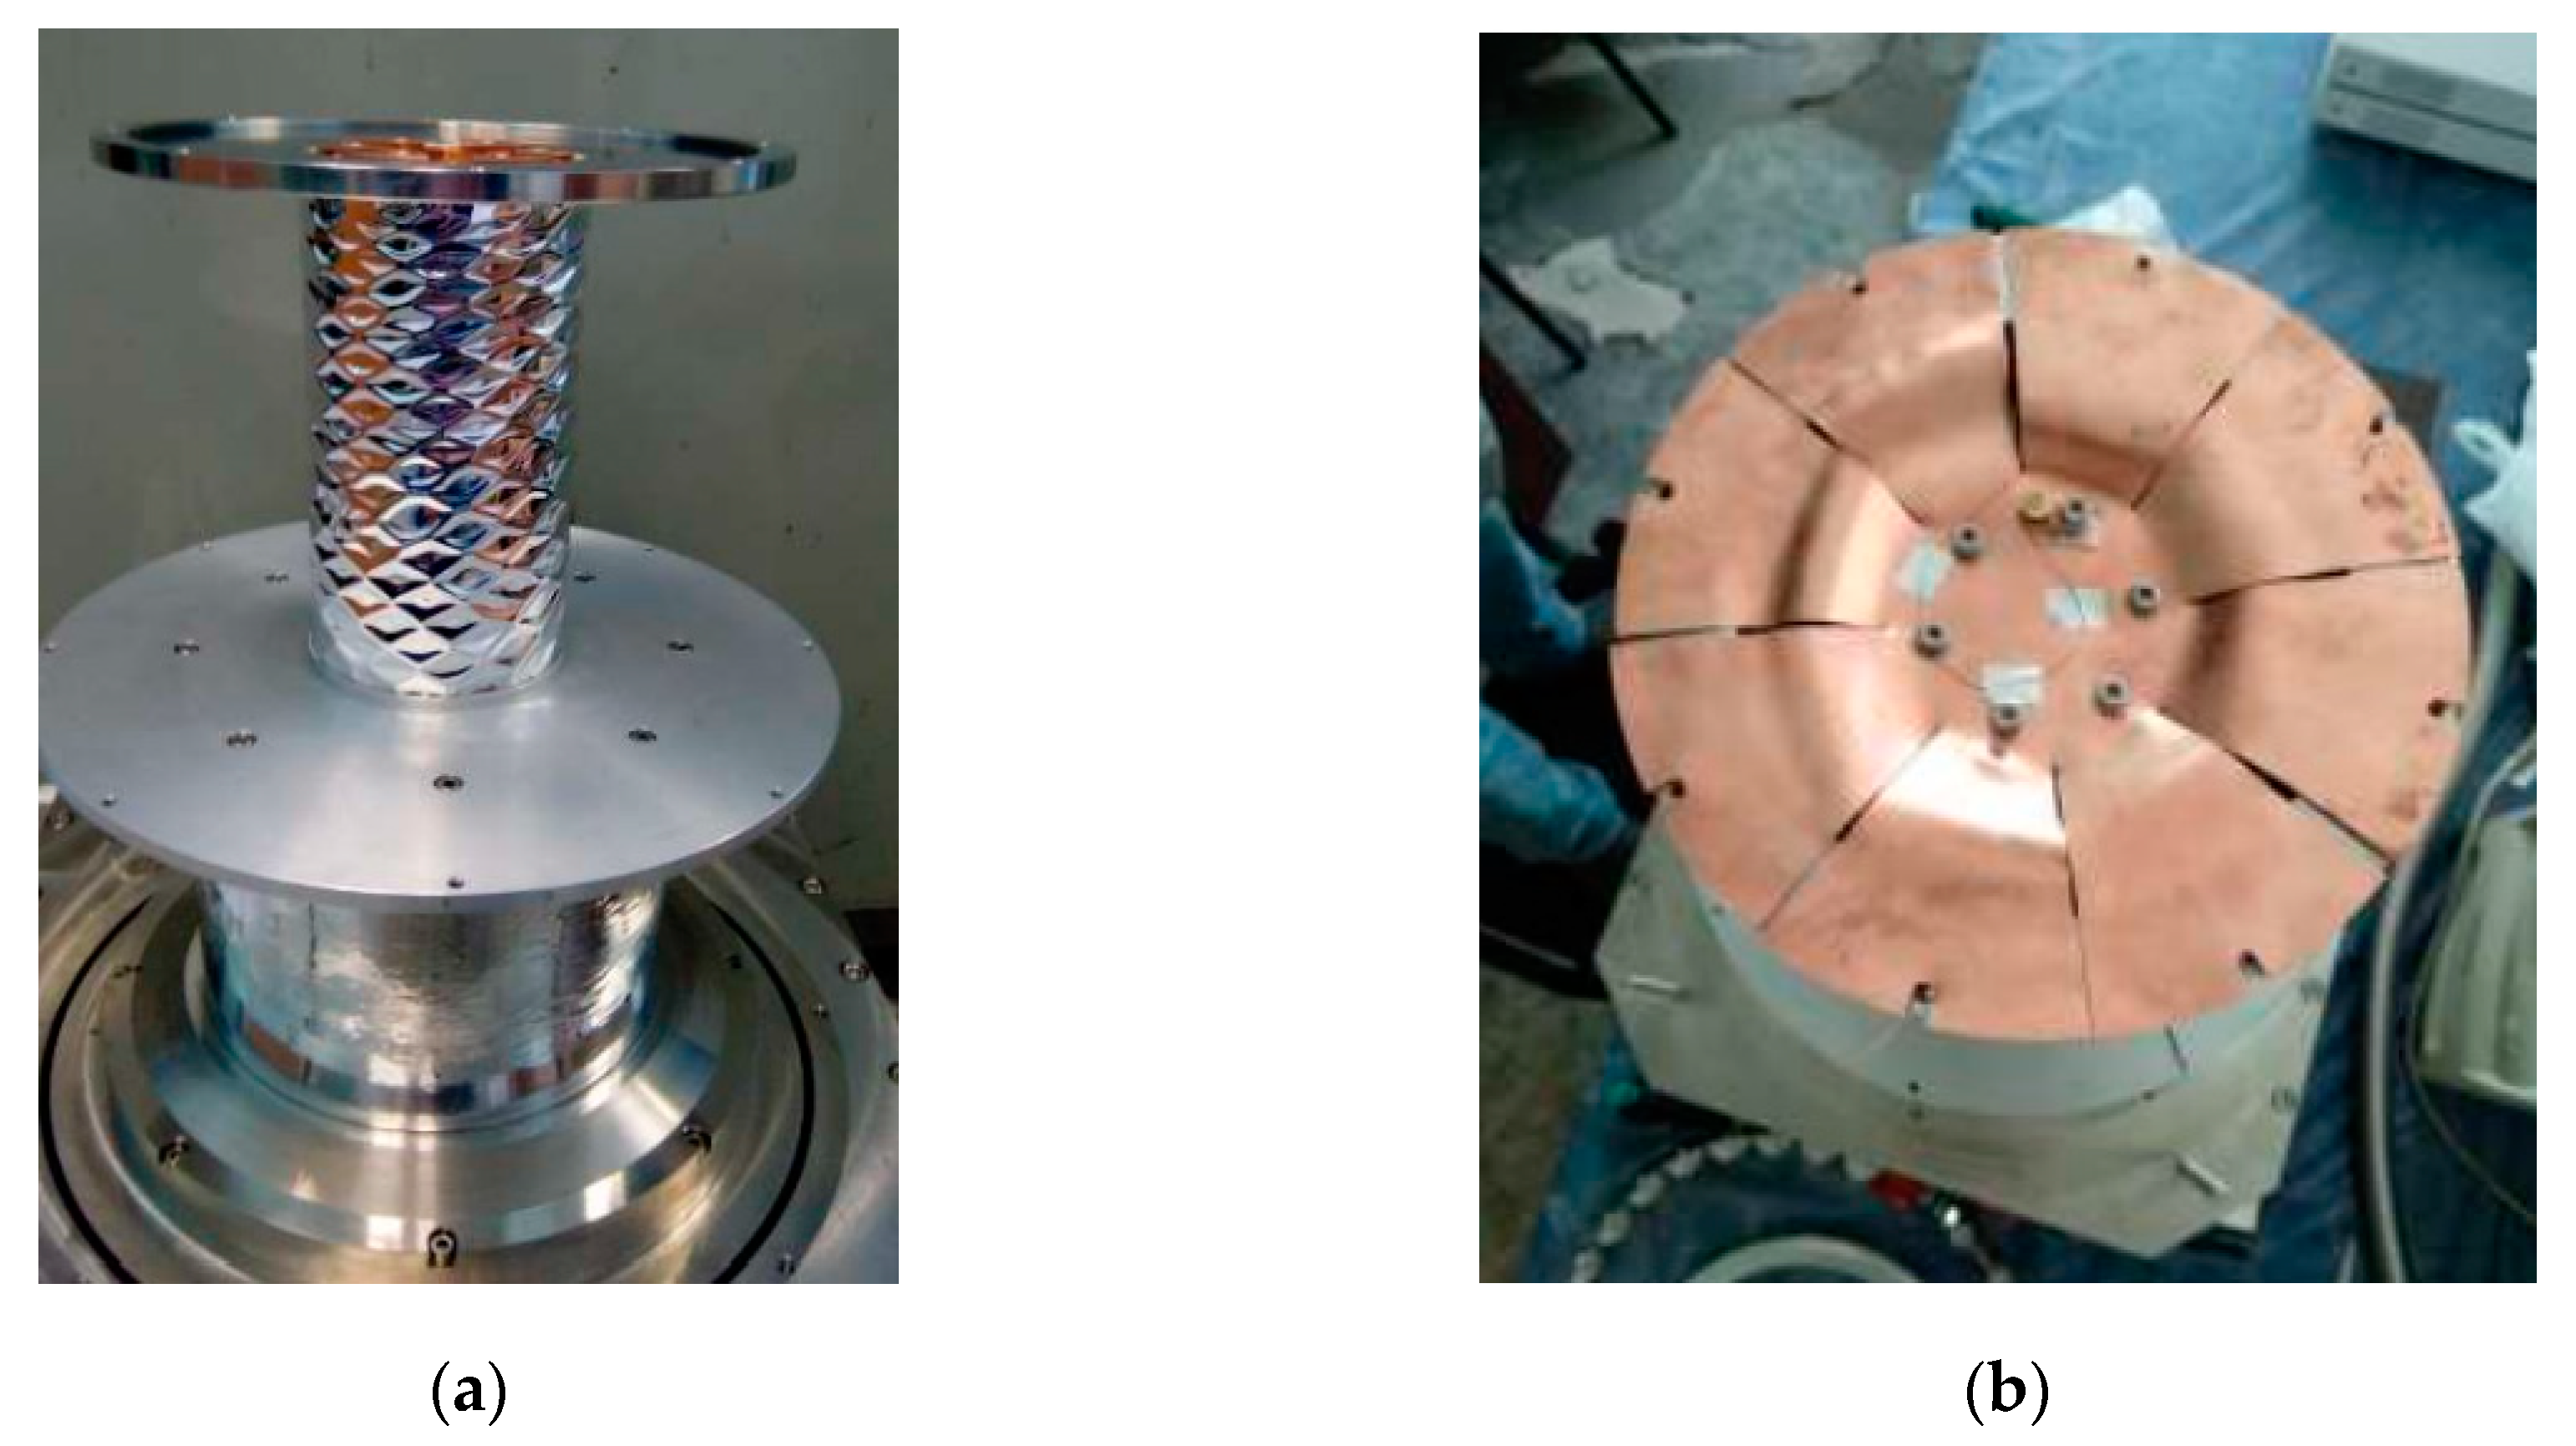
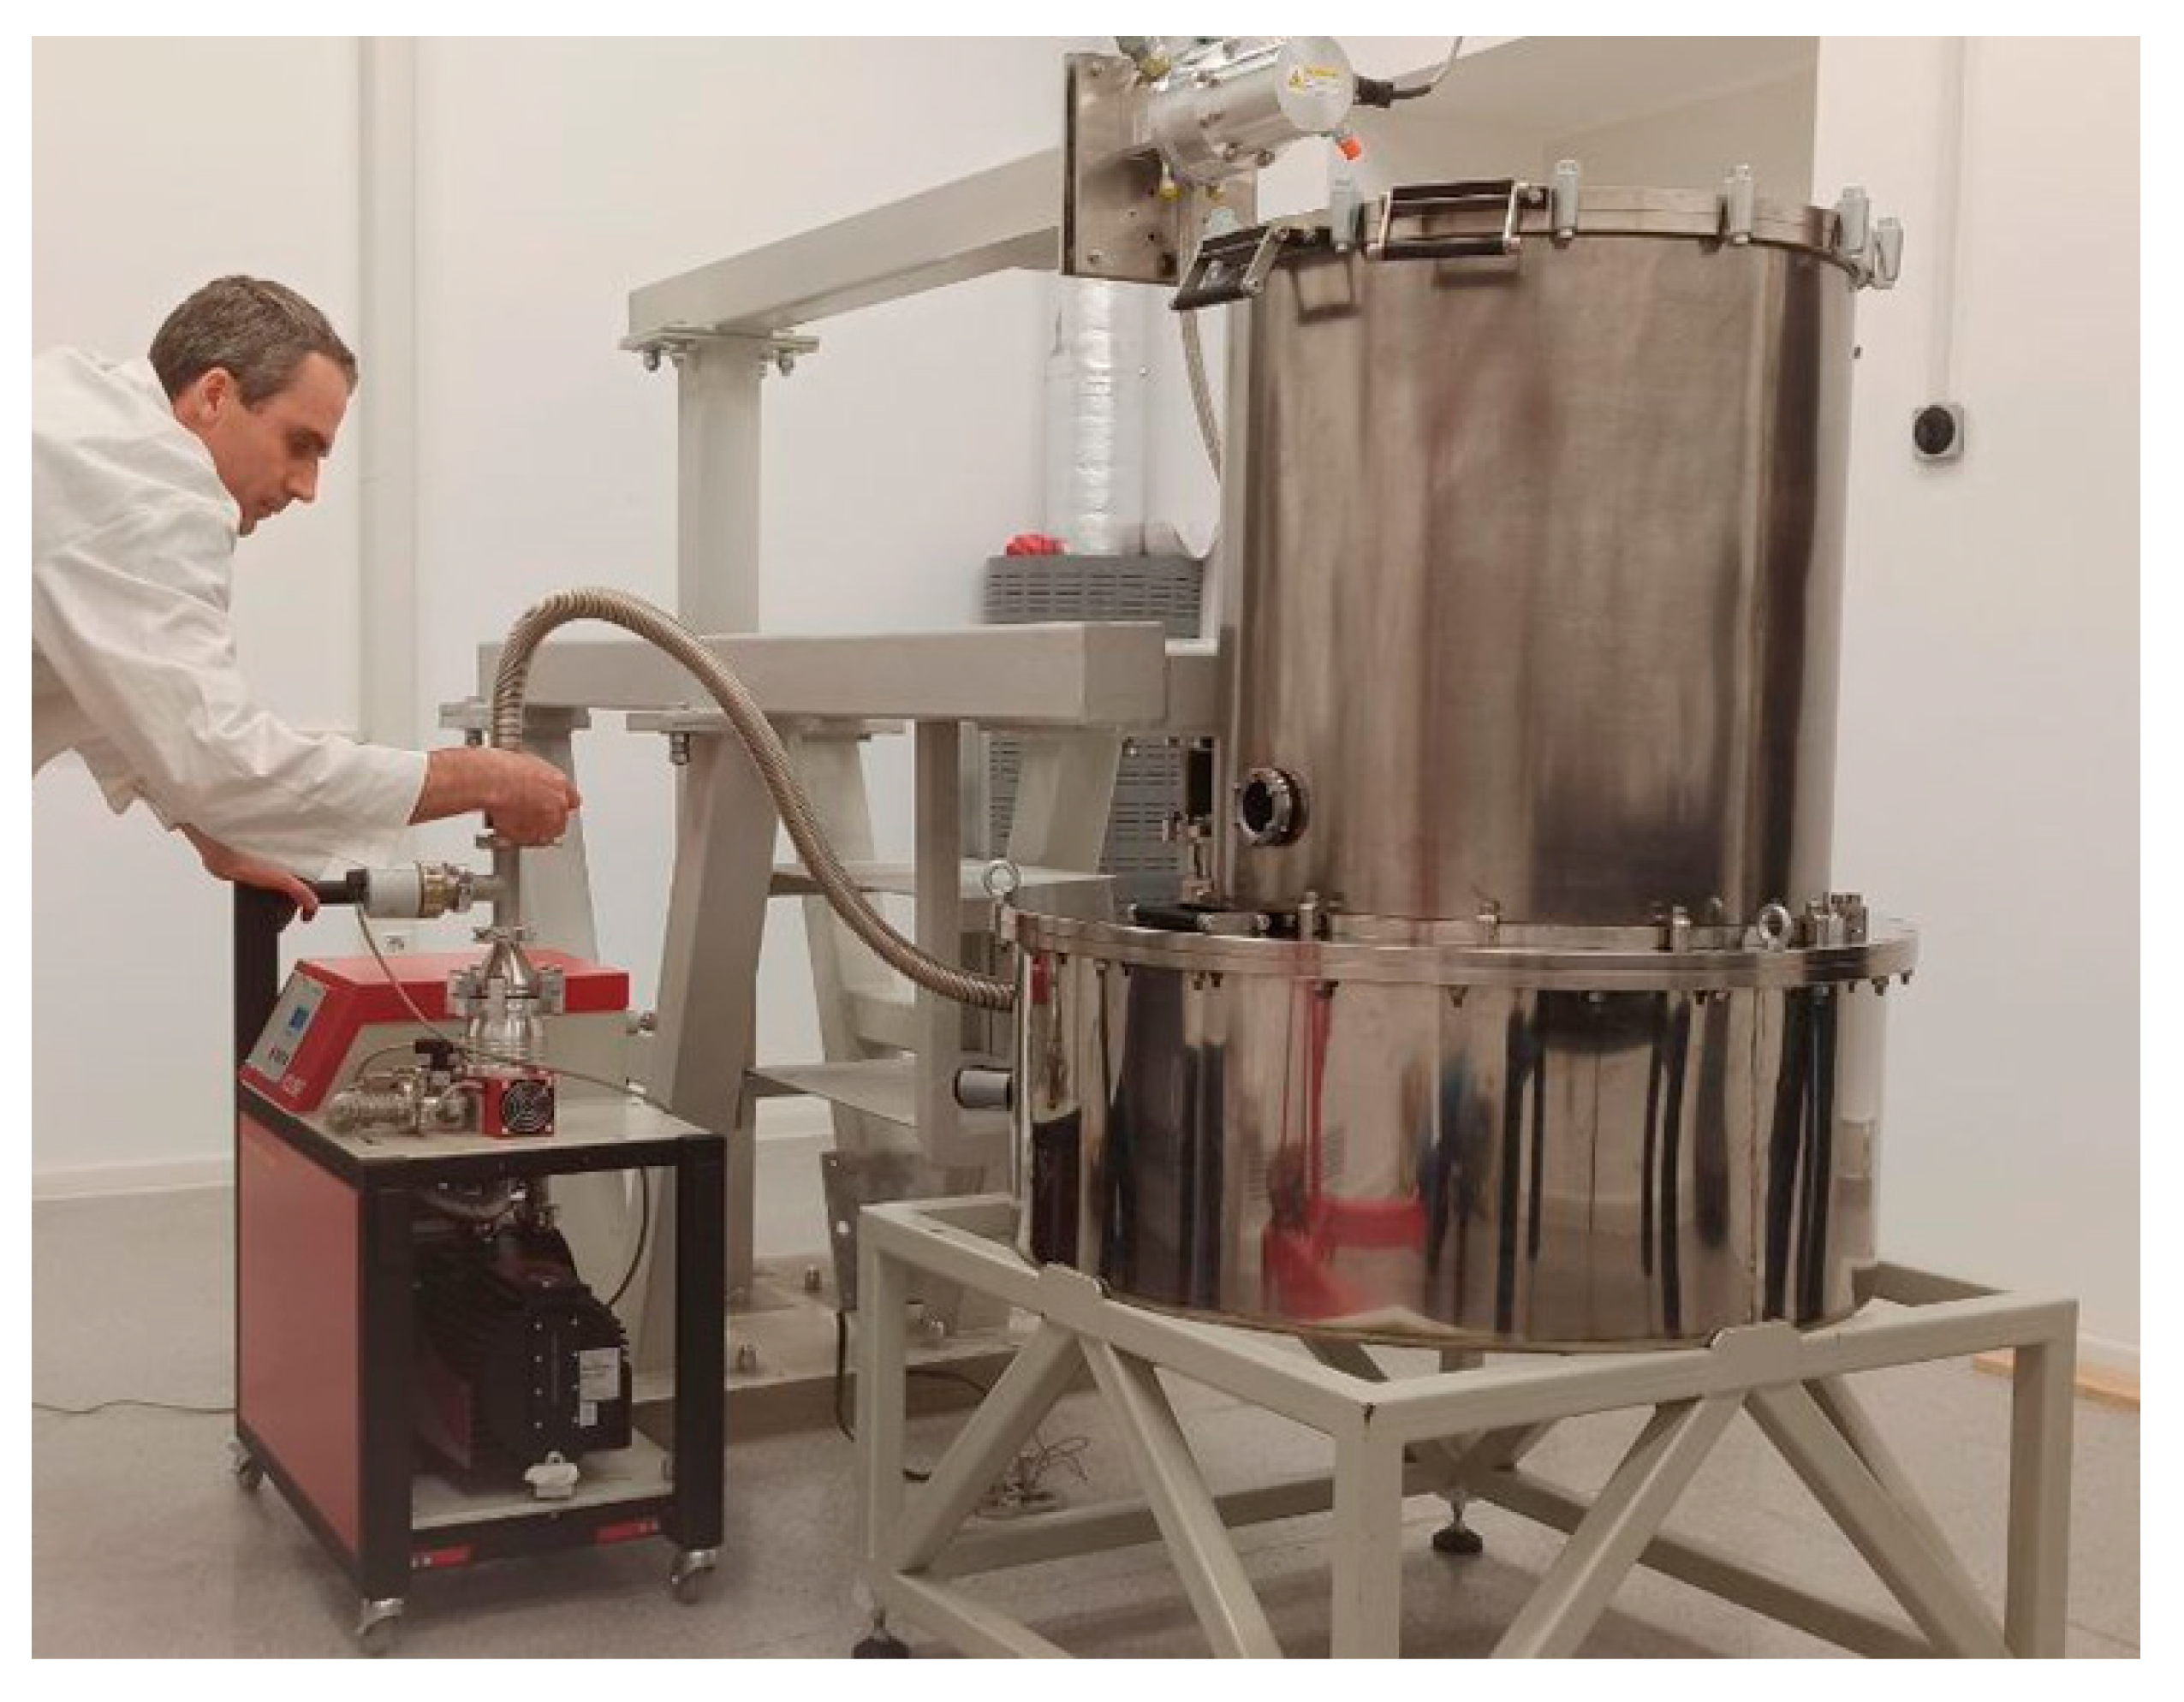
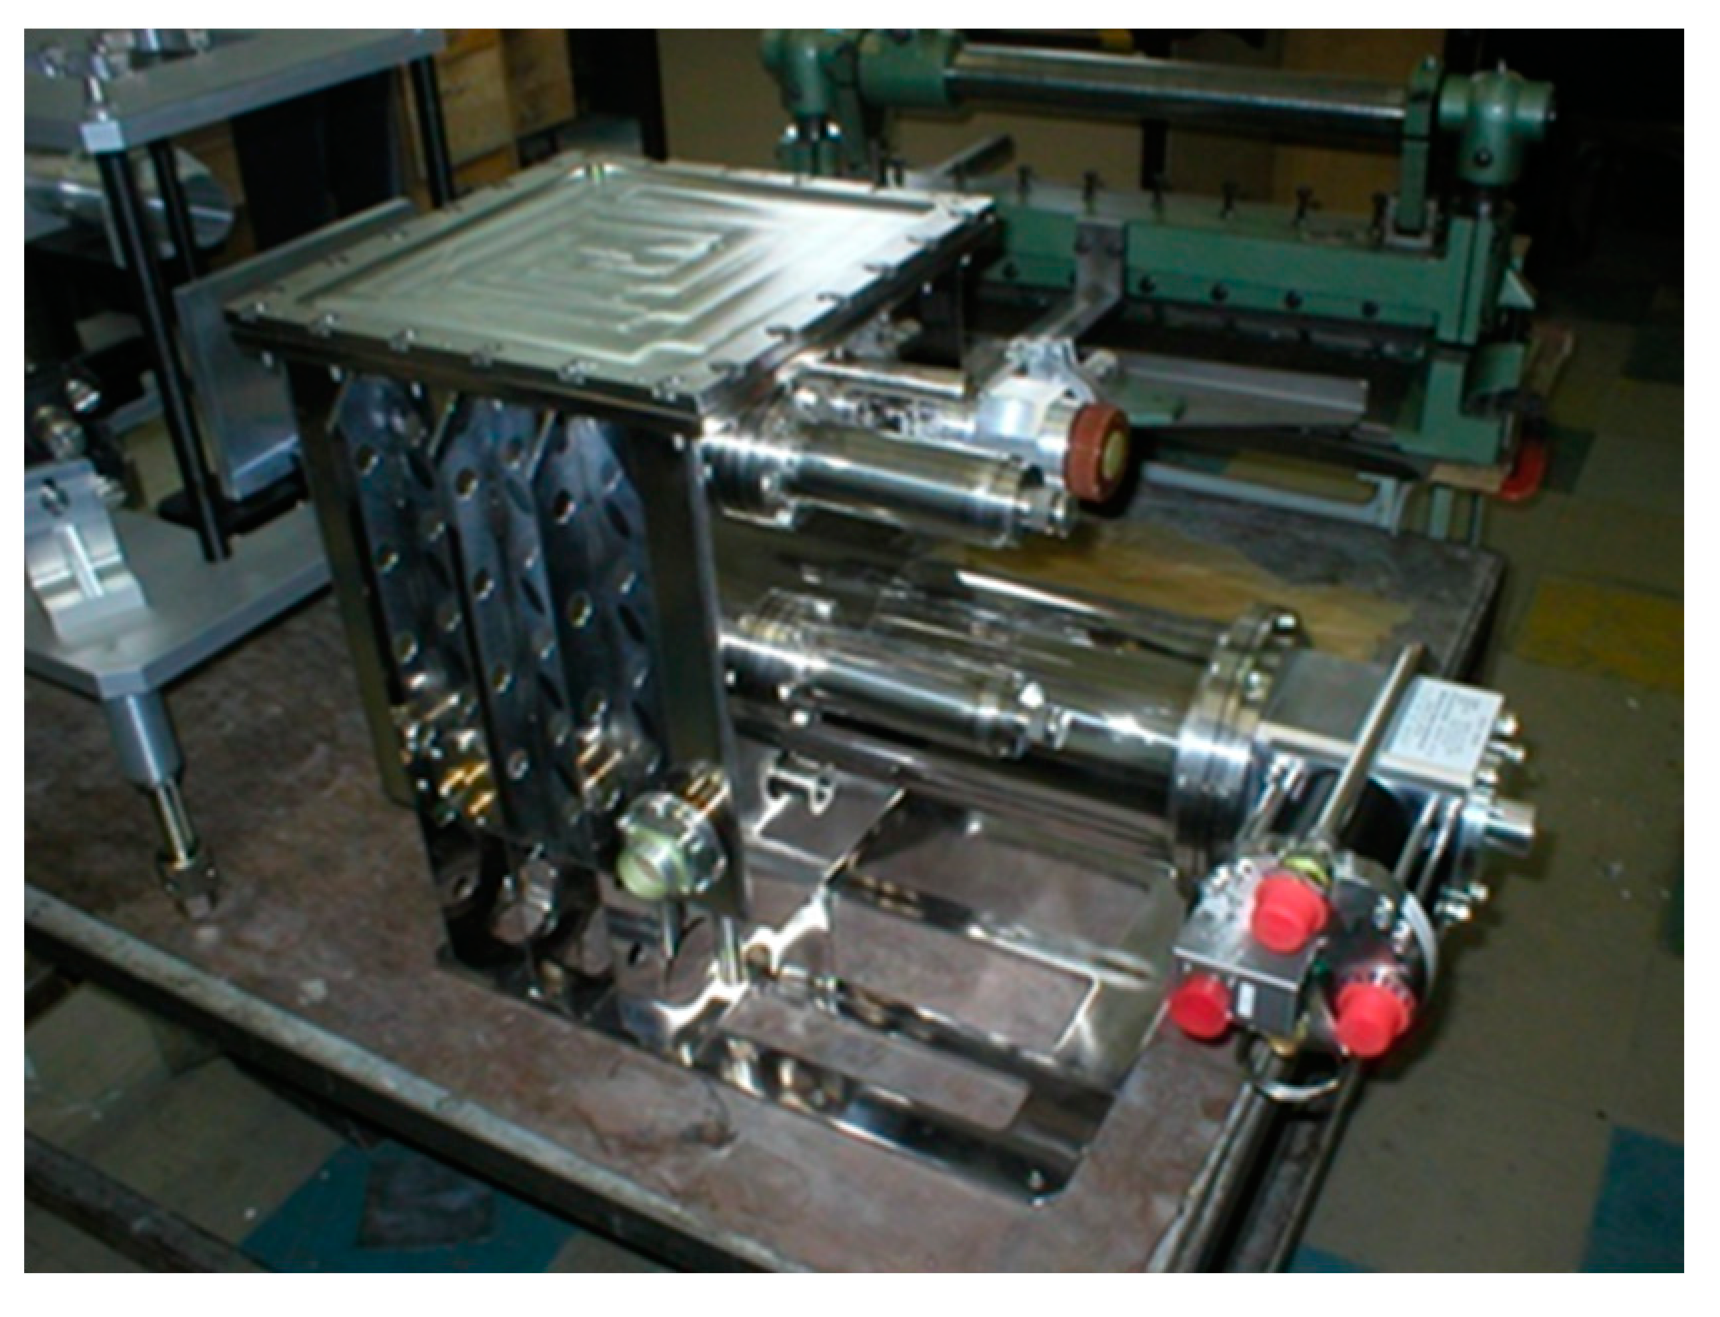
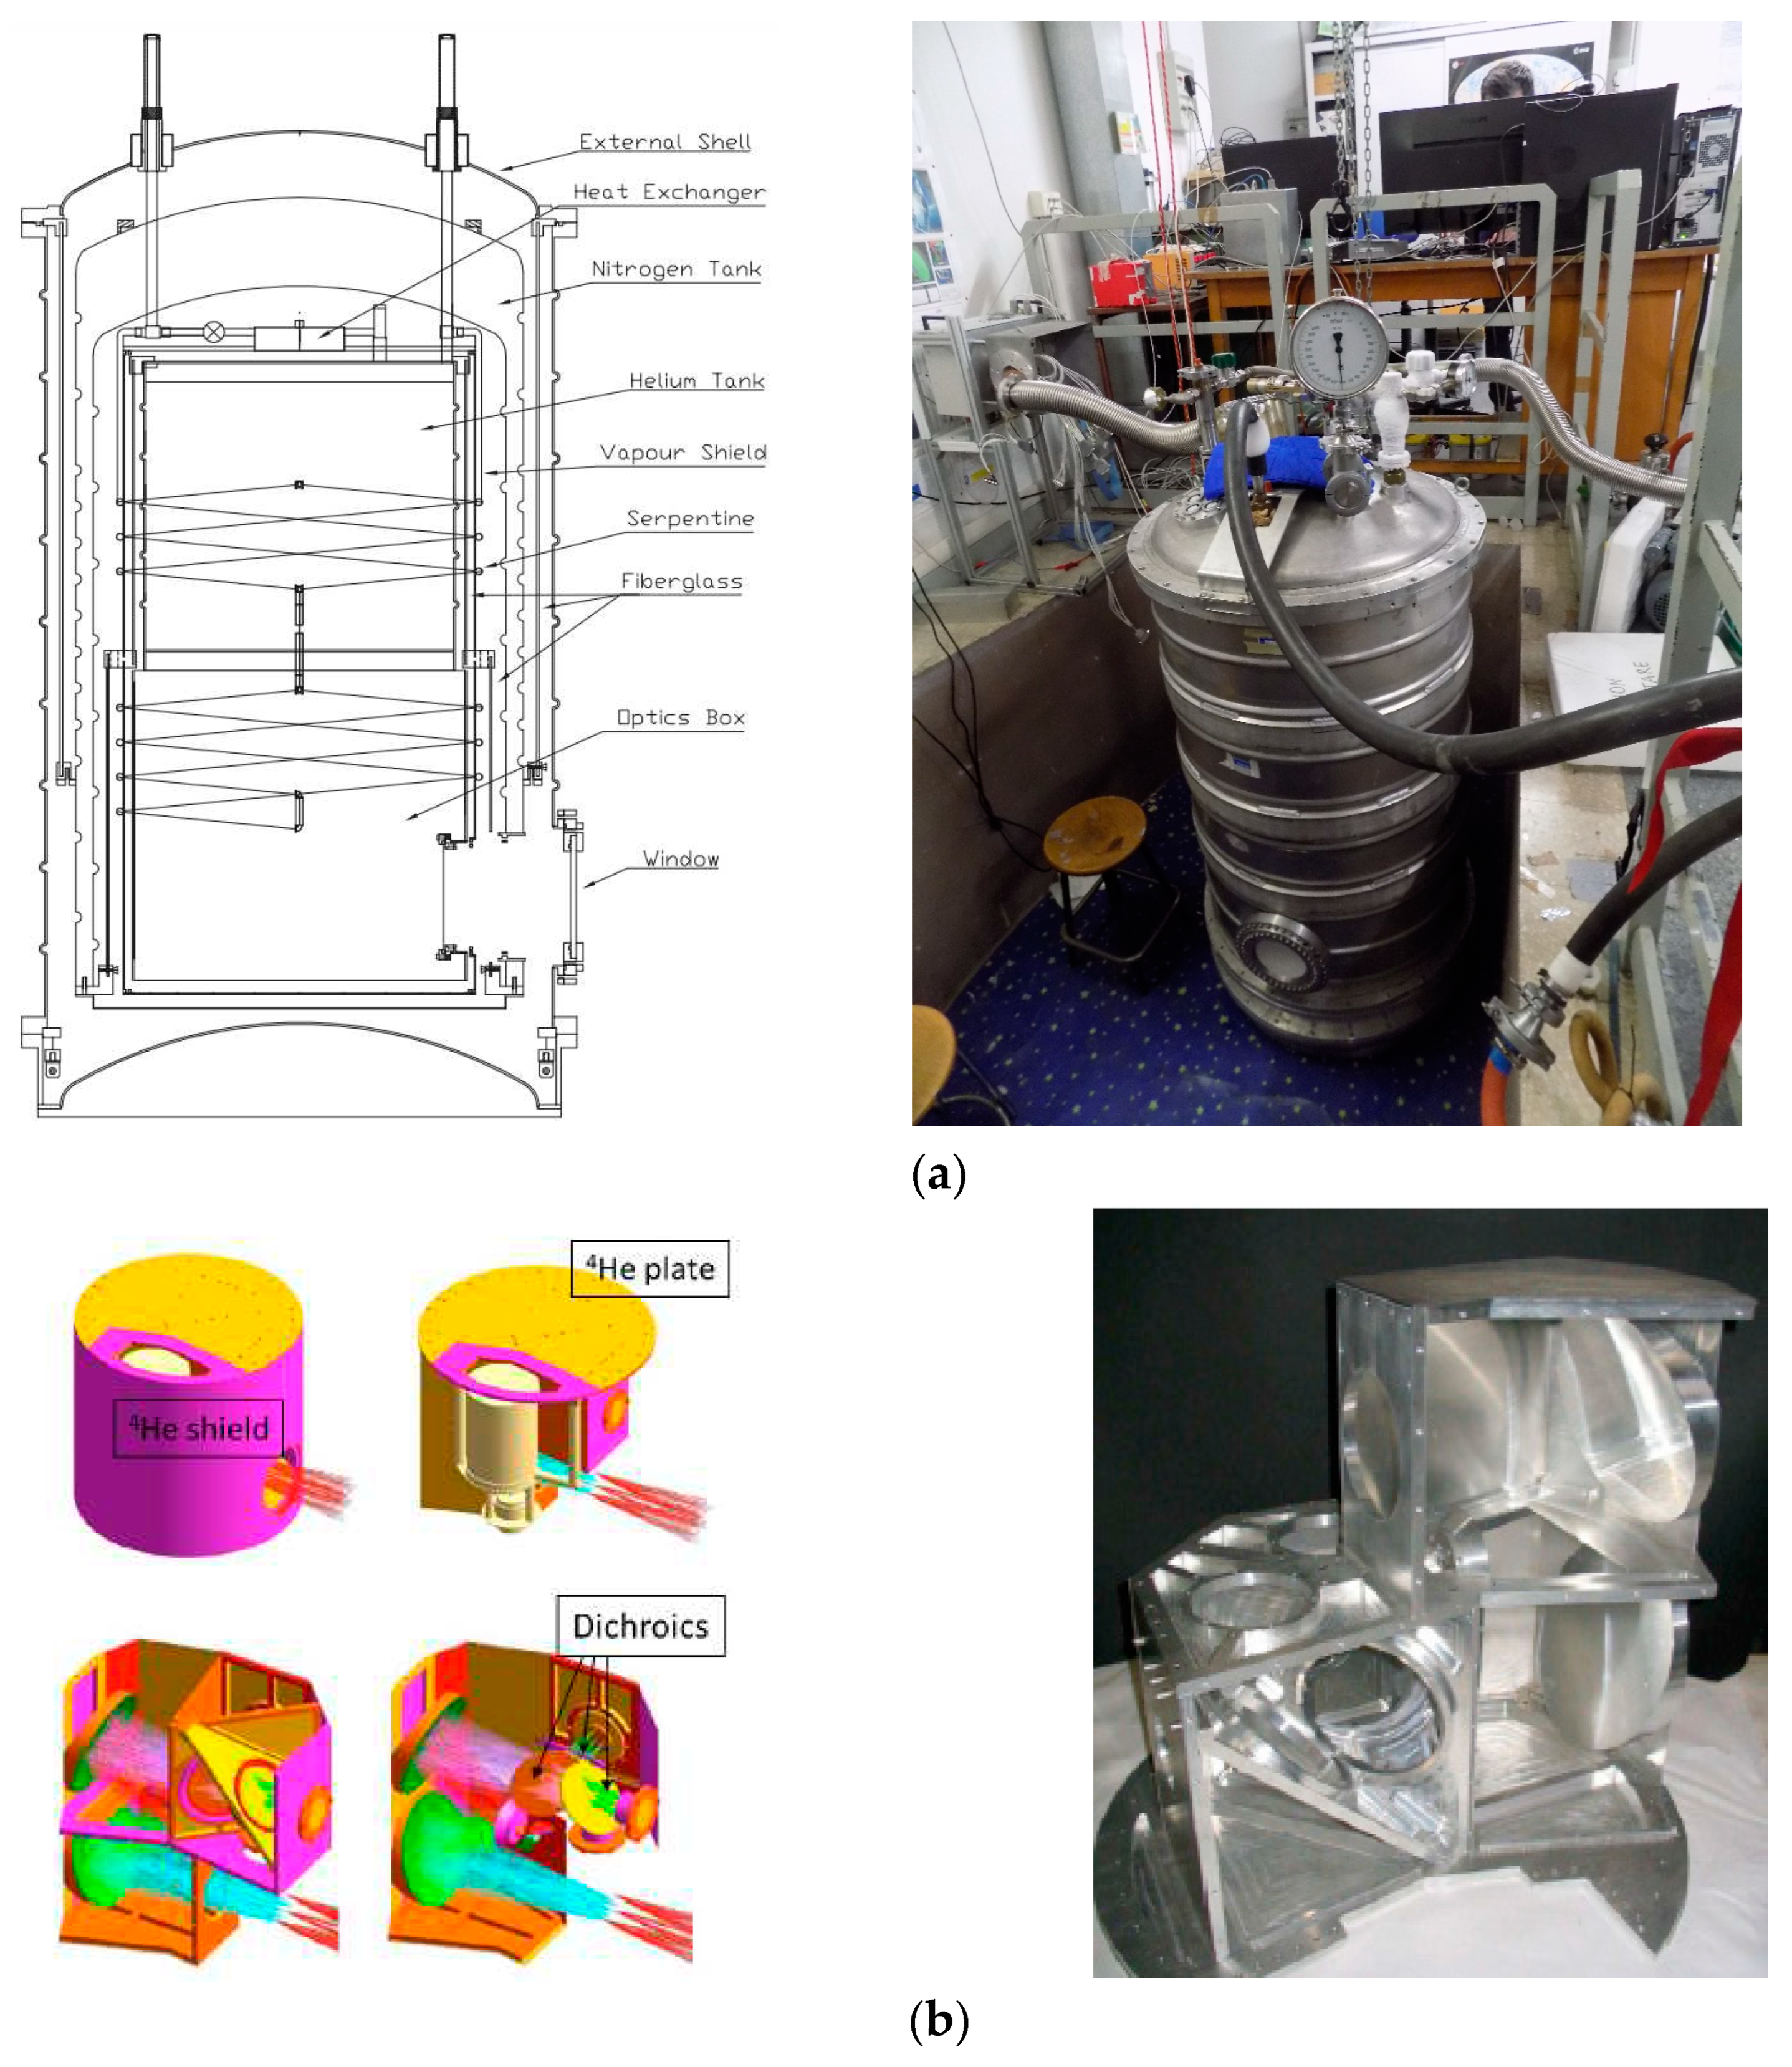
4.1.4. The low-vibration 4K cryostating system for studying thermal deformations of panels of the main mirror of the Millimetron space mission at cryogenic temperatures
- Operating temperature– 4К±0,5К;
- Residual pressure inside the cryostat – 10-5 mbar;
- The level of vibration displacements on a cold plate is no more than ±0,5 μm in frequency range up to 300 Гц;
- Vacuum inlets - 32 fiber optic, 2 KF25, KF16 and optical window;
- Overall dimensions: height – 1450 mm, diameter – 830 mm
4.1.5. Cryovacuum resonator complex
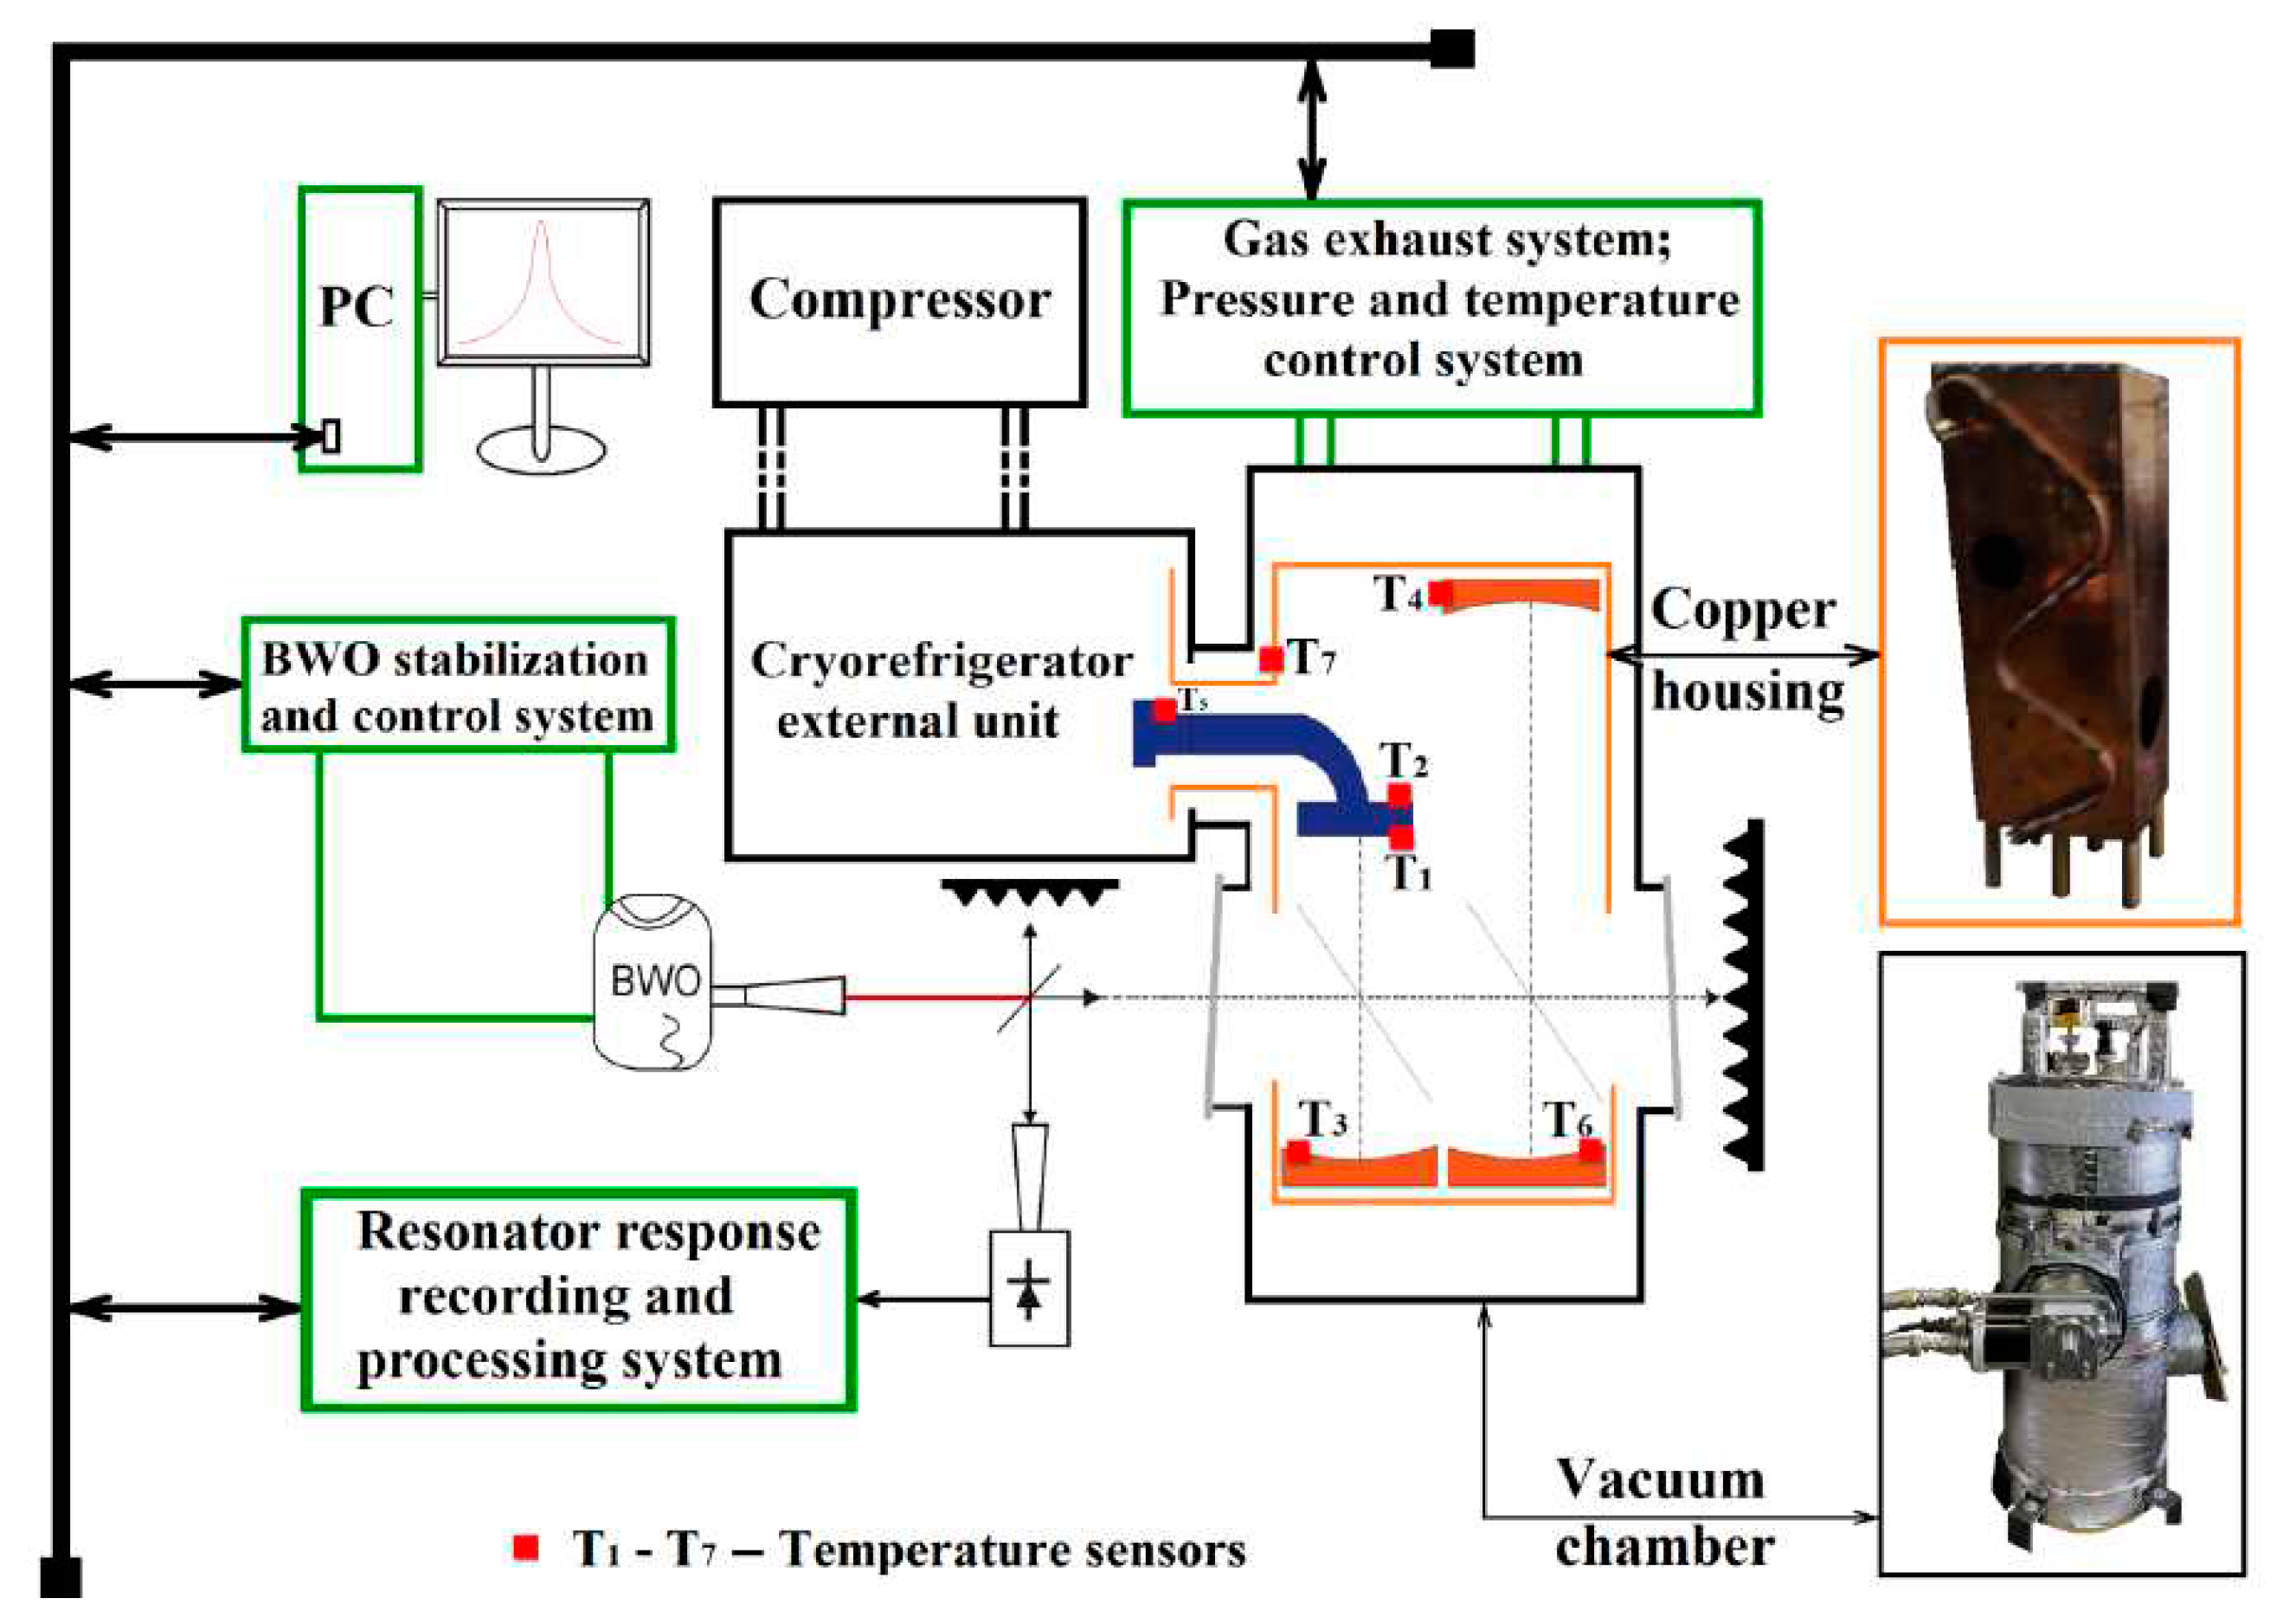
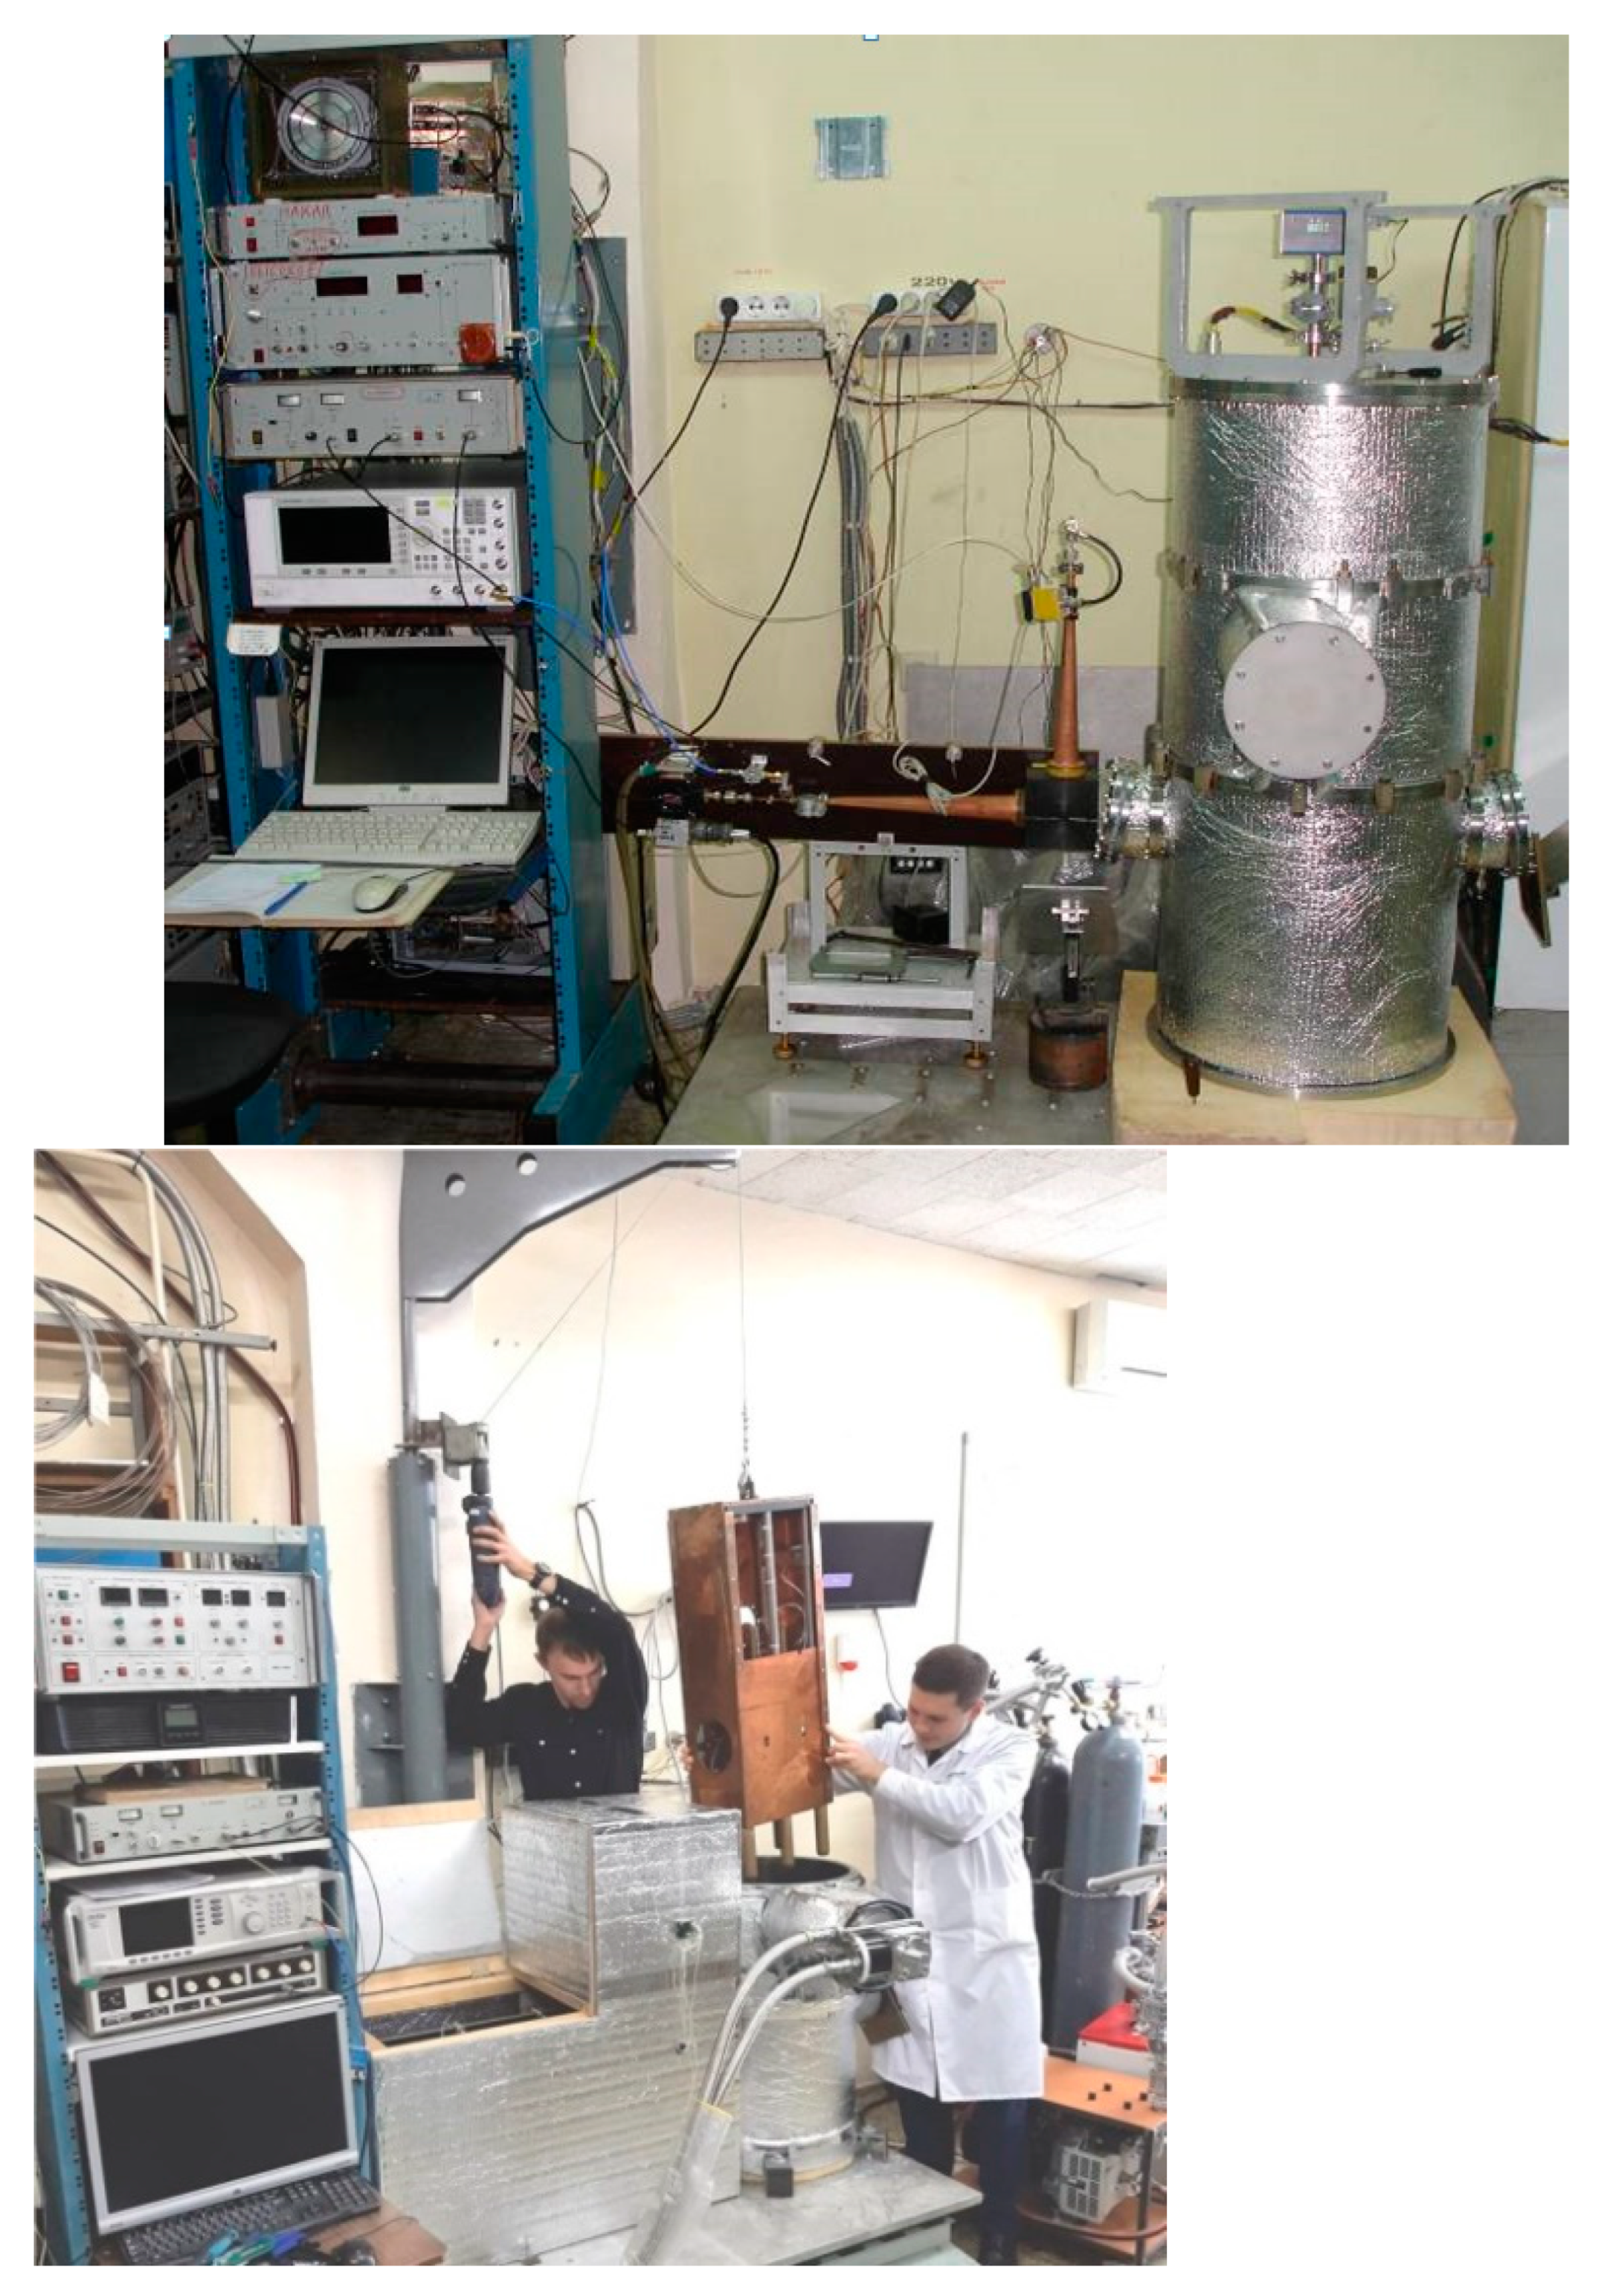
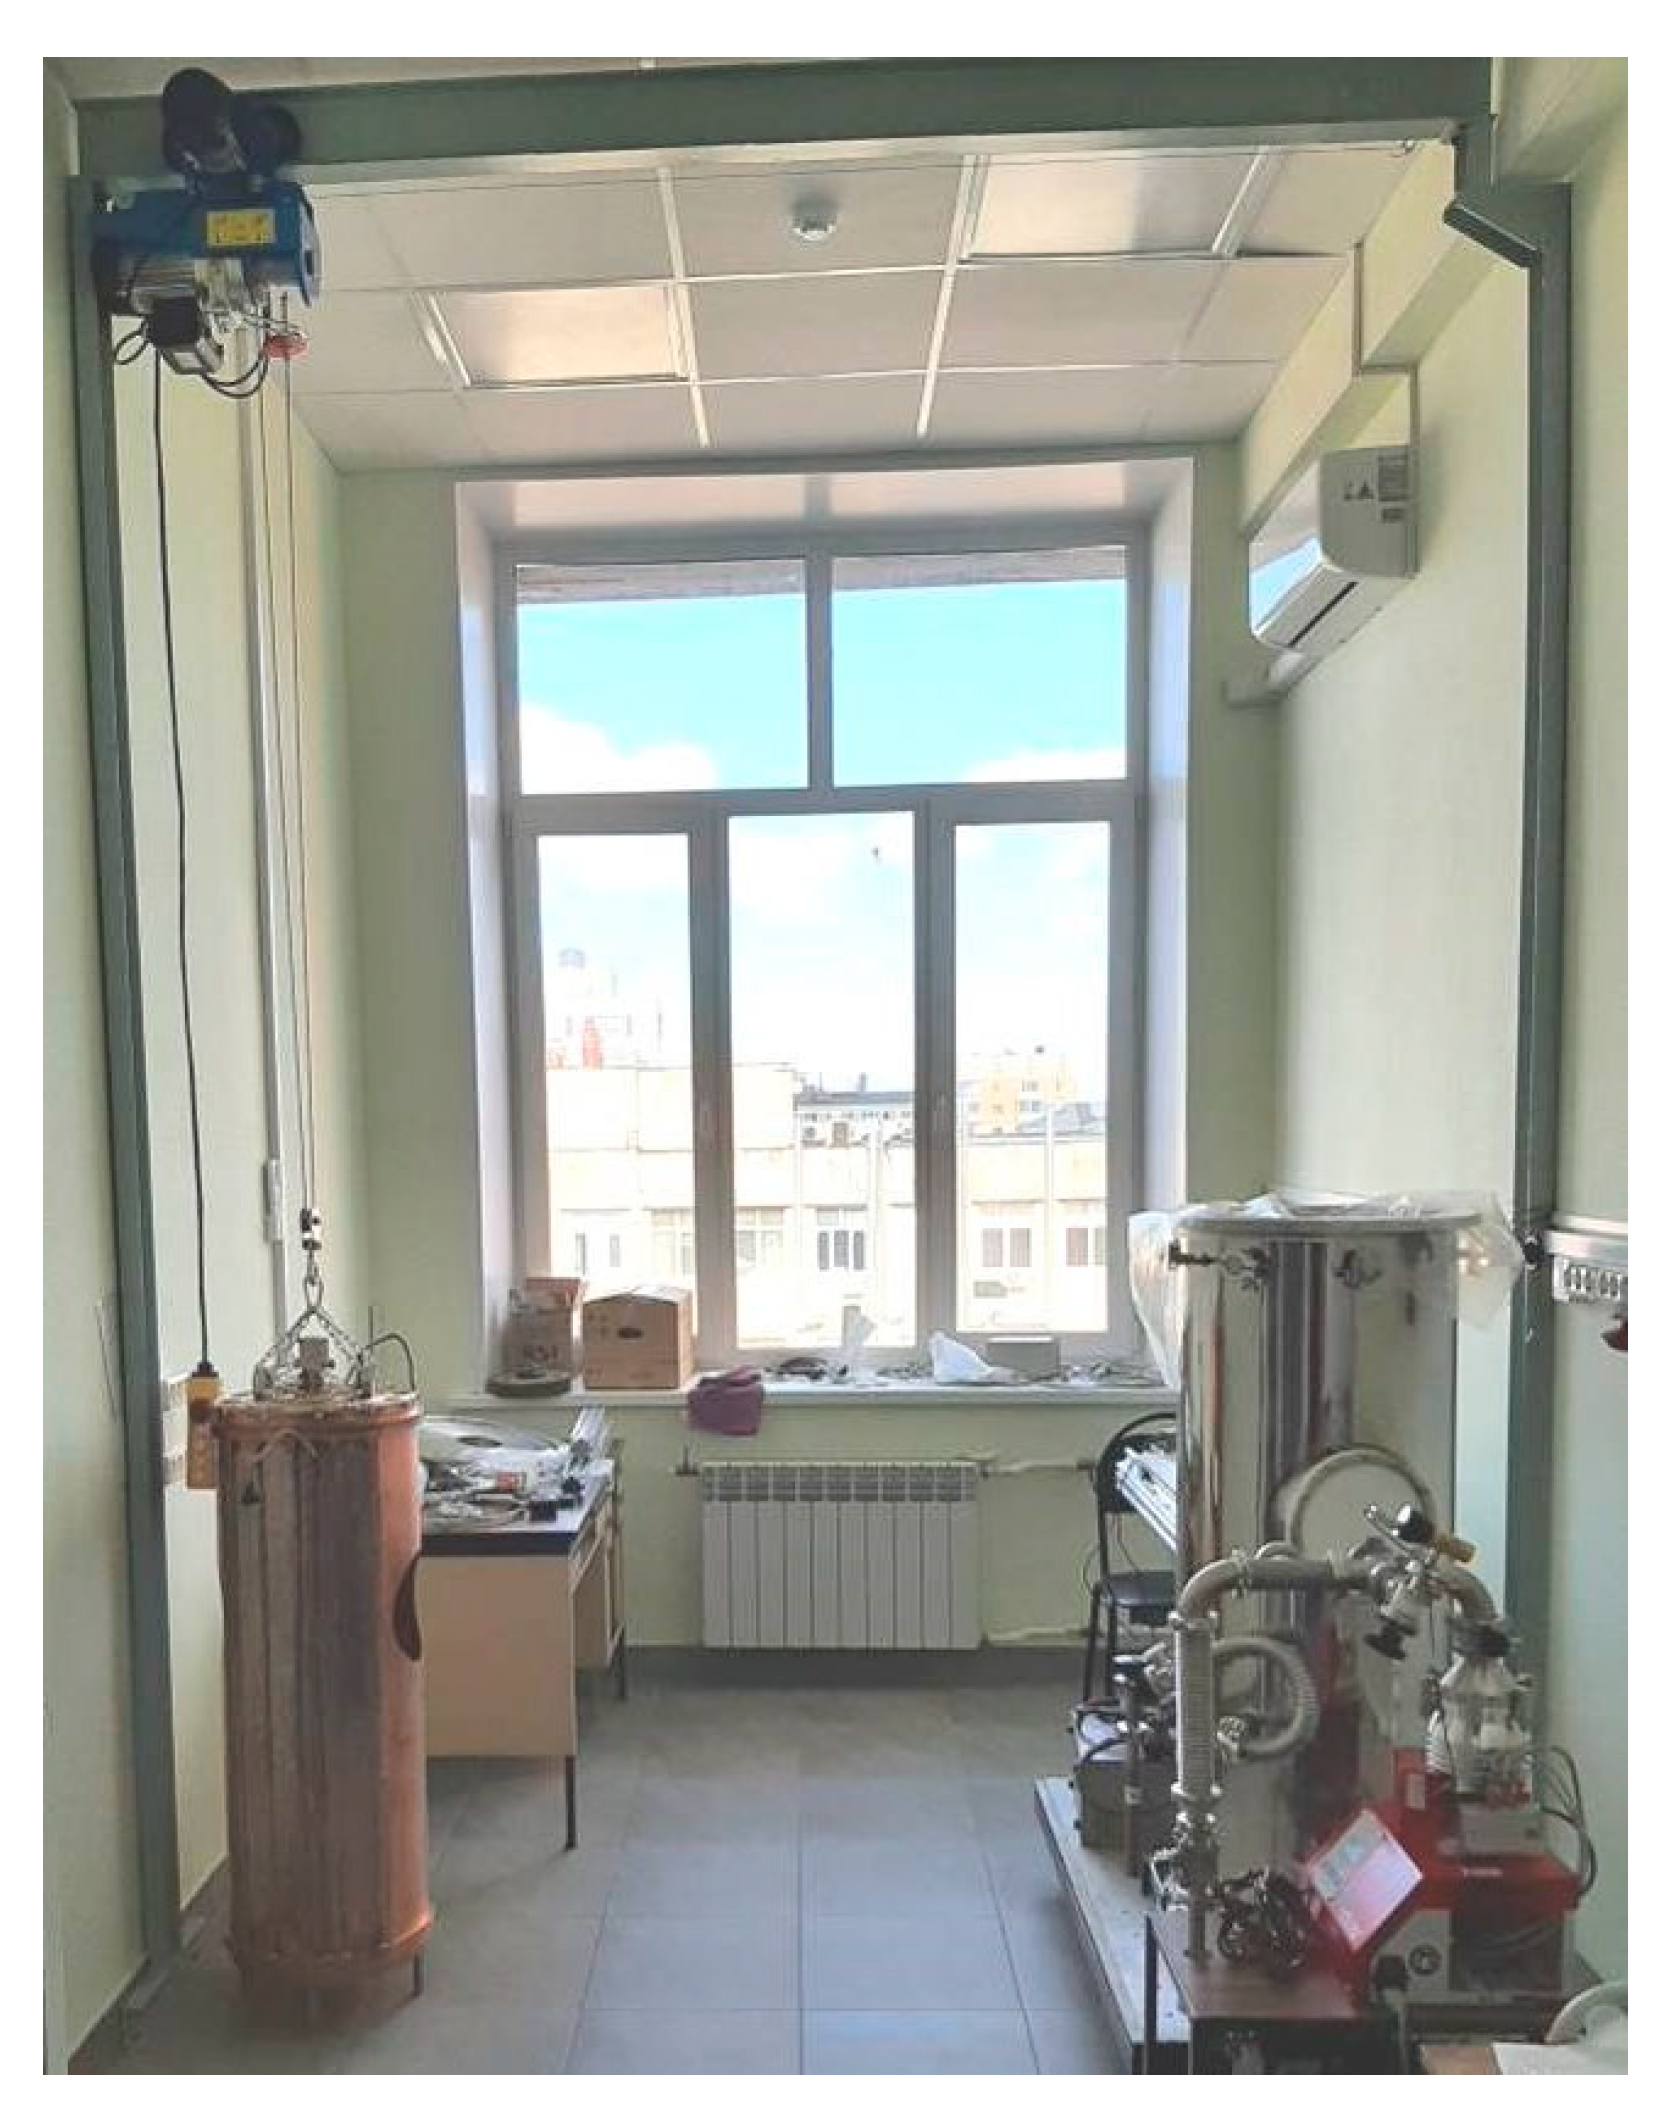
- Frequency range: 36 ÷ 520 GHz;
- Temperature range for gases: with the possibility of long–term stabilization at any temperature within 220 – 370 K, without temperature stabilization within 10 – 220 K; for dielectrics and metals : 4 K - 900 K;
- Gas pressure: 0 – 1500 Torr;
- Sensitivity to changes in absorption in gas: ~0.001 dB/km ( 4*10-9 cm-1);
- The range of measured values of the refractive index: 1 – 10 with a relative error up to 10-4;
- Measured thickness of dielectric plane-parallel plates: 0.002 – 30 mm with an accuracy of up to 10-4;
- Minimum diameter of the solid sample under study: ~ 12 mm (on 140 GHz);
- Range of measured values (tgδ): 10-2÷10-7 with a relative error of up to 5%;
- Range of measured values of reflection losses:
- 10-1÷10-4 with an average relative measurement error ~5% at the level of reflection losses ~10-3.
- Polyimide. Thickness 20 μm. 1 side Al thickness 80 nm;
- Polyimide. Thickness 20 μm. 2 side Al thickness 80 nm;
- Polyimide. Thickness 20 μm. 1 side Al thickness (А 999) thickness ~0.1 mkm with SiO2-x protection thickness ~30 nm. Back side–In2O3:SnO2 (95:5) thickness ~30 nm;
- Polyimide. Тhickness 20 μm. Nb thickness 50 nm;
- Glass plate 1.8 mm with Nb 50 nm;
- Jammed Polyimide №1.
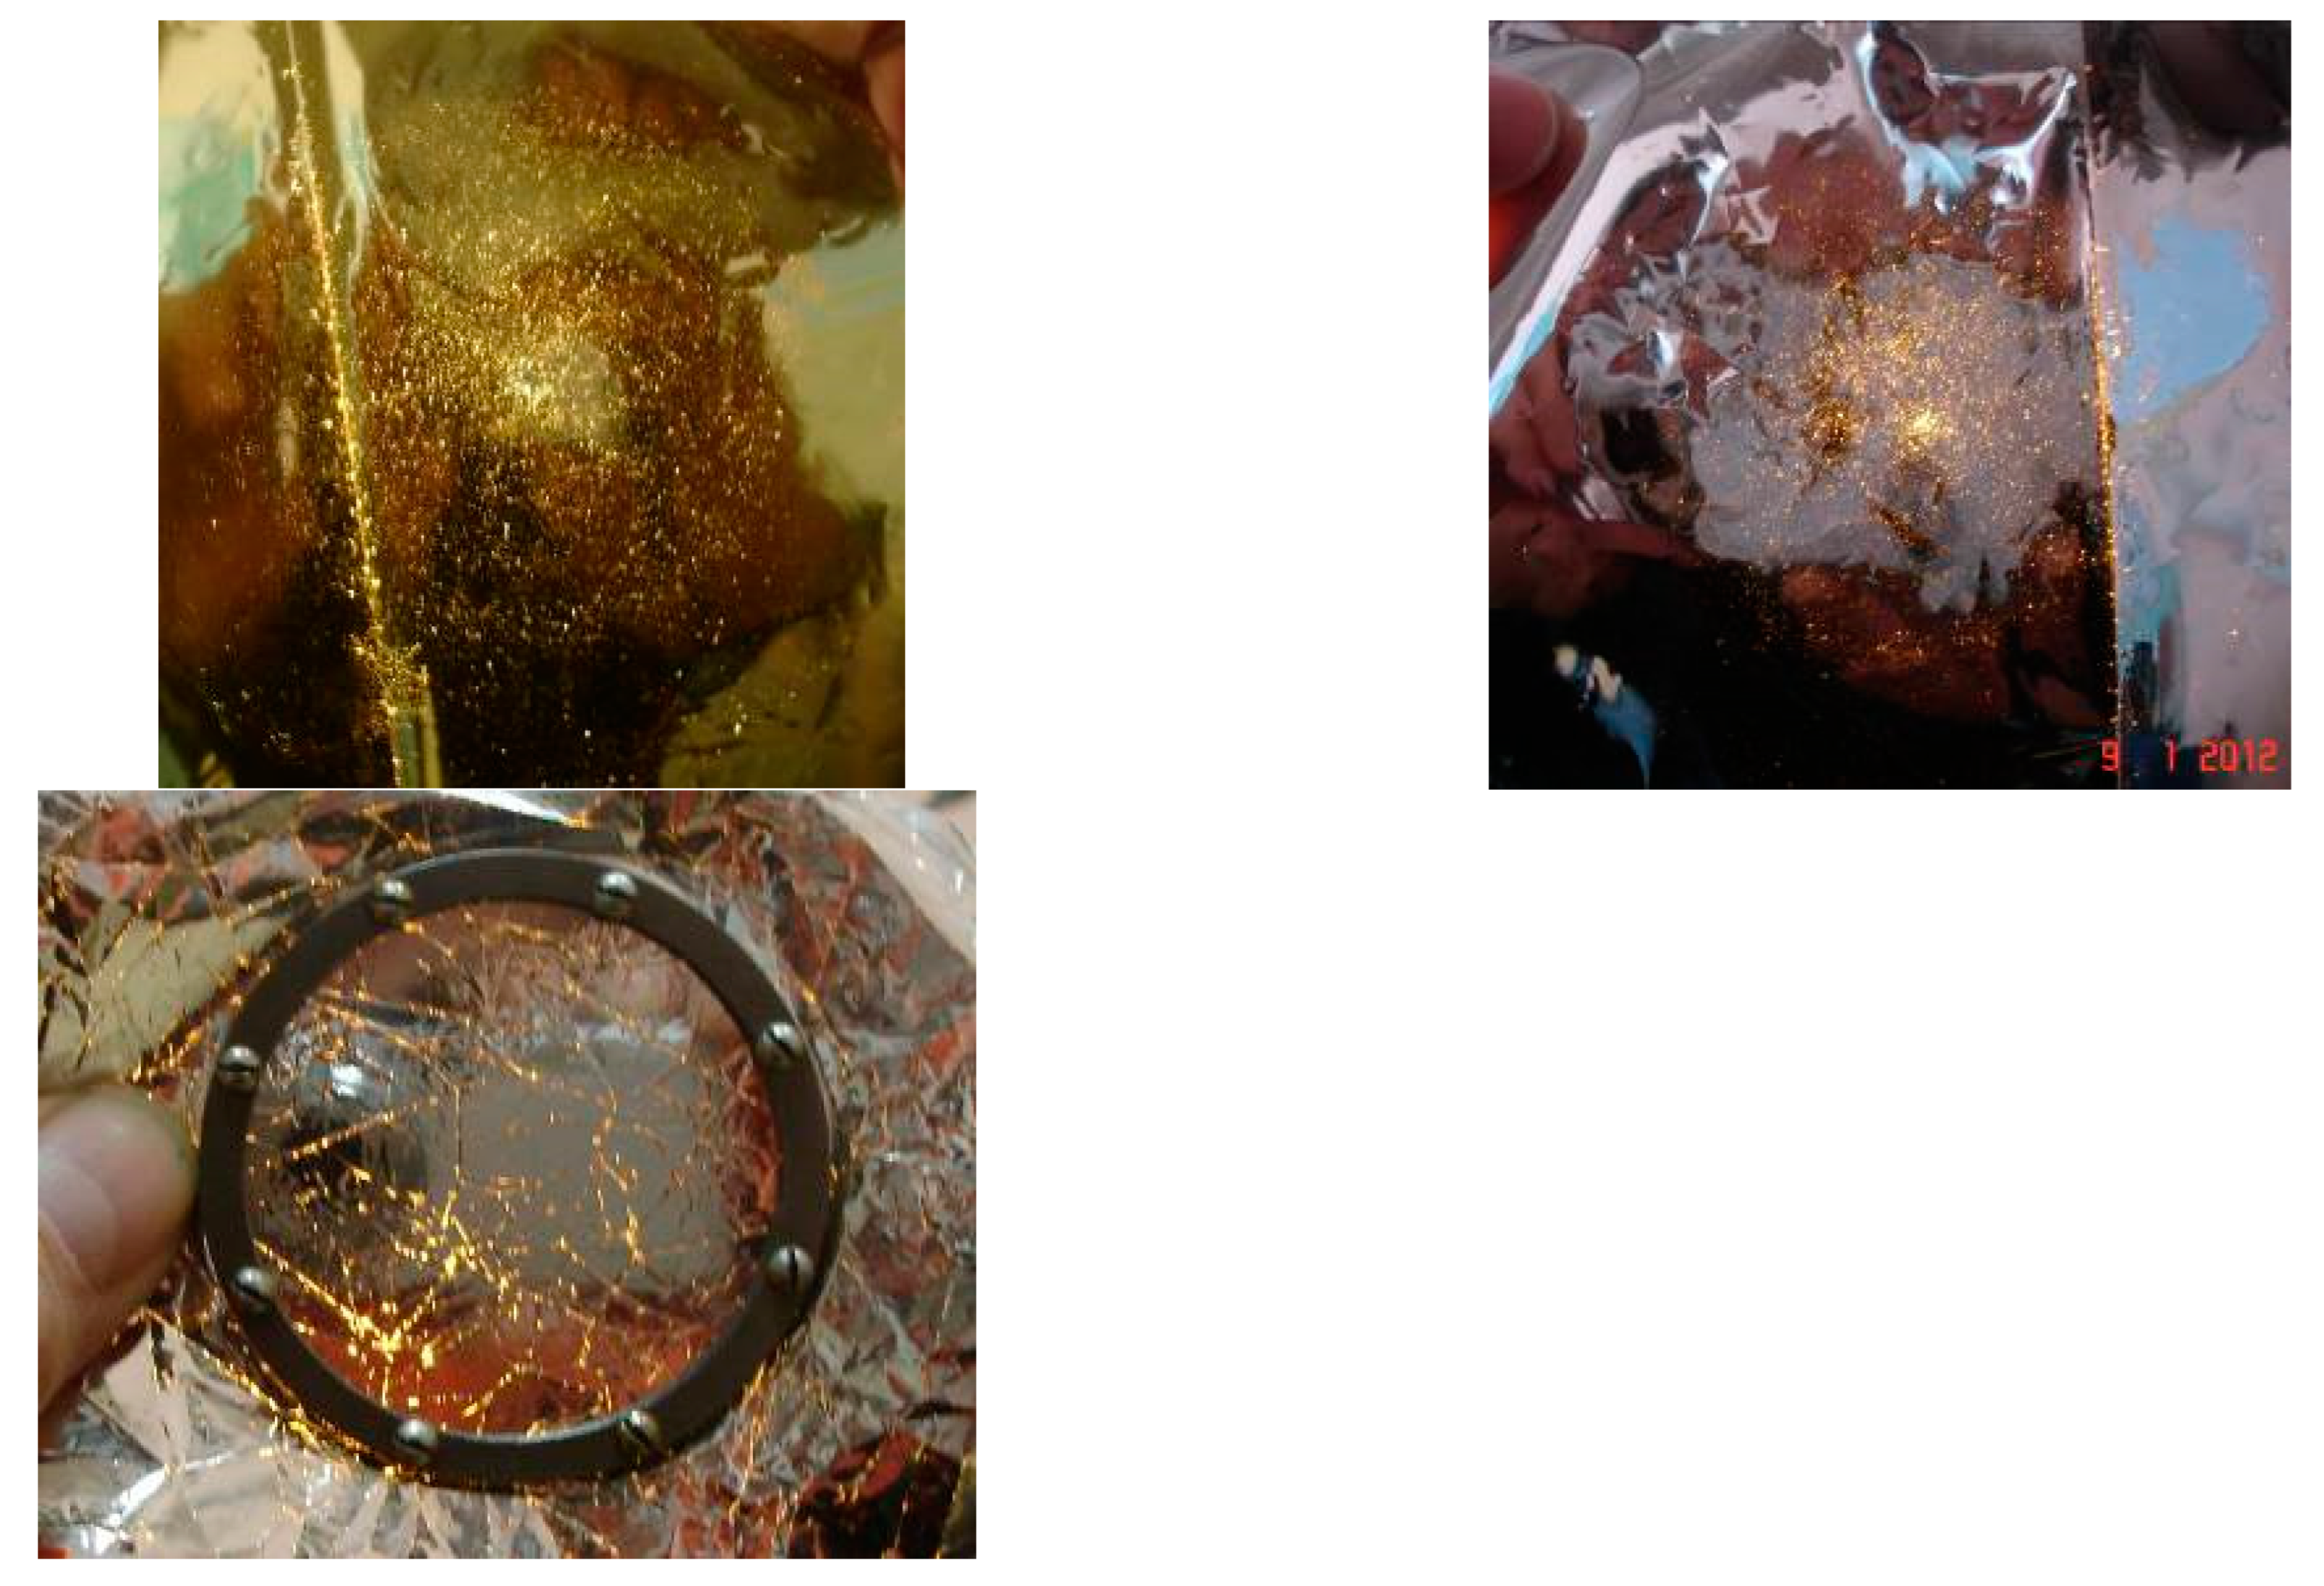
4.2. CCD matrix cooling systems
4.3. Components of cryogenic astronomical receivers that are outside the state of thermodynamic equilibrium
4.3.1. Physical temperature and noise of a sealed window

4.3.2. Dissipative transmission line at temperature drop
5. Conclusions
Author Contributions
Funding
Acknowledgments
Conflicts of Interest
References
- Ladu, A.; Schirru, L.; Gaudiomonte, F.; Marongiu, P.; Angius, G.; Perini, F.; Vargiu, G.P. Upgrading of the L-P Band Cryogenic Receiver of the Sardinia Radio Telescope: A Feasibility Study. Sensors 2022, 22, 4261. [CrossRef]
- Murzin, V.A.; Markelov, S.V.; Ardilanov, V.I.; et alAfanaseva, T.; Borisenko, A.; Ivashchenko, N.; Pritychenko, M.; Mitiani, G.; Vdovin, V. Astronomical CCD systems for the 6-meter telescop BTA (a review). Appl. Phys. 2016, 4, 500–506 [in Russian].
- Vdovin, V.F. Problems of cryogenic cooling of superconductor and semiconductor receivers in the range 0.1–1 THz. Radiophys. Quantum Electron. 2005, 48, 779–791. [CrossRef]
- Ulbricht, G; Lucia, M. De; Baldwin, E. Applications for Microwave Kinetic Induction Detectors in Advanced Instrumentation. Appl. Sci.. 2021, 11, 2671. [CrossRef]
- Alzhanov, B; Shafiee, M.; Kazykenov, Z.; Bekbolanova, M.; Smoot, G.; Grossan, B. The cryogenic detector for cosmology observation. IOP Conf. Ser.: Mater. Sci. Eng. 2019, 502, 012060. 27th International Cryogenics Engineering Conference and International Cryogenic Materials Conference 2018 (ICEC-ICMC 2018) 3–7 September 2018, Oxford, United Kingdom.
- Han, Y.; Zhang, A. Cryogenic technology for infrared detection in space. Scientific Reports. 2022, 12, 2349. [CrossRef]
- Benford, D.J.; Moseley, S.H. Cryogenic detectors for infrared astronomy: the Single Aperture Far-InfraRed (SAFIR) observatory. NASA / GSFC, Infrared Astrophysics, Code 685, Greenbelt, MD 20771, USA.. 2004.
- Archer, J.W. High-performance, 2.5-K cryostat incorporating a 100–120-GHz dual polarization receiver. Scientific Instruments 1985, 56, 449-458.
- Lang, A.; Bernardis, P.De; Petris, M. De; Masi, S.; Melchiorri, F.; Aquilini, E.; Martinis, L.; Scaramuzzi, F.; Melchiorri, B.; Boscaleri, A.; et.al. The BOOMERANG experiment. Space Science Reviews 1995, 74, 145-150. [CrossRef]
- Little, W. A. Microminiature refrigeration. Rev. Sci. Instrum. 1984, 55, 661-680. [CrossRef]
- Edelman, V.S. Near the Absolute Zero; Publisher: M.:Science, Moscow, Russia, 1983; 176 pages [in Russian].
- 12. Space Cryogenics Workshop, 2021.
- 13. Available online: https://www.sciencedirect.com/journal/cryogenics/special-issue/10KMQLLLNS1 (accessed on 24 November 2023).
- 14. Astronomical Journal Available online: https://journals.aas.org/astronomical-journal/ (accessed on 24 November 2023).
- Messenger, G.C. Cooling of Microwave Crystal Mixers and Antennas Trans. Microwave Theory Tech. 1957. 1957, 5, 62-63. [CrossRef]
- Advances in Cryogenic Engineering Proceedings of the 1959 Cryogenic Engineering Conference University of California, Berkeley, California, USA, Editor: Timmerhaus, K.D., September 2–4, 1959.
- White, G.K. Experimental techniques in low-temperature physics, 3rd ed.; Publisher: Clarendon Press Oxford, England, 1979; pages 331.
- Barron, R.F. Cryogenic systems, 2rd ed.; Publisher: Oxford University Press, Clarendon Press. Oxford, England, 1985; pages 507.
- Köhler, J.W.L.; Jonkers, C.O. Fundamentals of the gas refrigeration machine. Philips Tech. Rev. 1954, 16, 69-78.
- Little, W.A. Microminiature refrigeration. Rev. Sci. Instrum. 1984, 5, 661-680. [CrossRef]
- 33 International Symposium on Space Terahertz Technology (coming) https://web.cvent.com/event/ed54f48e-ce7d-4361-8d7f-7c2e997215a6/summary (accessed on 24 November 2023).
- 32 International Symposium on Space Terahertz Technology (the last) https://www.showsbee.com/fairs/IEEE-ISSTT.html (accessed on 24 November 2023).
- 30th Space Cryogenics Workshop https://spacecryogenicsworkshop.org (accessed on 24 November 2023).
- Cryogenic materials. Handbook of Brookhaven National Laboratory, New York 11973, November 11 1966.
- Malkov, M.P.; Danilov, I.B.; Zeldovich, A.G.; Fradkov, A.B. Handbook on the Physical and Technical Foundations of Cryogenics, 3rd ed.; Energoatomizdat: Moscow, Russia, 1985; p. 432.
- Martiyanov, K.; Makhalov, V.; Turlapov, A. Observation of a Two-Dimensional Fermi Gas of Atoms. Phys. Rev. Lett. 2010, 105, 030404. [CrossRef]
- Masuda, T.; Hiramoto, A.; Ang, D.G.; Meisenhelder, C.; Panda, C.D.; Sasao, N.; Uetake, S.; DeMille, D.P., Doyle, J.M.; Gabrielse, G.; Yoshimura, K. High-sensitivity low-noise photodetector using a large-area silicon photomultiplier. Opt. Express. 2023, 31, 1943-1957. [CrossRef]
- Tan, G.H. Atacama Large Millimeter Array. Proc. of 3-rd ESA Workshop on Millimeter Wave Technology and Applications: circuit, systems, and measurement technique. 2003, p. 107.
- Vdovin,V.F.; Grachev, V.G.; Dryagin, S.Yu.; Eliseev, A.I.; Kamaletdinov, R.K.; Korotaev, D.V.; Lesnov, I.V.; Mansfeld, M.A., Pevzner, E.L.; Perminov, V.G.; Pilipenko, A.M.; Sapozhnikov, B.D.; Saurin, V.P.. Cryogenically cooled low-noise amplifier for radio-astronomical observations and centimeter-wave deep-space communications systems. Astrophysical Bulletin. 2016, 71, 134-138. [CrossRef]
- Raisanen A. V. Experimental studies cooled millimeter wave mixers // Acta Polytechnica Scandinavica, Electr. engine, ser. 1980. № 46 / Helsinki University of technology, Finland.
- Weiner, S.; Pospieszalsky, M.R.; Norrod, R. Cryojenic HEMT low-noise receiver for 1.3 - 43 GHz. IEEE Trans. Microwave Theory Tech.. 1987, MTT-35, 1067-1069.
- Zimmuidzinas, J.; Richards, P.I. Superconducting Detectors and Mixers for Millimeter and Submillimeter Proc. of the IEEE. 2004, 92, 1597-2006. [CrossRef]
- Rudakov, K.I; Khudchenko, A.V.; Richards, P.I.; Filippenko, L.V.; Paramonov, M.E.; Hesper, R; Ronsó da Costa Lima, D.D.; Baryshev, A.M.; Koshelets, V.P. THz Range Low-Noise SIS Receivers for Space and Ground-Based Radio Astronomy. Appl. Sci. 2021, 11, 10087. [CrossRef]
- Cryogenic Technologies for the Stratospheric Observatory for Infrared Astronomy (SOFIA) Science Instruments https://ntrs.nasa.gov/api/citations/20205008777/downloads/20205008777.pdf (accessed on 24 November 2023).
- Balega, Y.; Bolshakov, O.; Chernikov, A.; Edelman, V.; Eliseev, A.; Emelyanov, E; Gunbina, A.; Krasilnikov, A.; Lesnov, I.; Mansfeld, M.; et.al. Cryogenic Systems for Astronomical Research in the Special Astrophysical Observatory of the Russian Academy of Science. Photonics. 2023, 10, 1263. [CrossRef]
- About ALMA, at first glance https://www.almaobservatory.org/en/about-alma/ (accessed on 24 November 2023).
- May, A.J. Sub-Kelvin Cryogenics for Experimental Cosmology. Proceedings of the 28th International Cryogenic Engineering Conference and International Cryogenic Materials Conference 2022. ICEC28-ICMC 2022. 2022, 70, 240-248.
- Vystavkin, A.N.; Shitov, S.V.; Bankov, S.E.; Kovalenko, A.G.; Pestriakov, A.V.; Cohn, I.A.; Uvarov, A.V.; Vdovin, V.F.; Perminov, V.G.; Trofimov, V.N.; et al. High sensitive 0.13–0.38 THz TES array radiometer for the big telescope azimuthal of Special Astrophysical Observatory of Russian Academy of Sciences. In Proceedings of the 2007 Joint 32nd International Conference on Infrared and Millimeter Waves and the 15th International Conference on Terahertz Electronics, Cardiff, UK, 2–9 September 2007.
- Chernikov, A.N.; Trofimov, V.N. Helium-3 adsorption refrigerator cooled with a closed-cycle cryocooler. J. Surf. Investigation. X-Ray Synchrotron Neutron Tech. 2014, 8, 956–960. [CrossRef]
- Camus, Ph.; Vermeulen, G.; Volpe, A.; Triqueneaux, S.; Benoit, A.; Butterworth, J.; d’Escrivan, S.; Tirolien, Th.. Status of the Closed-Cycle Dilution Refrigerator Development for Space Astrophysics. Journal of Low Temperature Physics. 2013, 176, 5-6. [CrossRef]
- Frossati, G.;. Experimental techniques: Methods for cooling below 300 mK. Journal of Low Temperature Physics. 1992, 87, 595-663. [CrossRef]
- Benoit, A.; Pujol, S. A dilution refrigerator insensitive to gravity. Phys. B Condens. Matter 1991, 169, 457–458. [CrossRef]
- Benoit, A.; Caussignac, M.; Pujol, S. New types of dilution refrigerator and space applications. Phys. B 1994, 197, 48-53. [CrossRef]
- Sirbi, A.; Pouilloux, B.; Benoit, A.; Lamarre, J.-M. Influence of the astrophysical requirements on dilution refrigerator design. Cryogenics 1999, 39, 665–669. [CrossRef]
- Volpe, A. Development of a closed cycle dilution refrigerator for astrophysical experiments in space. Universite de Grenoble, 2014.
- Chaudhry, G.; Volpe, A.; Camus, Ph.; Triqueneaux, S.; Vermeulen, G.;-M. A closed-cycle dilution refrigerator for space applications. Cryogenics 2012, 52, 471-477. [CrossRef]
- Haziot A, Vermeulen G. A new type of mixing chamber for a zero gravity dilution refrigerator. Hartford, US: CEC-ICMC и 2019.
- Oxford Instruments Group/ Cryojenics https://nanoscience.oxinst.com/cryogenics (accessed on 24 November 2023).
- Blueforce https://bluefors.com (accessed on 24 November 2023).
- Masi., S.; de Bernardis, P.; et.al. The BOOMERanG experiment and the curvature of the universe. Progress in Particle and Nuclear Physics 2002, 48, 243-261. [CrossRef]
- Nati, F.; Ade, P.; et.al. The OLIMPO experiment. New Astronomy Reviews 2007, 51, 385-389. [CrossRef]
- Masi., S.; de Bernardis, P.; et.al. Kinetic Inductance Detectors for the OLIMPO experiment: in-flight operation and performance. Journal of Cosmology and Astroparticle Physics 2019, 2019. [CrossRef]
- Nati, L.; Calvo, de Bernardis, P.; Fiadino, P.; Lamagna, L.; Masi, S.; Piacentini, R.; Rispoli, R.. Cryogenic systems for Long Duration Balloon experiments. Memorie della Societa Astronomica Italiana 2008, 79, 878-882.
- Cold Facts issued by the Cryogenic Society of America, Inc.
- https://www.cryogenicsociety.org/cold-facts#:~:text=Cold%20Facts%2C%20an%20internationally%20recognized,%20every%20member%20of%20the%20CSA. (accessed on 24 November 2023).
- Yusov, A.V.; Kozlov, S.A.; Ustinova, E.A.; et.al.. Testing high-precision electromechanical actuators used for adjustment of deployable antennas of astronomy space missions. Cryogenics 2021, 118, 103346. [CrossRef]
- Parshin, V.V.; Serov, E.A.; Bubnov, G.M.; Vdovin, V.F.; Koshelev, M.A.; Tretyakov, M.Yu. CRYOGENIC RESONATOR COMPLEX. Radiophys. Quantum Electron 2013, 56. [CrossRef]
- Gunbina, A.A.; Serov, E.A.; Mineev, K.V.; Parshin, V.V.; Vdovin, V.F.; Chekushkin, A.M.; Khan, F.V.; Koshelets, V.P. Experimental Study of the Reflectivity of Superconducting Nb-Based Films in the Subterahertz Frequency Band. Radiophys. Quantum Electron 2022, 65, 471-480. [CrossRef]
- Serov, E.A.; Parshin, V.V.; Bubnov, G.M.. Reflectivity of metals in the millimeter wavelength range at cryogenic temperatures. IEEE Trans. Microw. Theory Techn 2016, 64, 3828-3838. [CrossRef]
- Parshin, V.V.; Serov, E.A.; Bubnov, G.M.; Vdovin, V.F.; Nikolenko, A.S., Lesnov, I,V.; Gunbina, A.A. Smirnov, A.V.; Malginov, V.A.; Dolzenko, D.E.; Khohlov, D.R. Terahertz Reflectivity of YBa2Cu3O7-δ at Cryogenic Temperatures. IEEE Trans. On Applied Superconductivity 2020, 30, 9001705.
- Gardner, D.V. Does Your CCD Camera Need Cooling? Available online: https://www.photonics.com/Articles/Does_Your_CCD_Camera_Need_Cooling/a12810 (accessed on 24 November 2023).
- Cease, H.; DePoy, D.; Derylo, G.; Diehl, H.T.; Estrada, J.; Flaugher, B.; Kuk, K.; Kuhlmann, S.; Lathrop, A.; Schultz, K.; et al. Cooling the dark energy camera CCD array using a closed-loop two-phase liquid nitrogen system. In Moden Technologies in Space and Ground-Base Telescopes and Instrumentation; SPIE: Bellingham, DC, USA, 2010; p. 77393N.
- Afanasieva, I.; Murzin, V.; Ardilanov, V.; Ivaschenko, N.; Pritchenko, M.; Moiseev, A; Shablovinskaya, E.; Malginov, E. Astronomical Camera Based on a CCD261-84 Detector with Increased Sensitivity in the Near-Infrared. Photonics. 2023, 10, 774. [CrossRef]
- Vdovin, V.F.; Korotaev, D.V.; Lapkin, I.V. Collection of abstracts of the 11th International School of Microwave Radiophysics and RF Electrodynamics. 1993, p.21.
- Lamb, W.. Infrared and Millimeter Waves. 1993, 14, p. 951.
- R. Siegel, J.R. Howell. Thermal Radiation. Heat transfer. New-York : McGraw-Hill Book Company, 1972.
- Doeleman, S.S.; Barrett, J.; Blackburn, L.; Bouman, K.; Broderick, A.E.; Chaves, R.; Fish, V.L.; Fitzpatrick, G.; Fuentes, A.; Freeman, M.; et al. Reference Array and Design Consideration for the next-generation Event Horizon Telescope. arXiv 2023, arXiv:2306.08787. [CrossRef]
- Hojaev, A.; Shanin, G.I.; Artyomenko, Y.N. Suffa Radio Observatory in Uzbekistan: Progress and radio-seeing research plans. IAU Spec. Sess. 2007, 5, 177–182. [CrossRef]
- Marchiori, G.; Rampini, F.; Tordi, M.; Spinola, M.; Bressan, R. Towards the Eurasian Submillimeter Telescope (ESMT): Telescope concept outline and first results. In Proceedings of the Ground-Based Astronomy in Russia. 21st Century; Romanyuk, I.I., Yakunin, I.A., Valeev, A.F., Kudryavtsev, D.O., Eds.; Special Astrophysical Observatory: Nizhnii Arkhyz, Russia, 2020; pp. 378–383.
- Wang, N. Xinjiang Qitai 110 m radio telescope. Sci. Sin. Phys. Mech. Astron. 2014, 44, 783–794. [CrossRef]

| Group name | Temperature range | Applications | ||
|---|---|---|---|---|
| Non-cryogenic temperatures | Т > 100 (120) К | - climate chambers for testing astronomical receivers and their components - not cryogenic cooling of photodetectors |
||
| High cryogenic temperatures | ≤100 К | - cooling of photodetectors to reduce dark current | ||
| Nitrogen level | ~ 77 К | - high-temperature superconductors - cooling of photodetectors - cooling of microwave radio receivers |
||
| Hydrogen level | ~ 20 К | cooling of photodetectors, radio receivers of the centimeter and millimeter (MM) range, semiconductor amplifiers up to the MM range | ||
| Helium level | ~ 4 К (up to 1.6 K with pumping) |
- detecting devices based on superconductors of the second kind - superconducting readout electronics - antenna systems, cryogenic chambers for testing and laboratory experiment |
||
| Subkelvin cooling | < 1 К | - superconductors of the first kind - superconducting electronics - quantum computers and quantum communications - highly sensitive receiving systems for modern astronomy, telecommunications, radar, etc. |
||
| Extremely low temperatures reached | ~ 10-9 К | - problems of metrology - quantum standards of time and frequency, including for VLBI astronomy - fundamental physics |
| Photo | Characteristic | Advantages |
|---|---|---|
| Chamber with remote cooling | ||
 |
- Chamber with remote cooling; - Temperature range: 190 K – 230 K; - Type of cooling: liquid; - Cryoagent: liquid nitrogen; - Vacuum level: 10-4 mbar; - Availability of getter pumping; - Dimensions: 240 × 190 × 154 mm; - Electrical connector: SNC; - Optical window MgF, Diameter: 90 mm ; |
- -Vibration-free system; - Possibility of providing a high level of vacuum up to six months without pumping out with electromechanical pumps; - The presence of a large diameter window; - No liquid cryoagent inside the chamber. |
| Cryogenic transport system | ||
 |
- Temperature range: 163 – 168 K; - The possibility of simultaneous temperature control of three cooled objects; - The ability to control the temperature – step 1 °, accuracy ± 0.5 degrees. |
- Ease of manufacture; - High speed and precision temperature control; - The possibility of measuring heat flow. |
Disclaimer/Publisher’s Note: The statements, opinions and data contained in all publications are solely those of the individual author(s) and contributor(s) and not of MDPI and/or the editor(s). MDPI and/or the editor(s) disclaim responsibility for any injury to people or property resulting from any ideas, methods, instructions or products referred to in the content. |
© 2023 by the authors. Licensee MDPI, Basel, Switzerland. This article is an open access article distributed under the terms and conditions of the Creative Commons Attribution (CC BY) license (http://creativecommons.org/licenses/by/4.0/).


