Preprint
Article

Effects of Aloe Vera Mucilage as a Superplasticizer on Limestone Calcined Clay Self-Consolidating Concrete Performance

Altmetrics

Downloads

202

Views

108

Comments

0

A peer-reviewed article of this preprint also exists.

Submitted:

13 December 2023

Posted:

14 December 2023

You are already at the latest version

Alerts
Abstract
Self-consolidating concrete (SCC) is highly workable concrete that flows under minimal vibrations into congested reinforcement and sophisticated formworks. The properties of SCC are achieved by incorporating chemical admixtures. In this study, we analyzed if SCC could be designed with a cheap, easily accessible plant extract as a bio-admixture known as aloe vera mucilage (AVM). The main aim is to determine the effect of AVM on SCC prepared from ordinary Portland cement (OPC) and blended cement LC3, consisting of clinker (50%), calcined waste clay (30%), limestone (15%), and gypsum (5%). The AVM is applied in different dosages of up to 10%. The findings showed that the LC3 had a lower rate of consistency, lower slump values, and higher initial and final setting times compared to OPC. The V-funnel and L-box values were reduced with increased plasticizer dosing. Additionally, the OPC samples with both plasticizers achieved higher compressive strength than LC3 in the 7, 14, and 28 curing ages. However, the 2.5 % dosage of AVM showed some increase in compressive strength in both OPC and LC3 samples. Overall, AVM is comparable to the commercial plasticizer used as both influence the reduction of yield stress with an increase in slump flow.
Keywords: 
Subject: Chemistry and Materials Science  -   Applied Chemistry

1. Introduction

Self-consolidating concrete (SCC) is a unique type of special concrete, often called self-leveling concrete, self-compacting concrete, or super workable concrete [1]. SCC is used in the construction of bridges, buildings, and general infrastructure [2]. Unlike conventional concrete, which requires manual methods of compaction during placement, SCC deforms with minimal external energy to induce proper compaction [3]. The concept of concrete bending effortlessly without physical compaction during placement was first proposed in 1986 by Prof. Okamura in Japan [4]. The proposal was implemented later in 1988 by Ozawa at the University of Tokyo, Japan [5,6]. The invention was brought forward as a test for eliminating the poor performance of concrete structures that were attributed to the placement methods of concrete [7]. Like the other types of concretes, SCC is also made of cement, fine and coarse aggregates, and water. As noted by Kumar [8], the desired properties of SCC can be achieved by incorporating admixtures known as (high-range water reducers) superplasticizers into conventional concrete. Thus, the resulting product SCC can provide good rheology and workability [9]. SCC offers several advantages over conventional concrete, including saving on project time cost, vibrating machines cost, and lowering skilled labor costs [10]. Nevertheless, since it generally requires a larger amount of binder and chemical admixtures than ordinary concrete, its material cost is typically 20–50% higher [11]. Using expensive admixtures and having negative environmental effects from higher dosages of cement needed in its production makes traditional SCC unsustainable.
In order to fulfill the need to reduce carbon emissions, which are generated from clinker/cement production, alternative building materials containing lower amounts of cement have been developed. This has been a challenging task since no other material has the same properties as cement while being able to be produced worldwide for a cheap price. One of the most promising solutions nowadays seems to be limestone calcined clay cement (LC3) [12]. LC3-50 was successfully introduced by partially substituting limestone and calcined clay for clinker to make pozzolana cement of gypsum (5%), limestone (15%), calcined clay (30%), and clinker (50%) in these studies [12,13,14]. Marangu et al. [15] and Odhiambo et al. [16] pointed out that the inception of LC3 binder has benefited the concrete industry by saving on the energy of producing clinker from 1500 °C to about 800 °C of calcining clay as the clinker substitute. By adding suitable admixtures, this new type of green cement could be adapted to the production of SCC. Nevertheless, it has been found that supplementary cementitious materials such as limestone and calcined clay impact the fresh properties of LC3. For instance, Muzenda et al. [17] reported that calcined clay in LC3 helped to increase static and dynamic yield stress, initial thixotropic index, plastic viscosity, and cohesion, as well as its presence decreased harmonic distortion, while limestone showed an opposite effect. More recently, Canbek et al. [18] used machine learning to predict the yield stress of LC3. Understanding the rheological properties of LC3 is essential for controlling their fresh properties and improving their application, such as SCC.
Besides numerous kinds of chemical admixtures, alternatively, cheap and environmentally friendly organic extracts can be exploited to influence fresh concrete properties. The urge to improve the quality of concrete through admixtures has gradually induced demand for green concrete as commercially available chemicals are expensive and non-biodegradable. These environmentally bio-degradable products can be harnessed from plants, animals, or both. Athman et al. [19] conducted a study on SCC with gum arabic from acacia trees and found that its addition of 8 % of the weight of cement maintained low water demand but relatively reduced compressive strength. Starch as well has been exploited as a viscosity-modifying agent in SCC and found to retard setting time and minimal effect on compressive strength [20,21]. Aloe vera mucilage (AVM) squeezed from the leaves seems to be another promising admixture. Aloe vera plant is a succulent plant that grows in semi-arid and arid regions. The plant has been exploited extensively in the field of cosmetology and medicinal applications across the globe for millennia [22,23]. It has been reported that when it is added to concrete, it improves its workability [24], compressive strength [24], corrosion inhibition [25], and it can be used in the formation of porous concrete [26]. However, the effects of AVM on rheology and water-reducing effect for the production of green SCC prepared from LC3 remains unclear.
This paper is focused on two main aspects: utilizing green, environmentally friendly LC3 cement for the preparation of SCC, and studying the effects of AVM, a cheap, organic extract, on its fresh properties. For a better understanding of the effects of AVM, reference samples were prepared using OPC (CEM I 42.5 R/ type I), and the obtained results were compared with samples prepared using a commercial superplasticizer (CS) MasterGlenium 3889. A total of nine trial mixes of SCC with OPC and CS were conducted at w/c of 0.8, 0.9, and 1.0 in order to define the reference mixture. The flow was measured by the flow table, V-funnel, and the L-box. The setting times, consistency, slump flow, yield stress, and compressive strength against flow behavior from the percentage dosage of CS and AVM were studied.

2. Materials and Methods

2.1. Raw materials

For the sample preparation, coarse aggregate (CA), Fine Aggregates (FA), CEM I 42.5 R (OPC, also referred to as type I), already premixed blended limestone calcined clay cement (with 50% of clinker, thus it is labeled as LC3-50), type G: commercial superplasticizer (CS) MasterGlenium 3889, water, limestone dust powder (L), and aloe vera mucilage (AVM) as a bio-admixture were used. The chemical composition of the used raw powders is summarized in Table 1. Coarse aggregates had a specific gravity of 2.75, water absorption of 3.29%, and a fineness modulus of 7.17 of 92.83% gravel, while the fine aggregates exhibited a specific gravity of 2.39, water absorption of 5.76%, and fineness modulus of 3.758 of 95.83 % sand, as per ASTM C33 [27]. The OPC was produced by Mombasa Cement Limited, and it had a specific gravity of 3.09. With its composition and properties, it conforms to the Kenyan standard, KS EAS 148-1: 2017 [28]. L (Mineral Enterprise, Kitengela), which was used as a filler, had a fineness index of M16 and a specific gravity of 2.86 at 2.31 % water absorption. The specific gravity of LC3 was determined as 2.89. Tap water was used in the study. CS conforming to manufacturer specifications and ASTM C-494M [29] were purchased and adopted as a reference for a comparison of the effects of AVM on the selected properties of the designed SCC.
CS was purchased from Baden Aniline and Soda Factory (MASTER BUILDERS) at Syokimau, Kenya. It is categorized as the type G superplasticizer in ASTM C-494M [29], and its physiochemical properties, as provided by the producer, are displayed in Table 2.
AV plant leaves were harvested from a farmer in Kajiado, Kenya. The leaves were cut off the main stem and gently packed in sacks. In the laboratory, the leaves were dipped in clean water for about 30 minutes to drain toxins. Then, they were removed from the water and cut off the chain-edge saw. The mucilage was extracted by scooping the gel from the leaves and blended for a smooth gel without adding any water or chemicals. The mucilage was then refrigerated to avoid its decomposition. The sap was packed into a 10 ml translucent plastic container for transportation to the GC-MS laboratory for GC-MS analysis.

2.2. Mix design and sample preparation

In making SCC, nine mixes were designed and prepared following the official EFNARC guidelines [30]. In the batching process, the percentage coarse aggregate to fine aggregate ratio was varied as 40:40, 36:43, and 32:46 at a w/c ratio of 0.48. The detailed sample composition of the studied mixes is summarized in Table 3. The sample preparation process was used as follows: The batched materials were first mixed in a dry state for about three minutes until the color of the mixture was visually homogeneous. The 80% of the required amount of water was added to the dry mixture while mixing. The remaining 20% of water was added to the solution of a mixture of the superplasticizer. CS was dosed at 0%, 0.5%, 1%, 1.5%, and 2% to the weight of cement, whereas it was needed to adjust the AVM ratio (0%, 2.5%, 5%, 7.5%, and 10%, in order to achieve comparable results of the fresh properties.
Based on the results of the fresh properties, such as slump flow test, v-funnel test, and L-box test (the related methods will be described in detail in section 2.3. Methods) of the studied mixtures, TR7 was selected as the optimal SCC design for further analysis. All fresh SCC mixes were also placed in concrete molds with 150 x 150 x 150 mm dimensions. A total of 85 concrete cubes were cast and left to cure for 24 hours, covered by a foil. Then, the samples were removed from the molds and were submerged under water in the curing tank until they reached 7, 14, and 28 days of age. Thereafter, their compressive strength properties were determined in triplicate. In addition, a fundamental physical property, such as bulk density, was analyzed according to ASTM C138 [31] on the remaining specimens after curing for 28 days.

2.3. Methods

2.3.1. Setting time and consistency

The setting time and consistency tests were carried out as outlined in KS EAS-148-3-2017 [32]: 300 g of cement was placed in the bowl, and about 125 g of water was added within 10 seconds. The mixer was used to homogenize the mixture for 3 minutes. The paste was removed and filed into the oiled Vicat mold without compaction. The paste in the mold was placed on the base plate, and the plunger was lowered gently to the surface of the paste and released. The penetration reading within 30 seconds was recorded. The amount of water used in wetting cement was expressed in percentage to the cement, known as consistency. The plunger was then fitted with a needle and released at the surface of the paste, and the depth penetrated was recorded as the initial setting time. A time interval of 10 minutes was used until the highest penetration reached -5 mm. The process was repeated for the final setting time by replacing the needle with the ring attachment.

2.3.2. Slump flow, V-funnel and L-box

About 30 liters of SCC was prepared to conduct slump flow tests according to the established mix design procedure outlined by EFNARC [30]. Hydraulic fluid was used to moisten the interior surfaces and flow table surfaces. Abram’s cone with a flow table was set on a level ground. For the volume of a sample needed to work with, the test required three people. The concrete was filled in the cone, and the excess was removed. Then, the cone was lifted, and the material was left to flow. The diameters of the slump flow were measured and labeled as d1 and d2, and then their average was determined.
Approximately 6 liters of a mixture was used for the V-funnel test. The equipment was set at level ground and was filled with the studied SCC. The trap door at the bottom was then opened, and the stopwatch started simultaneously to record the time needed for the complete discharge (the flow time).
Lastly, the L-box test was also conducted on the fresh mixtures. The apparatus consisted of a rectangular section box in the shape of an “L,” with vertical and horizontal sections separated by a movable gate. The vertical part of the equipment was filled with the mixture, and then the movable gate was lifted. The filling and passing ability of the studied SCC were assessed using this test. The depth distance of the horizontal configuration of the channel was measured and noted as “H1” and “H2”. The blocking ratio was then calculated as H2/H1 within five minutes.

2.3.3. Yield stress

ASTM C1749-17a [33] defines yield stress as the minimum shear stress required to initiate flow, and it can be measured by a rheometer in Pascal (Pa). However, this study adopted Equation (1) by Roussel and Coussot [34] to determine the yield stress from a flow regime initiated in SCC prepared with the help of OPC and LC3-50 cements.
τ c = 225 ρ g 128 π 2 R 2 V o , 2
Where, Ʈc – Yield stress (Pa), ρ – density (kg/m3), g – gravity (m/s2), R – radius of spread regime (m), and V – volume of Abram cone (m3).

2.3.4. Compressive strength

The development of the compressive strength of the studied SCC mixtures was determined after 7, 14, and 28 days of age. At each testing age, three samples from each mixture were removed from the curing tank, wiped, and given 10 min to drain. Then, the samples were placed in a compressive strength test machine model YAW-300 in order to determine their compressive strength. The compressive strength results were recorded in MPa.

2.3.5. Bulk density

The bulk density was analyzed according to ASTM C138 [31], which was adjusted for the determination of the specimens after curing for 28 days. It means that it was taken into account that the bulk density of designed SCCs is a parameter, which, for a more relevant comparison to other building materials, needs to be provided at a constant weight and not on the wet samples. Additionally, the water removal from the samples is beneficial because it helps to stop hydration processes.
Three samples of each mixture were dried in the oven at 50 °C until constant mass was reached. This relatively low temperature was selected in order not to harm hydration products [35].

3. Results and discussion

3.1. Characterization of aloe vera mucilage

The AVM was screened for phenols and hydroxyls by means of a GC-MS equipment Shimadzu QP2010 GC-MS. A total of six compounds (The peak areas of 80.74% for 1-hexanol, 2-ethyl-, 4.74% diethyl phthalate, 4.27% hydroperoxide, 1-ethylbutyl, 4.12% ethylbenzene, 3.61% styrene, and 2.82% hydroperoxide, 1-methylpentyl,) were identified as outlined in peaks on Figure 1 and also in Table 5. Compounds such as hydroperoxide are very stable organic peroxides often used as radical initiators, as they perform homolysis at temperatures above 100 °C [36].
The highest percentage peak height of 84.33% was related to 1-hexanol, 2-ethyl. 1-Hexanol, 2-ethyl is known as a poorly soluble compound in water due to the large akyl group but soluble in almost all other organic compounds [37]. It is also known as 2-ethylhexanol, which easily biodegrades in water [38]. McGinty et al. [39] noted that 1-hexanol, 2-ethyl is a long-chain hydrocarbon of saturated chiral alcohol with methyl sides and one hydroxyl group per molecule on the structural element. Also, it is used as a fragrance compound in cosmetics and cleaning soapy detergents. The property of branching from esters formed by 1-hexanol, 2-ethyl does not allow crystallization [40]. This property renders 2-ethyhexanol useful in the manufacture of polyvinyl chloride plasticizers as it imparts a characteristic odor and a high boiling point [40,41]. Stamatelatou et al. [42] further reported that 2-ethylhexanol reacts with phthalate anhydride to form di-(2 ethyl-hexyl) phthalate that is from 95% used as a plasticizer in making PVC. As indicated by Ataman Chemicals [43], 2-ethylhexanol is an intermediate plasticizer as it breaks the chain during the synthesis of condensation polymers.
Diethyl phthalate with a peak height of 3.21 % was also detected. According to Wang et al. [44], diethyl phthalate is a short branched low molecular phthalate. Phthalates are plasticizers synthesized from phthalic acid and are often used to soften and increase the durability of plastics [45]. They can also be used in hair products, pharmaceuticals, and medical devices.
These properties listed above highlight the potential of AVM to be used as a superplasticizer in (SCC) concrete.

3.2. Setting time and consistency

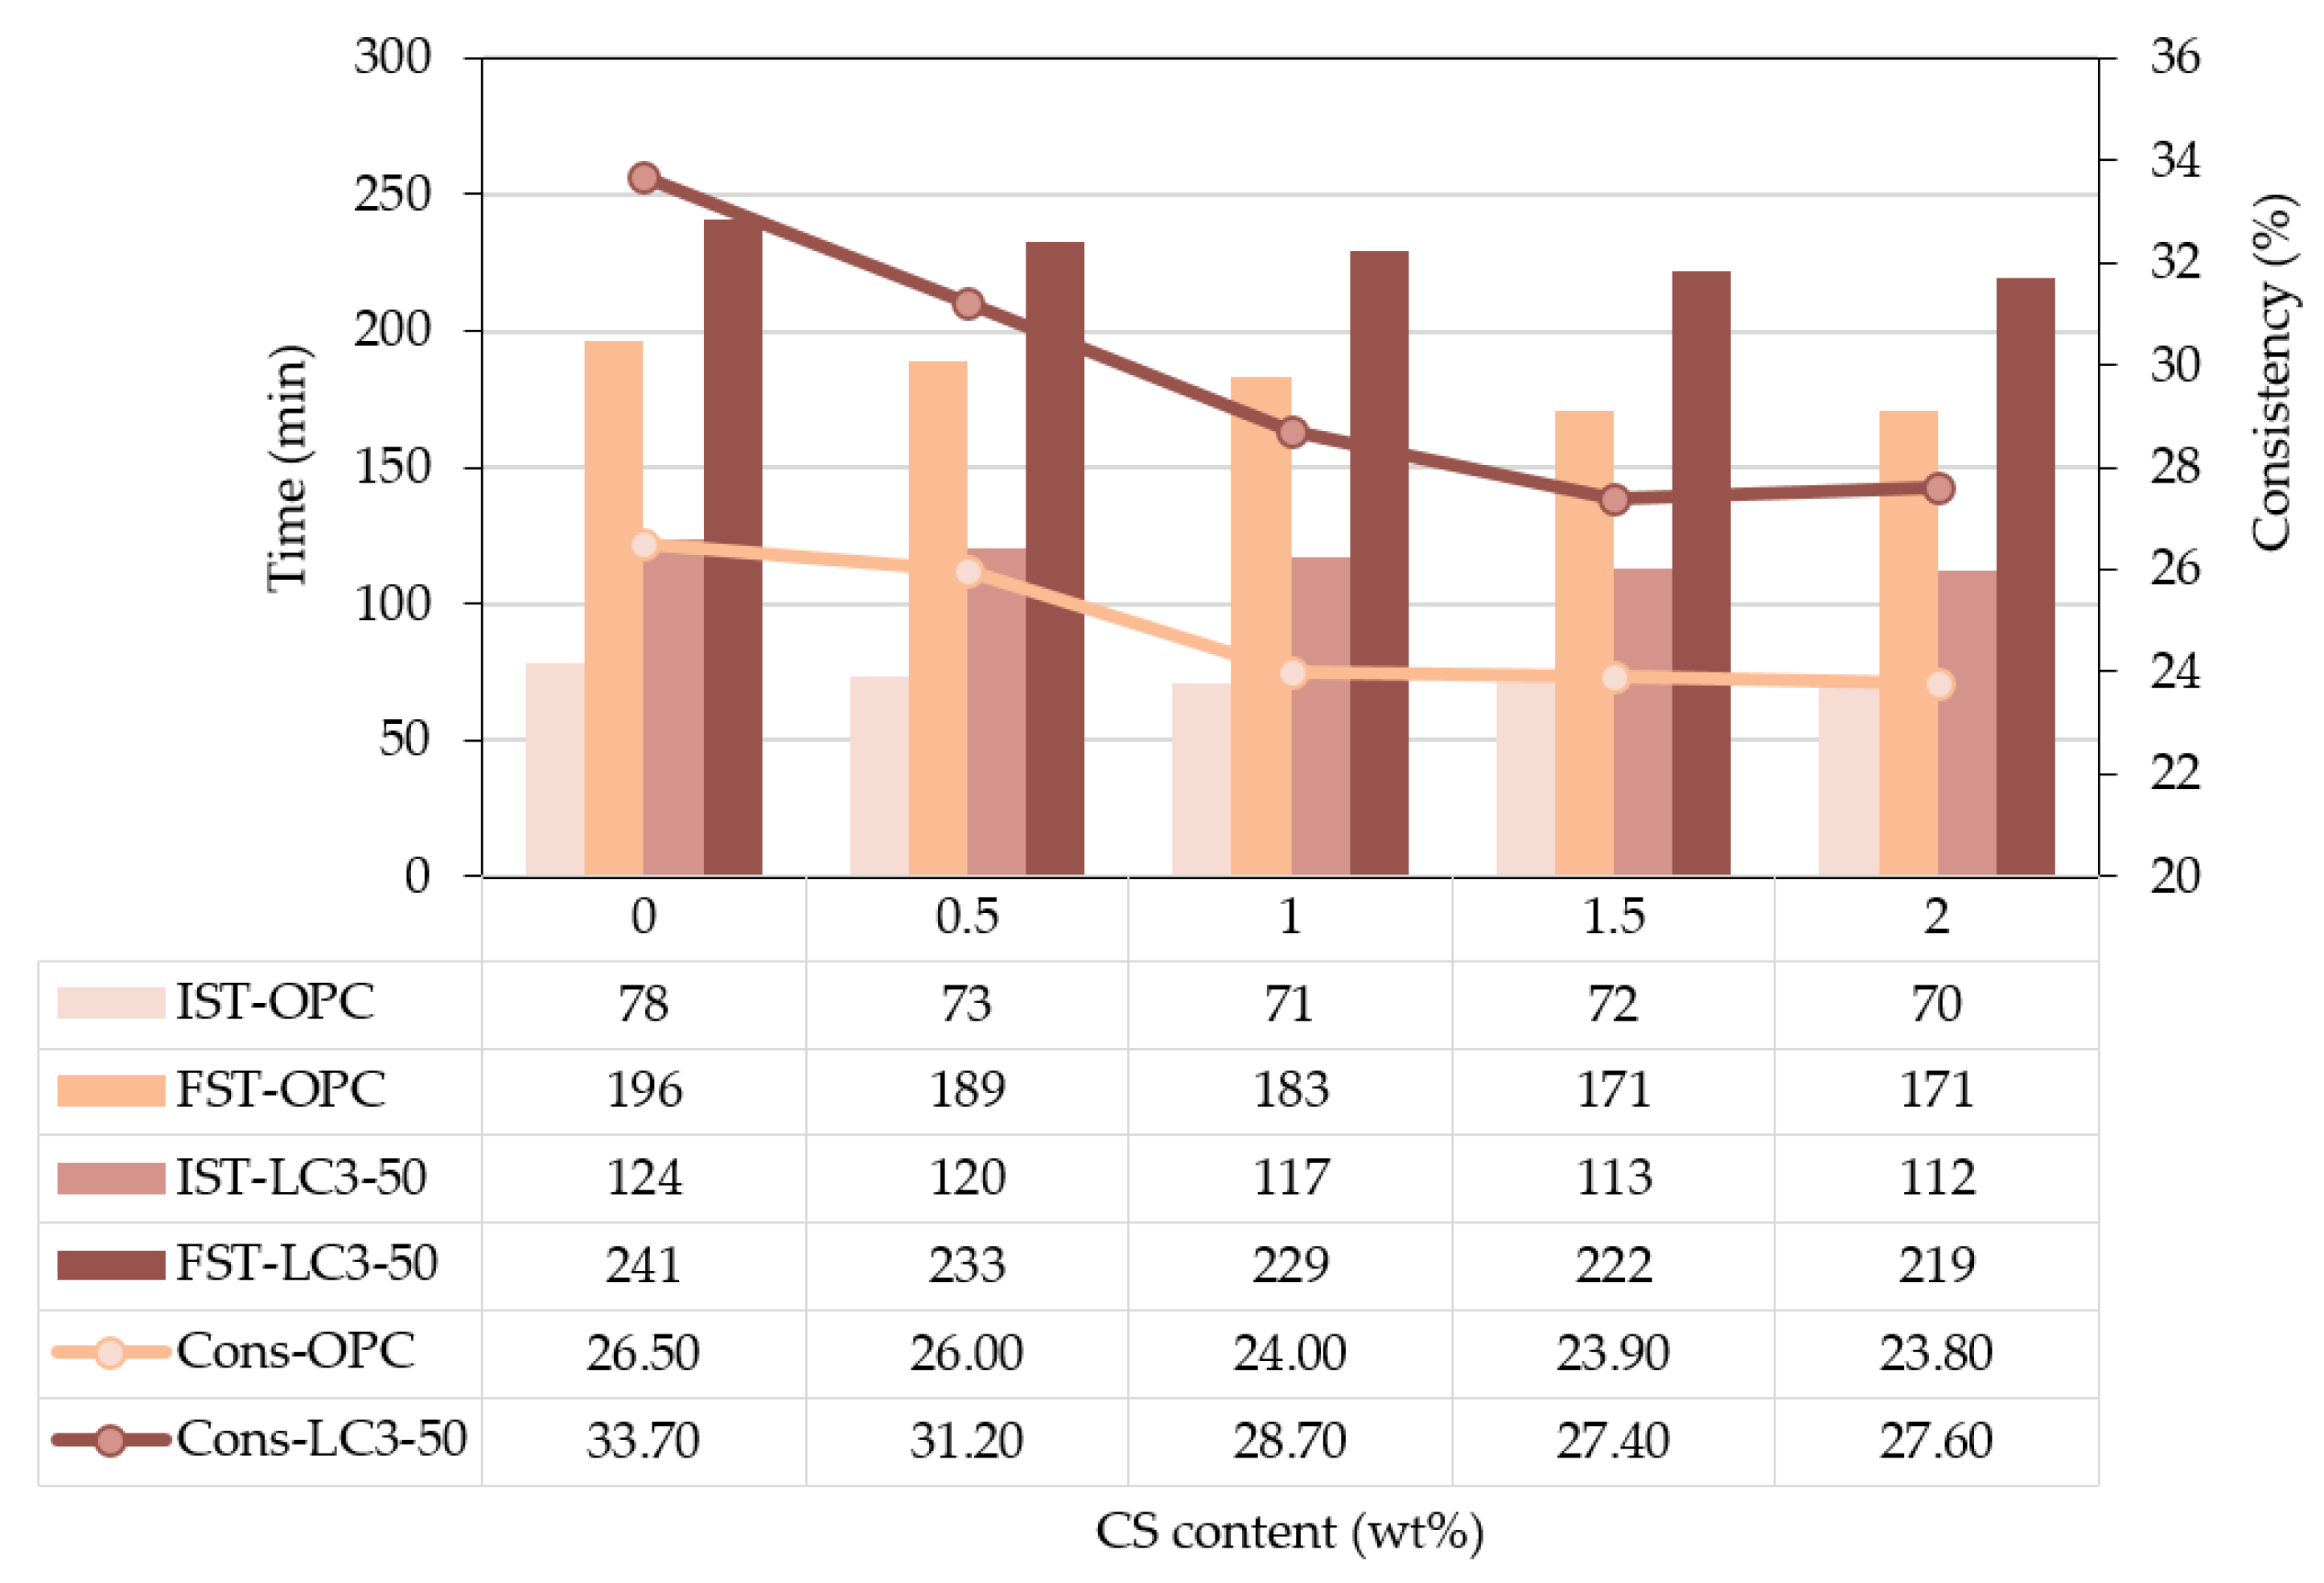
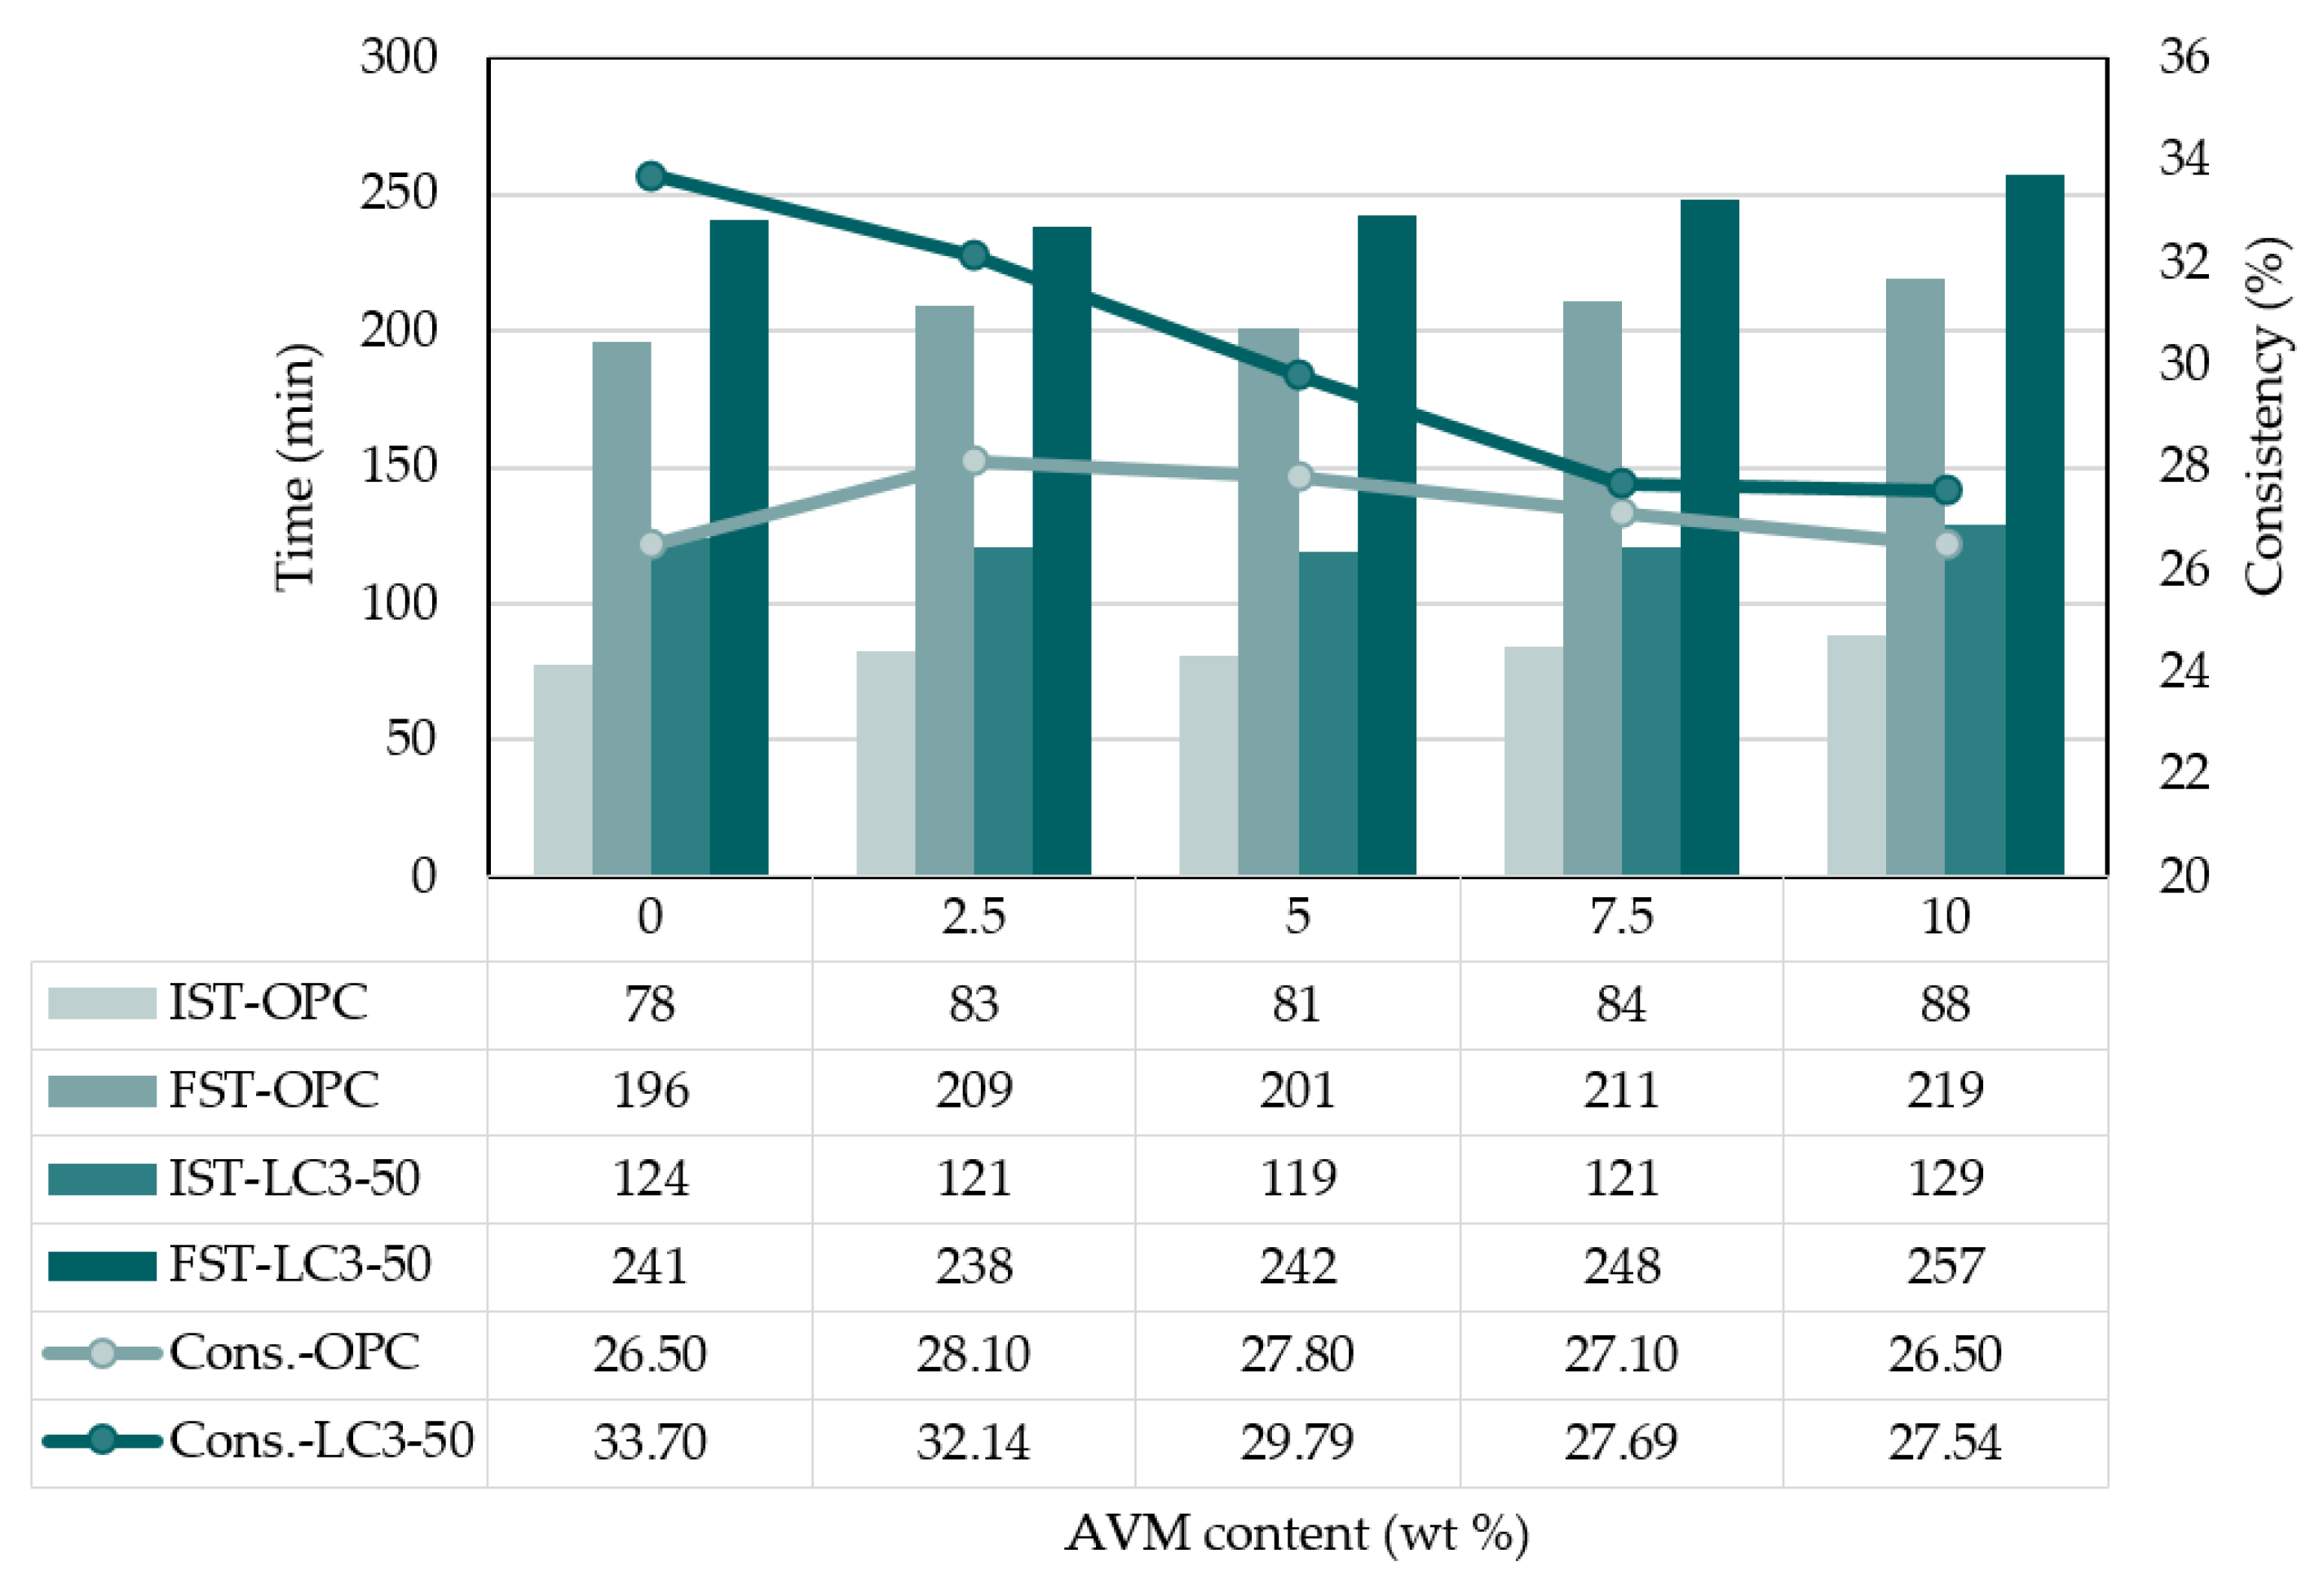
The setting time and consistency results of the studied systems are summarized in Figure 2 (mixtures containing CS) and Figure 3 (mixes with AVM).
The initial setting time (in figures labeled as IST) of the analyzed mixtures was affected by two main factors. The first one was related to the content of CS. When its amount increased from 0 to 2 wt.%, it slightly speeded up the time that the cement pastes started to lose their plasticity. In the case of the OPC samples, this time difference was 8 minutes between the samples without any superplasticizer and those with 2 wt.%. In the LC3-50 blends, this difference was slightly higher (by 12 minutes).
The second main factor influencing the IST was the type of cement in the mixes. The LC3-50 blends without CS exhibited significantly prolonged time needed to lose their plasticity by 46 minutes compared to the same samples containing 100% OPC. In the samples containing the maximal dosage of CS, this difference was 42 minutes, and thus, the effect of the decreased amount of cement in the LC3-50 blends affected the IST in a more evident way than the addition of CS. The final setting time (FST) showed the same trends as the IST. The results can be supported by Bhandari et al. [46] that the polycarboxylate-based admixtures, such as CS, in this study reduce the concentration of Ca2+ in the system, creating a strong bond from the adsorption effect on its molecules, thus reducing the overall setting times.
Regarding the consistency results, the difference between OPC and LC3-50 without CS was determined as 7.2%, and this difference decreased to 3.8% in the samples with the maximal dosage of CS at 2%. The result can be attributed to the action of superplasticizers by interfering with the interparticle forces of cement, hence lowering the yield stress [47]. In their study, Hirata et al. [49] argued that polymer molecules on superplasticizers shrink and get distorted when adsorption takes effect in the mixture for a few minutes.
Whereas adding 2.5 wt.% of AVM to the OPC delayed the IST by 5 min compared to the reference sample, the four times higher amount of AVM in the samples increased this value only by 10 min in the bio-admixture systems. Regarding the FST of these systems with the OPC, the lowest AVM content in the samples delayed this parameter by 13 minutes, while the highest AVM content increased this value by 23 minutes compared to the reference samples. When the AVM was added in the LC3-50 mixtures, the recorded IST was slower by 3 min in the samples with the lowest amount of AVM, whereas its value was prolonged by 5 min in the samples containing 10 wt.% of this bio-admixture. The FST in the last mentioned samples was 16 min longer compared to the LC3-50 mixtures without any addition.
Interestingly, the lowest AVM content had the most significant impact on the consistency results of OPC (increased by 1.6% compared to the results of OPC without a plasticizer), whereas the 10 wt.% addition led to the same results as the reference sample. For the LC3-50 samples, the addition of AVM showed a decreasing trend, with the highest difference in the consistency results by 6.2% in the samples with 10 wt.% AVM addition.
The obtained results for both OPC and LC3-50 systems indicate that CS plays the role of a set accelerator as opposed to AVM acting as a set retarder. OPC systems respond well with CS and AVM by obtaining the optimum 5-7 mm consistency at a water content of 23.8% and 26.5%, respectively. In the LC3-50 systems, the maximal addition of AVM only improved the consistency by achieving a 6.2% change from the reference samples. In the OPC system, AVM was not stable, as increasing the plasticizer dosage led to low consistency. That might be attributed to the low surface area of cement particles and the volume of water available from AVM compared to CS [48]. The result of AVM can be explained by Singh et al. [49], who pointed out that phenols react with calcium hydroxide (Ca(OH)2) in cement during the hydration processes. The phenol active part (OH) from AVM adsorbs on the cement ions, causing steric hindrance that helps retain flow and thus improved consistency with increase in percentage dosage.

3.3. Slump flow test, V-funnel test, and L-box test

Based on the EFNARC [30], a concrete mix can be classified as SCC if it fulfills the requirements for filling ability, passing ability, and segregation resistance, which can be evaluated, for example, using slump flow test, V-funnel test, and L-box test, respectively. The acceptance criteria of these parameters were established by EFNARC as follows: slump flow diameter may vary between 650 and 800 mm, V-funnel results could be recorded between 6 and 12 sec, and finally, the L-Box results h2/h1 should be between 0.8 and 1.0. The results obtained for all mixtures are summarized in Table 6 (containing CS) and Table 7 (mixtures with AVM).
In the case of OPC-CS (Table 6), the slump flow varied from 452.5 mm to 681.5 mm as the amount of CS increased in the mixtures. The optimal slump flow performance was achieved with 1.5 and 2 wt.% of CS. The V-funnel test revealed that even the dosage of 1 wt.% of CS could provide the passing ability of 11 sec, which was within the acceptable range. Regarding the results of the L-Box, it was evaluated, similarly to the slump flow diameter, that the mixtures with 1.5 and 2 wt.% fulfilled the EFNARC criteria for the production of the SCC.
When the AVM was added to the OPC (Table 7), none of the mixtures met the requirements to be classified as SCC. Nevertheless, the most promising results fulfilling two of the three parameters were obtained for the mixtures with 7.5 and 10 wt.% of AVM. Based on the results, it seems that if the dosage of AVM were kept between 7.5 and 10 wt.%, all three parameters would have provided the desired values.
In the LC3-50 mixtures, similar to the results of OPC, the addition of 2 wt.% CS and 10 wt.% of AVM provided the most satisfying results in the design of SCC. The LC3-50-CS mixture containing 1.5 wt.% CS fulfilled only one criterion (V-funnel results of 10 sec). Regarding the mixtures with the AVM superplasticizer, nearly all requirements (besides V-funnel by one second) were met in the mix with 10 wt.% of AVM.
From the obtained results of the above-presented fresh properties, it can be summarized that the most promising data were achieved at 2 wt.% of CS and between 7.5 and 10 wt. % of AVM to the weight of cement in both OPC-CS and LC3-50-CS systems. The combination of many phenol compounds found in the AVM extract leads to a complex reaction, which can be described based on the results obtained by Singh et al. [49], who observed that the active side of long-chain hydrocarbons such as 2-ethyl-hexanol creates electrostatic repulsion called steric hindrance that hinders crystallization. The more AVM is added, the ratio of cement to phenolic charges reduces, hence resulting in higher flow and improved workability. In excess dosage, bleeding starts to appear due to the excess -OH group. More details about the 2-ethyl-1-hexanol as a fragrance material are provided, for instance, in an extensive review by McGinty et al. [39].

3.4. Yield stress

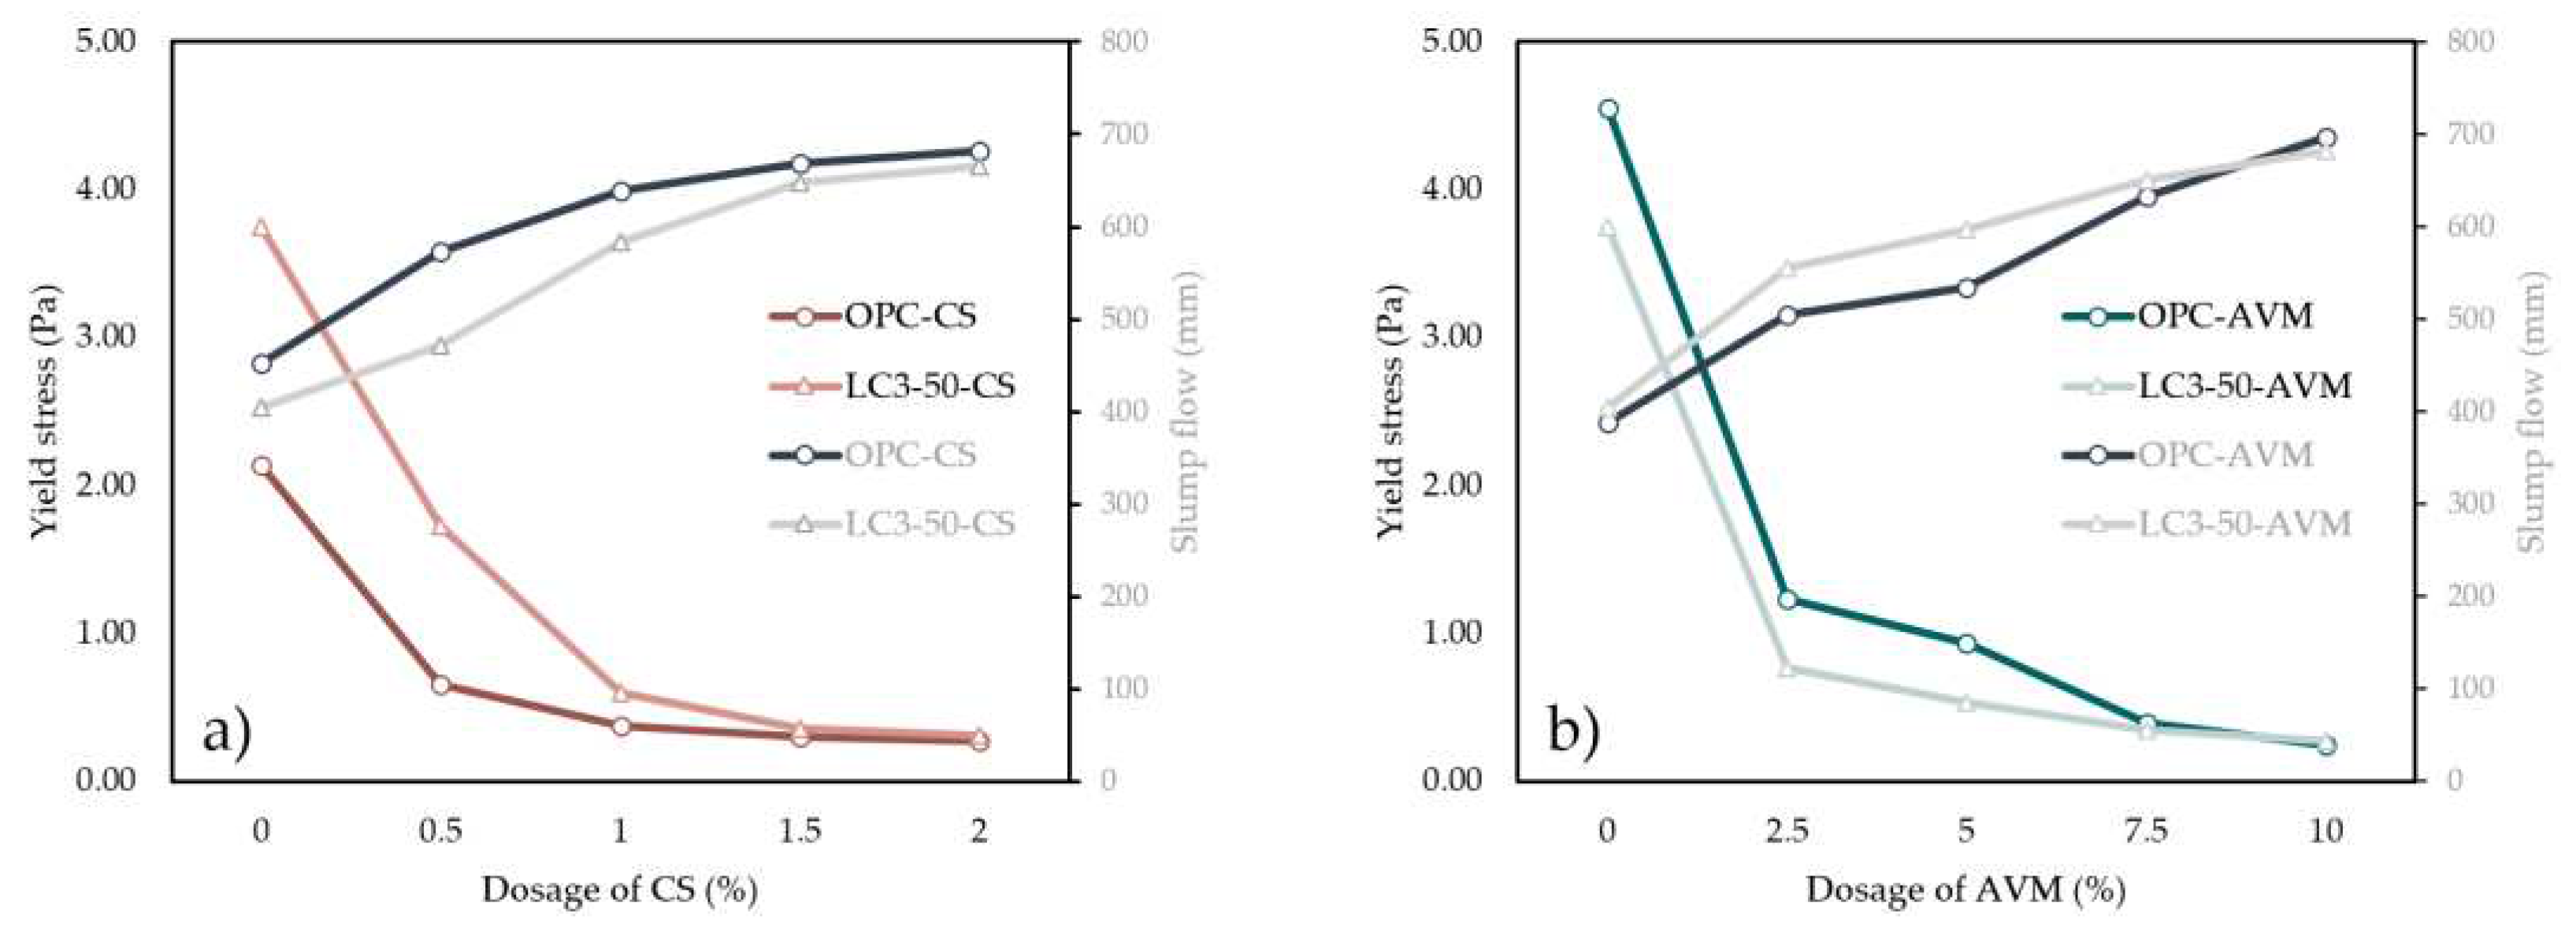
In this section, yield stress results, as determined by Equation (1), are summarized in Figure 4 and are discussed in correlation to the slump flow data. The results of yield stress, as depicted in a plot of Figure 4a, reduced from 2.14 Pa to 0.28 Pa at 0 wt. % to 2 wt. % dosage of CS, whereas the slump flow diameter increased gradually within the same samples, indicating that the concrete could flown more easily and was able to cover a greater horizontal distance. The optimum slump flow diameter within the acceptable range of 650–800 mm resulted in 668.5 mm at 0.30 Pa and 681.5 mm at 0.28 Pa yield stress, respectively, in the OPC-CS mixtures with 1.5 and 2 wt.% of CS. Very similar results of the yield stress were determined for the LC3-50-CS with the same CS dosages, 0.36 Pa and 0.31 Pa, with the related slump flow diameters of 647.5 mm and 666.0 mm, respectively. Additionally, when 0 wt.% of CS was added to the LC3 blends, the resulting yield stress reached the value of 3.75 Pa at the slump flow diameter of 404.5 mm. The generally lower slump flow diameters of LC3 blends compared to OPC can be attributed to the higher demand for water in LC3-50 cement compared to OPC, as depicted by consistency results.
In the case of the mixtures containing the AVM superplasticizer, the yield stress curves, along with related slump flow results, are depicted in Figure 4b. At 0 wt.% of AVM, OPC, and LC3-50 systems indicate slump flow and yield stress of 389 mm at 4.56 Pa and 404.5 mm at 3.75 Pa, respectively. Similar to the mixtures containing CS, as the AVM content increased within the mixtures, it was possible to reduce the yield stress to 0.40 Pa and 0.25 Pa in the OPC samples with 7.5 wt.% and 10 wt.% of AVM, with the related slump flow results of 633.5 mm and 697.0 mm, respectively. For the LC3-50 samples with the same AVM content, the yield stress decreased to 0.35 Pa and 0.27 Pa at the related slump flow diameters of 651.0 mm and 682.5 mm.
When these results are compared to the existing literature, for instance, Zhu et al. [50] described polycarboxylate superplasticizers (PCEs), to whose the used CS belongs, as materials having high fluidity on low w/c ratio, as excess water prevents adsorption on cement particles thus flocculation that leads to bleeding. PCEs can, therefore, significantly reduce yield stress, as reported in [50,51]. Comparing the behavior of PCEs to AVM, yield stress from both systems decreases with an increase in slump flow attributed to the adsorption effect from -COOH and -OH supplied from phenolic groups analyzed in AVM extract.

3.5. Compressive strength

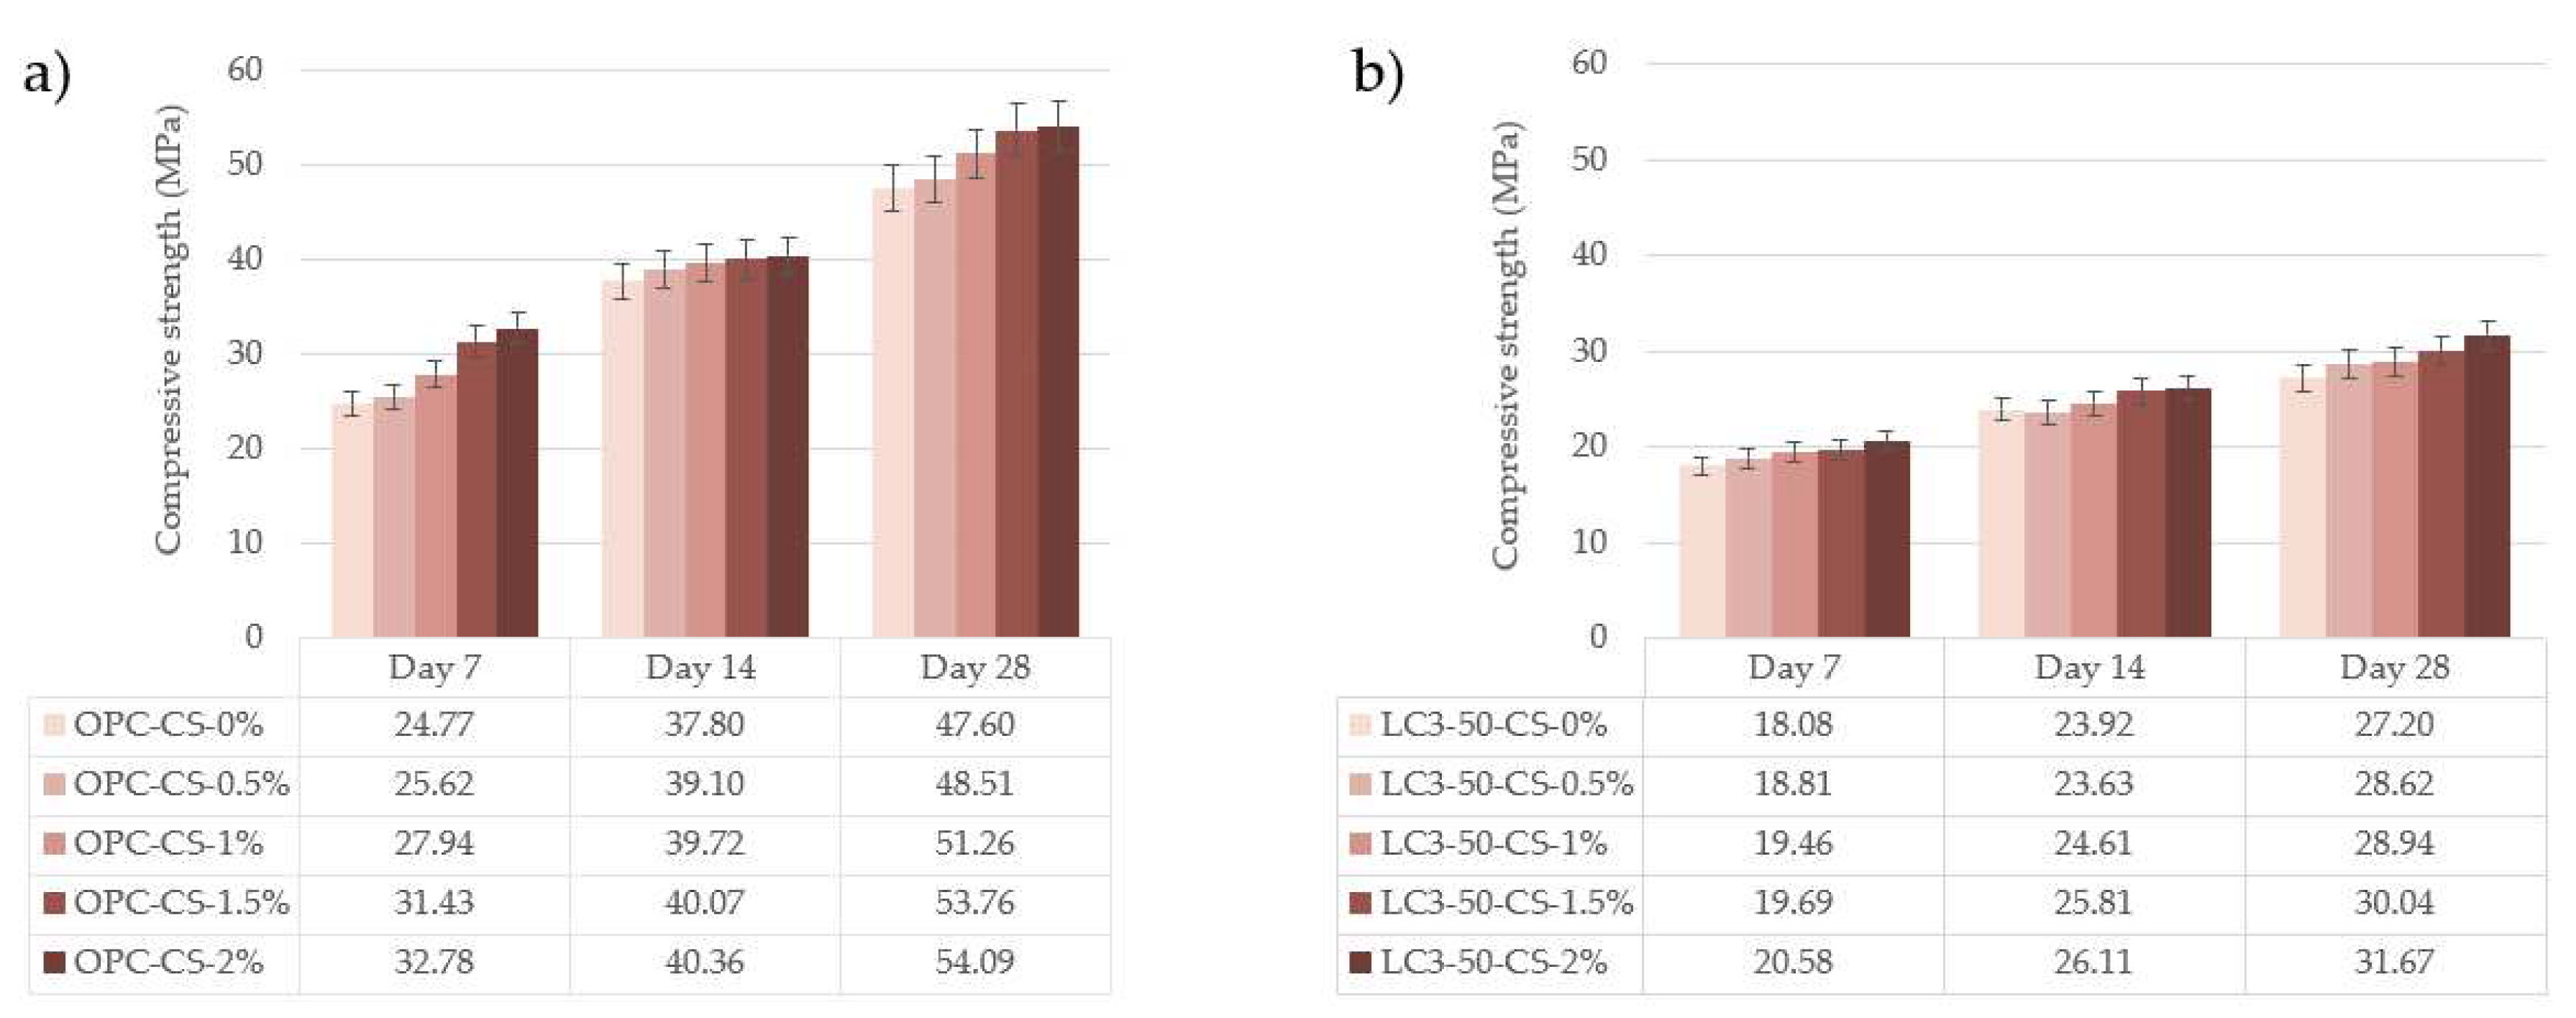
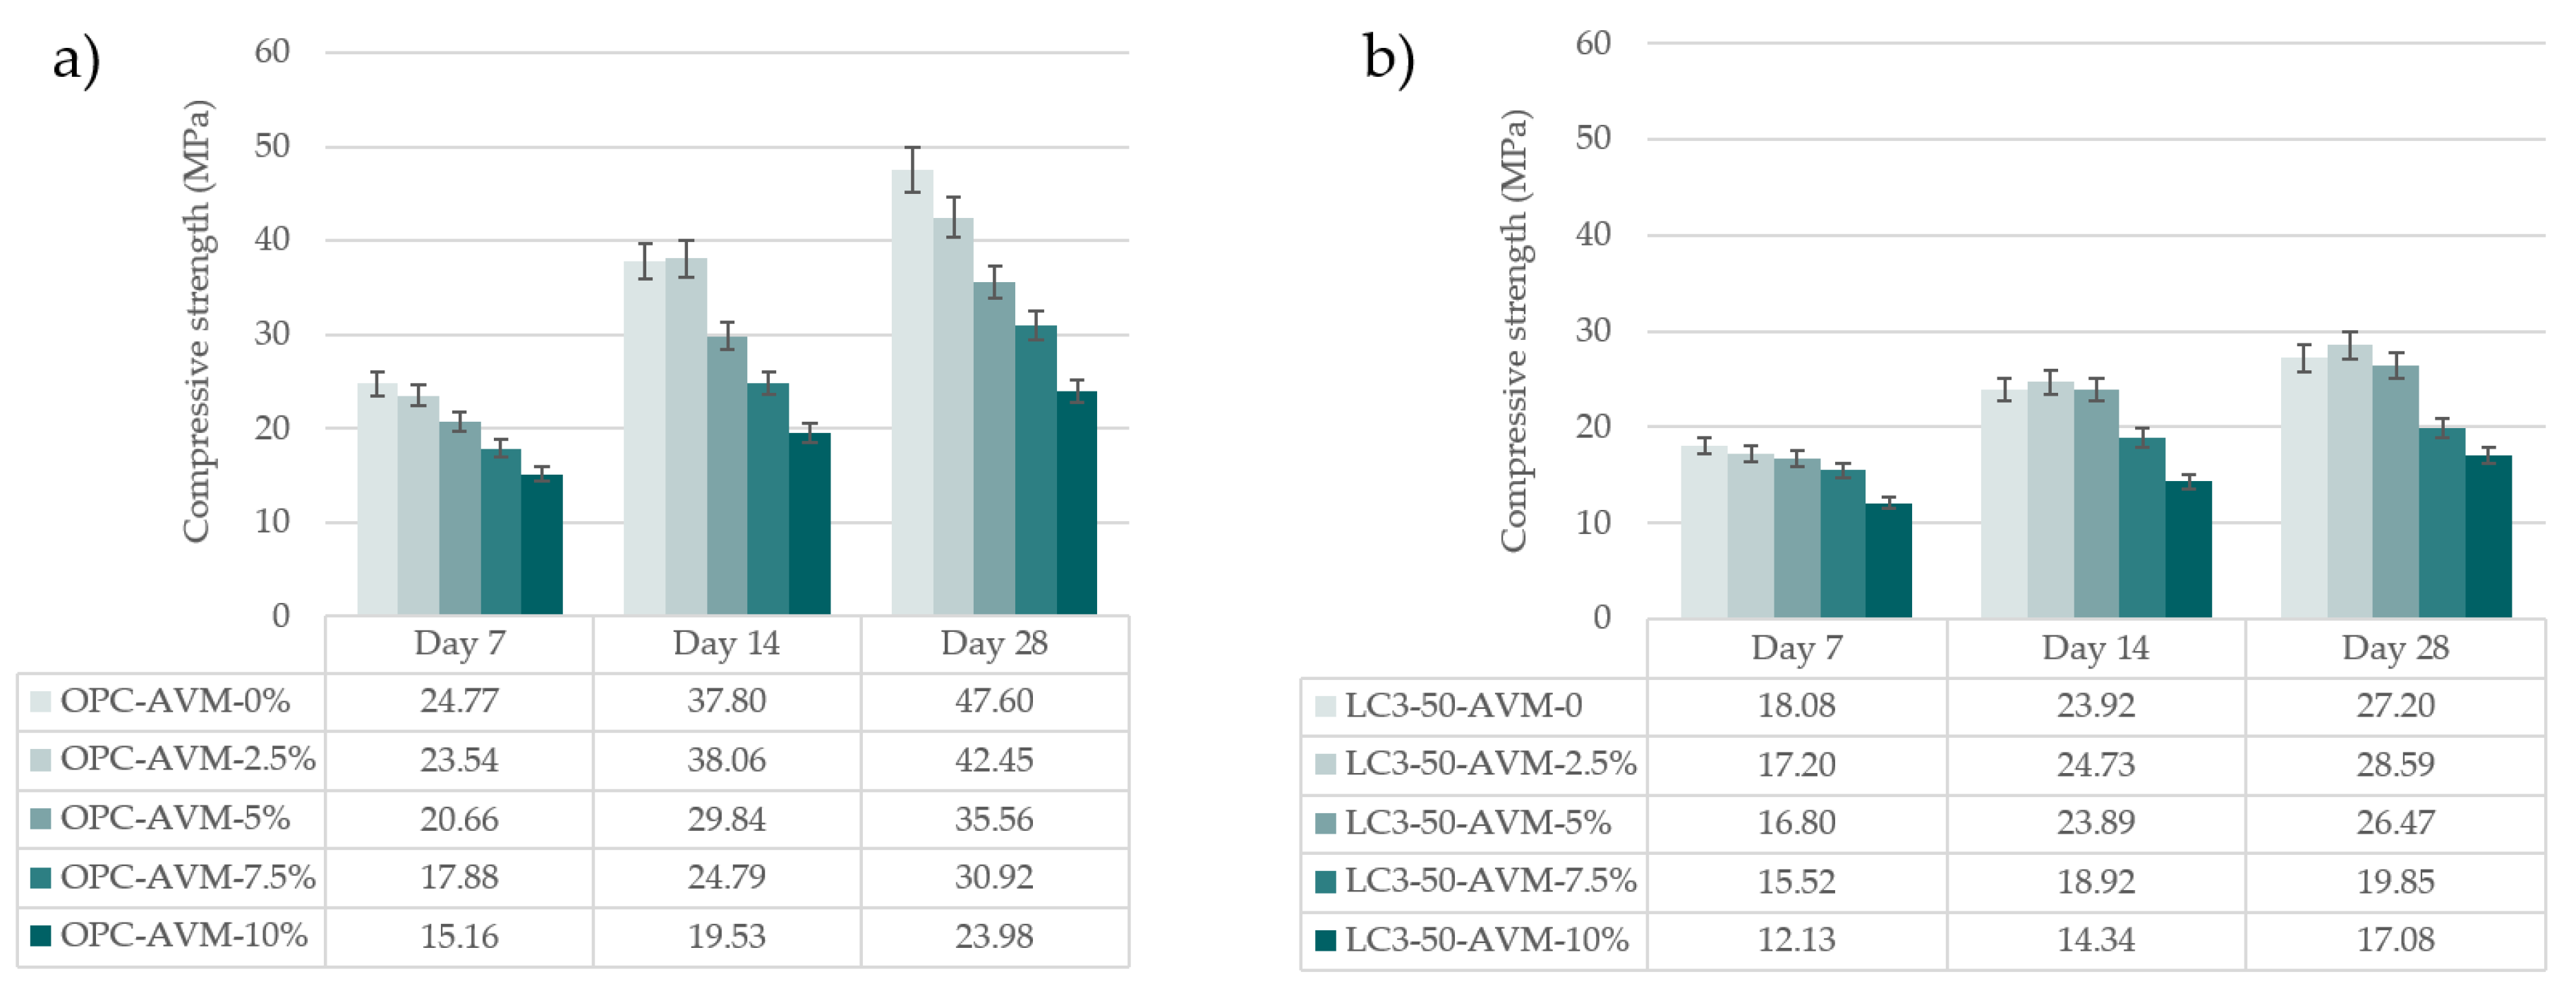
In this section, compressive strength results of the studied SCC mixtures at 7, 14, and 28 days are presented in Figure 5 for the samples containing CS and in Figure 6 for the samples with AVM.
Generally, compressive strength is considered one of the most important parameters in evaluating the performance of newly designed building materials. As expected in water-cured cement-based materials, all mixtures showed an increasing trend of compressive strength over time, which is mainly attributed to the continuous cement hydration of the main mineral phases of cement, such as C3S, C2S, C3A, and C4AF (and the chemical reactions between the metakaolin and calcium hydroxide in the case of LC3 [52]). In OPC, proportions of C3S are high and mainly responsible for early strength development [53]. This explains why the early strength of the reference OPC system was about 6.69 MPa higher than LC3-50 blends after curing for 7 days. Another important reason for generally lower compressive strength values of LC3-50 is that the high cement replacements with the pozzolana active materials, such as metakaolin used in this study, lead to slower early strength development of blends [54]. At later ages, C2S starts to contribute to compressive strength, which, along with the effect of C3S, helps increase the compressive strength over time [55].
When CS superplasticizer was added to OPC and LC3-50 systems, the compressive strength revealed an increased trend with its dosage (Figure 5). Interestingly, in the OPC systems, its addition showed similar increasing trends in the samples after 7 and 28 days, whereas it had a very low impact on the 14-day strength. The reason is not apparent. After 28 days of curing, the OPC samples with 2 wt.% of CS reached 54.09 MPa, whereas for the LC3-50, the compressive strength was 31.67 MPa. The relatively low results can be attributed to the presence of inert limestone filler that is meant for filling existing voids. Since LC3 constituents include limestone, optimizing the amount of limestone filler can tremendously increase the compressive strength of concrete, as discussed, e. g., in [56,57].
When AVM was added to studied samples, the compressive results showed an opposite trend compared to CS. The compressive strength of OPC-AVM and LC3-50-AVM is only observed slightly to increase at the 28 days of curing by dosing 2.5 wt.% AVM, as can be seen in Figure 6. Further dosing of AVM by 5%, 7.5%, and 10% by weight of OPC, the results of compressive strength decreased by 16.2%, 35.0%, and 49.6%, respectively. In LC3-50-AVM systems, the samples showed more or less the same trends by dosing of AVM by 5%, 7.5%, and 10% by weight of LC3-50, and by 28 days, even though results decreased to a lesser extent by 7.4%, 27.0%, and 37.2%, respectively.
The results can relate to research done by Singh et al. [49] on the effect of phenol on the hydration of cement, who observed that phenols retard hydration and as increasing the dosage of hydroxyl groups setting time increases. The increase may be attributed to the supply of -COOH and -OH that create a repelling effect called steric hindrance. The impact of delaying hydration does not allow C-S-H formation to occur as quickly as required. The delayed effect results in the retardation of fresh mix and affect the compressive results due to the excess addition of AVM, as depicted in Figure 6. A similar explanation about the retarding impact of hydroxyl groups in cement was provided, e.g., in [58], where their number and stereochemistry were reported as important parameters controlling the retardation generated by sugar alcohols and phenols on cement hydration.

3.6. Bulk density

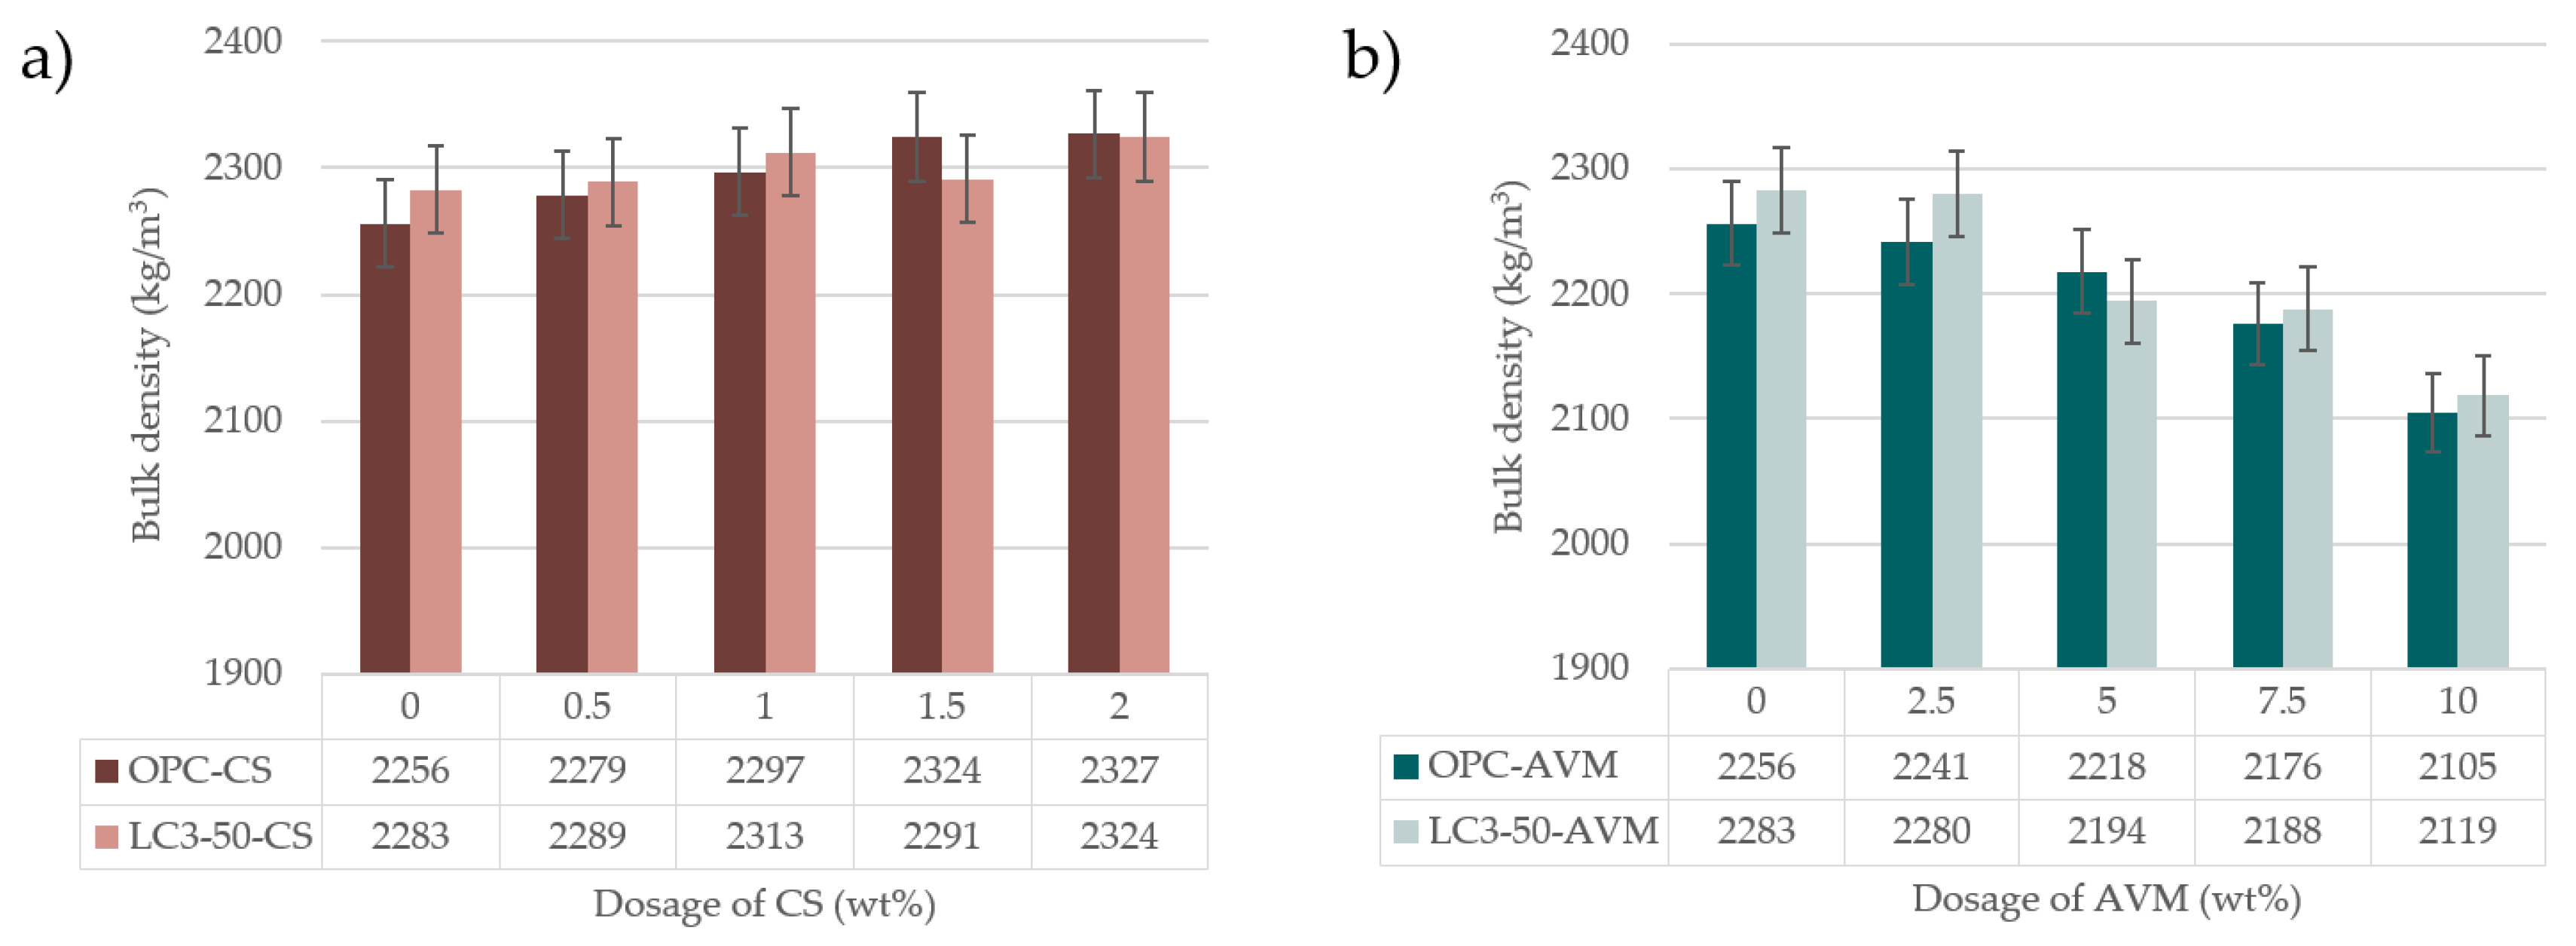
The influence of the used superplasticizers on the bulk density of OPC and LC3 systems cured for 28 days in water and dried at 50 °C prior to testing is shown in Figure 7.
When the CS was added to the mixtures, the specimen density increased with its percentage dosage for both studied systems, as expected (Figure 7a). These results lie within the same range of bulk density of 2200–2400 kg/m3, as reported by Opara et al. [59]. Contrary to these results, the bulk density data from OPC and LC3 decreased with the addition of the AVM plasticizer with an increase in its dosage (Figure 7b). However, at 2.5 wt. % AVM in OPC and LC3 systems exhibited a range of densities for conventional structural concrete.
The results from CS dosage indicate that 2 wt. % dosage increased the density of OPC and LC3 specimens in reference to the control at 0 wt. % dosage by 3 % and 2 %, respectively. On the other hand, 2.5 wt. % AVM in OPC reduced the density by 1 % but in LC3 by 0 %. However, both systems recorded the lowest value of density at 10 wt. % AVM dosage. These results can be attributed to the nature and properties of concrete mixture constituents, such as the specific gravity of cement, limestone filler, CS, AVM, aggregates, and water-powder ratio, as discussed in more detail in [60].

4. Conclusions

In this experimental investigation, the effects of AVM on the fresh properties and mechanical performance of OPC and LC3-50 in producing SCC are presented. Based on the obtained results, the following conclusions can be drawn:
  • In the study, the setting time of OPC and LC3-50 was increased with the percentage dosage of AVM, indicating that AVM could play the role of a potential set retarder.
  • In terms of workability (slump flow, V-funnel, and L-Box), the results at 10 wt.% AVM dosage are well comparable with 2 wt.% of CS dosage in OPC and LC3-50 systems. AVM recorded a slump flow of 672.5 ± 23.25 mm and 656.5 ± 9 mm compared with the control for both OPC and LC3-50 cement systems.
  • From the yield stress results, it can be concluded that the percentage dosage of AVM relatively reduced the yield stress. This implies that AVM acts as a plasticizer and can be used to improve the workability and rheology of concrete systems.
  • In the case of the compressive strength, AVM only improved this properly at very small dosages of 2.5 wt.%, by 42.45 ± 1.04 MPa of OPC and 28.59 ± 1.39 MPa of LC3-50 at 28 days. A further increase in dosage reduces overall compressive strength for both systems. The findings suggest that AVM is not a set accelerator in concrete systems when used if added in large volumes. However, at 7.5 wt.%, the dosage of AVM to concrete recorded allowable structural concrete strength [28] of 30.92 ± 1.55 MPa MPa and 19.85 ± 0.99 MPa MPa for OPC and LC3-50 systems after water curing for 28 days, respectively.
  • The density of SCC concrete prepared using 2.5 wt.% of AVM resulted in a bulk density comparable to conventional structural concrete, but it reduced with an increase in AVM contents.
  • The findings overall suggest that AVM is a potential admixture for making SCC at 7.5 wt.% addition to concrete as the mix achieved a flow of 633.5 ± 32.25 mm and 667 ± 15.75 mm, V-funnel of 9 and 8 seconds and L-box blocking ratio of 0.81 and 0.82 for OPC and LC3-50 systems, and provided allowable structural concrete strength. Nevertheless, the long-term durability properties of such SCC should be evaluated.

Author Contributions

Conceptualization, A.N.O..; methodology, A.N.O., J.M, and J.M.M; software, A.N.O., and L.S.; validation, S.A., J.M., and J.M.M..; formal analysis, A.N.O.; investigation, A.N.O., and J.M.M.; resources, A.N.O., J.M., and J.M.M.; data curation, L.S.; writing—original draft preparation, A.N.O., and L.S.; writing—review and editing, L.S..; visualization, J.M.M., and L.S.; supervision, S.A., J.M. and J.M.M; project administration, L.S.; funding acquisition, A.N.O,. and L.S. All authors have read and agreed to the published version of the manuscript.

Funding

This research was funded by MERU UNIVERSITY OF SCIENCE AND TECHNOLOGY from the 7th Internal Call (Grant No. 12) and by the CZECH SCIENCE FOUNDATION, grant number 20-14506S.

Institutional Review Board Statement

Not applicable.

Informed Consent Statement

Not applicable.

Data Availability Statement

The data presented in this study are available on request.

Acknowledgments

The authors acknowledge Meru University of Science and Technology, East Africa Portland Cement, Materials Testing and Research Division, Meru, and University of Nairobi for offering laboratories to conduct this research.

Conflicts of Interest

The authors of this manuscript declare no conflict of interest.

References

  1. Kiran, K.; Naresh, J. Determination of fresh and hardened state properties of Self Compacting Concrete using GGBFS and RHA. IJIRSET 2018. [Google Scholar] [CrossRef]
  2. Siddique, R. Self-compacting concrete: materials, properties and applications; Woodhead Publishing: 2019.
  3. Karakurt, C.; Dumangöz, M.J.M. Rheological and durability properties of self-compacting concrete produced using marble dust and blast furnace slag. Materials 2022, 15, 1795. [Google Scholar] [CrossRef]
  4. Dey, S.; Kumar, V.V.P.; Goud, K.R.; Basha, S.K.J. State of art review on self compacting concrete using mineral admixtures. J. Build. Pathol. Rehabil. 2021, 6, 18. [Google Scholar] [CrossRef]
  5. Shi, C.; Wu, Z.; Lv, K.; Wu, L.J.C.; Materials, B. A review on mixture design methods for self-compacting concrete. Constr. Build. Mater. 2015, 84, 387–398. [Google Scholar] [CrossRef]
  6. Okamura, H.; Ouchi, M. Self-compacting concrete. J. Adv. Concr. Technol. 2003, 1, 5–15. [Google Scholar] [CrossRef]
  7. Tejaswini, G.L.S.; Rao, A.V. A detailed report on various behavioral aspects of self-compacting concrete. Mater. Today: Proc. 2020, 33, 839–844. [Google Scholar]
  8. Kumar, M.A.; Magesh, R.; Selvapraveen, S.; Vignesh, M. Assessment on fresh properties and hardened properties of self compacting concrete. AIP Conf. Proc. 2020. [Google Scholar]
  9. Meko, B.; Ighalo, J.O.; Ofuyatan, O.M. Enhancement of self-compactability of fresh self-compacting concrete: A review. Clean. Mater. 2021, 1, 100019. [Google Scholar] [CrossRef]
  10. Kalaimani, R.; Subha, C.; Reymond, D.J. Investigation on Strength Characteristics of Self Compacting Concrete incorporated with AR Glass Fibers. E3S Web Conf. 2023, 03005. [Google Scholar] [CrossRef]
  11. Mahajan, G. experimental investigation on properties of self compacting concrete using mineral admixtures. ir.aiktclibrary.org 2016. [Google Scholar]
  12. Scrivener, K.; Martirena, F.; Bishnoi, S.; Maity, S. Calcined clay limestone cements (LC3). Cem. Concr. Res. 2018, 114, 49–56. [Google Scholar] [CrossRef]
  13. Kafodya, I.; Basuroy, D.; Marangu, J.M.; Kululanga, G.; Maddalena, R.; Novelli, V.I. Mechanical performance and physico-chemical properties of limestone calcined clay cement (LC3) in Malawi. Buildings 2023, 13, 740. [Google Scholar] [CrossRef]
  14. Marangu, J.M. Physico-chemical properties of Kenyan made calcined Clay-Limestone cement (LC3). Case Stud. Constr. Mater. 2020, 12, e00333. [Google Scholar] [CrossRef]
  15. Marangu, J.M.; Riding, K.; Alaibani, A.; Zayed, A.; Thiong’o, J.K.; Wachira, J.M. Potential for selected kenyan clay in production of limestone calcined clay cement. In Proceedings of the Calcined Clays for Sustainable Concrete: Proceedings of the 3rd International Conference on Calcined Clays for Sustainable Concrete, 2020; pp. 19–25.
  16. Odhiambo, V.O.; Scheinherrová, L.; Abuodha, S.O.; Mwero, J.N.; Marangu, J.M. Effects of Alternate Wet and Dry Conditions on the Mechanical and Physical Performance of Limestone Calcined Clay Cement Mortars Immersed in Sodium Sulfate Media. Materials 2022, 15, 8935. [Google Scholar] [CrossRef]
  17. Muzenda, T.R.; Hou, P.; Kawashima, S.; Sui, T.; Cheng, X. The role of limestone and calcined clay on the rheological properties of LC3. Cem. Concr. Compos. 2020, 107, 103516. [Google Scholar] [CrossRef]
  18. Canbek, O.; Xu, Q.; Mei, Y.; Washburn, N.R.; Kurtis, K.E. Predicting the rheology of limestone calcined clay cements (LC3): Linking composition and hydration kinetics to yield stress through Machine Learning. Cem. Concr. Res. 2022, 160, 106925. [Google Scholar] [CrossRef]
  19. Athman, C.M.; Abuodha, S.O.; Nyomboi, T. USE of GUM Arabic as a Superplasticizer in Self-Compacting Concrete. IJISME 2018. [Google Scholar]
  20. Isik, I.E.; Ozkul, M.H. Materials, B. Utilization of polysaccharides as viscosity modifying agent in self-compacting concrete. Constr. Build. Mater. 2014, 72, 239–247. [Google Scholar] [CrossRef]
  21. Oni, D.; Mwero, J.; Kabubo, C. The effect of cassava starch on the durability characteristics of concrete. Open J. Civ. Eng. 2020, 14. [Google Scholar] [CrossRef]
  22. Surjushe, A.; Vasani, R.; Saple, D.J. Aloe vera: a short review. Indian J. Dermatol. 2008, 53, 163. [Google Scholar] [CrossRef]
  23. Pegu, A.J.; Sharma, M.A. Review on Aloe vera. Int. J. Trend. Sci. Res. Dev. 2019, 3, 35–40. [Google Scholar] [CrossRef]
  24. Aburto-Moreno, Z.; Alvarado-Quintana, H.; Vásquez-Alfaro, I. Influencia del aloe-vera sobre la resistencia a la compresión, infiltración, absorción capilar, tiempo de fraguado y asentamiento en un concreto estructural. SCIENDO 2018, 21, 105–118. [Google Scholar] [CrossRef]
  25. Herrera-Hernandez, H.; Franco-Tronco, M.I.; Miranda-Hernandez, J.G.; Hernandez-Sanchez, E.; Espinoza-Vazquez, A.; Fajardo, G. Aloe-vera gel as potential corrosion inhibitor for concrete steel reinforcement. Avances en Ciencias e Ingeniería 2015, 6, 9–23. [Google Scholar]
  26. Oggu, A.; Madupu, L.N.K.S. Study on properties of porous concrete incorporating aloevera and marble waste powder as a partial cement replacement. Mater. Today: Proc. 2022, 52, 1946–1951. [Google Scholar] [CrossRef]
  27. ASTM. Standard Specification for Concrete Aggregates (ASTM C33/C33M-18). West Conshohocken: American Society for Testing and Materials; 2023.
  28. KS EAS 148-1, Cement — Test methods — Part 1: Determination of strength, Kenya Bureau of Standards, Nairobi, Kenya, 2017.
  29. ASTM. Standard Specification for Chemical Admixtures for Concrete (ASTM C494/C494M-17). West Conshohocken: American Society for Testing and Materials; 2017.
  30. EFNARC. The European Guidelines for Self-Compacting Concrete Specification, Production and Use. May, 2005.
  31. ASTM. Standard Test Method for Density (Unit Weight), Yield, and Air Content (Gravimetric) of Concrete (ASTM C138/C138M-17a). West Conshohocken: American Society for Testing and Materials; 2023.
  32. KS EAS 148-3, Cement-Test Methods Part 3: Determination of Setting Times and Soundness, Kenya Bureau of Standards, Nairobi, Kenya, 2017.
  33. ASTM. Standard Guide for Measurement of the Rheological Properties of Hydraulic Cementious Paste Using a Rotational Rheometer(ASTM C1749-17a). West Conshohocken: American Society for Testing and Materials; 2017.
  34. Pierre, A.; Lanos, C.; Estelle, P. Extension of spread-slump formulae for yield stress evaluation. Appl. Rheol. 2013, 23, 63849. [Google Scholar]
  35. Scheinherrová, L.; Pommer, V.; Vejmelková, E.; Černý, R. Comparison of water removal methods from cement paste at early age. In Proceedings of the AIP Conference Proceedings, 2021.
  36. Sebbar, N.; Bozzelli, J.W.; Bockhorn, H. Kinetic Study of Di-Tert-Butyl Peroxide: Thermal Decomposition and Product Reaction Pathways. Int. J. Chem. Kinet. 2015, 47, 133–161. [Google Scholar] [CrossRef]
  37. Moo-Young, M. Comprehensive biotechnology; Elsevier: 2019.
  38. Wakayama, T.; Ito, Y.; Sakai, K.; Miyake, M.; Shibata, E.; Ohno, H.; Kamijima, M. Comprehensive review of 2-ethyl-1-hexanol as an indoor air pollutant. J. Occup. Health 2019, 61, 19–35. [Google Scholar] [CrossRef] [PubMed]
  39. McGinty, D.; Scognamiglio, J.; Letizia, C.S.; Api, A.M. Fragrance material review on 2-ethyl-1-hexanol. FCT 2010, 48, S115–S129. [Google Scholar] [CrossRef] [PubMed]
  40. Ahmed, W.A.; Yarmo, A.; Salih, N.; Derawi, M.D.; Yusop, M.R.; Salimon, J. Synthesis and lubricity properties analysis of branched dicarboxylate esters based lubricant. MJAS 2015, 19, 106–117. [Google Scholar]
  41. Bodaghi, A. An overview on the recent developments in reactive plasticizers in polymers. Polym. Adv. Technol. 2020, 31, 355–367. [Google Scholar] [CrossRef]
  42. Stamatelatou, K.; Pakou, C.; Lyberatos, G. Occurrence, toxicity, and biodegradation of selected emerging priority pollutants in municipal sewage sludge. Compr. Biotech. 2011, 6, 473–484. [Google Scholar]
  43. Chemicals, A. “2-Ethylhexanol,” Information Society Services Human Resources. Available online: https://www.atamanchemicals.com/2-ethylhexanol_u24548/ (accessed on 12.12.2023).
  44. Wang, Y.; Qian, H. Phthalates and their impacts on human health. In Proceedings of the Healthcare; 2021; p. 603. [Google Scholar]
  45. Fan, Z.; Lin, L. Exposure science: contaminant mixtures. Ency. Envir. Health 2011. [Google Scholar]
  46. Bhandari, I.; Kumar, R.; Sofi, A.; Nighot, N.S. A systematic study on sustainable low carbon cement–Superplasticizer interaction: Fresh, mechanical, microstructural and durability characteristics. Heliyon 2023. [Google Scholar] [CrossRef] [PubMed]
  47. Flatt, R.J. Interparticle forces and superplasticizers in cement suspensions; Thesis. EPFL: 1999.
  48. Pan, J.; Feng, K.; Wang, P.; Chen, H.; Yang, W. Retardation and compressive strength enhancement effect of upcycling waste carrot as bio-admixture for cement mortars. J. Build. Eng. 2022, 62, 105402. [Google Scholar] [CrossRef]
  49. Singh, N.B.; Singh, S.P.; Sarvehi, R. Effect of phenols on the hydration of Portland cement. Adv. Cem. Res. 1989, 2, 43–47. [Google Scholar] [CrossRef]
  50. Zhu, W.; Feng, Q.; Luo, Q.; Bai, X.; Lin, X.; Zhang, Z. Effects of pce on the dispersion of cement particles and initial hydration. Materials 2021, 14, 3195. [Google Scholar] [CrossRef] [PubMed]
  51. Zhang, K.; Mezhov, A.; Schmidt, W. Effect of Polycarboxylate Superplasticizer in Ordinary Portland Cement and Sulfate Resistant Cement. J. Mater. Civ. Eng. 2023, 35, 04023113. [Google Scholar] [CrossRef]
  52. Yu, J.; Wu, H.-L.; Mishra, D.K.; Li, G.; Leung, C.K.Y. Compressive strength and environmental impact of sustainable blended cement with high-dosage Limestone and Calcined Clay (LC2). J. Clean. Prod. 2021, 278, 123616. [Google Scholar] [CrossRef]
  53. Bullard, J.W.; Jennings, H.M.; Livingston, R.A.; Nonat, A.; Scherer, G.W.; Schweitzer, J.S.; Scrivener, K.L.; Thomas, J. J Mechanisms of cement hydration. Cem. Concr. Res. 2011, 41, 1208–1223. [Google Scholar] [CrossRef]
  54. Scrivener, K.; Avet, F.; Maraghechi, H.; Zunino, F.; Ston, J.; Hanpongpun, W.; Favier, A. Impacting factors and properties of limestone calcined clay cements (LC3). Green Mater. 2018, 7, 3–14. [Google Scholar] [CrossRef]
  55. Chang, J.; Jiang, T.; Cui, K. Influence on compressive strength and CO2 capture after accelerated carbonation of combination β-C2S with γ-C2S. Constr. Build. Mater. 2021, 312, 125359. [Google Scholar] [CrossRef]
  56. Bederina, M.; Makhloufi, Z.; Bouziani, T. Effect of limestone fillers the physic-mechanical properties of limestone concrete. Phys. Procedia 2011, 21, 28–34. [Google Scholar] [CrossRef]
  57. Dhandapani, Y.; Santhanam, M.; Gettu, R.; Pillai, R. Perspectives on blended cementitious systems with calcined clay-limestone combination for sustainable low carbon cement transition. Indian Concr. J. 2020, 94, 31–45. [Google Scholar]
  58. Nalet, C.; Nonat, A. Effects of functionality and stereochemistry of small organic molecules on the hydration of tricalcium silicate. Cem. Concr. Res. 2016, 87, 97–104. [Google Scholar] [CrossRef]
  59. Opara, H.E.; Eziefula, U.G.; Eziefula, B.I. Comparison of physical and mechanical properties of river sand concrete with quarry dust concrete. SSP - J. Civ. Eng. 2018, 13, 127–134. [Google Scholar] [CrossRef]
  60. Hospodarova, V.; Junak, J.; Stevulova, N. Color pigments in concrete and their properties. Pollack Periodica 2015, 10, 143–151. [Google Scholar] [CrossRef]
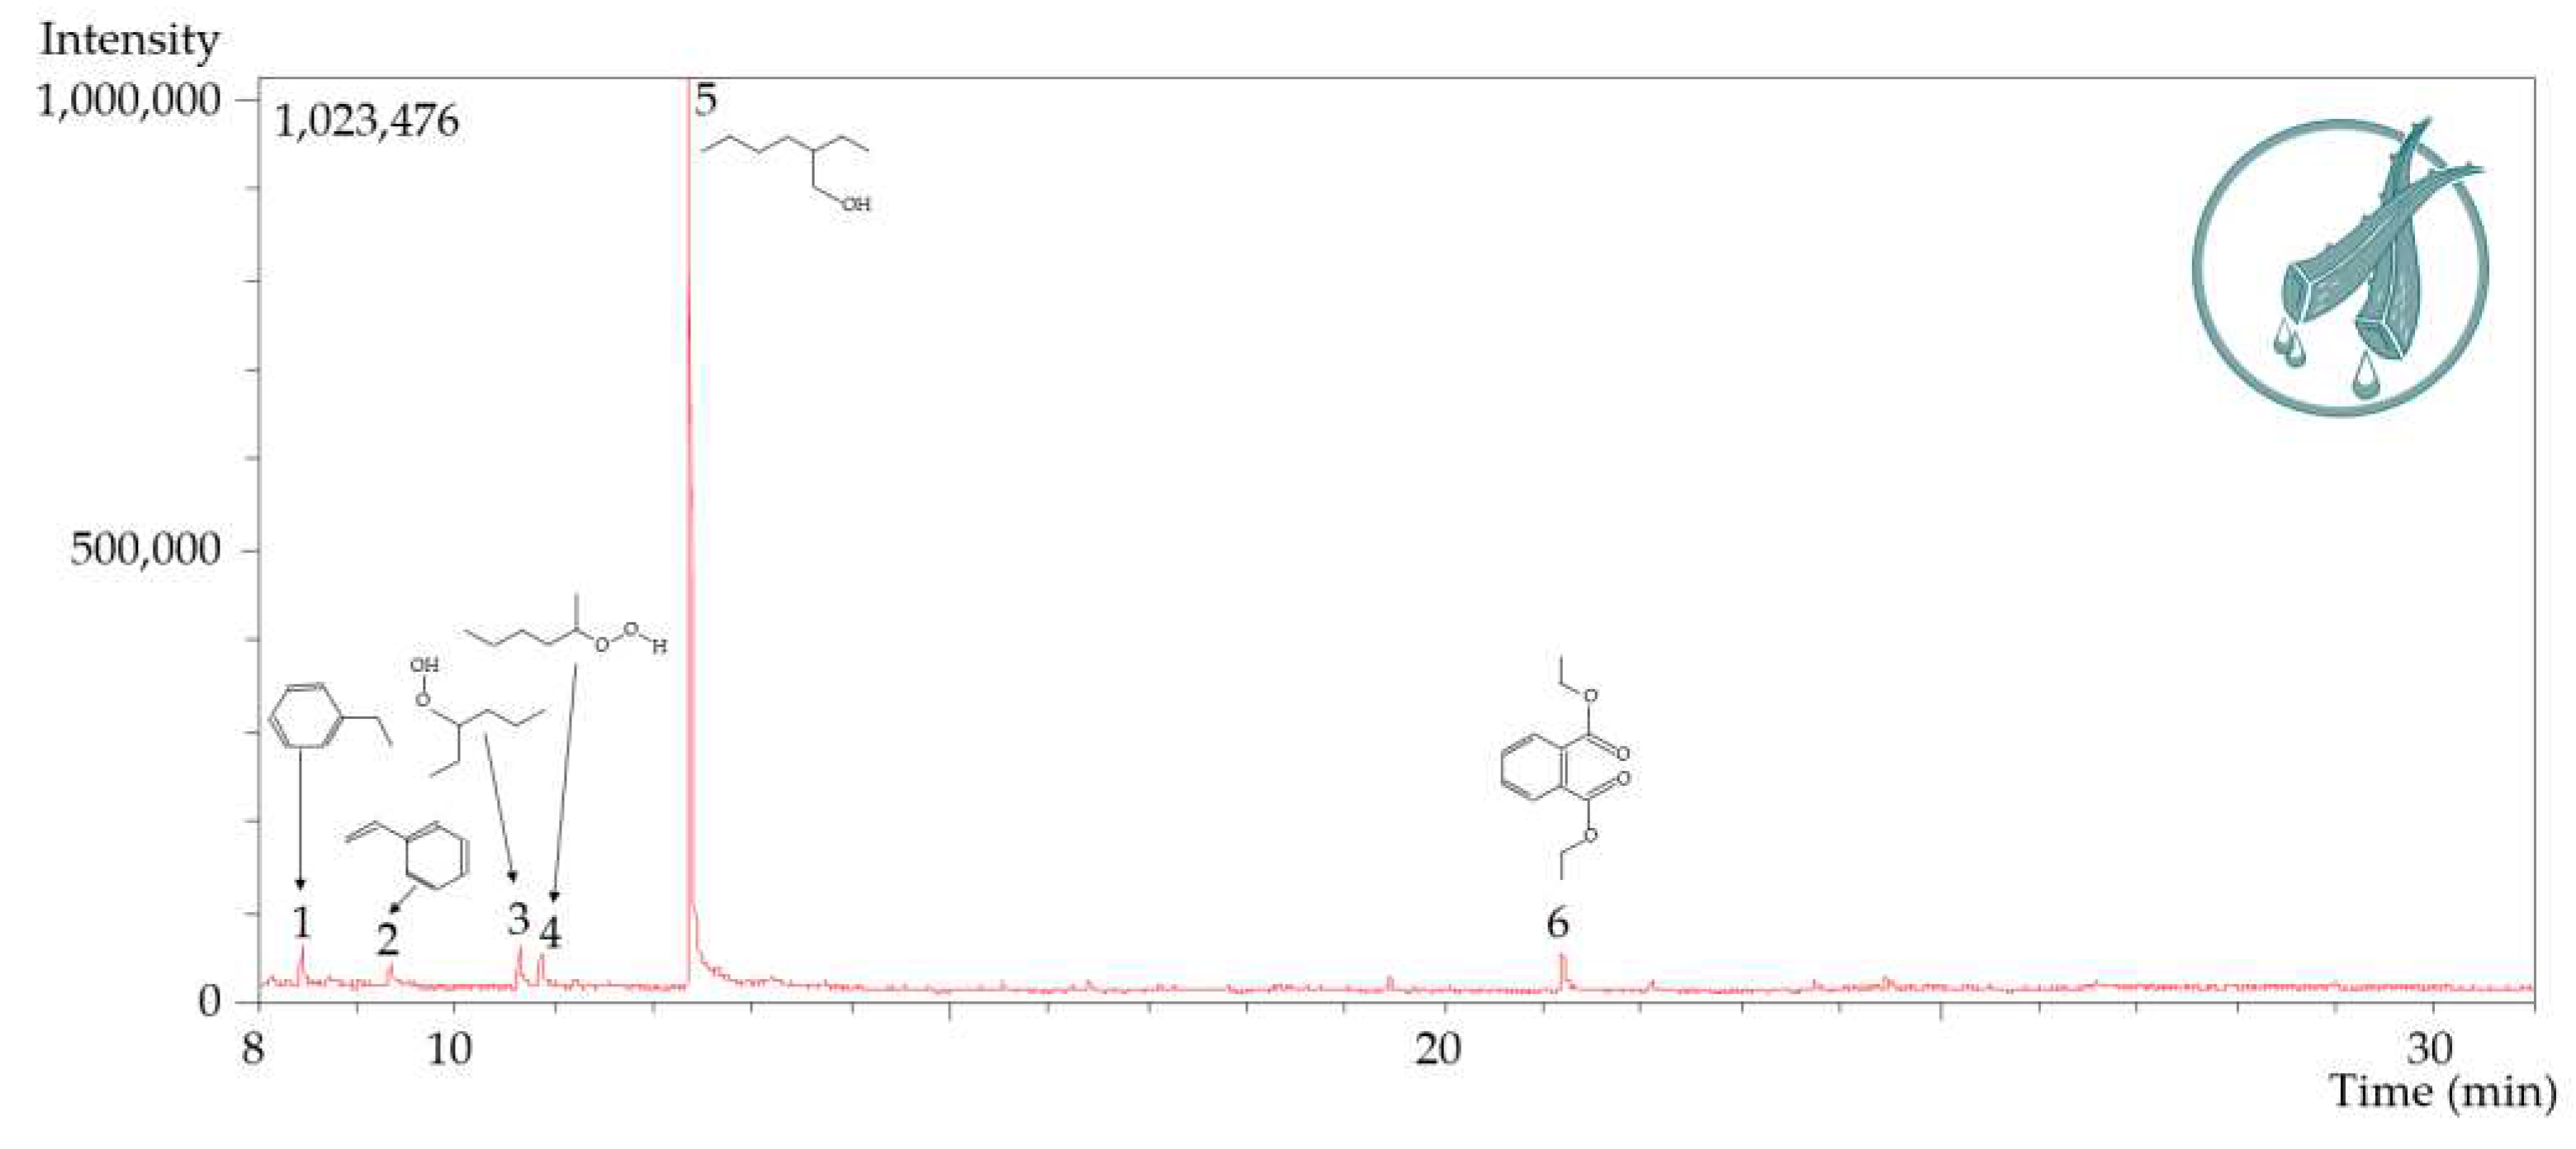
Figure 1. Organic peaks identified by GC-MS in the AVM sample.
Preprints 93298 g001
Figure 2. Consistency and setting times for the systems containing CS.
Preprints 93298 g002
Figure 3. Consistency and setting times for the systems containing AVM.
Preprints 93298 g003
Figure 4. Yield stress and slump flow results of the mixtures containing a) CS and b) AVM superplasticizers.
Preprints 93298 g004
Figure 5. Compressive strength development of a) OPC mixtures and b) LC3-50 blends containing commercial superplasticizer for up to 28 days.
Preprints 93298 g005
Figure 6. Compressive strength development of a) OPC mixtures and b) LC3-50 blends containing AVM superplasticizer for up to 28 days.
Preprints 93298 g006
Figure 7. Bulk density OPC mixtures and LC3-50 blends containing a) CS and b) AVM superplasticizers.
Preprints 93298 g007
Table 1. Chemical composition of the raw powders.
Raw material SO3 Al2O3 Fe2O3 CaO SiO2 MgO LOI
OPC 1.14 5.43 3.68 64.83 21.64 2.5 0.78
LC3-50 2.54 11.99 3.98 44.53 30.14 1.31 5.51
L 0.33 0.47 0.42 90.68 1.42 0.59 6.09
Table 2. Physiochemical properties of CS.
Description Property
Appearance Whitish to light brown clear to cloudy liquid
Specific gravity at 25 °C 1.073
pH value 5.0 – 7.0
Chloride content “chloride-free” to EN 934-2
Table 3. Mix design of the studied SCC.
Trials CA (kg/m3) FA (kg/m3) OPC/LC3-50 (kg/m3) L (kg/m3) w/c w/p CS/AVM
TR1 1078.00 562.13 363.38 224.22 0.43 0.8 1.82
TR2 1078.00 562.13 363.38 224.22 0.48 0.9 3.63
TR3 970.20 644.57 331.41 204.49 0.48 0.9 4.97
TR4 862.40 732.64 351.14 216.67 0.48 0.8 3.51
TR5 862.40 732.64 351.14 216.67 0.48 0.9 7.02
TR6 970.20 644.57 331.41 204.49 0.48 0.9 4.97
TR7 970.20 644.57 331.41 204.49 0.48 0.9 6.62
TR8 970.20 644.57 331.41 204.49 0.50 1.0 4.97
TR9 970.20 644.57 331.41 204.49 0.48 0.9 6.62
Table 4. Slump flow, L-box Test, and V-funnel results of the designed SCC.
Trials d (mm) Relative Slump H2/H1 (mm) V-funnel (Sec) Observations* Further testing
TR1 398.5 0.99 0 15+ S No
TR2 432.5 1.16 0 15+ S No
TR3 615.0 2.07 0.68 8 F; S-V No
TR4 497.5 1.49 0 15 S No
TR5 762.5 2.81 0.88 6 F; B No
TR6 515.0 1.57 0.18 13 H-V No
TR7 672.5 2.36 0.81 8 F Yes
TR8 762.5 2.81 0.83 5 F; B No
TR9 659.0 2.30 0.20 6 F; B No
* B – Bleeding; F – Flowable; H-V – Highly viscous; S – Stiff; S-V – Slightly viscous.
Table 5. Compounds in Aloe Barbadensis as identified in the GC-MS analysis.
Peak Report TIC
Peak# R.Time Area Area% Height Height % Name
1 8.465 84270 4.12 42596 3.75 Ethylbenzene
2 9.356 73891 3.61 23475 2.07 Styrene
3 10.649 87366 4.27 44871 3.96 Hydroperoxide, 1-ethylbutyl
4 10.867 57727 2.82 30394 2.68 Hydroperoxide, 1-methylpentyl
5 12.376 1651585 80.74 956651 84.33 1-Hexanol, 2-ethyl-
6 21.189 90686 4.43 36440 3.21 Diethyl Phthalate
Table 6. Impact of CS on slump flow, V-funnel, and L-box test results.
Mix type % CS
dosage
Slump
flow (mm)
V-funnel
(sec)
L-Box
(h2/h1)
Observations
OPC-CS 0 452.5 No flow 0 No flow
0.5 572.5 High viscosity 0 No flow
1 639.5 11 0.46 Flowing but viscous
1.5 668.5 9 0.88 Flowing, no bleeding
2 681.5 8 0.94 Flowing
LC3-50-CS 0 404.5 No flow 0 No flow
0.5 472.0 High viscosity 0 No flow
1 583.0 13 0.43 Flowing but viscous
1.5 647.5 10 0.60 Flowing
2 666.0 9 0.88 Flowing
Table 7. Impact of AVM on slump flow, V-funnel, and L-box test results.
Mix Type % AVM
dosage
Slump
Flow (mm)
V-funnel
(sec)
L-Box
(h2/h1)
Observations
OPC-AVM 0 389.0 No flow 0 No flow
2.5 505.0 High viscosity 0 No flow
5 534.0 14 0 Highly viscous
7.5 633.5 9 0.81 Flowing
10 697.0 5 0.83 Flowing
LC3-50-AVM 0 404.5 No flow 0 No flow
2.5 555.0 High viscosity 0 No flow
5 596.5 14 0 Highly viscous
7.5 651.0 8 0.82 Flowing
10 682.5 5 0.94 Flowing
Disclaimer/Publisher’s Note: The statements, opinions and data contained in all publications are solely those of the individual author(s) and contributor(s) and not of MDPI and/or the editor(s). MDPI and/or the editor(s) disclaim responsibility for any injury to people or property resulting from any ideas, methods, instructions or products referred to in the content.
Copyright: This open access article is published under a Creative Commons CC BY 4.0 license, which permit the free download, distribution, and reuse, provided that the author and preprint are cited in any reuse.
Prerpints.org logo

Preprints.org is a free preprint server supported by MDPI in Basel, Switzerland.

Subscribe

© 2024 MDPI (Basel, Switzerland) unless otherwise stated