Submitted:
14 December 2023
Posted:
15 December 2023
You are already at the latest version
Abstract
Keywords:
1. Introduction
2. Materials and Methods
2.1. Films Depositions by Electron Beam Evaporation
2.2. Structure and Morphology Characterization
2.3. Gas sensing
3. Results and Discussion
4. Conclusions
Author Contributions
Funding
Acknowledgments
References
- Bassous, N.J.; Rodriguez, A.C.; Leal, C.I.L.; Jung, H.Y.; Lee, C.K.; Joo, S.; Kim, S.; Yun, C.; Hahm, M.G.; Ahn, M.-H.; Kim, S.-W.; Oh, Y.S. and Shin, S.R. Significance of Various Sensing Mechanisms for Detecting Local and Atmospheric Greenhouse Gases: A Review. Adv. Sensor Res. 2023; 2300094. [Google Scholar] [CrossRef]
- Nazaroff, W.W.; Weschler, C.J. Indoor ozone: Concentrations and influencing factors. Indoor Air. 2022, 32:e12942. [CrossRef]
- Salonen, H.; Salthammer, T.; Morawska, L. Human exposure to ozone in school and office indoor environments. Environ. Int. 2018, 119: 503-514. [CrossRef]
- Burratti, L.; Bolli, E.; Casalboni, M.; De Matteis, F.; Mochi, F.; Francini, R. et al. Synthesis of Fluorescent Ag Nanoclusters for Sensing and Imaging Applications. Mater. Sci. Forum. 2018, 941:2243–8. [CrossRef]
- Neri, G. First Fifty Years of Chemoresistive Gas Sensors. Chemosensors. 2015, 3, 1–20. [Google Scholar] [CrossRef]
- Yoon, J.W.; Grilli, M.L.; Di Bartolomeo, E.; Polini, R and Traversa, E. The NO2 response of solid electrolyte sensors made using nano-sized LaFeO3 electrodes. Sens. Actuators B Chem. 2001, 76, (1–3): 483-488. [CrossRef]
- Chopra K, Kaur I. Thin Film Device Applications. Springer US; 1983.
- Bellucci, A.; Mastellone, M.; Girolami, M.; Orlando, S.; Medici, L.; Mezzi, A.; Kaciulis, S.; Polini, R.; Trucchi, D.M. ZnSb-based thin films prepared by ns-PLD for thermoelectric applications. Appl. Surf. Sci. 2017; 418, 589–593. [Google Scholar] [CrossRef]
- Mezzi, A.; Bolli, E.; Kaciulis, S.; Bellucci, A.; Paci, B.; Generosi, A.; Mastellone, M.; Serpente, V.; Trucchi, D.M. Multi-Technique Approach for Work Function Exploration of Sc2O3 Thin Films. Nanomaterials. 2023, 13, 1430. [Google Scholar] [CrossRef] [PubMed]
- Hee-Tae Jung. The present and the future of Gas Sensors. ACS Sensors. 2022, 7 (4): 912-913. [CrossRef]
- Bochenkov, V. E. and G. B. SergeeV. Sensitivity, Selectivity, and Stability of Gas-Sensitive Metal-Oxide Nanostructures. 2010.
- Serpente, V.; Girolami, M.; Mastellone, M.; Sabbatella, G.; Vitulano, A.; Staccioli, M.P.; Riccucci, C.; Di Carlo, G.; Trucchi, D.M. Selective flexible sensor for monitoring volatile organic compounds in museum display cases. J. Cult. Herit. 2024, 66: 1-9. [CrossRef]
- Bogue, R. Emerging applications driving innovations in gas sensing. Sens. Rev. 2017, 37, 2. [Google Scholar] [CrossRef]
- Rose, K.; Eldridge, S.; Chapin, L. The internet of things: An overview. The internet society (ISOC), 2015; 80, 1–50. [Google Scholar]
- Yuan, H.; Aljneibi, S.A.A.A.; Yuan, J.; Wang, Y.; Liu, H.; Fang, J.; Tang, C.; Yan, X.; Cai, H.; Gu, Y.; et al. ZnO nanosheets abundant in oxygen vacancies derived from metal-organic frameworks for ppb-level gas sensing. Adv. Mater. 2019, 31, 1807161. [Google Scholar] [CrossRef] [PubMed]
- Elger, A.; Hess, C. Elucidating the Mechanism of Working SnO2 Gas Sensors Using Combined Operando UV/Vis, Raman, and IR Spectroscopy. Angew. Chem. Int. Ed. 2019, 58, 15057–15061. [Google Scholar] [CrossRef]
- Ma, J.; Ren, Y.; Zhou, X.; Liu, L.; Zhu, Y.; Cheng, X.; Xu, P.; Li, X.; Deng, Y.; Zhao, D. Pt nanoparticles sensitized ordered mesoporous WO3 semiconductor: Gas sensing performance and mechanism study. Adv. Funct. Mater. 2018, 28, 1705268. [Google Scholar] [CrossRef]
- Dey, Ananya. Semiconductor metal oxide gas sensors: A review. Mater. Sci. Eng. B. 2018, 229, 206-217. [CrossRef]
- Goel, N.; Kunal, K.; Kushwaha, A.; Kuma, M. Metal oxide semiconductors for gas sensing. Eng. Rep. 2022, e12604. [Google Scholar] [CrossRef]
- Isaac, N.A.; Pikaar, I.; Biskos, G. Metal oxide semiconducting nanomaterials for air quality gas sensors: Operating principles, performance, and synthesis techniques. Mikrochim Acta. 2022, 189, 196. [Google Scholar] [CrossRef] [PubMed]
- Rescalli, A.; Marzorati, D.; Gelosa, S.; Cellesi, F.; Cerveri, P. Temperature Modulation of MOS Sensors for Enhanced Detection of Volatile Organic Compounds. Chemosensors. 2023, 11, 501. [Google Scholar] [CrossRef]
- Xue, S.; Cao, S.; Huang, Z.; Yang, D.; Zhang, G. Improving Gas-Sensing Performance Based on MOS Nanomaterials: A Review. Materials. 2021, 14, 4263. [Google Scholar] [CrossRef] [PubMed]
- Mitra, P.; Chatterjee, A.P.; Maiti, H.S. ZnO thin film sensor. Mater. Lett. 1998, 35 (1–2)1998: 33-38. [CrossRef]
- Gaiardo, A.; Fabbri, B.; Giberti, A.; Guidi, V.; Bellutti, P.; Malagù, C.; Valt, M.; Pepponi, G.; Gherardi, S.; Zonta, G.; Martucci, A.; Sturaro, M.; Landini, N. ZnO and Au/ZnO thin films: Room-temperature chemoresistive properties for gas sensing applications. Sens. Actuators B Chem. 2016, 237: 1085-1094. [CrossRef]
- Aydın, H.; Yakuphanoglu, F.; Aydın, C. Al-doped ZnO as a multifunctional nanomaterial: Structural, morphological, optical and low-temperature gas sensing properties. J. Alloys Compd. 2019, 773: 802-811. [CrossRef]
- Wang, Z.; Bu, M.; Hu, N.; Zhao, L. An overview on room-temperature chemiresistor gas sensors based on 2D materials: Research status and challenge. Compos. B. Eng. 2023; 248, 110378. [Google Scholar] [CrossRef]
- Kumar, R.R.; Raja Sekhar, M.; Raghvendra et al. Comparative studies of ZnO thin films grown by electron beam evaporation, pulsed laser and RF sputtering technique for optoelectronics applications. Appl. Phys. A. 2020, 126, 859. [CrossRef]
- Ihokura, K. & Watson, J. The Stannic Oxide Gas Sensor Principles and Applications (1st ed.). CRC Press. 1994. [CrossRef]
- Birkefeld, L.D.; Azad, A.M.; Akbar, S.A. Carbon Monoxide and Hydrogen Detection by Anatase Modification of Titanium Dioxide. J. Am. Ceram. Soc. 1992, 75, 2964–2968. [Google Scholar] [CrossRef]
- Meng, L.J.; de Sá, C.P.M.; Dos Santos, M.P. Study of the structural properties of ZnO thin films by x-ray photoelectron spectroscopy. Appl. Surf. Sci. 1994, 78, 57–61. [Google Scholar] [CrossRef]
- Manjón, F. J.; Marí, B.; Serrano, J.; Romero, A.H. Silent Raman modes in zinc oxide and related nitrides. J. Appl. Phys. 2005; 97, 053516. [Google Scholar] [CrossRef]
- Wang, Z.; Qiu, X.; Shi, J.; Yu, H. Room Temperature Ozone Detection using ZnO based Film Bulk Acoustic Resonator (FBAR). Electrochem. Soc. 2011; 159, J13. [Google Scholar] [CrossRef]
- Takata, M.; Tsubone, D.; Yanagida, H. Dependence of electricalconductivity of ZnO, degree of sensing. J. Am. Ceram. Soc. 1976, 59, 4–8. [Google Scholar] [CrossRef]
- Tzolov, M.; Tzenov, N.; Dimova-Malinovska, D.; Kalitzova, M.; Pizzuto, C.; Vitali, G.; Zollo, G.; Ivanov, I. Vibrational properties and structure of undoped and Al-doped ZnO films deposited by RF magnetron sputtering. Thin Solid Films, 2000; 379, 28–36. [Google Scholar] [CrossRef]
- Venkatesh, P.S.; Ramakrishnan, V.; Jeganathan, K. Raman silent modes in vertically aligned undoped ZnO nanorods. Physica B Condens. Matter. 2016, 481, 204–8. [Google Scholar] [CrossRef]
- Venkatesh, P.S.; Jeganathan, K. Investigations on the growth and characterization of vertically aligned zinc oxide nanowires by radio frequency magnetron sputtering. J. Solid State Chem. 2013; 200, 84–89. [Google Scholar] [CrossRef]
- Venkatesh, P.S.; Purushothaman, V.; Muthu, S.E.; Arumugam, S.; Ramakrishnan, V.; Jeganathan, K.; Ramamurthi, K. Role of point defects on the enhancement of room temperature ferromagnetism in ZnO nanorods. Cryst. Eng. Comm. 2012; 14, 4713–4718. [Google Scholar] [CrossRef]
- Ashrafi, A.; Jagadish, C. Review of zincblende ZnO: Stability of metastable ZnO phases. J. Appl. Phys. 2007; 102, 071101. [Google Scholar] [CrossRef]
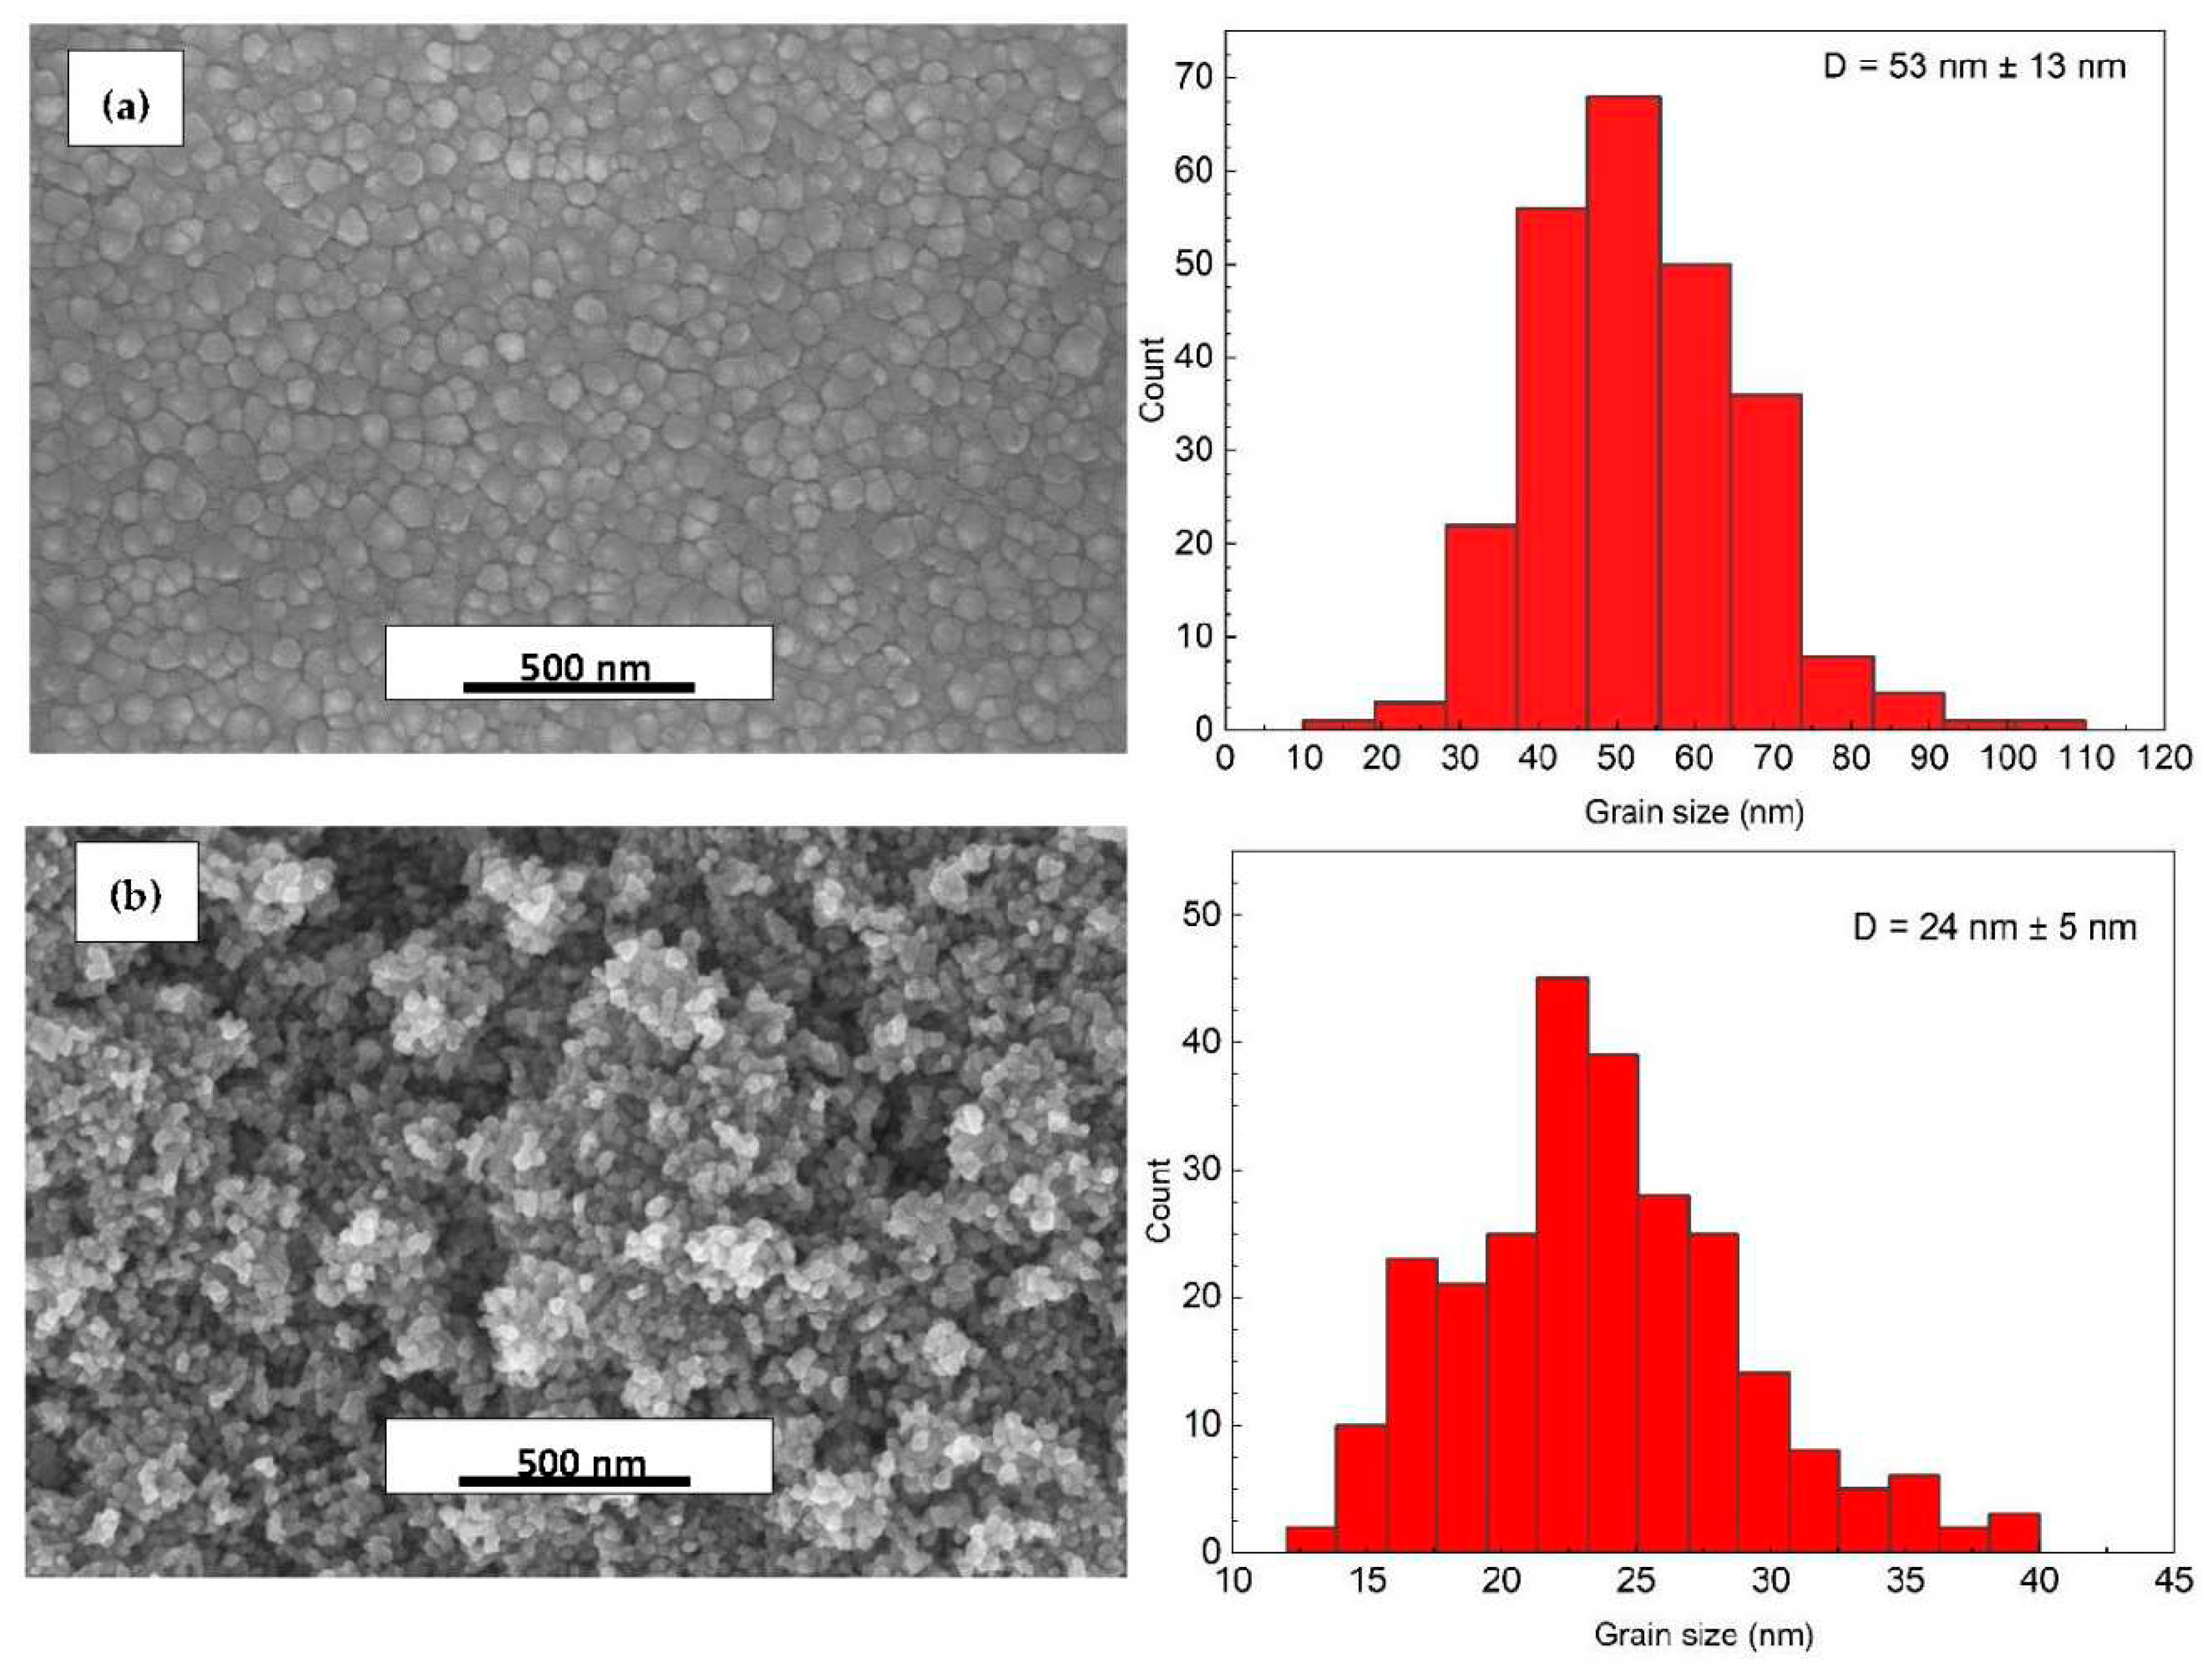
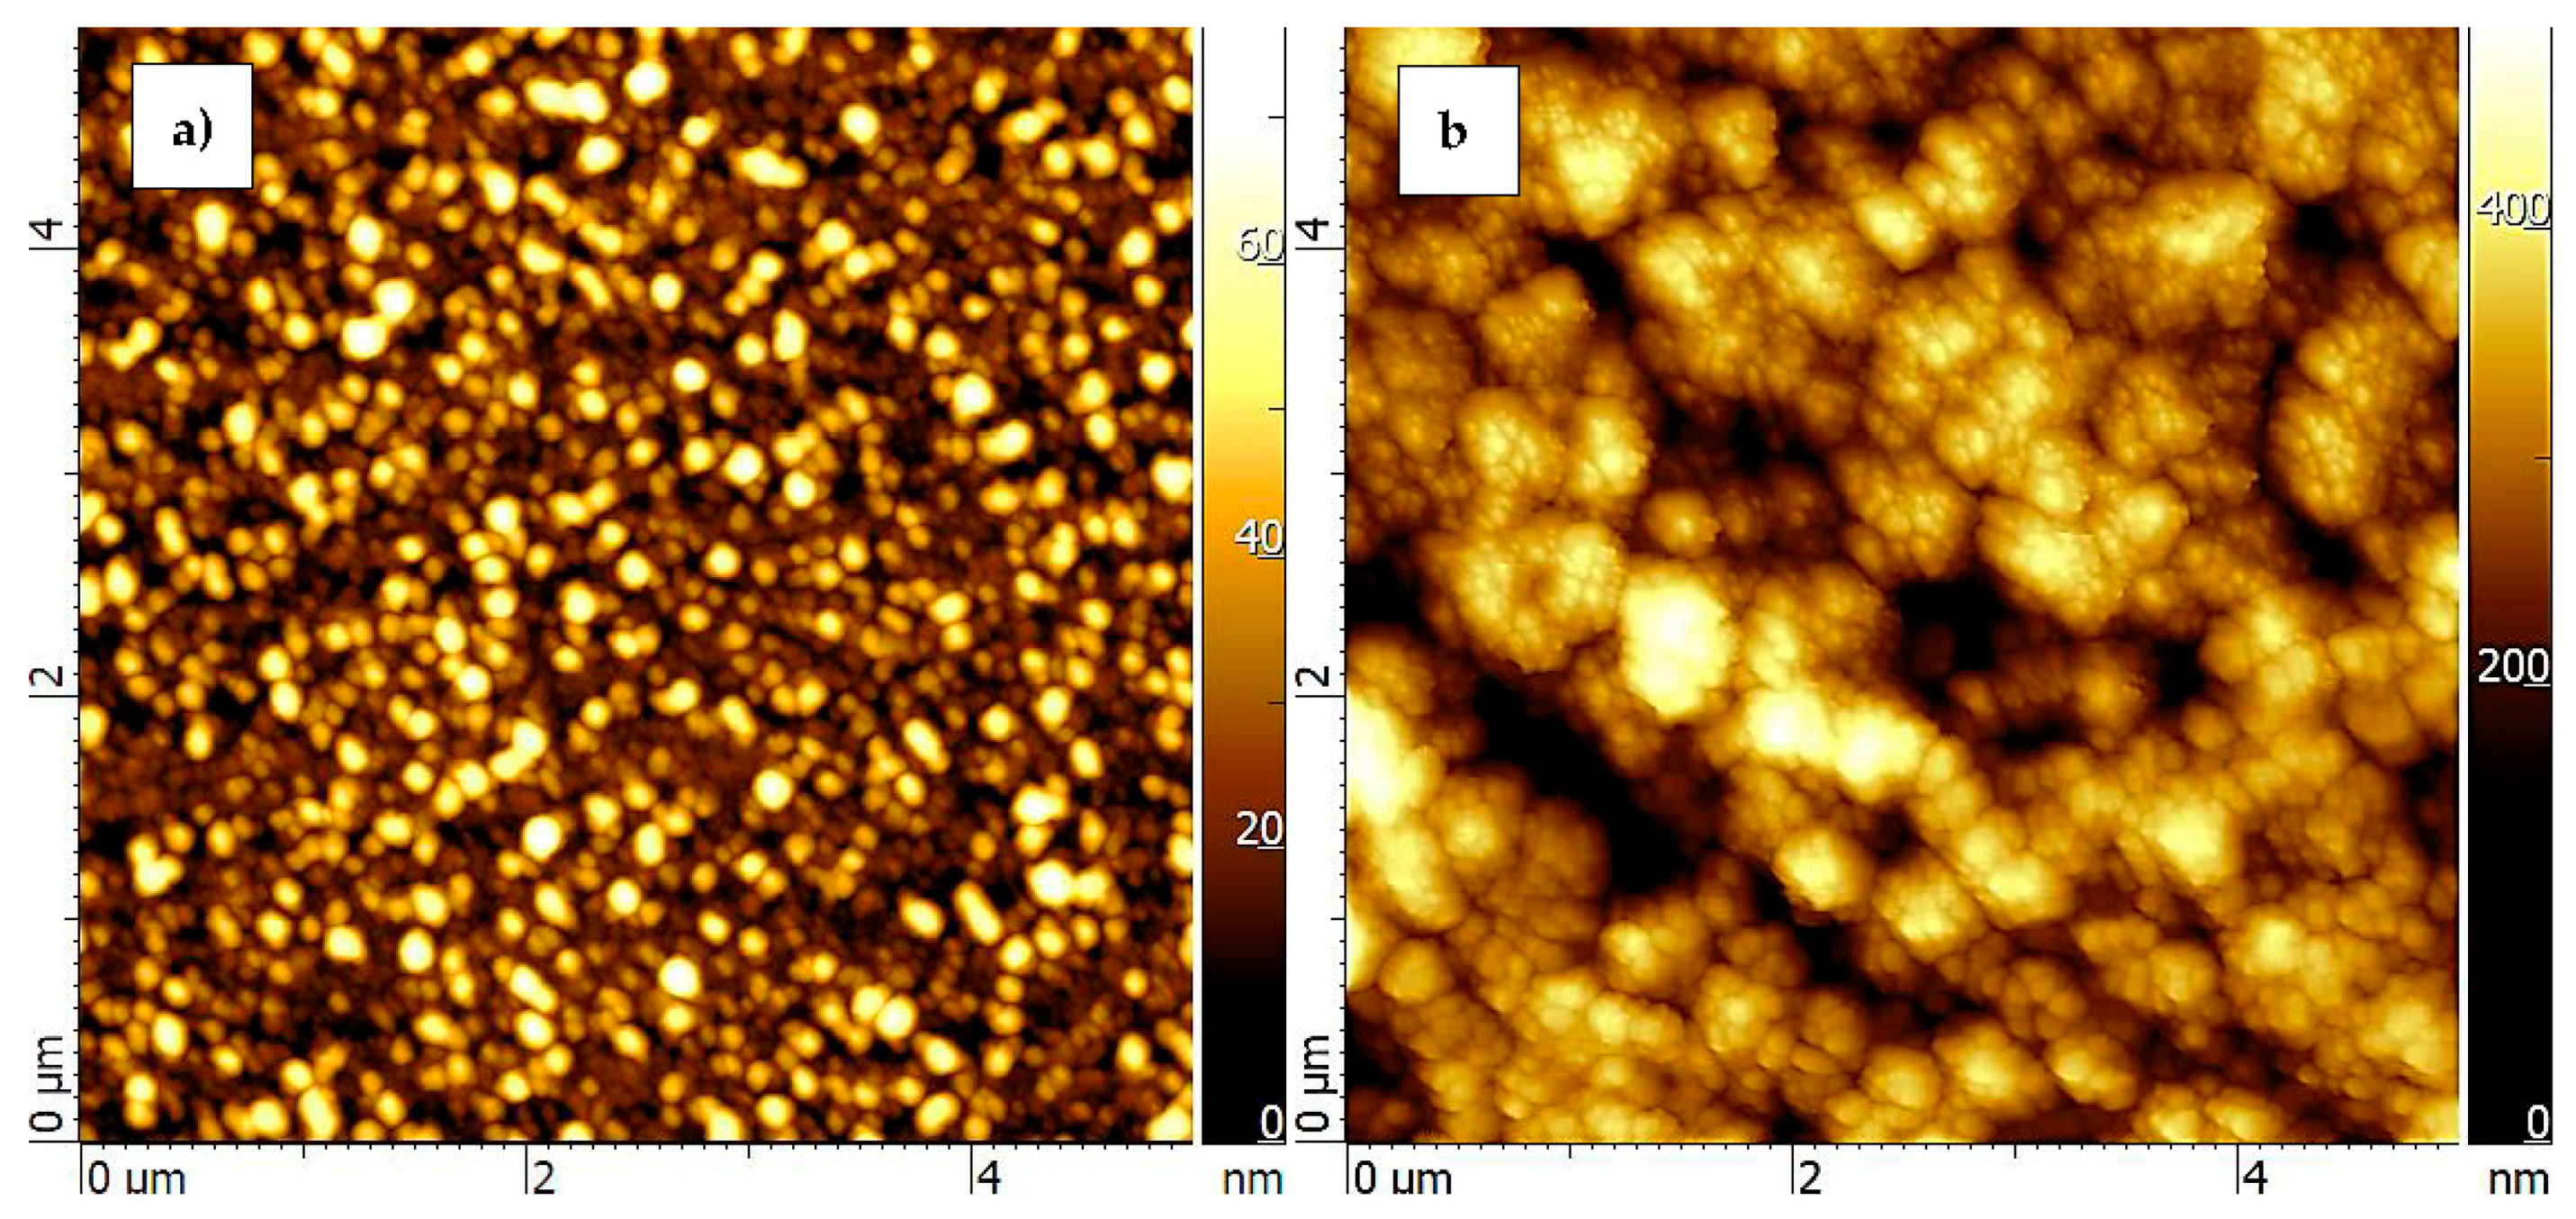
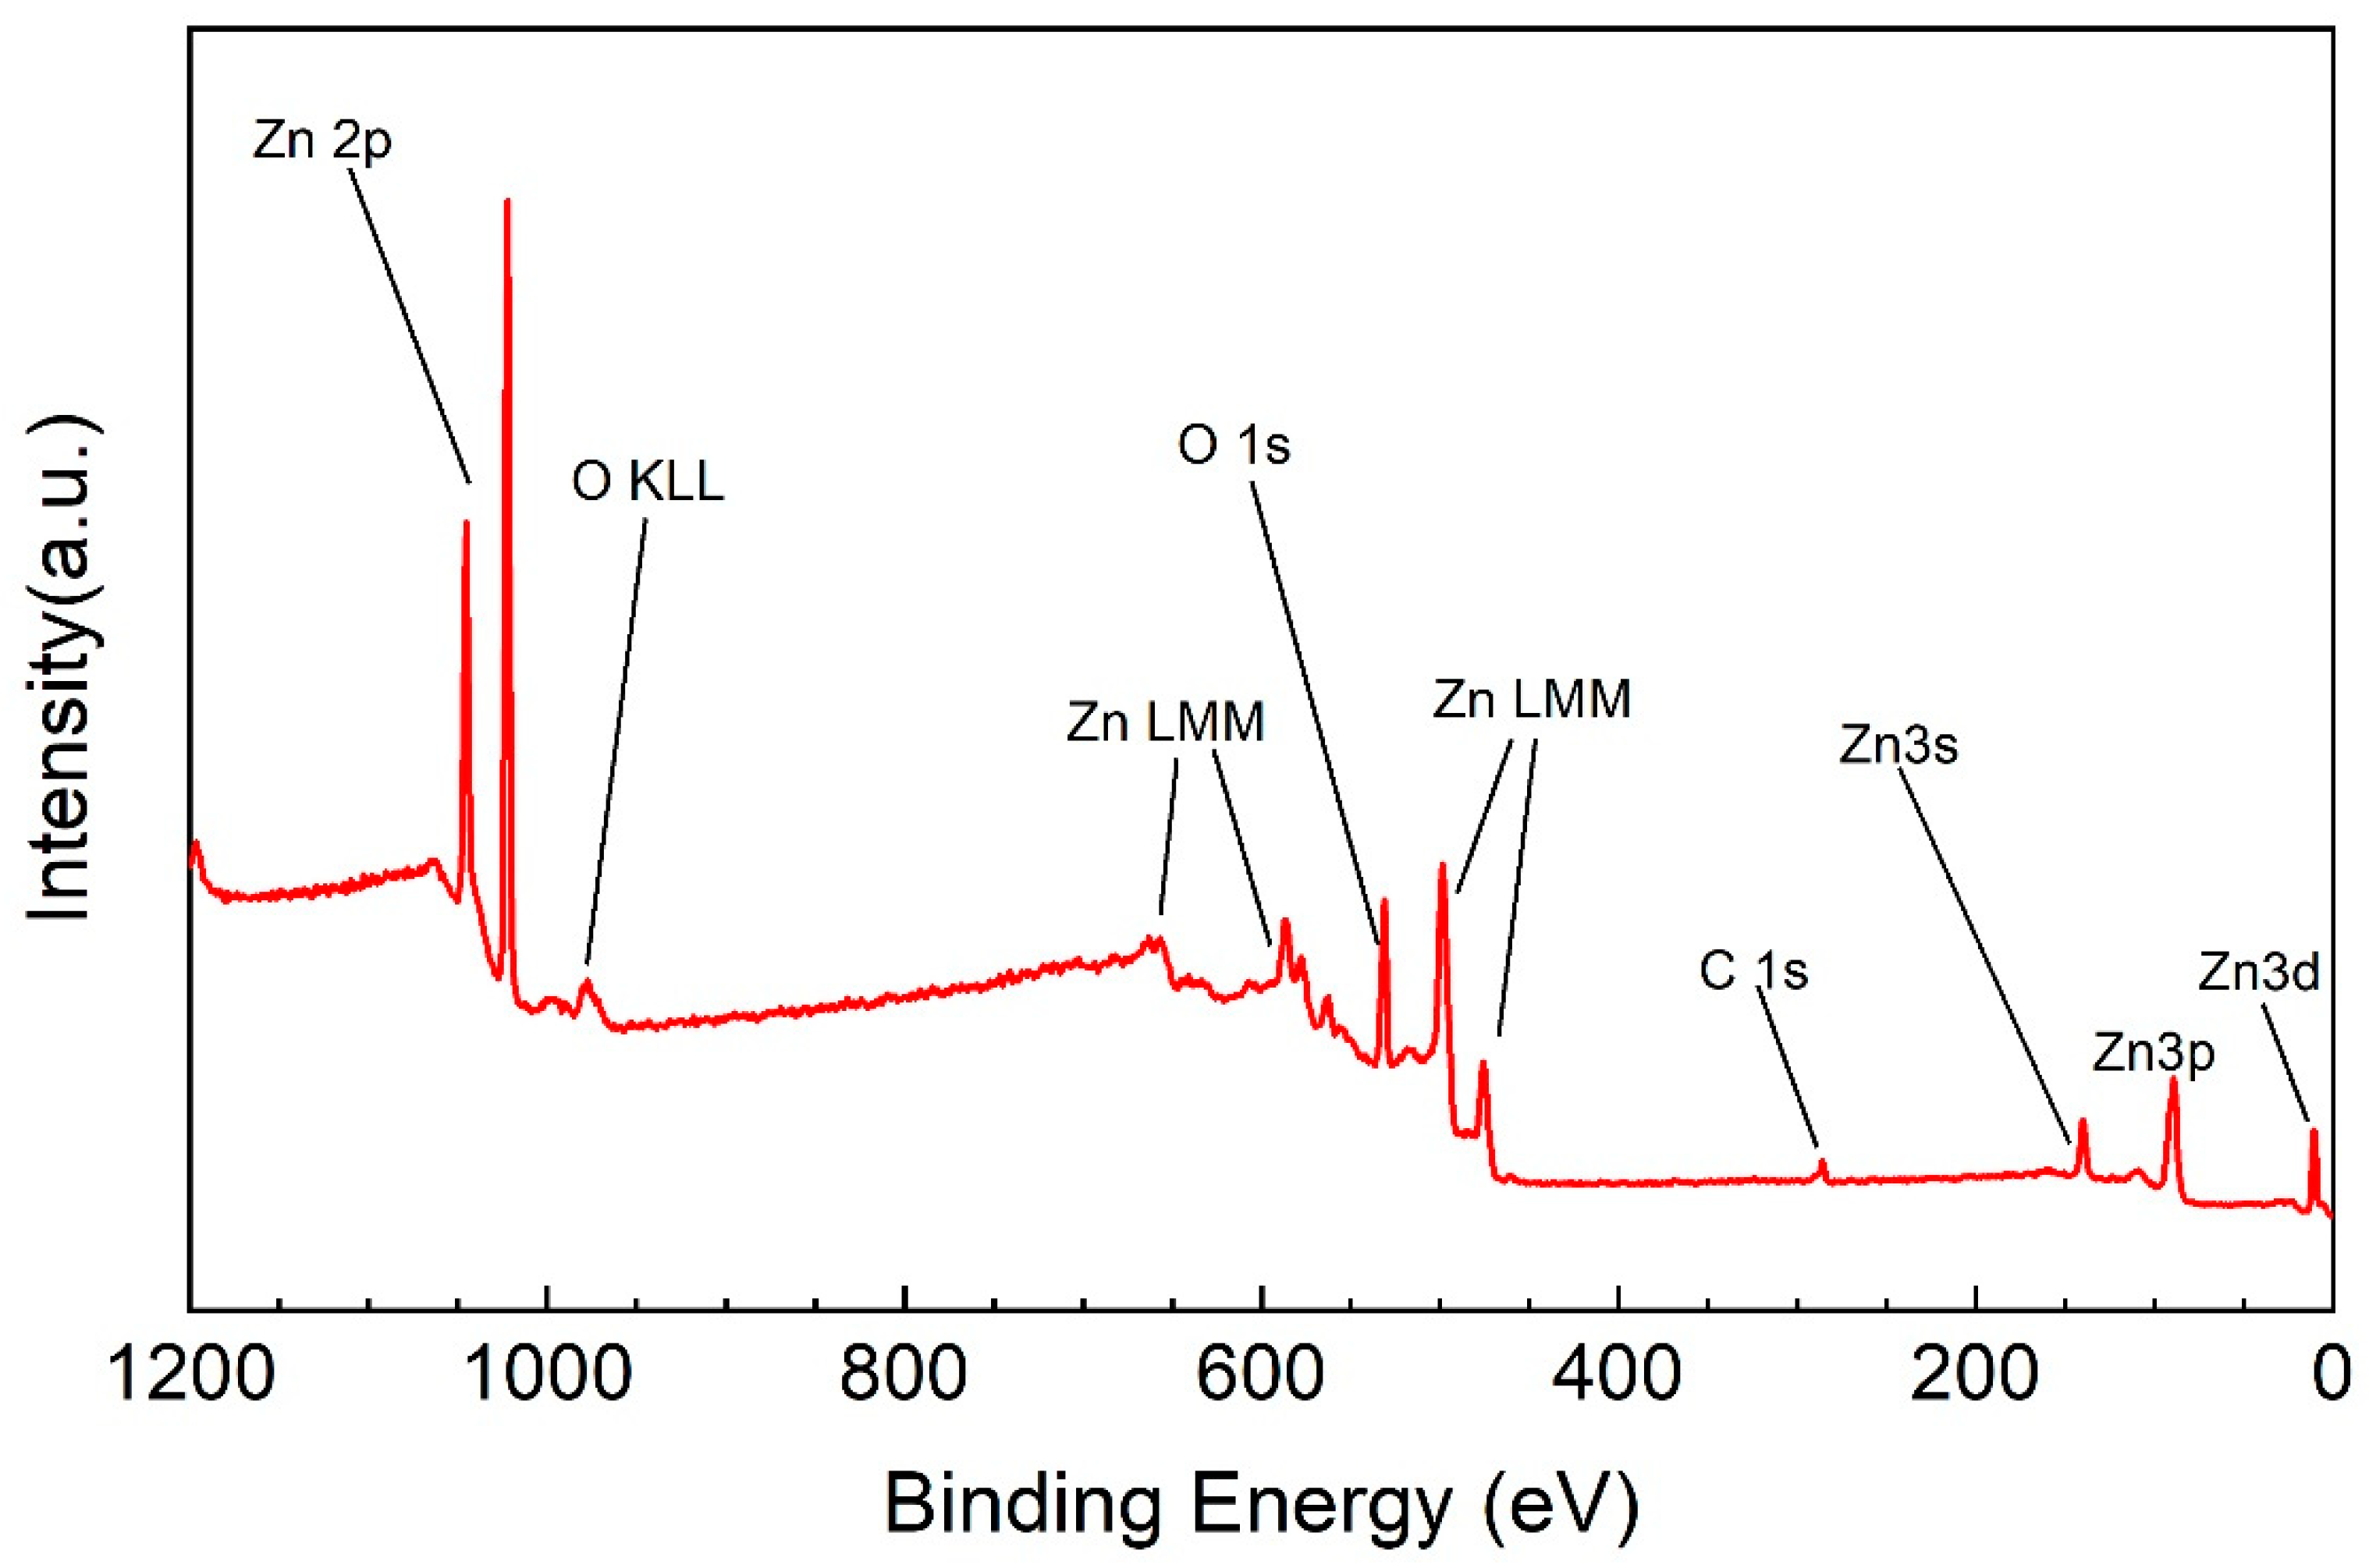
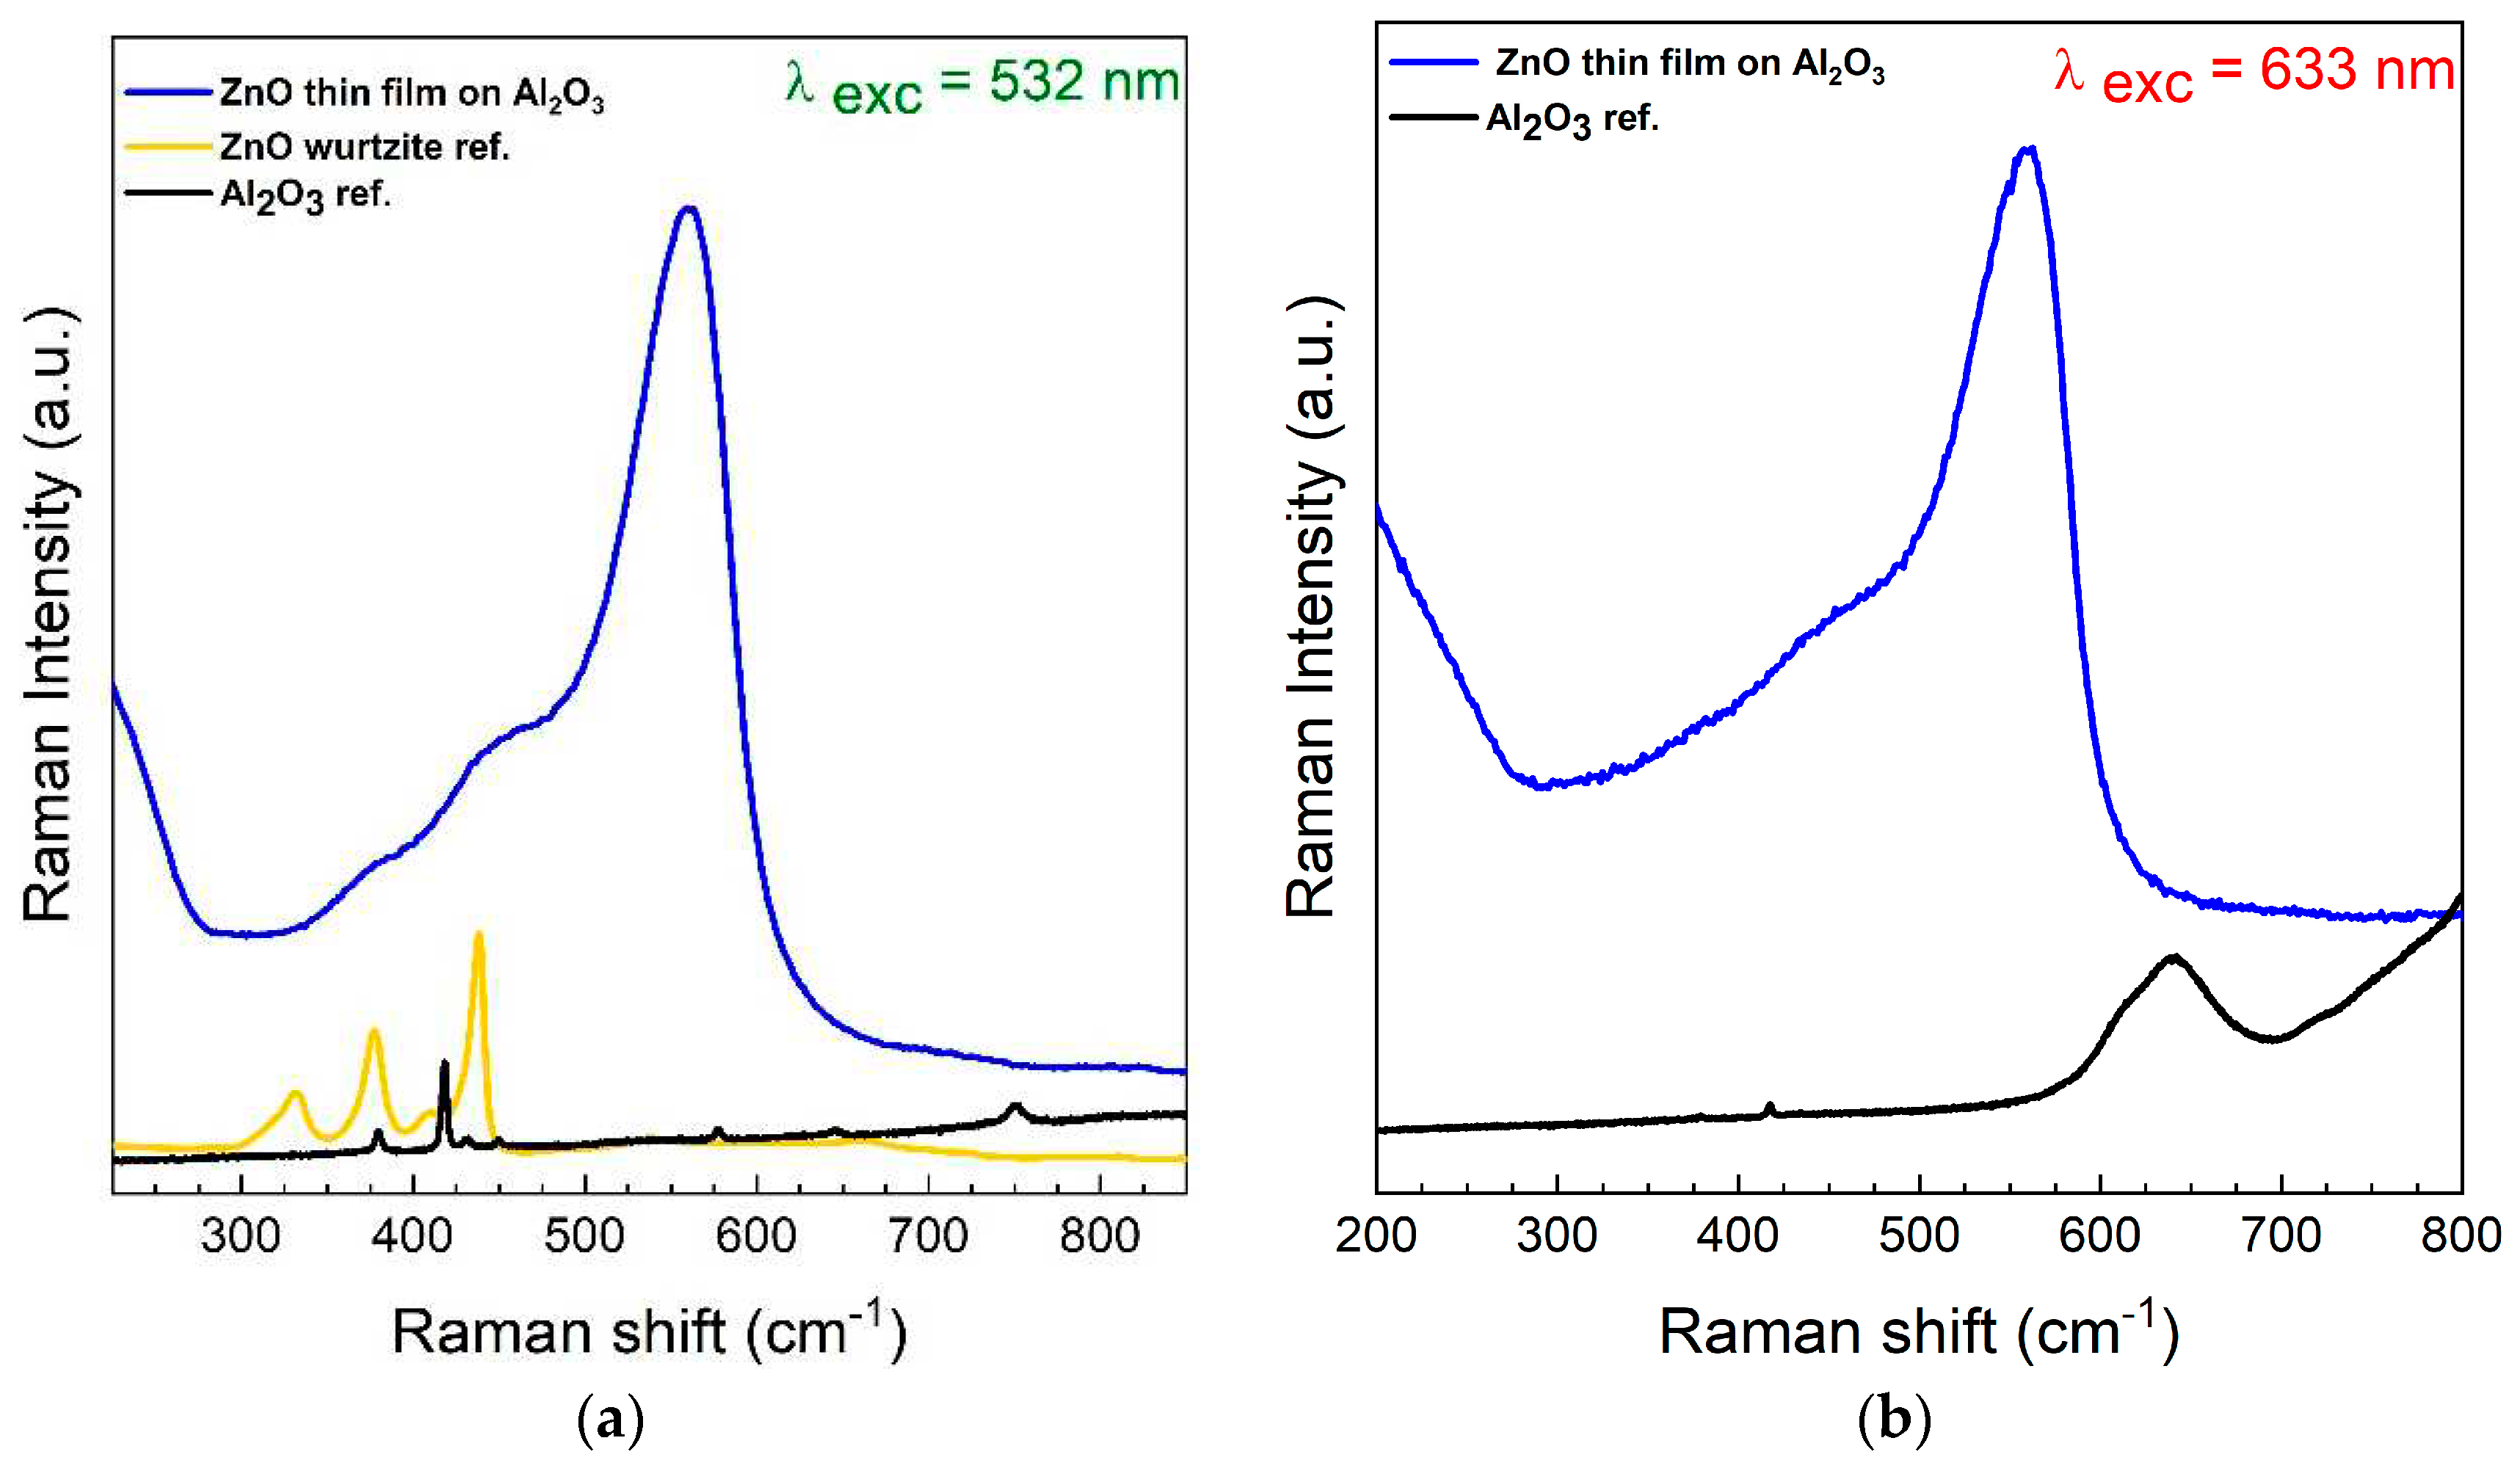

| Si | Al2O3 | ZnO on Si | ZnO on Al2O3 | |
|---|---|---|---|---|
| Ra (nm) | 3.7 | 62.3 | 10.3 | 61.2 |
| RRMS (nm) | 5.4 | 78.1 | 12.8 | 75.5 |
| Nome | BE (eV) | at. %as grown | at. %after 30 s of Ar+ | Bond |
|---|---|---|---|---|
| C1s – A | 285.0 | 11.2 | - | C – C |
| C1s – B | 288.2 | 2.6 | - | C = O |
| O1s – 1 | 530.0 | 30.9 | 37.8 | ZnO |
| O1s – 2 | 531.8 | 13.0 | 5.9 | Zn(OH)2 |
| Zn2p3 | 1021.5 | 42.3 | 56.3 | ZnO |
Disclaimer/Publisher’s Note: The statements, opinions and data contained in all publications are solely those of the individual author(s) and contributor(s) and not of MDPI and/or the editor(s). MDPI and/or the editor(s) disclaim responsibility for any injury to people or property resulting from any ideas, methods, instructions or products referred to in the content. |
© 2023 by the authors. Licensee MDPI, Basel, Switzerland. This article is an open access article distributed under the terms and conditions of the Creative Commons Attribution (CC BY) license (http://creativecommons.org/licenses/by/4.0/).


