1. Introduction
Inadequately high energy intake, which is typical for example, in obesity, prediabetes or type 2 diabetes mellitus (T2DM), leads to changes in the gut microbiome, of which metabolites are able to pass the gut wall and result in phenotypic changes in white adipose tissue (WAT) [
1]. These also affect cells resident in adipose tissue. Adipocytes do not only play a role in energy storage and mobilization, but also secrete paracrine factors to regulate other metabolic tissues. As a result of the increased energy intake, the size of the fat cells also changes rapidly, resulting in an increase in the outflow of free fatty acids, a decrease in the production of adiponectin, an increase in the number of pro-inflammatory cytokines and inflammatory cells in the adipose tissue, hypoxia and fibrosis. Inflammatory cells in adipose tissue can produce both pro-inflammatory and anti-inflammatory cytokines. In the case of chronic excessive energy intake, the production of pro-inflammatory cytokines increases, thereby leading to oxidative stress, systemic, low-grade inflammation and metabolic disorders, such as insulin resistance [
2].
In obesity the stromal vascular fraction of WAT expresses inflammatory cytokines [
3]. In the case of obesity, macrophages are the most numerous cells around the WAT cells (nearly 40%), while in the lean condition macrophages represent approximately less than 10% [
4]. WAT macrophages play a crucial role in the expression of inflammatory cytokines [
3].
Macrophages are the phagocytic members of the immune system. They play a role in both innate an d adaptive immuno-mechanisms. Macrophages are classified into 2 phenotypes and functions: M1 with pro-inflammatory action and M2 with anti-inflammatory activity [
5]. M1 and M2 macrophages metabolize arginine differently. Type M1 macrophages degrade arginine to nitric oxide and citrulline using the nitric oxide synthase enzyme. Type M2 macrophages metabolise arginine using the arginase 1 [
6]. M1 macrophages produce free radicals and nitric oxide (NO) and secrete inflammatory cytokines such as tumor necrosis factor alpha (TNF-α) and IL-6 [
7]. M1-type macrophages are one of the most significant players in the development of inflammation through the pro-inflammatory cytokines they produce. [
3,
7]. M2 macrophages are also involved in the defense mechanisms against pathogens, mainly activated by fungal cells, parasites, immune complexes, complement, apoptotic cells, macrophage colony stimulating factor (MCSF), interleukin-4 (IL-4), IL-13, IL-10, tumor growth factor beta (TGF-β) [
8]. In addition to defending against pathogens, M2 macrophages can clear apoptotic cells, promote wound healing and reduce the inflammatory response [
8]. As a result, the polarization of macrophages into the pro-inflammatory or anti-inflammatory direction plays an important role in the control of inflammatory conditions. Abnormal function of immune cells and increased levels of inflammatory cytokines in the circulation lead to systemic subclinical inflammation affecting all cells of the body, which finally results in oxidative stress at the subcellular level [
9].
Oxidative stress, which develops as a result of ongoing subclinical inflammation, may play a role in the development of multi-hormonal resistance (e.g. insulin resistance, erythropoietin resistance, leptin resistance) [
10,
11]. Furthermore, free radicals are highly reactive and easily react with different types of macro-molecules. They are able to attack DNA, proteins, lipids and amino acids as well. The structural changes of these molecules also lead to the modification and loss of their function. The modified molecules created in this way are mostly stable, so we can also use them as markers of oxidative stress.
Phenylalanine (Phe) is an essential amino acid which is transformed enzymatically to para-tyrosine (para-Tyr), dihydroxy-phenylalanine (DOPA), catecholamines, melanin and thyroid hormones. Aromatic ring of Phe is relatively vulnerable, and in addition to the aforementioned important enzymatic modifications, it can also undergo non-enzymatic changes. Hydroxyl free radicals are able to non-enzymatically hydroxylate the aromatic ring of Phe, resulting in the production of non-physiological meta- and ortho-tyrosine (meta-Tyr and ortho-Tyr) in addition to para-Tyr. However, the amount of non-enzymatically formed para-Tyr is significantly less than the amount of para-Tyr formed in the enzymatic process. In the case of oxidative stress, meta- and ortho-Tyr reflect the amount of hydroxyl free radicals, and abnormal tyrosines are considered to be markers of oxidative stress. Tyr isomers have long been studied mainly as markers of oxidative stress, but there is growing evidence of harmful effects of non-physiological Tyr isomers, as makers [
12]. Many examples of the detrimental effects of abnormal tyrosines are known. Meta-Tyr can inhibit the development of other plants [
13], and can also influence the growth of tumors [
14]. Our research group previously observed that a relationship can be demonstrated between ortho-Tyr serum levels and erythropoietin resistance in dialysis patients. In one study, meta- and ortho-Tyr were able to inhibit erythropoietin-dependent erythrocyte proliferation in a time- and dose-dependent manner [
15]. Based on these, we believe that abnormal tyrosines are not only reliable indicators of oxidative stress, but are also capable of causing tissue damage [
10].
The negative effects of meta-Tyr are both direct and indirect: directly, it is incorporated into proteins, altering their structure and function, and indirectly, it causes disturbances in reactive oxygen and nitrogen metabolism [
16]. In addition to the increase in Tyr isomers due to oxidative stress, it is also likely to enter living organisms through nutrition [
11]. Nevertheless, few clinical or in vivo studies have investigated the adverse effects of abnormal Tyr isomers.
In our previous study [
17], we confirmed that the non-physiological Tyr isomers (meta- and ortho-Tyr) were markers of oxidative stress in type 2 diabetes mellitus with or without chronic kidney disease, in end-stage renal disease, or in septic conditions. At the same time, due to the antioxidant effect of resveratrol, the excretion of ortho-Tyr in the urine decreased in patients with type 2 diabetes mellitus, and a parallel decrease in insulin resistance was observed. Furthermore, in our previous studies, we concluded that non-physiological tyrosines are not only the markers of the oxidative stress, but they may also play a role in the pathogenesis of many diseases [
10,
11,
18]. Culturing of different cell lines on meta- and ortho-Tyr led to insulin resistance in these cells, similar to growing in a high-glucose environment. In these cells cultured on meta- and ortho-Tyr, no insulin-induced IRS-1 phosphorylation was detected. In cells culturing on para-Tyr, insulin was able to induce the phosphorylation of Akt in the medium with normal glucose content, however, in the presence of meta- and ortho-Tyr, insulin was unable to exert any effect, similarly to the environment with high glucose content.
T2DM is considered to be the epidemic of our time, with a steadily increasing prevalence worldwide. This is a chronic disease which can be associated with many comorbidities such as cardiovascular diseases, kidney disease, neuropathy and dementia [
19], and it may result in an immunocompromised condition [
20]. In addition, oxidative stress is increased in T2DM, which may be associated with the development of other diseases such as cardiovascular disease [
21]. T2DM is characterized by insulin resistance (IR), hyperglycemia and impaired insulin secretion. The link between IR and T2DM has long been well known. In the case of insulin resistance, the cells do not respond properly to insulin, which in a long term leads to hyperinsulinemia, hyperglycemia and to the development of T2DM. IR predicts and plays a key role in the development of T2DM, therefore, IR is both a predictor and a therapeutic target for T2DM. Furthermore, insulin resistance, hyperinsulinemia and hyperglycemia can contribute to the development of other pathological conditions, such as oxidative stress and inflammation [
21,
22].
Inflammation plays a key role in the pathogenesis of T2DM, but its mechanism remains to be clarified [
23]. Inappropriate activation of immune cells and subsequent inflammatory processes are involved in the progression and development of T2DM [
23]. IR in T2DM may have a significant effect on the function of macrophages [
24], because insulin affects the M1 and M2 type polarization of macrophages through the induction of Akt signaling [
25]. Pro-inflammatory cytokines produced by M1-type macrophages (e.g. TNFα) contribute to the development of IR and, on the other hand, IR can lead to inflammation via polarization of macrophages to pro-inflammatory state [
26,
27]. Polarization of macrophages is influenced by many factors present in their environment, which factors act through different signaling pathways. One of these significant signaling pathways is the phosphoinositide 3-kinase (PI3K)/Akt pathway, through which, among others, insulin signaling takes place [
28].
In our previous studies, we observed that non-stimulated basal phosphorylation of Akt in 3T3-L1 adipocytes, HEK cells and podocytes and non-stimulated basal IRS-1 phosphorylation in macrophages were significantly higher in response to meta- and ortho-Tyr, compared to para-Tyr using Western-blot examination [
10,
11]. This set point shift resulted in resistance to insulin stimulation in these cells [
10,
11]. Moreover, we observed that dephosphorylation of phosphorylated polypeptide by the enzyme of protein tyrosine phosphates 1B was almost impossible when the phosphorylated tyrosines were meta-Tyr or ortho-Tyr, whereas it was rapidly dephosphorylated in the case of phosphorylated para-Tyr [
10,
11].
The aim of our present study was to investigate microscopically the effect of meta- and ortho-Tyr on insulin sensitivity of macrophages via Akt phosphorylation and to investigate the effect of abnormal Tyr-isomers on the polarization of macrophages.
2. Materials and Methods
2.1. Macrophage cell culture
J774A.1 mouse BALB/C monocyte-macrophage cell lines (Sigma Aldrich, Budapest, Hungary, CAT number: 91051511-1VL) was cultured and maintained in Dulbecco’s modified Eagle’s medium (DMEM, Sigma Aldrich CAT number: D6046) with 10% fetal bovine serum (Gibco, CAT number: A3840402), 100U/mL penicillin, 0.1 mg/mL streptomycin (Gibco, CAT number: 15070-063), 2 μg/mL Fluconazole (Fresenius Kabi Hungary), 1 μg/mL insulin (Sigma Aldrich, Budapest, Hungary, CAT number: I 9278) and 5 or 25 mmol/L glucose (experiment dependent).
2.2. Human embryonic kidney 293 (HEK) cell culture
HEK 293 cell lines (ATCC® CRL-11268™) was cultured and maintained in Dulbecco’s modified Eagle’s medium (DMEM, Sigma Aldrich CAT number: D6046) with 10% fetal bovine serum (Gibco, CAT number: A3840402), 100U/mL penicillin, 0.1 mg/mL streptomycin (Gibco, CAT number: 15070-063), 2 μg/mL Fluconazole (Fresenius Kabi Hungary), 1 μg/mL insulin (Sigma Aldrich, Budapest, Hungary, CAT number: I 9278) and 5 or 25 mmol/L glucose (experiment dependent).
2.3. Macrophages: treatments and pAkt staining
The DMEM medium originally contains 36 mg/L para-Tyr. Four groups were formed as follows: 72 mg/L para-Tyr (physiological tyrosine) was added to the medium of the negative control group (with 5 mmol/L glucose) and the positive control group (para25-Tyr group) with 25 mmol/L glucose. 72 mg/L meta-, or ortho-Tyr (unphysiological tyrosine) was added to the medium of the other two groups (with 5 mmol/L glucose). Cells were grown on coverslips in 6-well plates in a humidified incubator at 37◦C and 5% CO2. After 5 days, cells were incubated overnight in serum-deprived medium. Insulin treatment was performed in a serum-deprived medium as follows: 0 nM/L (control), 6 nM/L, 25 nM/L, 100 nM/L and 400 nM/L insulin for 10 minutes. After the insulin treatment, cells were washed twice with ice-cold PBS to remove any traces of the medium.
The staining method was based on a publication with minor modifications [
29]. Cells were fixed with 4% buffered ice-cold Paraformaldehyde (PFA, Sigma Aldrich CAT number: P-6148) in PBS for 20 minutes on ice, followed by 3 times 5 min washes with PBS. Permeabilized with 0.1% Triton X-100 (Sigma Aldrich CAT number: T-9284) in PBS for 15 minutes, which was followed by 1 times 5 min. wash with PBS and blocked with 5% bovine serum albumin (BSA, Sigma Aldrich CAT number: A7906-100G) at room temperature (RT) for 60 min. Following this the cells were incubated with the primary antibody (Anti-phospho-Akt (Ser473), Cell Signaling CAT number: 4060), diluted (1:100) in blocking buffer, and incubated overnight at 4 °C in a humidified chamber and then for 60 min. in RT. To remove the primary antibody, coverslips were washed for 3 times 5 min in PBS containing 0.1% Triton X-100. Cells were incubated with the secondary antibody (Alexa Fluor 647, Goat anti-Rabbit IgG (H+L) Highly Cross-Adsorbed Secondary Antibody, Invitrogen CAT number: A-21245) in PBS at RT for 4 hours. After 3 times 5 min. of washing with PBS, cell membranes were stained with 5 μg/mL CellBritte (Cellbritte Green Cytoplasmic Membrane Dye, Biotium Inc., CAT number: 30021) at RT for 20 min. After a single wash for 5 min. with PBS, the nuclei of cells were stained with 10 μg/mL DAPI (Sigma Aldrich, Budapest, Hungary, CAT number: 10236276001) at RT for 5 min. Finally, the coverslips were mounted with DPX (Sigma Aldrich, Budapest, Hungary, CAT number: 06522)
2.4. Macrophages: treatments and arginase 1 and iNOS staining
To investigate the M1/M2 polarization of macrophages, we measured the intensity of arginase 1 and iNOS labeling and used the arginase 1/iNOS ratio. The J774A.1 macrophage cells intended for arginase 1 and iNOS labeling were treated as described above, with the following differences: before the end of the tyrosine treatments the cells were treated with 400nM/L insulin for 48 hours (except for the control groups). Also, 24 hours before the end of the tyrosine treatment, all groups were treated with LPS (Lipopolysaccharide (LPS) Solution (500X) Invitrogen CAT number: 00-4976-93) for 3 hours.
For arginase 1 and iNOS labelling phycoerythrin (PE) conjugated arginase 1 rat monoclonal antibody (A1exF5, Invitrogen CAT number: 12-3697-82) and Alexa Fluor™ 488 conjugated anti-iNOS rat monoclonal antibody (CXNFT, Invitrogen CAT number: 53-5920-82) were applied and the staining procedures were executed similarly as in the case of p-Akt antibody. Reaction specificity was tested by appropriate isotype control antibodies. Furthermore, due to colour matching, it was not possible to label the cell membrane (see below in the “Measurements of intensity” section).
2.5. Measurements of intensity
The intensity measurement was performed with a slight modification of the method described in our previous study [
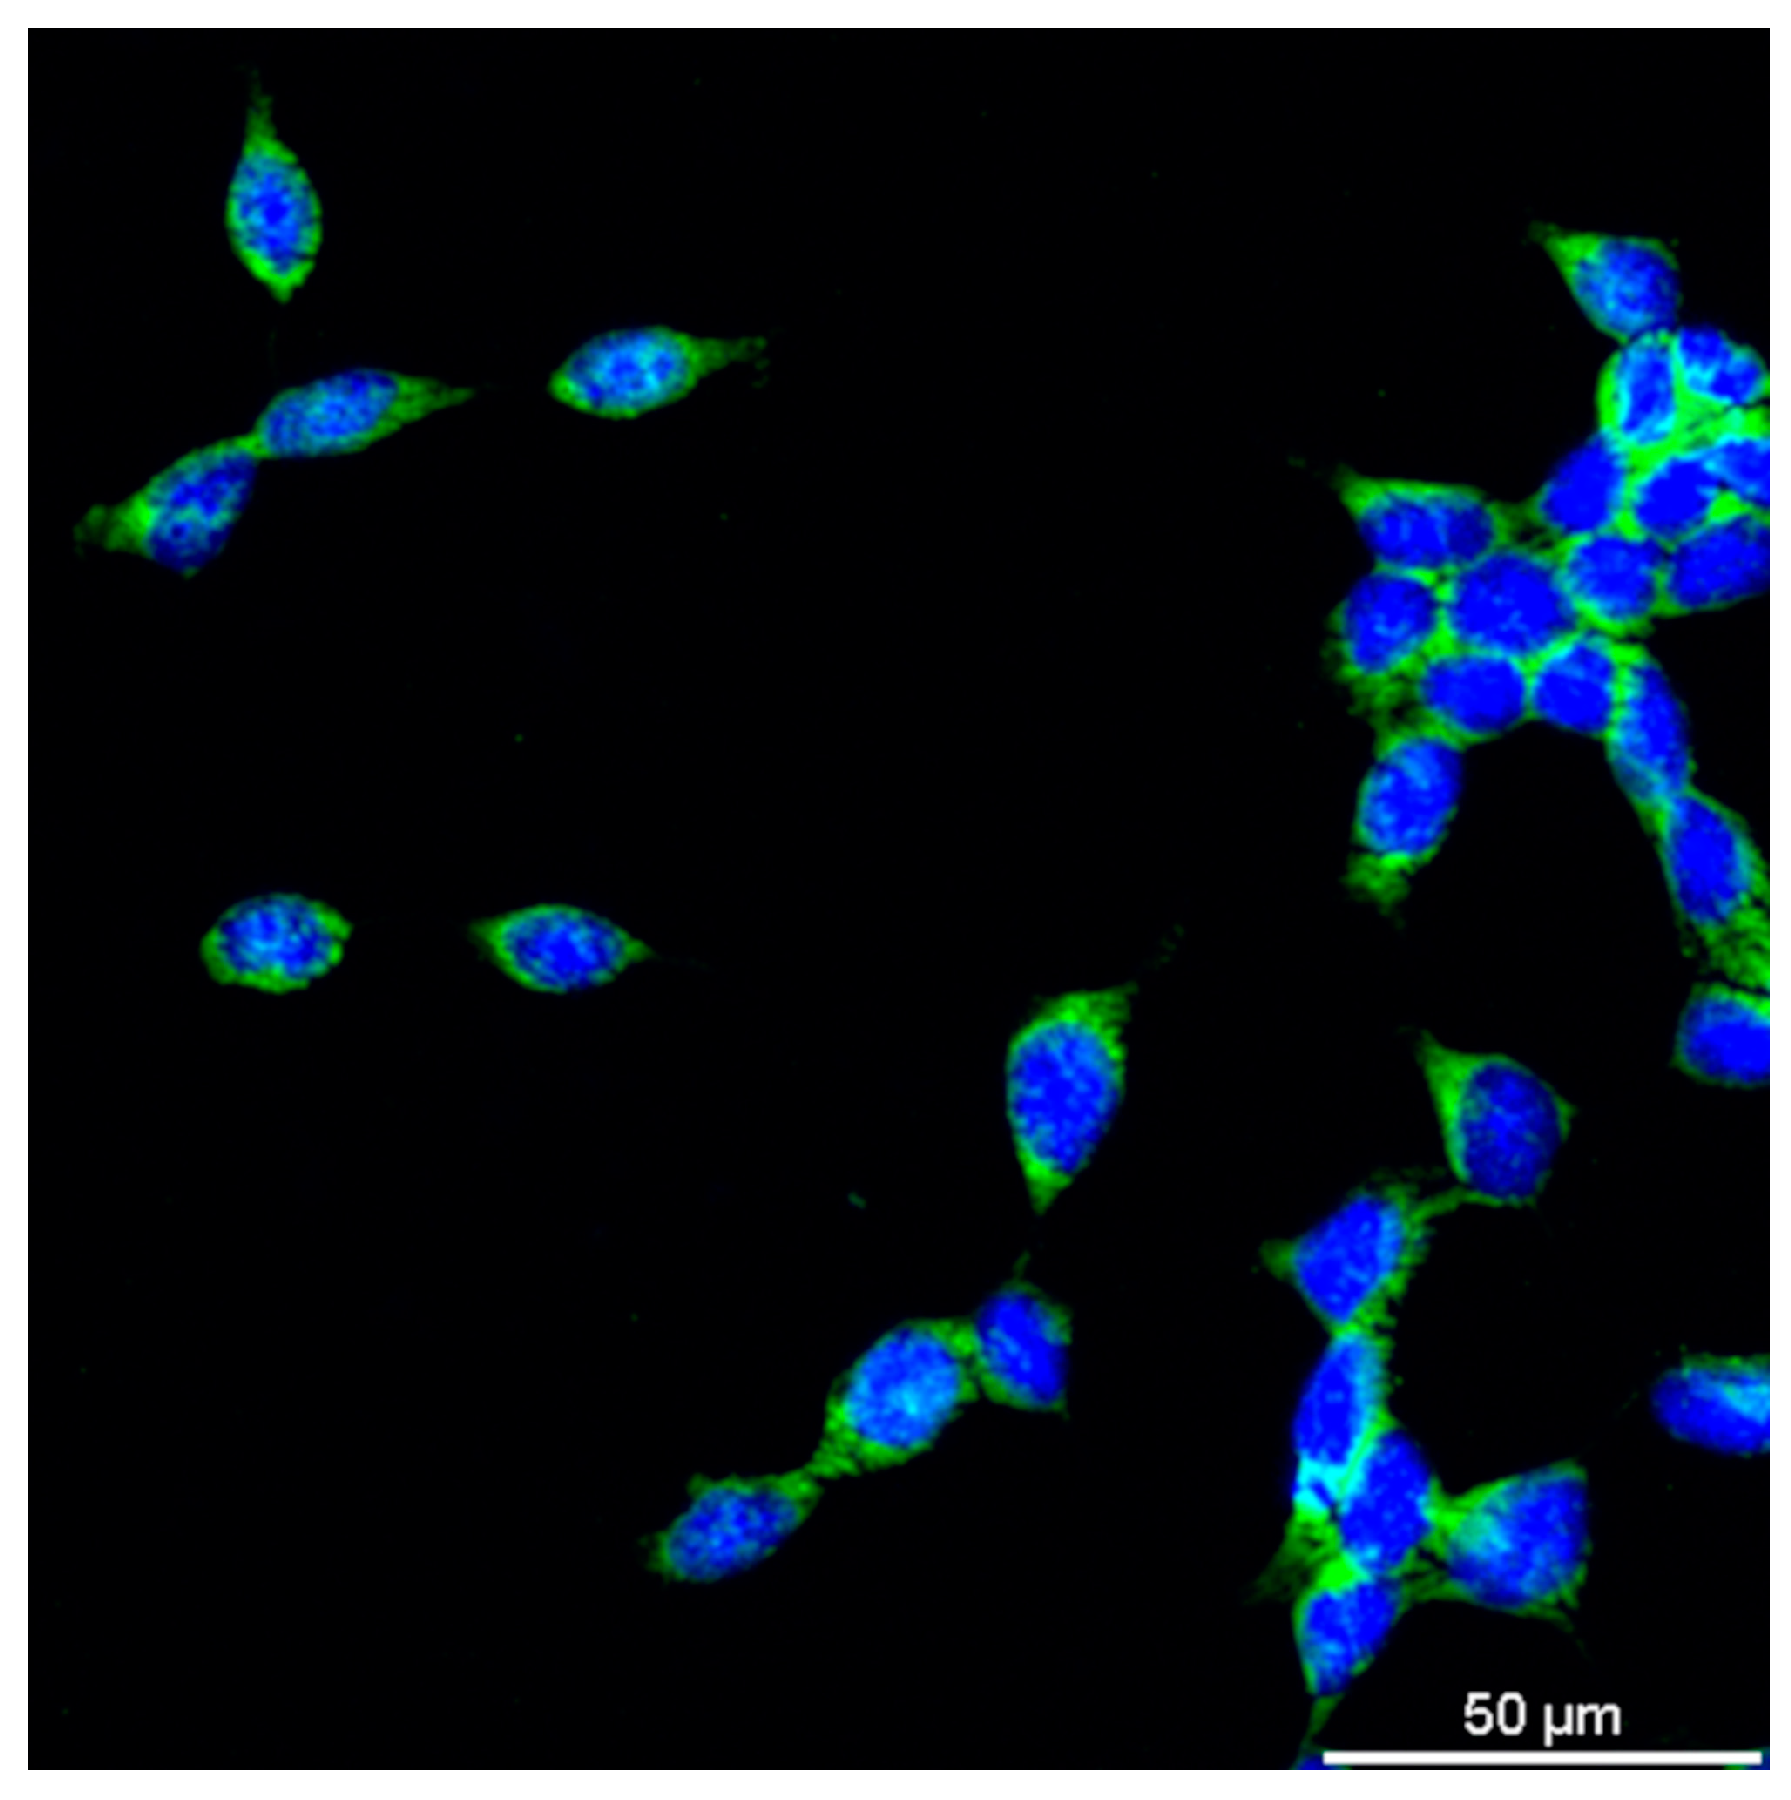
18]. The images of the stained cells were scanned with a Nikon Confocal Laser Scanning Microscope system (Nikon, Tokyo, Japan). Fluorescence images from the same experiment were taken with the same exposure settings and laser intensity. The parameters were as follows: pAkt staining: Laser Wavelength: 561.0; Laser Power: 81.0; PMT HV: 135; PMT Offset: -25, Arginase 1 staining: Laser Wavelength: 561.0; Laser Power: 84.6; PMT HV: 157, PMT Offset: -10, iNOS staining: Laser Wavelength: 488.0; Laser Power: 81.0; PMT HV: 140, PMT Offset: 0 The Nikon NIS element software was used to quantify intensity of staining. The regions of interest (ROIs) were selected manually using the cell membrane staining on the images (Nikon Electronic Format (NEF) 12-bit) (
Figure 1.). In the case of arginase 1 and iNOS lelling, it was not possible to label the cell membrane, therefore, ROIs were assigned around 4 cells to reduce measuring error. The ROIs were duplicated (the area of duplicate ROI was equal to the original ROI). The duplicate ROIs were placed to the background. The pixels within the ROI areas (original and background) were measured and the pixels within the background ROIs were subtracted from the pixels of the original ROIs. Finally, the obtained intensity values were corrected by the area of the ROIs. The final intensity values are expressed in arbitrary units (a.u.).
2.6. Tyrosine uptake in HEK cells
Before the experiment, cells were incubated overnight in serum-deprived medium. For the control assay, the original serum-free medium (DMEM, Sigma Aldrich CAT number: D6046) was used. For the Tyr uptake assay, para-, meta-, and ortho-Tyr were added to the medium in such a way that it contained equal amounts of the three Tyr isomers. HEK cells were incubated in a medium containing equal amounts of Tyr isomers for 0, 10, 20, 30, 40, 50, and 60 min. At the end of the incubation period, the cells were washed twice with ice-cold PBS and scraped off mechanically after the addition of 80 μl/plate of lysis buffer. The lysis buffer contained the following: 1 M/L sodium-chloride (NaCl), 50 mM/L Trisbase, pH 7.4, 1% Triton X, 0.5% sodium deoxycholate (SOD), 0.1% sodium dodecyl sulphate (SDS), 5 mg/mL phenylmethylsulphonyl fluoride (PMSF), phosphatase inhibitor cocktails 1 and 2 (Sigma Aldrich, Budapest, Hungary, CAT number: P5726 and P2850), protease inhibitor cocktail (Sigma Aldrich, Budapest, Hungary, CAT number: P8340).
HPLC measurement of tyrosine isoforms was performed with a slight modification of the method described in our previous study [
10]. In HPLC analysis of the Tyr content, both the total of non-protein-bound intracellular Tyr concentration and of the protein-bound cellular Tyr content were measured. For the measurement of non-protein bound total intracellular Tyr concentration, 200 μl of distilled water was added to the samples and stored overnight at -70 °C to achieve adequate cell lysis. After thawing, the samples were centrifuged at 15000 rpm for 15 minutes. 200 μl of the supernatant was taken and mixed with 200 μl of 60% trichloroacetic acid. The samples were incubated on ice for 30 min., followed by centrifugation at 15000 rpm for 15 min. After centrifugation, 40 μl of the filtered and diluted fivefold supernatant was mixed with 160 μl of distilled water and was injected onto the HPLC column.
For the measurement of total protein-bound cellular Tyr content, 200 μl of distilled water was added to the samples and lysed by freezing at -70 °C overnight. After thawing, the samples were centrifuged at 4000 rpm and 200 μl of the supernatant was added to 200 μl of 60% trichloroacetic acid and incubated on ice for 30 min. The next centrifugation was performed at 4000 rpm for 10 min and the sediment was suspended in 1% trichloroacetic acid and 4 µl of 400 mmol/L desferrioxamine. Forty µl of 500 mmol/L butylated hydroxytoluene was added to the samples to avoid free radical formation during hydrolysis. In the next step, the proteins were hydrolysed at 120 °C overnight after the addition of 200 µl of 6 N hydrochloric acid. The hydrolysate was filtered through a 0.2 µm filter (Millipore Co., Billerica, MA, USA) and 20 µl of the filtrate was injected onto the HPLC column of a Shimadzu Class LC-10 ADVP HPLC system (Shimadzu USA Manufacturing Inc., Canby, OR, USA). A Rheodyne manual injector was used for injection.
No derivatisation or labeling was needed because the amounts of para-, meta-, and ortho-Tyr were determined by measuring their autofluorescence. The Shimadzu Class 10 HPLC system we used was equipped with an RF-10 AXL fluorescence detector (Shimadzu USA Manufacturing Inc., Canby, OR, USA). 1% sodium acetate and 1% acetic acid dissolved in water were used as mobile phase. Separations were performed on a LiChroCHART 250-4 column (Merck KGaA, Darmstadt 64271, Germany) in an isocratic run. Para-, meta- and ortho-Tyr were measured at excitation wavelengths of 275 nm and emission wavelengths of 305 nm. The exact concentration of amino acids was determined by area under the curve (AUC) and external standard calibration.
2.7. Statistical analyses
The distribution of variables was checked using the Shapiro-Wilk test. The difference between the variables with normal distribution was examined via analysis of variance (ANOVA). In case of variables with non-normal distribution the Kruskal-Wallis test and the Mann-Whitney U test were used. To test for trends in the data, the Mann-Kendall trend test was used. A p value of less than 0.05 was considered statistically significant. Data analysis was performed using Paleontological Statistics (PAST) software version 3.21.
4. Discussion
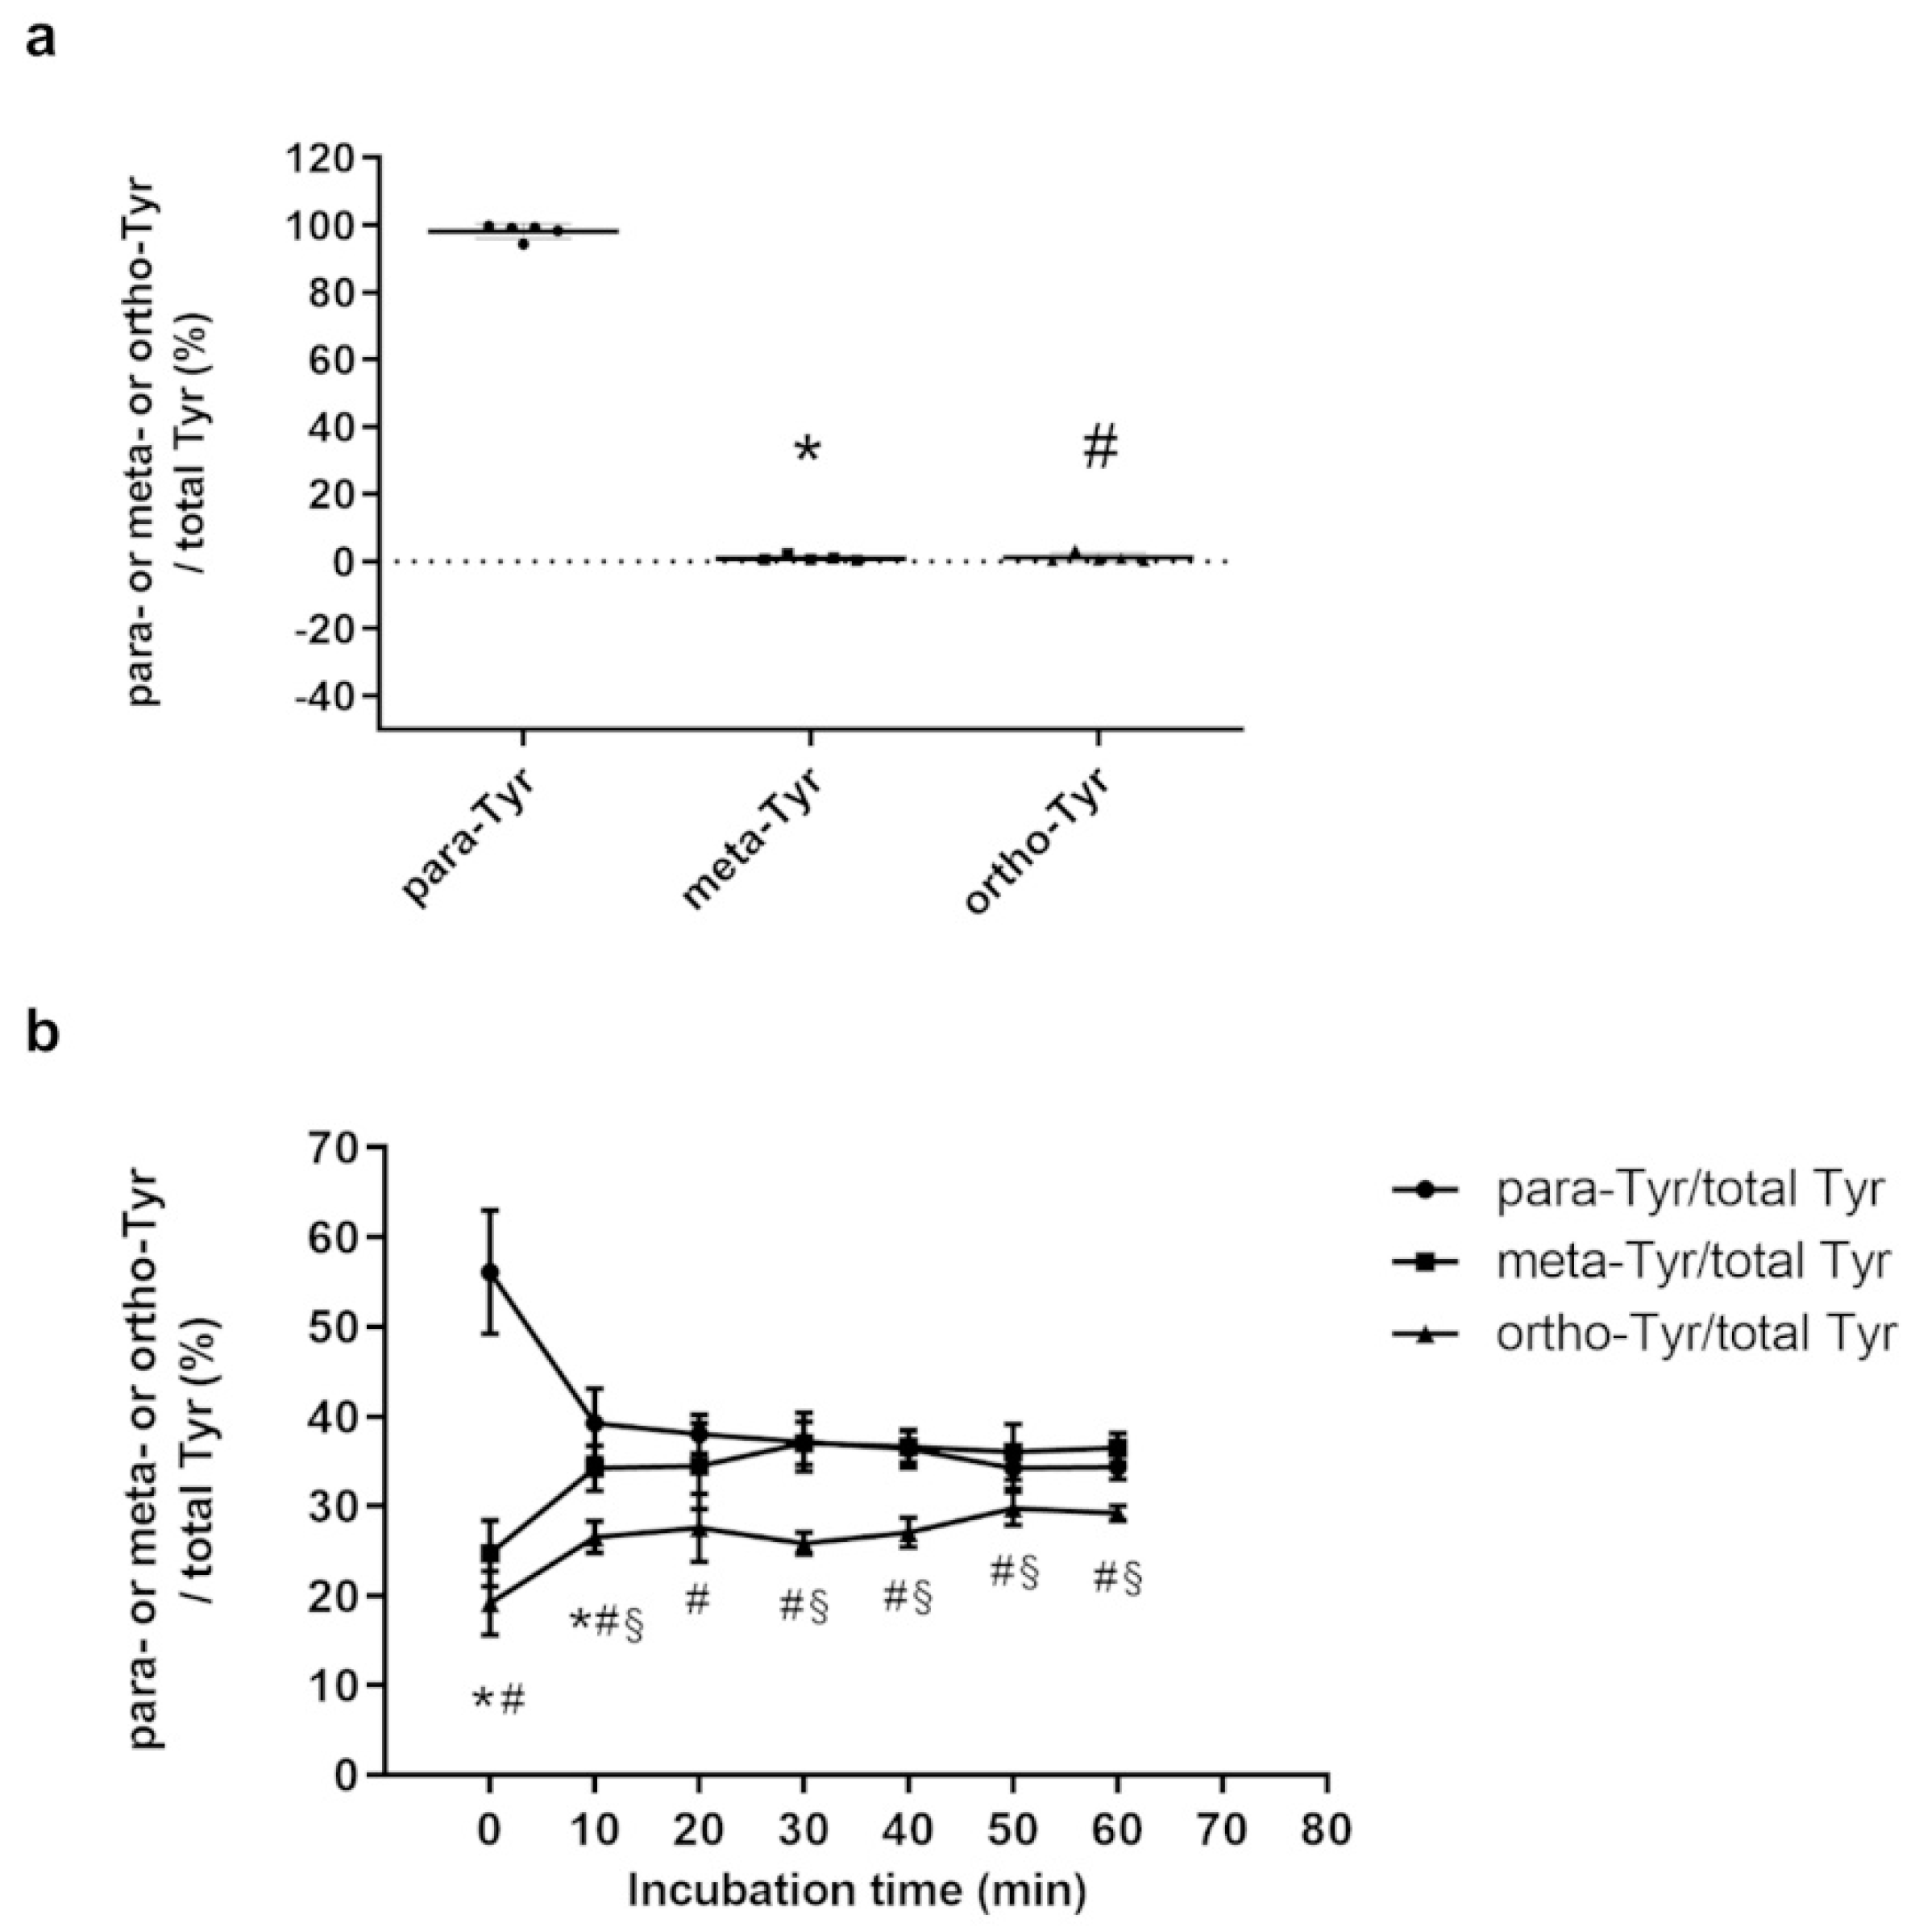
In our investigations, cultured cells are able to take up meta- and ortho-Tyr isomers in amounts similar to para-Tyr. Abnormal tyrosine isomers increased pAkt levels and decreased the arginase 1/iNOS ratio in a manner similar to high glucose (para25-Tyr), and abolished or reversed the effect of insulin, which increased pAkt and decreased the arginase 1/iNOS ratio in macrophages. Since M1-type macrophages express a nitric oxide synthase enzyme that metabolizes arginine to nitric oxide (NO) and citrulline, whereas M2-type macrophages are characterized by the metabolism of arginine by arginase 1 [
6], the arginase 1/iNOS ratio is a good indicator of the direction of polarization of macrophages.
Our results examining the uptake of Tyr by HEK cells prove that the cells take up the non-physiological Tyr isomers and the amount of the three isomers tended to equalize in the cells. Tyrosines modified by hydroxyl free radicals are incorporated into the proteins and peptides, and they may change the structure and function of the proteins [
30,
31]. In this study, 3,4-dihydroxy-phenylalanine and dopaquinone modifications of proteins were found to occur in several cases at the phosphorylation sites [
30].
Hyperglycaemia also has an oxidative stress-inducing effect, which may play a role in the development of insulin resistance in diabetes and its complications [
10,
18,
29]. As a result of oxidative stress, the amount of hydroxyl free radicals increases, which leads to an increase in the meta- and ortho-Tyr products in a non-enzymatic way generated from Phe [
10].
In some studies, oxidative stress has been shown to decrease pAkt in, for example, uterine and mesangial cells [
32,
33], whereas yet other studies have shown that oxidative stress increases pAkt in alveolar and human THP1 macrophages [
34,
35,
36]. However, to our knowledge, our study is the first to demonstrate that oxidative stress-induced meta- and ortho-Tyr increase pAkt in macrophages independently of insulin effects. Our studies show that non-physiological tyrosine isomers increase the amount of pAkt and are able to reverse the pAkt-increasing effect of insulin in macrophages.
In our work, we investigated the effect of insulin resistance induced by the non-physiological tyrosines on the polarization of macrophages. Several studies have addressed the role of macrophage polarisation in the development of inflammation and insulin resistance, but less attention has been paid to the effect of insulin resistance on macrophages. It has been observed that diabetic patients are more susceptible to various infections such as lower respiratory tract infections like pulmonary tuberculosis and pneumonia, urinary tract infections, and skin as well as soft tissue infections [
20].
Panda at al. assessed macrophage effector functions in uncontrolled DM patients with or without tuberculosis (TB) infection (TB+DM and DM), non-diabetic TB patients, and non-diabetic-uninfected controls. In their study they found, among others, reduced phagocytic capacity of macrophages, reduced NO levels (indicating reduced iNOS activation) and increased CD206 (M2 macrophage marker) levels in macrophages under diabetic conditions [
37].
Ieronymaki and colleagues investigated the effect of insulin resistance on macrophage polarization in a cell culture and they used an in vivo diet-induced glucose intolerance mouse model. Their results showed that insulin resistant macrophages had an M2-like phenotype and that mice carrying insulin resistant macrophages showed reduced sepsis-induced lung injury in polymicrobial sepsis model [
38].
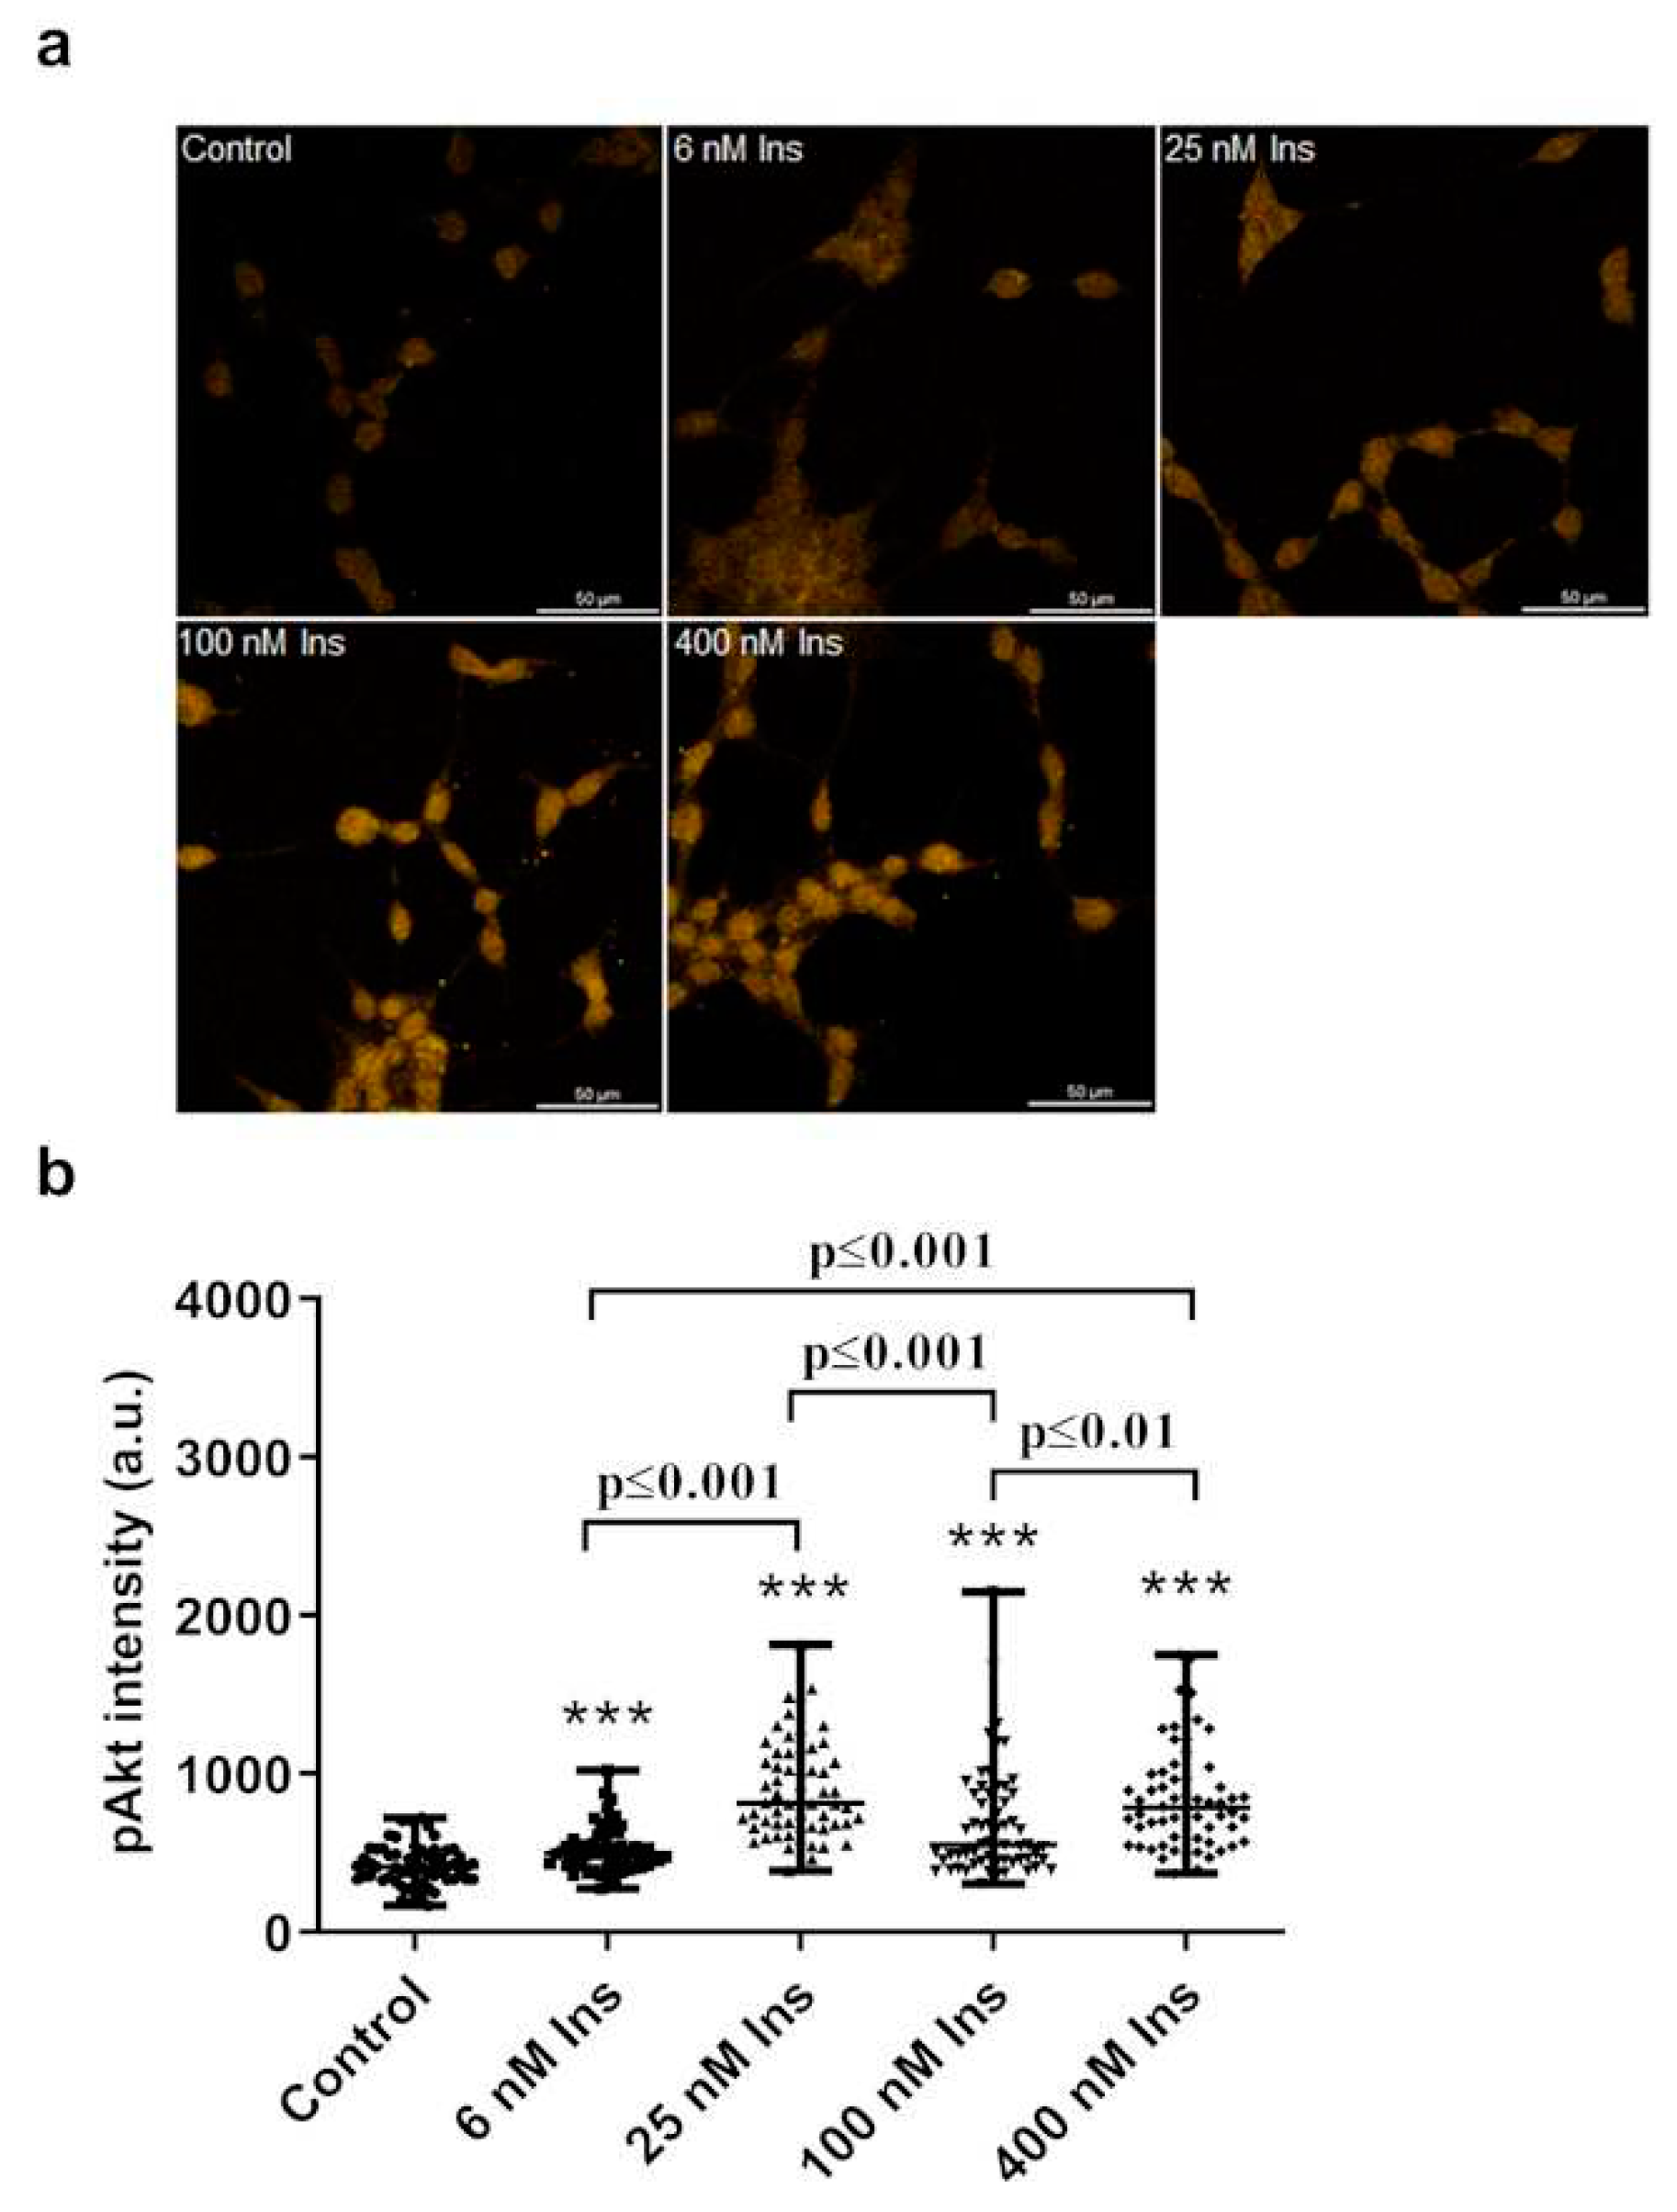
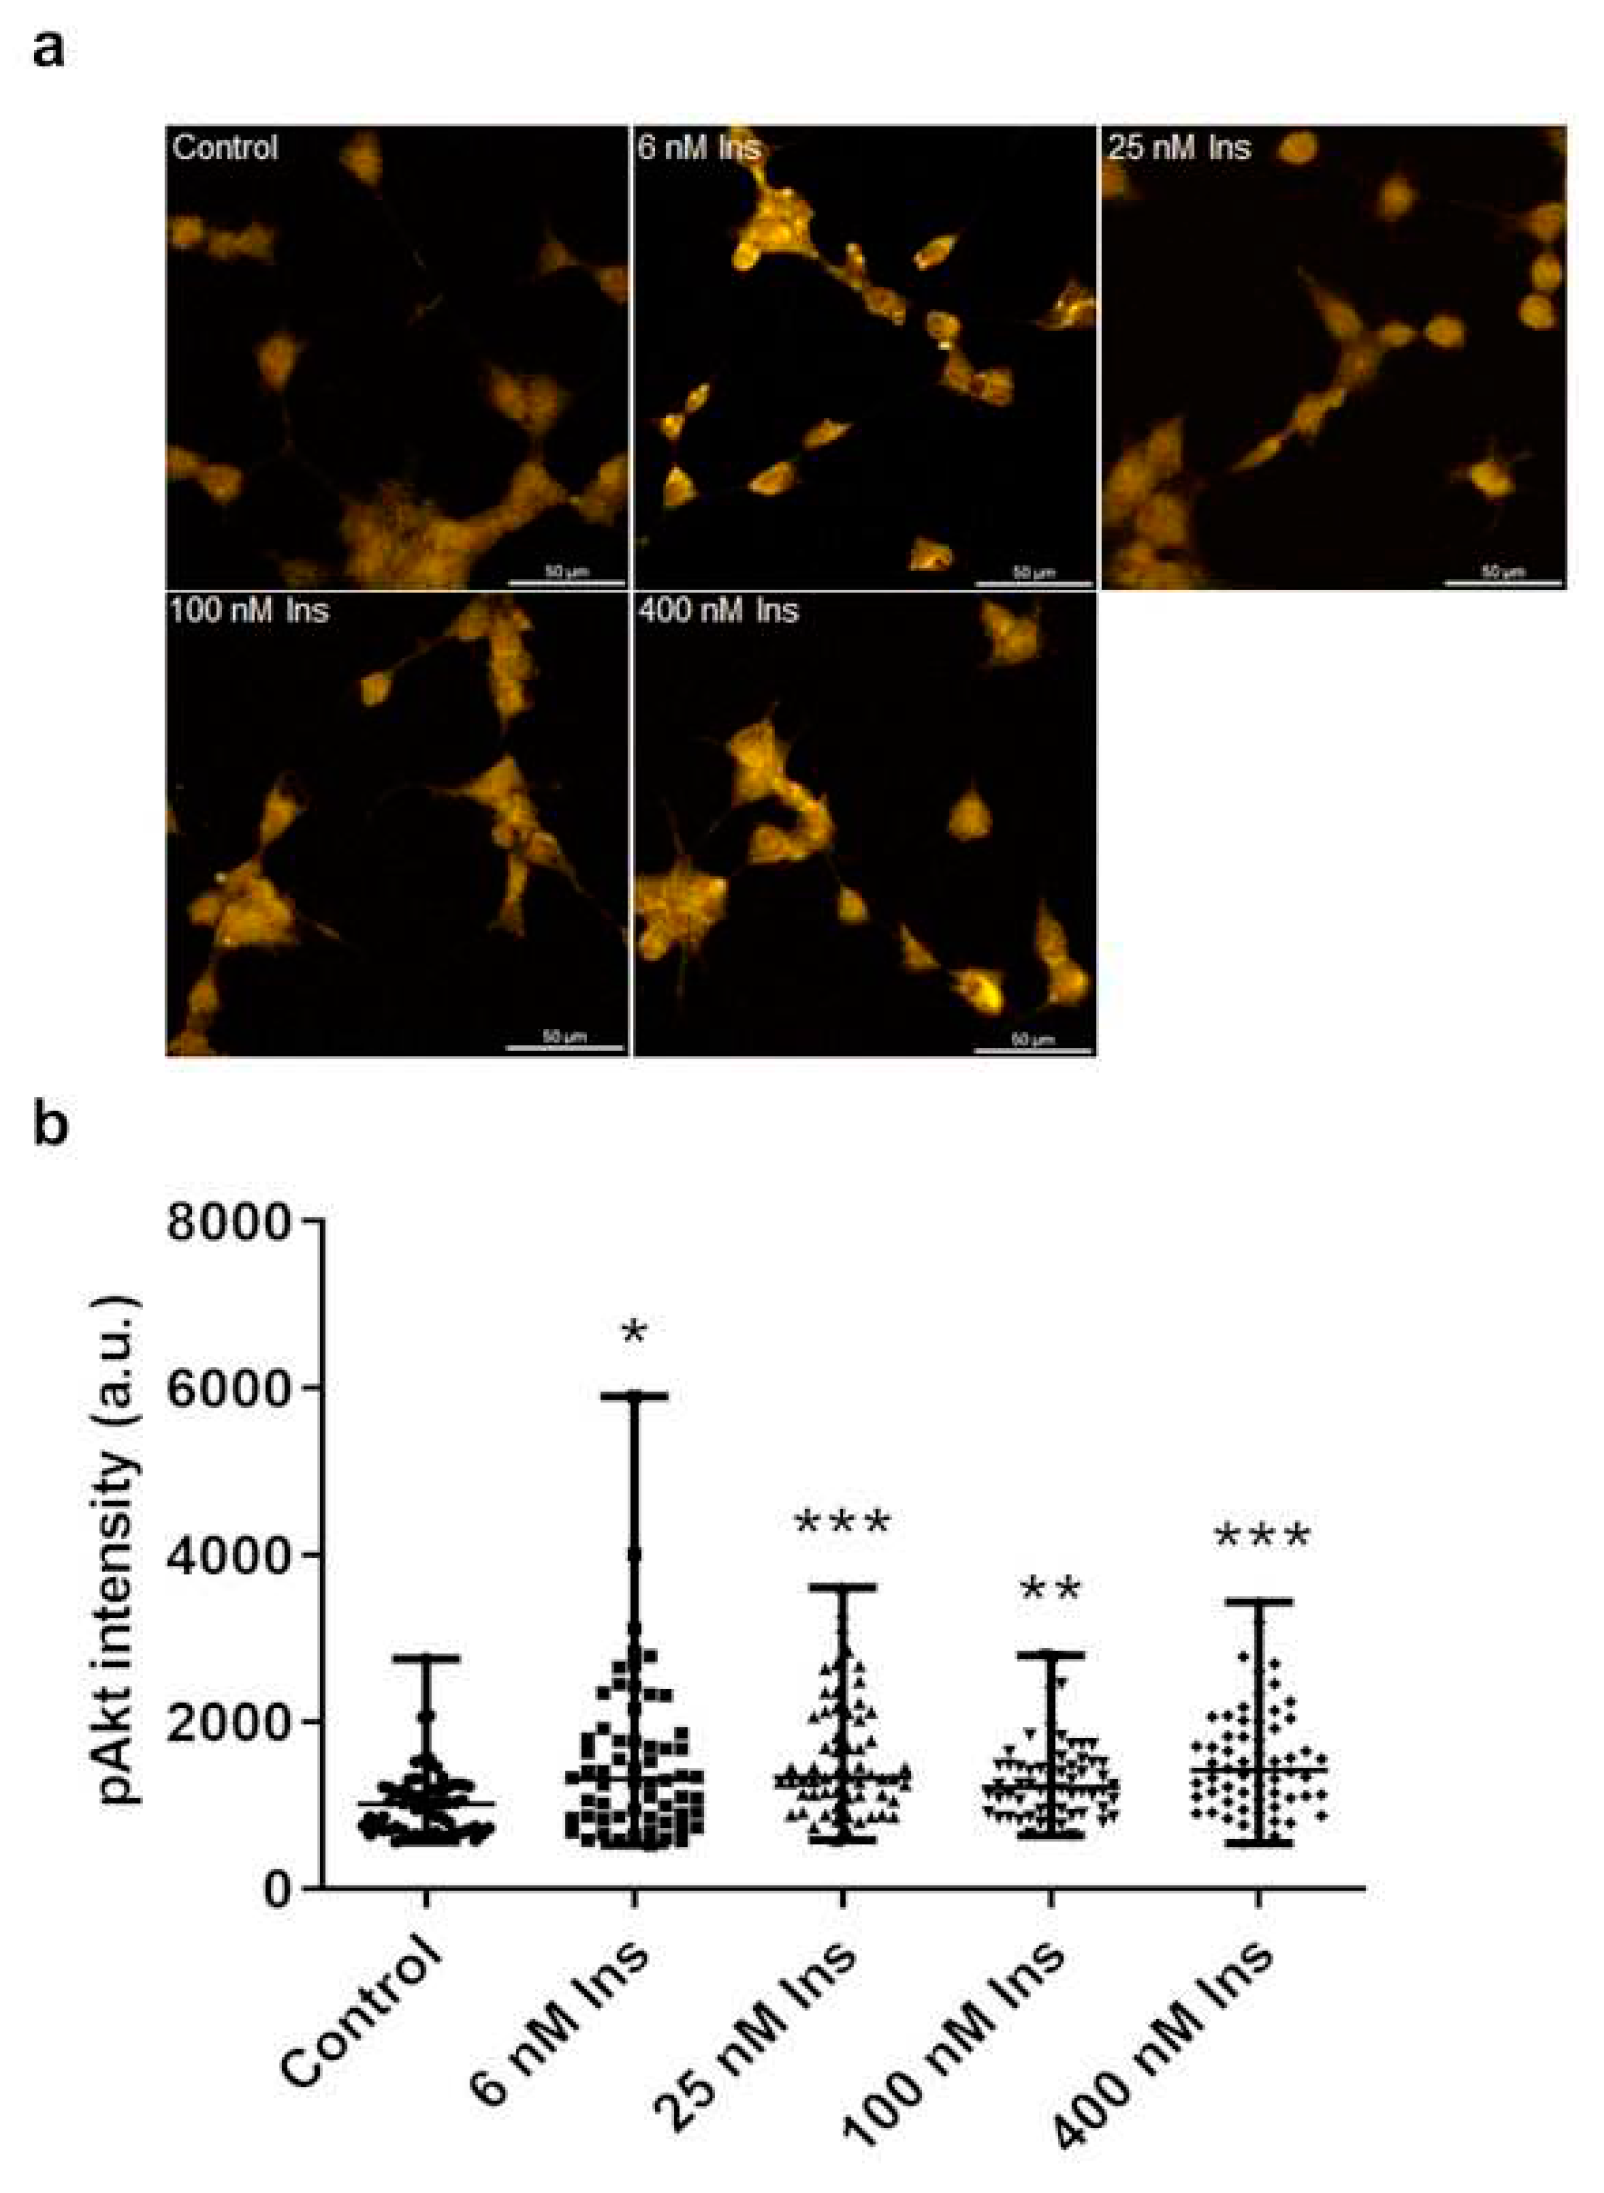
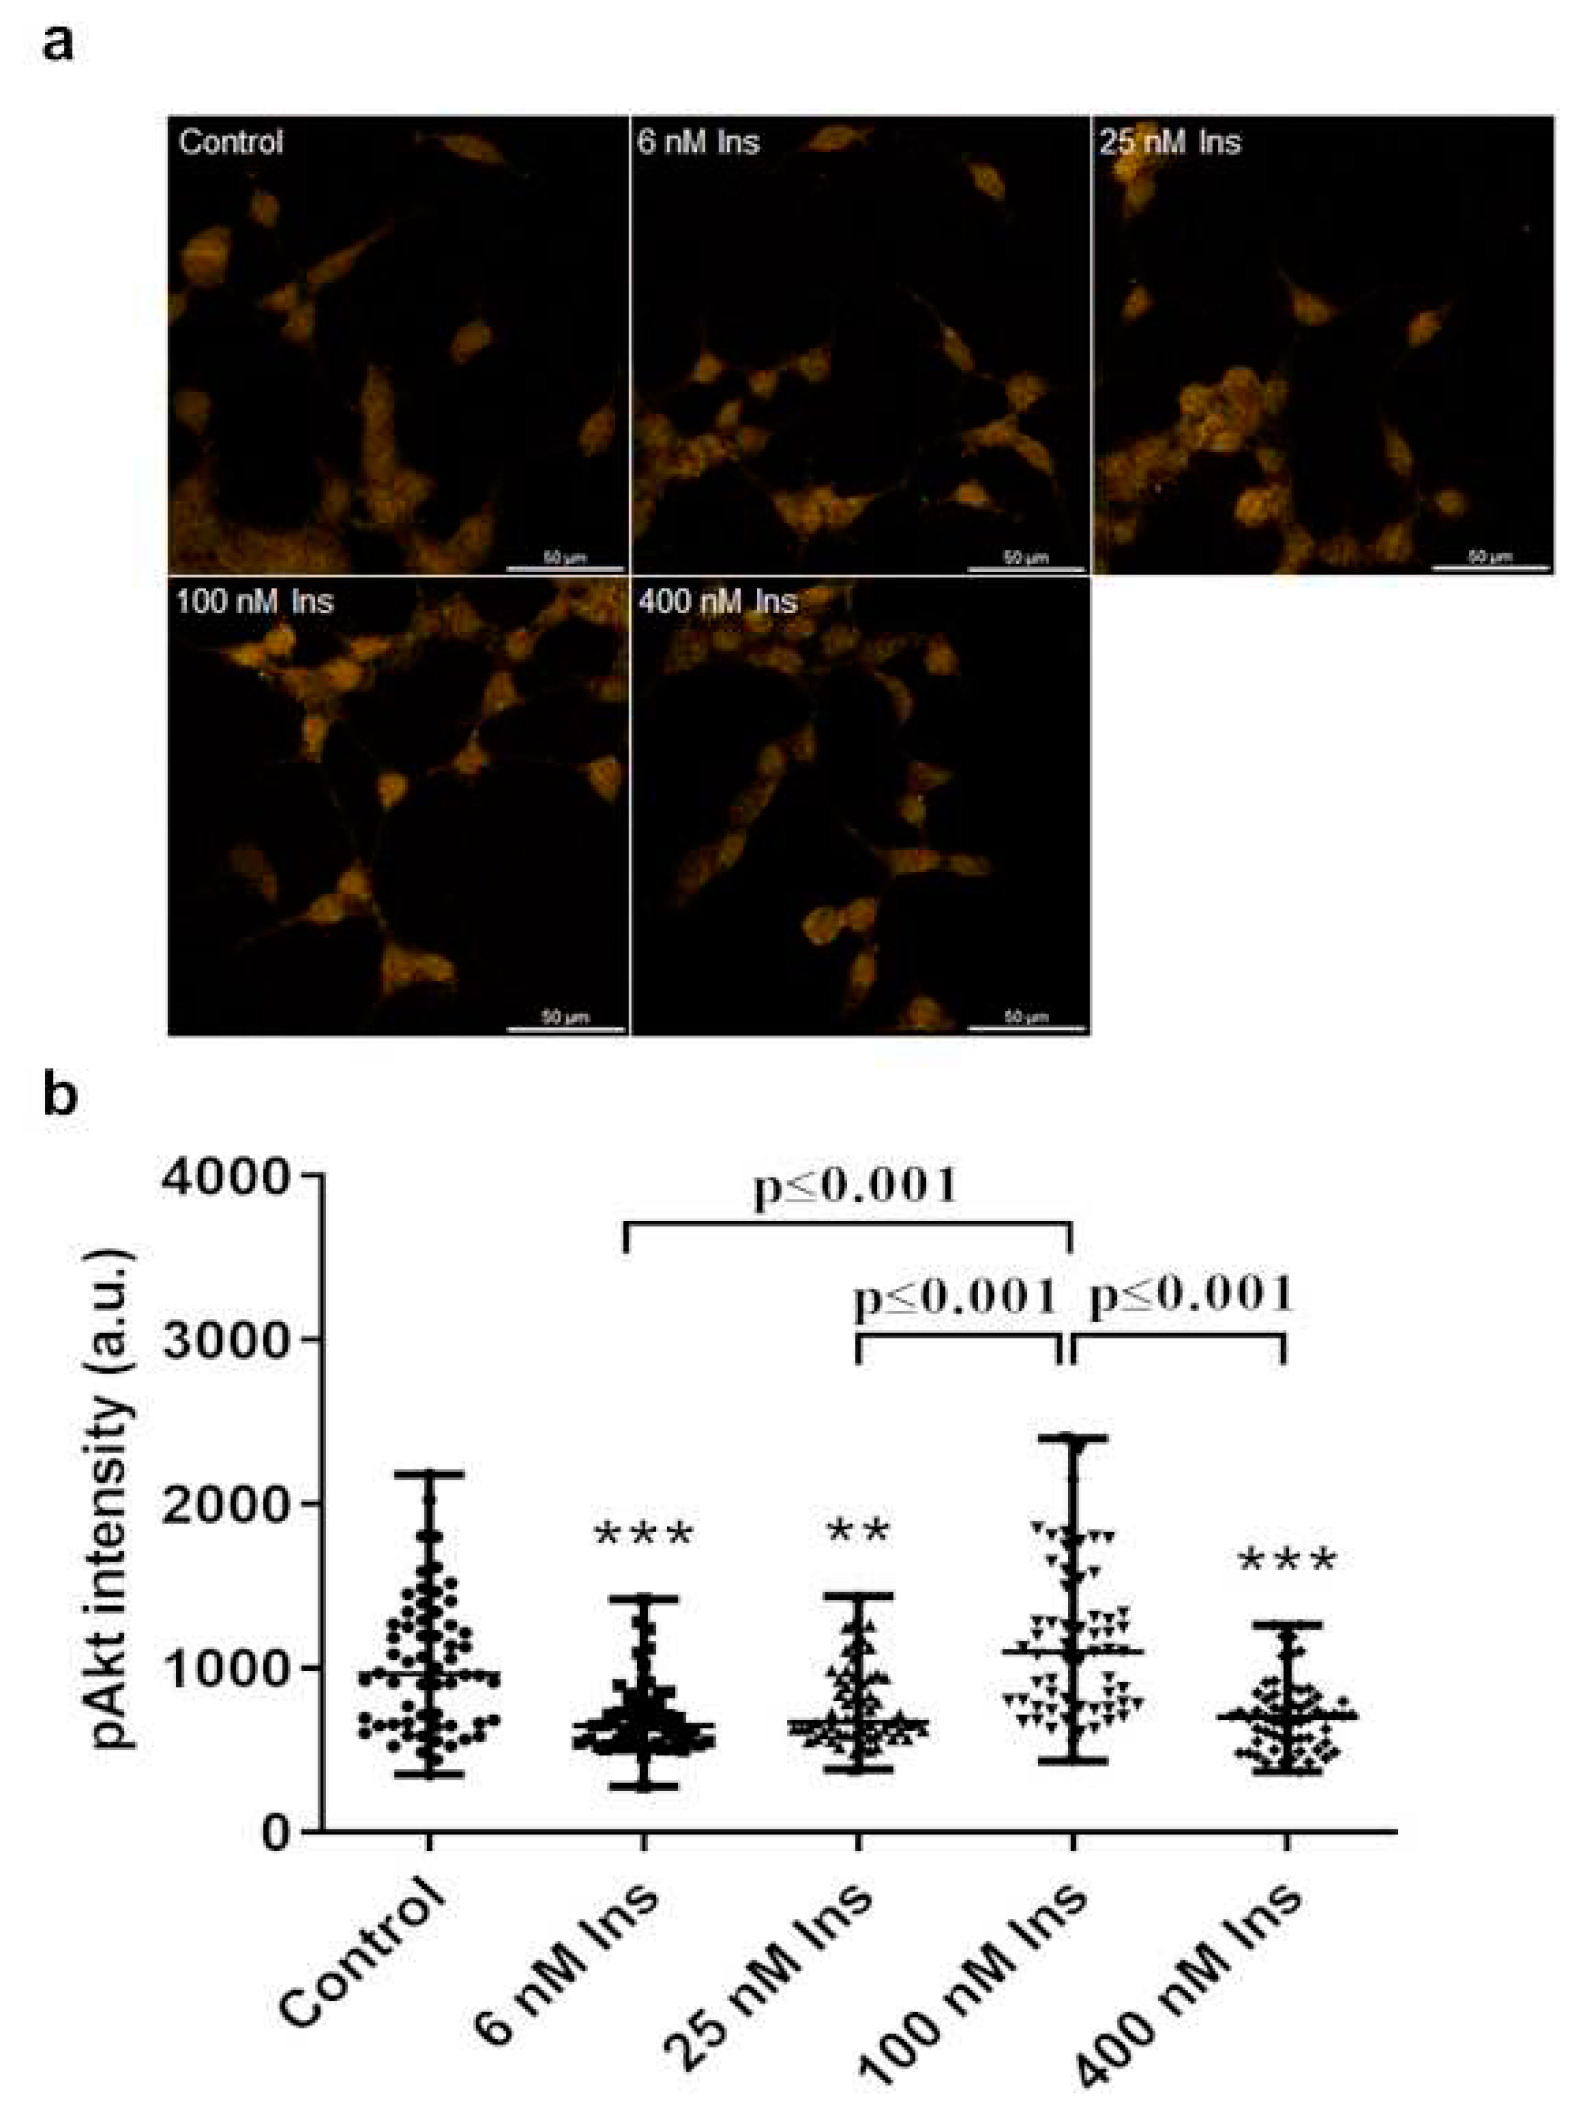
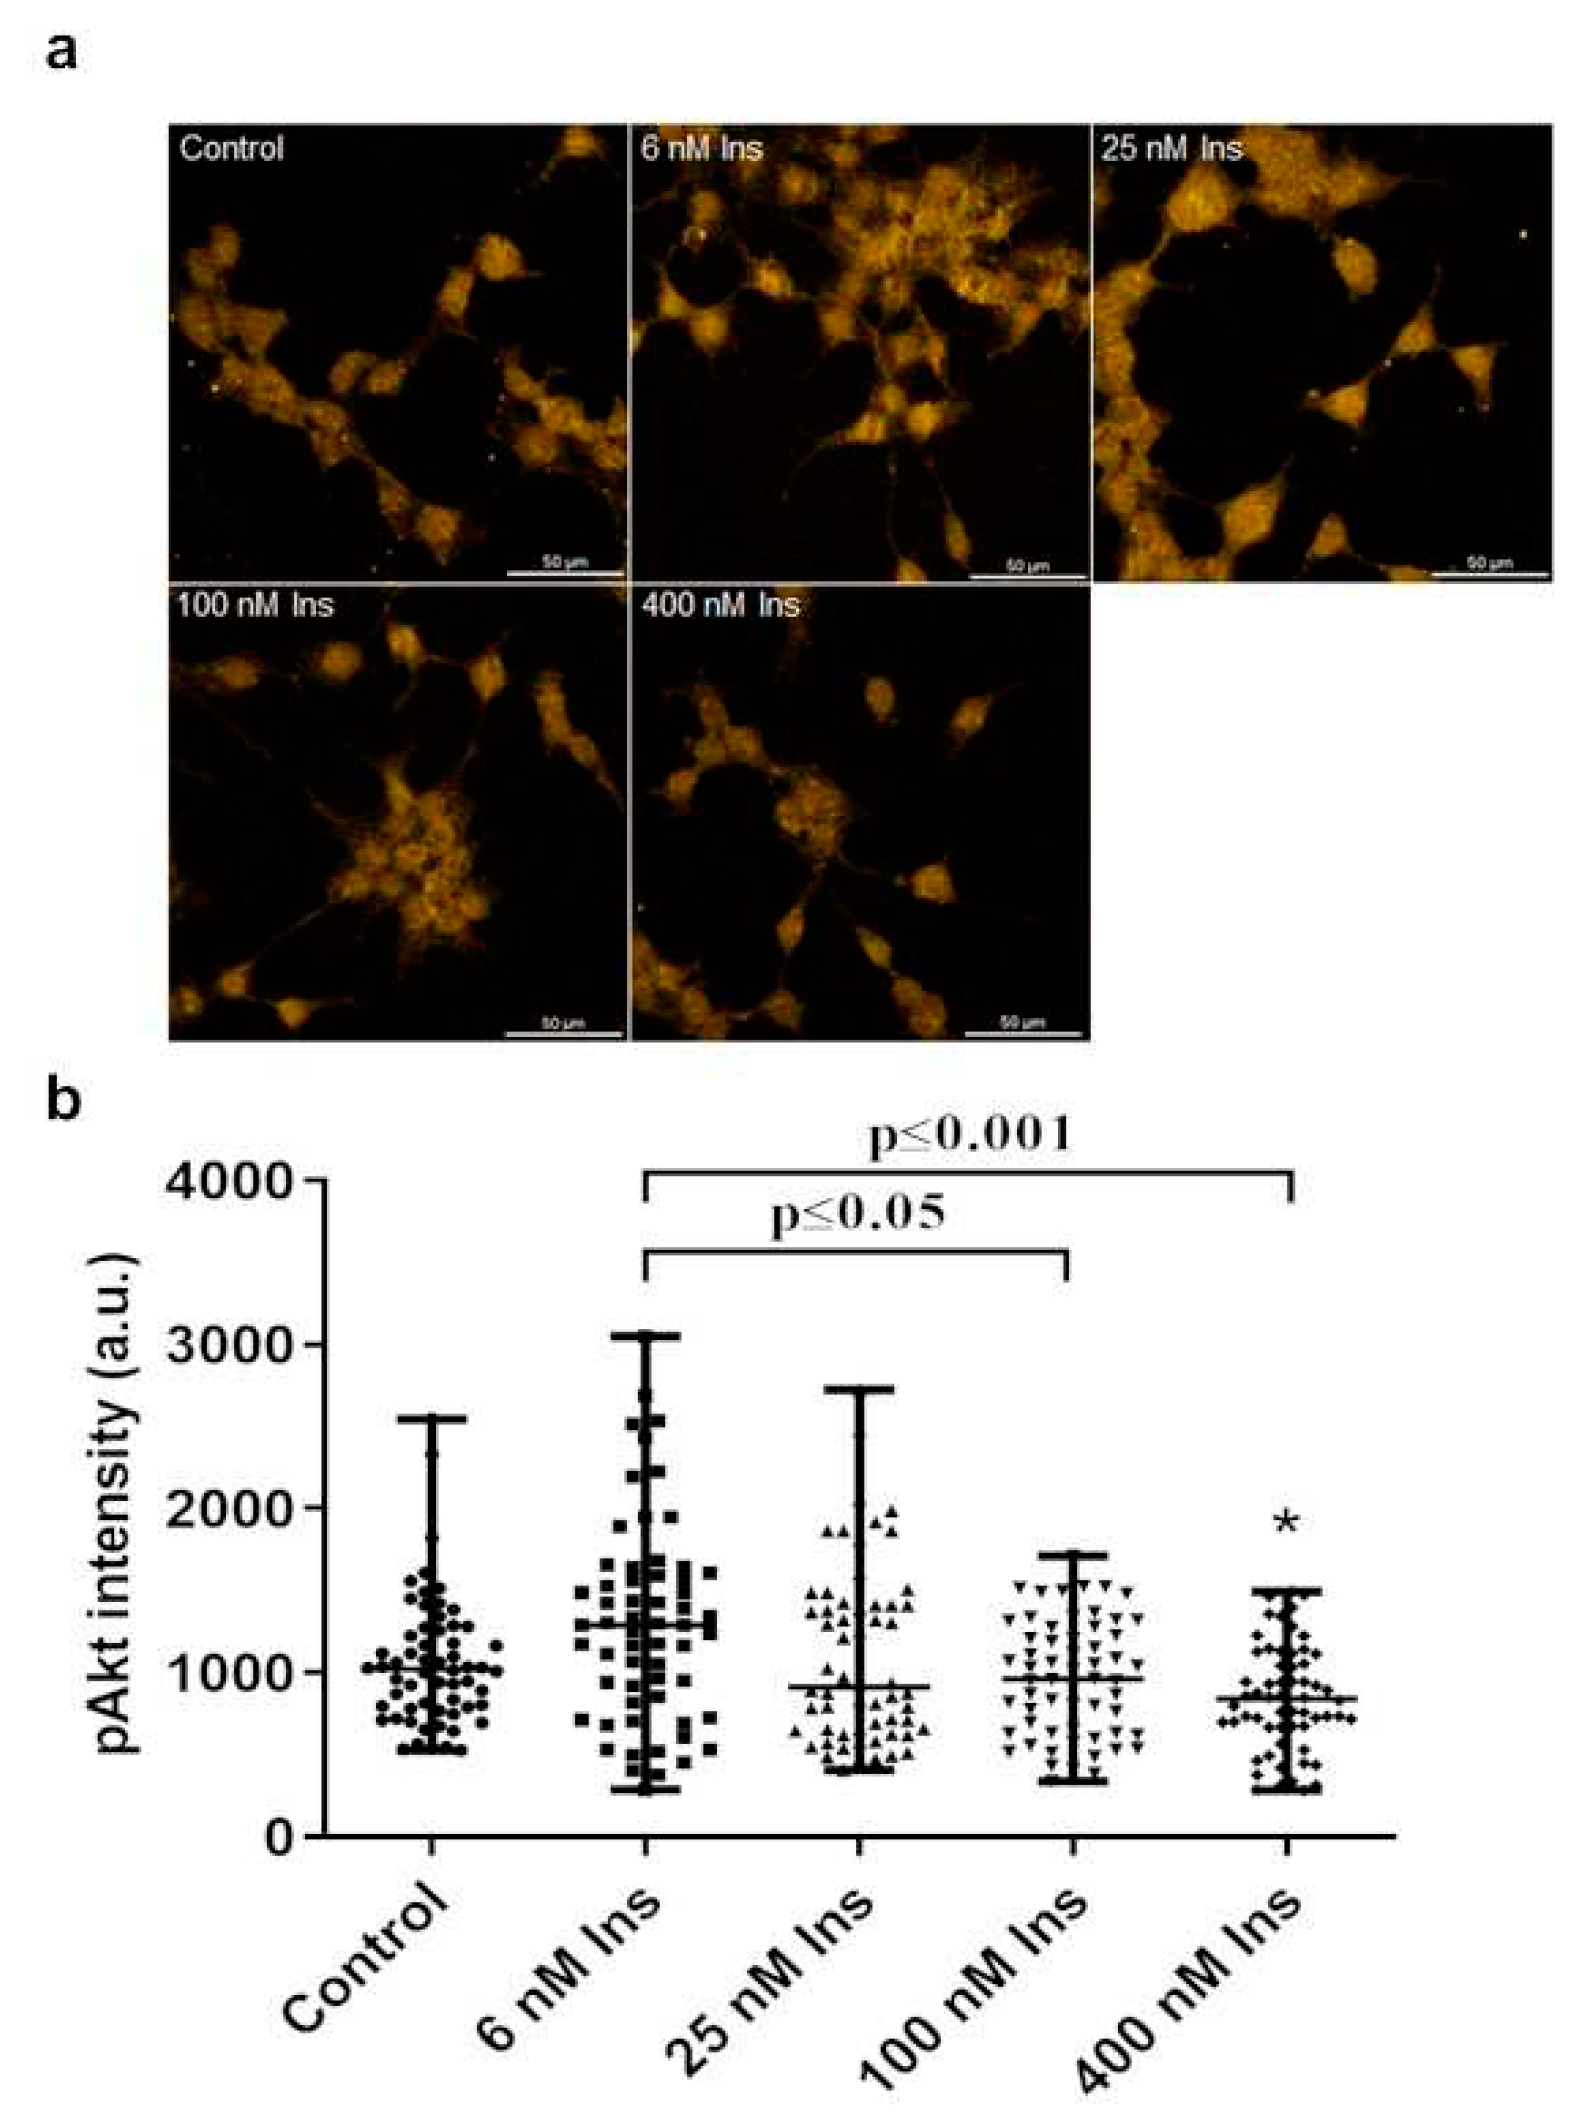
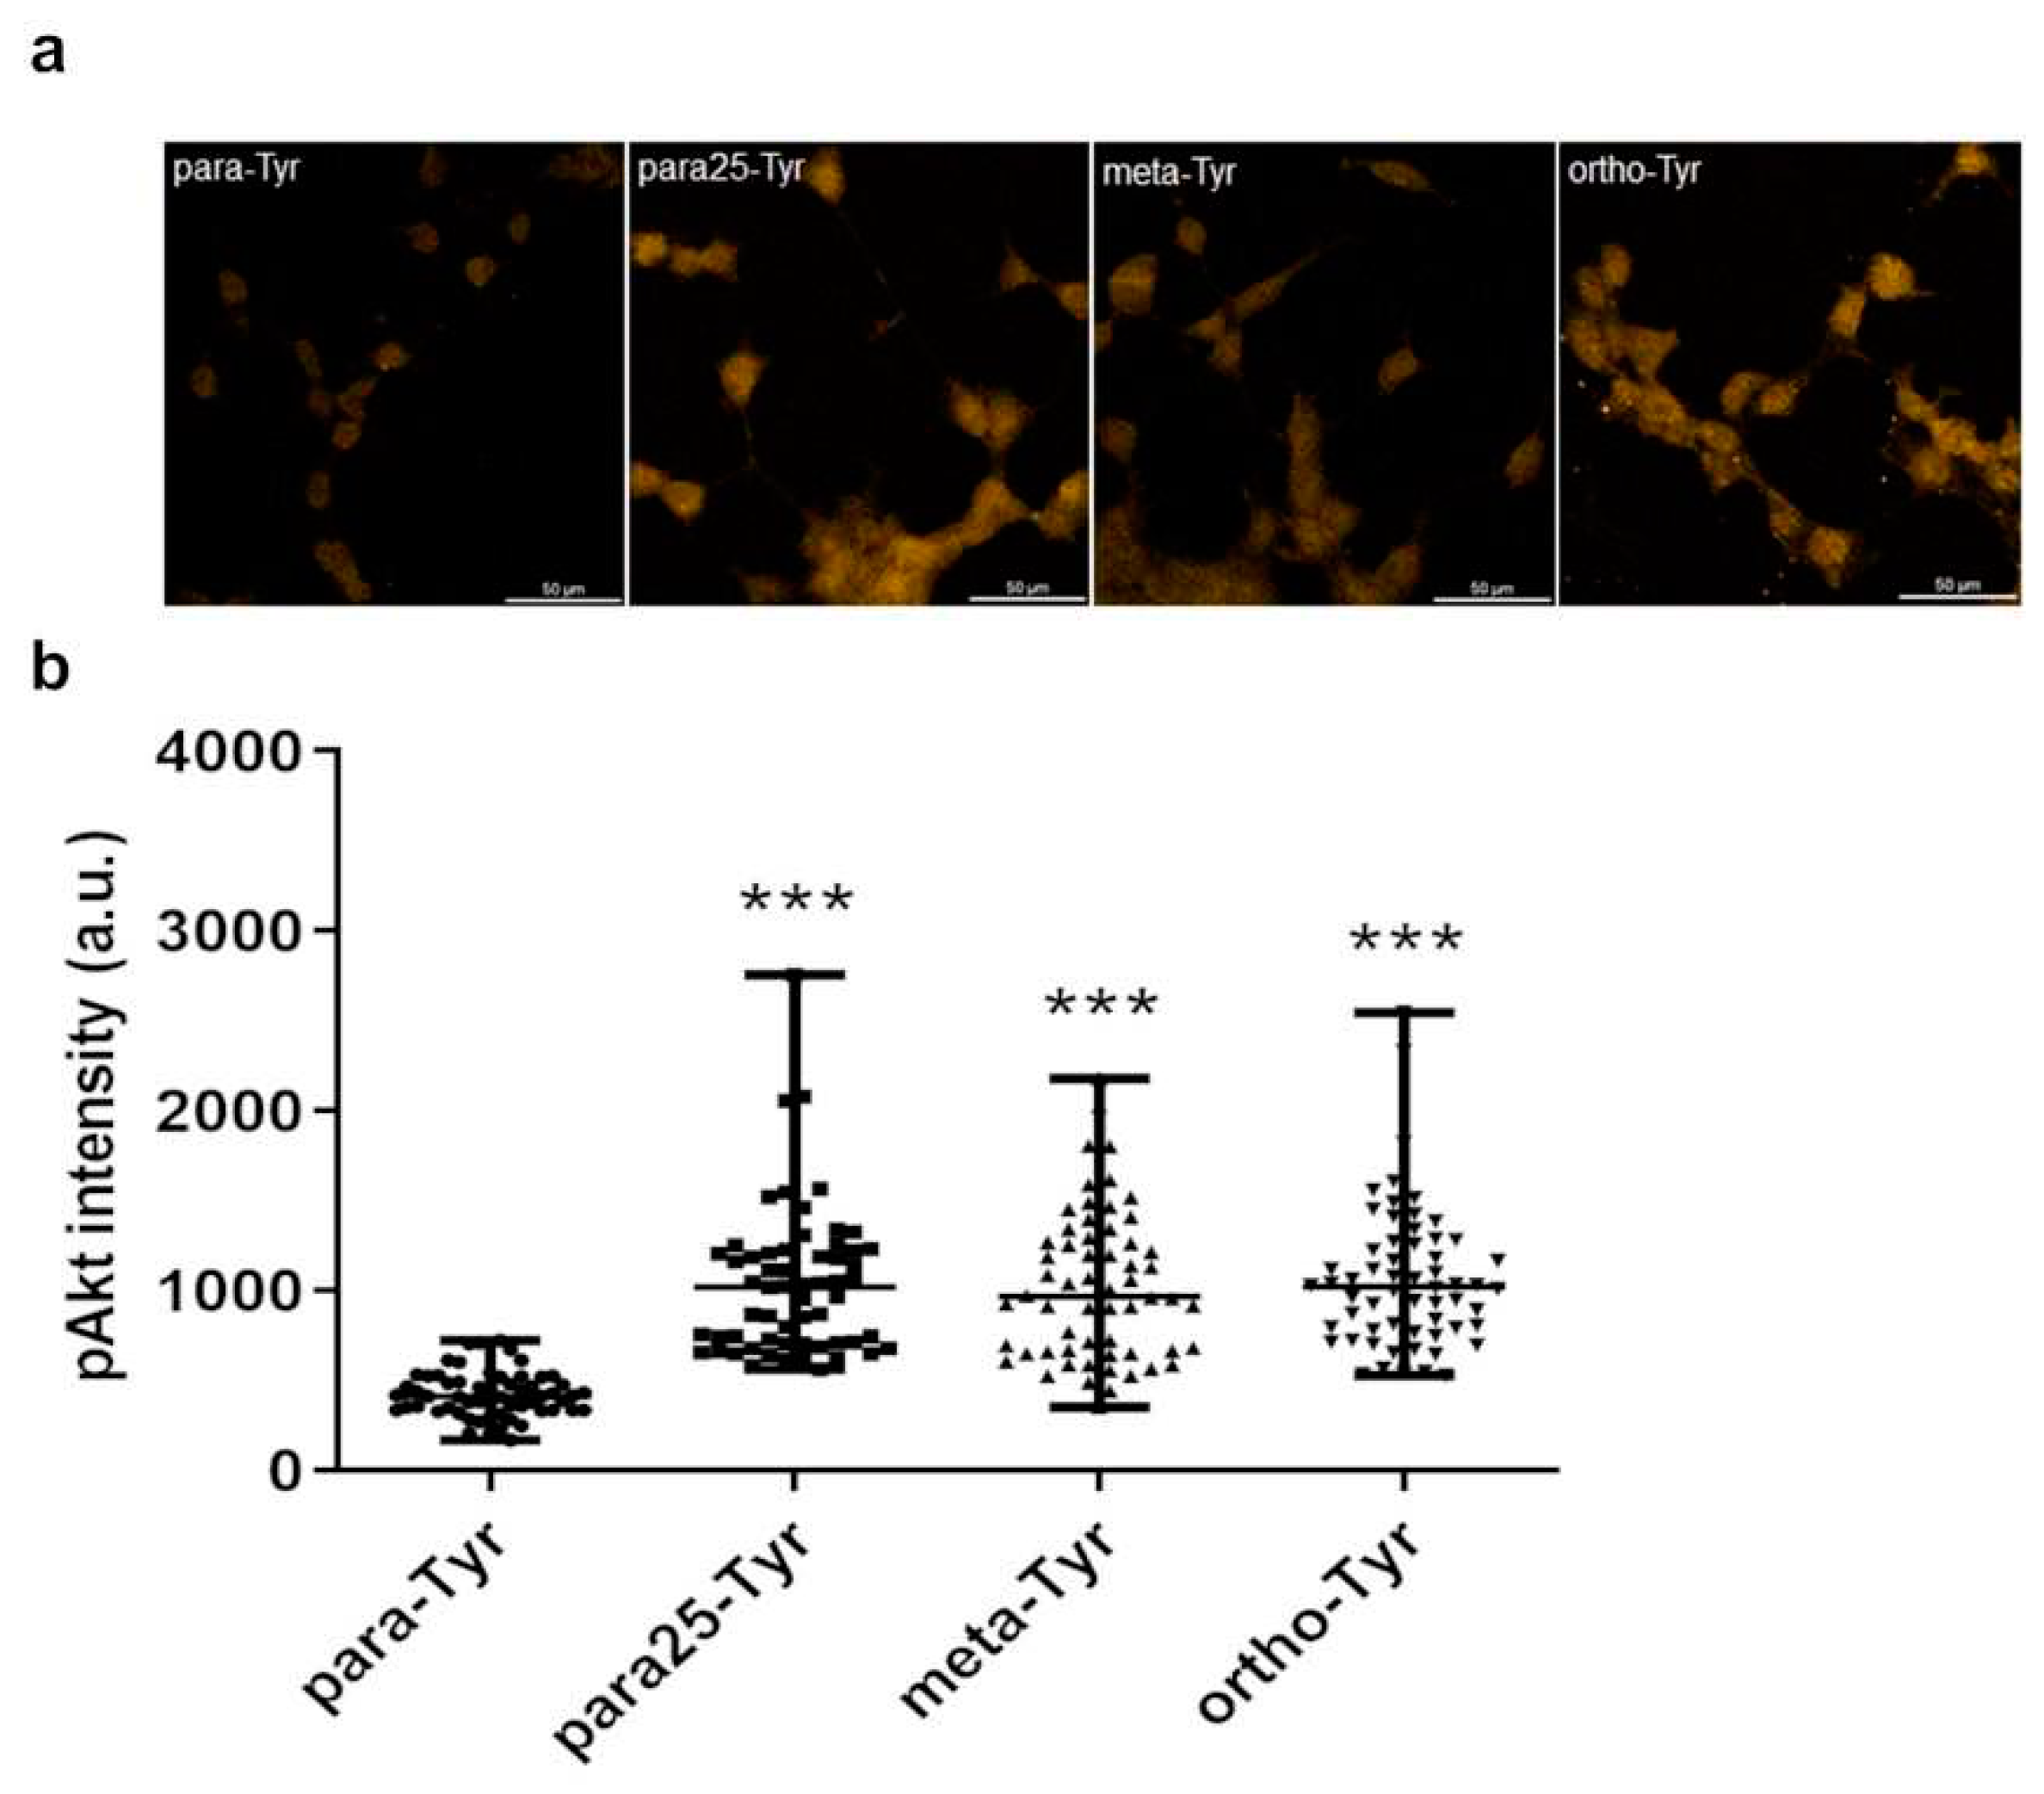
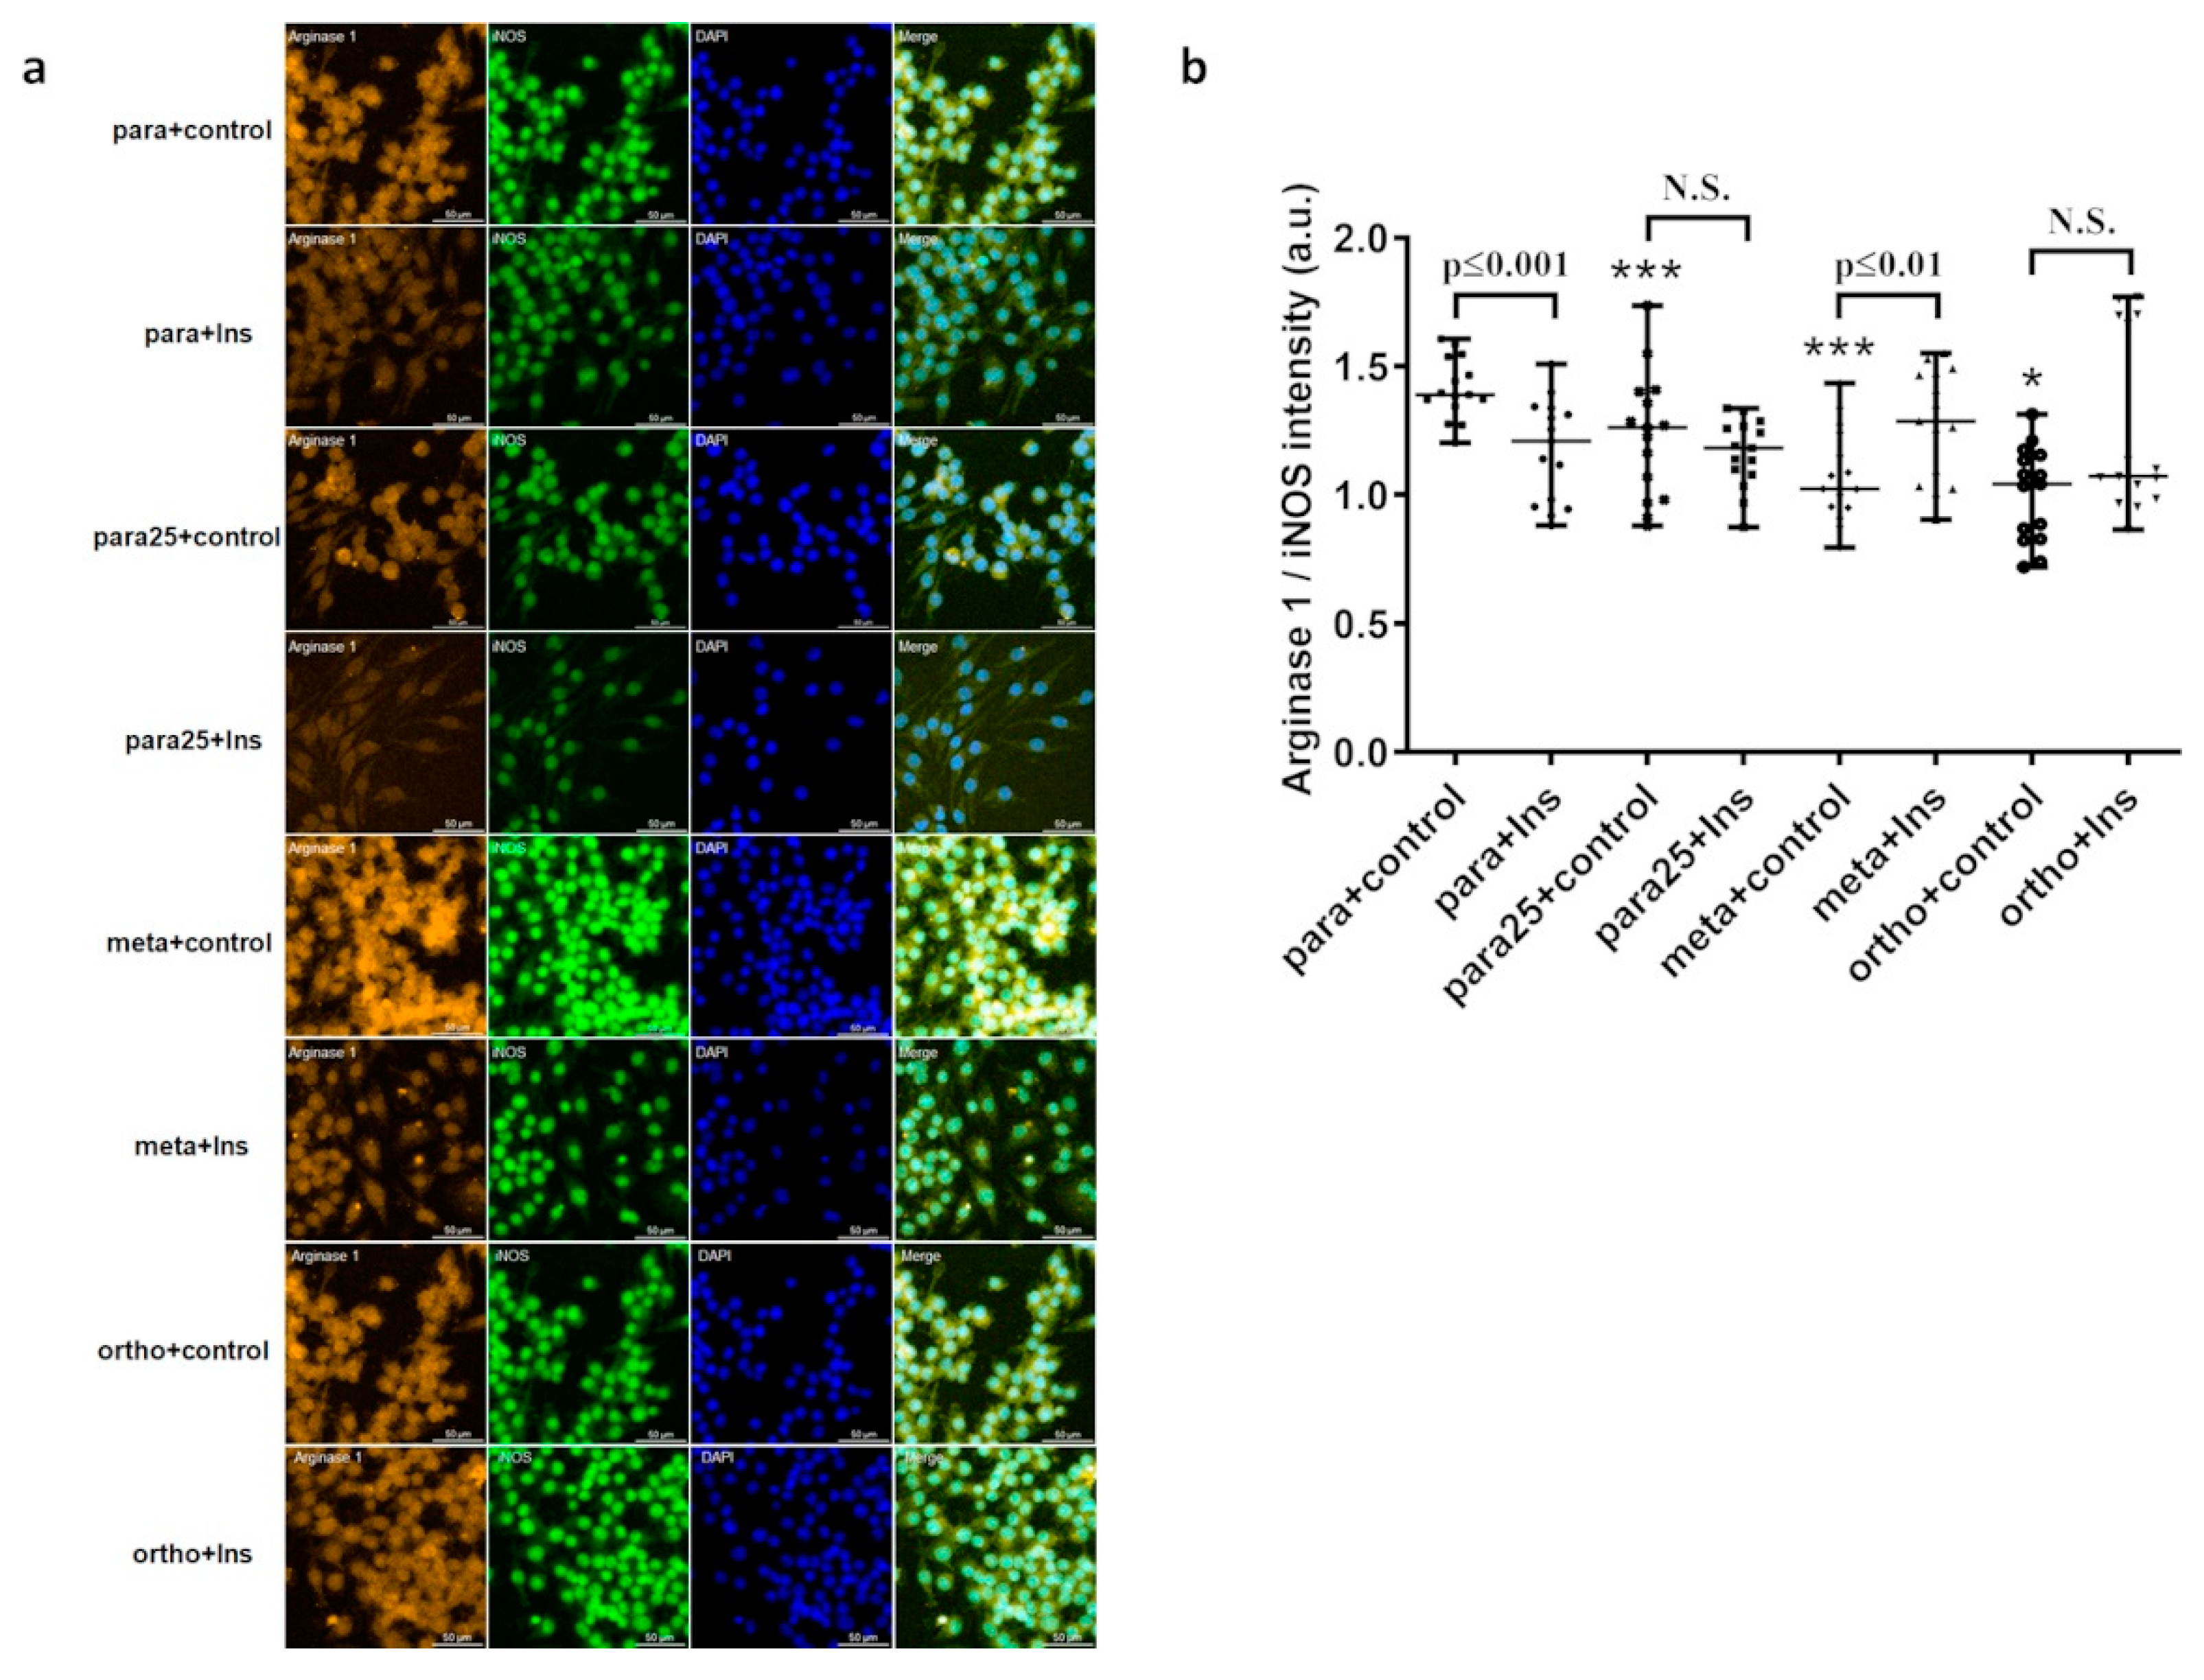
In our study, in the presence of physiological para-Tyr, as expected, insulin increased the amount of pAkt and decreased the arginase 1/iNOS ratio, suggesting an M1 polarization. Non-physiological meta- and ortho-Tyr increased pAkt levels and decreased the arginase 1/iNOS ratio in macrophages without insulin treatment, similar to the high glucose treatment. Meta- and ortho-Tyr reversed the increasing effect of insulin on pAkt. High glucose and orto-Tyr abolished the decreasing effect of insulin on the arginase 1/iNOS ratio. Moreover, in the case of meta-Tyr, the effect of insulin was reversed and it increased the arginase 1/iNOS ratio.
The results of pAkt and arginase 1/iNOS ratio measurements show a significant coherence, suggesting that non-physiological tyrosine isomers increase pAkt levels and reverse the effect of insulin on pAkt in macrophages, affecting M1/M2 polarization of macrophages.
Figure 1.
Immunofluorescence staining of cell membranes and DAPI staining of nuclei in J774A.1 macrophages.
Figure 1.
Immunofluorescence staining of cell membranes and DAPI staining of nuclei in J774A.1 macrophages.
Figure 2.
Amount of Tyr isomers in HEK cells on control medium (n=5/group) (a), and the amount of tyrosine isomers in cells on 3 Tyr isomers containing medium after different incubation times (n=6/group) (b). * meta-Tyr vs. para-Tyr p<0.05, # ortho-Tyr vs. para-Tyr p<0.05, § meta-Tyr vs. ortho-Tyr p<0.05.
Figure 3.
Effect of insulin treatment on pAkt levels in J774A.1 macrophages cultured in para-tyrosine (para-Tyr) contains medium. Immunofluorescence staining of pAkt (a), and measured staining intensity values of pAkt (b) in J774A.1 macrophages. ***p≤0.001 vs. control, n=60/group.
Figure 3.
Effect of insulin treatment on pAkt levels in J774A.1 macrophages cultured in para-tyrosine (para-Tyr) contains medium. Immunofluorescence staining of pAkt (a), and measured staining intensity values of pAkt (b) in J774A.1 macrophages. ***p≤0.001 vs. control, n=60/group.
Figure 4.
Effect of insulin treatment on pAkt levels in J774A.1 macrophages cultured in para-tyrosine contains medium with 25 mmol/L glucose (para25-Tyr group). Immunofluorescence staining of pAkt (a), and measured staining intensity values of pAkt (b) in J774A.1 macrophages. *p<0.05 vs. control, **p≤0.01 vs. control, ***p≤0.001 vs. control, n=60/group.
Figure 5.
Effect of insulin treatment on pAkt levels in J774A.1 macrophages cultured in meta-tyrosine (meta-Tyr) contains medium. Immunofluorescence staining of pAkt (a), and measured staining intensity values of pAkt (b) in J774A.1 macrophages. **p≤0.01 vs. control, ***p≤0.001 vs. control, n=60/group.
Figure 6.
Effect of insulin treatment on pAkt levels in J774A.1 macrophages cultured in ortho-tyrosine (ortho-Tyr) contains medium. Immunofluorescence staining of pAkt (a), and measured staining intensity values of pAkt (b) in J774A.1 macrophages. *p<0.05 vs. control, n=60/group.
Figure 6.
Effect of insulin treatment on pAkt levels in J774A.1 macrophages cultured in ortho-tyrosine (ortho-Tyr) contains medium. Immunofluorescence staining of pAkt (a), and measured staining intensity values of pAkt (b) in J774A.1 macrophages. *p<0.05 vs. control, n=60/group.
Figure 7.
Comparison of the pAkt labeling intensity between the non-insulin treated controls of para-, para25-, meta-, and ortho-Tyr group. Immunofluorescence staining of pAkt (a), and measured staining intensity values of pAkt (b) in J774A.1 macrophages. ***p≤0.001 vs. control, n=60/group.
Figure 7.
Comparison of the pAkt labeling intensity between the non-insulin treated controls of para-, para25-, meta-, and ortho-Tyr group. Immunofluorescence staining of pAkt (a), and measured staining intensity values of pAkt (b) in J774A.1 macrophages. ***p≤0.001 vs. control, n=60/group.
Figure 8.
Immunofluorescence and DAPI staining (a) and effects of para-, para25-, meta-, and ortho-Tyr treatment on the arginase 1/iNOS ratio alone and with insulin in J774A.1 macrophages (b). *p≤0.05 vs. control, ***p≤0.001 vs. control, n=15/group.
Figure 8.
Immunofluorescence and DAPI staining (a) and effects of para-, para25-, meta-, and ortho-Tyr treatment on the arginase 1/iNOS ratio alone and with insulin in J774A.1 macrophages (b). *p≤0.05 vs. control, ***p≤0.001 vs. control, n=15/group.
