Submitted:
15 December 2023
Posted:
18 December 2023
You are already at the latest version
Abstract
Keywords:
1. Introduction
2. Results
2.1. HPTLC-UV/Vis Method Development

2.2. UV/Vis Method Development
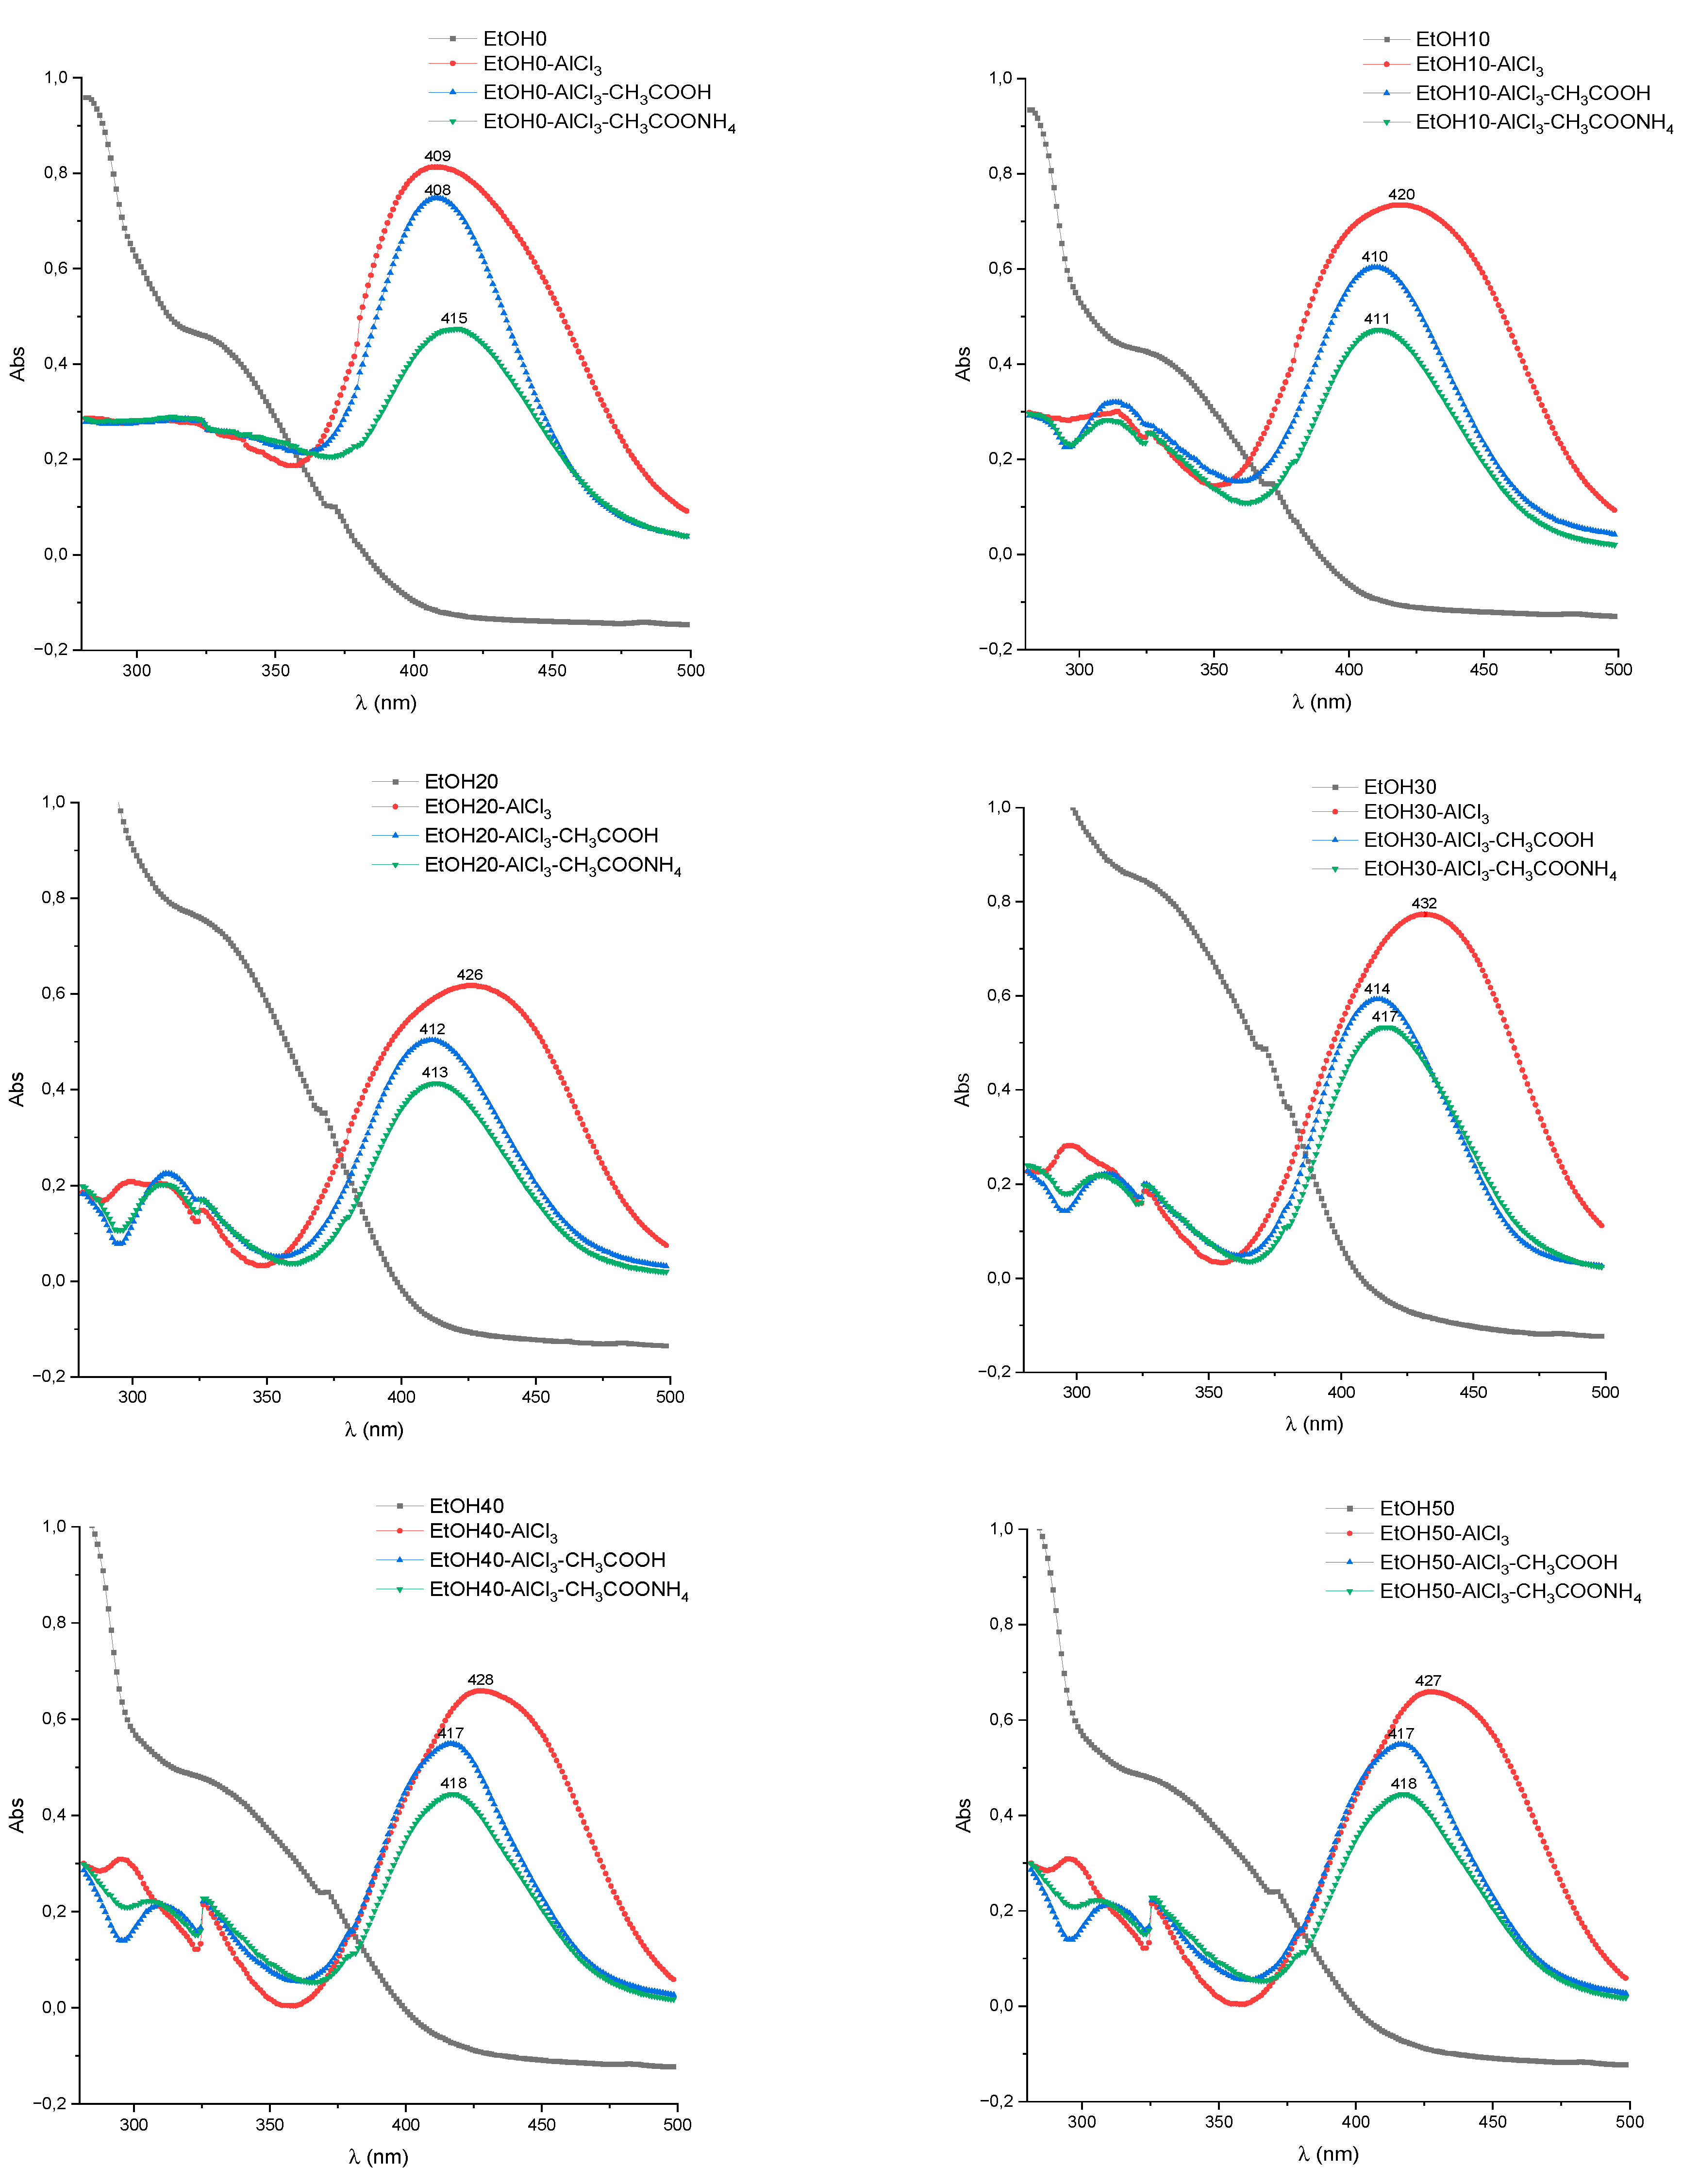
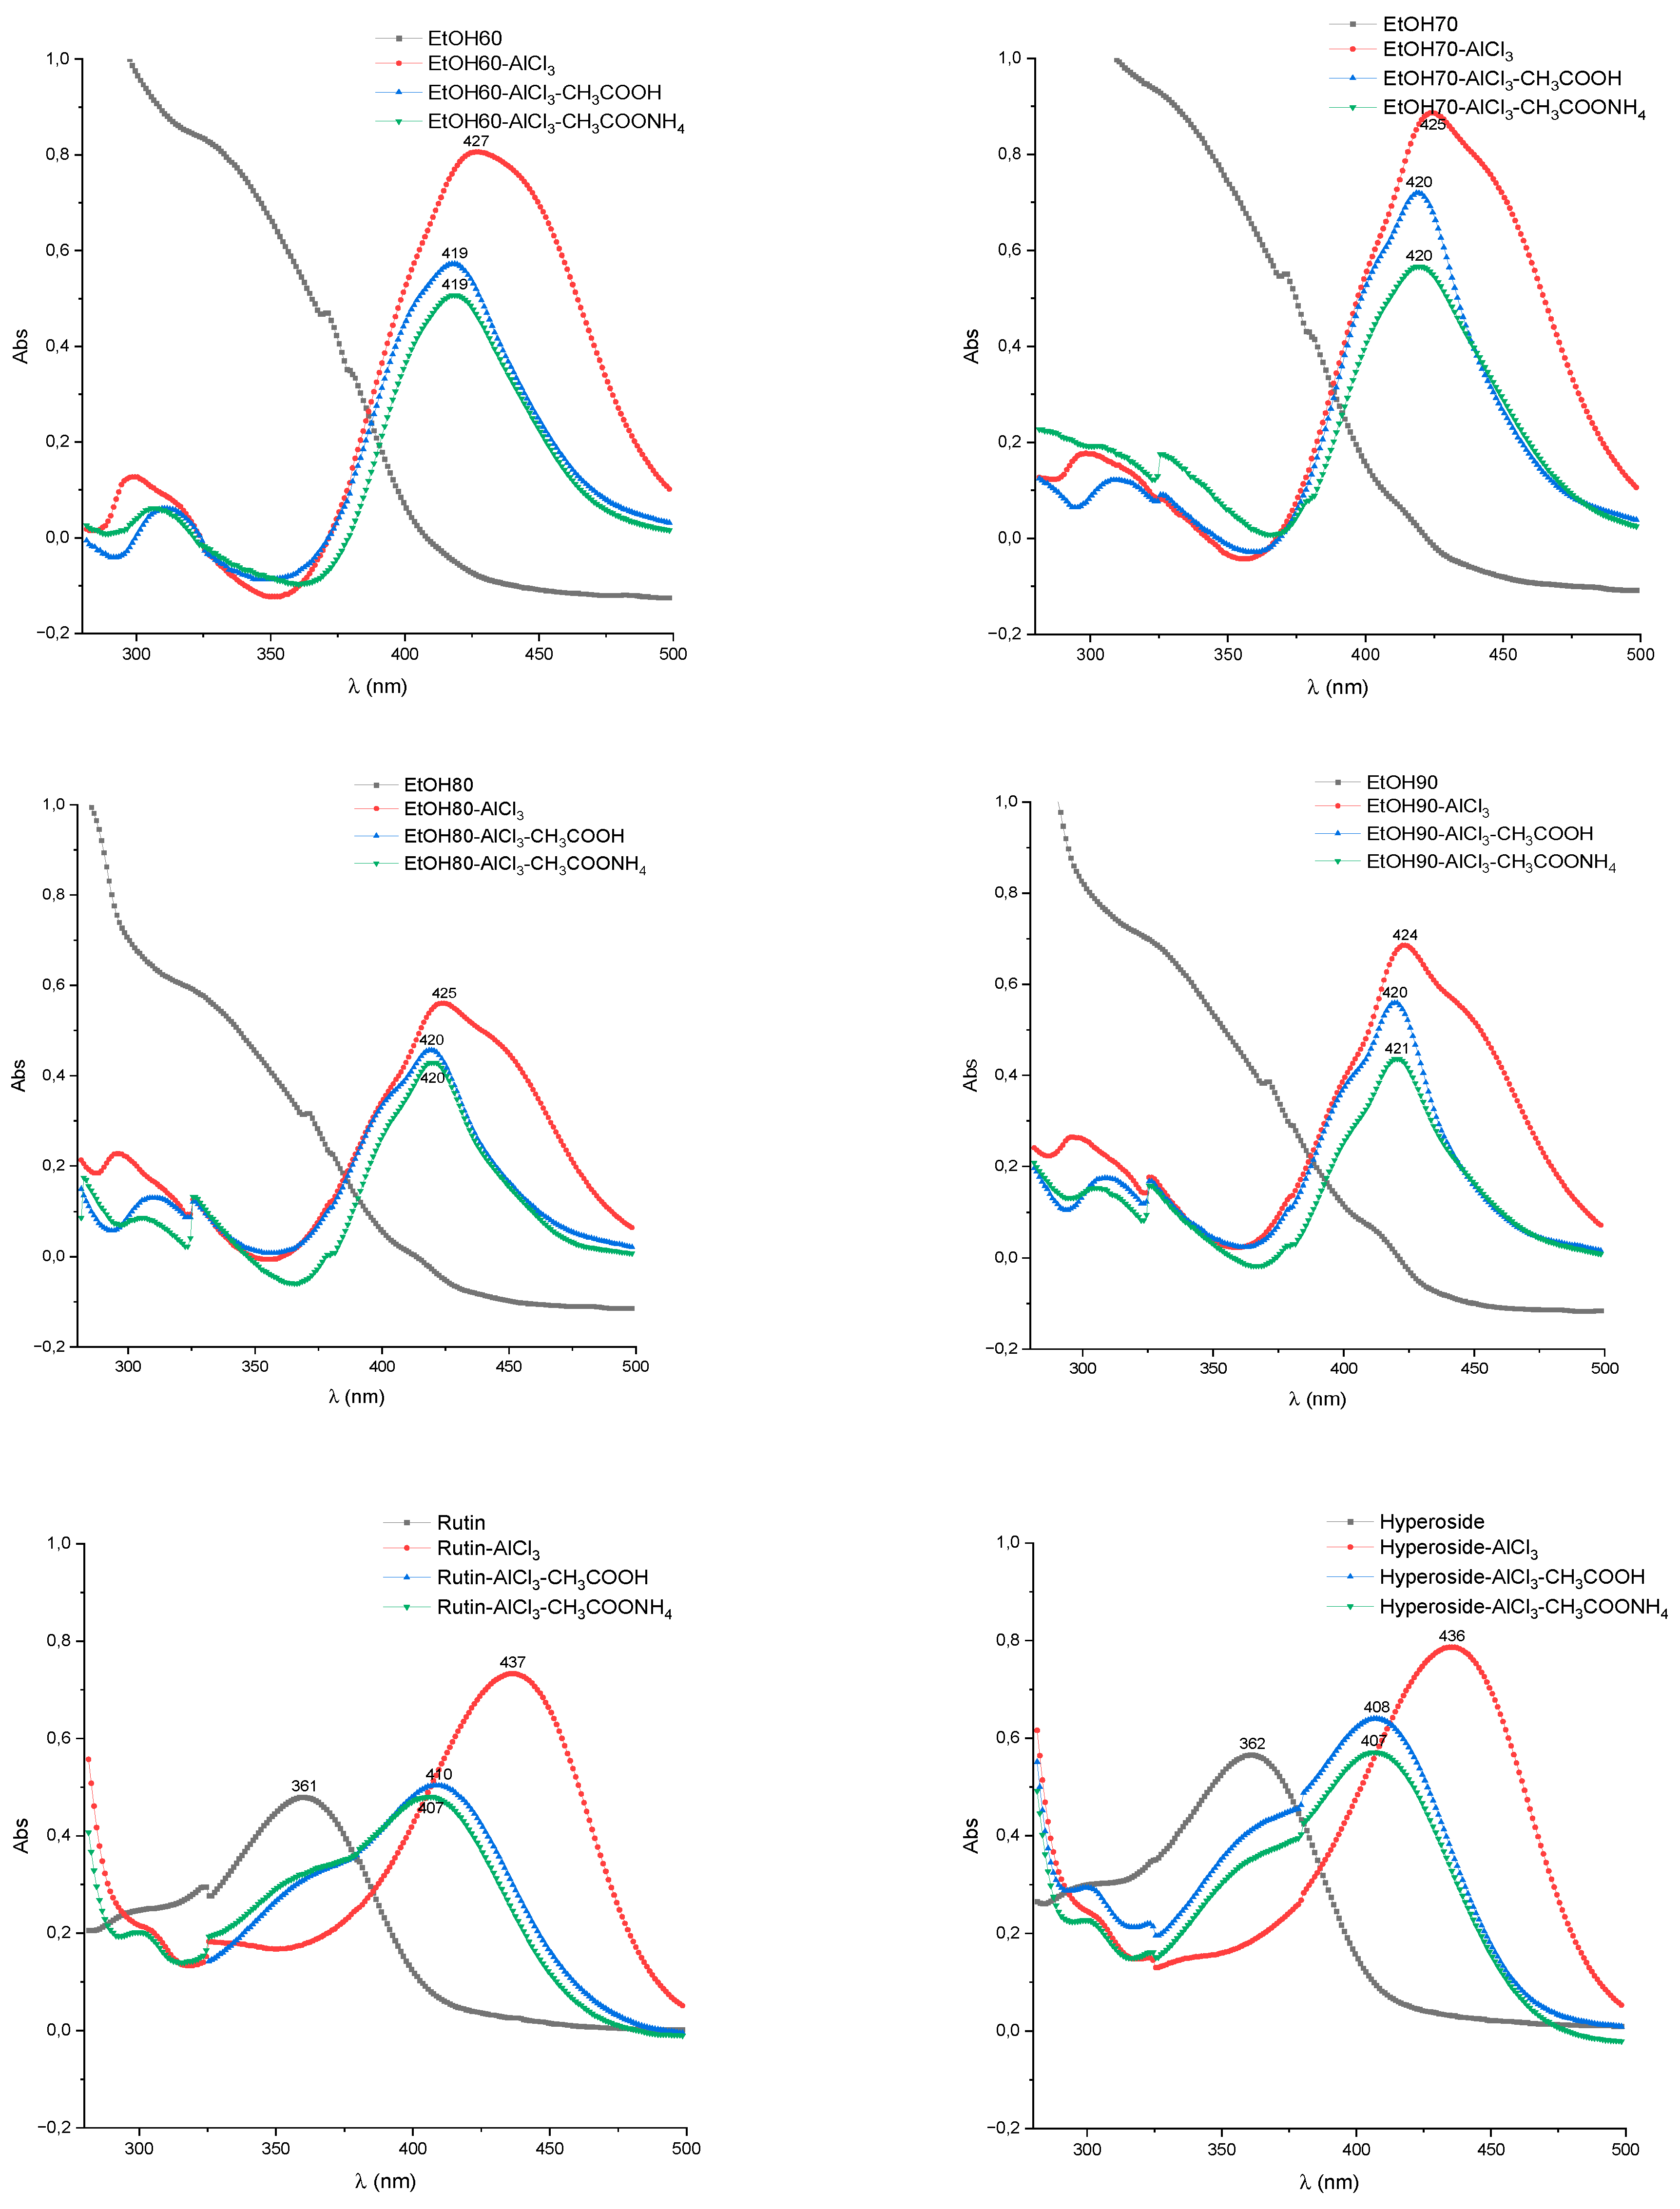
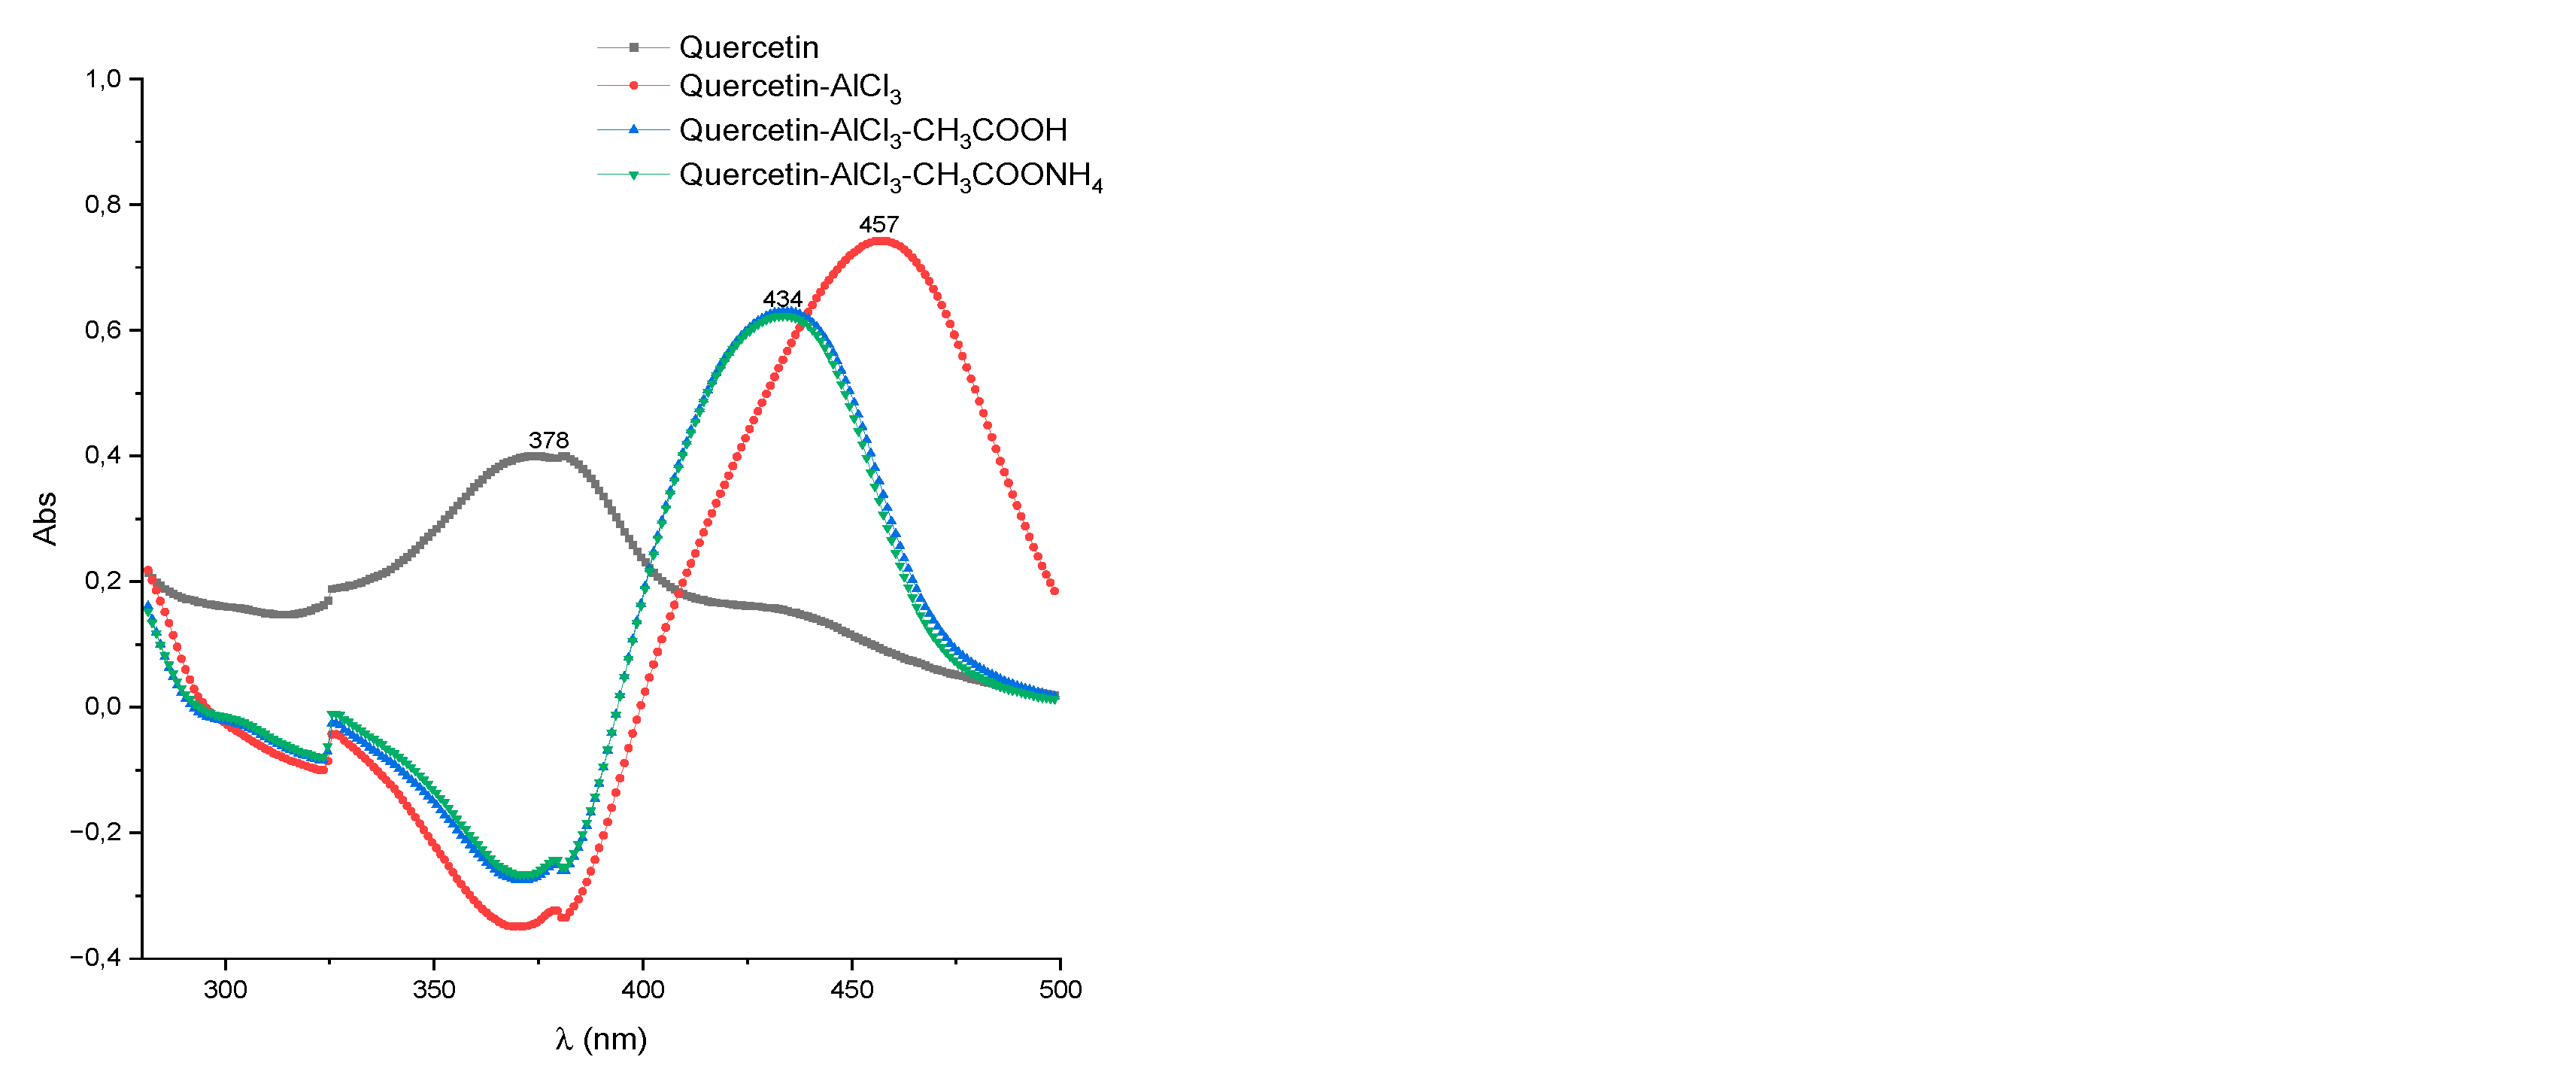
| Test specimen | Band I, λmax nm | Shift of band I, λmax nm | ||
|---|---|---|---|---|
| Method I(AlCl3) | Method II (AlCl3-CH3COOH) |
Method III (AlCl3-СН3СООNH4) |
||
| EtOH0 | 336-338 | 399-403 | 404-408 | 409-413 |
| EtOH10 | 336-340 | 417-423 | 407-411 | 408-413 |
| EtOH20 | 340-344 | 424-428 | 410-413 | 411-414 |
| EtOH30 | 346-349 | 427-431 | 413-416 | 415-419 |
| EtOH40 | 345-347 | 429-432 | 412-415 | 415-418 |
| EtOH50 | 338-341 | 423-427 | 414-417 | 417-421 |
| EtOH60 | 345-350 | 426-428 | 417-419 | 417-420 |
| EtOH70 | 347-351 | 423-425 | 418-420 | 418-420 |
| EtOH80 | 337-342 | 422-426 | 418-420 | 419-421 |
| EtOH90 | 339-344 | 422-424 | 419-421 | 419-422 |
| Rutin | 358-361 | 435-439 | 407-410 | 404-408 |
| Hyperoside | 360-362 | 434-437 | 406-408 | 405-408 |
| Quercetin | 380 | 454-458 | 432-435 | 431-434 |
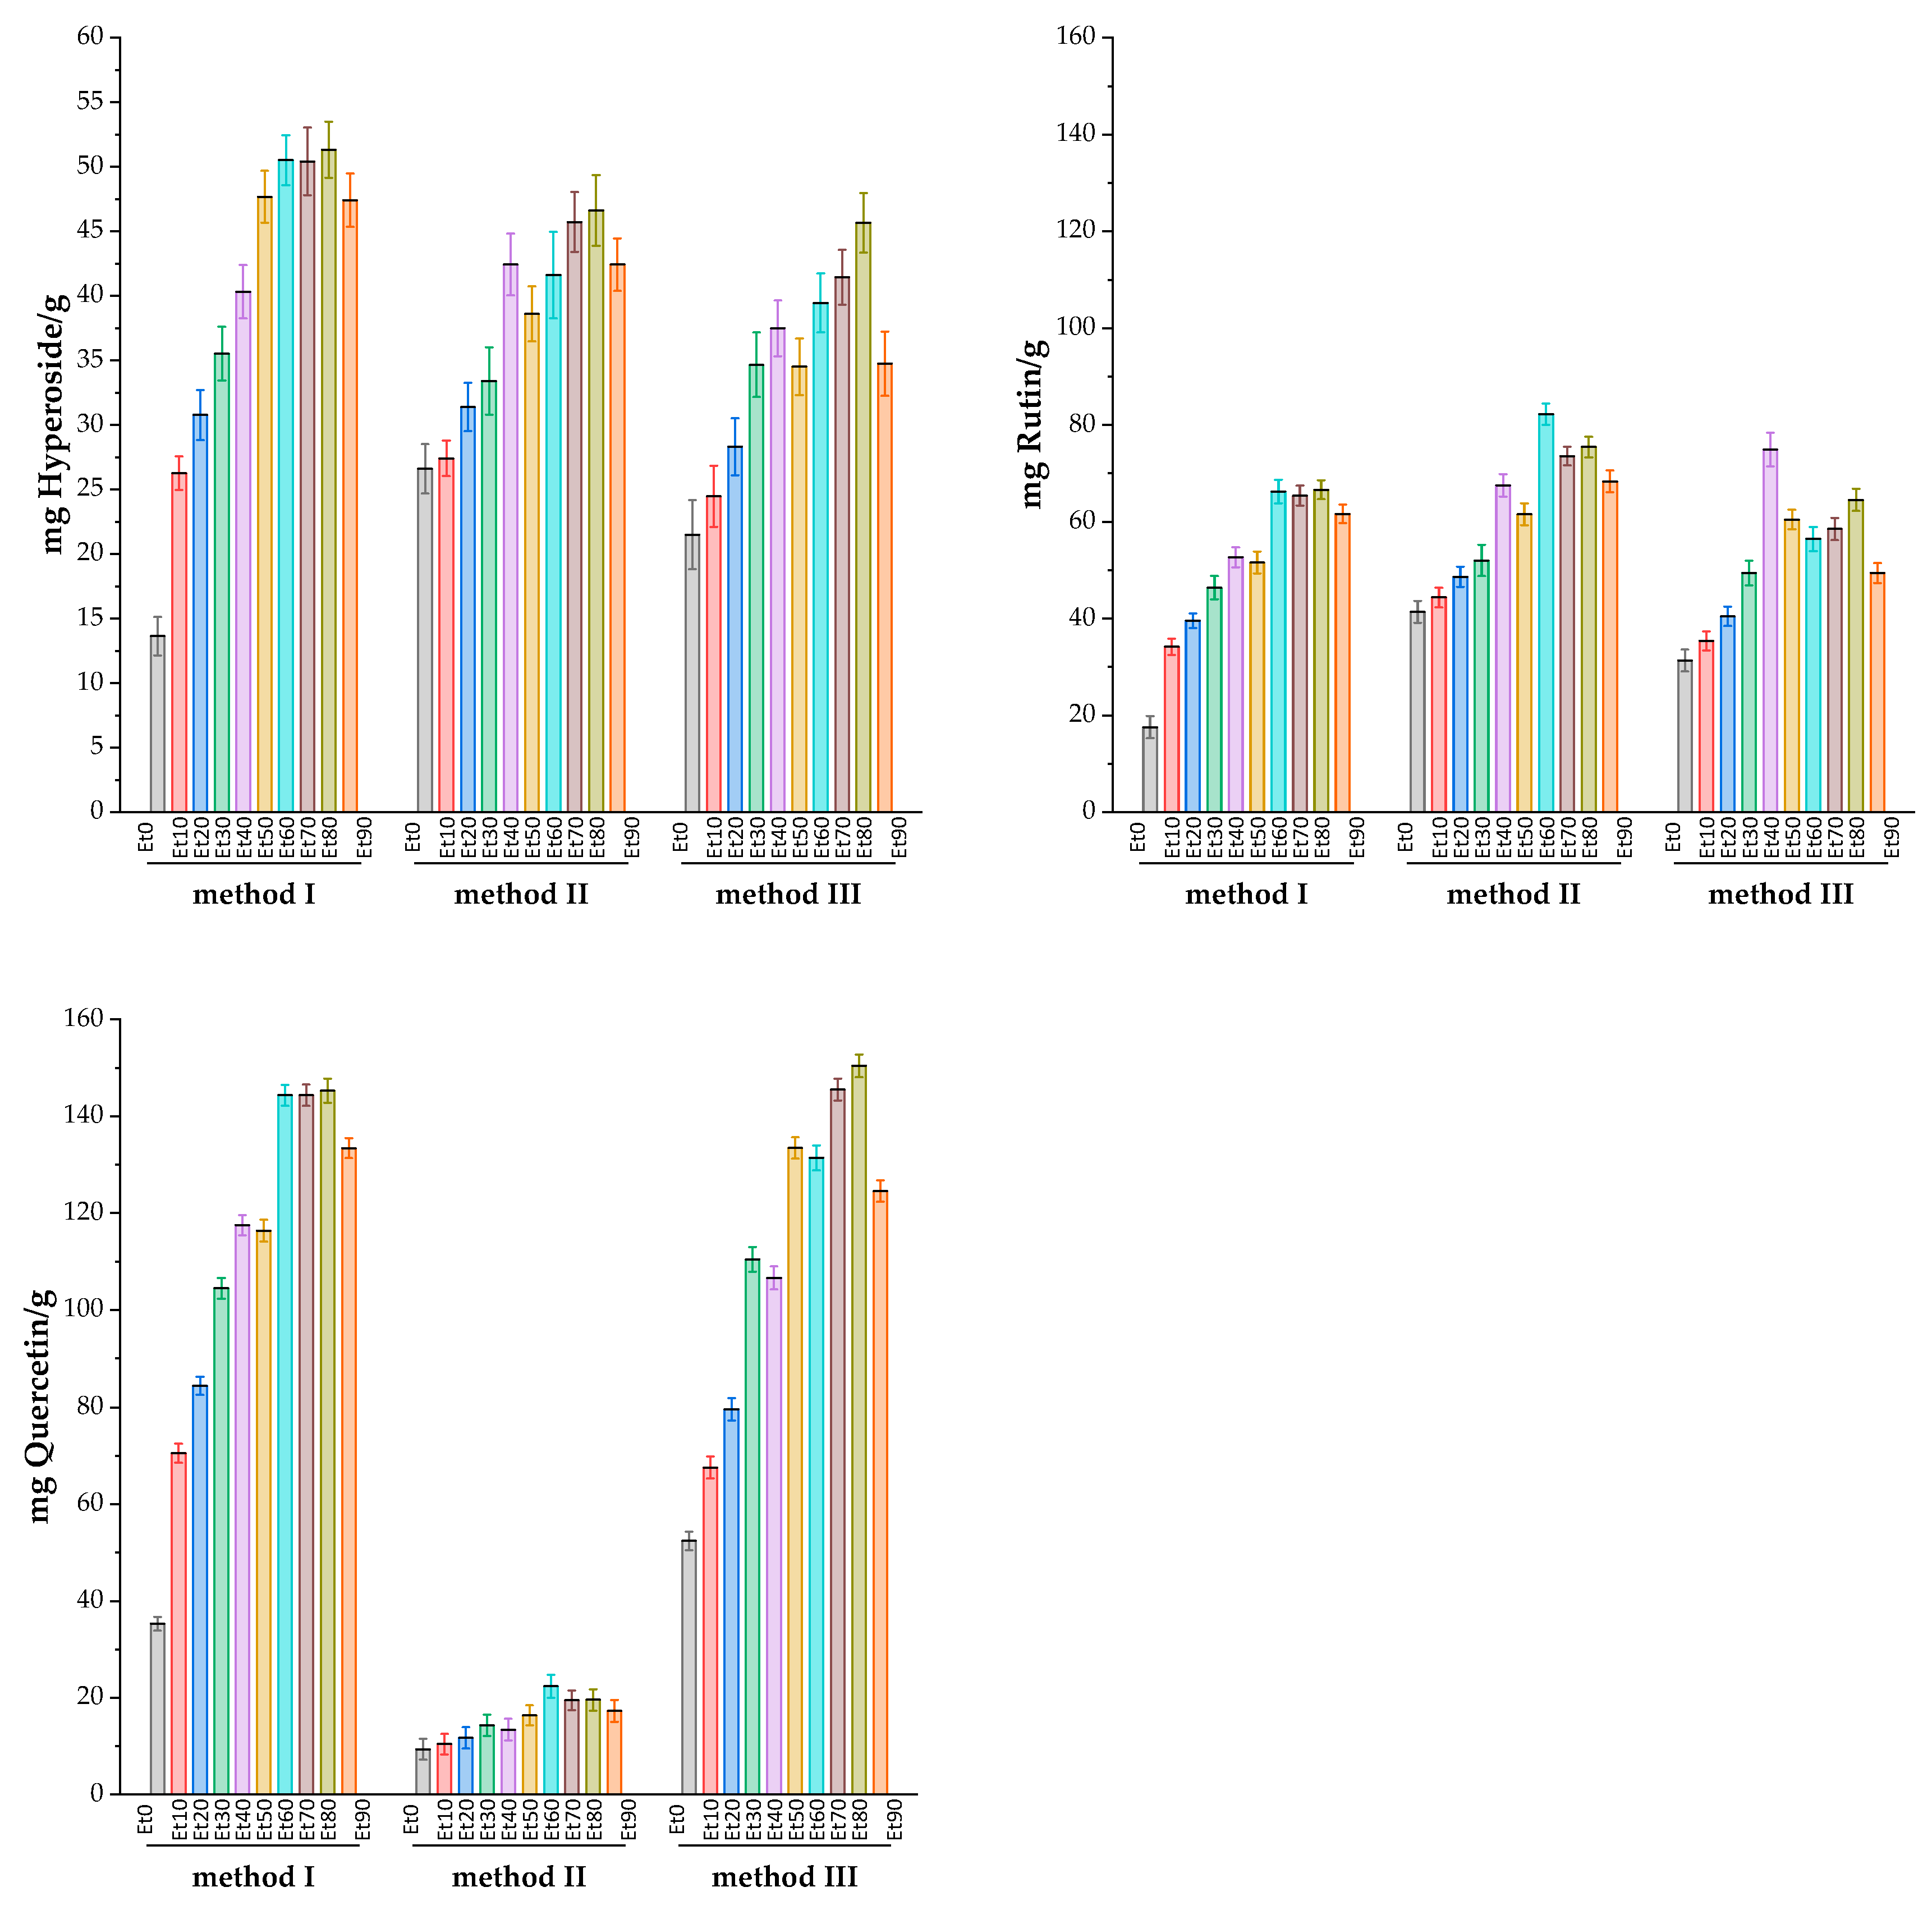
| Sample | Weight of the dry extract sample, g/g |
Total Flavonoids in dry extract of Rhododendron tomentosum in terms of standard, mg/g | ||||||||
|---|---|---|---|---|---|---|---|---|---|---|
| Method I | Method II | Method III | ||||||||
| mg R/g | mg H/g | mg Q/g | mg R/g | mg H/g | mg Q/g | mg R/g | mg H/g | mg Q/g | ||
| EtOH0 | 0.13 | 17.99±1.18 | 13.89±0.76 | 31.67±0.72 | 41.03±1.16 | 26.36±0.98 | 9.38±1.11 | 31.29±1.15 | 21.52±1.37 | 52.42±0.99 |
| EtOH10 | 0.09 | 34.34±0.87 | 26.37±0.66 | 70.97±1.02 | 44.05±1.04 | 28.20±0.70 | 10.43±1.08 | 35.52±1.00 | 24.56±1.21 | 67.25±1.16 |
| EtOH20 | 0.15 | 39.76±0.76 | 30.46±0.99 | 84.34±0.97 | 48.72±1.06 | 31.11±0.95 | 11.90±1.13 | 40.68±1.02 | 28.23±1.13 | 79.67±1.20 |
| EtOH30 | 0.16 | 46.77±1.23 | 35.80±1.06 | 104.22±1.09 | 52.39±1.64 | 33.11±1.33 | 14.29±1.13 | 49.49±1.30 | 34.54±1.28 | 110.18±1.31 |
| EtOH40 | 0.16 | 52.64±1.05 | 40.25±1.05 | 117.82±1.07 | 67.83±1.18 | 42.65±1.22 | 13.53±1.14 | 74.84±1.77 | 37.37±1.11 | 106.79±1.21 |
| EtOH50 | 0.18 | 51.56±1.16 | 47.96±1.02 | 116.76±1.14 | 61.77±1.13 | 38.85±1.09 | 16.24±1.06 | 60.43±1.02 | 34.68±1.11 | 133.36±1.14 |
| EtOH60 | 0.17 | 66.05±1.23 | 50.60±0.98 | 144.51±1.11 | 82.10±1.12 | 41.08±1.70 | 22.31±1.22 | 56.43±1.27 | 39.57±1.17 | 131.02±1.32 |
| EtOH70 | 0.18 | 65.35±1.05 | 50.18±1.33 | 144.38±1.11 | 73.62±0.99 | 45.78±1.18 | 19.63±1.03 | 58.94±1.16 | 41.34±1.08 | 145.39±1.17 |
| EtOH80 | 0.11 | 66.79±0.99 | 51.31±1.11 | 145.35±1.27 | 75.45±1.09 | 46.86±1.40 | 19.79±1.12 | 64.98±1.17 | 45.75±1.18 | 150.77±1.19 |
| EtOH90 | 0.13 | 61.96±0.96 | 47.71±1.05 | 133.80±1.04 | 68.21±1.13 | 42.20±1.04 | 17.35±1.15 | 49.48±1.05 | 34.88±1.26 | 124.61±1.13 |
3. Discussion
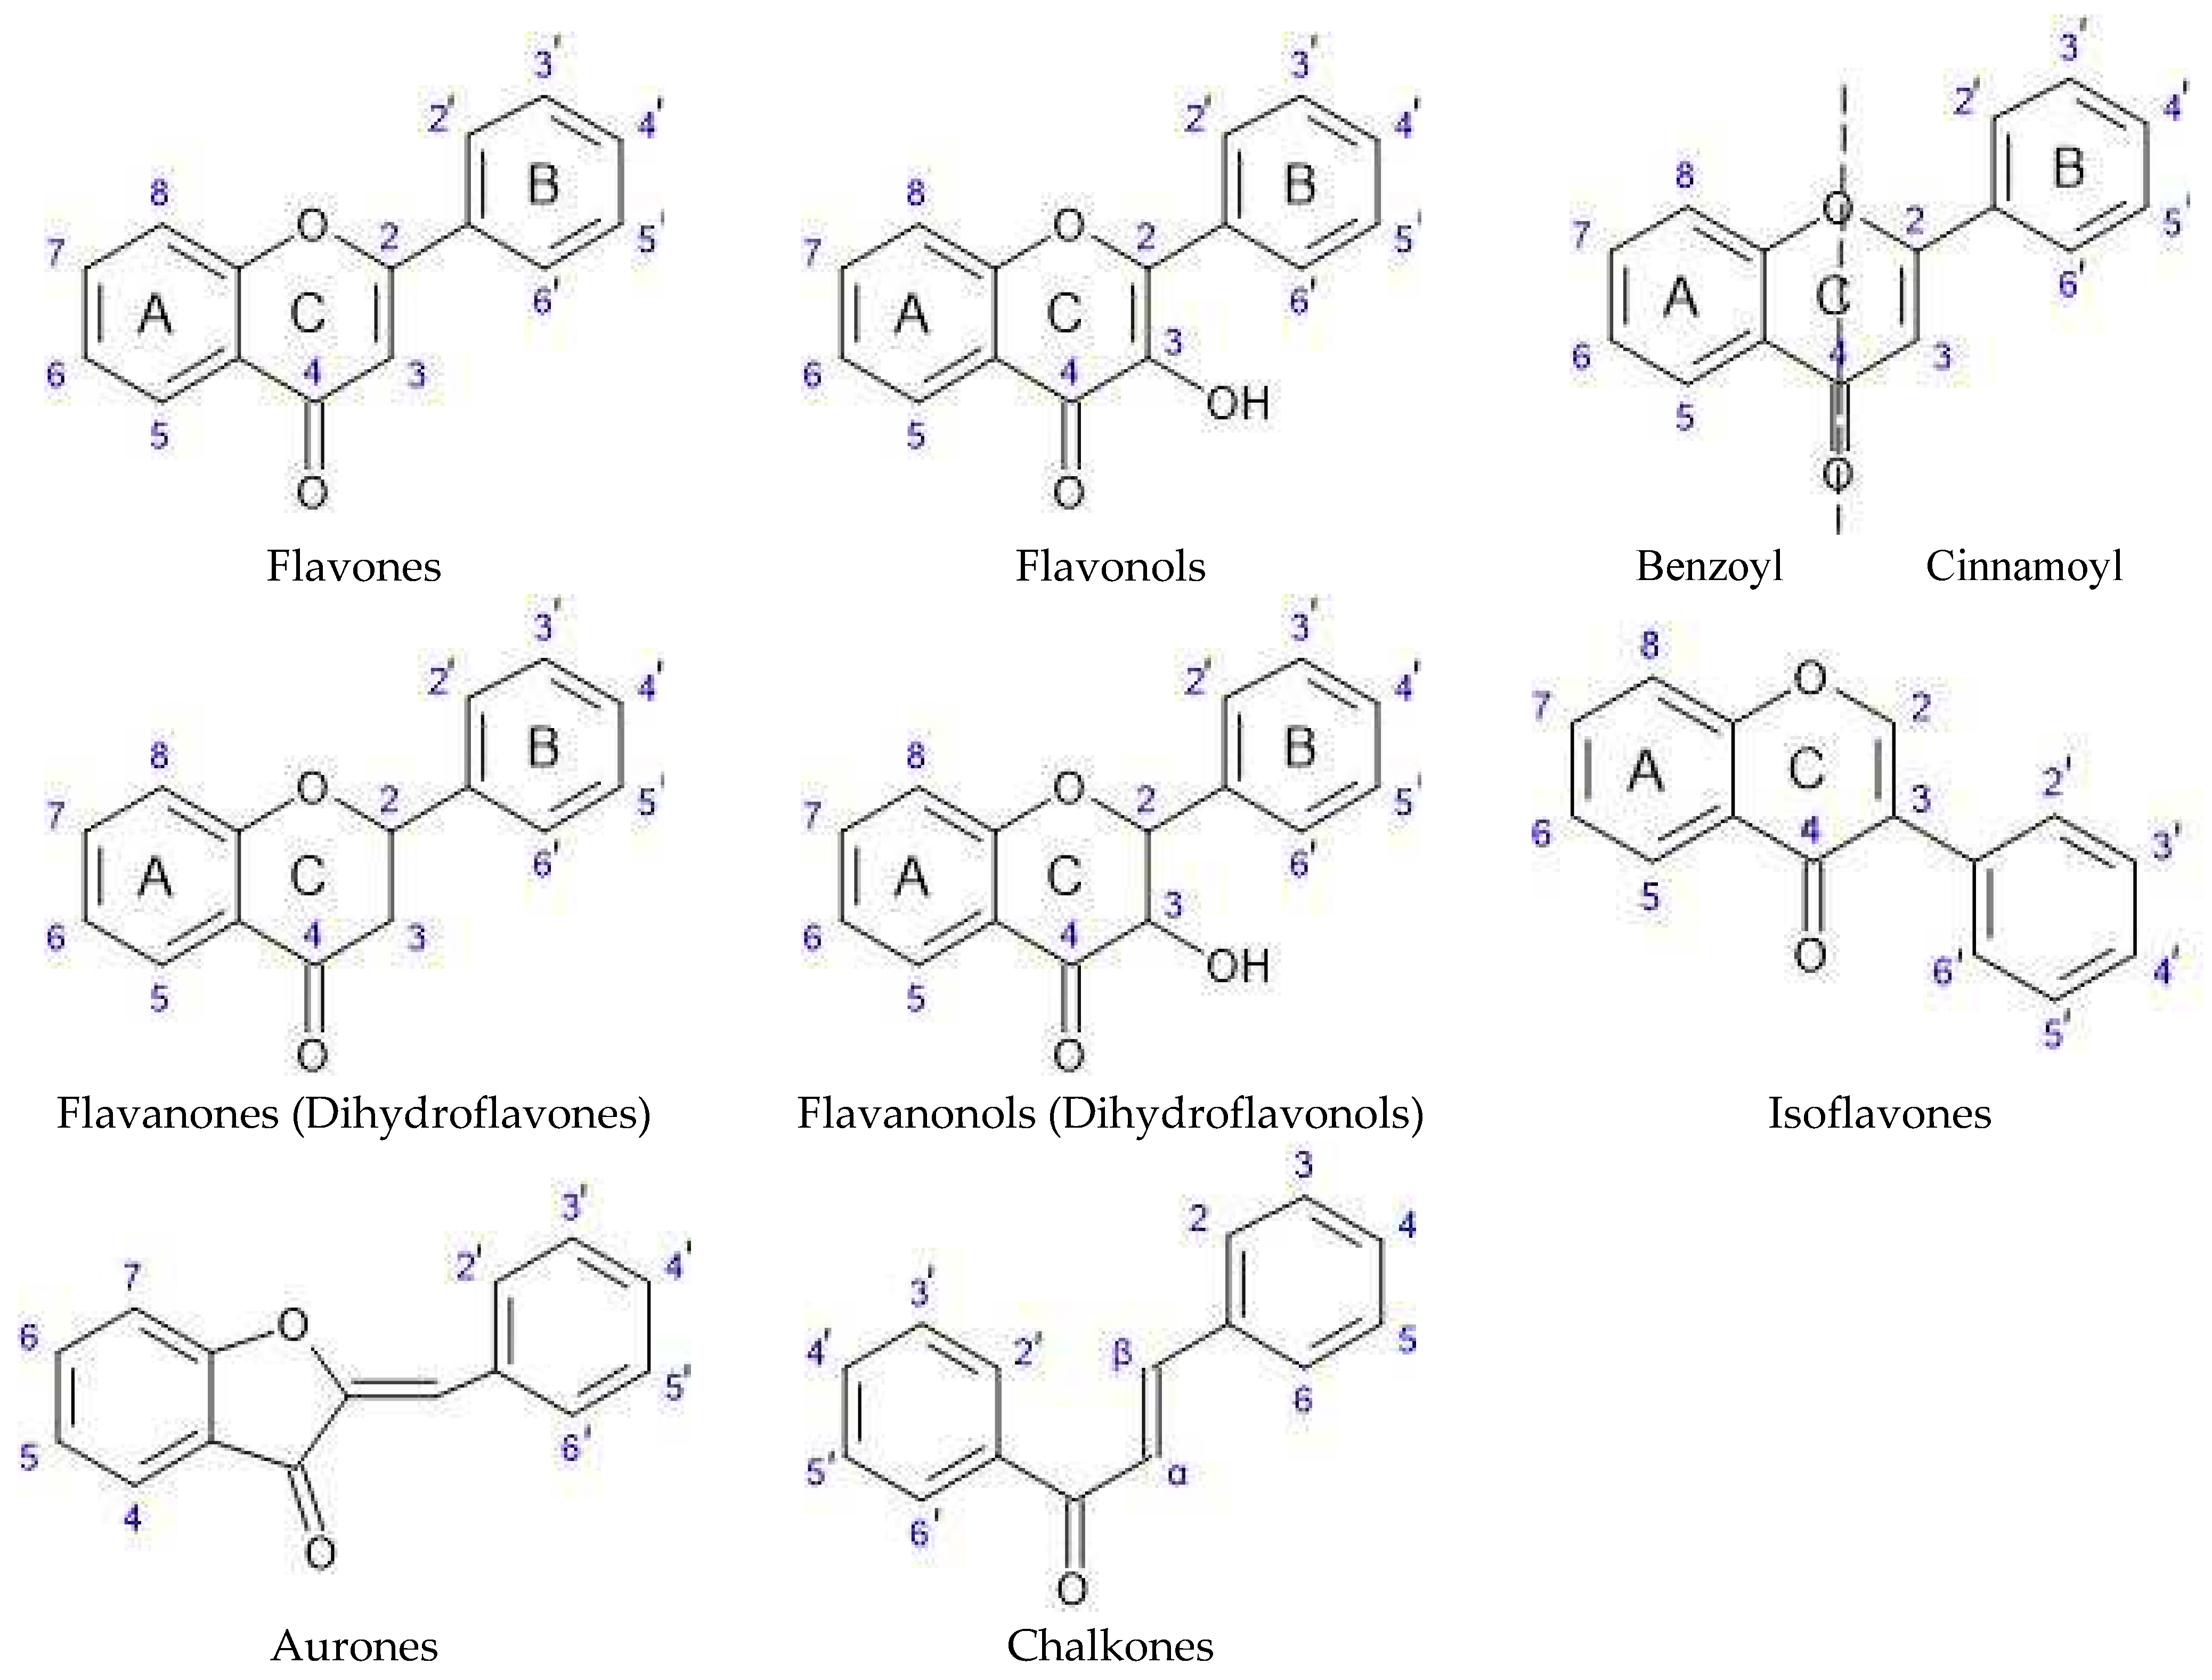
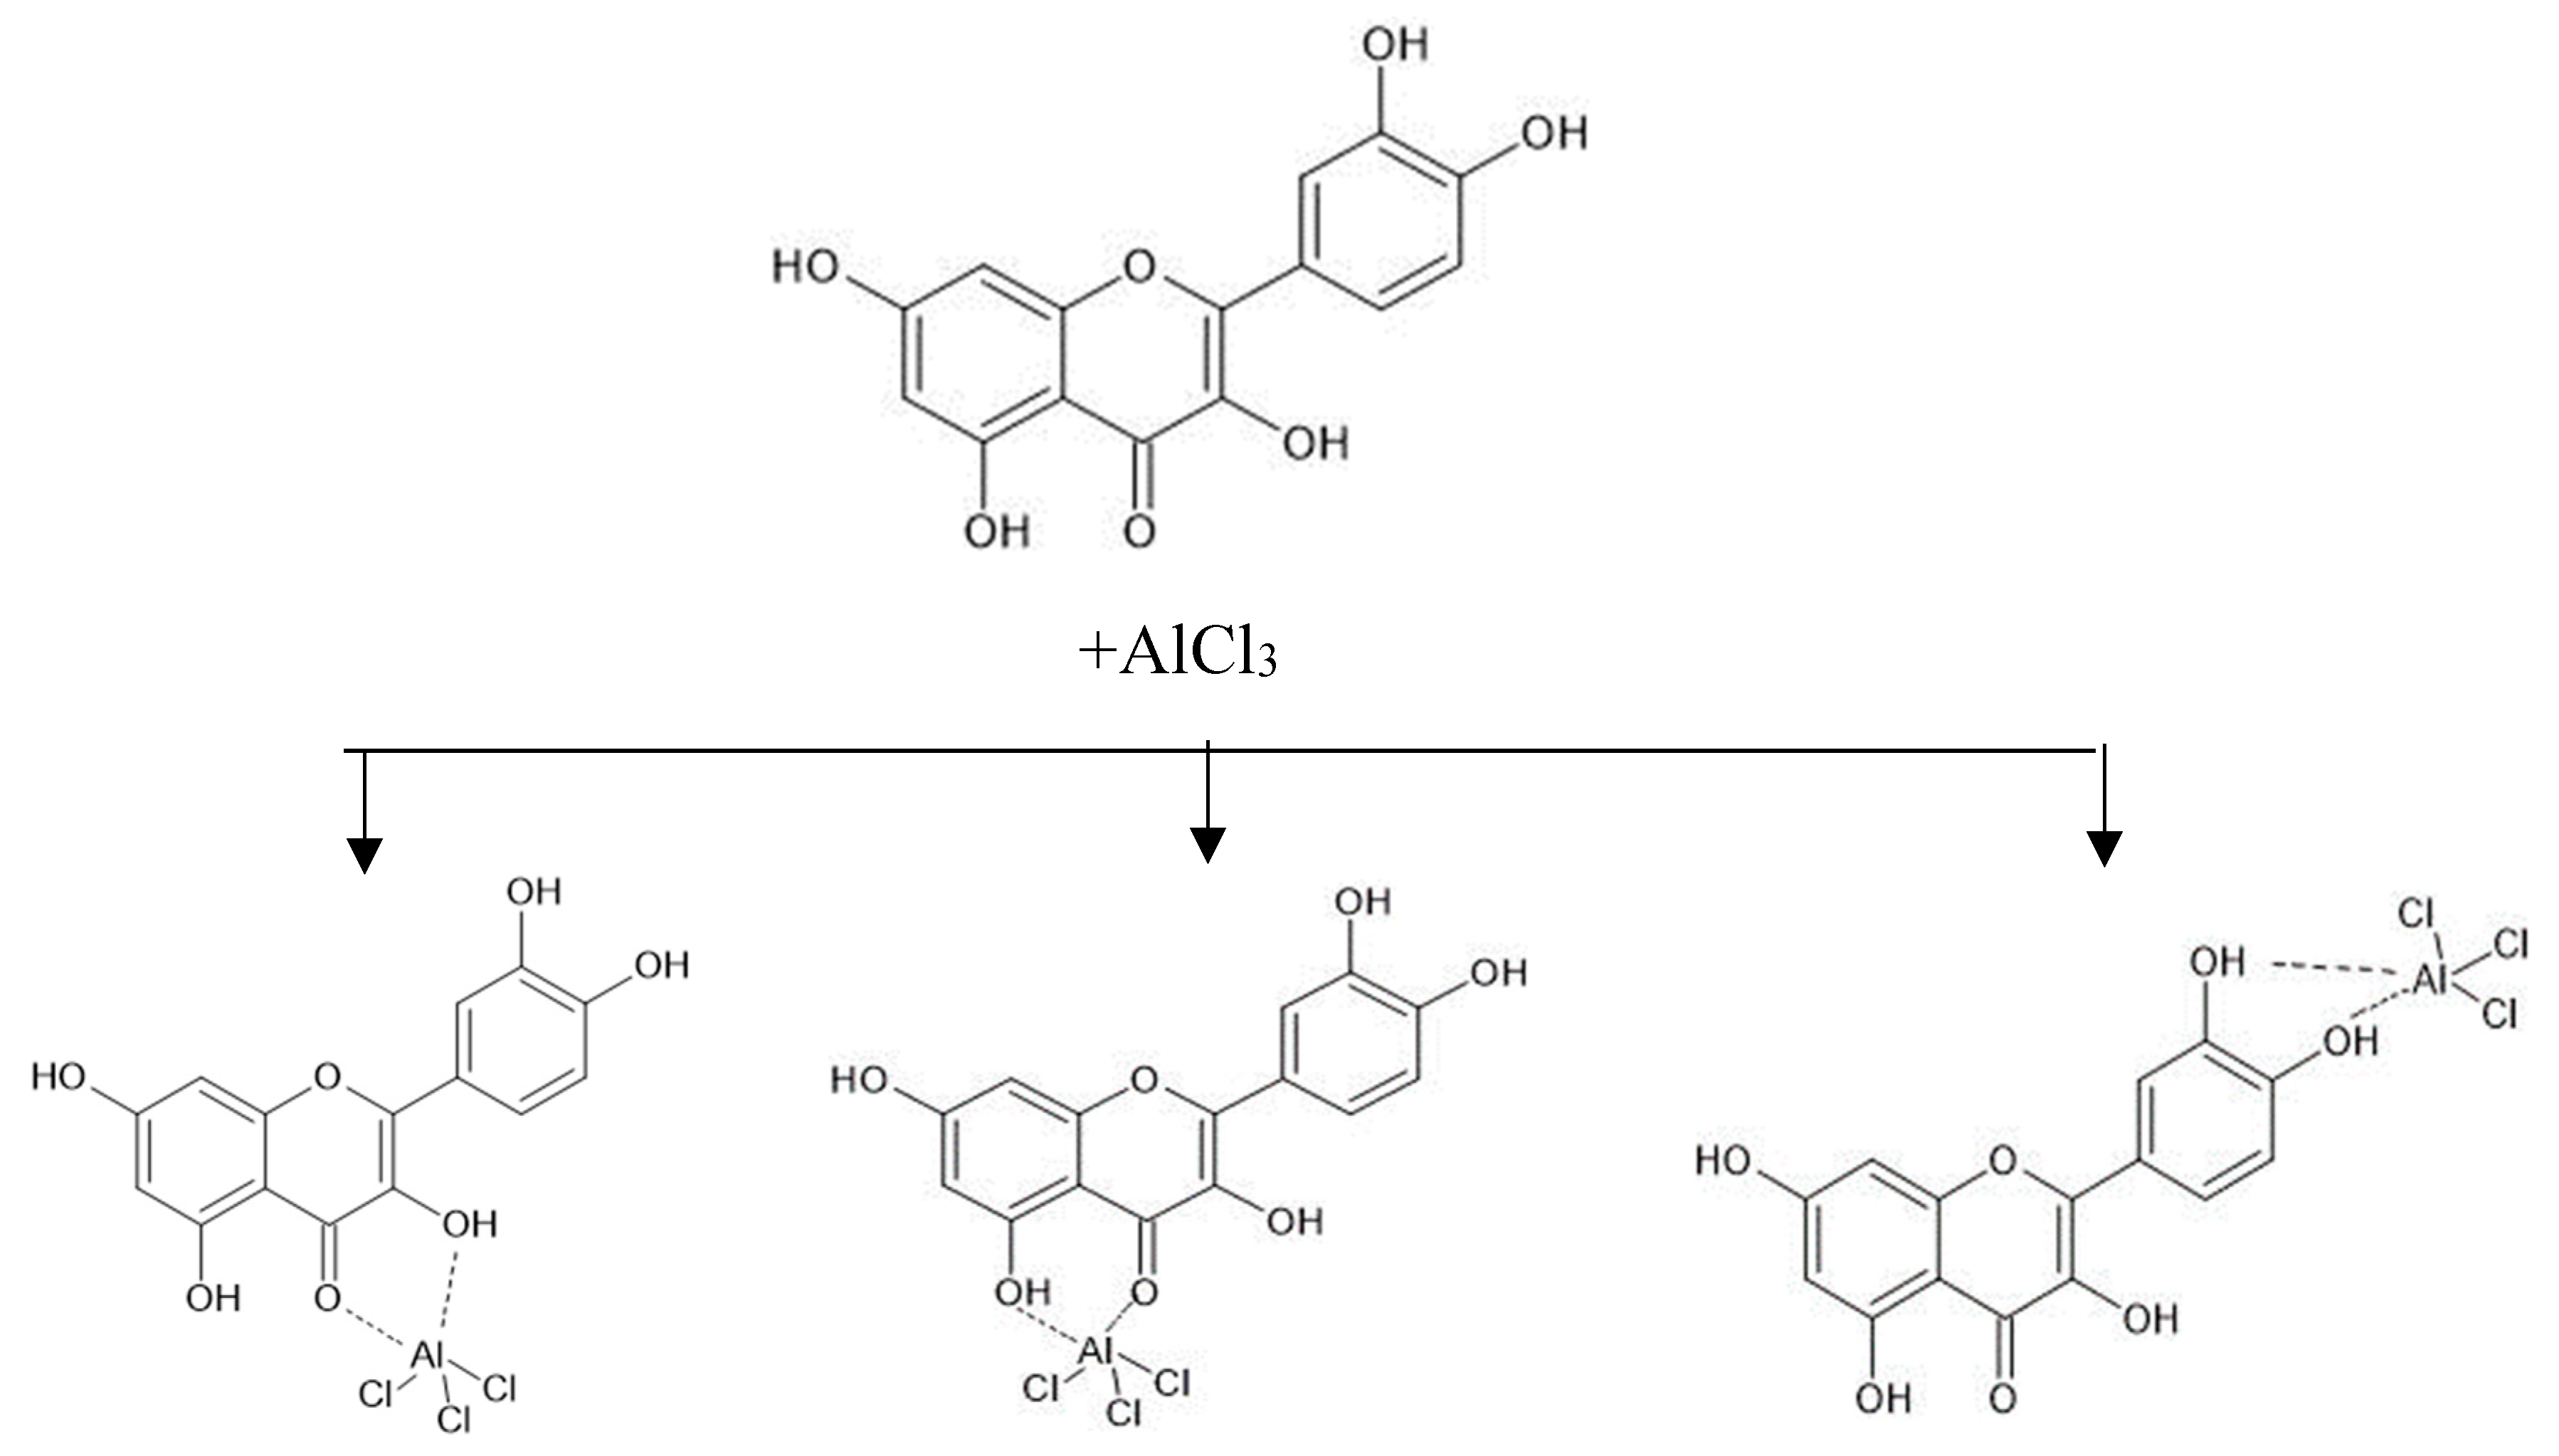
4. Materials and Methods
4.1. Chemicals
4.2. Plant Material
4.3. Extracts Preparation
4.4. Chromatographic Analyses
4.5. Method for Determining the Total Flavonoids Content
4.6. Statistical Analysis
5. Conclusions
Author Contributions
Funding
Conflicts of Interest
References
- Dampc, A.; Luczkiewicz, M. Rhododendron Tomentosum (Ledum Palustre). A Review of Traditional Use Based on Current Research. Fitoterapia 2013, 85, 130–143. [Google Scholar] [CrossRef]
- Upyr, T. V.; Tolmachova, K. S.; Koshovyi, O. M.; Komisarenko, A. M.; Kireyev, I. V. The Study of the Chemical Composition and the Pharmacological Activity of the Polysaccharide Complex Obtained from Ledum Palustre. Вісник Фармації 2016, No. 3, 32–35.
- Dufour, D.; Pichette, A.; Mshvildadze, V.; Bradette-Hébert, M.-E.; Lavoie, S.; Longtin, A.; Laprise, C.; Legault, J. Antioxidant, Anti-Inflammatory and Anticancer Activities of Methanolic Extracts from Ledum Groenlandicum Retzius. J. Ethnopharmacol. 2007, 111, 22–28. [Google Scholar] [CrossRef]
- Ledum palustre - Labrador-tea -- Discover Life. https://www.discoverlife.org/mp/20q?search=Ledum+palustre (accessed 2023-11-01).
- Упир, Т. В.; Зайцев, Г. П.; Кoшoвий, О. М.; Кoмісаренкo, А. М. Фенoльний склад рідкoгo екстракту з пагoнів Ledum palustre. Збірник Наукoвих Праць Співрoбітників НМАПО Ім П Л Шупика 2015, No. 24(5), 239–243.
- Mikhailova, N. S.; Konovalova, O. A.; Rybalko, K. S. Chemical Composition of Ledum Palustre. Chem. Nat. Compd. 1978, 14, 103–105. [Google Scholar] [CrossRef]
- Jesionek, A.; Kokotkiewicz, A.; Mikosik-Roczynska, A.; Ciesielska-Figlon, K.; Luczkiewicz, P.; Bucinski, A.; Daca, A.; Witkowski, J. M.; Bryl, E.; Zabiegala, B.; Luczkiewicz, M. Chemical Variability of Rhododendron Tomentosum (Ledum Palustre) Essential Oils and Their pro-Apoptotic Effect on Lymphocytes and Rheumatoid Arthritis Synoviocytes. Fitoterapia 2019, 139, 104402. [Google Scholar] [CrossRef] [PubMed]
- Ye, C.; Jin, M.; Li, R.; Sun, J.; Wang, R.; Wang, J.; Li, S.; Zhou, W.; Li, G. Phytochemical and Chemotaxonomic Study on the Leaves of Rhododendron Dauricum L. Biochem. Syst. Ecol. 2020, 90, 104038. [Google Scholar] [CrossRef]
- Andersen, O. M.; Markham, K. R. Flavonoids : Chemistry, Biochemistry and Applications, 1st Edition.; CRC Press, 2005. [CrossRef]
- Altemimi, A.; Lakhssassi, N.; Baharlouei, A.; Watson, D. G.; Lightfoot, D. A. Phytochemicals: Extraction, Isolation, and Identification of Bioactive Compounds from Plant Extracts. Plants Basel Switz. 2017, 6. [Google Scholar] [CrossRef] [PubMed]
- Azmir, J.; Zaidul, I. S. M.; Rahman, M. M.; Sharif, K. M.; Mohamed, A.; Sahena, F.; Jahurul, M. H. A.; Ghafoor, K.; Norulaini, N. A. N.; Omar, A. K. M. Techniques for Extraction of Bioactive Compounds from Plant Materials: A Review. SI Extr. Encapsulation 2013, 117, 426–436. [Google Scholar] [CrossRef]
- Jha, A. K.; Sit, N. Extraction of Bioactive Compounds from Plant Materials Using Combination of Various Novel Methods: A Review. Trends Food Sci. Technol. 2022, 119, 579–591. [Google Scholar] [CrossRef]
- Charegaonkar, D. High-Performance Thin-Layer Chromatography: Excellent Automation. In High-performance thin-layer chromatography (HPTLC); Springer, 2010; pp. 55–65.
- de Rijke, E.; Out, P.; Niessen, W. M. A.; Ariese, F.; Gooijer, C.; Brinkman, U. A. Th. Analytical Separation and Detection Methods for Flavonoids. Plant Anal. 2006, 1112, 31–63. [Google Scholar] [CrossRef]
- Orfali, R.; Perveen, S.; Aati, H. Y.; Alam, P.; Noman, O. M.; Palacios, J.; Al-Kurbi, B. S. S.; Al-Taweel, A. M.; Khan, A.; Mehmood, R.; Khan, S. I. High-Performance Thin-Layer Chromatography for Rutin, Chlorogenic Acid, Caffeic Acid, Ursolic Acid, and Stigmasterol Analysis in Periploca Aphylla Extracts. Separations 2021, 8. [Google Scholar] [CrossRef]
- Scotti, F.; Löbel, K.; Booker, A.; Heinrich, M. St. John’s Wort (Hypericum Perforatum) Products - How Variable Is the Primary Material? Front. Plant Sci. 2018, 9, 1973. [Google Scholar] [CrossRef] [PubMed]
- Larit, F.; León, F.; Jasika-Misiak, I.; Wieczorek, P. P.; Cutler, S. J. Phenolic Content And Antioxidant Activity Of Cytisus Villosus And Hypericum Afrum Extracts. Planta Med. 2016, 82, PB21. [Google Scholar] [CrossRef]
- Shanaida, M.; Golembiovska, O.; Jasicka-Misiak, I.; Oleshchuk, O.; Beley, N.; Kernychna, I.; Wieczorek, P. P. Sedative Effect and Standardization Parameters of Herbal Medicinal Product Obtained from the L. Herb. Eur. Pharm. J. 2021, 68, 1–9. [Google Scholar] [CrossRef]
- Marby, T. J.; Markham, K. R.; Thomas, M. B. The Systematic Identification of Flavonoids, 1st ed.; Springer Berlin, Heidelberg: New York.
- Chang, C.-C.; Yang, M.-H.; Wen, H.-M.; Chern, J.-C. Estimation of Total Flavonoid Content in Propolis by Two Complementary Colometric Methods. J. Food Drug Anal. 2002, 10, 3. [Google Scholar] [CrossRef]
- Petry, R. D.; Ortega, G. G.; Silva, W. B. Flavonoid Content Assay: Influence of the Reagent Concentration and Reaction Time on the Spectrophotometric Behavior of the Aluminium Chloride--Flavonoid Complex. Pharm. 2001, 56, 465–470. [Google Scholar]
- Mammen, D.; Daniel, M. A Critical Evaluation on the Reliability of Two Aluminum Chloride Chelation Methods for Quantification of Flavonoids. Food Chem. 2012, 135, 1365–1368. [Google Scholar] [CrossRef]
- Pękal, A.; Pyrzynska, K. Evaluation of Aluminium Complexation Reaction for Flavonoid Content Assay. Food Anal. Methods 2014, 7, 1776–1782. [Google Scholar] [CrossRef]
- Shraim, A. M.; Ahmed, T. A.; Rahman, M. M.; Hijji, Y. M. Determination of Total Flavonoid Content by Aluminum Chloride Assay: A Critical Evaluation. LWT 2021, 150, 111932. [Google Scholar] [CrossRef]
- Cornard, J. P.; Merlin, J. C. Spectroscopic and Structural Study of Complexes of Quercetin with Al(III). J. Inorg. Biochem. 2002, 92, 19–27. [Google Scholar] [CrossRef]
- Huzio, N.; Grytsyk, A.; Raal, A.; Grytsyk, L.; Koshovyi, O. Phytochemical and Pharmacological Research in Agrimonia Eupatoria L. Herb Extract with Anti-Inflammatory and Hepatoprotective Properties. Plants 2022, 11. [Google Scholar] [CrossRef] [PubMed]
- Ramos, R. T. M.; Bezerra, I. C. F.; Ferreira, M. R. A.; Soares, L. A. L. Spectrophotometric Quantification of Flavonoids in Herbal Material, Crude Extract, and Fractions from Leaves of Eugenia Uniflora Linn. Pharmacogn. Res. 2017, 9, 253. [Google Scholar] [CrossRef]
- Pietta, P.-G. Flavonoids as Antioxidants. J. Nat. Prod. 2000, 63, 1035–1042. [Google Scholar] [CrossRef] [PubMed]
- The Contribution of Flavonoid C-Ring on the DPPH Free Radical Scavenging Efficiency. A Kinetic Approach for the 3′,4′-Hydroxy Substituted Members. Innov. Food Sci. Emerg. Technol. 2006, 7, 140–146. [Google Scholar] [CrossRef]
- Struchkov, P. Comparison of Spectrophotometric Methods of Total Flavonoid Assay Based on Complex Formation with Aluminum Chloride as Applied to Multicomponent Herbal Drug Angionorm. J. Pharm. Negat. Results 2018, 9, 1–7. [Google Scholar] [CrossRef]
- Rice-Evans, C. A.; Miller, N. J.; Paganga, G. Structure-Antioxidant Activity Relationships of Flavonoids and Phenolic Acids. Free Radic. Biol. Med. 1996, 20, 933–956. [Google Scholar] [CrossRef] [PubMed]
- Platzer, M.; Kiese, S.; Tybussek, T.; Herfellner, T.; Schneider, F.; Schweiggert-Weisz, U.; Eisner, P. Radical Scavenging Mechanisms of Phenolic Compounds: A Quantitative Structure-Property Relationship (QSPR) Study. Front. Nutr. 2022, 9. [Google Scholar] [CrossRef]
- Kaneta, M.; Nakagawa, Y. Investigation and Identification of Antioxidative Flavonols, Quercetin and Kaempferol Glycosides in the Unused Parts of 10 Types of Food Plants Commonly Consumed in Japan. Food Sci. Technol. Res. 1999, 5, 125–128. [Google Scholar] [CrossRef]
- Bajracharya, G. B.; Paudel, M.; Kc, R. Insight into the Structure Elucidation of Flavonoids ThroughUV-Visible Spectral Analysis of Quercetin Derivatives Using Shift Reagents. J. Nepal Chem. Soc. 2017, 37, 55–64. [Google Scholar] [CrossRef]
- Materska, M. QUERCETIN AND ITS DERIVATIVES: CHEMICAL STRUCTURE AND BIOACTIVITY– A REVIEW. Pol J Food Nutr Sci 2008, 58, 407–413. [Google Scholar]
- Kovalska, N.; Karpiuk, U.; Minarchenko, V.; Cholak, I.; Zaimenko, N.; Skrypchenko, N.; Liu, D. Comparative Analysis of the Content of Sum of Hydroxycinnamic Acids from Leaves of Actinidia Arguta Lindl. Collected in Ukraine and China. J. Chem. 2023, 2023, 2349713. [Google Scholar] [CrossRef]
- Minarchenko, V.; Tymchenko, I.; Pidchenko, V.; Dvirna, T.; Makhynia, L.; Karpiuk, U.; Kovalska, N. Diagnostic Features of Raw Materials of Related Equisetum Species of Ukrainian Flora. J. Res. Pharm. 2022, 26, 1780–1788. [Google Scholar] [CrossRef]
- Minarchenko, V.; Karpiuk, U.; Kovalska, N.; Tymchenko, I.; Dvirna, T.; Сholak, I. Diagnostic Micromorphological Features of Leaf Surface of Selected Species of the Genus L. (Asteraceae). Hacquetia 2023, 22, 131–141. [Google Scholar] [CrossRef]
- Osorio-Tobón, J. F. Recent Advances and Comparisons of Conventional and Alternative Extraction Techniques of Phenolic Compounds. J. Food Sci. Technol. 2020, 57, 4299–4315. [Google Scholar] [CrossRef]
- Hudz, N.; Horčinová Sedláčková, V.; Kukhtenko, H.; Svydenko, L. Facets of the Elaboration of the Salvia Sclarea L. Extracts. Agrobiodiversity Improv. Nutr. Health Life Qual. 2023, 7, 61–69. [Google Scholar]
- Kukhtenko, H.; Bevz, N.; Hudz, N.; Datkhayev, U.; Kukhtenko, O. Alhagi Kirghisorum: Technological Aspects of Its Thick Extract for the Pharmaceutical Application. Agrobiodiversity Improv. Nutr. Health Life Qual. 2022, 6. [Google Scholar] [CrossRef]
- Jha, A. K.; Sit, N. Extraction of Bioactive Compounds from Plant Materials Using Combination of Various Novel Methods: A Review. Trends Food Sci. Technol. 2022, 119, 579–591. [Google Scholar] [CrossRef]
- Durling, N. E.; Catchpole, O. J.; Grey, J. B.; Webby, R. F.; Mitchell, K. A.; Foo, L. Y.; Perry, N. B. Extraction of Phenolics and Essential Oil from Dried Sage (Salvia Officinalis) Using Ethanol–Water Mixtures. Food Chem. 2007, 101, 1417–1424. [Google Scholar] [CrossRef]
- Raal, A.; Jaama, M.; Utt, M.; Püssa, T.; Žvikas, V.; Jakštas, V.; Koshovyi, O.; Nguyen, K. V.; Thi Nguyen, H. The Phytochemical Profile and Anticancer Activity of Anthemis Tinctoria and Angelica Sylvestris Used in Estonian Ethnomedicine. Plants 2022, 11. [Google Scholar] [CrossRef]
- Jasicka-Misiak, I.; Makowicz, E.; Stanek, N. Chromatographic Fingerprint, Antioxidant Activity, and Colour Characteristic of Polish Goldenrod (Solidago Virgaurea L.) Honey and Flower. Eur. Food Res. Technol. 2018, 244, 1169–1184. [Google Scholar] [CrossRef]
- Shanaida, M.; Hudz, N.; Jasicka-Misiak, I.; Wieczorek, P. P. Polyphenols and Pharmacological Screening of a Monarda Fistulosa L. Dry Extract Based on a Hydrodistilled Residue By-Product. Front. Pharmacol. 2021, 12, 563436. [Google Scholar] [CrossRef]
- Elena, D. L. Pharmacognostic Methods for Analysis of Herbal Drugs, According to European Pharmacopoeia. In Promising Pharmaceuticals; IntechOpen, 2012. [CrossRef]
- Shinkovenko, I. L.; Kashpur, N. V.; Ilyina, T. V.; Kovalyova, A. M.; Goryacha, O. V.; Koshovyi, O. M.; Toryanyk, E. L.; Kryvoruchko, O. V. The Immunomodulatory Activity of the Extracts and Complexes of Biologically Active Compounds of Galium Verum L. Herb. Ceska Slov. Farm. Cas. Ceske Farm. Spolecnosti Slov. Farm. Spolecnosti 2018, 67, 25–29. [Google Scholar]
- State Pharmacopoeia of Ukraine; Ukrainian Scientific Pharmacopoeial Center of Drugs Quality: Kharkiv, Ukraine, 2015.
Disclaimer/Publisher’s Note: The statements, opinions and data contained in all publications are solely those of the individual author(s) and contributor(s) and not of MDPI and/or the editor(s). MDPI and/or the editor(s) disclaim responsibility for any injury to people or property resulting from any ideas, methods, instructions or products referred to in the content. |
© 2023 by the authors. Licensee MDPI, Basel, Switzerland. This article is an open access article distributed under the terms and conditions of the Creative Commons Attribution (CC BY) license (http://creativecommons.org/licenses/by/4.0/).


