Submitted:
15 December 2023
Posted:
18 December 2023
You are already at the latest version
Abstract
Keywords:
1. Introduction
2. Problem Formulation
2.1. Power Flow Study for Distribution Network
2.2. Network Reconfiguration
2.3. D-STATCOM Modelling
2.4. PV modelling
2.5. Total Power Loss Reduction with Simultaneous Installation of Distributed PV Sources/DSTATCOM Devices along with Network Reconfiguration
2.6. Total Operating Cost Minimization
2.7. Voltage Profile Improvement by Installing Distributed PV Sources and DSTATCOM Device along with Network Reconfiguration
2.8. Objective Function
2.8.1. Equality Constraints
2.8.2. Inequality Constraints
3. Load Model
3.1. Polynomial (ZIP) Load Model
3.2. Load Growth Model
4. MALO Algorithm
5. Results
6. Conclusion
Author Contributions
Funding
Competing Interest
Data Availability Statement
Acknowledgments
Conflicts of Interest
References
- Kola Sampangi Sambaiah, Jayabharathi, T., Optimal reconfiguration of Distribution Network in presence of D-STATCOM and Photovoltaic array using Metaheuristic algorithm, European Journal of Electrical Engineering and Computer Science,vol.4(2020). [CrossRef]
- Cholapandian, V., Yuvaraj, T., Devabalaji, K.R., Optimal Allocation of Photo-Voltaic Units in Radial Distribution Networks Using a New Student Psychology Based Optimization Algorithm, Int. J. Electr. Eng. Inf., vol.13, pp 318–335 (2021). [CrossRef]
- Yuvaraj, Thangaraj, et al., Optimal integration of Capacitor and Distributed Generation in distribution system considering load variation using BAT optimization algorithm, Energies vol.14, no.12, pp 3548(2021). [CrossRef]
- Sanjay, R., Jayabarathi, T., Raghunathan, T., Ramesh, V., Mithulananthan, N., Optimal allocation of distributed generation using hybrid grey wolf optimizer, IEEE Access, vol.5, pp.14807-18 (2017). [CrossRef]
- Yuvaraj, T., Devabalaji, K.R., Ravi, K., Optimal allocation of DG in the radial distribution network using bat optimization algorithm, Advances in Power Systems and Energy Management, Springer, Singapore, pp. 563–569 (2018). [CrossRef]
- Likhith Kumar , M.V, et al., Optimal allocation of DG units in distribution system considering variation in active power load, Archives of Electrical Engineering, Vol.68,no.2, pp 265-277(2019). [CrossRef]
- Morrn ,J., Haan,S.D., Maximum penetration level of distribution generation without violating voltage limits, Engineering, Material Science(2008). [CrossRef]
- Rawat , Shelly, A Comprehensive Review on Impact of Wind and Solar Photovoltaic Energy Sources on Voltage Stability of Power Grid, Journal of Engineering Research, vol.7, no.4, pp.178-202 (2020).
- Sampath Ediriweera, W.E.P, et al., Robust microgrid for distribution systems with high solar photovoltaic penetration, Archives of Electrical Engineering, vol.72, no 3, pp.785-809 (2023). Doi: 10.24425/aee.2023.146050. [CrossRef]
- Dash, S.K, Mishra, S, Abdelaziz, A.Y, Alghaythi, M Lallehyani, A., Optimal Allocation of Distributed Generators in Active Distribution Networks Using a New Oppositional Hybrid Sine Cosine Muted Differential Evolution Algorithm, Energies, vol. 15, pp.2267 (2022). [CrossRef]
- Balu K., Mukherjee, V., Optimal siting and sizing of distributed generation in radial distribution system using a novel student psychology-based optimization algorithm. Neural Comput. Appl., vol.33, pp.15639–15667 (2021). [CrossRef]
- Hemeida, A.M, Bakry, O.M., Mohamed, A.A., Mahmoud, E.A., Genetic Algorithms and Satin Bowerbird Optimization for optimal allocation of distributed generators in radial system, Appl. Soft Comput., vol. 111, pp.107727 (2021). [CrossRef]
- Montoya, O.D, Gil-González, W, Hernández, J.C., Efficient Operative Cost Reduction in Distribution Grids Considering the Optimal Placement and Sizing of D-STATCOMs Using a Discrete-Continuous VSA. Appl. sci., vol.11, pp.2175(2021). [CrossRef]
- Taher, S. A., Afsari, S. A., Optimal location and sizing of DSTATCOM in distribution systems by immune algorithm, International Journal of Electrical Power & Energy Systems, vol. 60, pp 34-44 (2014). [CrossRef]
- Yuvaraj, T., Devabalaji, K. R., Ravi, K., Optimal placement and sizing of STATCOM using harmony search algorithm, Energy Procedia, vol.79, pp.759-65 (2015). [CrossRef]
- Farhoodnea, M., Mohamed, A., Shareef, H., Zayandehroodi, H., Optimum D-STATCOM placement using firefly algorithm for power quality enhancement, IEEE 7th international power engineering and optimization conference (PEOCO),vol. 3, pp. 98- 102, Langkawi (2013). [CrossRef]
- Arouna Oloulade, Adolphe Moukengue Im ano, Xavier Fifatin, Antoine Vianou, Herman Tamadaho, Ramanou Badarou., Multi-Objective Optimization of the Safe Operation of the Electrical Distribution System by Placing D-FACTS and Network Reconfiguration, Journal of Power and Energy Engineering, vol.7, pp.94-113 (2019). [CrossRef]
- Balamurugan, P., Yuvaraj, T., Muthukannan, P (2018).,Optimal allocation of DSTATCOM in distribution network using Whale optimization algorithm, Eng. Technol. Appl. Sci Res, vol.8, no.5, pp.3445-3449 (2018). [CrossRef]
- Ghatak, Sriparna Roy, Sannigrahi, Surajit, Acharjee, Parimal., Optimised planning of distribution network with photovoltaic system, battery storage, and DSTATCOM, IET Renew. Power. Gener, vol.12, no.15, pp.1823-1832 (2018). [CrossRef]
- Yuvaraj, Devabalaji, K.R., et al., Comparative analysis of various compensating devices in energy trading radial distribution system for voltage regulation and loss mitigation using Blockchain technology and Bat algorithm, Energy reports, ELSEVIER (2022). [CrossRef]
- Gupta, A. R, Kumar, A., Impact of various load models on D-STATCOM allocation in DNO operated distribution network, Proc Comput Sci , vol.125, pp.862–870 (2018). [CrossRef]
- Dash, S.K., Mishra, S., Simultaneous Optimal Placement and Sizing of D-STATCOMs Using a Modified Sine Cosine Algorithm, Advances in Intelligent Computing and Communication, Springer, Singapore, pp.423–436 (2021). [CrossRef]
- Sambaiah, K.S, Jayabarathi, T., Optimal reconfiguration and renewable distributed generation allocation in electric distribution systems, International Journal of Ambient Energy, pp.1-29 (2019). [CrossRef]
- Sultana, B., Mustafa, M.W., Sultana, U., Rauf, A., Review on reliability improvement and power loss reduction in distribution system via network reconfiguration, Renew Sustain Energy Rev., vol.66, pp.297-310(2016). [CrossRef]
- Kola Sampangi Sambaiah, A review on optimal allocation and sizing techniques of DG in distribution systems, International Journal of Renewable Energy Research, vol.8, no.3, pp.1236-1256( 2018). [CrossRef]
- Ramprakash, sujatha B. C., Optimal placement and sizing of DG for power loss minimization and VSI improvement using BAT algorithm, IEEE conference NPSC 2016, IIT Bhubaneshwar, INDIA. [CrossRef]
- Ana Moura, Juliana Salvadorinho, Barbara Soares and Joana Cordeiro., Comparative study of Distribution Networks reconfiguration problem approaches, RAIRO Operations Research, vol. 55, pp. 2083-2124 (2021). [CrossRef]
- Hamida, I.B., Salah, S. B., Msahli, F., Mimouni, M.F., Optimal network reconfiguration and renewable DG integration considering time sequence variation in load and DGs, Renewable Energy,vol.121, pp.66-80 (2018). [CrossRef]
- Hassan, S. et al., Optimization techniques applied for optimal planning and integration of renewable energy sources based on distributed generation: Recent trends, Cogent engineering, Taylor & Francis Group, vol.3, pp. 1–25(2020). [CrossRef]
- Shaheen, A.M., Elsayed, A.M., El-Sehiemy, R.A., Abdelaziz, A.Y., Equilibrium optimization algorithm for network reconfiguration and distributed generation allocation in power systems, Appl. Soft Comput., vol.98, pp.106867 (2021). [CrossRef]
- Vinod Kumar Thunuguntla and Satish Kumar Injeti., Butterfly optimizer assisted Max–Min based multi-objective approach for optimal connection of DGs and optimal network reconfiguration of distribution networks, Journal of Electrical Systems and Information Technology, SPRINGER (2022). [CrossRef]
- Devi, S., Geethanjali, M., Optimal location and sizing determination of Distributed Generation and DSTATCOM using Particle Swarm Optimization algorithm, International Journal of Electrical Power & Energy Systems, vol.62, pp.562-70 (2014). [CrossRef]
- Tolabi, H.B., Ali, M.H., Rizwan, M., Simultaneousreconfiguration, optimal placement of DSTATCOM, and photovoltaic array in a distribution system based on fuzzy-ACO approach, IEEE Transactions on sustainable Energy,vol. 6, pp. 210-8 (2015). [CrossRef]
- Devabalaji, K.R., Ravi, K., Optimal size and siting of multiple DG and DSTATCOM in radial distribution system using Bacterial Foraging Optimization Algorithm, Ain Shams Engineering Journal, vol.7, pp.959-71 (2016). [CrossRef]
- El-Ela, A.A., El-Sehiemy, R.A., Abbas, A.S., Optimal placement and sizing of distributed generation and capacitor banks in distribution systems using water cycle algorithm, IEEE Systems Journal, vol.12, pp.3629-36 (2018). [CrossRef]
- Ganesh, S., Kanimozhi, R., Meta-heuristic technique for network reconfiguration in distribution system with photovoltaic and DSTATCOM, IET Generation, Transmission & Distribution,vol.12, pp.4524-35 (2018). [CrossRef]
- Zellagui, M., Lasmari, A., Settoul, S., El-Sehiemy, R.A., El-Bayeh, C.Z. Chenni, R., Simultaneous allocation of photovoltaic DG and DSTATCOM for echno-economic and environmental benefits in electrical distribution systems at different loading conditions using novel hybrid optimization algorithms. Int. Trans. Electr. Energy Syst., vol.31, pp.12992(2021). [CrossRef]
- Chinnaraj, S.G.R., Kuppan, R., Optimal sizing and placement of multiple renewable distribution generation and DSTATCOM in radial distribution systems using hybrid lightning search algorithm-simplex method optimization algorithm, Comput. Intell., vol.37, pp.1673–1690 (2021). [CrossRef]
- Oda, E.S., Abd El Hamed, A.M., Ali, A., Elbaset, A. A., Abd El Sattar, M., Ebeed, M., Stochastic optimal planning of distribution system considering integrated photovoltaic-based DG and DSTATCOM under uncertainties of loads and solar irradiance, IEEE Access, vol.9, pp.6541–26555 (2021). [CrossRef]
- Ping He, et al., Photovoltaic power prediction based on improved grey wolf algorithm optimized back propagation, Archives of Electrical Engineering, vol.72, no. 3, pp. 613-628(2023). [CrossRef]
- Eid A., Kamel S., Zawbaa H.M., Dardeer M., Improvement of active distribution systems with high penetration capacities of shunt reactive compensators and distributed generators using Bald Eagle Search, Ain Shams Eng. J., vol.13, pp.101792 (2022). [CrossRef]
- Thuan Thanh Nguyen, Thang Trung Nguyen, Ngoc Au Nguyen, Thanh Long Duong , A Novel method based on Coyote algorithm for simultaneous network reconfiguration and distribution generation placement, Ain Shams Engineering Journal, vol.12, Issue 1, pp.665-676(2021), doi.org/10.1016/j.asej.2020.06.005. [CrossRef]
- Abdullah M. Shaheen, Abdallah M. Elsayed, Ragab A., EI-Sehiemy, Salah Kamel, Sherif S.M., Ghoneim, A modified marine predators optimization algorithms for simultaneous network reconfiguration and distributed generator allocation in distribution systems under different loading conditions, Engineering Optimization, Issue 4(2020), doi/org/10.1080/0305215X.2021.1897799. [CrossRef]
- Truong Hoang Bao Huy, Thanh Van Tran, Dieu Ngoc Vo, Ho Thi Thao Nguyen, An improved metaheuristic method for simultaneous network reconfiguration and distributed generation allocation, Alexandria Engineering Journal, vol. 61, Issue 10, pp.8069-8088(2022). [CrossRef]
- Varaprasad Janamala, Radha Rani, K, Optimal allocation of solar photovoltaic distributed generation in electrical distribution networks using Archimeds optimization algorithm, Clean Energy, vol. 6, pp.271-287(2022). [CrossRef]
- Yang, X.S., He, X., Bat algorithm: literature review and applications, International Journal of Bio-Inspired Computation, vol.5, pp.141–149 (2013). [CrossRef]
- Mohammad Shehab et al., A Comprehensive Review of Bat Inspired Algorithm: Variants, Applications, and Hybridization, Computational methods in Engineering, vol.30, pp.765-797(2023). [CrossRef]
- T. Jayabarathi et al., The Bat Algorithm, Variants and Some Practical Engineering Applications: A Review, Nature-Inspired Algorithms and Applied Optimization, Studies in Computational Intelligence ,pp.744 (2017). [CrossRef]
- Zaid Abdi Alkareem Alyasseri et al., Recent advances of bat-inspired algorithm, its versions and applications, Neural Computing and Applications vol.34,16387 –16422 (2022). [CrossRef]
- Mirjalili, S., The ant lion optimizer, Adv. Eng. Softw., vol.83, pp.80-98 (2015). [CrossRef]
- Heidari, A. A., Faris, H., Mirjalili, S., Aljarah, I., and Mafarja,M., Ant lion optimizer: Theory, literature review, and application in multi-layer perceptron neural networks, in Nature-Inspired Optimizers. Springer, pp.23-46 (2020). [CrossRef]
- Assiri, A. S., Hussien, A. G., and Amin, M., Ant lion optimization:Variants, hybrids, and applications, IEEE Access, vol.8, pp.77746-77764 (2020). [CrossRef]
- Wang, M., Wu, C., Wang,L., Xiang, D., and Huang, X., A feature selection approach for hyperspectral image based on modified ant lion optimizer, Knowl.-Based Syst., vol.168, pp.39-48 (2019). [CrossRef]
- Dinkar,S.K., and Deepa, K. An efficient opposition based Lévy flight antlion optimizer for optimization problems, J. Comput. Sci., vol.29, pp.119-141(2018). [CrossRef]
- Barshandeh, S. and Haghzadeh, M., A new hybrid chaotic atom search optimization based on tree-seed algorithm and Levy flight for solving optimization problems, Eng. Comput.,pp. 1-44 (2020). [CrossRef]
- Zhao, R., Wang, Y., Liu, C., Hu, P., Li, Y., Li, H., and Yuan, C., Selfish herd optimizer with Levy flight distribution strategy for global optimization problem, Phys. A, Stat. Mech. Appl., vol.538, pp.122687 (2020). [CrossRef]
- Liu, Y. and Cao, B., A novel ant colony optimization algorithm with Levy flight, IEEE Access,vol. 8, pp.67205-67213( 2020). [CrossRef]
- Jen-Hao, Teng., A direct approach for distribution system load flow solutions,IEEE Trans. Power Deliv. Vol.18, no.3, pp. 882–887 (2003). [CrossRef]
- Atma Ram Gupta, Ashwani Kumar., Energy saving using D-STATCOM placement in radial distribution system under reconfigured network, Energy Procedia (2015). [CrossRef]
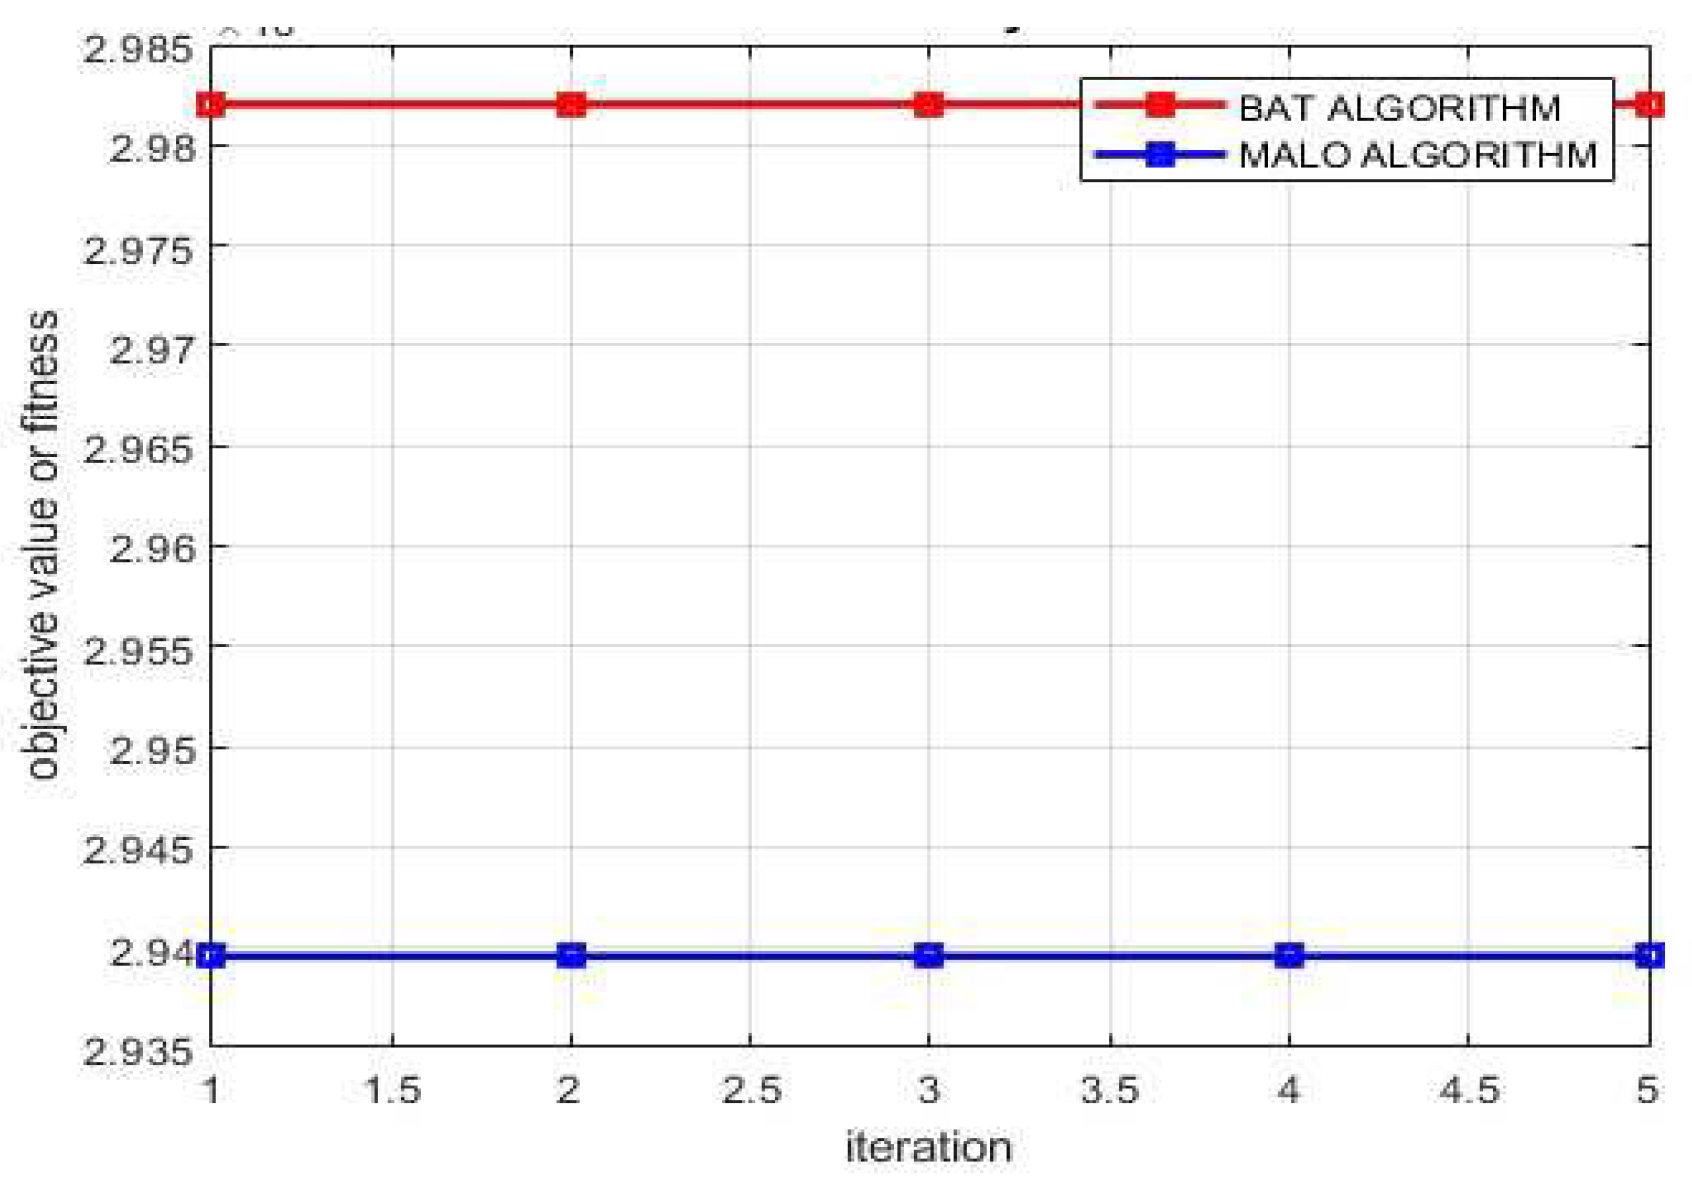
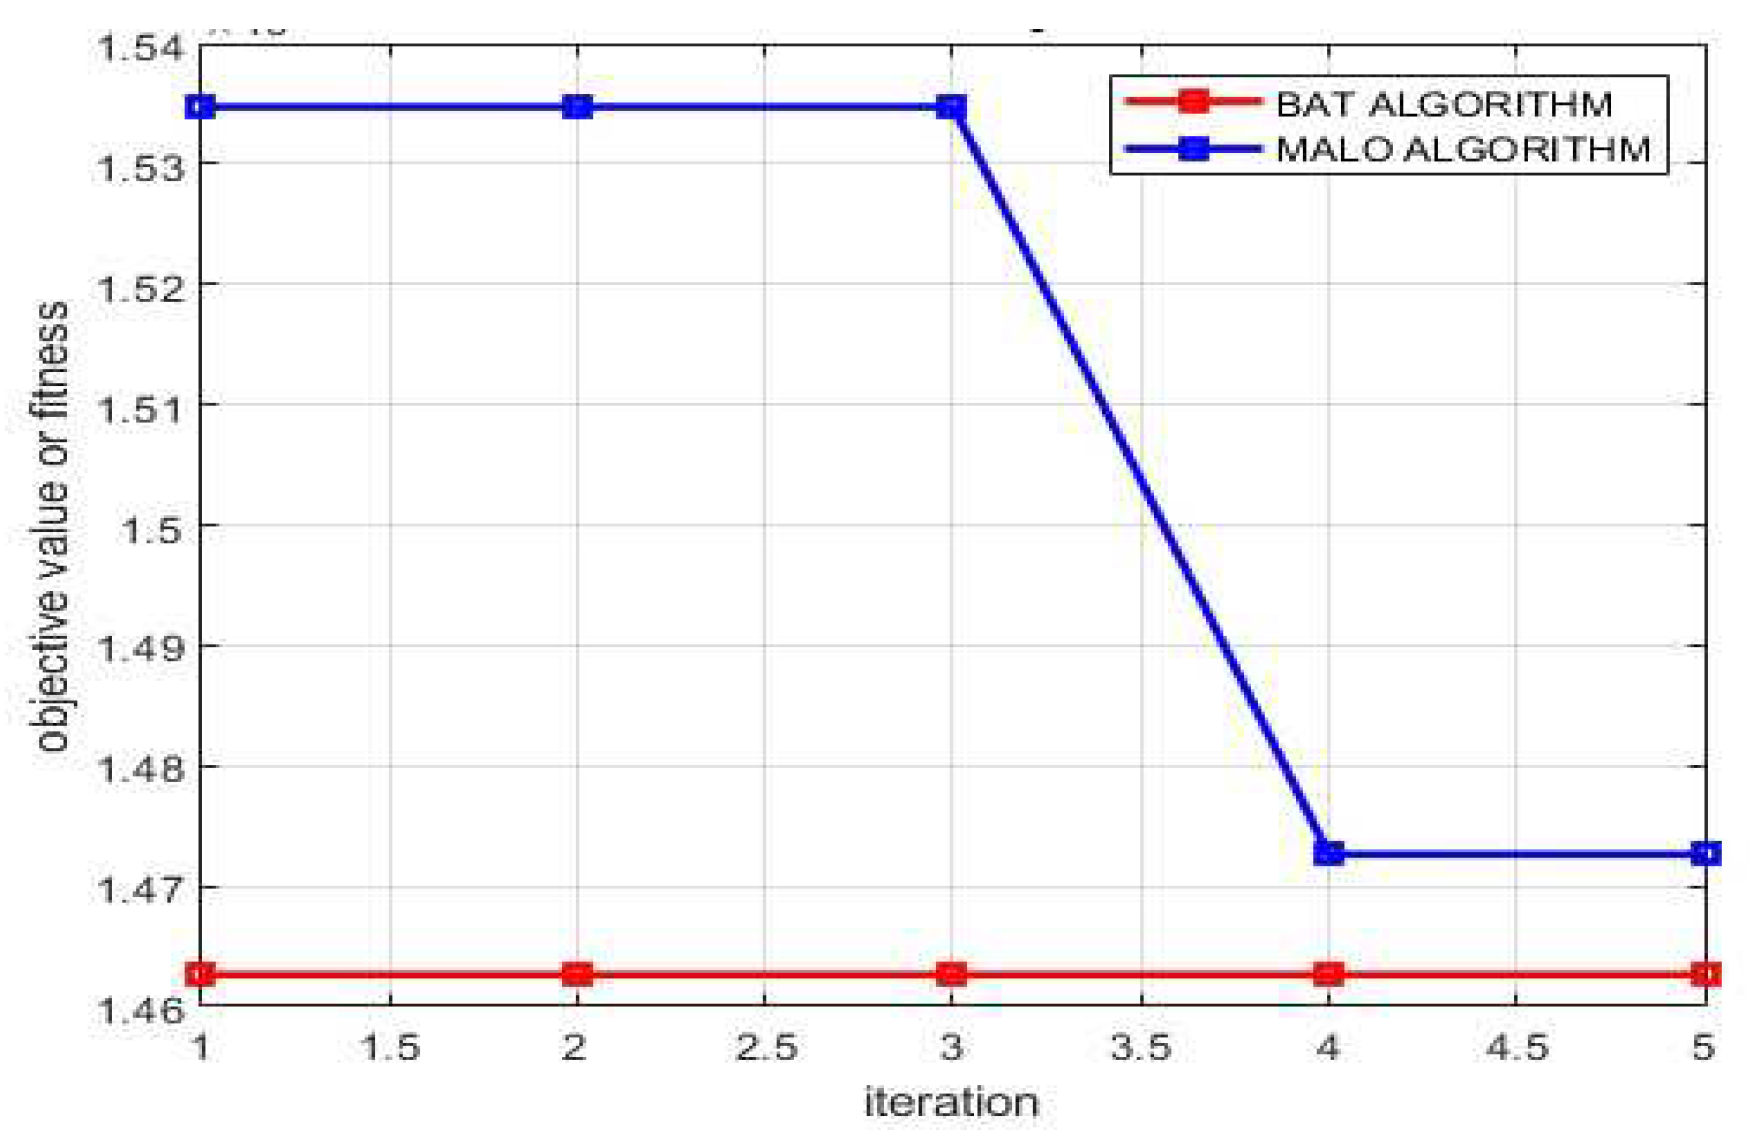
| Algorithm | MALO |
| Number of population | 10 |
| Number of Iterations | 10 |
| A min | 0.4 |
| A max | 0.85 |
| Spiral shape=b | 0.3 |
| Algorithm | BAT |
| Number of population | 10 |
| Number of Iteration | 10 |
| Loudness | 0.5 |
| Emission rate | 0.5 |
| Frequency | 0-2 |
| Cost of Energy | 0.05$/kWh |
| Cost of DSTATCOM | 50$/kVAr |
| Cost of PV DG | 1$/kW |
| MODEL | Constant Power Model | ZIP load Model | ||||||||
| Cases | Base Case | Recon BAT | Reconfig MALO |
DG+DSTAT+ Reconfig BAT | DG+DSTAT+Reconfig MALO | Base Case | Reconfig BAT | Reconfig MALO | DG+DSTAT+Reconfig BAT | DG+DSTAT+Reconfig MALO |
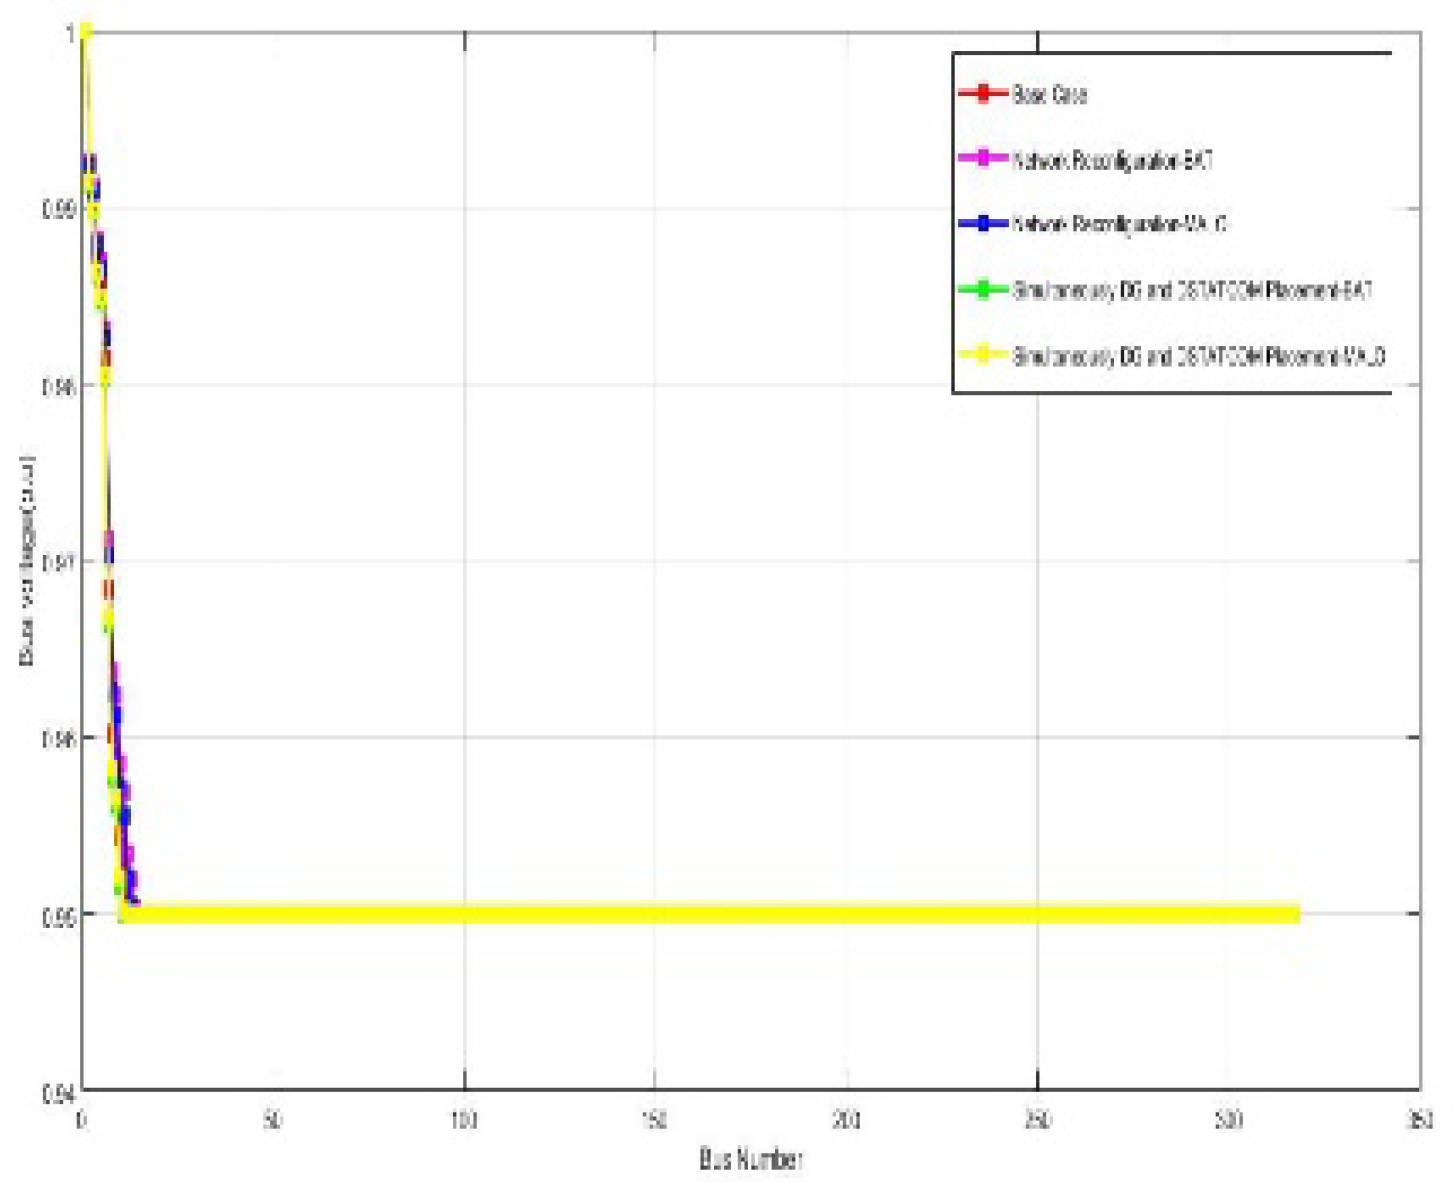
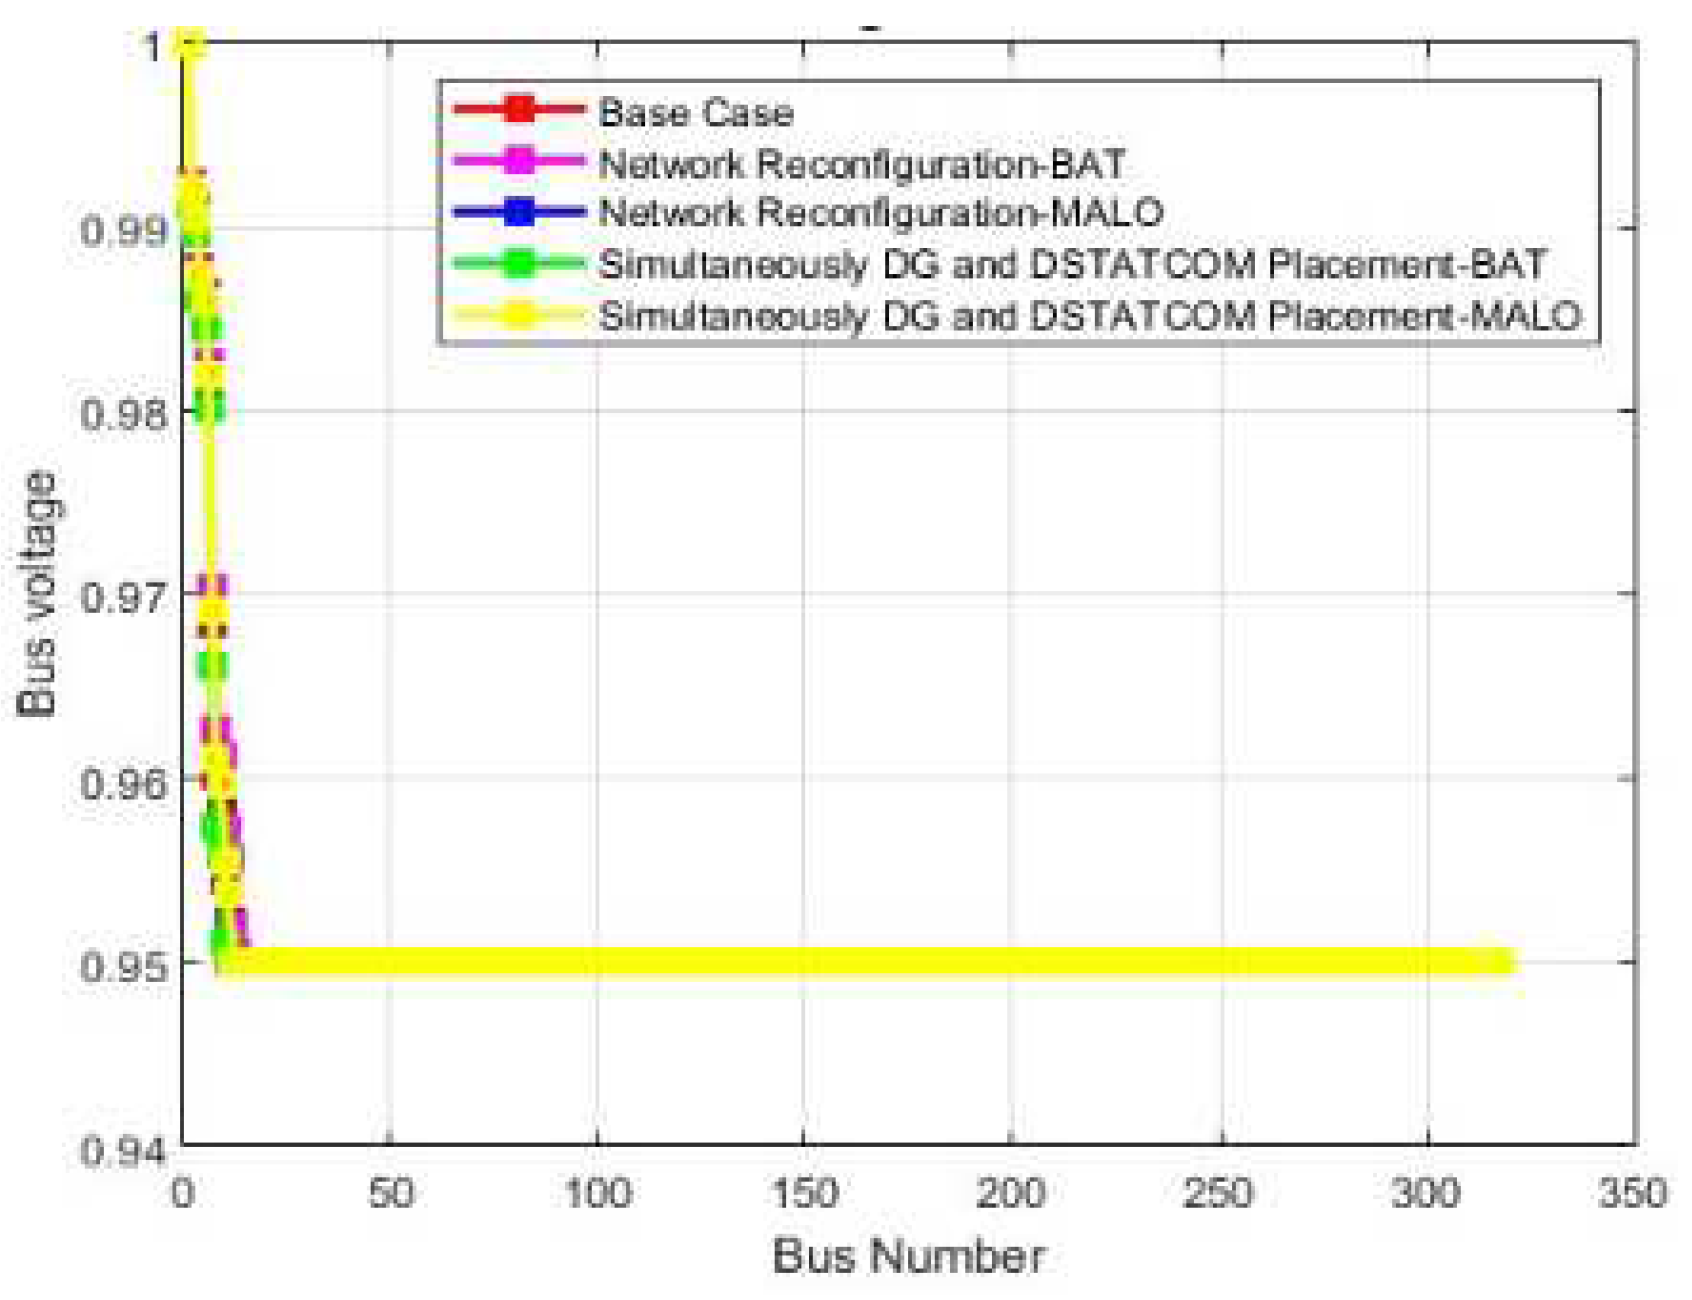
| Real power losses kW | 1298.14 | 935.48 | 800.62 | 871.34 | 759.75 | 2631.08 | 1611.99 | 1603.08 | 1447.85 | 1500.13 |
| Reactive power loss kVAr | 978.70 | 1054.14 | 925.50 | 887.01 | 856.01 | 1979.25 | 1385.87 | 1162.50 | 1393.75 | 1145.64 |
| PV size and location | - | - | - | 871(81), 1014 (72) 1193 (3) |
1993(65), 604(84), 621 (102) | - | - | - | 1336(90) ,984 (41) ,1418 (76) | 2000(111) ,2000 (118) ,1858 (118) |
| DSTATCOM size and location | - | - | - | 274 (26), 1864(84) | 382 (106) ,1317 (47) | - | - | - | 1367(101), 1463(27) | 1900(118),1900 (118) |
| Total operating cost ($) | - | - | - | 334383.5 | 312047.98 | - | - | - | 422452.3 | 617555 |
| Vmin @bus | 0.86 (77) | 0.95(40) | 0.95(33) | 0.95(40) | 0.95(48) | 0.811 (77) | 0.95(22) | 0.95(42) | 0.95(22) | 0.95(42) |
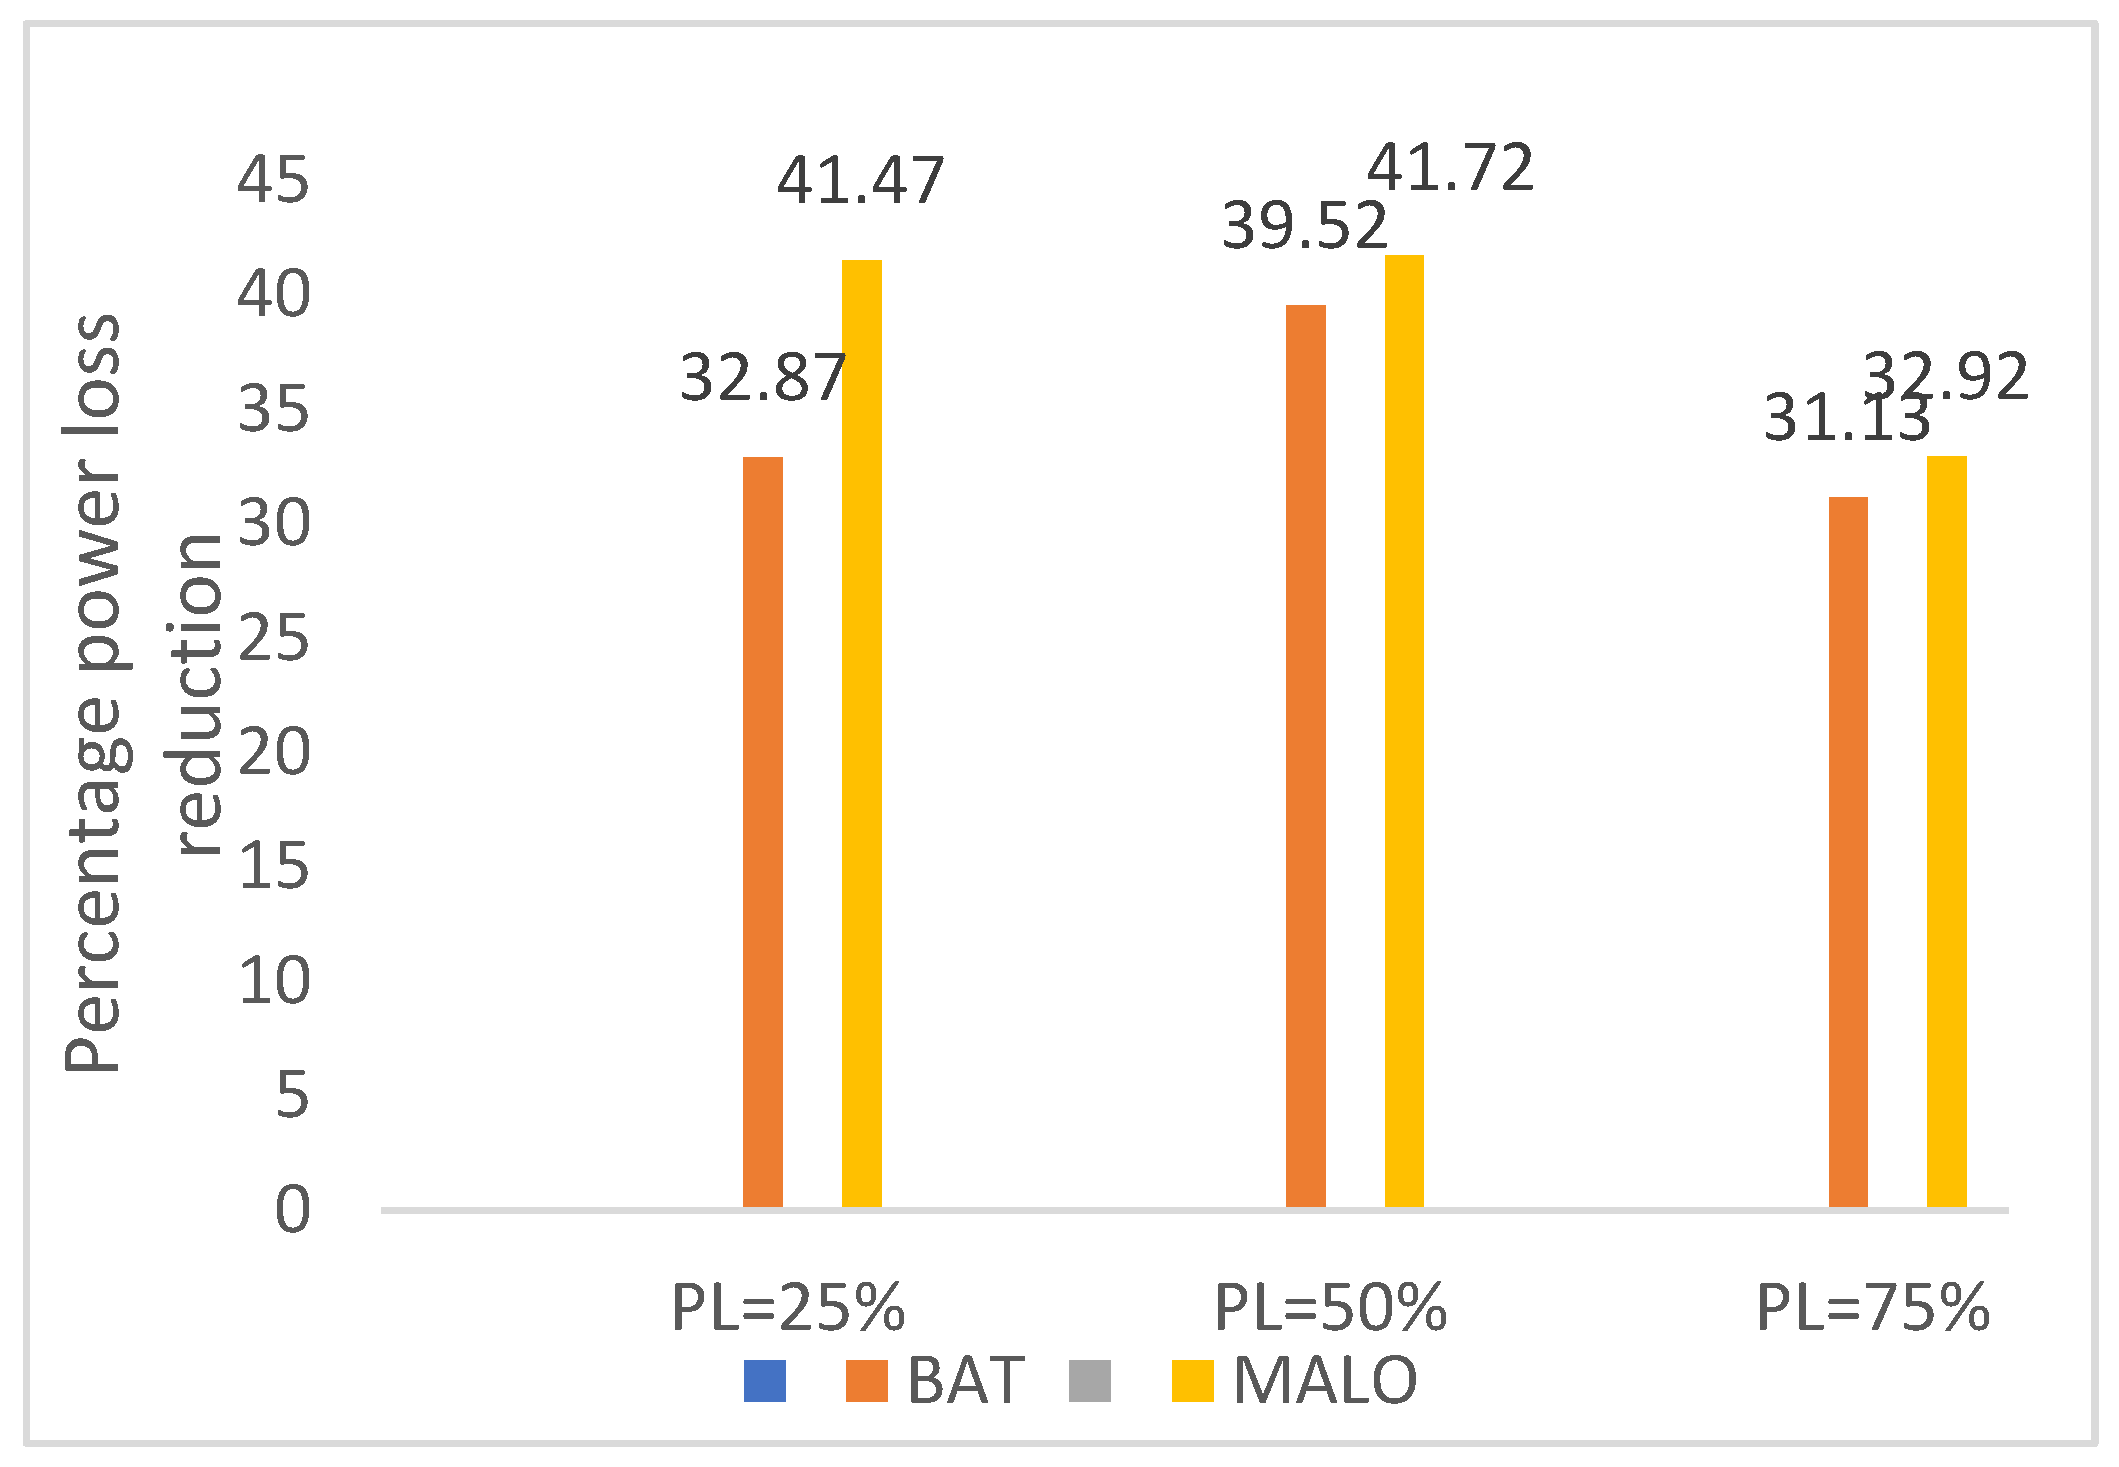
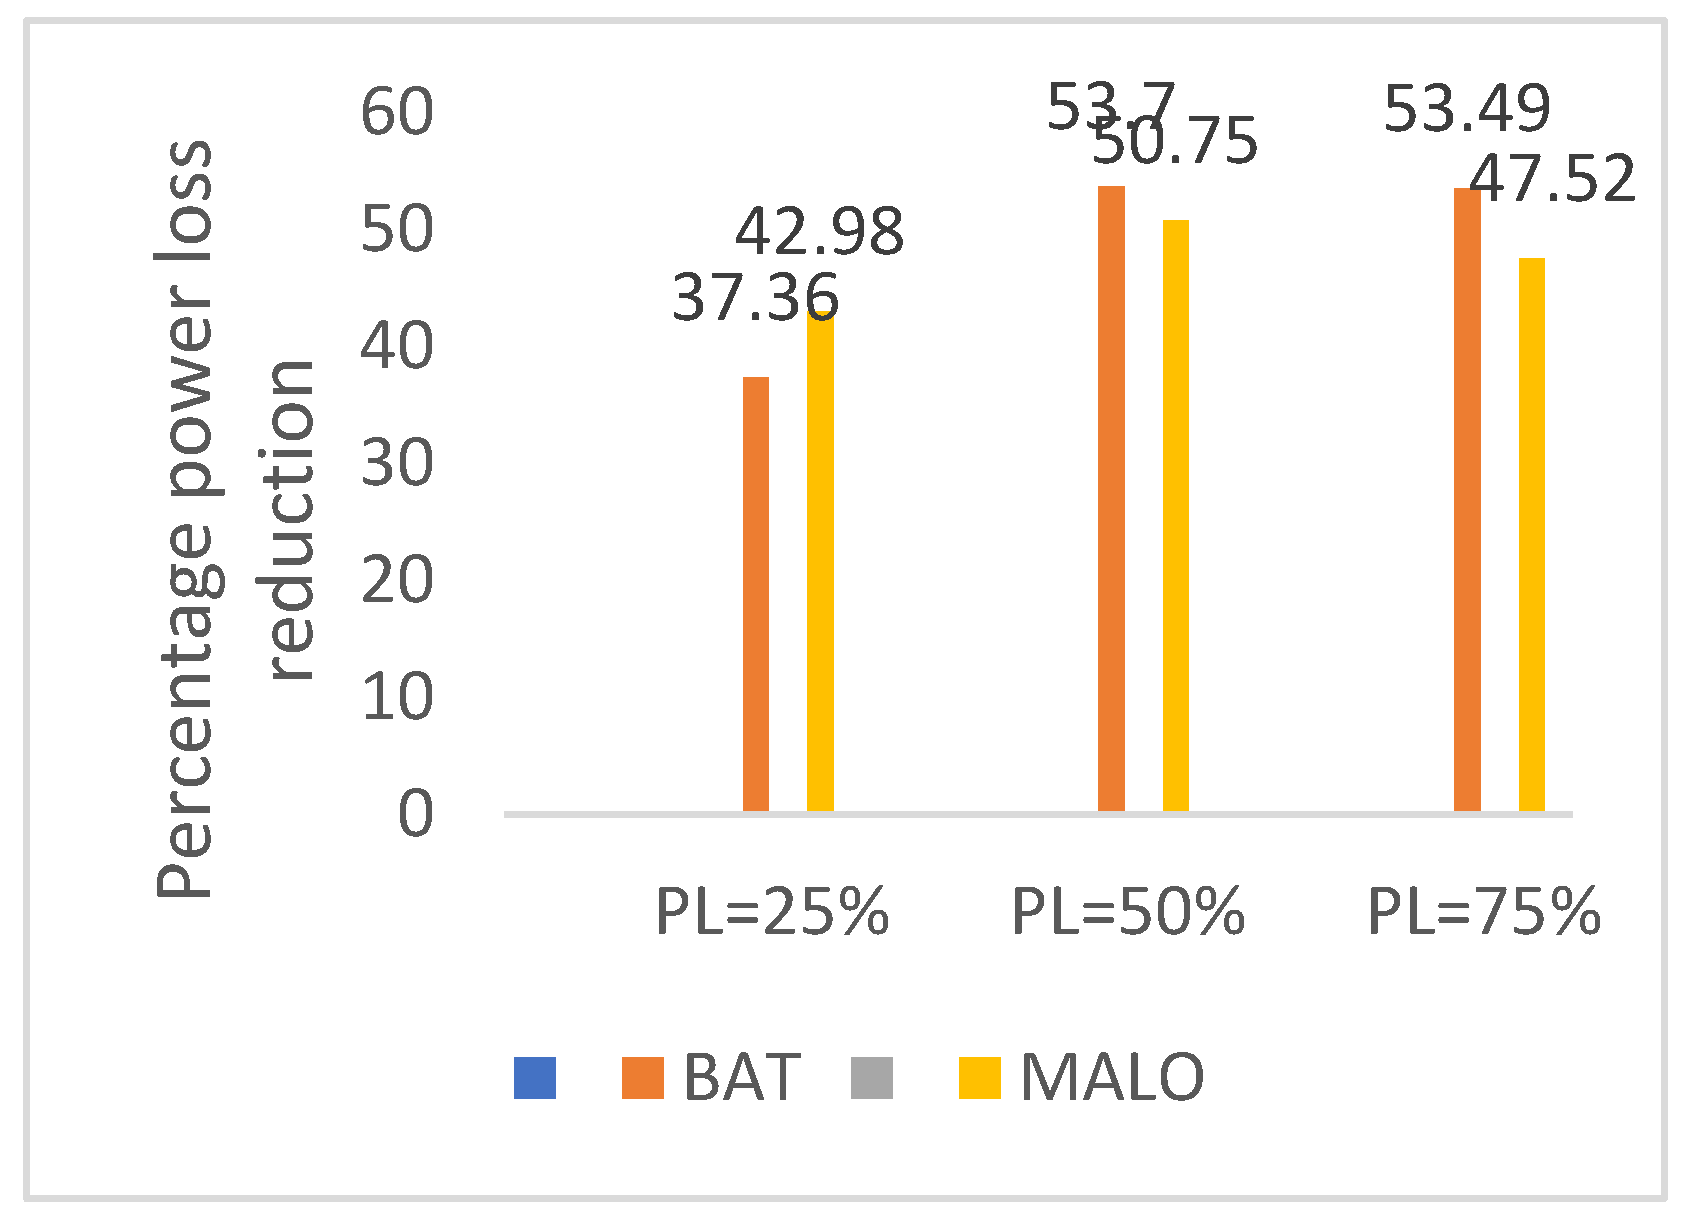
| %Loss reduction | - | 27.93 | 38.32 | 32.87 | 41.47 | - | 38.73 | 39.07 | 37.36 | 42.98 |
| Execution time in seconds | 0.0471 | 1.19 | 1.38 | 0.78 | 0.70 | 0.027 | 0.71 | 0.72 | 0.62 | 0.457 |
| Model | CP Model | CP Model | CP Model | CP Model | |
| Scenario-1 | Parameter quantity | MO-MFPA (Ganesh and (Kanimozhi 2018) |
Grass Optimising Algorithm (Sambaiah and Jayabharathi 2020) |
Proposed BAT (Three distributed PV sources with 25% penetration and two DSTATCOMs) | Proposed MALO(Three distributed PV sources with 25% penetration and two DSTATCOMs) |
| Scenario-2 |
Open switches |
42,25,22,121,50,58,39,95,71,74,97,129,130,109,34 | 25,23,39,43,34,58,124,95,71,97,74,129,130,109,5 | 130,122,128,101,131,21,47,126,125,132,123,119,124,118,127 | 132,120,128,124,121,102,126,51,118,55,125,127,129,119 |
| P Loss(kW) | 854 | 878.57 | 935.48 | 800.62 | |
| % Loss reduction | 32.90 | 31.94 | 27.93 | 38.32 | |
| Vmin(p.u) | 0.9310 | 0.9394(74) | 0.95(40) | 0.95(33) | |
| Scenario-3 |
Open switches |
42, 25, 21, 121, 48, 60, 39, 125, 126, 68, 76, 129, 130, 109, 33 | 16, 21, 39, 43, 32, 58, 124, 125, 71, 97, 128, 85, 130, 108, 132 | 130,122,128,101,131,21,47,126,125,132,123,119,124,118,127 | 132,120,128,124,121,102,126,51,118,55,125,127,129,119 |
| P Loss(kW) | 544 | 435.39 | 871.34 | 759.75 | |
| % Loss reduction | 57.2 | 66.27 | 32.87 | 41.47 | |
| Vmin (p.u) | 0.9654 | 0.9459(71) | 0.95(40) | 0.95(48) | |
| D-STATCOM size and location (kVAr) | 1568(97) |
1868.7(50),1269.47(75),1104.7(111) | 274 (26), 1864(84) | 382 (106), 1317 (47) | |
| PV DG size and location(kW) | 1656(109) | 1743.96(51),1989.9(92),1919.6(109) | 871(81), 1014 (72), 1193 (3) | 1993(65), 604 (84), 621 (102) |
| MODEL | Constant Power Model | ZIP load Model | ||||||||
| Cases | Base Case | BAT Reconfig | MALO Reconfig | BAT DG+DSTAT+Reconfig | MALO DG+DSTAT+Reconfig | Base Case | BAT Reconfig | MALO Reconfig | BAT DG+DSTAT+Reconfig | MALO DG+DSTAT+Reconfig |
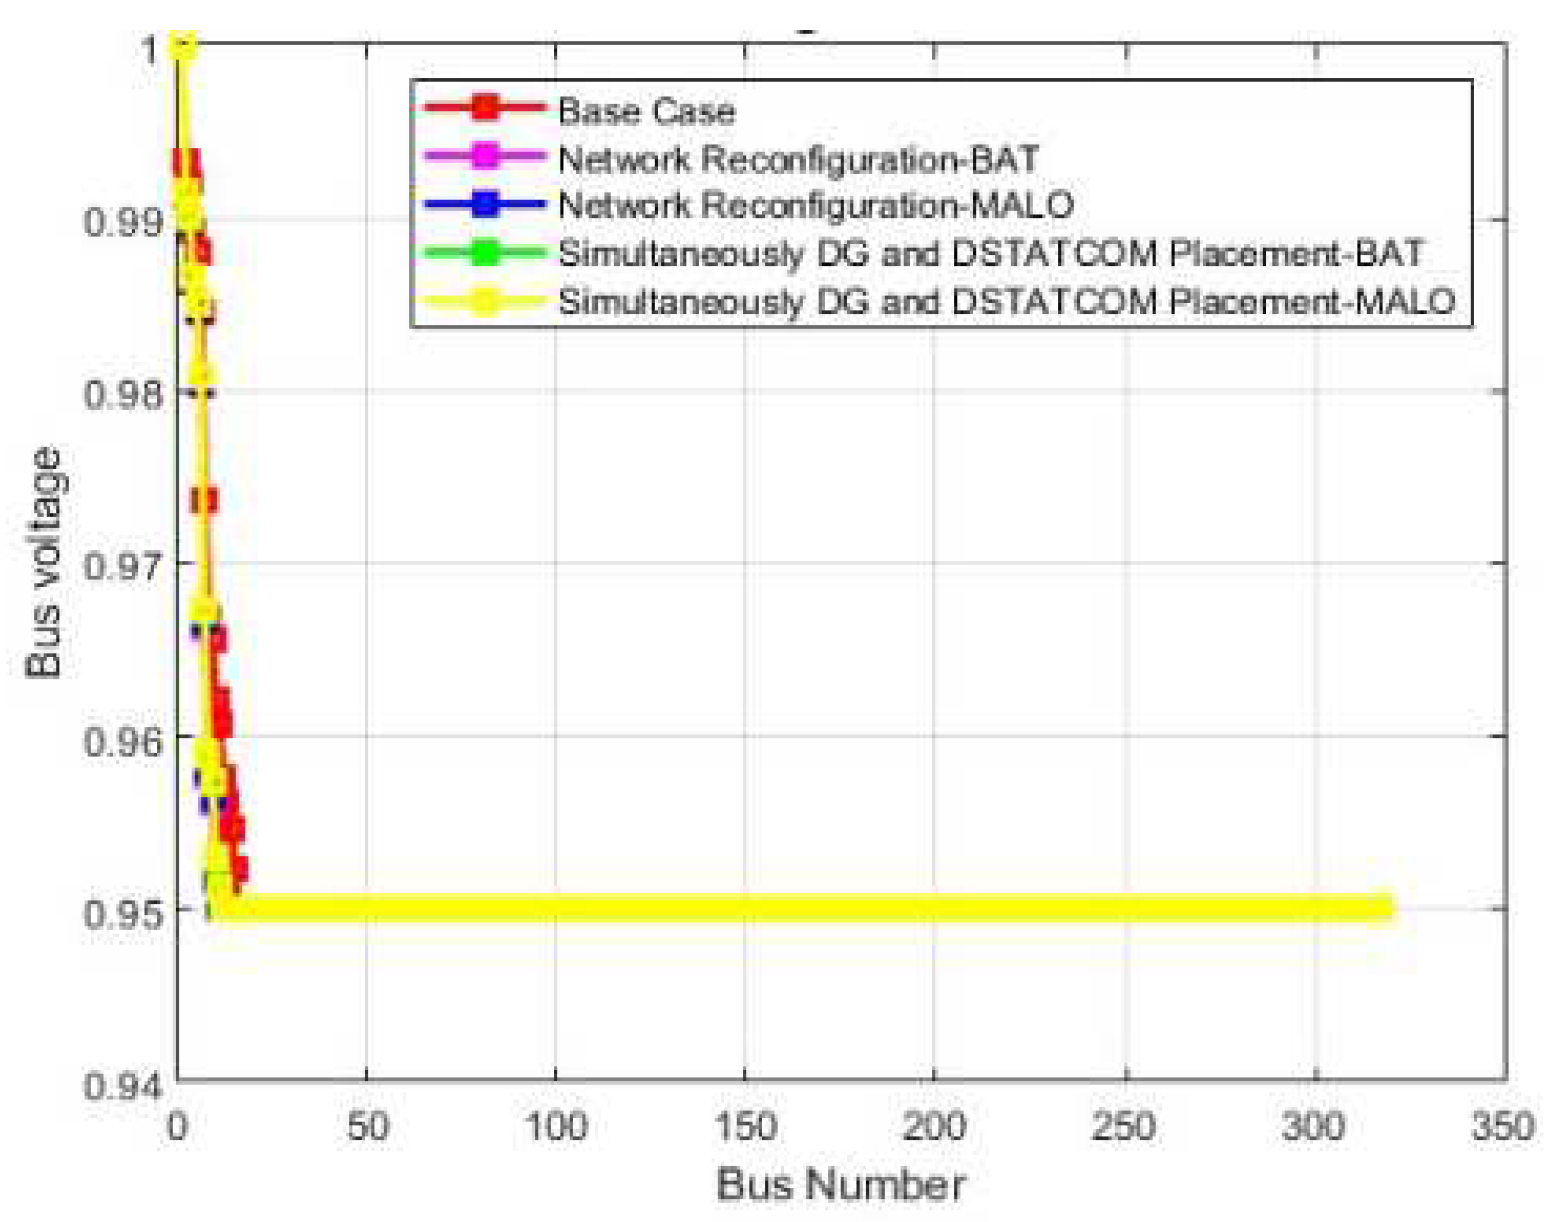
| Real power losses kW | 3.5 E+5 | 3.1 E+5 | 3.25 E+5 | 2.57E+5 | 1.75E+5 | 3.05 E+5 | 2.83E+5 | 2.68E+5 | 1.10E+5 | 1.24E+5 |
| Reactive power loss kVAr | 2.0 E+5 | 1.77 E+5 | 1.83 E+5 | 1.40 E+5 | 0.95 E+5 | 1.78E+5 | 1.60 E+5 | 1.51 E+5 | 0.54E+5 | 1.770.67E+5 |
| PV size and location | - | - | - | 2013(117), 2113(76), 1021(23) | 2142(258), 3022(27), 2568(317) | - | - | - | 3033(294), 3432(6) 378(229) | 5000(294) , 5000(317), 5000(317) |
| DSTATCOM size and location | - | - | - | 6765(122) 2000(192) |
5355(190) 8878(101) |
- | - | - | 9173(136) 7979(85) |
10000(97) 10000(317) |
| Total Operating Cost ($) | - | - | - | 935220 | 1468980 | - | - | - | 1616720 | 2306200 |
| Vmin @bus | 0.95 (12) | 0.95(15) | 0.95(14) | 0.95(10) | 0.95(10) | 0.95 (12) | 0.95(12) | 0.95(12) | 0.95(11) | 0.95(12) |
| %Loss reduction | - | 9.65 | 7.11 | 26.56 | 49.77 | - | 7.36 | 12.30 | 63.78 | 59.34 |
| Execution time in seconds | 0.23 | 20.53 | 20.73 | 7.06 | 6.42 | 0.19 | 6.65 | 29.52 | 6.27 | 6.51 |
| MODEL | Constant Power Model | ZIP load Model | ||||||||
| Cases | Base Case | BAT Reconfig | MALO Reconfig | BAT DG + DSTAT+ Reconfig | MALO DG +DSTAT +Reconfig | Base Case | BAT Reconfig | MALO Reconfig | BAT DG + DSTAT +Reconfig | MALO DG +DSTAT +Reconfig |
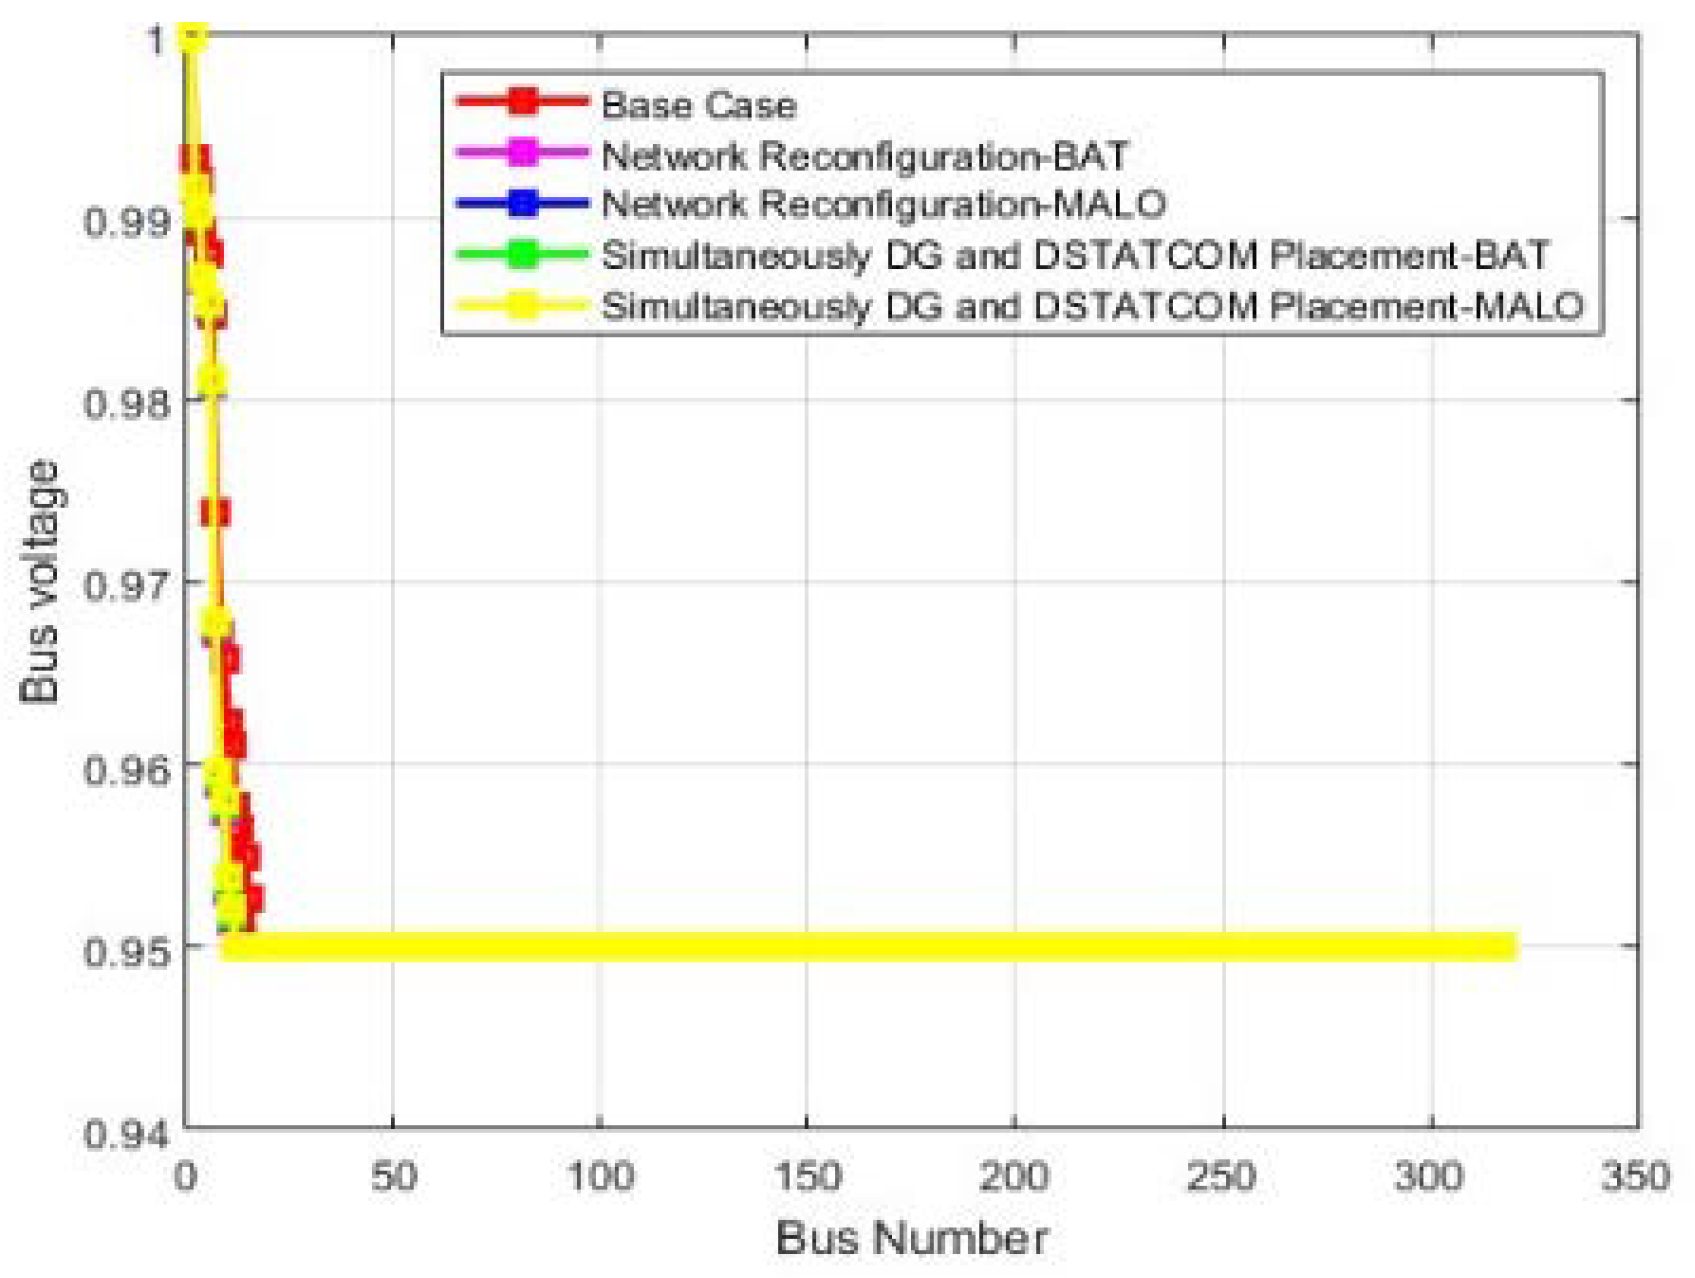
| Real power losses kW | 2.21E+5 | 2.38E+5 | 2.08 E+5 | 0.99E+5 | 1.067 E+5 | 1.65E+5 | 1.75E+5 | 1.46E+5 | 1.02+5 | 0.73E+5 |
| Reactive power loss kVAr | 1.29E+5 | 1.29 E+5 | 1.22 E+5 | 0.51E+5 | 0.61 E+5 | 0.97 E+5 | 0.98 E+5 | 0.85E+5 | 0.57 E+5 | 0.40E+5 |
| PV size and location | - | - | - | 1654(305), 4775(207) ,1967 (219) | 4647 (35) ,2888 (166) ,1212(212) | - | - | - | 253(115), 923(170), 4847 (133) | 5000 (317),5000 (249), 5000 (228) |
| DSTATCOM size and location | - | - | - | 9752 (149) 8864(604) |
6922 (42) 8166 (216) |
- | - | - | 3534(19) 6231 (242) |
10000 (202) 4719 (317) |
| Total operating Cost ($) | - | - | - | 1905880 | 1586315 | - | - | - | 1110030 | 1933980 |
| Vmin @bus | 0.95 (16) | 0.95(11) | 0.95(16) | 0.95(12) | 0.95(16) | 0.95 (16) | 0.95(12) | 0.95(12) | 0.95(12) | 0.95(12) |
| %Loss reduction | - | -8.08 | 5.58 | 55.21 | 51.69 | - | -5.64 | 11.50 | 38.42 | 55.75 |
| Execution time in seconds | 0.222 | 30.11 | 29.80 | 6.24 | 2.52 | 0.1946 | 3.28 | 28.0 | 2.31 | 4.76 |
Disclaimer/Publisher’s Note: The statements, opinions and data contained in all publications are solely those of the individual author(s) and contributor(s) and not of MDPI and/or the editor(s). MDPI and/or the editor(s) disclaim responsibility for any injury to people or property resulting from any ideas, methods, instructions or products referred to in the content. |
© 2023 by the authors. Licensee MDPI, Basel, Switzerland. This article is an open access article distributed under the terms and conditions of the Creative Commons Attribution (CC BY) license (http://creativecommons.org/licenses/by/4.0/).


