Preprint
Article

Enhancing Energy Efficiency of Underwater Sensor Network Routing Aiming to Achieve Reliability

Altmetrics

Downloads

124

Views

42

Comments

0

This version is not peer-reviewed

Submitted:

16 December 2023

Posted:

18 December 2023

You are already at the latest version

Alerts
Abstract
To facilitate wireless communication, ocean exploration, and various environmental and research applications, the underwater Internet of Things has been developed with an infrastructure of acoustic sensor networks. There has been a significant increase in failures and a decrease in the efficiency of the network due to the fluid and challenging underwater environment. Consequently, achieving quality of service (QoS) in underwater networks remains a research area. Supporting QoS in underwater sensor networks is challenging due to resource limitations such as processing power, memory, bandwidth, and power sources. The purpose of this study was to examine the service quality requirements as well as protocols that have been implemented in recent years. Finally, based on quality criteria, we have presented a routing solution based on fuzzy logic, which is more efficient than other recent methods regarding energy consumption rate, JFI, efficiency, and reliability.
Keywords: 
Subject: Computer Science and Mathematics  -   Computer Networks and Communications

1. Introduction

Today, underwater control and monitoring systems are among the most challenging topics in electronics and computer science. The purpose of research is, therefore, to find a solution that meets specific conditions and expectations. The lower the cost-to-efficiency ratio under the same working conditions and quality, the more popular that method will become. Equipment known as sensors can monitor changes in the environment or each set’s status. Sensors embedded in the underwater environment provide information that can be used to monitor the environment and control its changes. About five hundred years ago, underwater acoustics and communication were invented [1]. The discovery of Da Vinci is considered the beginning of underwater acoustic research. Ocean data sampling, environmental monitoring, underwater exploration, accident prevention, monitoring of underwater equipment and structures, navigation, identification of mines and discoveries, and environmental monitoring are among the essential applications of underwater wireless sensor networks [2].
Although these applications offer countless advantages, they pose several challenges [2]. A challenge such as a long and variable propagation delay is that sound waves propagate at a deficient speed and have a propagation time five times shorter than radio waves. Furthermore, due to the dynamic nature of the water environment, the propagation delay of sound waves may vary. There is a limited amount of bandwidth available. Ideally, at a distance of 40 kilometres, there is a bandwidth of 40 kilobits per second [3,4].
Additionally, bandwidth becomes less available as distance increases. It is limited in terms of power and energy due to using batteries. There is usually no possibility of recharging the battery. Further, the sensor nodes are subject to wear and tear due to the seawater’s salt content and the underwater environment [5]. The existence of failure, fading, and multi-pathing phenomena in underwater communications causes nodes to be unable to communicate with one another. Therefore, they have a high bit error rate, resulting in much disconnection. The cost of production is high for these products. Consequently, some studies have attempted to resolve one of the limitations of the network to preserve its energy. For example, scheduling mechanisms for conserving energy in idle mode, restoration of connectivity, indirect routing, and clustering are all effective methods.
In this research, we are looking for a suitable routing information transfer solution based on clustering in underwater sensor networks to achieve service quality with energy consumption in this type of network. Cluster routing locations are heuristic and based on routing paths.
The structure of this article is organised as follows: Section II provides a comprehensive review of prior research in the field of underwater Internet of Things (IoT). Section III introduces the methodology proposed in this study. Section IV details the simulation results obtained from implementing the proposed method. The article concludes with Section V, discussing the implications and conclusions drawn from this research.

2. Related works

The Underwater Internet of Things (UIoT) represents groundbreaking underwater communication and monitoring innovation. This technology enables a robust network of interconnected devices beneath the ocean’s surface, facilitating data collection, environmental monitoring, and various maritime activities. The architecture of UIoT is complex, mainly due to the challenging underwater environment. It typically involves a multi-layer framework comprising sensor nodes, acoustic modems, and surface stations. These sensor nodes collect data from acoustic signals to floating buoys or surface stations. These stations then relay the information to satellites or terrestrial networks for further processing and analysis.
The challenges associated with UIoT are multifaceted and significant. Firstly, the underwater environment poses a major hurdle due to high pressure, salinity, and limited light penetration. These conditions drastically affect communication reliability and data transmission rates. Secondly, acoustic communication, the primary mode of underwater communication, faces issues like limited bandwidth, high latency, and susceptibility to interference from various sources, such as marine life and human activities. Additionally, the deployment and maintenance of underwater IoT devices are logistically challenging and costly, requiring specialised equipment and expertise. Energy consumption and conservation are also critical challenges, as underwater devices must operate for extended periods without easy access to power sources. Addressing these challenges is crucial for successfully advancing the Underwater Internet of Things.

2.1. Quality of Service in UIoT

Achieving quality of service (QoS) in Underwater Internet of Things (UIoT) networks involves various strategies and methodologies, each addressing the unique challenges posed by the underwater environment:
  • Adaptive Modulation and Coding: Adjusts modulation and coding schemes according to channel conditions, balancing data rate and error performance for reliable communication in varying underwater environments [6].
  • Acoustic Beamforming: Directs acoustic signals in specific directions, reducing interference and enhancing signal strength and communication reliability [7].
  • Multi-Path Routing: Uses multiple paths for data packets to increase transmission reliability, compensating for potential path disruptions in dynamic underwater environments [3].
  • Energy-Efficient Protocols: Focuses on conserving energy in underwater sensors with limited power resources, extending their operational lifespan and maintaining network integrity [8].
  • Prioritisation of Data: Implements protocols to prioritise transmitting time-sensitive or critical data, reducing latency and improving response times in crucial scenarios [3].
  • Buffer Management: Manages data packets in transmission queues to handle high latency and variable rates in underwater communications, minimising packet loss and delay [3].
  • Cross-Layer Design: Optimises multiple communication protocol layers simultaneously for significant improvements in network performance and overall quality of service [9].
  • Each method plays a vital role in mitigating the intrinsic challenges of underwater communication, thereby enhancing the quality of service in UIoT networks.

2.2. Clustering in UIoT

Clustering and cluster-based routing are essential in Underwater Sensor Networks and the Underwater Internet of Things to improve network performance, energy efficiency, and reliability of data transmission. In this approach, sensor nodes are grouped into clusters, each led by a Cluster Head (CH). The CH collects and aggregates data from its cluster and then sends it to a base station or surface buoy. This method dramatically reduces long-range transmissions, resulting in energy savings and extended network lifespans [5]. Advantages of Clustering:
  • Energy Efficiency: By minimising direct transmissions to the distant base station and routing through the CH, the energy expenditure is significantly reduced.
  • Scalability: Clustering allows the network to scale effectively, as adding new nodes causes minimal disruption.
  • Load Balancing: Efficiently distributing the role of the CH among various nodes helps balance the energy consumption across the network.

2.3. Cluster-Based Routing in UIoT

Routing in underwater networks, particularly in UIoT, can be complex due to dynamic topology, limited bandwidth, and high latency. Cluster-based routing addresses these challenges by organising the network into manageable clusters, simplifying the routing process [10]. Critical Aspects of Cluster-Based Routing:
  • Intra-cluster Communication: Within a cluster, nodes typically use short-range, low-power transmissions to send data to their CH, reducing energy consumption and minimising interference.
  • Inter-cluster Communication: CHs relay data between clusters or to the surface station. This often involves longer-range transmissions, which are more energy-intensive but restricted to fewer nodes (CHs).
  • Dynamic Cluster Formation: To adapt to the changing underwater environment, clusters may be dynamically reformed and CHs rotated to distribute energy consumption evenly.
In summary, clustering and cluster-based routing in USNs and UIoT are crucial in enhancing network efficiency, particularly in energy conservation and data transmission reliability. These strategies are tailored to overcome the unique challenges of the underwater environment, paving the way for more effective and sustainable aquatic communication systems.

2.4. Recent Quality of Service-Based Routing Protocol

Recent research in UIoT networks has focused on clustering protocols, highlighting the need for energy-conscious network design and control strategies. These studies emphasise the importance of refining clustering techniques by considering various factors such as the dynamic behaviour of underwater entities, node location, energy consumption, traffic load, distance to the cluster head, and transmission methodologies. Critical aspects of routing protocols have been thoroughly examined, encompassing clustering mechanisms, localisation strategies, route planning, and queue-based approaches [11,12] (see Table 1).
  • The study in [13] developed a routing protocol for IoT networks that excels in energy efficiency and minimises latency. This protocol considers several crucial elements, such as node energy levels, transmission distances, data sizes, and routing alternatives. Evaluating these factors ensures data travels via the most effective routes, thereby preventing the overburdening of energy-constrained nodes.
  • In [14], a novel strategy was formulated to address energy wastage in IoT networks, mainly focusing on ‘network holes’ created due to substantial distances between nodes. This strategy involves a guard-based flooding technique, proving to be more effective in filling these gaps than other existing methods.
  • The research in [15] proposed a unique routing protocol for underwater sensor networks that surpasses others in energy efficiency. It employs multi-hop communications and underwater relay nodes for data transfer, consequently reducing the energy consumption of individual nodes. This protocol has also demonstrated superior performance in total energy conservation compared to other renowned protocols.
  • In [16], innovative routing protocols were developed for underwater IoT devices to enhance energy efficiency and QoS. These protocols leverage a clustering strategy to organise devices and employ opportunistic routing for data transmission across clusters. Their performance has been shown to exceed existing protocols regarding energy efficiency and QoS.
  • The DSPR protocol, as mentioned in [17], represents a novel approach in underwater IoT networking, targeting improvements in energy efficiency and reliability through directional routing and selective power regulation. However, further empirical testing is required to evaluate its efficacy in real-world scenarios.
  • The study in [18] introduced an advanced technique for localising underwater IoT devices, integrating magnetic, optical, and acoustic communications. This method shows greater accuracy than previous techniques, yet more research is needed for practical application development.
  • In [19], a fresh clustering protocol for underwater IoT networks was proposed, utilising the k-means algorithm for cluster head selection. This protocol’s simplicity and effectiveness are notable, but further comparative studies with other underwater IoT-specific clustering protocols are essential for a comprehensive assessment.

3. Proposing method

3.1. Clustering

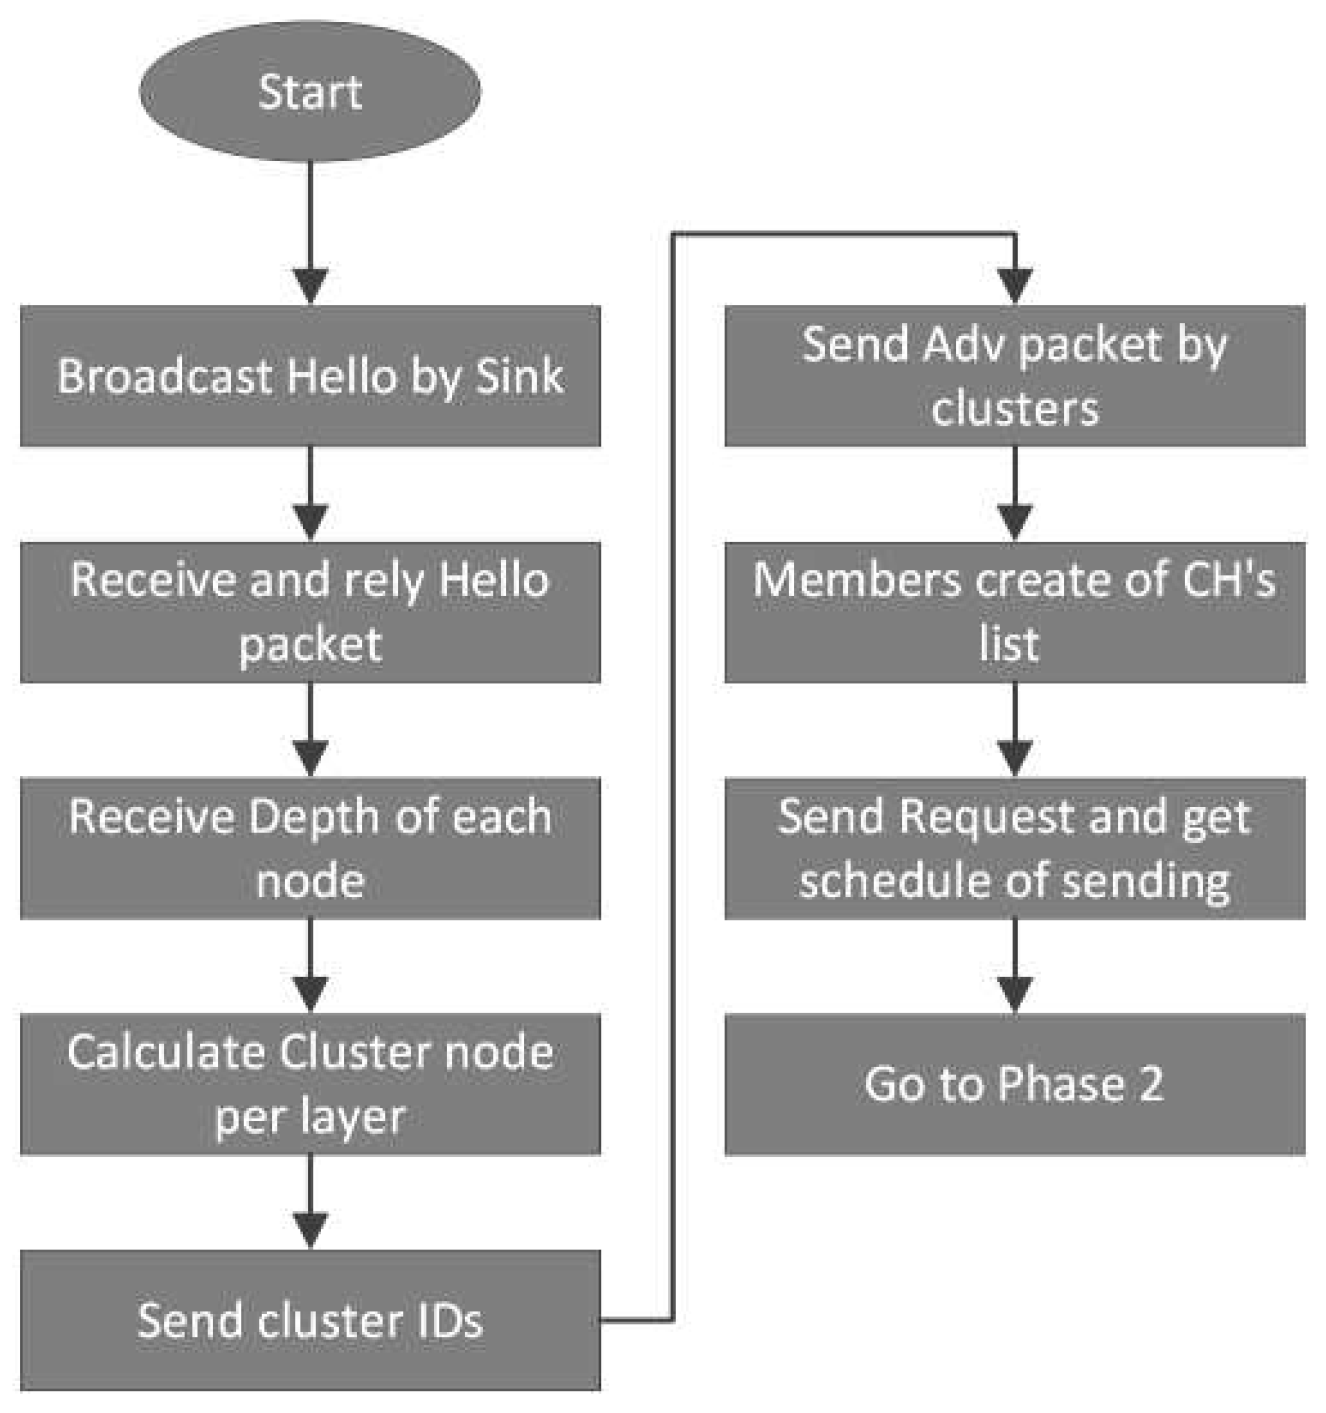
According to the proposed method, network nodes are managed in clusters before routing and transmitting information to the well. Several protocols have been proposed in underwater wireless sensor network clustering; however, each protocol has shortcomings, depending on its application, which may not be able to be used in random and challenging underwater sensor conditions or provide acceptable network efficiency. Accordingly, the proposed method employs a hybrid mode, in which the sensor nodes are clustered in the first stage, and routing between the cluster head nodes and the well will be created in the network after the clustering process is complete. The clustering model in the proposed underwater sensor network is shown in Figure 1 and Figure 2.

3.2. Routing

According to the mentioned conditions of the basic algorithm, we use fuzzy logic in our proposed method to send data to the well and select the next step for transmitting data. The node with the highest fuzzy value will be chosen as the next step. The desired parameters in this fuzzification will be the remaining energy, the direct distance to the well, the Depth and the number of neighbours of the node. In this way, the node selected with this mechanism has the best conditions in front of its one-step neighbours, which will increase the reliability of the network and the death time of the first network node. The path created by our proposed method is valid until t seconds, and we will use another phase to determine the status of the nodes again, which includes the parameters of the number of downstream members of each node (to predict how much traffic there is on the target node) In other words, the traffic available in the recent period is on the node) Moreover, the value of the fuzzy value of the node is in the previous stage to improve the reliability of sending data in the network and prevent the delay and failure of the link in the network.
In the future, when the fuzzy status determination values are sent to the neighbours by the network nodes, the nodes that are in the same neighbourhood and do not have a connection with each other, after hearing the status determination message, the nodes can be separated from their current path and go to a more suitable upstream node that has better conditions in terms of The traffic load. The number of downstream members will increase, increasing the network’s dynamic balance. The proposed approach in this section will result in the dynamics of the virtual pipe and make the network more stable compared to environmental changes.
Another phase is the proposed multicast transmission, where each sensor node will send its packet to two or more nodes in its routing list with the highest scores. Each upstream node will forward the packet to its upstream parent as soon as it receives it. Upon receiving a flag in the packet header of the first forwarding node, the neighbouring nodes will pause for twice the length of the path and queue for the packet. Suppose the Ack message is not received from the parent node. In that case, the primary forwarder will resend the packet after the mentioned time, but this will be from a path other than the path of the direct forwarder, which will increase the chance of the node transmitting data. In this scenario, node A multicasts its packet to nodes B and C, and because node B hears the packet sent by C to F, it stops sending it again and stops twice the RTT time. If after the above time, node F does not send the Ack confirmation message to its neighbours, node B will send the message received from A that it has queued in the form of multicast, with the difference that in this round, in the header of the packet, node F’s ID will be among the recipients. The package sent by B will not exist. Therefore, this process is repeated until the package reaches the destination.
For a better description of the proposed method, we describe the work steps line by line:
  • Start
  • The Sink sends a broadcast message on the network. (nodes get their direct distance to the Sink)
  • Each node sends its distance to the Sink, Depth and energy in a packet to its neighbours.
  • The data-sending node selects the next best step by fuzzy calculation of its neighbouring nodes based on the parameters of residual energy, direct distance to the Sink, Depth, and number of hops.
  • Step four is repeated until the data reaches the Sink.
  • After the const of T seconds in the network, the status of the network nodes is determined using another Fuzzy to decide which nodes carry a large traffic load and are at risk of being lost. This fuzzy approach will be based on the traffic load rate on the node in the recent sampling period, the amount of remaining energy, the number of neighbours available to the node and the throughput criterion. If a node has more neighbours, it can get the chance of not being in the relay path and save energy.
  • When the status of the nodes is determined, the neighbouring nodes will be informed of their position, and if it was better than the next step T seconds ago, they will change their next step.
  • Nodes forward the packet to some high priority forwarding in their list. After receiving the packet, each node checks whether the packet received an Ack from other neighbours.
  • After stopping the 2xRTT time, if it has not received the Ack packet, it will resend it; otherwise, it will delete it.
Note: This method’s energy-saving approach will remove the high-consuming GPS factor and increase the Average Lifetime Network.

3.3. Fuzzy calculation

This fuzzy method selects the appropriate next step with the remaining energy, less than the sink node, less than the water level and the neighbour in the current cluster head, which are considered as the inputs of the fuzzy system:
  • Network residual energy
Network residual energy is an essential factor in calculating the lifetime of a node in the network. The energy the node releases is used to communicate with other nodes or in idle mode; the remaining energy is calculated using formula 1.
R e m a i n i n g   E n e r g y = T o t a l   E n e r g y E n e r g y   C o n s u m p t i o n
  • Distance between nodes
The distance between 2 connected nodes is calculated at a particular time. Distance is essential, as the energy consumed in transmitting a packet depends on the distance between two nodes. The distance is calculated by the Euclidean geometry formula 2:
D i s t a n c e =   ( X 1 X 2 ) 2 + ( Y 1 Y 2 ) 2 + ( Z 1 Z 2 ) 2
  • Depth: In underwater sensor nodes, by default, all nodes have a depth gauge, and Thay have not applied any additional costs to the network.
  • Number of Neighbours: Each node constructs a list of accessible nodes in its vicinity based on the packets received from neighbouring nodes.
Enhancing network efficiency and minimising congestion requires optimising the fitness function, as outlined in Equation 3.
F F ( f i ) = i = 1 N ( w 1 × E i ) + ( w 2 × D j , i   ) + ( w 3 × D E i ) + ( w 4 × N N i   )
Where i means iteration, which can range from 1 to N (the total number of nodes).
  • And w1, w2, w3, w4 is the load (or weight) prepared on the algorithm.
  • E i  is the residual energy of each node in the network.
  • D j , i    is the distance between nodes i and j.
  • D E i  is the Depth of node.
  • NN is the number of accessible neighbours.
We have used the triangular fuzzification model and state levelling method (Figure 4 and Table 2):
Figure 3. Fuzzification of Remaining Energy.
Preprints 93567 g003
Finally, the cluster head node with the highest FF value should be selected as the most suitable next step. For example, a table is created in each cluster head node according to Table 3, which will be updated after different time intervals.
In the proposed method, after the interval of t seconds, a fuzzy value update will be done based on the network traffic. This update ensures that a node known as a suitable node by the initial fuzzy computation is not placed in the top traffic of the network. For this purpose, another fuzzy system has been proposed, which accepts as input the fuzzy amount obtained from the first stage, known as FF, and the traffic rate in the recent period, resulting in an updated fuzzy value.

4. Simulation

To evaluate and compare the proposed method with recent methods such as [16,17,19], NS simulation version 2.31 and Aquasim package version 2 were used. The beam widths of each underwater sensor node varied between 0 and 360 degrees. The radio range of the sensor node was 150 meters, and the radio range of the Sink was 200 meters. Network nodes were randomly distributed in the underwater environment (Table 4).

4.1. Network Lifetime

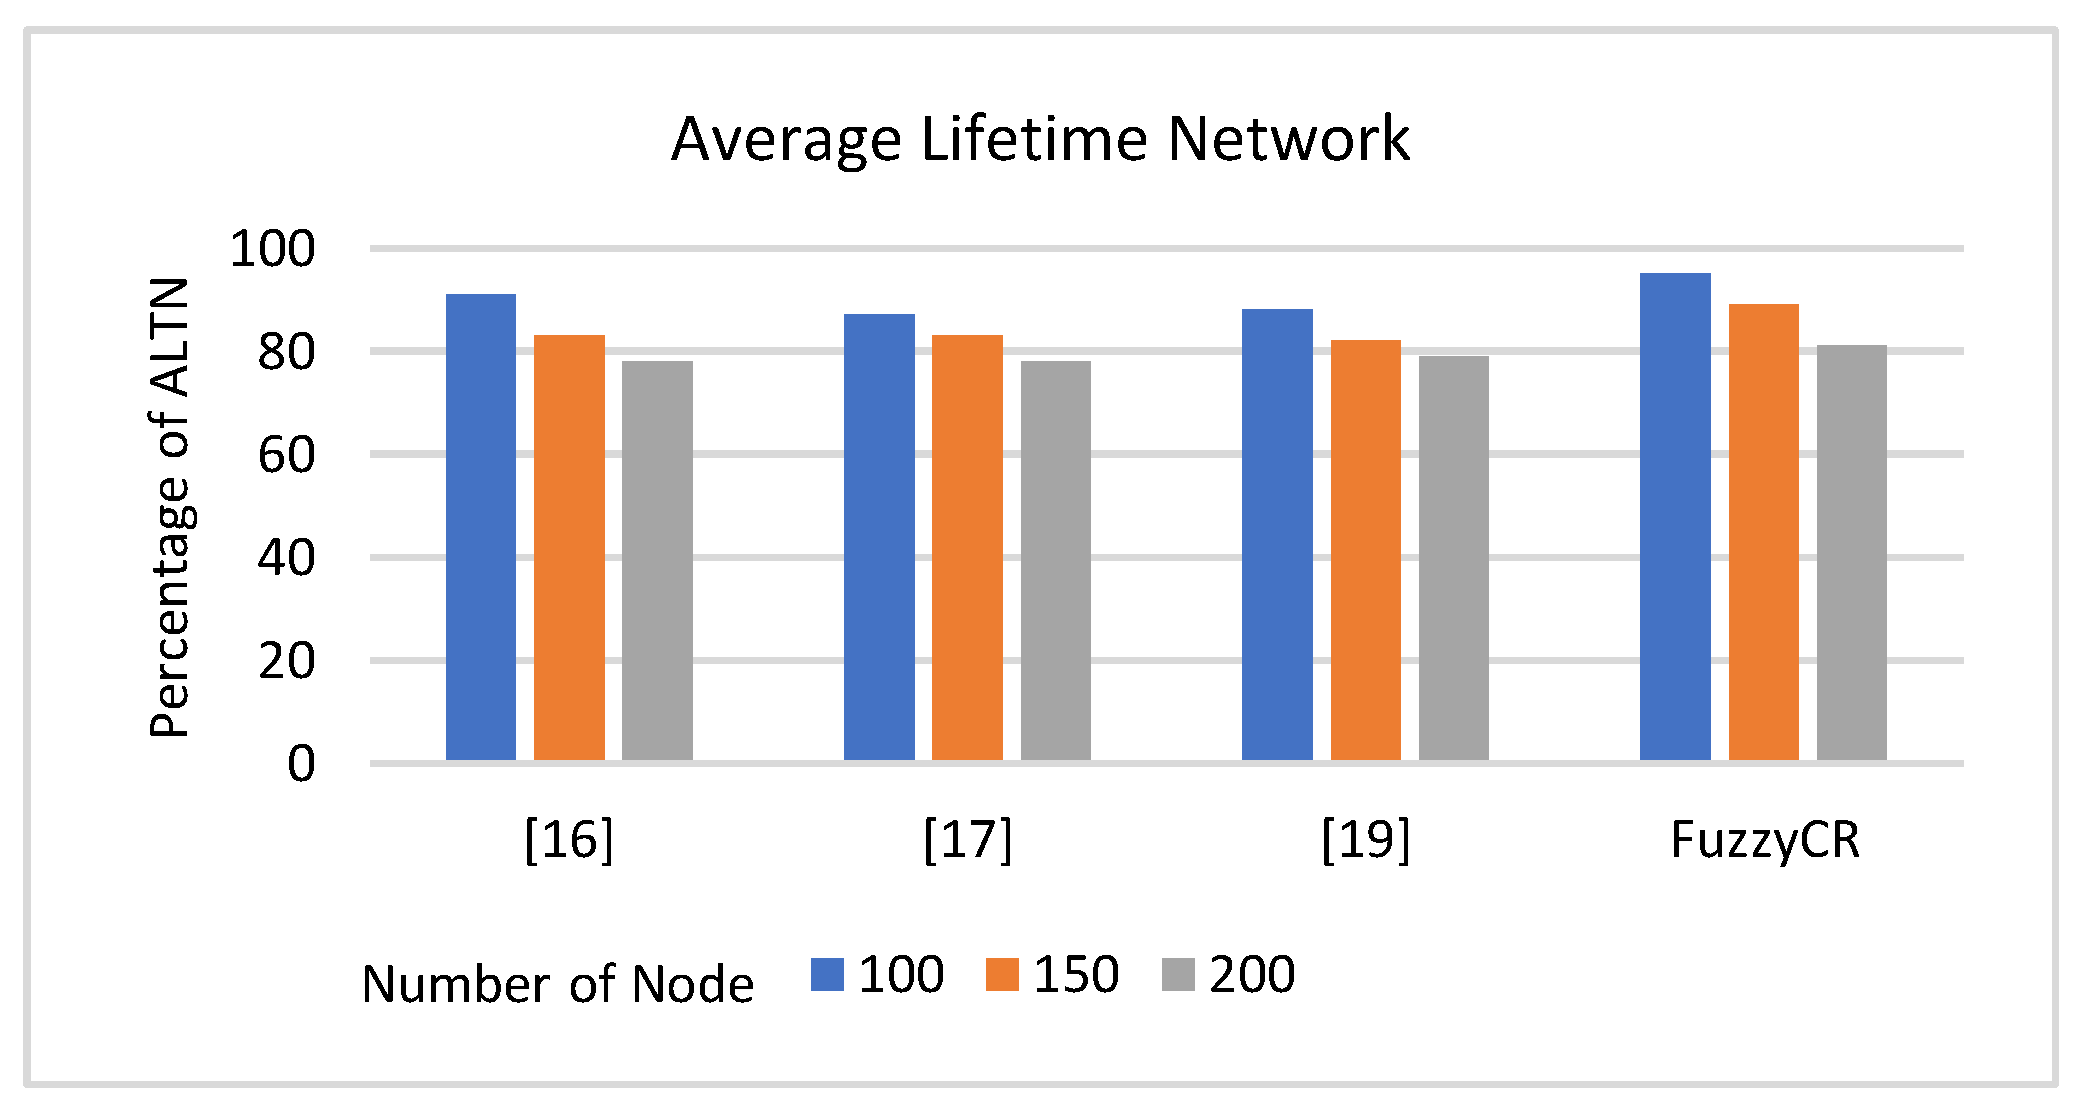
The test evaluates a new protocol’s durability in a network by examining its graph structure, optimal pathfinding, and energy balance. A strategic decision-making framework focusing on energy and resource usage produces uniform energy consumption and enhances network robustness. The network’s resilience against failures like link deterioration or energy depletion is notably improved. The ‘first node death’ metric measures the protocol’s effectiveness, where delayed node failure indicates better energy balance and reduced network issues. Detailed results of initial node mortality in tested protocols are presented in Table 5.
The calculation of the initial node’s death time and the Average Lifetime of the Network (ALTN) is derived using equation 4:
A L T N = i = 1 N m t i + ( m × T ) N
Here, ti represents the death time of the ith node, N signifies the total count of nodes in the network, m indicates the count of nodes remaining at the simulation’s conclusion, and T denotes the pre-established lifetime of the network (Figure 4 and Table 6).

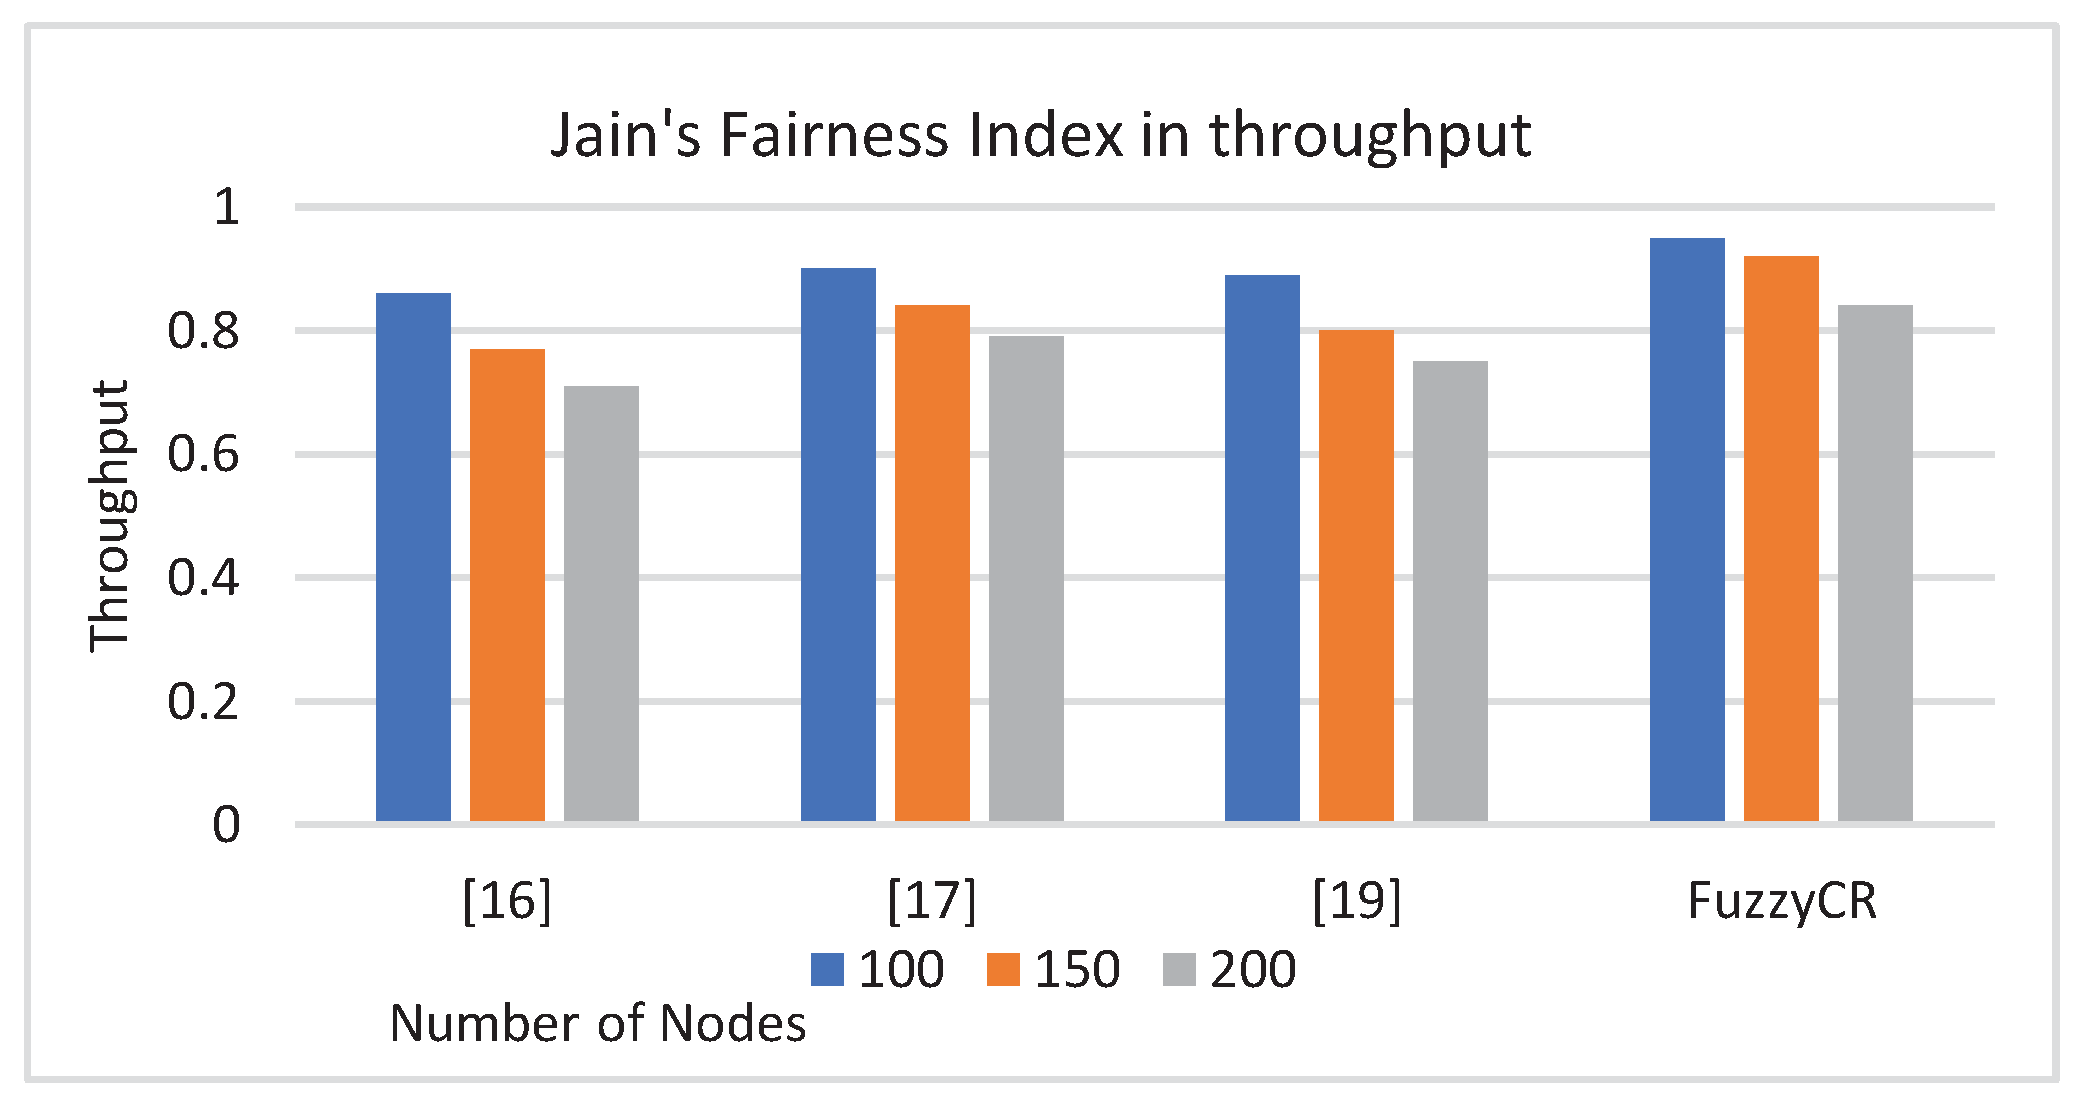
4.2. JFI test in link’s throughput

The assessment of Jain’s Fairness Index (JFI) in distributing network resources for forward links among nodes requires initially computing the link throughput. This throughput is influenced by various factors, including heightened traffic, link losses, queuing issues, bandwidth constraints, discrepancies in the transmission and reception rates, and congestion and collisions at the receiver. The FuzzyCR method aims to mitigate these issues as effectively as possible. This is achieved through a decision-making system that establishes stable links by pairing suitable parent nodes with each child node during the formation of the network graph. This fuzzy approach helps sustain node throughput by ensuring load balancing. The throughput between a child link  ( i )  and a parent node  ( p )  is determined using Equation 5. Additionally, Equation 6 calculates the fairness level (JFI) in the allocation of network resources like bandwidth to the nodes, where  ( T h i )  is the throughput of the child link  ( i )  and parent  ( p ) , and  ( n )  denotes the total node count in the network (Figure 5).
T h r o u g h p u t i , p = i = 1 n ( ( s i z e d a t a ) × ( t i m e _ t a k e n d a t a _ t r a n s m i t t i n g ) )   ( R e s p o n s e t i m e ) × n
J F I T h = [ i = 1 n T h i ] 2 n i = 1 n ( T h i ) 2

4.3. Energy efficiency and fairness

In underwater sensor networks, performance and data transfer are significantly affected by various challenges, especially the limited energy capacity of nodes. Considering the limited energy resources available, the main goal in designing such networks is to ensure that energy is used evenly across all nodes. Using energy more efficiently and within acceptable limits leads to a longer lifespan for individual nodes and the entire network, thereby preventing early node failures. The network’s energy efficiency is assessed using three principal metrics: the average balance of energy, the fairness in energy consumption among nodes, and the lifespan of individual nodes. However, before assessing energy consumption fairly, this study calculates standard energy consumption based on Equation 7.
E t x ( m ,   d ) = ( E c o n × m ) + ) t a m p × m × l 2 )
In this context,  E c o n  represents energy consumption,  l 2  denotes energy loss, and d is the distance between a node and its parent. The amplification factor for node transmission is represented by  t a m p ,  and m signifies the bits transferred between the child and parent nodes. According to Equation 7, the average energy level is calculated as the ratio of the total remaining energy in all nodes at the end of the simulation to their total initial energy. This proposed method demonstrates several benefits over other approaches, leading to promising outcomes in this experiment. The variance in energy consumption is determined using Equation 7, while the fairness of energy consumption across nodes is calculated with Equation 8. The deviation in energy consumption is given by:
D e v = i = 1 n ( e n e r g y i A v e r a g e ) 2
Table 7. Node energy consumption variance in different methods.
Network Size [16] [17] [19] FuzzyCR
100 35.22 36.34 37.11 42.17
150 36.87 37.18 39.83 45.03
200 37.07 38.55 41.28 47.8
When the value derived from Equation 8 approaches 100%, it indicates a balanced energy consumption among nodes. Here, Devworst represents the most unfavourable scenario in which half of the nodes have depleted their energy while the remaining nodes have not consumed it. The fairness is calculated as follows:
F a i r n e s s = 1 D e v D e v w o r s t
Table 8 shows that in the FuzzyCR protocol, fairness in energy consumption among network nodes improves with more nodes but worsens with increased traffic. Higher node counts provide more options for fair distribution, while heavy traffic reduces the ability to maintain energy equity. The table illustrates the direct and inverse relationships of node count and traffic intensity, respectively, with fairness.

5. Conclusion

In this research, considering the importance of service quality in the underwater Internet of Things, we proposed a hierarchical protocol based on audio sensors. In this method, two clustering structures and inter-cluster communication were created in the network graph, which was done according to the effective metrics in increasing the network efficiency. Finally, after performing the simulation, we concluded that the proposed method has performed well compared to other recent methods in energy consumption efficiency and the justice of using links in the network.

References

  1. K. K. Gola, M. Dhingra, B. Gupta, and R. Rathore, “An empirical study on underwater acoustic sensor networks based on localisation and routing approaches,” Adv. Eng. Softw., vol. 175, p. 103319, 2023. [CrossRef]
  2. B. Ragavi, V. Baranidharan, A. John Clement Sunder, L. Pavithra, and S. Gokulraju, “A Comprehensive Survey on Different Routing Protocols and Challenges in Underwater Acoustic Sensor Networks,” Recent Adv. Metrol., pp. 309–320, 2023. [CrossRef]
  3. J. Jiang, G. Han, and C. Lin, “A survey on opportunistic routing protocols in the Internet of Underwater Things,” Comput. Networks, vol. 225, p. 109658, Apr. 2023. [CrossRef]
  4. S. A. H. Mohsan, Y. Li, M. Sadiq, J. Liang, and M. A. Khan, “Recent advances, future trends, applications and challenges of internet of underwater things (iout): a comprehensive review,” J. Mar. Sci. Eng., vol. 11, no. 1, p. 124, 2023. [CrossRef]
  5. E. S. Ali, R. A. Saeed, I. K. Eltahir, and O. O. Khalifa, “A systematic review on energy efficiency in the internet of underwater things (IoUT): Recent approaches and research gaps,” J. Netw. Comput. Appl., vol. 213, p. 103594, Apr. 2023. [CrossRef]
  6. X. Cui, P. Yan, J. Li, S. Li, and J. Liu, “Deep reinforcement learning-based adaptive modulation for OFDM underwater acoustic communication system,” EURASIP J. Adv. Signal Process., vol. 2023, no. 1, p. 1, 2023. [CrossRef]
  7. D. A. Cuji and M. Stojanovic, “Transmit Beamforming for Underwater Acoustic OFDM Systems,” IEEE J. Ocean. Eng., 2023. [CrossRef]
  8. S. Bharany, S. Sharma, N. Alsharabi, E. Tag Eldin, and N. A. Ghamry, “Energy-efficient clustering protocol for underwater wireless sensor networks using optimised glowworm swarm optimisation,” front. Mar. Sci., vol. 10, p. 1117787, 2023. [CrossRef]
  9. Z. Zhu, Y. Zhou, R. Wang, and F. Tong, “Internet of Underwater Things Infrastructure: A Shared Underwater Acoustic Communication Layer Scheme for Real-world Underwater Acoustic Experiments,” IEEE Trans. Aerosp. Electron. Syst., 2023. [CrossRef]
  10. K. Sathish et al., “Reliable Data Transmission in Underwater Wireless Sensor Networks Using a Cluster-Based Routing Protocol Endorsed by Member Nodes,” Electronics, vol. 12, no. 6, p. 1287, 2023. [CrossRef]
  11. M. Faheem et al., “QoSRP: A cross-layer QoS channel-aware routing protocol for the internet of underwater acoustic sensor networks,” Sensors (Switzerland), vol. 19, no. 21, 2019. [CrossRef]
  12. M. Al-Bzoor, A. Musa, K. Alzoubi, and T. Gharaibeh, “A Directional Selective Power Routing Protocol for the Internet of Underwater Things,” Wirel. Commun. Mob. Comput., vol. 2022, pp. 1–13, Feb. 2022. [CrossRef]
  13. W. Xu, R. He, and C. Yu, “Energy Efficient Routing for Multi-modal Underwater Wireless Sensor Networks,” in 2021 International Conference on Security, Pattern Analysis, and Cybernetics(SPAC), Jun. 2021, pp. 516–520. [CrossRef]
  14. U. Draz et al., “Energy efficient watchman based flooding algorithm for IoT-enabled underwater wireless sensor and actor networks,” ETRI J., vol. 43, no. 3, pp. 414–426, Jun. 2021. [CrossRef]
  15. K. Bhattacharjya, S. Alam, and D. De, “CUWSN: energy efficient routing protocol selection for cluster based underwater wireless sensor network,” Microsyst. Technol., vol. 28, no. 2, pp. 543–559, Feb. 2022. [CrossRef]
  16. V. G. Menon, D. Midhunchakkaravarthy, A. Sujith, S. John, X. Li, and M. R. Khosravi, “Towards Energy-Efficient and Delay-Optimized Opportunistic Routing in Underwater Acoustic Sensor Networks for IoUT Platforms: An Overview and New Suggestions,” Comput. Intell. Neurosci., vol. 2022, pp. 1–15, Mar. 2022. [CrossRef]
  17. D. R. Kesari Mary, E. Ko, D. J. Yoon, S.-Y. Shin, and S.-H. Park, “Energy Optimisation Techniques in Underwater Internet of Things: Issues, State-of-the-Art, and Future Directions,” Water, vol. 14, no. 20, p. 3240, Oct. 2022. [CrossRef]
  18. R. A. Khalil, N. Saeed, M. I. Babar, T. Jan, and S. Din, “Bayesian Multidimensional Scaling for Location Awareness in Hybrid-Internet of Underwater Things,” IEEE/CAA J. Autom. Sin., vol. 9, no. 3, pp. 496–509, Mar. 2022. [CrossRef]
  19. L. Li, Y. Qiu, and J. Xu, “A K-Means Clustered Routing Algorithm with Location and Energy Awareness for Underwater Wireless Sensor Networks,” Photonics, vol. 9, no. 5, p. 282, Apr. 2022. [CrossRef]
  20. R. W. L. Coutinho and A. Boukerche, “OMUS: Efficient Opportunistic Routing in Multi-Modal Underwater Sensor Networks,” IEEE Trans. Wirel. Commun., pp. 1–1, 2021. [CrossRef]
  21. Q. Wang, J. Li, Q. Qi, P. Zhou, and D. O. Wu, “An Adaptive-Location-Based Routing Protocol for 3-D Underwater Acoustic Sensor Networks,” IEEE Internet Things J., vol. 8, no. 8, pp. 6853–6864, Apr. 2021. [CrossRef]
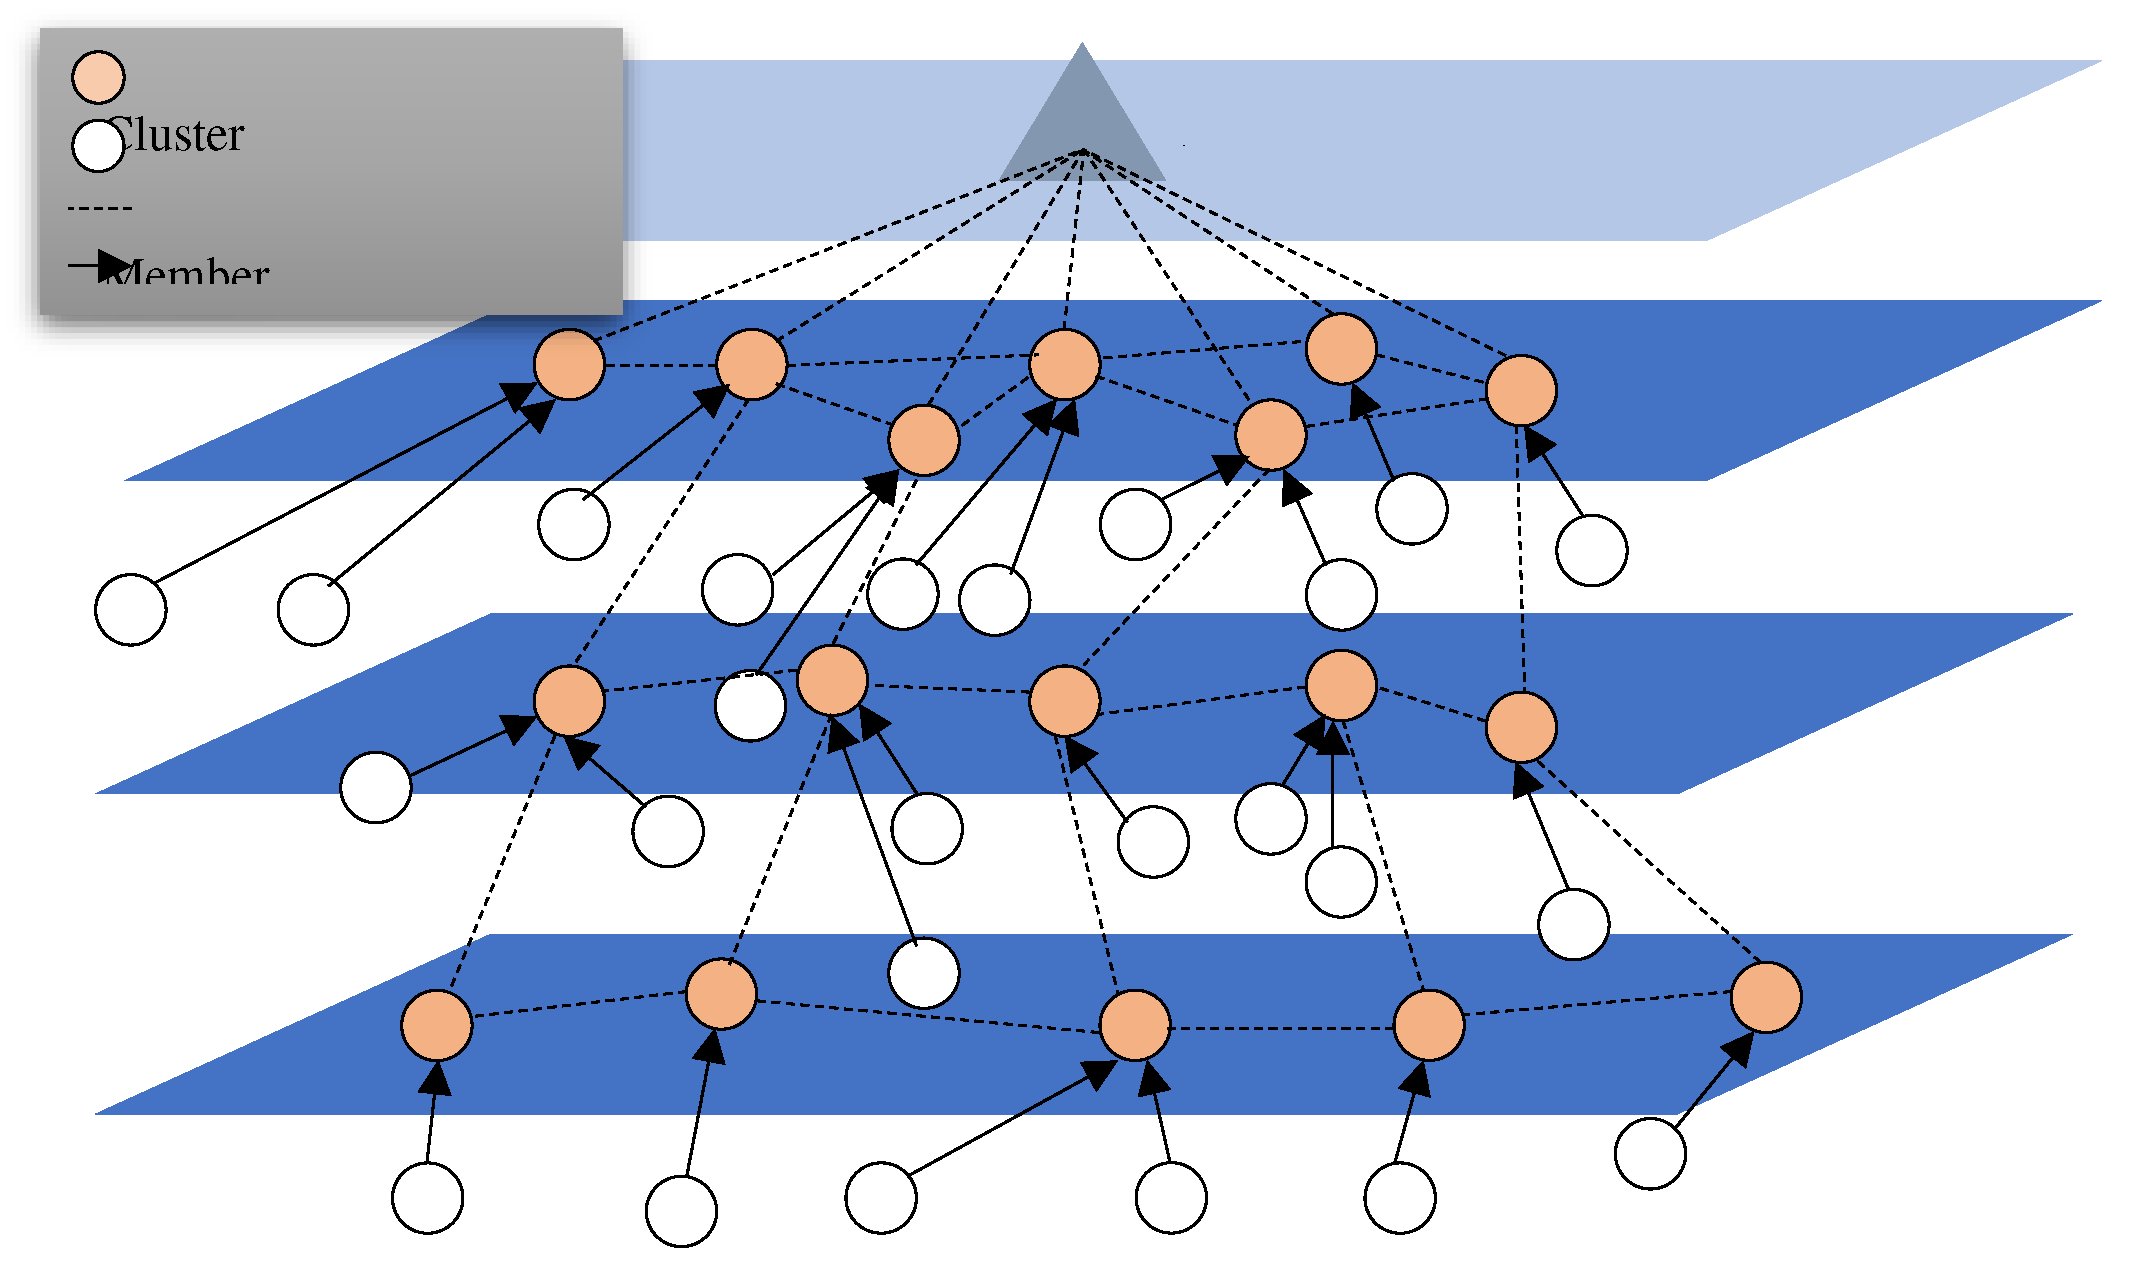
Figure 1. Representation of hierarchical clustering in the proposed underwater sensor network.
Preprints 93567 g001
Figure 2. Clustering Process.
Preprints 93567 g002
Figure 4. Average lifetime network test.
Preprints 93567 g004
Figure 5. Jain Fairness Index in throughput.
Preprints 93567 g005
Table 1. Recent Energy Efficient Routing Protocols and Quality of Service.
Protocol Algorithm Method Performance indicators
Energy Efficiency Lifetime QoS Efficiency
[13]
2021
Improved Energy Efficiency Routing Protocol Balancing traffic load between nodes with higher residual energy Low Low Low
[14]
2021
Guard-based flood pattern Reducing energy consumption by solving the problem of holes due to the long distance of the route. High Low Low
[15]
2022
Cluster approach based on energy-efficient routing protocol Reducing energy consumption and the possibility of network development with multi-step communication. Low Low High
[16]
2022
Opportunistic location-based routing protocols Increasing energy efficiency and reducing latency. Low High Low
[17]
2022
Step Selective Power Routing Protocol Increase selection accuracy to reduce energy consumption and improve the delivery ratio. Low Low Justly
[18]
2022
Combining Bayesian multidimensional scaling localisation Increasing the accuracy of hybrid communication in underwater Internet of Things. High Low Justly
[19]
2022
k-means algorithm Optimal cluster head selection based on the distance to the base station High Low Justly
Table 2. Table Type Styles.
No Rules
1   E n e r g y S 1 × D i s t a n c e S 1 × D e p t h S 1 × N N S 1
2   E n e r g y S 1 × D i s t a n c e S 1 × D e p t h S 1 × N N S 2
3   E n e r g y S 1 × D i s t a n c e S 1 × D e p t h S 2 × N N S 1
4   E n e r g y S 1 × D i s t a n c e S 1 × D e p t h S 2 × N N S 2
5   E n e r g y S 1 × D i s t a n c e S 2 × D e p t h S 1 × N N S 1
6   E n e r g y S 1 × D i s t a n c e S 2 × D e p t h S 1 × N N S 2
7   E n e r g y S 1 × D i s t a n c e S 2 × D e p t h S 2 × N N S 1
8   E n e r g y S 1 × D i s t a n c e S 2 × D e p t h S 2 × N N S 2
9   E n e r g y S 2 × D i s t a n c e S 1 × D e p t h S 1 × N N S 1
10   E n e r g y S 2 × D i s t a n c e S 1 × D e p t h S 1 × N N S 2
11   D E n e r g y S 2 × D i s t a n c e S 1 × D e p t h S 2 × N N S 1
12   E n e r g y S 2 × D i s t a n c e S 1 × D e p t h S 2 × N N S 2
14   E n e r g y S 2 × D i s t a n c e S 2 × D e p t h S 1 × N N S 1
15   E n e r g y S 2 × D i s t a n c e S 2 × D e p t h S 1 × N N S 2
16   D e p t h S 2 × D i s t a n c e S 2 × D e p t h S 2 × N N S 1
Table 3. Table Type Styles.
Node ID Remaining Energy(J) Distance to sink(m) Depth (m) Number of Neighbors(n)   F F ( n )
17 26.6 67 32 5 0.32
6 36.9 76 43 4 0.28
22 28.5 53.3 51 3 0.39
73 41.6 48.6 27 4 0.48
99 32.7 66.09 40 3 0.31
18 37.8 80.01 39 6 0.44
4 22.9 49 50 4 0.37
Table 4.
Parameters Value (s)
Network topology Random position
Deployment area 1000  ×  1000  ×  500 m3
Initial node energy 50 J
Initial sink energy 50 kJ
Number of nodes 100, 150, 200
Communication range 150 m
Acoustic transmission range(sink) 200 m
Channel Underwater channel
Sink position Surface (500  ×  500  ×  0)
Iterations 10
Packet size 50 bytes
DIO/ DAO/ DAO-Ack / DIS pkt size 4 bytes
Packet generation rate λ = 0.1 ~ 0.2  pkt/s
Simulation time 1000 s
Antenna Omni-directional
Table 5. The time of death for the first node in the network in parallel protocols with 100, 150 and 200 nodes.
Network Size [16] [17] [19] FuzzyCR
100 407 419 438 492
150 306 343 334 489
200 268 266 286 477
Table 6. the time of death for the first node in the proposed FuzzyCR at different traffic rates.
Network
Size in FuzzyCR
Packet inter-arrival time
  λ = 0.6  s   λ = 0.8  s λ = 1  s
100 437 456 493
150 393 421 489
200 311 386 477
Table 8. The node’s energy consumption fairness indicator for FuzzyRC at variable traffic rates.
Network
Size in FuzzyCR
Packet inter-arrival time
  λ = 0.6  s   λ = 0.8  s   λ = 1  s
100 83.12 88.19 91.56
150 79.78 82.45 89.32
200 73.25 77.11 86.14
Disclaimer/Publisher’s Note: The statements, opinions and data contained in all publications are solely those of the individual author(s) and contributor(s) and not of MDPI and/or the editor(s). MDPI and/or the editor(s) disclaim responsibility for any injury to people or property resulting from any ideas, methods, instructions or products referred to in the content.
Copyright: This open access article is published under a Creative Commons CC BY 4.0 license, which permit the free download, distribution, and reuse, provided that the author and preprint are cited in any reuse.
Prerpints.org logo

Preprints.org is a free preprint server supported by MDPI in Basel, Switzerland.

Subscribe

© 2024 MDPI (Basel, Switzerland) unless otherwise stated