Submitted:
15 December 2023
Posted:
18 December 2023
You are already at the latest version
Abstract
Keywords:
1. Introduction
2. Materials and Methods
2.1. Preparation of synthetic beta-amyloid peptides
2.2. Cell Culture
2.3. In vitro model of the BBB
2.3.1. Cell cultivation on transwell membrane
2.3.2. Measuring the passage of Aβ isoforms through a monolayer of bEnd.3 cells
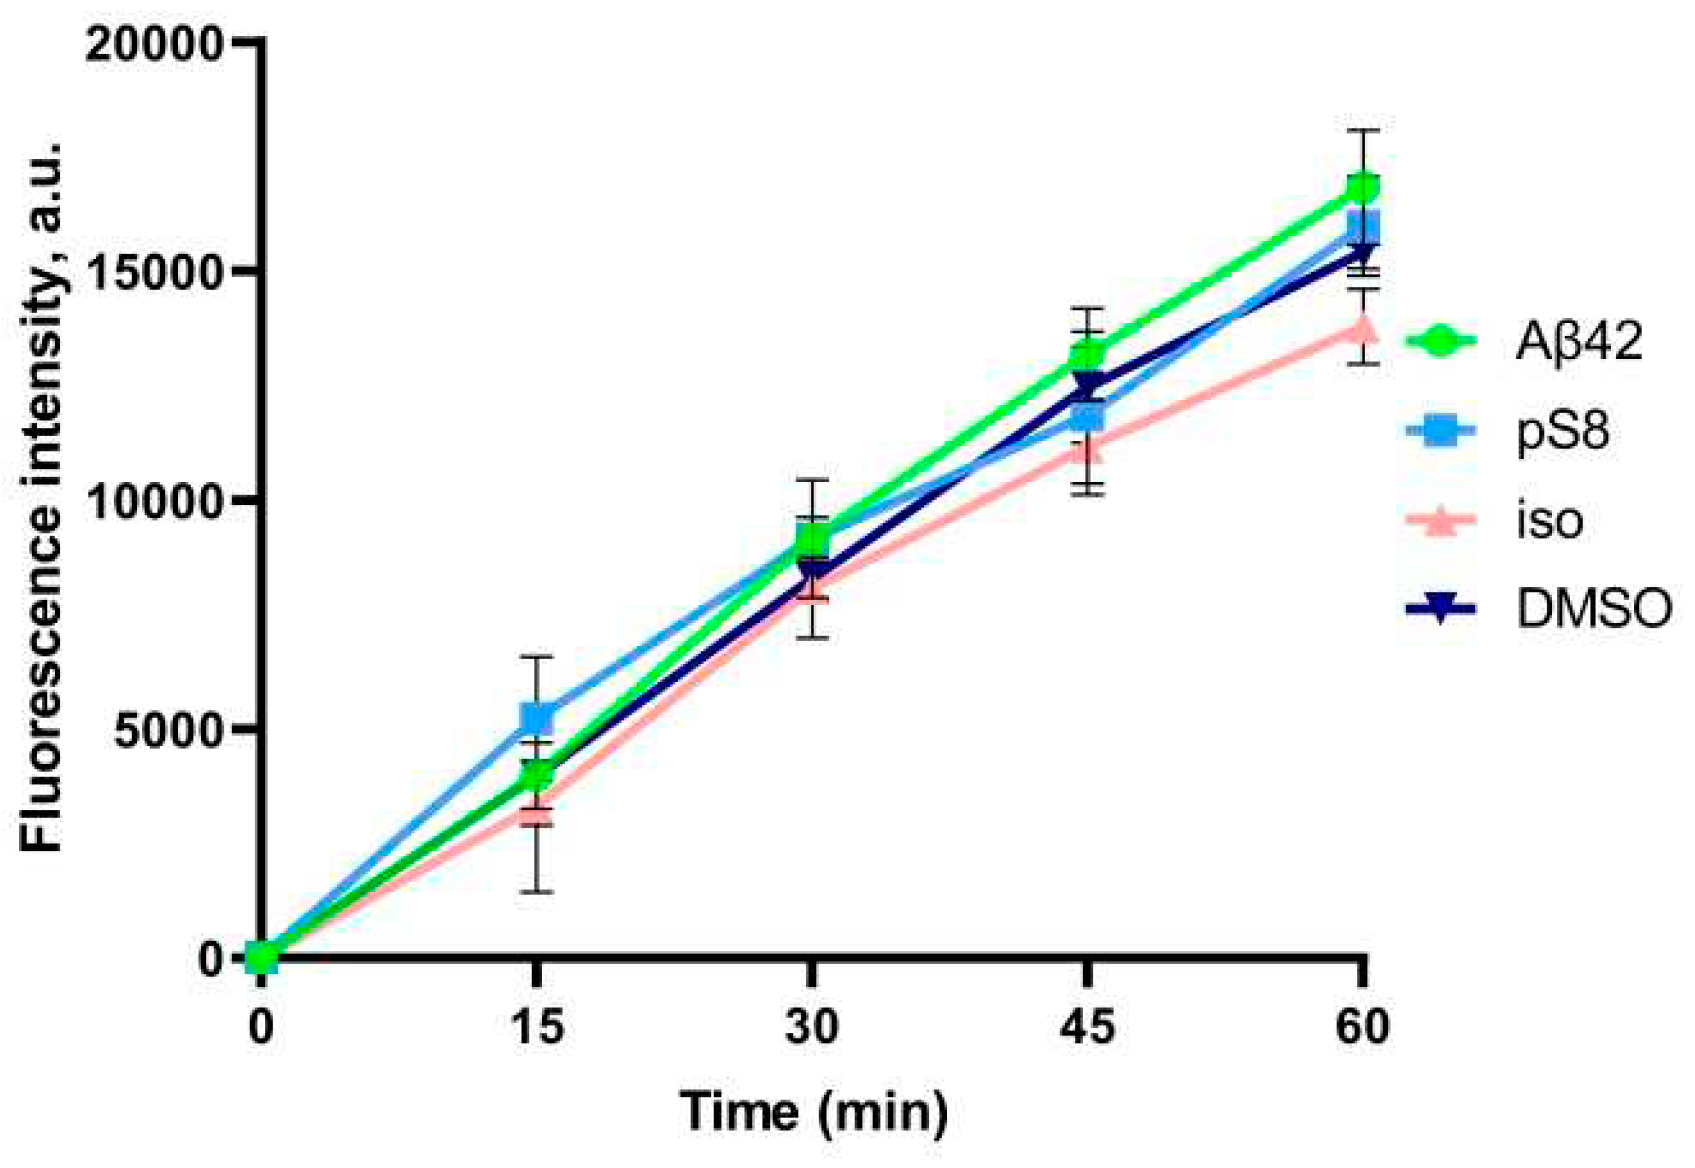
2.3.3. Endothelial permeability measurement
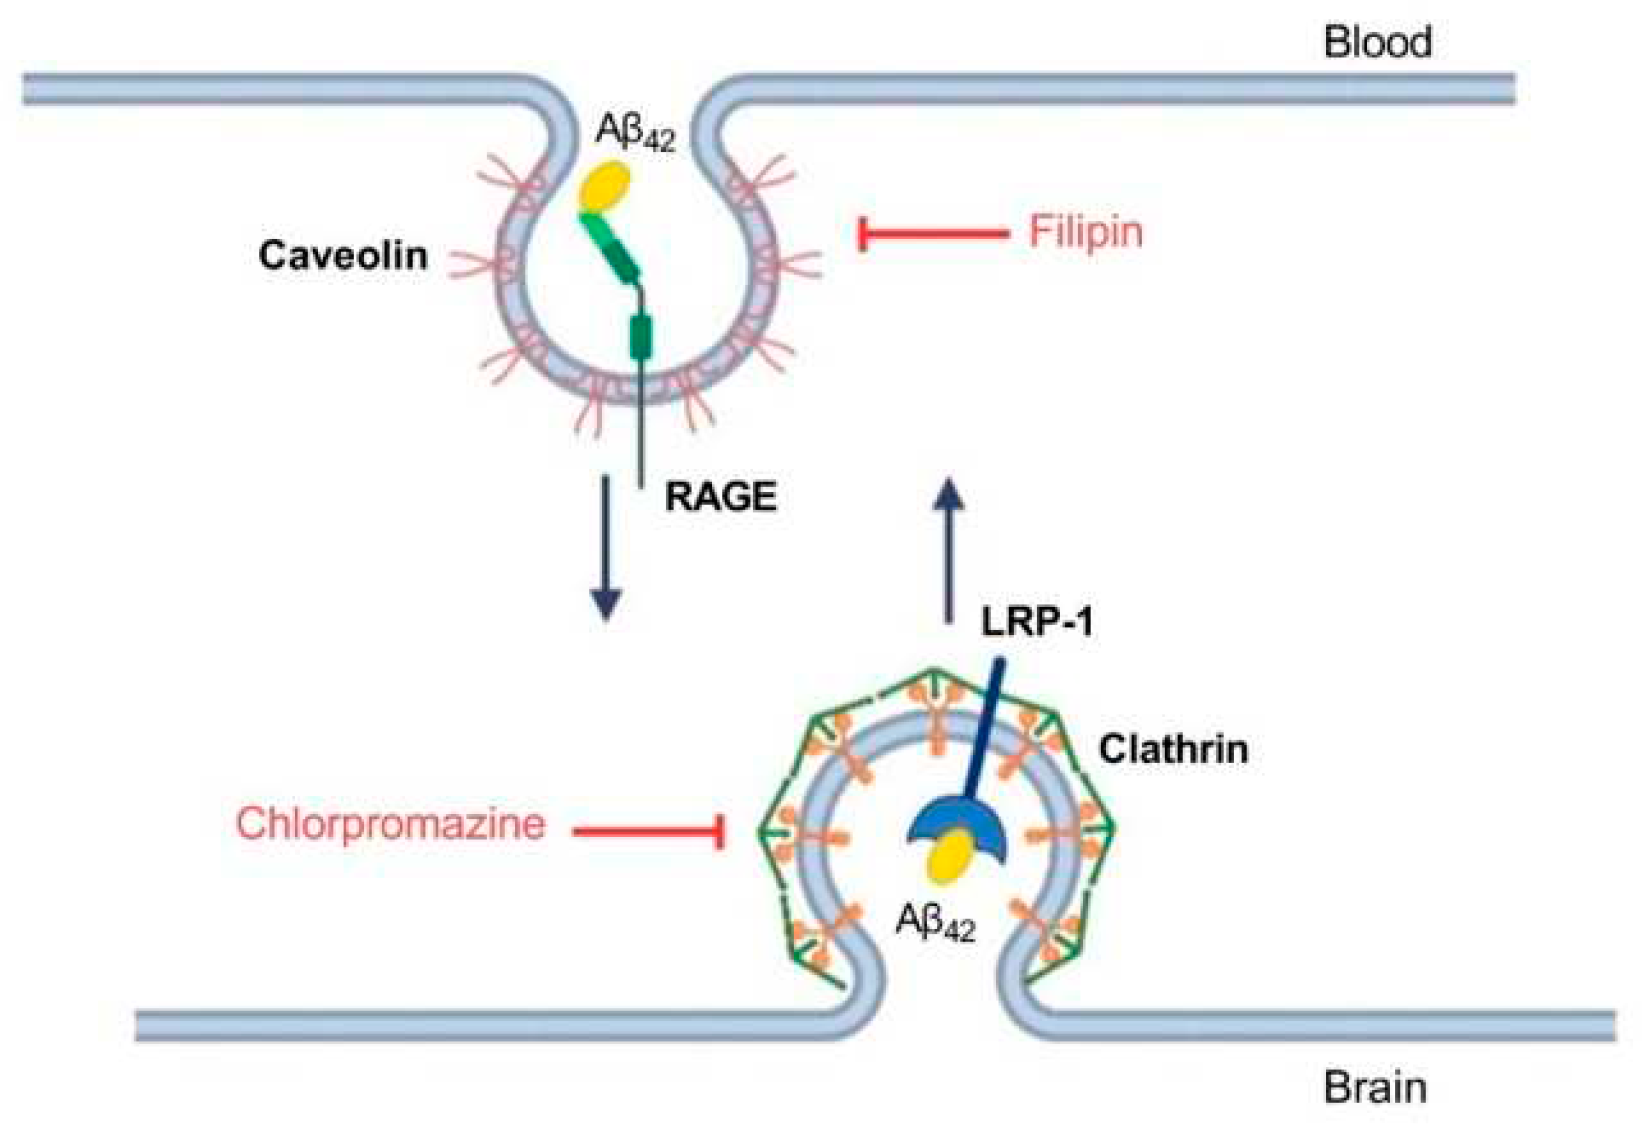
2.3.4. Study of the transport mechanisms of beta-amyloid and its isoforms
2.4. ELISA
2.5. Determination of parameters of interaction of Aβ and its isoforms with RAGE
2.6. Measurement of intracellular concentrations of Aβ and its isoforms
2.7. Statistical data processing
3. Results
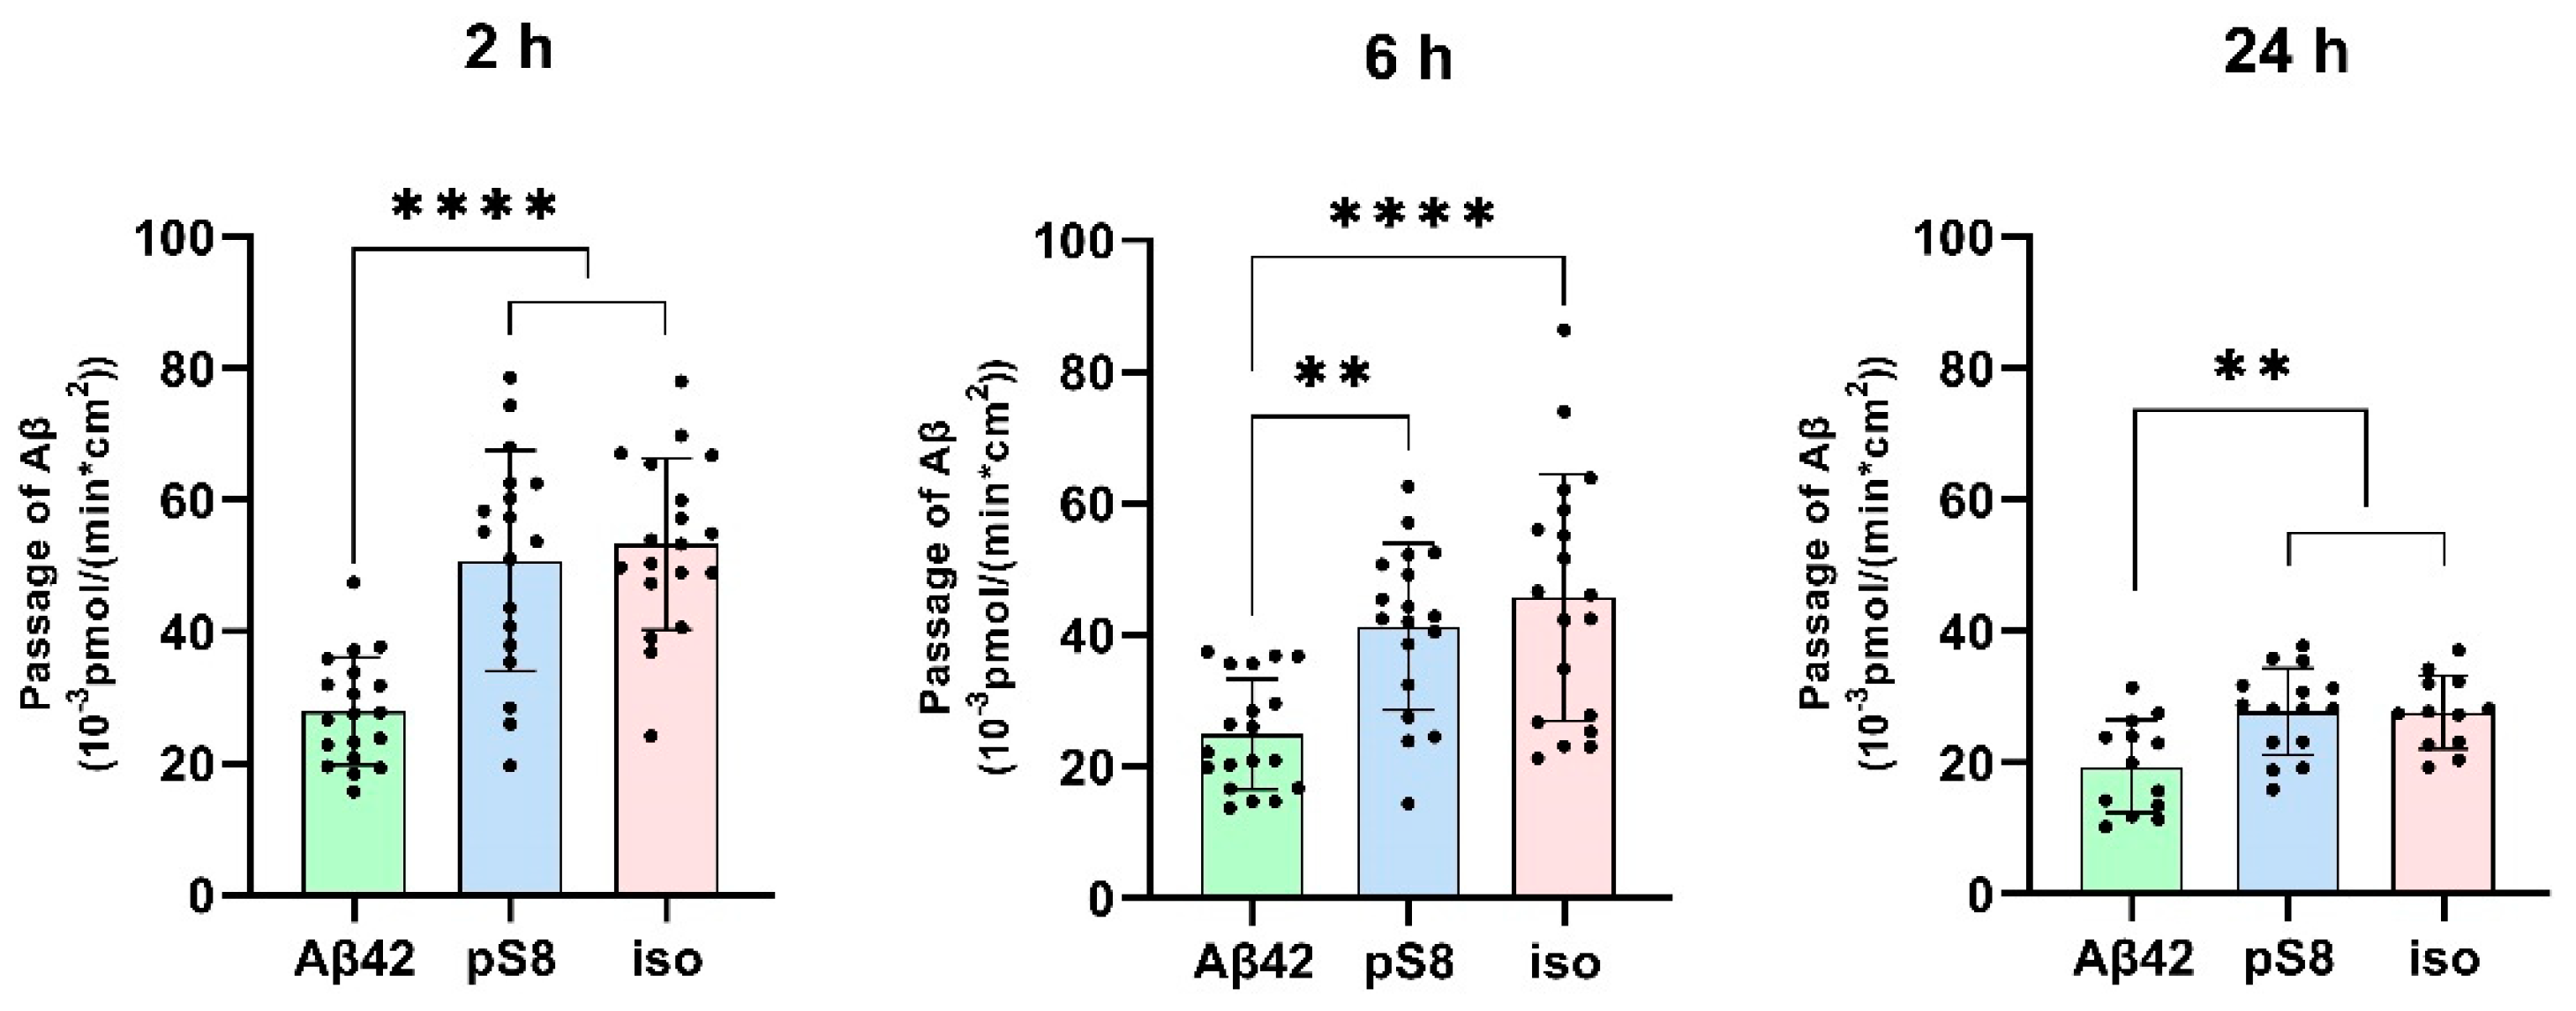
3.1. Isomerized and phosphorylated Aβ pass through the BBB model more efficiently than unmodified Aβ.
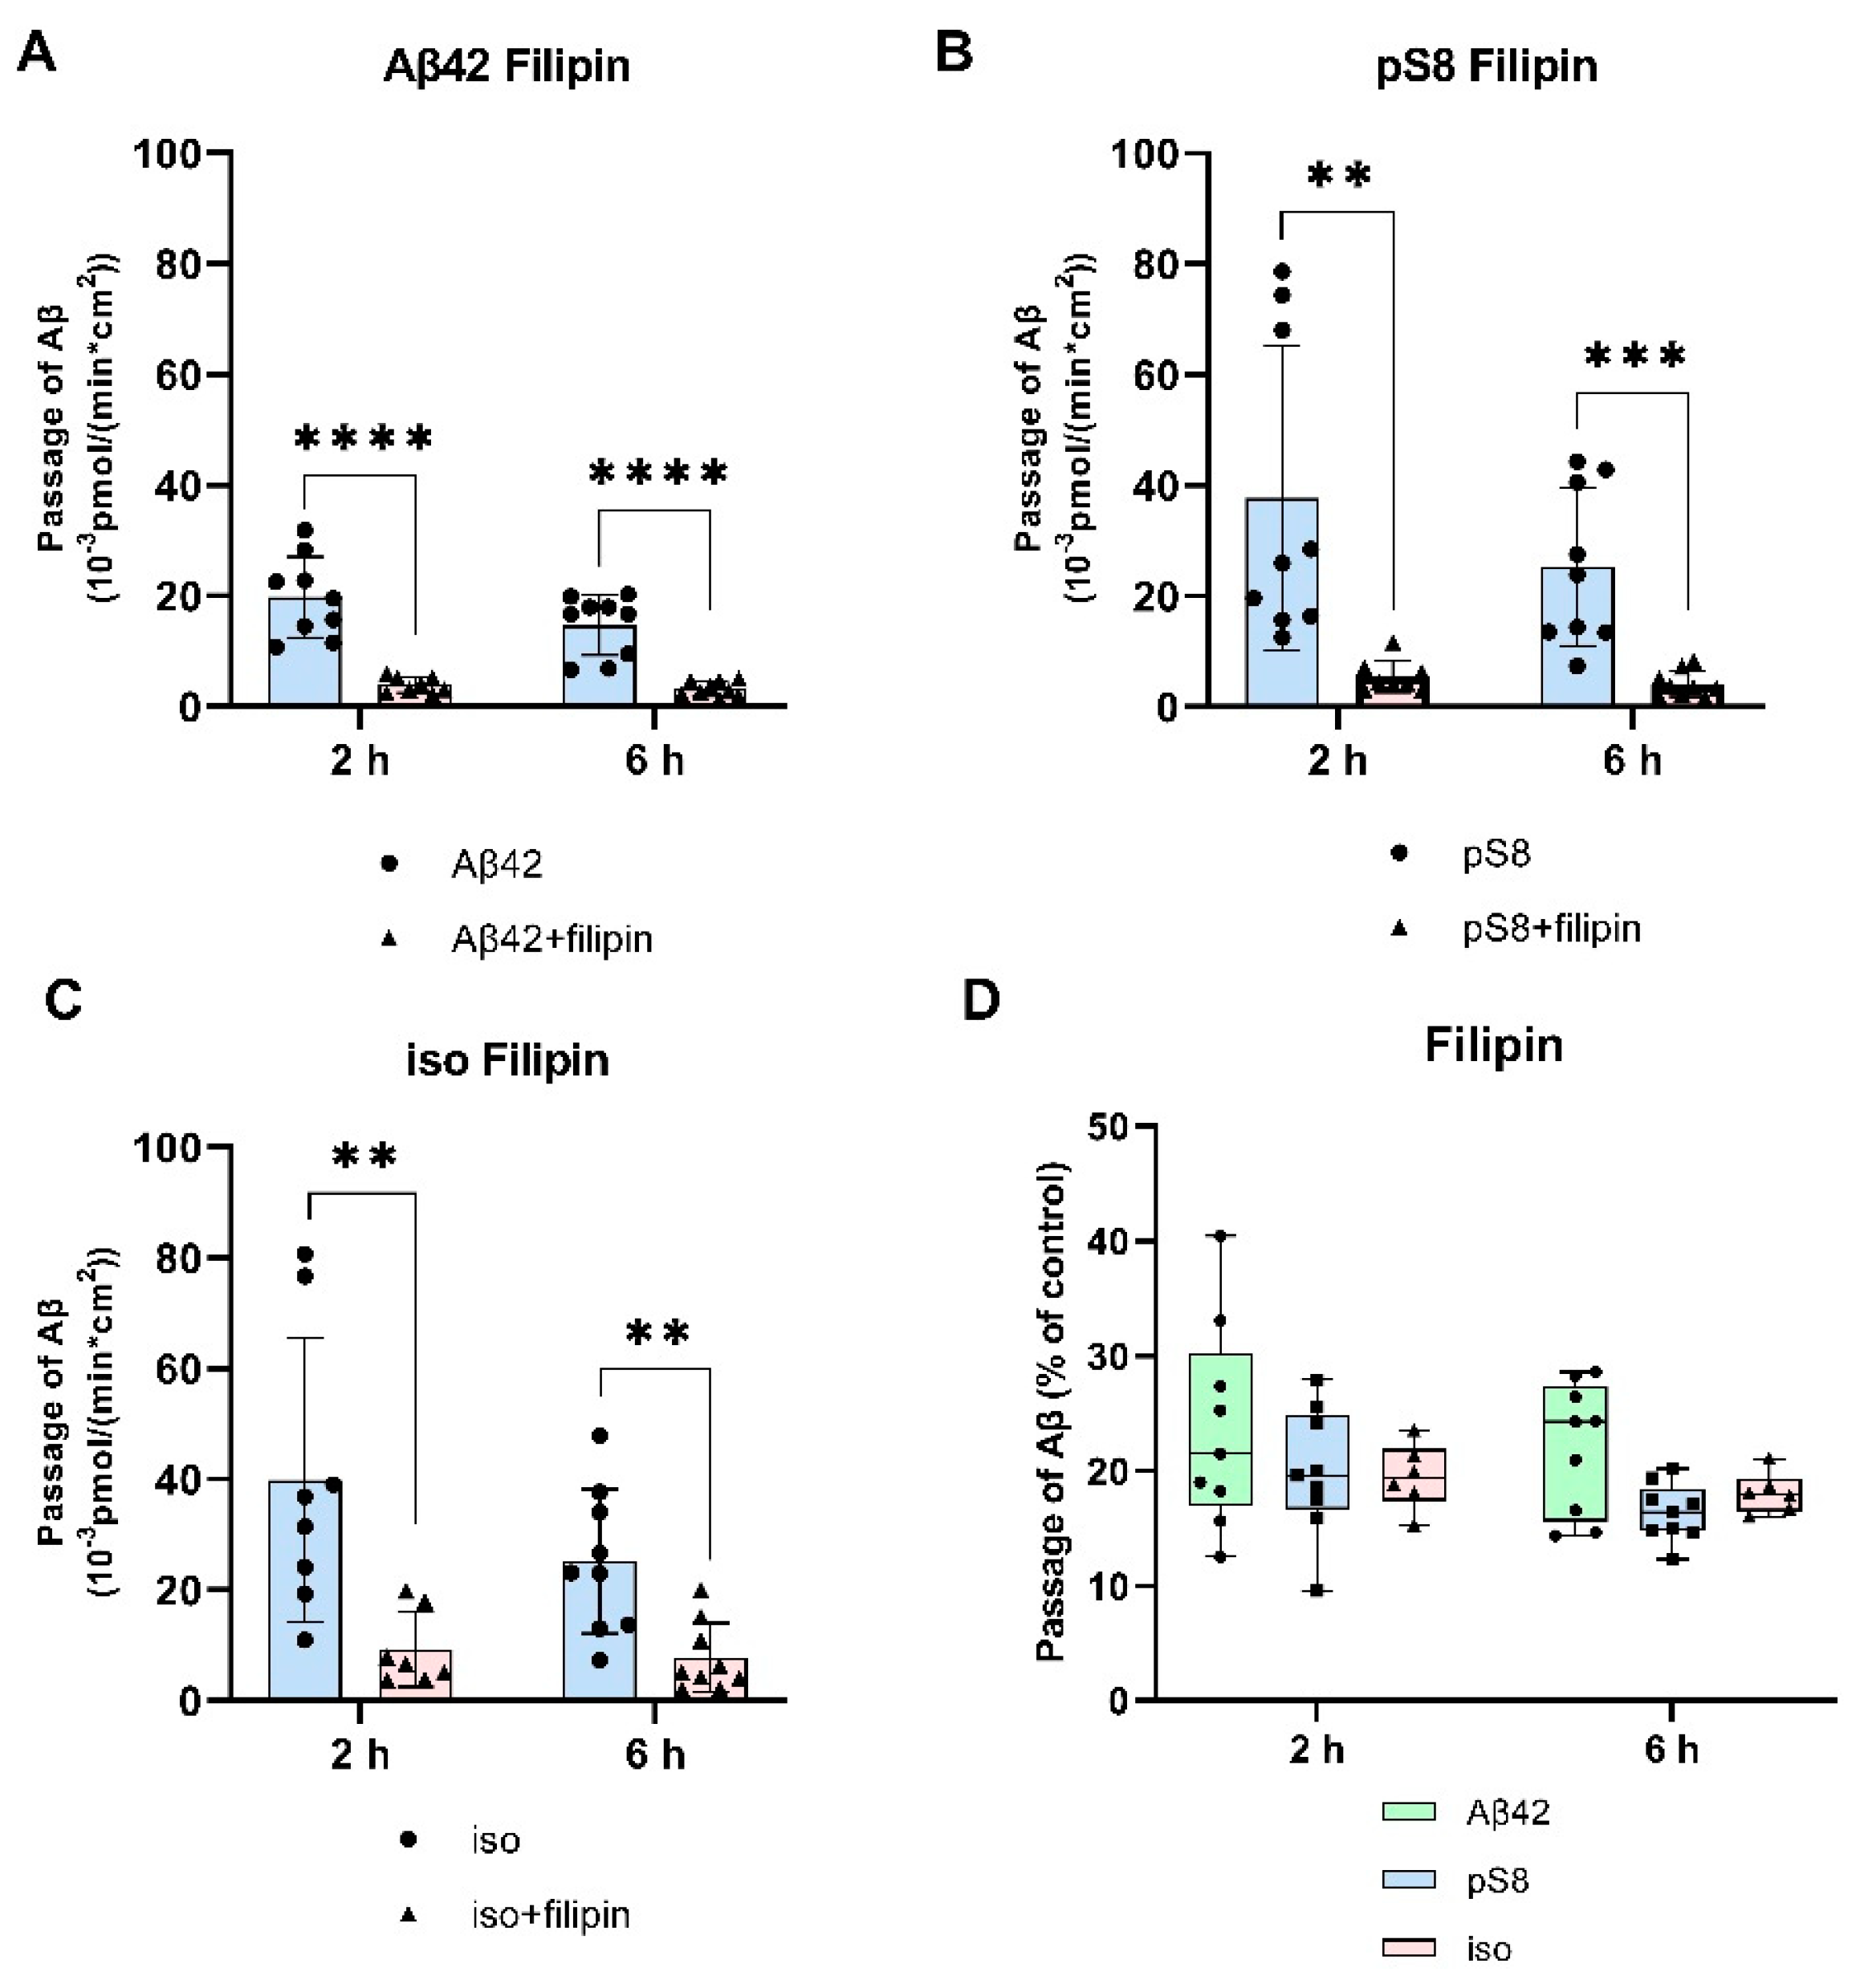
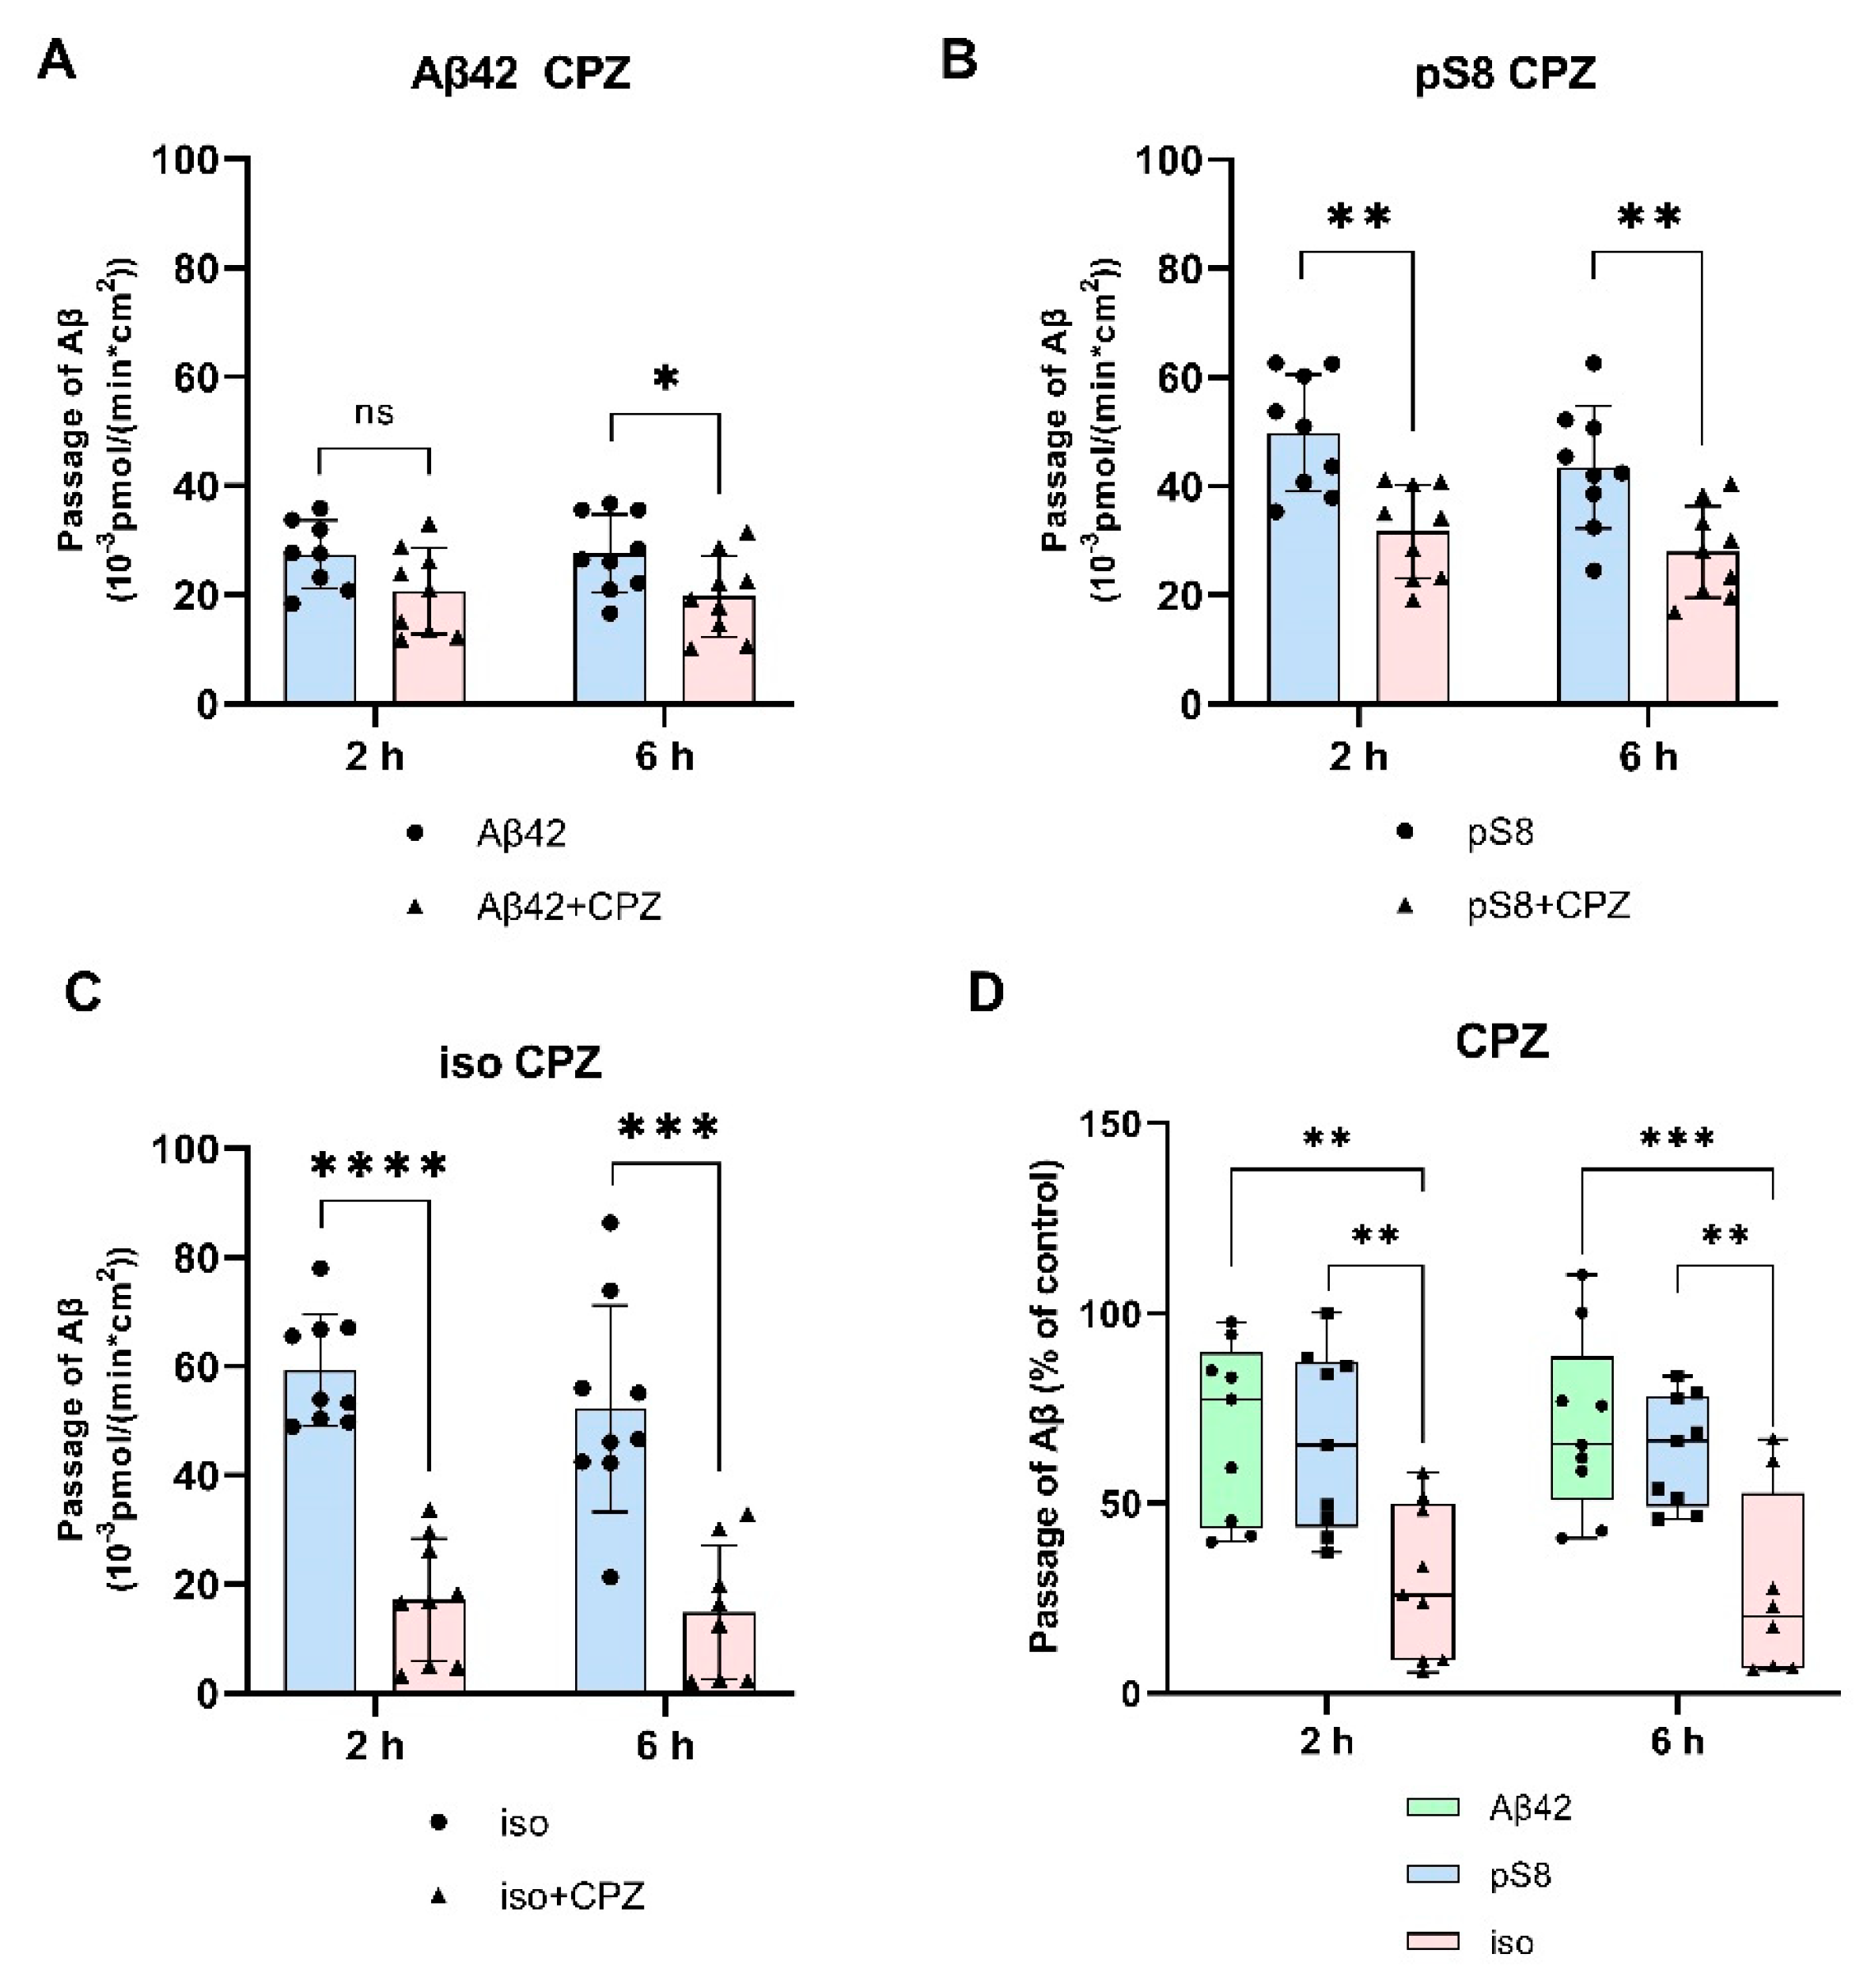
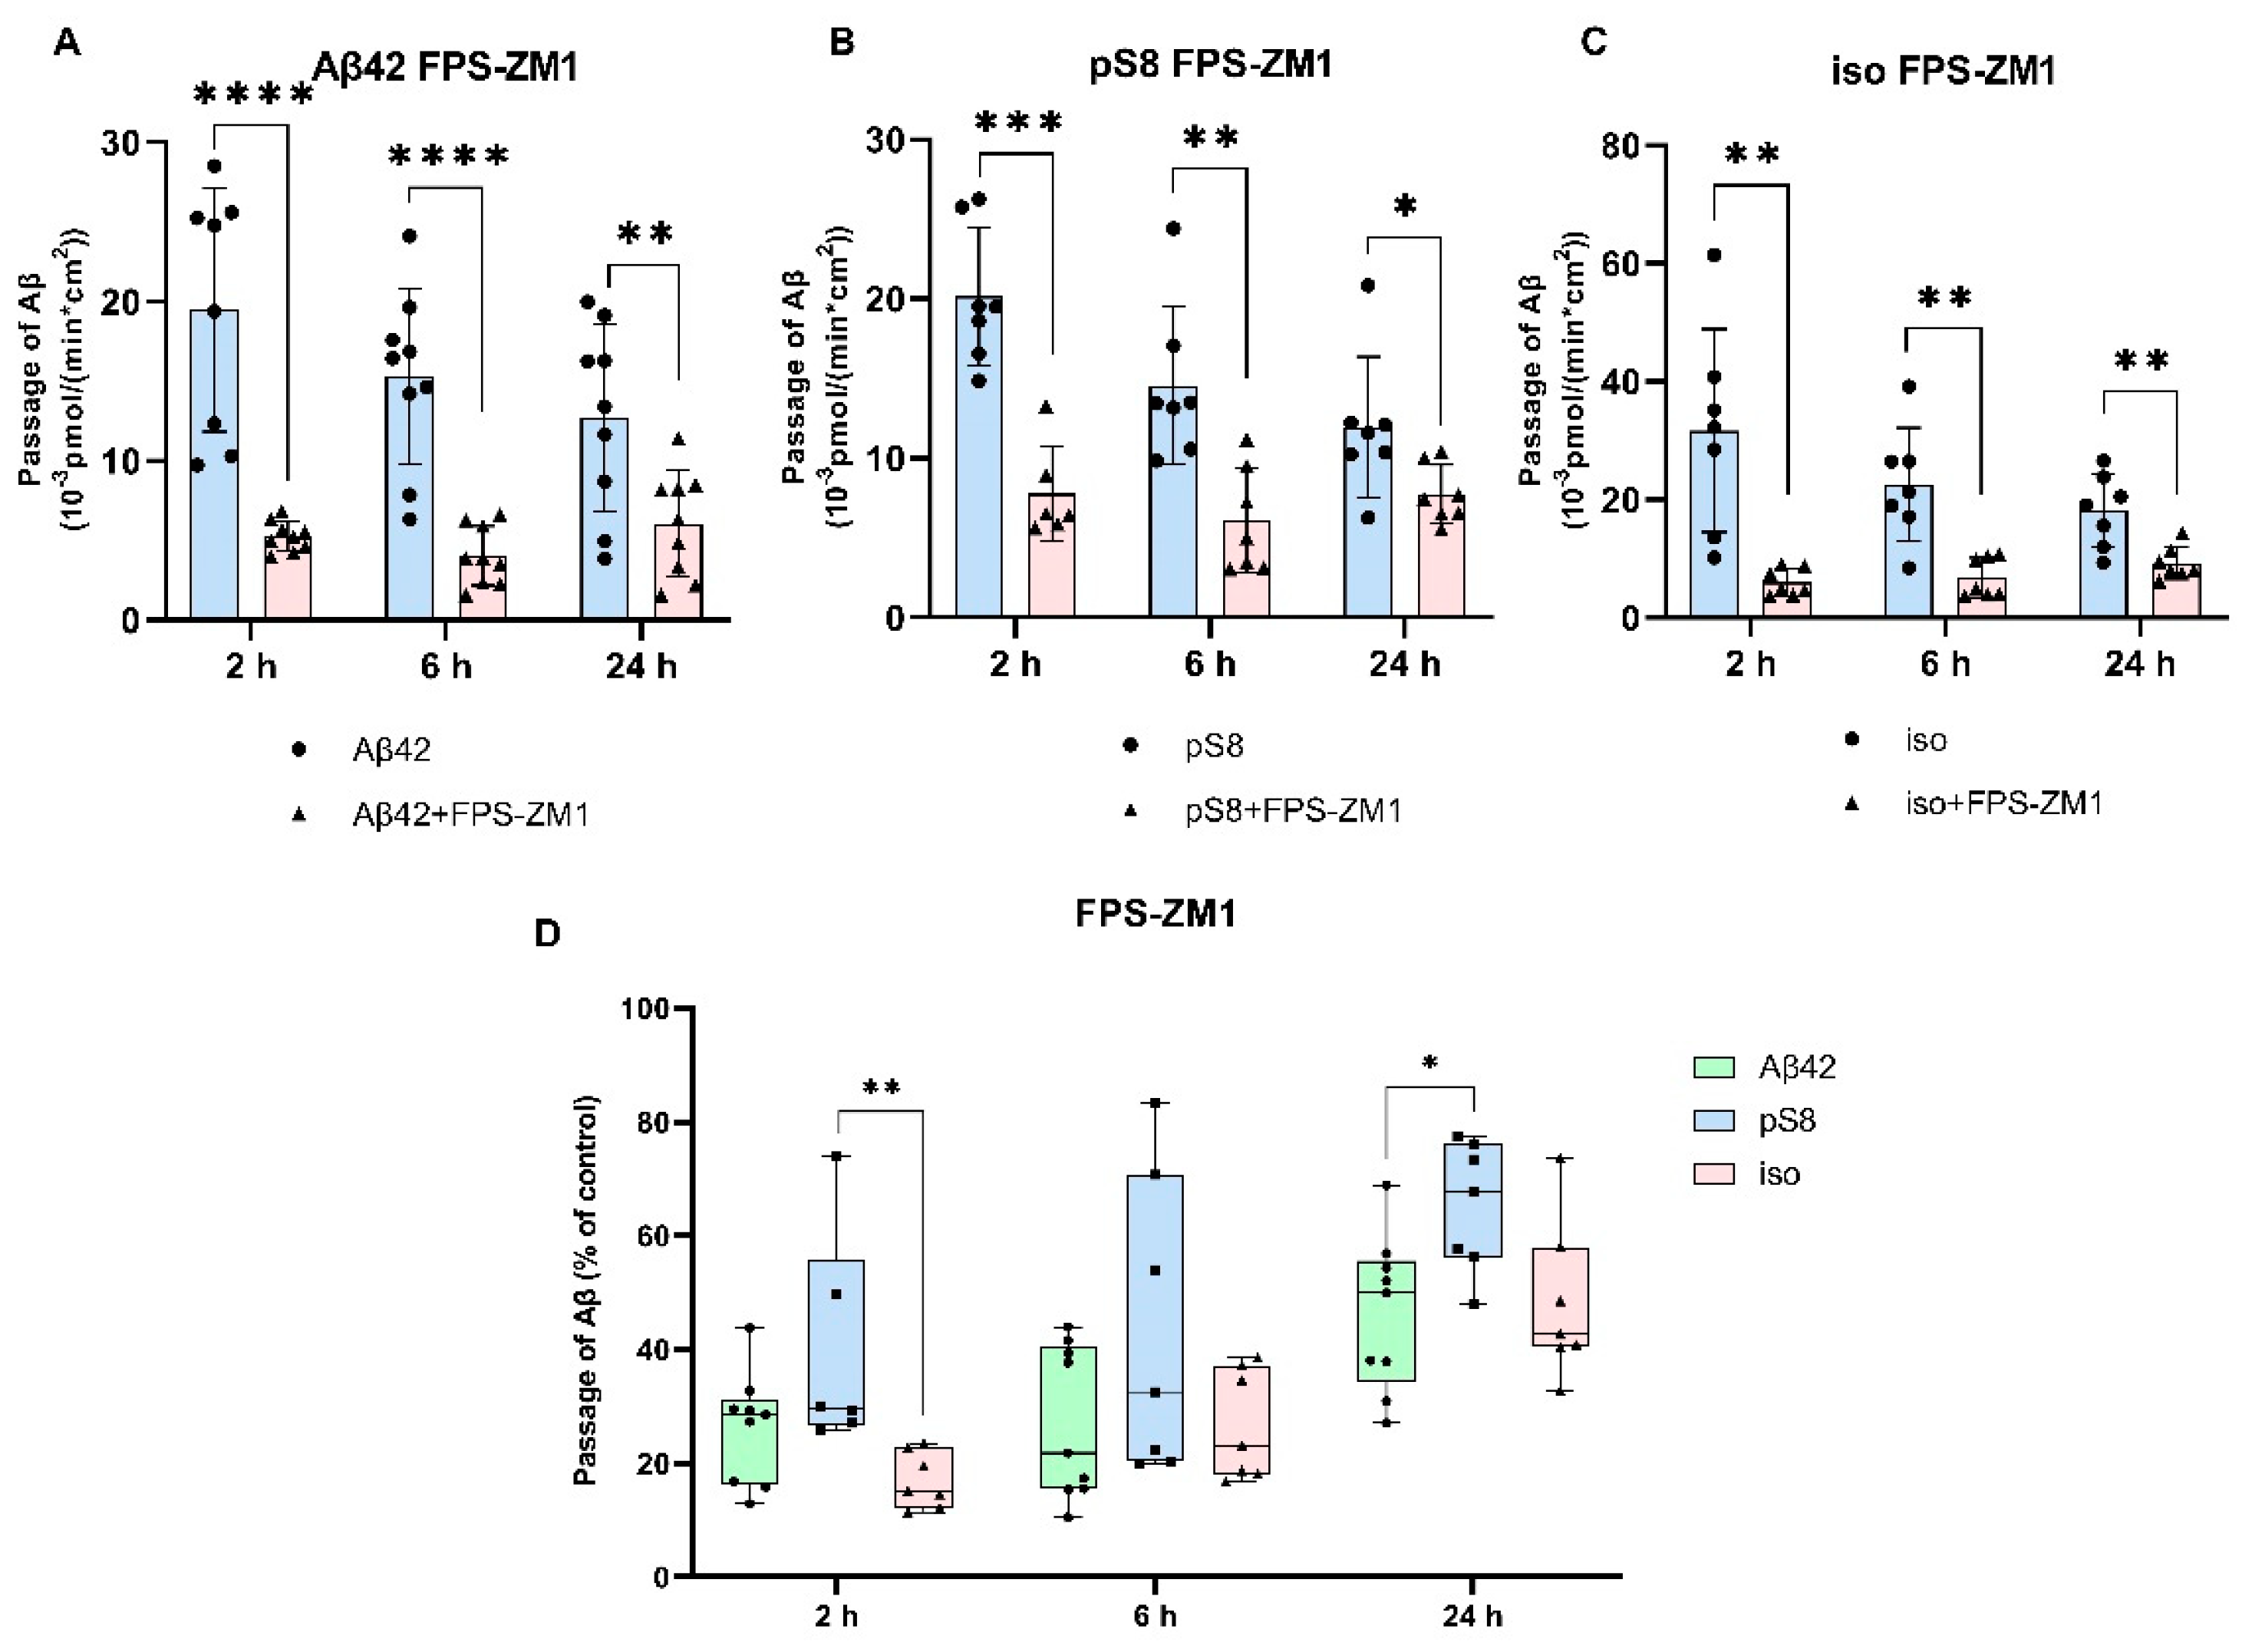
3.2. The mechanism of transport of Aβ42, pS8-Aβ42 and iso-Aβ42 across the BBB is different.
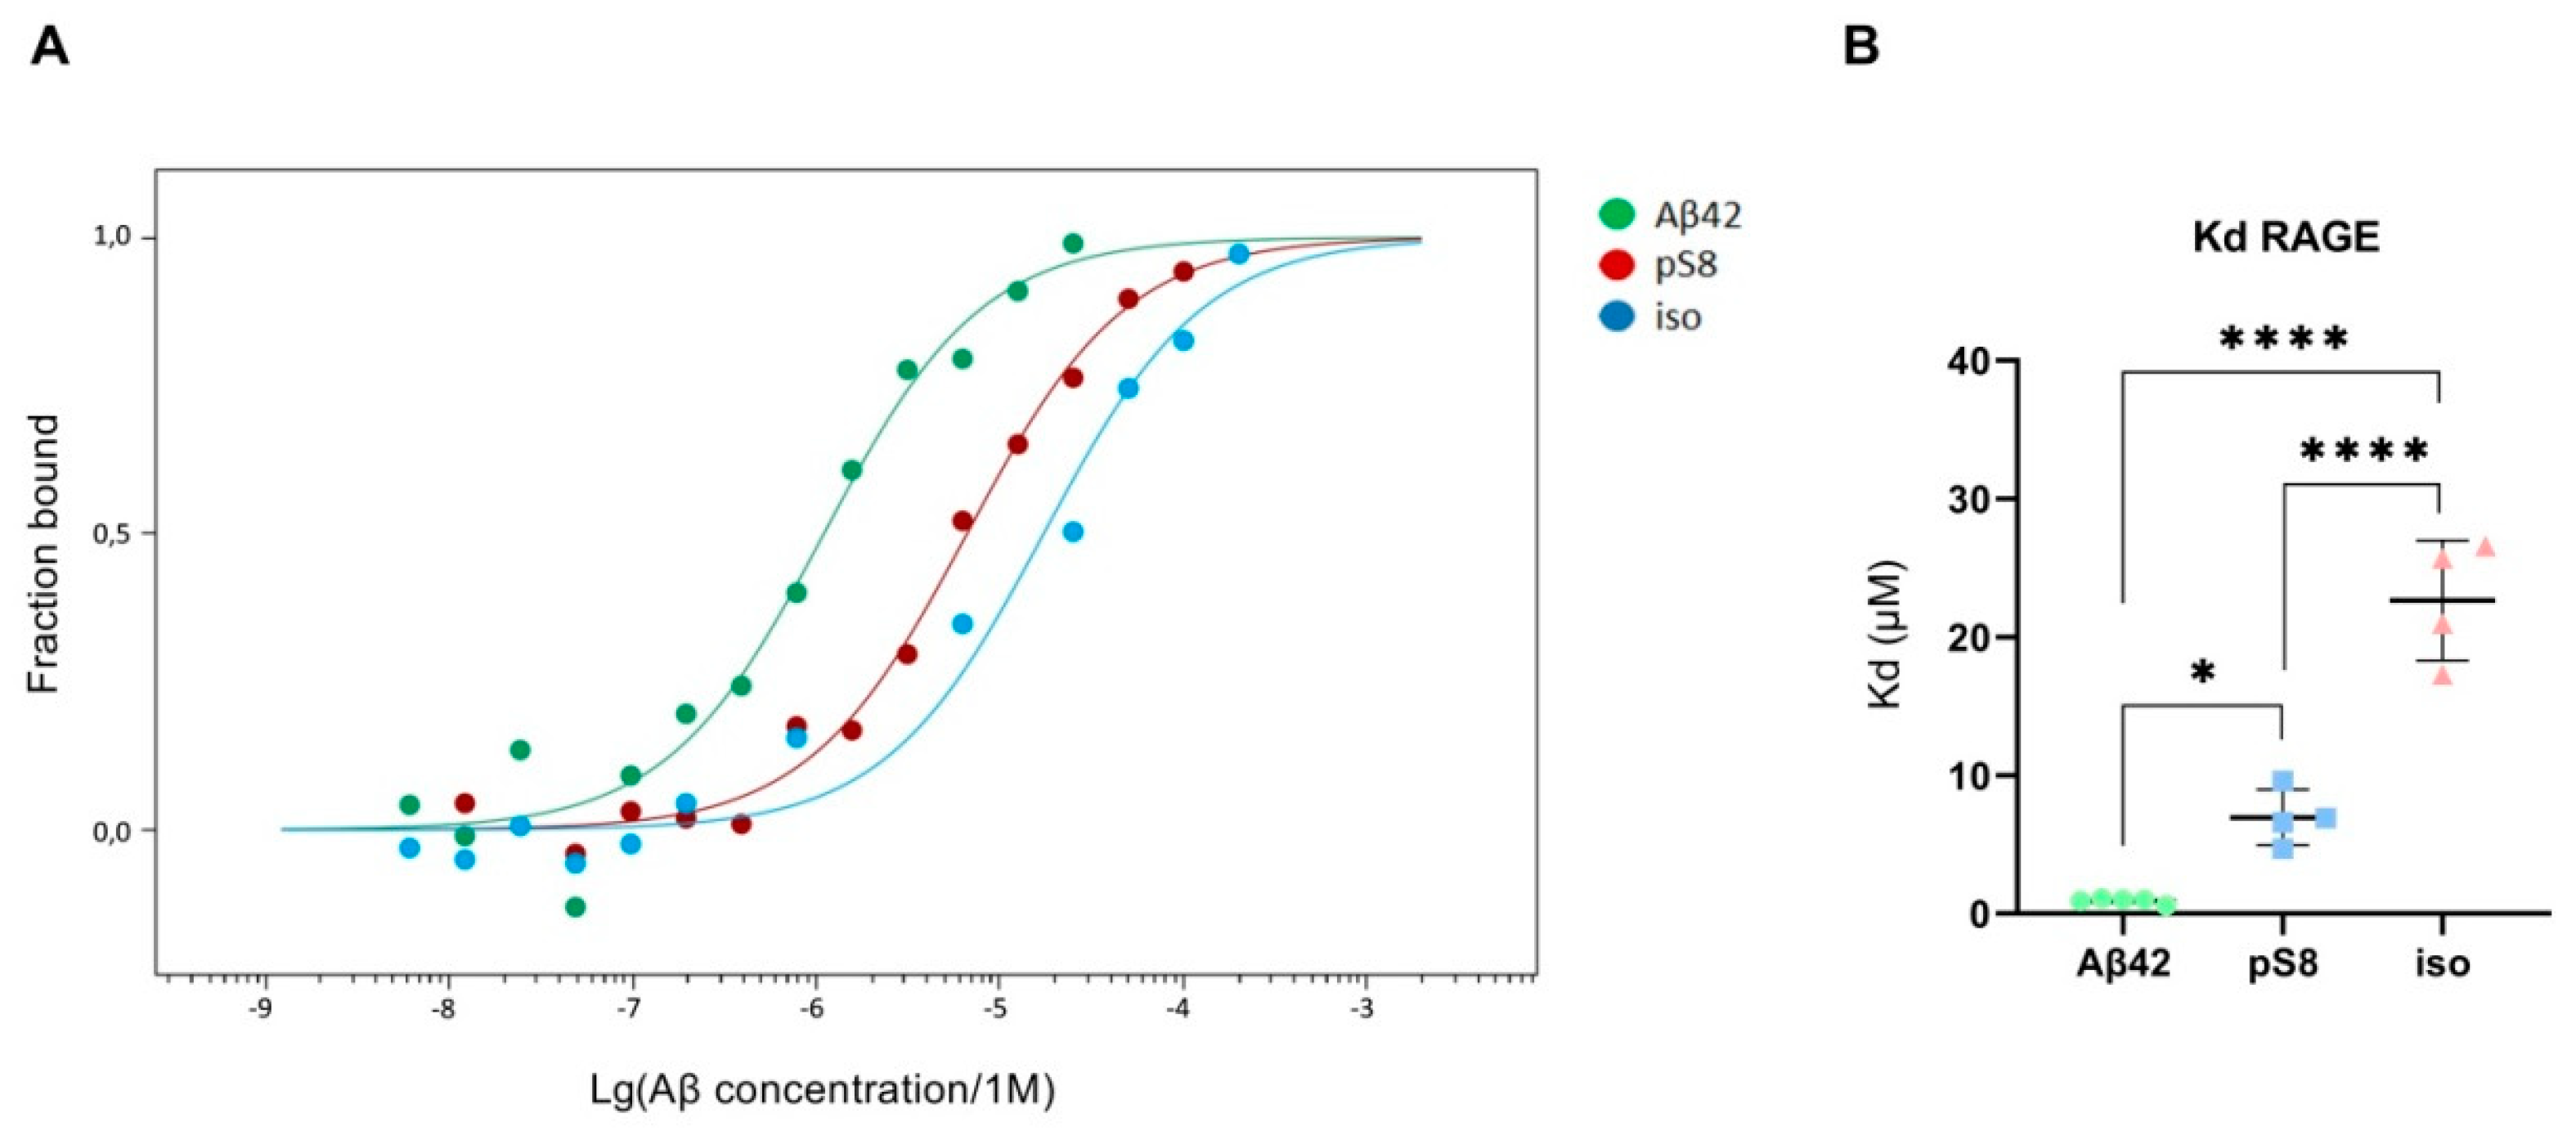
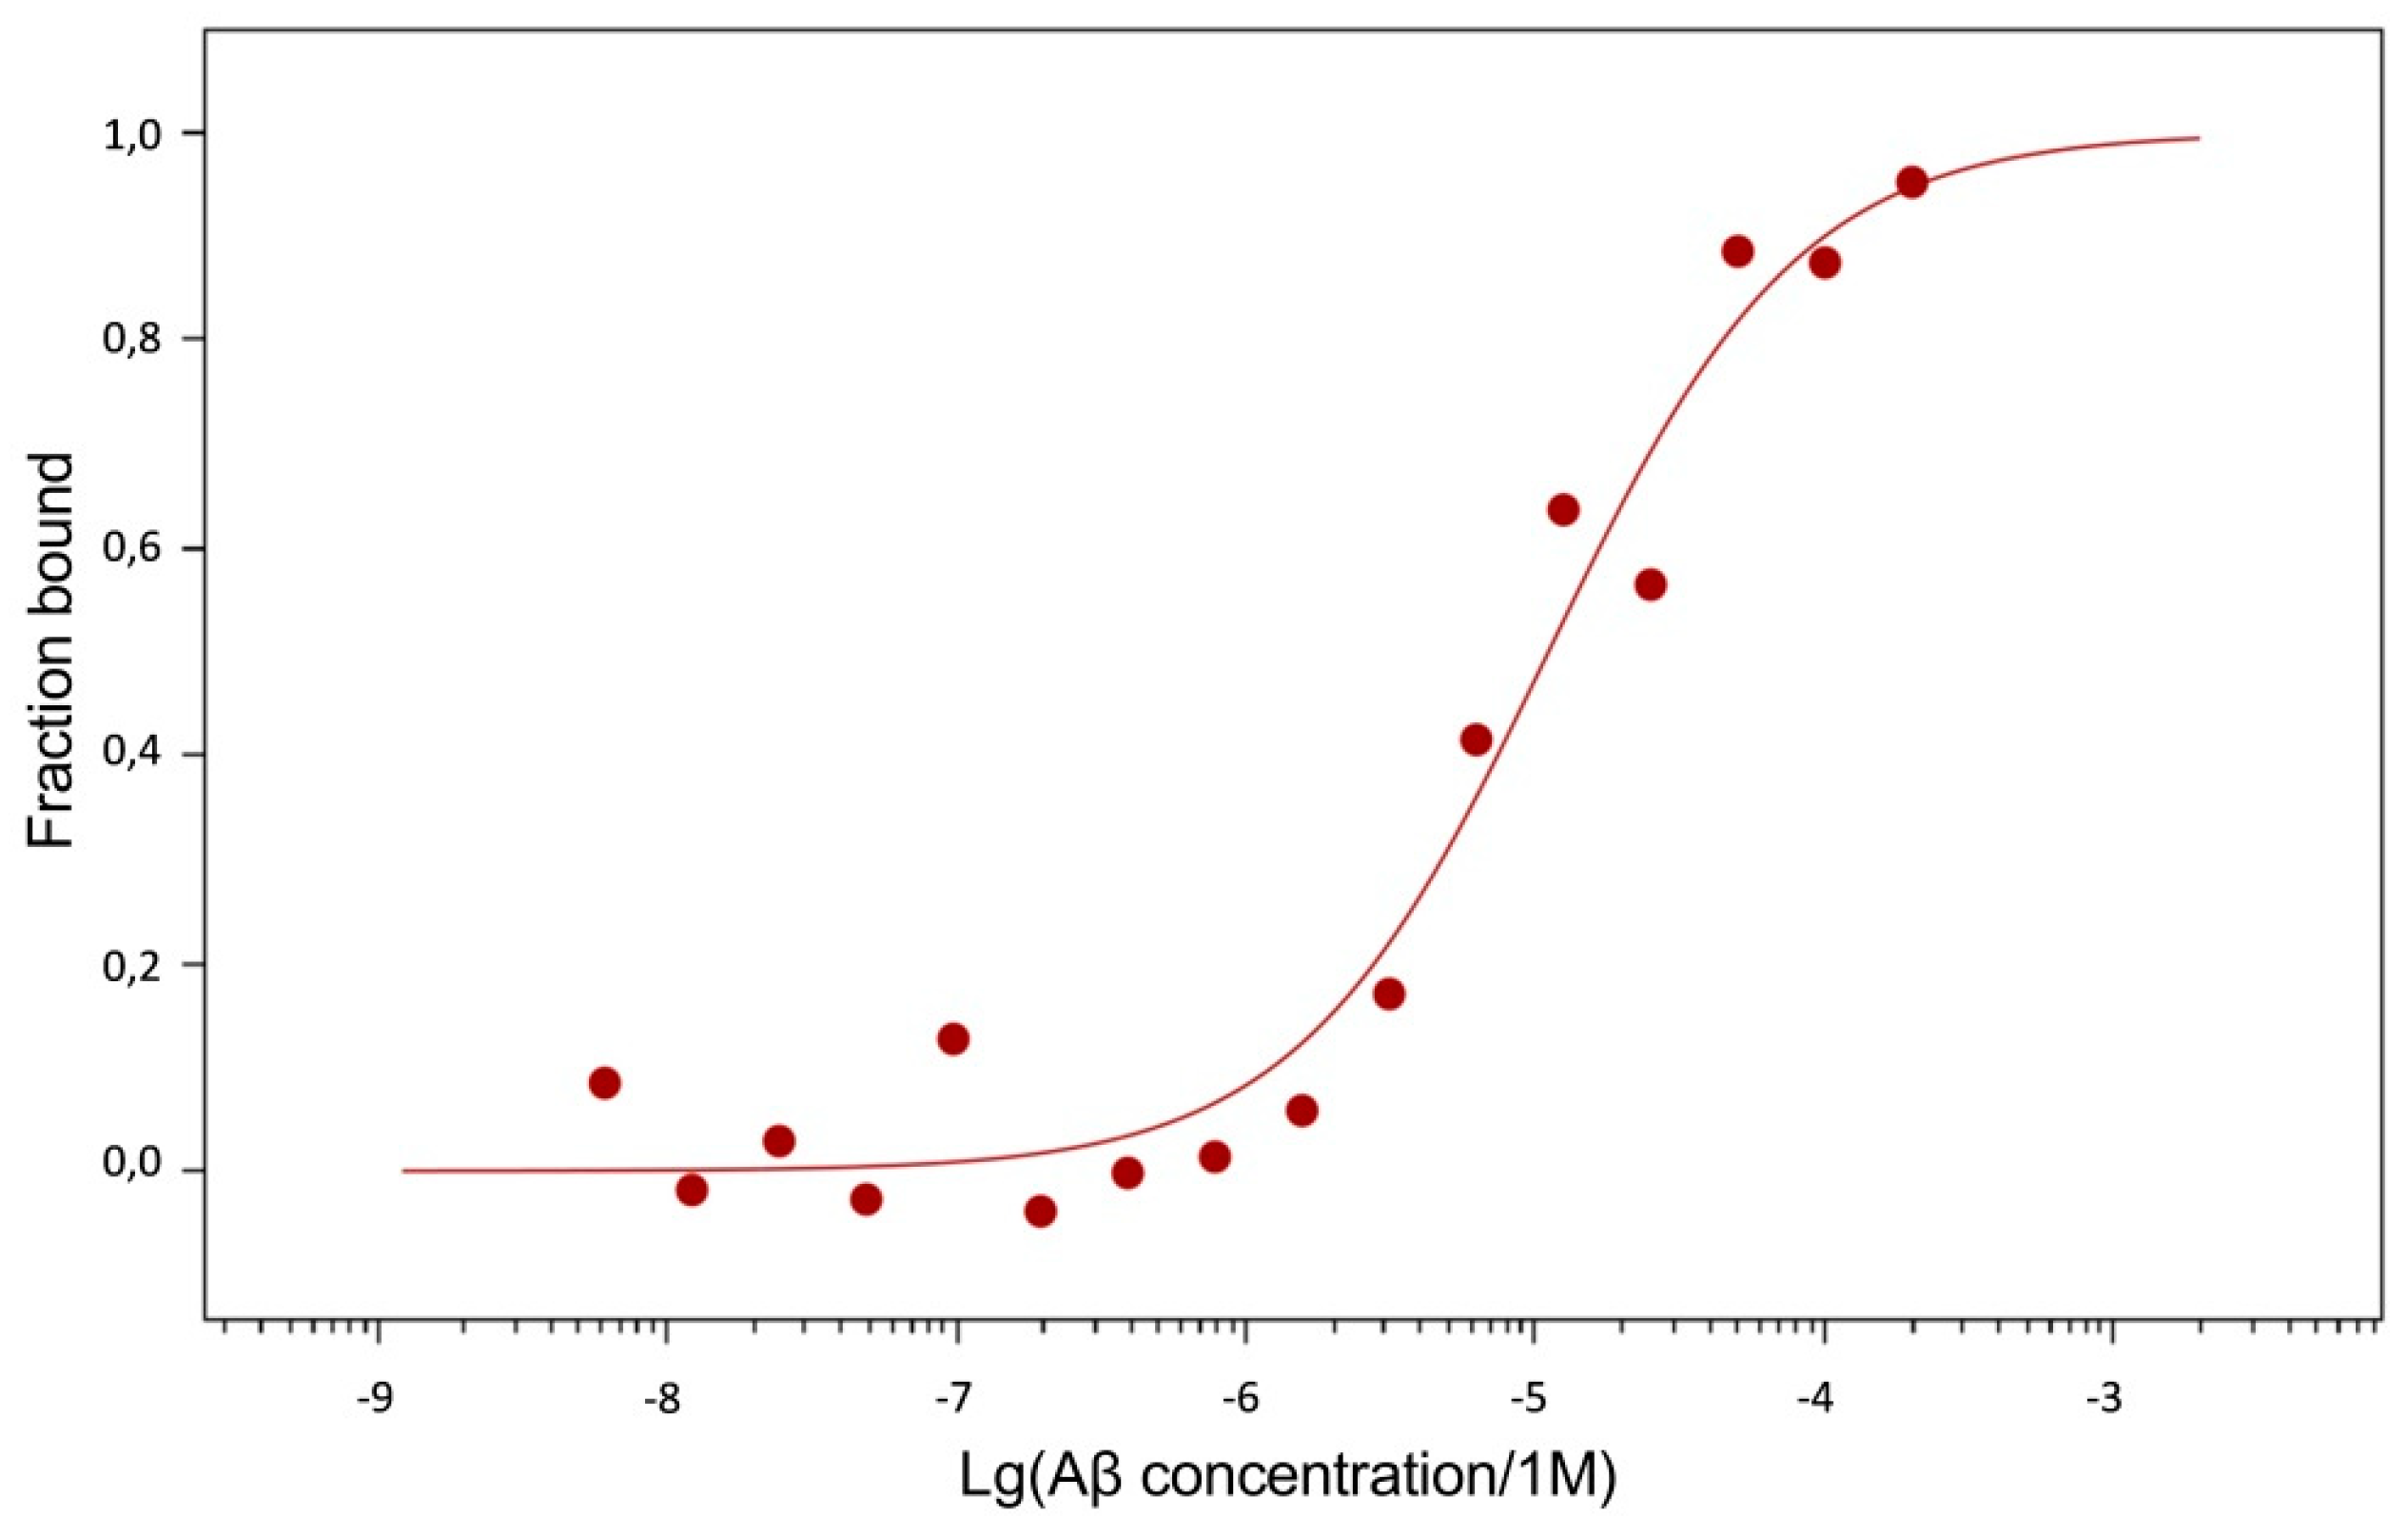
3.3. Aβ modifications affect the interaction with RAGE.
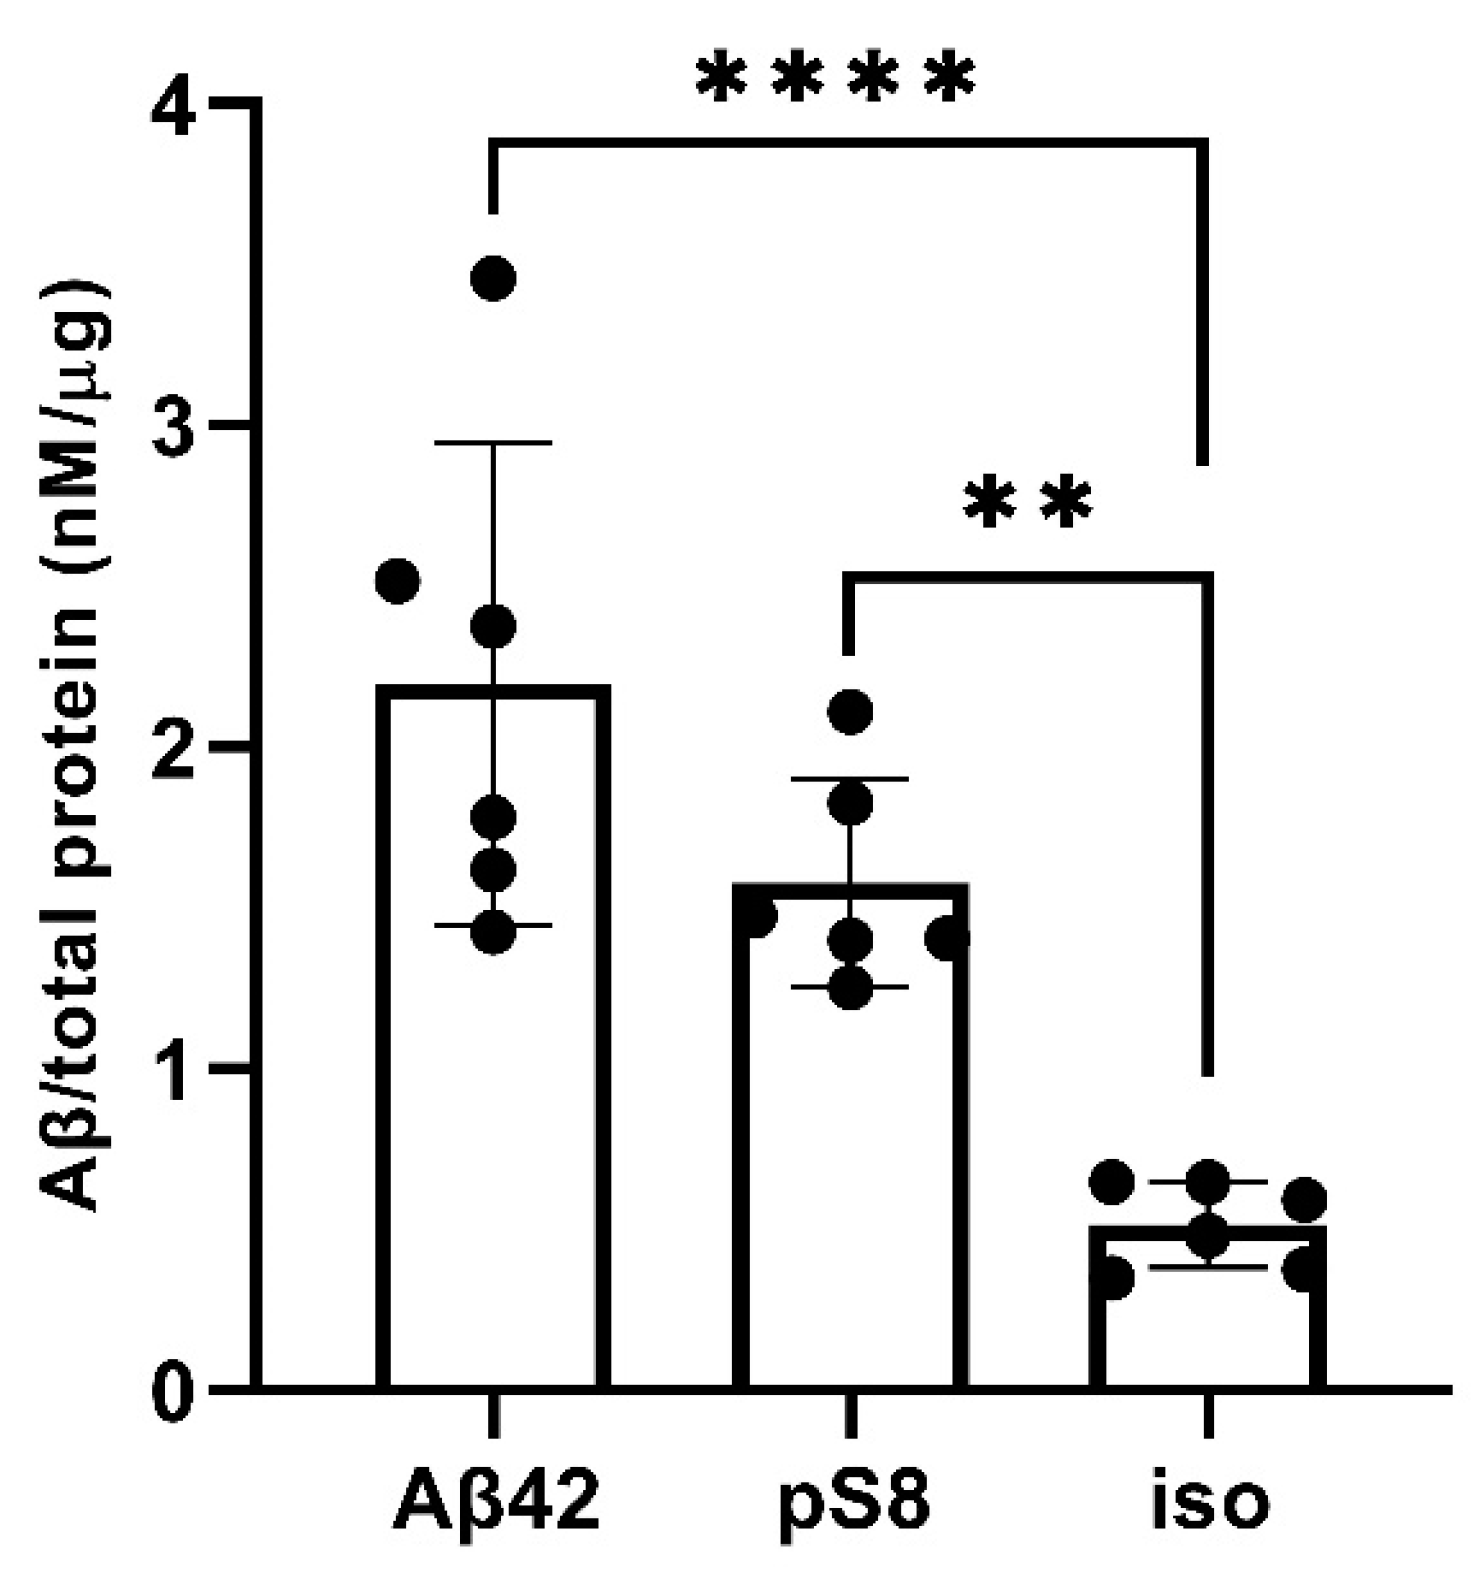
3.4. Aβ42, pS8-Aβ42 and iso-Aβ42 accumulate differently in bEnd.3 cells
4. Discussion
5. Conclusions
Supplementary Materials
Author Contributions
Funding
Institutional Review Board Statement
Data Availability Statement
Conflicts of Interest
References
- Sonkusare, S.K.; Kaul, C.L.; Ramarao, P. Dementia of Alzheimer’s Disease and Other Neurodegenerative Disorders--Memantine, a New Hope. Pharmacol Res 2005, 51, 1–17. [Google Scholar] [CrossRef]
- Scheltens, P.; Blennow, K.; Breteler, M.M.B.; de Strooper, B.; Frisoni, G.B.; Salloway, S.; Van der Flier, W.M. Alzheimer’s Disease. The Lancet 2016, 388, 505–517. [Google Scholar] [CrossRef]
- Moro, M.L.; Phillips, A.S.; Gaimster, K.; Paul, C.; Mudher, A.; Nicoll, J.A.R.; Boche, D. Pyroglutamate and Isoaspartate Modified Amyloid-Beta in Ageing and Alzheimer’s Disease. Acta Neuropathologica Communications 2018, 6, 3. [Google Scholar] [CrossRef]
- Barykin, E.P.; Mitkevich, V.A.; Kozin, S.A.; Makarov, A.A. Amyloid β Modification: A Key to the Sporadic Alzheimer’s Disease? Front Genet 2017, 8, 58. [Google Scholar] [CrossRef]
- Barykin, E.P.; Petrushanko, I.Y.; Kozin, S.A.; Telegin, G.B.; Chernov, A.S.; Lopina, O.D.; Radko, S.P.; Mitkevich, V.A.; Makarov, A.A. Phosphorylation of the Amyloid-Beta Peptide Inhibits Zinc-Dependent Aggregation, Prevents Na,K-ATPase Inhibition, and Reduces Cerebral Plaque Deposition. Front Mol Neurosci 2018, 11, 302. [Google Scholar] [CrossRef]
- Zirah, S.; Kozin, S.A.; Mazur, A.K.; Blond, A.; Cheminant, M.; Segalas-Milazzo, I.; Debey, P.; Rebuffat, S. Structural Changes of Region 1-16 of the Alzheimer Disease Amyloid Beta-Peptide upon Zinc Binding and in Vitro Aging. J Biol Chem 2006, 281, 2151–2161. [Google Scholar] [CrossRef]
- Forest, K.H.; Alfulaij, N.; Arora, K.; Taketa, R.; Sherrin, T.; Todorovic, C.; Lawrence, J.L.M.; Yoshikawa, G.T.; Ng, H.-L.; Hruby, V.J.; et al. Protection against β-Amyloid Neurotoxicity by a Non-Toxic Endogenous N-Terminal β-Amyloid Fragment and Its Active Hexapeptide Core Sequence. Journal of Neurochemistry 2018, 144, 201–217. [Google Scholar] [CrossRef] [PubMed]
- Mukherjee, S.; Perez, K.A.; Lago, L.C.; Klatt, S.; McLean, C.A.; Birchall, I.E.; Barnham, K.J.; Masters, C.L.; Roberts, B.R. Quantification of N-Terminal Amyloid-β Isoforms Reveals Isomers Are the Most Abundant Form of the Amyloid-β Peptide in Sporadic Alzheimer’s Disease. Brain Commun 2021, 3, fcab028. [Google Scholar] [CrossRef] [PubMed]
- Shimizu, T.; Matsuoka, Y.; Shirasawa, T. Biological Significance of Isoaspartate and Its Repair System. Biol Pharm Bull 2005, 28, 1590–1596. [Google Scholar] [CrossRef] [PubMed]
- Mitkevich, V.A.; Petrushanko, I.Y.; Yegorov, Y.E.; Simonenko, O.V.; Vishnyakova, K.S.; Kulikova, A.A.; Tsvetkov, P.O.; Makarov, A.A.; Kozin, S.A. Isomerization of Asp7 Leads to Increased Toxic Effect of Amyloid-Β42 on Human Neuronal Cells. Cell Death Dis 2013, 4, e939. [Google Scholar] [CrossRef] [PubMed]
- Kummer, M.P.; Heneka, M.T. Truncated and Modified Amyloid-Beta Species. Alz Res Therapy 2014, 6, 28. [Google Scholar] [CrossRef] [PubMed]
- Jamasbi, E.; Separovic, F.; Hossain, M.A.; Ciccotosto, G.D. Phosphorylation of a Full Length Amyloid-β Peptide Modulates Its Amyloid Aggregation, Cell Binding and Neurotoxic Properties. Mol Biosyst 2017, 13, 1545–1551. [Google Scholar] [CrossRef]
- Barisano, G.; Montagne, A.; Kisler, K.; Schneider, J.A.; Wardlaw, J.M.; Zlokovic, B.V. Blood–Brain Barrier Link to Human Cognitive Impairment and Alzheimer’s Disease. Nat Cardiovasc Res 2022, 1, 108–115. [Google Scholar] [CrossRef] [PubMed]
- Nation, D.A.; Sweeney, M.D.; Montagne, A.; Sagare, A.P.; D’Orazio, L.M.; Pachicano, M.; Sepehrband, F.; Nelson, A.R.; Buennagel, D.P.; Harrington, M.G.; et al. Blood-Brain Barrier Breakdown Is an Early Biomarker of Human Cognitive Dysfunction. Nat Med 2019, 25, 270–276. [Google Scholar] [CrossRef] [PubMed]
- Zenaro, E.; Piacentino, G.; Constantin, G. The Blood-Brain Barrier in Alzheimer’s Disease. Neurobiol Dis 2017, 107, 41–56. [Google Scholar] [CrossRef]
- Bu, X.-L.; Xiang, Y.; Jin, W.-S.; Wang, J.; Shen, L.-L.; Huang, Z.-L.; Zhang, K.; Liu, Y.-H.; Zeng, F.; Liu, J.-H.; et al. Blood-Derived Amyloid-β Protein Induces Alzheimer’s Disease Pathologies. Mol Psychiatry 2018, 23, 1948–1956. [Google Scholar] [CrossRef]
- Sun, H.-L.; Chen, S.-H.; Yu, Z.-Y.; Cheng, Y.; Tian, D.-Y.; Fan, D.-Y.; He, C.-Y.; Wang, J.; Sun, P.-Y.; Chen, Y.; et al. Blood Cell-Produced Amyloid-β Induces Cerebral Alzheimer-Type Pathologies and Behavioral Deficits. Mol Psychiatry 2021, 26, 5568–5577. [Google Scholar] [CrossRef]
- Kozin, S.A.; Cheglakov, I.B.; Ovsepyan, A.A.; Telegin, G.B.; Tsvetkov, P.O.; Lisitsa, A.V.; Makarov, A.A. Peripherally Applied Synthetic Peptide isoAsp7-Aβ(1-42) Triggers Cerebral β-Amyloidosis. Neurotox Res 2013, 24, 370–376. [Google Scholar] [CrossRef]
- Kozin, S.A.; Makarov, A.A. The Convergence of Alzheimer’s Disease Pathogenesis Concepts. Mol Biol 2019, 53, 896–903. [Google Scholar] [CrossRef]
- Biere, A.L.; Ostaszewski, B.; Stimson, E.R.; Hyman, B.T.; Maggio, J.E.; Selkoe, D.J. Amyloid Beta-Peptide Is Transported on Lipoproteins and Albumin in Human Plasma. J Biol Chem 1996, 271, 32916–32922. [Google Scholar] [CrossRef]
- Zhu, D.; Su, Y.; Fu, B.; Xu, H. Magnesium Reduces Blood-Brain Barrier Permeability and Regulates Amyloid-β Transcytosis. Mol Neurobiol 2018, 55, 7118–7131. [Google Scholar] [CrossRef]
- Abulrob, A.; Sprong, H.; Van Bergen en Henegouwen, P.; Stanimirovic, D. The Blood-Brain Barrier Transmigrating Single Domain Antibody: Mechanisms of Transport and Antigenic Epitopes in Human Brain Endothelial Cells. J Neurochem 2005, 95, 1201–1214. [Google Scholar] [CrossRef]
- Daniel, J.A.; Chau, N.; Abdel-Hamid, M.K.; Hu, L.; von Kleist, L.; Whiting, A.; Krishnan, S.; Maamary, P.; Joseph, S.R.; Simpson, F.; et al. Phenothiazine-Derived Antipsychotic Drugs Inhibit Dynamin and Clathrin-Mediated Endocytosis. Traffic 2015, 16, 635–654. [Google Scholar] [CrossRef] [PubMed]
- Deane, R.; Singh, I.; Sagare, A.P.; Bell, R.D.; Ross, N.T.; LaRue, B.; Love, R.; Perry, S.; Paquette, N.; Deane, R.J.; et al. A Multimodal RAGE-Specific Inhibitor Reduces Amyloid β–Mediated Brain Disorder in a Mouse Model of Alzheimer Disease. J Clin Invest 2012, 122, 1377–1392. [Google Scholar] [CrossRef]
- Roher, A.E.; Esh, C.L.; Kokjohn, T.A.; Castaño, E.M.; Van Vickle, G.D.; Kalback, W.M.; Patton, R.L.; Luehrs, D.C.; Daugs, I.D.; Kuo, Y.-M.; et al. Amyloid Beta Peptides in Human Plasma and Tissues and Their Significance for Alzheimer’s Disease. Alzheimer’s & Dementia 2009, 5, 18–29. [Google Scholar] [CrossRef]
- Kiko, T.; Nakagawa, K.; Satoh, A.; Tsuduki, T.; Furukawa, K.; Arai, H.; Miyazawa, T. Amyloid β Levels in Human Red Blood Cells. PLoS One 2012, 7, e49620. [Google Scholar] [CrossRef] [PubMed]
- Eisele, Y.S.; Obermüller, U.; Heilbronner, G.; Baumann, F.; Kaeser, S.A.; Wolburg, H.; Walker, L.C.; Staufenbiel, M.; Heikenwalder, M.; Jucker, M. Peripherally Applied Abeta-Containing Inoculates Induce Cerebral Beta-Amyloidosis. Science 2010, 330, 980–982. [Google Scholar] [CrossRef] [PubMed]
- Eisele, Y.S.; Fritschi, S.K.; Hamaguchi, T.; Obermüller, U.; Füger, P.; Skodras, A.; Schäfer, C.; Odenthal, J.; Heikenwalder, M.; Staufenbiel, M.; et al. Multiple Factors Contribute to the Peripheral Induction of Cerebral β-Amyloidosis. J Neurosci 2014, 34, 10264–10273. [Google Scholar] [CrossRef]
- Burwinkel, M.; Lutzenberger, M.; Heppner, F.L.; Schulz-Schaeffer, W.; Baier, M. Intravenous Injection of Beta-Amyloid Seeds Promotes Cerebral Amyloid Angiopathy (CAA). Acta Neuropathol Commun 2018, 6, 23. [Google Scholar] [CrossRef]
- Marques, M.A.; Kulstad, J.J.; Savard, C.E.; Green, P.S.; Lee, S.P.; Craft, S.; Watson, G.S.; Cook, D.G. Peripheral Amyloid-Beta Levels Regulate Amyloid-Beta Clearance from the Central Nervous System. J Alzheimers Dis 2009, 16, 325–329. [Google Scholar] [CrossRef]
- Deane, R.; Du Yan, S.; Submamaryan, R.K.; LaRue, B.; Jovanovic, S.; Hogg, E.; Welch, D.; Manness, L.; Lin, C.; Yu, J.; et al. RAGE Mediates Amyloid-Beta Peptide Transport across the Blood-Brain Barrier and Accumulation in Brain. Nat. Med. 2003, 9, 907–913. [Google Scholar] [CrossRef]
- Ayloo, S.; Gu, C. Transcytosis at the Blood–Brain Barrier. Current Opinion in Neurobiology 2019, 57, 32–38. [Google Scholar] [CrossRef] [PubMed]
- Pemberton, S.; Galindo, D.C.; Schwartz, M.W.; Banks, W.A.; Rhea, E.M. Endocytosis of Insulin at the Blood-Brain Barrier. Frontiers in Drug Delivery 2022, 2. [Google Scholar] [CrossRef] [PubMed]
- Roberts, R.; Sandra, A.; Siek, G.C.; Lucas, J.J.; Fine, R.E. Studies of the Mechanism of Iron Transport across the Blood-Brain Barrier. Annals of Neurology 1992, 32, S43–S50. [Google Scholar] [CrossRef] [PubMed]
- Goulatis, L.I.; Shusta, E.V. Protein Engineering Approaches for Regulating Blood–Brain Barrier Transcytosis. Current Opinion in Structural Biology 2017, 45, 109–115. [Google Scholar] [CrossRef] [PubMed]
- Chellappa, R.C.; Lukose, B.; Rani, P. Correction: G82S RAGE Polymorphism Influences Amyloid-RAGE Interactions Relevant in Alzheimer’s Disease Pathology. PLOS ONE 2021, 16, e0248252. [Google Scholar] [CrossRef] [PubMed]
- Yan, S.D.; Stern, D.; Kane, M.D.; Kuo, Y.M.; Lampert, H.C.; Roher, A.E. RAGE-Abeta Interactions in the Pathophysiology of Alzheimer’s Disease. Restor Neurol Neurosci 1998, 12, 167–173. [Google Scholar] [PubMed]
- Chen, X.; Walker, D.G.; Schmidt, A.M.; Arancio, O.; Lue, L.-F.; Yan, S.D. RAGE: A Potential Target for Abeta-Mediated Cellular Perturbation in Alzheimer’s Disease. Curr Mol Med 2007, 7, 735–742. [Google Scholar] [CrossRef] [PubMed]
- Sugihara, T.; Munesue, S.; Yamamoto, Y.; Sakurai, S.; Akhter, N.; Kitamura, Y.; Shiba, K.; Watanabe, T.; Yonekura, H.; Hayashi, Y.; et al. Endogenous Secretory Receptor for Advanced Glycation End-Products Inhibits Amyloid-β 1-42 Uptake into Mouse Brain. Journal of Alzheimer’s Disease 2012, 28, 709–720. [Google Scholar] [CrossRef]
- Tolstova, A.P.; Adzhubei, A.A.; Mitkevich, V.A.; Petrushanko, I.Y.; Makarov, A.A. Docking and Molecular Dynamics-Based Identification of Interaction between Various Beta-Amyloid Isoforms and RAGE Receptor. International Journal of Molecular Sciences 2022, 23, 11816. [Google Scholar] [CrossRef]
- Yu, Y.J.; Zhang, Y.; Kenrick, M.; Hoyte, K.; Luk, W.; Lu, Y.; Atwal, J.; Elliott, J.M.; Prabhu, S.; Watts, R.J.; et al. Boosting Brain Uptake of a Therapeutic Antibody by Reducing Its Affinity for a Transcytosis Target. Sci Transl Med 2011, 3, 84ra44. [Google Scholar] [CrossRef]
- Wiley, D.T.; Webster, P.; Gale, A.; Davis, M.E. Transcytosis and Brain Uptake of Transferrin-Containing Nanoparticles by Tuning Avidity to Transferrin Receptor. Proceedings of the National Academy of Sciences 2013, 110, 8662–8667. [Google Scholar] [CrossRef]
- Tian, X.; Leite, D.M.; Scarpa, E.; Nyberg, S.; Fullstone, G.; Forth, J.; Matias, D.; Apriceno, A.; Poma, A.; Duro-Castano, A.; et al. On the Shuttling across the Blood-Brain Barrier via Tubule Formation: Mechanism and Cargo Avidity Bias. Sci Adv 2020, 6, eabc4397. [Google Scholar] [CrossRef]
- Lambeth, T.R.; Riggs, D.L.; Talbert, L.E.; Tang, J.; Coburn, E.; Kang, A.S.; Noll, J.; Augello, C.; Ford, B.D.; Julian, R.R. Spontaneous Isomerization of Long-Lived Proteins Provides a Molecular Mechanism for the Lysosomal Failure Observed in Alzheimer’s Disease. bioRxiv 2019, 605626. [Google Scholar] [CrossRef] [PubMed]
- Zinchenko, E.; Klimova, M.; Mamedova, A.; Agranovich, I.; Blokhina, I.; Antonova, T.; Terskov, A.; Shirokov, A.; Navolokin, N.; Morgun, A.; et al. Photostimulation of Extravasation of Beta-Amyloid through the Model of Blood-Brain Barrier. Electronics 2020, 9, 1056. [Google Scholar] [CrossRef]
- Shubbar, M.H.; Penny, J.I. Therapeutic Drugs Modulate ATP-Binding Cassette Transporter-Mediated Transport of Amyloid Beta(1–42) in Brain Microvascular Endothelial Cells. European Journal of Pharmacology 2020, 874, 173009. [Google Scholar] [CrossRef] [PubMed]
- Dal Magro, R.; Simonelli, S.; Cox, A.; Formicola, B.; Corti, R.; Cassina, V.; Nardo, L.; Mantegazza, F.; Salerno, D.; Grasso, G.; et al. The Extent of Human Apolipoprotein A-I Lipidation Strongly Affects the β-Amyloid Efflux Across the Blood-Brain Barrier in Vitro. Frontiers in Neuroscience 2019, 13. [Google Scholar] [CrossRef] [PubMed]
- Shackleton, B.; Crawford, F.; Bachmeier, C. Inhibition of ADAM10 Promotes the Clearance of Aβ across the BBB by Reducing LRP1 Ectodomain Shedding. Fluids and Barriers of the CNS 2016, 13, 14. [Google Scholar] [CrossRef] [PubMed]
Disclaimer/Publisher’s Note: The statements, opinions and data contained in all publications are solely those of the individual author(s) and contributor(s) and not of MDPI and/or the editor(s). MDPI and/or the editor(s) disclaim responsibility for any injury to people or property resulting from any ideas, methods, instructions or products referred to in the content. |
© 2023 by the authors. Licensee MDPI, Basel, Switzerland. This article is an open access article distributed under the terms and conditions of the Creative Commons Attribution (CC BY) license (http://creativecommons.org/licenses/by/4.0/).


