Submitted:
17 December 2023
Posted:
18 December 2023
You are already at the latest version
Abstract
Keywords:
1. Introduction
2. Results
2.1. Baseline Characterization and Mortality
2.2. Physiological Responses to Hemorrhage
2.3. Fluid Resuscitation on Hemodynamic and Metabolic Parameters
2.4. Fluid Resuscitation on Hemodilution and Coagulation Parameters
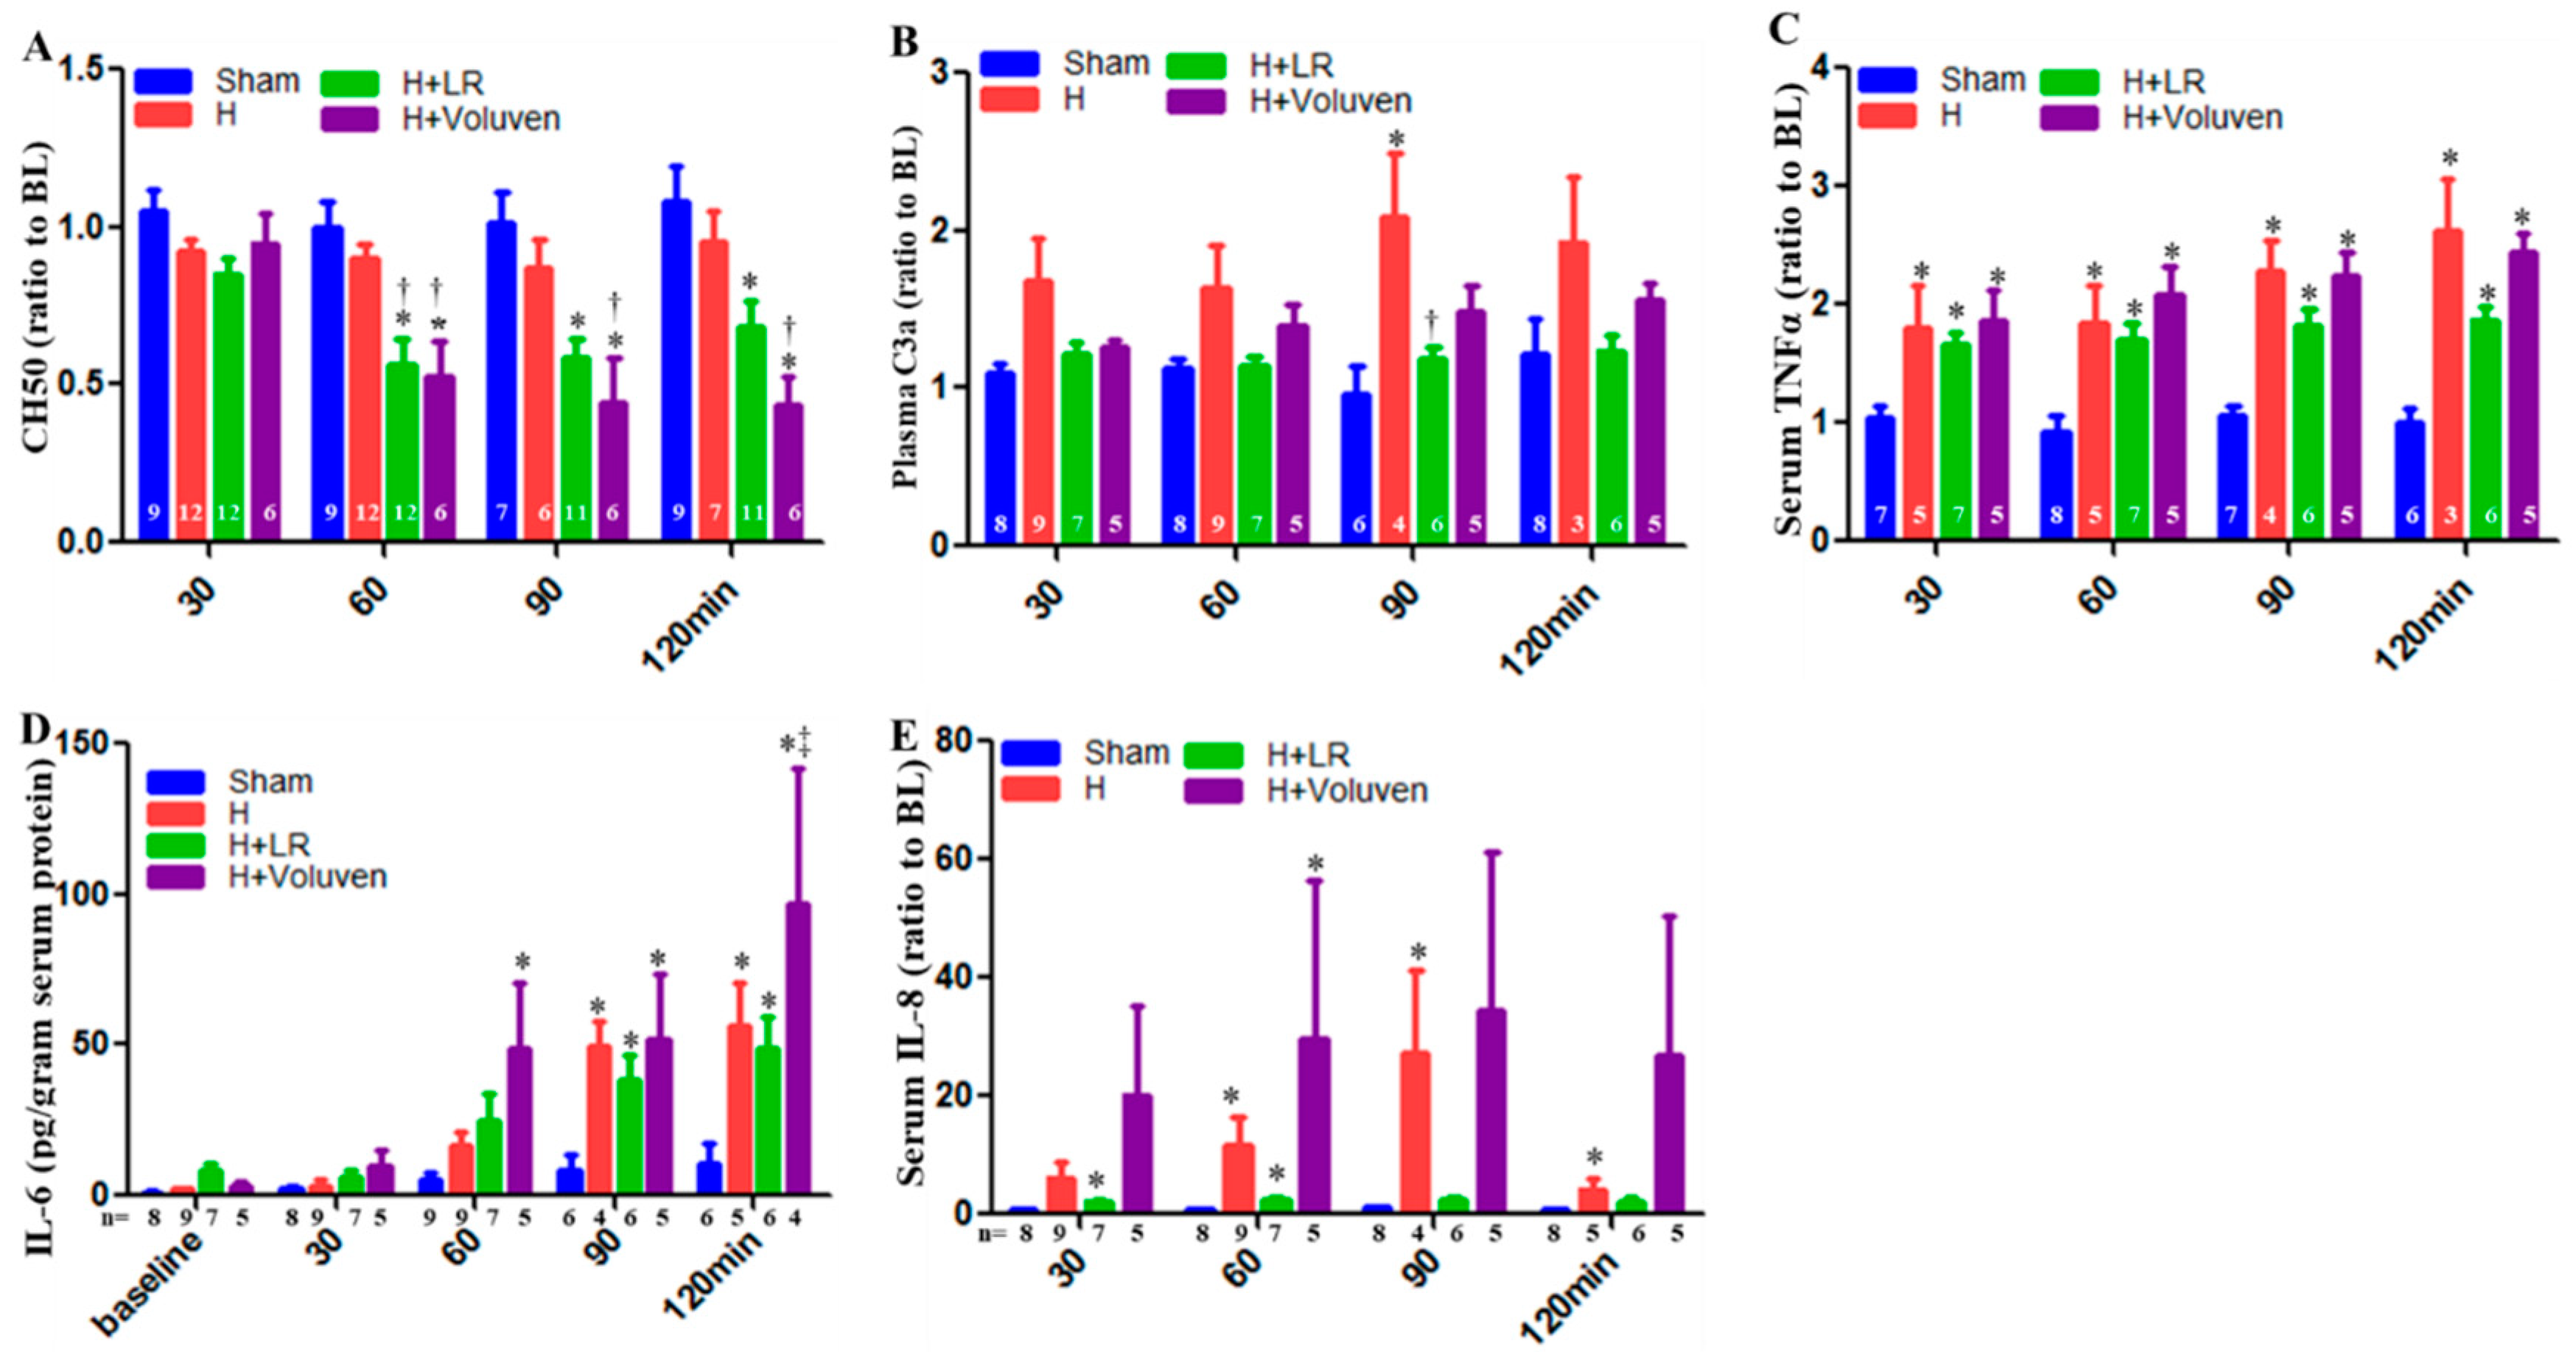
2.5. Circulating Complement Activation and Cytokine Release
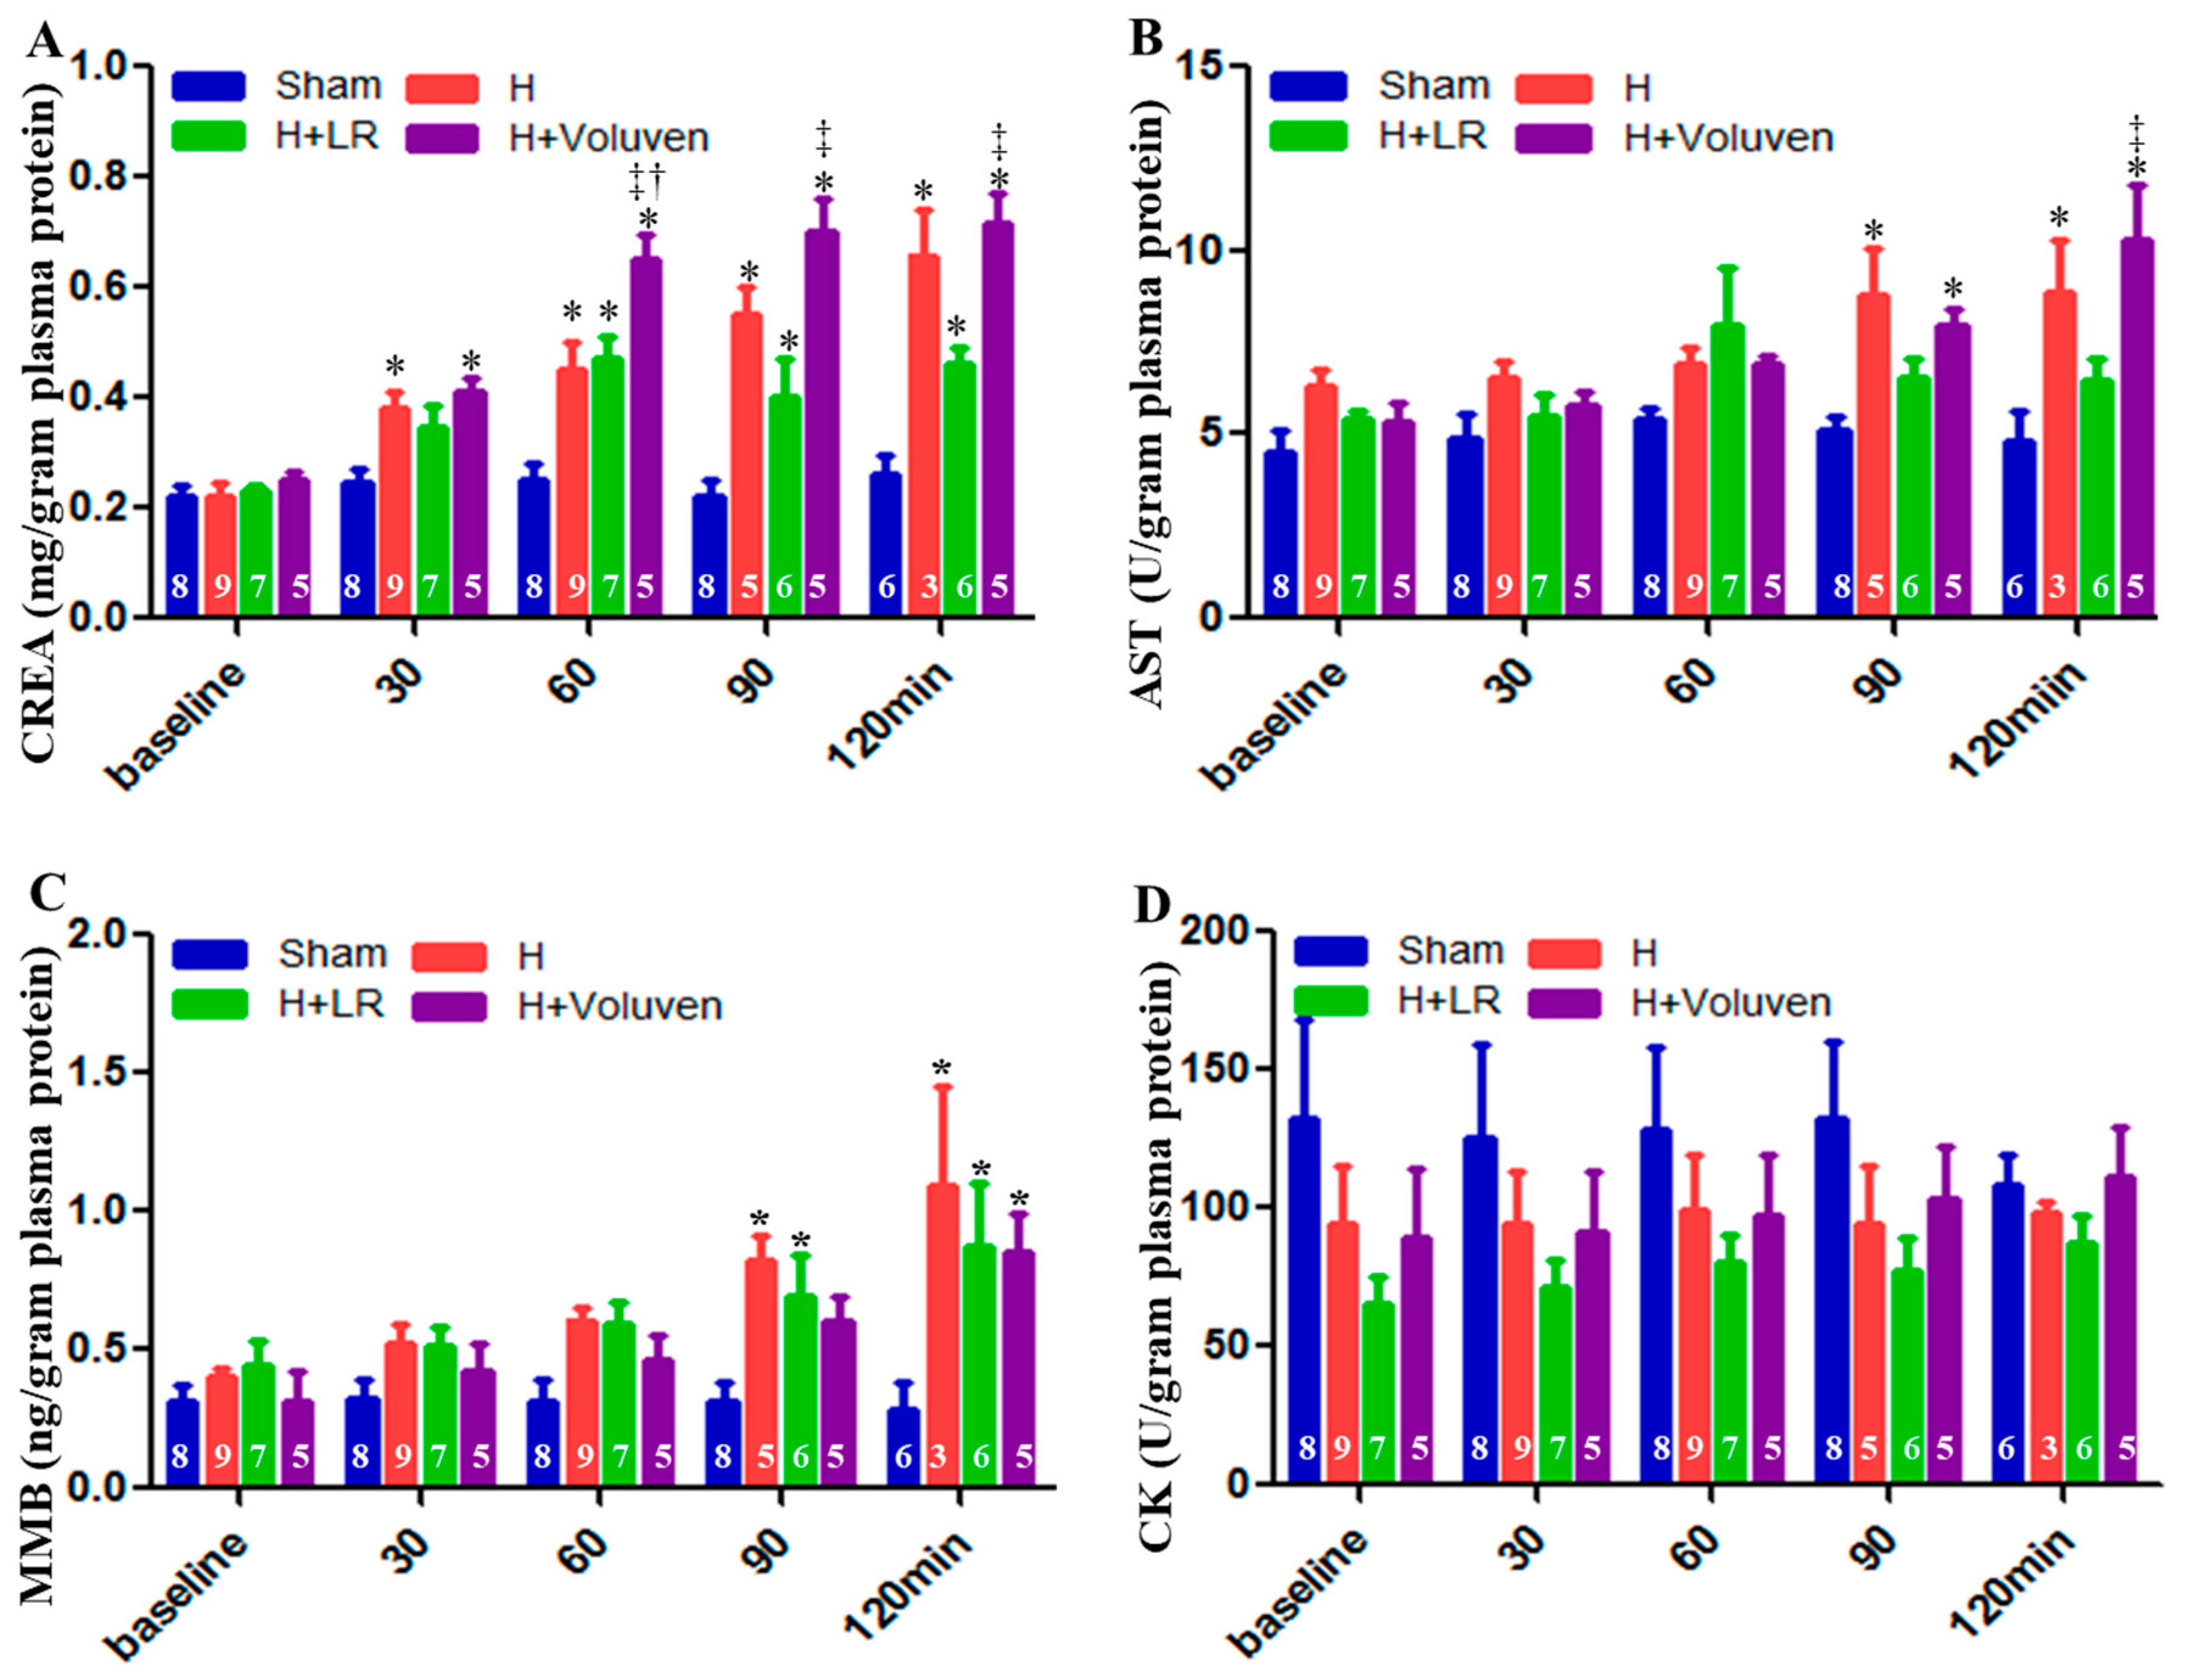
2.6. End Organ Function
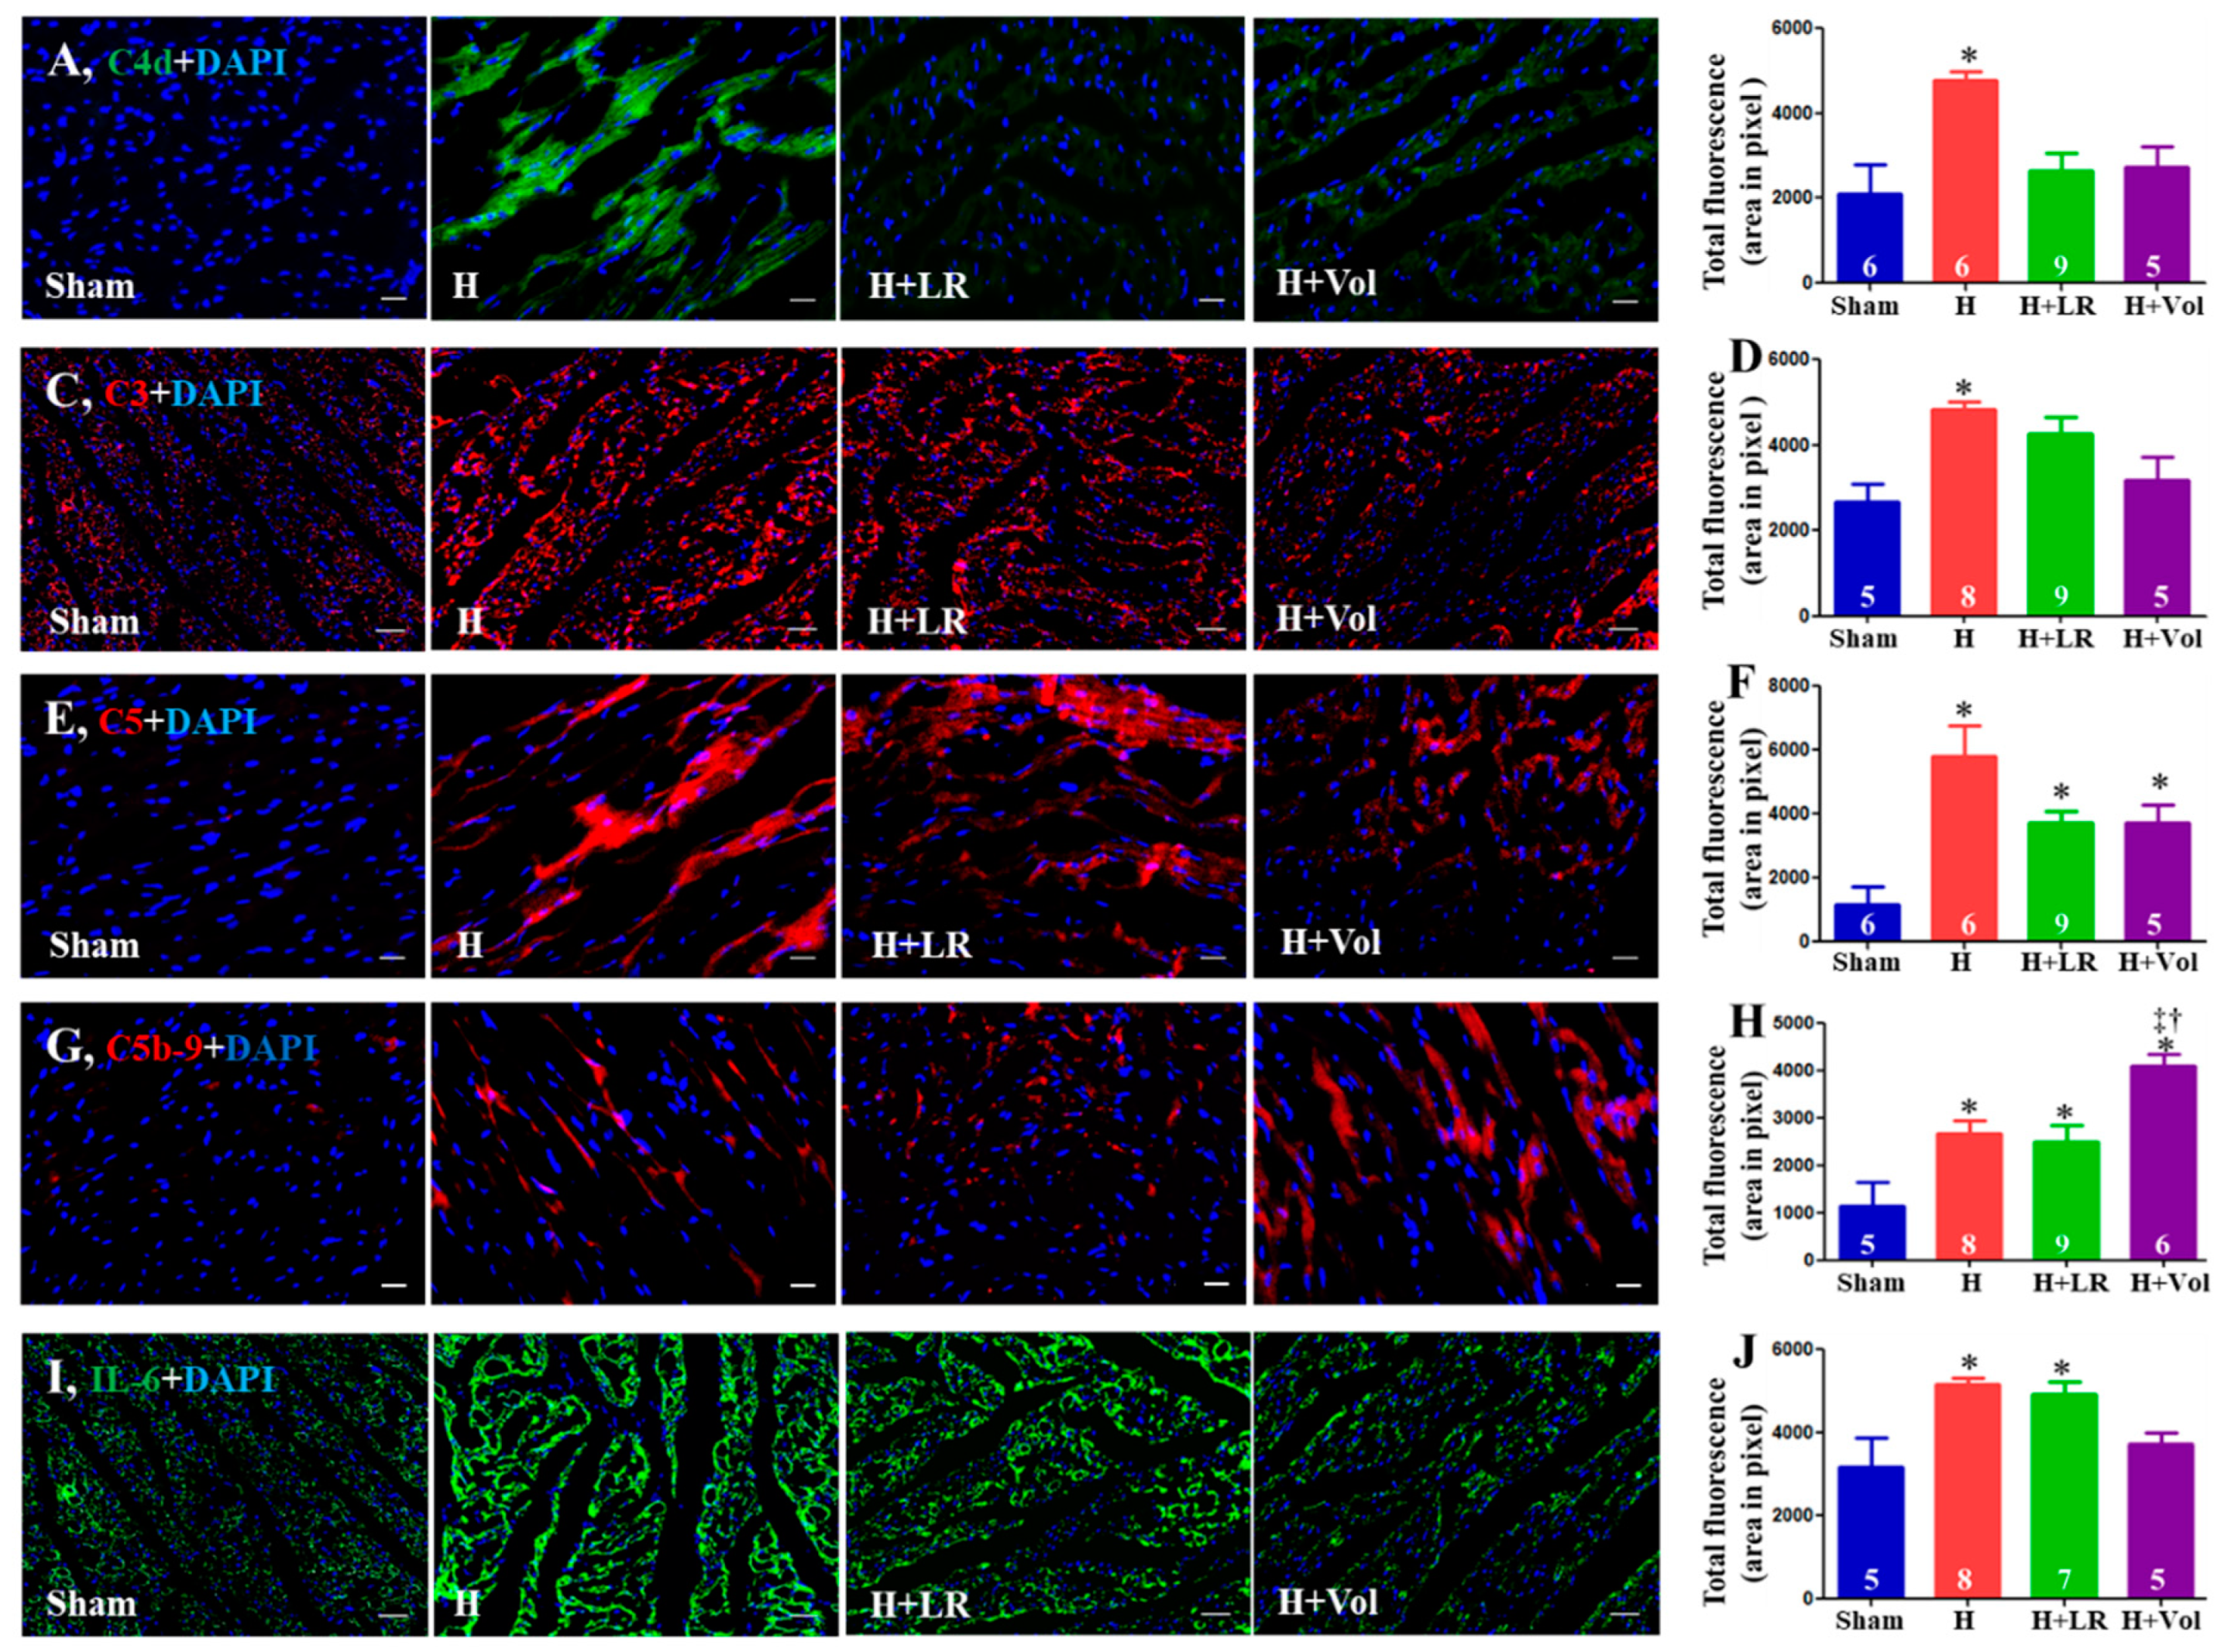
2.7. Myocardial Inflammatory Responses to Hemorrhagic Shock and Fluid Resuscitation
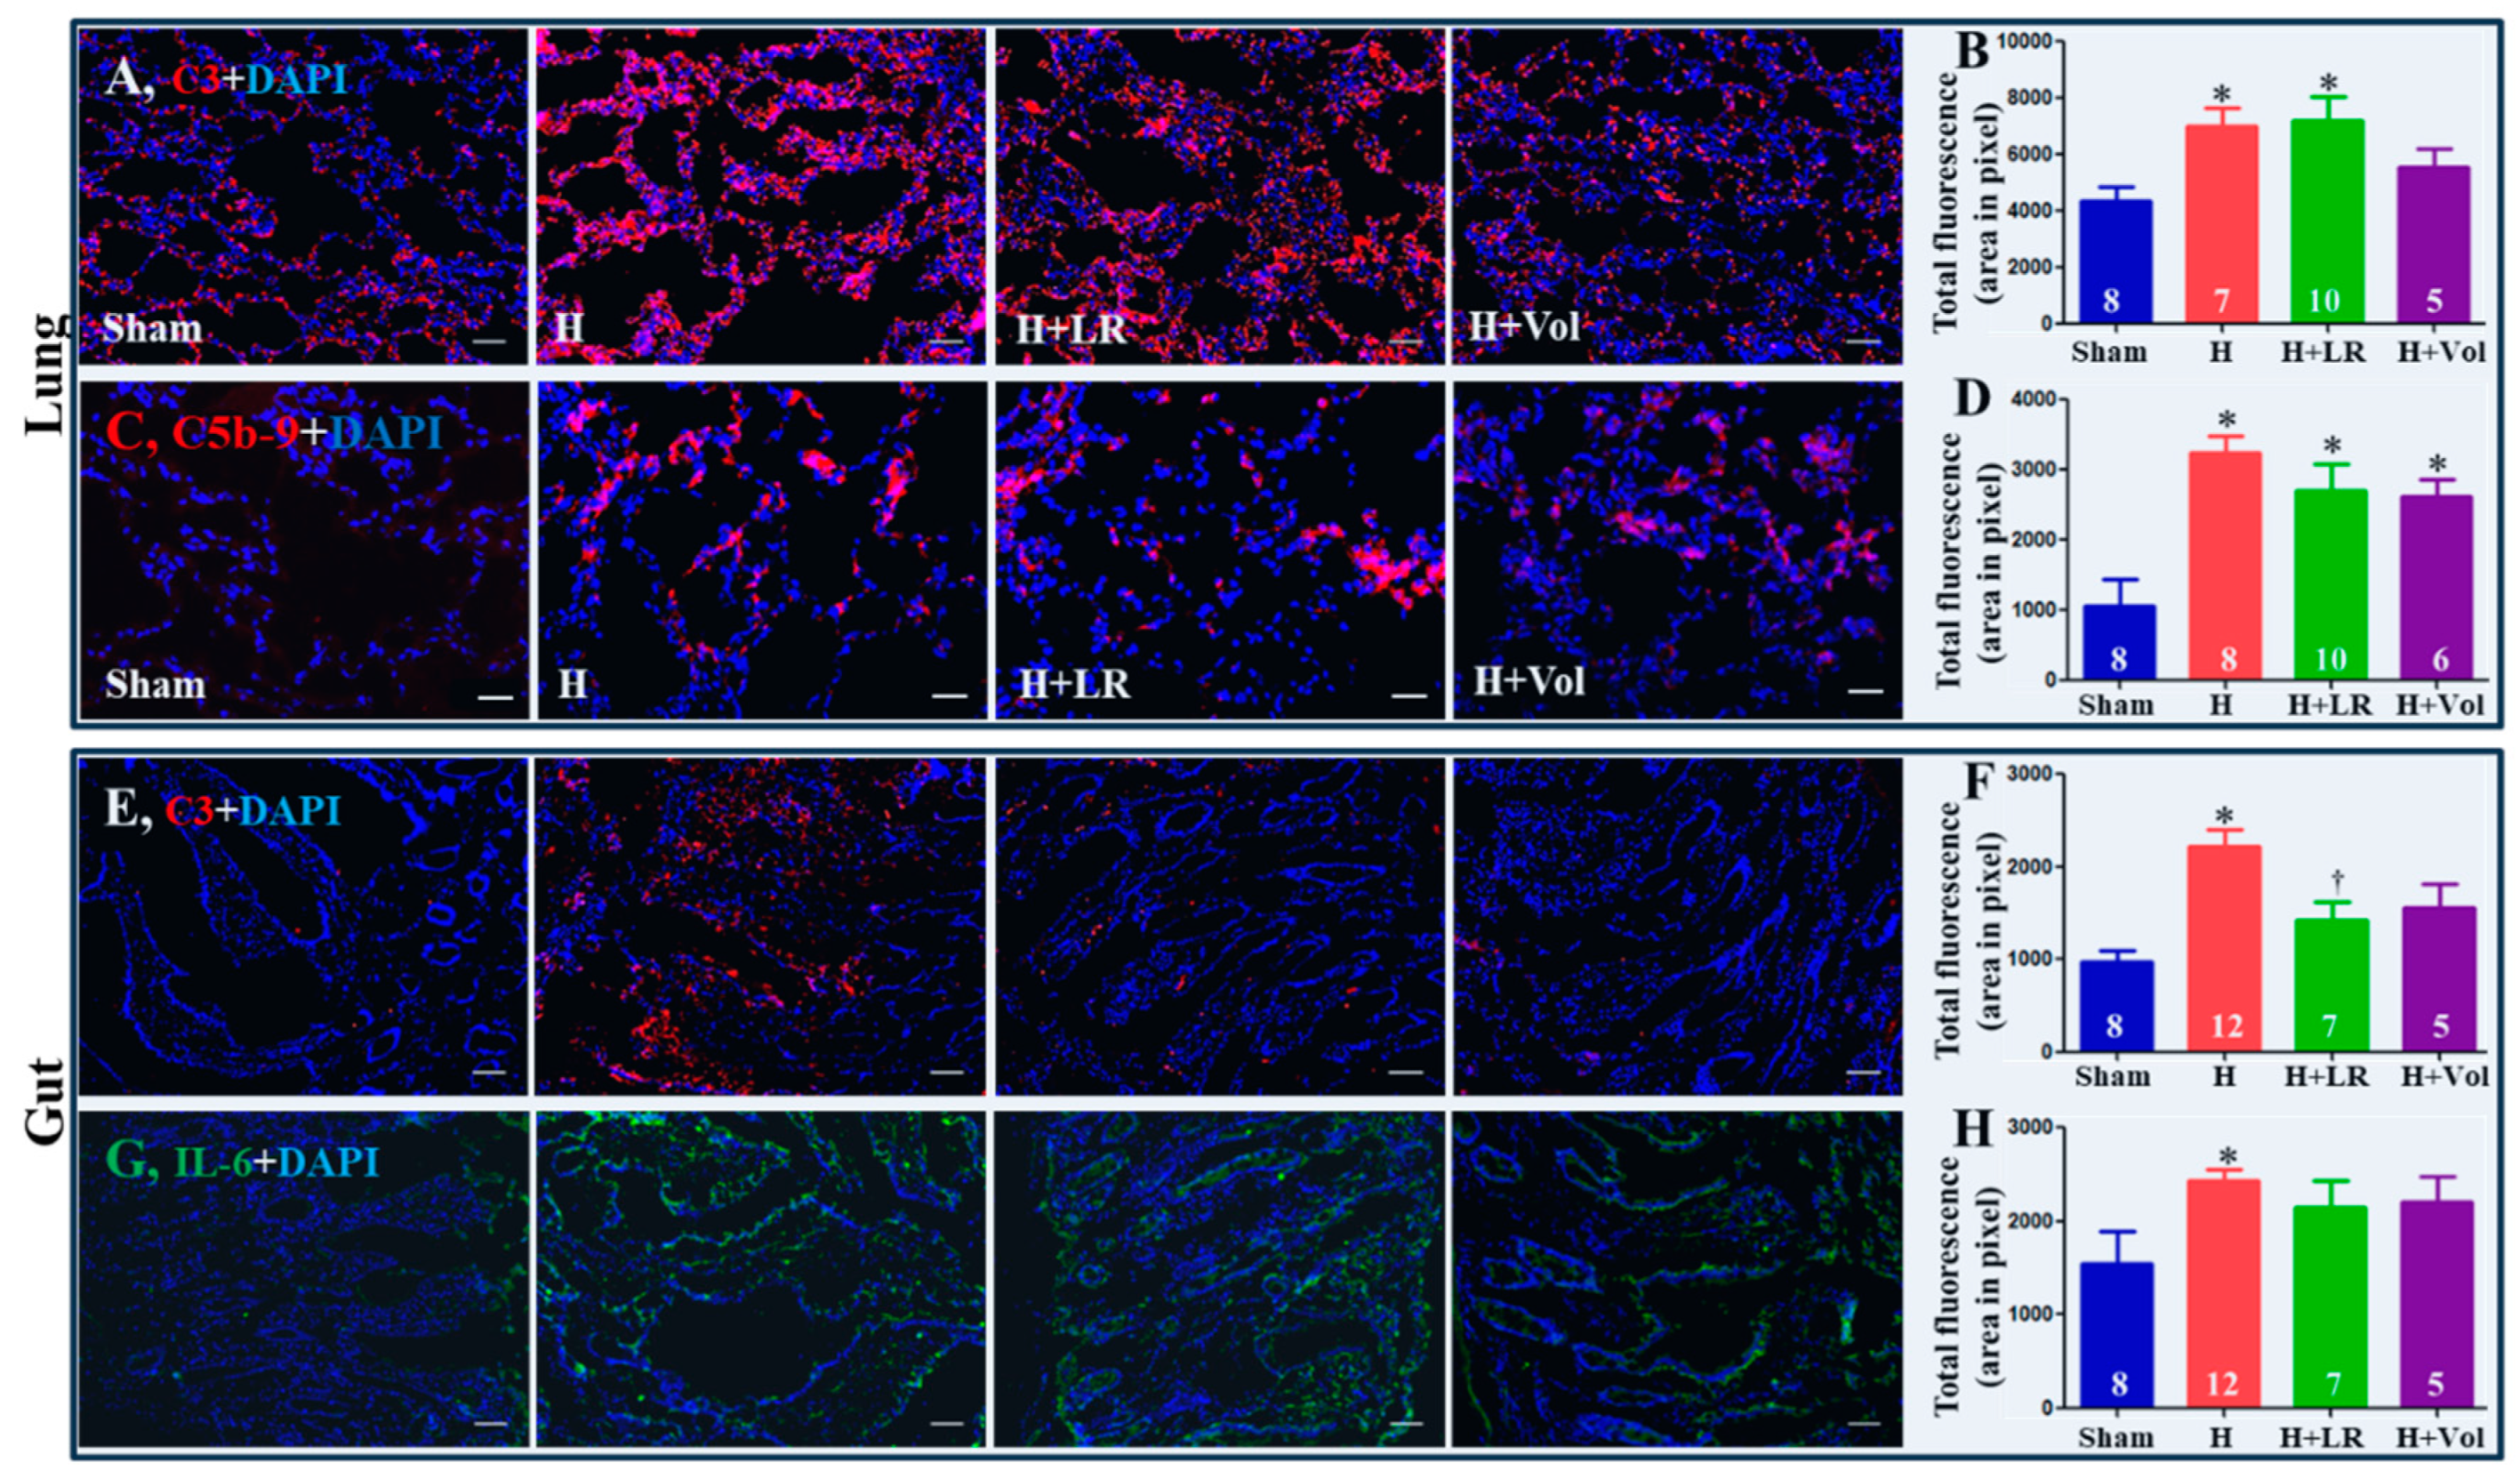
2.8. Pulmonary and Intestinal Inflammatory Responses to Hemorrhagic Shock and Fluid Resuscitation
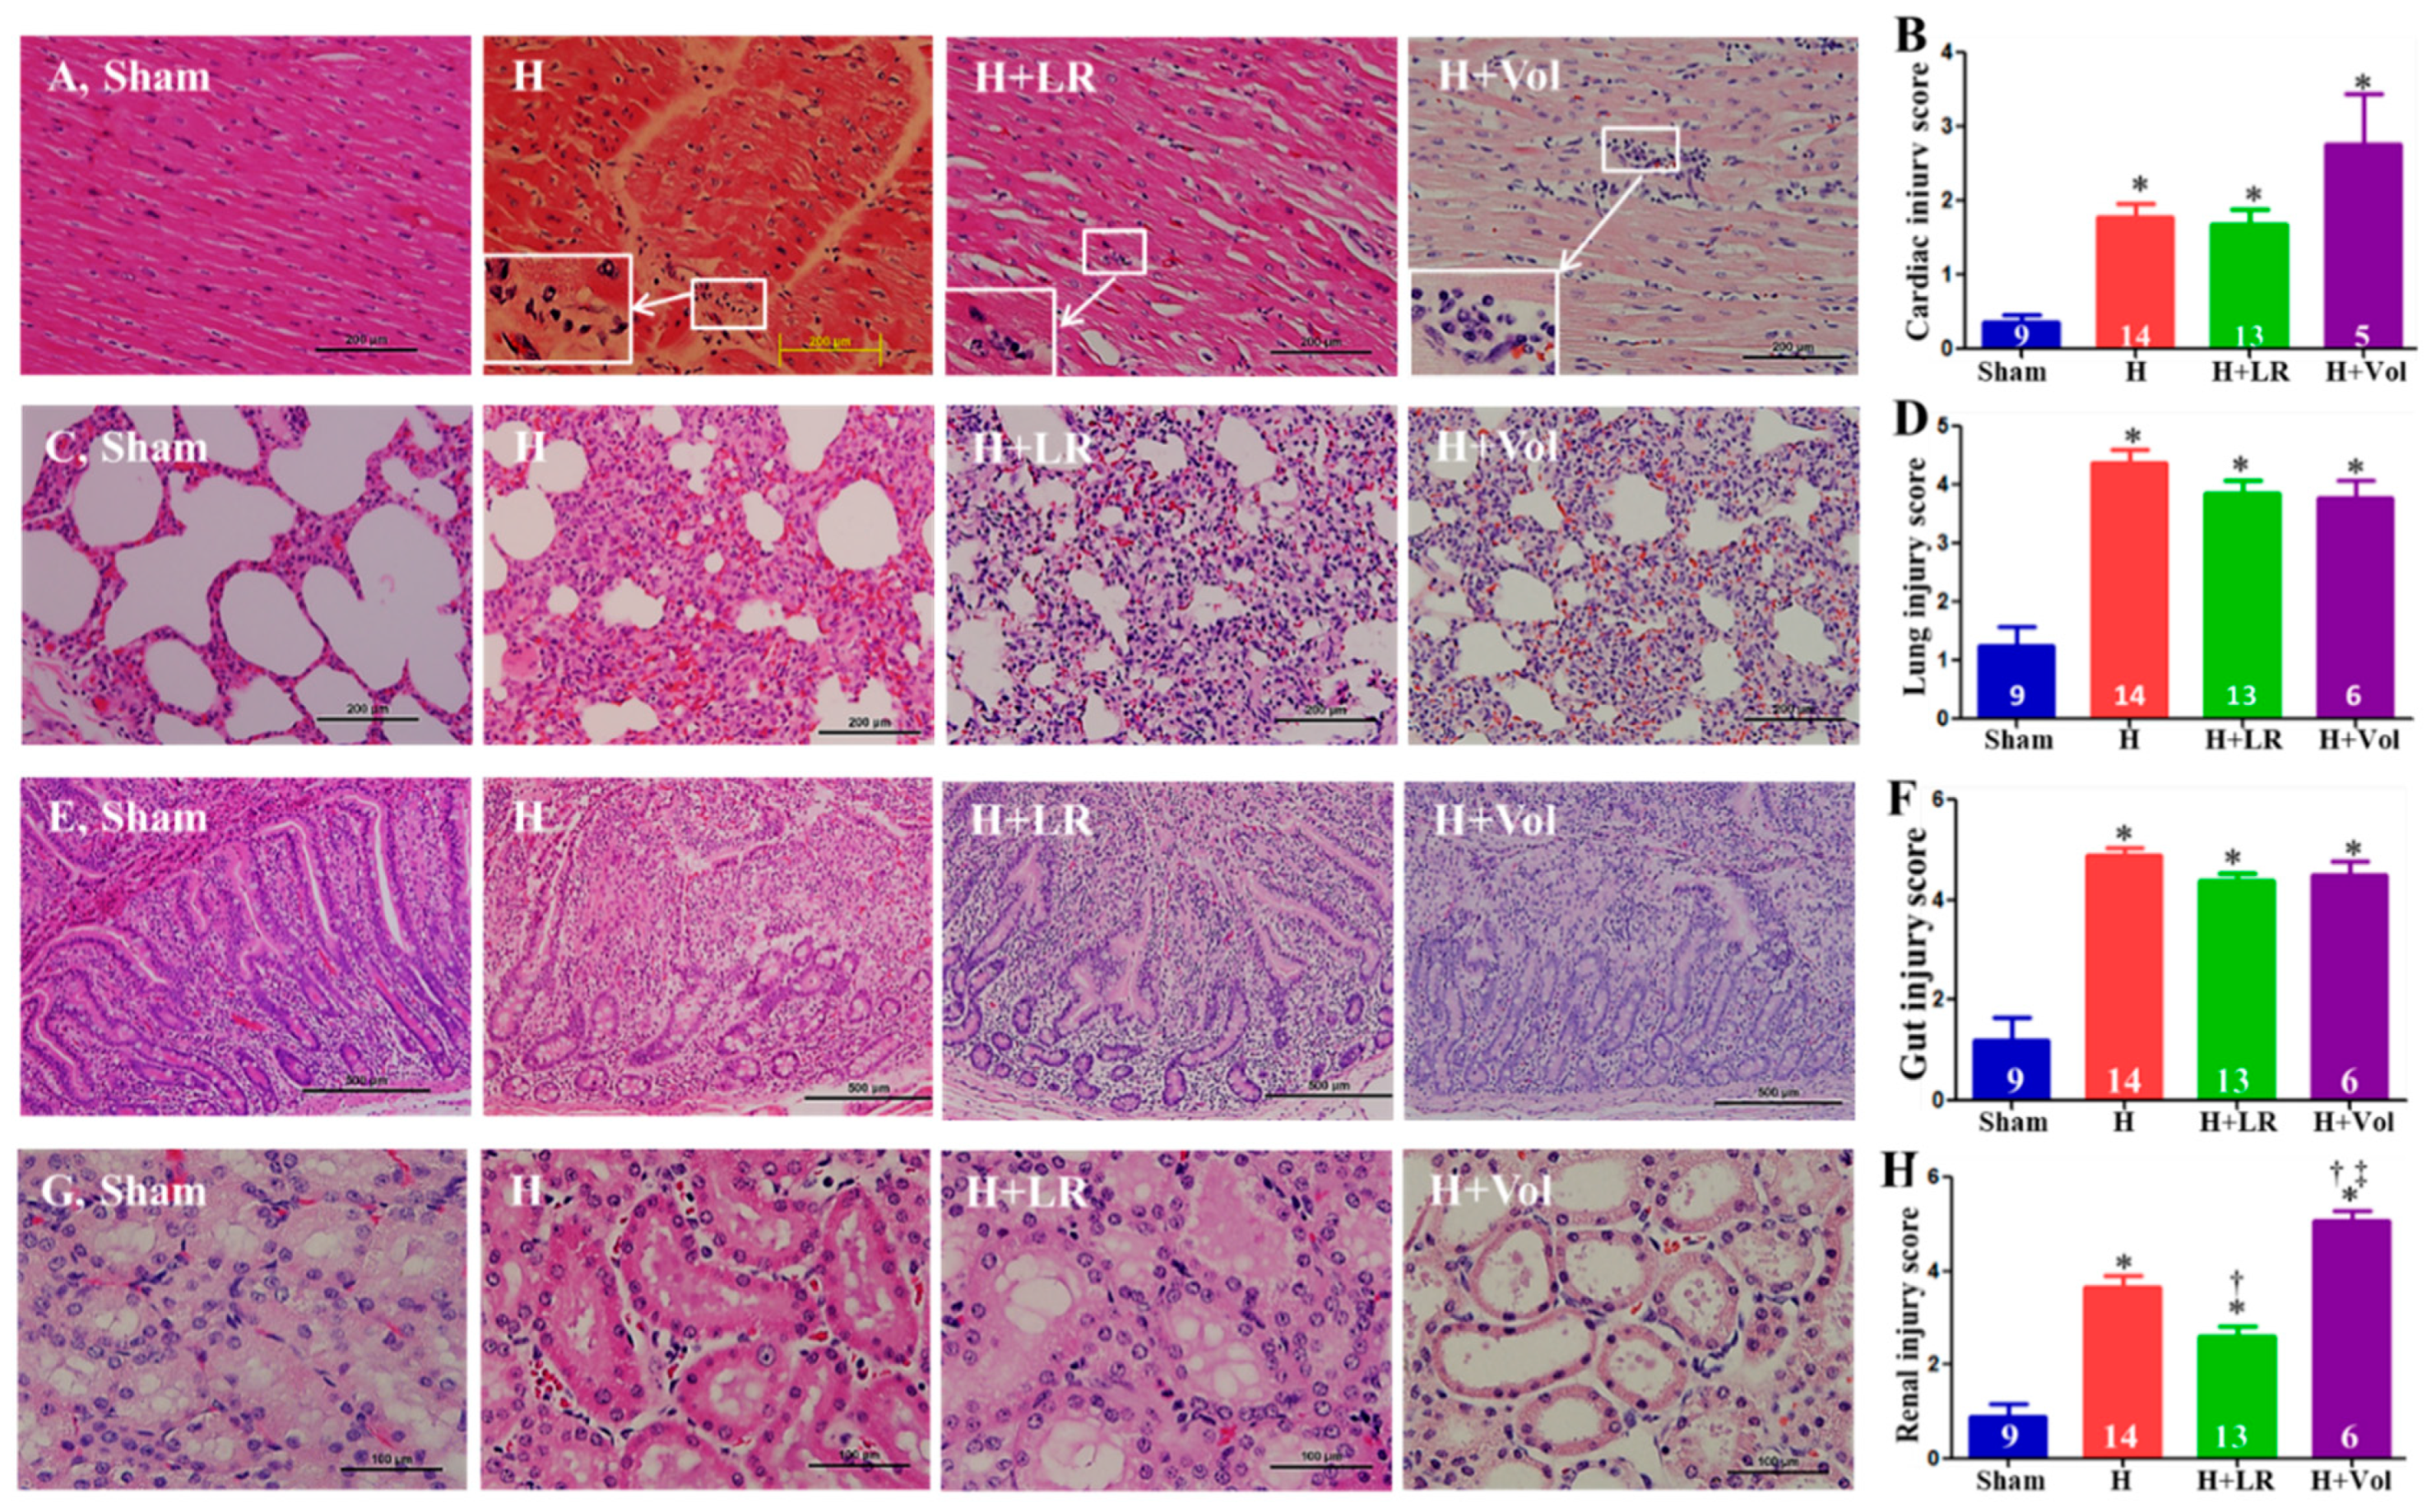
2.9. Effect of H and Fluid Resuscitation on Organ Histopathological Alterations
2.10. Effect of Hemorrhage and Fluid Resuscitation on Survival
3. Discussion
4. Conclusions
5. Materials and Methods
5.1. Animal Study
5.1.1. General Procedures
5.1.2. Surgical Preparation
5.1.3. Experimental Design
5.1.4. Biosampling
5.2. Assays
5.2.1. Reagents and Antibodies
5.2.2. Histological Examination
5.2.3. Immunohistochemical Staining
5.2.4. Cytokine Assays
5.2.5. Quantitative Assessment of End Tissue Function
5.2.6. Measurement of Coagulation Parameters
5.2.7. Analysis of Complement Functional Activity
5.2.8. Analysis of Plasma C3a
5.3. Statistical Analysis
Author Contributions
Funding
Institutional Review Board Statement
Informed Consent Statement
Data Availability Statement
Acknowledgments
Conflicts of Interest
References
- Hooper, T. J.; De Pasquale, M.; Strandenes, G.; Sunde, G.; Ward, K. R. Challenges and Possibilities in Forward Resuscitation. Shock 2014, 41 Suppl 1, 13–20. [CrossRef]
- Gruen, R. L.; Brohi, K.; Schreiber, M.; Balogh, Z. J.; Pitt, V.; Narayan, M.; Maier, R. V. Haemorrhage Control in Severely Injured Patients. The Lancet 2012, 380 (9847), 1099–1108. [CrossRef]
- Moore, E. E.; Moore, H. B.; Kornblith, L. Z.; Neal, M. D.; Hoffman, M.; Mutch, N. J.; Schöchl, H.; Hunt, B. J.; Sauaia, A. Trauma-Induced Coagulopathy. Nat Rev Dis Primers 2021, 7 (1), 30. [CrossRef]
- Ramesh, G. H.; Uma, J. C.; Farhath, S. Fluid Resuscitation in Trauma: What Are the Best Strategies and Fluids? Int J Emerg Med 2019, 12 (1), 38. [CrossRef]
- Roger, C.; Muller, L.; Deras, P.; Louart, G.; Nouvellon, E.; Molinari, N.; Goret, L.; Gris, J. C.; Ripart, J.; De La Coussaye, J. E.; Lefrant, J. Y. Does the Type of Fluid Affect Rapidity of Shock Reversal in an Anaesthetized-Piglet Model of near-Fatal Controlled Haemorrhage? A Randomized Study. British Journal of Anaesthesia 2014, 112 (6), 1015–1023. [CrossRef]
- Curry, N.; Hopewell, S.; Dorée, C.; Hyde, C.; Brohi, K.; Stanworth, S. The Acute Management of Trauma Hemorrhage: A Systematic Review of Randomized Controlled Trials. Crit Care 2011, 15 (2), R92. [CrossRef]
- Leibner, E.; Andreae, M.; Galvagno, S. M.; Scalea, T. Damage Control Resuscitation. Clin Exp Emerg Med 2020, 7 (1), 5–13. [CrossRef]
- Holcomb, J. B.; Del Junco, D. J.; Fox, E. E.; Wade, C. E.; Cohen, M. J.; Schreiber, M. A.; Alarcon, L. H.; Bai, Y.; Brasel, K. J.; Bulger, E. M.; Cotton, B. A.; Matijevic, N.; Muskat, P.; Myers, J. G.; Phelan, H. A.; White, C. E.; Zhang, J.; Rahbar, M. H.; Prommtt Study Group, F. T. The Prospective, Observational, Multicenter, Major Trauma Transfusion (PROMMTT) Study: Comparative Effectiveness of a Time-Varying Treatment With Competing Risks. JAMA Surg 2013, 148 (2), 127. [CrossRef]
- Parr, M. J.; Bouillon, B.; Brohi, K.; Dutton, R. P.; Hauser, C. J.; Hess, J. R.; Holcomb, J. B.; Kluger, Y.; Mackway-Jones, K.; Rizoli, S. B.; Yukioka, T.; Hoyt, D. B. Traumatic Coagulopathy: Where Are the Good Experimental Models? Journal of Trauma: Injury, Infection & Critical Care 2008, 65 (4), 766–771. [CrossRef]
- Curry, N.; Davis, P. W. What’s New in Resuscitation Strategies for the Patient with Multiple Trauma? Injury 2012, 43 (7), 1021–1028. [CrossRef]
- Snyder, C. W.; Weinberg, J. A.; McGwin, G.; Melton, S. M.; George, R. L.; Reiff, D. A.; Cross, J. M.; Hubbard-Brown, J.; Rue, L. W.; Kerby, J. D. The Relationship of Blood Product Ratio to Mortality: Survival Benefit or Survival Bias? Journal of Trauma: Injury, Infection & Critical Care 2009, 66 (2), 358–364. [CrossRef]
- MacLeod, J. B. A.; Lynn, M.; McKenney, M. G.; Cohn, S. M.; Murtha, M. Early Coagulopathy Predicts Mortality in Trauma. J Trauma 2003, 55 (1), 39–44. [CrossRef]
- Maegele, M.; Lefering, R.; Yucel, N.; Tjardes, T.; Rixen, D.; Paffrath, T.; Simanski, C.; Neugebauer, E.; Bouillon, B. Early Coagulopathy in Multiple Injury: An Analysis from the German Trauma Registry on 8724 Patients. Injury 2007, 38 (3), 298–304. [CrossRef]
- Huber-Lang, M.; Lambris, J. D.; Ward, P. A. Innate Immune Responses to Trauma. Nat Immunol 2018, 19 (4), 327–341. [CrossRef]
- Huber-Lang, M.; Sarma, J. V.; Zetoune, F. S.; Rittirsch, D.; Neff, T. A.; McGuire, S. R.; Lambris, J. D.; Warner, R. L.; Flierl, M. A.; Hoesel, L. M.; Gebhard, F.; Younger, J. G.; Drouin, S. M.; Wetsel, R. A.; Ward, P. A. Generation of C5a in the Absence of C3: A New Complement Activation Pathway. Nat Med 2006, 12 (6), 682–687. [CrossRef]
- Amara, U.; Flierl, M. A.; Rittirsch, D.; Klos, A.; Chen, H.; Acker, B.; Brückner, U. B.; Nilsson, B.; Gebhard, F.; Lambris, J. D.; Huber-Lang, M. Molecular Intercommunication between the Complement and Coagulation Systems. The Journal of Immunology 2010, 185 (9), 5628–5636. [CrossRef]
- Gulla, K. C.; Gupta, K.; Krarup, A.; Gal, P.; Schwaeble, W. J.; Sim, R. B.; O’Connor, C. D.; Hajela, K. Activation of Mannan-binding Lectin-associated Serine Proteases Leads to Generation of a Fibrin Clot. Immunology 2010, 129 (4), 482–495. [CrossRef]
- Simovic, M. O.; Yang, Z.; Jordan, B. S.; Fraker, T. L.; Cancio, T. S.; Lucas, M. L.; Cancio, L. C.; Li, Y. Immunopathological Alterations after Blast Injury and Hemorrhage in a Swine Model of Prolonged Damage Control Resuscitation. Int J Mol Sci 2023, 24 (8), 7494. [CrossRef]
- Yang, Z.; Aderemi, O. A.; Zhao, Q.; Edsall, P. R.; Simovic, M. O.; Lund, B. J.; Espinoza, M. D.; Woodson, A. M.; Li, Y.; Cancio, L. C. Early Complement and Fibrinolytic Activation in a Rat Model of Blast-Induced Multi-Organ Damage. Mil Med 2019, 184 (Suppl 1), 282–290. [CrossRef]
- Yang, Z.; Simovic, M. O.; Liu, B.; Burgess, M. B.; Cap, A. P.; DalleLucca, J. J.; Li, Y. Indices of Complement Activation and Coagulation Changes in Trauma Patients. Trauma Surg Acute Care Open 2022, 7 (1), e000927. [CrossRef]
- Yang, Z.; Le, T. D.; Simovic, M. O.; Liu, B.; Fraker, T. L.; Cancio, T. S.; Cap, A. P.; Wade, C. E.; DalleLucca, J. J.; Li, Y. Traumatized Triad of Complementopathy, Endotheliopathy, and Coagulopathy - Impact on Clinical Outcomes in Severe Polytrauma Patients. Front Immunol 2022, 13, 991048. [CrossRef]
- Dutton, R. P. Current Concepts in Hemorrhagic Shock. Anesthesiology Clinics 2007, 25 (1), 23–34. [CrossRef]
- Niles, S. E.; McLaughlin, D. F.; Perkins, J. G.; Wade, C. E.; Li, Y.; Spinella, P. C.; Holcomb, J. B. Increased Mortality Associated With the Early Coagulopathy of Trauma in Combat Casualties. Journal of Trauma: Injury, Infection & Critical Care 2008, 64 (6), 1459–1465. [CrossRef]
- Bermudez, T.; Sammani, S.; Song, J. H.; Hernon, V. R.; Kempf, C. L.; Garcia, A. N.; Burt, J.; Hufford, M.; Camp, S. M.; Cress, A. E.; Desai, A. A.; Natarajan, V.; Jacobson, J. R.; Dudek, S. M.; Cancio, L. C.; Alvarez, J.; Rafikov, R.; Li, Y.; Zhang, D. D.; Casanova, N. G.; Bime, C.; Garcia, J. G. N. eNAMPT Neutralization Reduces Preclinical ARDS Severity via Rectified NFkB and Akt/mTORC2 Signaling. Sci Rep 2022, 12 (1), 696. [CrossRef]
- Campbell, J. C.; Li, Y.; van Amersfoort, E.; Relan, A.; Dubick, M.; Sheppard, F.; Pusateri, A.; Niemeyer, D.; Tsokos, G. C.; Dalle Lucca, J. J. C1 Inhibitor Limits Organ Injury and Prolongs Survival in Swine Subjected to Battlefield Simulated Injury. Shock 2016, 46 (3 Suppl 1), 177–188. [CrossRef]
- Carey, M. E. Analysis of Wounds Incurred by U.S. Army Seventh Corps Personnel Treated in Corps Hospitals during Operation Desert Storm, February 20 to March 10, 1991: The Journal of Trauma: Injury, Infection, and Critical Care 1996, 40 (Supplement), 165S-169S. [CrossRef]
- Dalle Lucca, J. J.; Li, Y.; Simovic, M. O.; Slack, J. L.; Cap, A.; Falabella, M. J.; Dubick, M.; Lebeda, F.; Tsokos, G. C. Decay-Accelerating Factor Limits Hemorrhage-Instigated Tissue Injury and Improves Resuscitation Clinical Parameters. J Surg Res 2013, 179 (1), 153–167. [CrossRef]
- Huber-Lang, M.; Gebhard, F.; Schmidt, C. Q.; Palmer, A.; Denk, S.; Wiegner, R. Complement Therapeutic Strategies in Trauma, Hemorrhagic Shock and Systemic Inflammation – Closing Pandora’s Box? Seminars in Immunology 2016, 28 (3), 278–284. [CrossRef]
- Karasu, E.; Nilsson, B.; Köhl, J.; Lambris, J. D.; Huber-Lang, M. Targeting Complement Pathways in Polytrauma- and Sepsis-Induced Multiple-Organ Dysfunction. Front Immunol 2019, 10, 543. [CrossRef]
- Lupu, L.; Horst, K.; Greven, J.; Mert, Ü.; Ludviksen, J. A. K.; Pettersen, K.; Lau, C.; Li, Y.; Palmer, A.; Qin, K.; Zhang, X.; Mayer, B.; van Griensven, M.; Huber-Lang, M.; Hildebrand, F.; Mollnes, T. E. Simultaneous C5 and CD14 Inhibition Limits Inflammation and Organ Dysfunction in Pig Polytrauma. Front. Immunol. 2022, 13, 952267. [CrossRef]
- Simovic, M. O.; Falabella, M. J.; Le, T. D.; DalleLucca, J. J.; Li, Y. Decay-Accelerating Factor Creates an Organ-Protective Phenotype after Hemorrhage in Conscious Rats. Int J Mol Sci 2022, 23 (21), 13563. [CrossRef]
- Yang, Z.; Nicholson, S. E.; Cancio, T. S.; Cancio, L. C.; Li, Y. Complement as a Vital Nexus of the Pathobiological Connectome for Acute Respiratory Distress Syndrome: An Emerging Therapeutic Target. Front Immunol 2023, 14, 1100461. [CrossRef]
- Yang, Z.; Nunn, M. A.; Le, T. D.; Simovic, M. O.; Edsall, P. R.; Liu, B.; Barr, J. L.; Lund, B. J.; Hill-Pryor, C. D.; Pusateri, A. E.; Cancio, L. C.; Li, Y. Immunopathology of Terminal Complement Activation and Complement C5 Blockade Creating a Pro-Survival and Organ-Protective Phenotype in Trauma. Br J Pharmacol 2023, 180 (4), 422–440. [CrossRef]
- Yang, Z.; Simovic, M. O.; Edsall, P. R.; Liu, B.; Cancio, T. S.; Batchinsky, A. I.; Cancio, L. C.; Li, Y. HMGB1 Inhibition to Ameliorate Organ Failure and Increase Survival in Trauma. Biomolecules 2022, 12 (1), 101. [CrossRef]
- Holcomb, J. B.; McMullin, N. R.; Pearse, L.; Caruso, J.; Wade, C. E.; Oetjen-Gerdes, L.; Champion, H. R.; Lawnick, M.; Farr, W.; Rodriguez, S.; Butler, F. K. Causes of Death in U.S. Special Operations Forces in the Global War on Terrorism: 2001–2004. Annals of Surgery 2007, 245 (6), 986–991. [CrossRef]
- Maughon, J. S. An Inquiry into the Nature of Wounds Resulting in Killed in Action in Vietnam. Mil Med 1970, 135 (1), 8–13. [CrossRef]
- Sauaia, A.; Moore, F. A.; Moore, E. E.; Moser, K. S.; Brennan, R.; Read, R. A.; Pons, P. T. Epidemiology of Trauma Deaths: A Reassessment. J Trauma 1995, 38 (2), 185–193. [CrossRef]
- Holcomb, J. B. Transport Time and Preoperating Room Hemostatic Interventions Are Important: Improving Outcomes After Severe Truncal Injury. Critical Care Medicine 2018, 46 (3), 447–453. [CrossRef]
- Barry, M.; Trivedi, A.; Vivona, L. R.; Chui, J.; Pathipati, P.; Miyazawa, B.; Pati, S. RECOVERY OF ENDOTHELIOPATHY AT 24 HOURS IN AN ESTABLISHED MOUSE MODEL OF HEMORRHAGIC SHOCK AND TRAUMA. Shock 2022, 58 (4), 313–320. [CrossRef]
- Bunch, C. M.; Chang, E.; Moore, E. E.; Moore, H. B.; Kwaan, H. C.; Miller, J. B.; Al-Fadhl, M. D.; Thomas, A. V.; Zackariya, N.; Patel, S. S.; Zackariya, S.; Haidar, S.; Patel, B.; McCurdy, M. T.; Thomas, S. G.; Zimmer, D.; Fulkerson, D.; Kim, P. Y.; Walsh, M. R.; Hake, D.; Kedar, A.; Aboukhaled, M.; Walsh, M. M. SHock-INduced Endotheliopathy (SHINE): A Mechanistic Justification for Viscoelastography-Guided Resuscitation of Traumatic and Non-Traumatic Shock. Front. Physiol. 2023, 14, 1094845. [CrossRef]
- Burk, A.-M.; Martin, M.; Flierl, M. A.; Rittirsch, D.; Helm, M.; Lampl, L.; Bruckner, U.; Stahl, G. L.; Blom, A. M.; Perl, M.; Gebhard, F.; Huber-Lang, M. Early Complementopathy after Multiple Injuries in Humans. Shock 2012, 37 (4), 348–354. [CrossRef]
- Campbell, J. C.; Li, Y.; van Amersfoort, E.; Relan, A.; Dubick, M.; Sheppard, F.; Pusateri, A.; Niemeyer, D.; Tsokos, G. C.; Dalle Lucca, J. J. C1 Inhibitor Limits Organ Injury and Prolongs Survival in Swine Subjected to Battlefield Simulated Injury. Shock 2016, 46 (3 Suppl 1), 177–188. [CrossRef]
- Ganter, M. T.; Brohi, K.; Cohen, M. J.; Shaffer, L. A.; Walsh, M. C.; Stahl, G. L.; Pittet, J.-F. Role of the Alternative Pathway in the Early Complement Activation Following Major Trauma. Shock 2007, 28 (1), 29–34. [CrossRef]
- Li, Y.; Zhao, Q.; Liu, B.; Dixon, A.; Cancio, L.; Dubick, M.; Dalle Lucca, J. Early Complementopathy Predicts the Outcomes of Patients with Trauma. Trauma Surg Acute Care Open 2019, 4 (1), e000217. [CrossRef]
- Lord, J. M.; Midwinter, M. J.; Chen, Y.-F.; Belli, A.; Brohi, K.; Kovacs, E. J.; Koenderman, L.; Kubes, P.; Lilford, R. J. The Systemic Immune Response to Trauma: An Overview of Pathophysiology and Treatment. Lancet 2014, 384 (9952), 1455–1465. [CrossRef]
- Huber-Lang, M. S.; Ignatius, A.; Köhl, J.; Mannes, M.; Braun, C. K. Complement in Trauma-Traumatised Complement? Br J Pharmacol 2021, 178 (14), 2863–2879. [CrossRef]
- Dobson, G. P.; Morris, J. L.; Letson, H. L. Why Are Bleeding Trauma Patients Still Dying? Towards a Systems Hypothesis of Trauma. Front Physiol 2022, 13, 990903. [CrossRef]
- Medby, C. Is There a Place for Crystalloids and Colloids in Remote Damage Control Resuscitation? Shock 2014, 41 (Supplement 1), 47–50. [CrossRef]
- Cazzolli, D.; Prittie, J. The Crystalloid-colloid Debate: Consequences of Resuscitation Fluid Selection in Veterinary Critical Care. J Vet Emergen Crit Care 2015, 25 (1), 6–19. [CrossRef]
- Fleming, S. D.; Phillips, L. M.; Lambris, J. D.; Tsokos, G. C. Complement Component C5a Mediates Hemorrhage-Induced Intestinal Damage. Journal of Surgical Research 2008, 150 (2), 196–203. [CrossRef]
- Horstick, G.; Kempf, T.; Lauterbach, M.; Bhakdi, S.; Kopacz, L.; Heimann, A.; Malzahn, M.; Horstick, M.; Meyer, J.; Kempski, O. C1-Esterase-Inhibitor Treatment at Early Reperfusion of Hemorrhagic Shock Reduces Mesentry Leukocyte Adhesion and Rolling. Microcirculation 2001, 8 (6), 427–433. [CrossRef]
- Hoth, J. J.; Wells, J. D.; Jones, S. E.; Yoza, B. K.; McCall, C. E. Complement Mediates a Primed Inflammatory Response after Traumatic Lung Injury. Journal of Trauma and Acute Care Surgery 2014, 76 (3), 601–609. [CrossRef]
- Peckham, R. M.; Handrigan, M. T.; Bentley, T. B.; Falabella, M. J.; Chrovian, A. D.; Stahl, G. L.; Tsokos, G. C. C5-Blocking Antibody Reduces Fluid Requirements and Improves Responsiveness to Fluid Infusion in Hemorrhagic Shock Managed with Hypotensive Resuscitation. J Appl Physiol (1985) 2007, 102 (2), 673–680. [CrossRef]
- Wang, P.; Ba, Z. F.; Reich, S. S.; Zhou, M.; Holme, K. R.; Chaudry, I. H. Effects of Nonanticoagulant Heparin on Cardiovascular and Hepatocellular Function after Hemorrhagic Shock. American Journal of Physiology-Heart and Circulatory Physiology 1996, 270 (4), H1294–H1302. [CrossRef]
- Relja, B.; Wagner, N.; Franz, N.; Dieteren, S.; Mörs, K.; Schmidt, J.; Marzi, I.; Perl, M. Ethyl Pyruvate Reduces Acute Lung Damage Following Trauma and Hemorrhagic Shock via Inhibition of NF-κB and HMGB1. Immunobiology 2018, 223 (3), 310–318. [CrossRef]
- Wagner, N.; Dieteren, S.; Franz, N.; Köhler, K.; Mörs, K.; Nicin, L.; Schmidt, J.; Perl, M.; Marzi, I.; Relja, B. Ethyl Pyruvate Ameliorates Hepatic Injury Following Blunt Chest Trauma and Hemorrhagic Shock by Reducing Local Inflammation, NF-kappaB Activation and HMGB1 Release. PLoS One 2018, 13 (2), e0192171. [CrossRef]
- Yang, R.; Harada, T.; Mollen, K. P.; Prince, J. M.; Levy, R. M.; Englert, J. A.; Gallowitsch-Puerta, M.; Yang, L.; Yang, H.; Tracey, K. J.; Harbrecht, B. G.; Billiar, T. R.; Fink, M. P. Anti-HMGB1 Neutralizing Antibody Ameliorates Gut Barrier Dysfunction and Improves Survival after Hemorrhagic Shock. Mol Med 2006, 12 (4–6), 105–114. [CrossRef]
- Keshari, R. S.; Silasi, R.; Popescu, N. I.; Patel, M. M.; Chaaban, H.; Lupu, C.; Coggeshall, K. M.; Mollnes, T. E.; DeMarco, S. J.; Lupu, F. Inhibition of Complement C5 Protects against Organ Failure and Reduces Mortality in a Baboon Model of Escherichia Coli Sepsis. Proc Natl Acad Sci U S A 2017, 114 (31), E6390–E6399. [CrossRef]
- Morrison, A. M.; Wang, P.; Chaudry, I. H. A NOVEL NONANTICOAGULANT HEPARIN PREVENTS VASCULAR ENDOTHELIAL CELL DYSFUNCTION DURING HYPERDYNAMIC SEPSIS: Shock 1996, 6 (1), 46–51. [CrossRef]
- Dalle Lucca, J. J.; Simovic, M.; Li, Y.; Moratz, C.; Falabella, M.; Tsokos, G. C. Decay-Accelerating Factor Mitigates Controlled Hemorrhage-Instigated Intestinal and Lung Tissue Damage and Hyperkalemia in Swine. J Trauma 2011, 71 (1 Suppl), S151-160. [CrossRef]
- Dalle Lucca, J. J.; Li, Y.; Simovic, M.; Pusateri, A. E.; Falabella, M.; Dubick, M. A.; Tsokos, G. C. Effects of C1 Inhibitor on Tissue Damage in a Porcine Model of Controlled Hemorrhage. Shock 2012, 38 (1), 82–91. [CrossRef]
- CRASH-2 trial collaborators; Shakur, H.; Roberts, I.; Bautista, R.; Caballero, J.; Coats, T.; Dewan, Y.; El-Sayed, H.; Gogichaishvili, T.; Gupta, S.; Herrera, J.; Hunt, B.; Iribhogbe, P.; Izurieta, M.; Khamis, H.; Komolafe, E.; Marrero, M.-A.; Mejía-Mantilla, J.; Miranda, J.; Morales, C.; Olaomi, O.; Olldashi, F.; Perel, P.; Peto, R.; Ramana, P. V.; Ravi, R. R.; Yutthakasemsunt, S. Effects of Tranexamic Acid on Death, Vascular Occlusive Events, and Blood Transfusion in Trauma Patients with Significant Haemorrhage (CRASH-2): A Randomised, Placebo-Controlled Trial. Lancet 2010, 376 (9734), 23–32. [CrossRef]
- Guyette, F. X.; Brown, J. B.; Zenati, M. S.; Early-Young, B. J.; Adams, P. W.; Eastridge, B. J.; Nirula, R.; Vercruysse, G. A.; O’Keeffe, T.; Joseph, B.; Alarcon, L. H.; Callaway, C. W.; Zuckerbraun, B. S.; Neal, M. D.; Forsythe, R. M.; Rosengart, M. R.; Billiar, T. R.; Yealy, D. M.; Peitzman, A. B.; Sperry, J. L.; STAAMP Study Group. Tranexamic Acid During Prehospital Transport in Patients at Risk for Hemorrhage After Injury: A Double-Blind, Placebo-Controlled, Randomized Clinical Trial. JAMA Surg 2020, 156 (1), 11–20. [CrossRef]
- Rowell, S. E.; Meier, E. N.; McKnight, B.; Kannas, D.; May, S.; Sheehan, K.; Bulger, E. M.; Idris, A. H.; Christenson, J.; Morrison, L. J.; Frascone, R. J.; Bosarge, P. L.; Colella, M. R.; Johannigman, J.; Cotton, B. A.; Callum, J.; McMullan, J.; Dries, D. J.; Tibbs, B.; Richmond, N. J.; Weisfeldt, M. L.; Tallon, J. M.; Garrett, J. S.; Zielinski, M. D.; Aufderheide, T. P.; Gandhi, R. R.; Schlamp, R.; Robinson, B. R. H.; Jui, J.; Klein, L.; Rizoli, S.; Gamber, M.; Fleming, M.; Hwang, J.; Vincent, L. E.; Williams, C.; Hendrickson, A.; Simonson, R.; Klotz, P.; Sopko, G.; Witham, W.; Ferrara, M.; Schreiber, M. A. Effect of Out-of-Hospital Tranexamic Acid vs Placebo on 6-Month Functional Neurologic Outcomes in Patients With Moderate or Severe Traumatic Brain Injury. JAMA 2020, 324 (10), 961. [CrossRef]
- Li, S. R.; Guyette, F.; Brown, J.; Zenati, M.; Reitz, K. M.; Eastridge, B.; Nirula, R.; Vercruysse, G. A.; O’Keeffe, T.; Joseph, B.; Neal, M. D.; Zuckerbraun, B. S.; Sperry, J. L. Early Prehospital Tranexamic Acid Following Injury Is Associated With a 30-Day Survival Benefit: A Secondary Analysis of a Randomized Clinical Trial. Annals of Surgery 2021, 274 (3), 419–426. [CrossRef]
- Hannon, J. P.; Bossone, C. A.; Rodkey, W. G. Splenic Red Cell Sequestration and Blood Volume Measurements in Conscious Pigs. Am J Physiol 1985, 248 (3 Pt 2), R293-301. [CrossRef]
- Bebarta, V. S.; Daheshia, M.; Ross, J. D. The Significance of Splenectomy in Experimental Swine Models of Controlled Hemorrhagic Shock. J Trauma Acute Care Surg 2013, 75 (5), 920. [CrossRef]
- Boysen, S. R.; Caulkett, N. A.; Brookfield, C. E.; Warren, A.; Pang, J. M. Splenectomy Versus Sham Splenectomy in a Swine Model of Controlled Hemorrhagic Shock. Shock 2016, 46 (4), 439–446. [CrossRef]
- Kheirabadi, B. S.; Sandeen, J. L.; Dubick, M. A. Re: The Significance of Splenectomy in Experimental Swine Models of Hemorrhagic Shock. J Trauma Acute Care Surg 2013, 75 (5), 920–921. [CrossRef]
- Vnuk, D.; Lemo, N.; Nesek-Adam, V.; Maticić, D.; Radisić, B.; Kos, J.; Rumenjak, V.; Dohan Ehrenfest, D. M. Cardiopulmonary Effects of Hemorrhagic Shock in Splenic Autotransplanted Pigs: A New Surgical Model. Coll Antropol 2010, 34 (3), 923–930.
- Bellamy, R. F.; Maningas, P. A.; Wenger, B. A. Current Shock Models and Clinical Correlations. Ann Emerg Med 1986, 15 (12), 1392–1395. [CrossRef]
- Pottecher, J.; Chemla, D.; Xavier, L.; Liu, N.; Chazot, T.; Marescaux, J.; Fischler, M.; Diemunsch, P.; Duranteau, J. Re: The Significance of Splenectomy in Experimental Swine Models of Hemorrhagic Shock. J Trauma Acute Care Surg 2013, 75 (5), 921–922. [CrossRef]
- Sondeen, J. L.; Dubick, M. A.; Holcomb, J. B.; Wade, C. E. Uncontrolled Hemorrhage Differs from Volume- or Pressure-Matched Controlled Hemorrhage in Swine. Shock 2007, 28 (4), 426–433. [CrossRef]
- Sondeen, J. L.; Prince, M. D.; Kheirabadi, B. S.; Wade, C. E.; Polykratis, I. A.; de Guzman, R.; Dubick, M. A. Initial Resuscitation with Plasma and Other Blood Components Reduced Bleeding Compared to Hetastarch in Anesthetized Swine with Uncontrolled Splenic Hemorrhage. Transfusion 2011, 51 (4), 779–792. [CrossRef]
- Batchinsky, A. I.; Jordan, B. S.; Necsoiu, C.; Dubick, M. A.; Cancio, L. C. DYNAMIC CHANGES IN SHUNT AND VENTILATION-PERFUSION MISMATCH FOLLOWING EXPERIMENTAL PULMONARY CONTUSION. Shock 2010, 33 (4), 419–425. [CrossRef]
- Weeks, C.; Moratz, C.; Zacharia, A.; Stracener, C.; Egan, R.; Peckham, R.; Moore, F. D.; Tsokos, G. C. Decay-Accelerating Factor Attenuates Remote Ischemia-Reperfusion-Initiated Organ Damage. Clin Immunol 2007, 124 (3), 311–327. [CrossRef]



| Group | ||||
|---|---|---|---|---|
| Sham | H | H + LR | H+Voluven | |
| n | 9 | 13 | 12 | 6 |
| Body weight (kg) | 39.4±1.1 | 38.2±0.6 | 39.1±0.8 | 40.8±1.7 |
| Controlled SBV (ml/kg) | 22 | 22 | 22 | 22 |
| Uncontrolled SBV (ml/kg) | ||||
| At time 30 | N/A | 11.1±1.0 | 7.8±0.9 | 10.1±1.5 |
| 60 | N/A | 12.7±1.1 | 10.7±2.4 | 13.9±1.8 |
| 90 | N/A | 12.7±1.1 | 8.6±1.0 | 16.1±2.3‡ |
| 120 | N/A | 12.5±1.6 | 8.6±1.0 | 17.5±2.7‡ |
| 360min | N/A | 13.7±1.0 | 11.0±2.3 | 18.3±2.8‡ |
| PP (mmHg) | ||||
| Baseline | 26.7±2.1 | 28.7±3.2 | 29.1±2.8 | 28.8±1.8 |
| at time 30 | 28.5±1.7 | 20.1±2.9 | 17.7±2.7* | 19.7±4.0* |
| 60 | 29.1±1.3 | 21.5±3.1 | 22.0±2.6 | 27.8±3.1 |
| 90 | 27.2±1.5 | 14.3±1.5 | 22.0±3.3 | 28.0±2.6† |
| 120 min | 26.0±1.5 | 16.3±3.8 | 21.3±3 | 24.6±3.9 |
| MAP (mmHg) | ||||
| Baseline | 63.4±2.5 | 62.6±3.2 | 63.4±3.1 | 60.8±1.6 |
| at time 30 | 65.1±1.3 | 38.7±2.3* | 39.5±3.8* | 32.2±4.1* |
| 60 | 63.3±1.4 | 37.9±2.2* | 44.6±2.8* | 44.3±1.5* |
| 90 | 62.4±1.9 | 29.6±1.9* | 44.1±1.9*† | 43.0±1.3* |
| 120 min | 63.4±1.8 | 26.9±2.2* | 43.0±1.6*† | 38.1±3.7* |
| Shock index (bpm/mmHg) | ||||
| Baseline | 1.3±0.1 | 1.4±0.2 | 1.3±0.1 | 1.3±0.1 |
| at time 30 | 1.4±0.1 | 4.5±0.3* | 5.2±1.2* | 4.8±0.7* |
| 60 | 1.5±0.1 | 4.5±0.2* | 3.5±0.4* | 3.2±0.1*† |
| 90 | 1.5±0.1 | 5.4±0.5* | 3.2±0.2*† | 3.1±0.1*† |
| 120 min | 1.6±0.1 | 5.3±0.2* | 3.4±0.2*† | 3.3±0.1*† |
| Group | ||||
|---|---|---|---|---|
| Sham | H | H + LR | H+Voluven | |
| n | 9 | 14 | 12 | 6 |
| pH: Baseline | 7.4±0.0 | 7.4±0.0 | 7.4±0.0 | 7.4±0.0 |
| at time 30 | 7.4±0.0 | 7.4±0.0 | 7.4±0.0 | 7.4±0.0 |
| 60 | 7.4±0.0 | 7.4±0.0 | 7.4±0.0 | 7.4±0.0 |
| 90 | 7.5±0.0 | 7.4±0.0 | 7.4±0.0 | 7.4±0.0 |
| 120 min | 7.5±0.0 | 7.4±0.0 | 7.4±0.02 | 7.4±0.1 |
| Base excess (mmol/L): Baseline | 5.3±0.8 | 6.2±0.6 | 5.2±1.0 | 6.7±0.8 |
| at time 30 | 6.3±0.9 | 2.5±0.6* | 2.8±0.7 | 0.4±1* |
| 60 | 5.9±0.8 | -0.7±1.0* | 1.8±1.0* | 1.6±0.9* |
| 90 | 6.1±1.0 | -3.4±2.2* | 3.5±1.0† | 3.2±1.2† |
| 120 min | 7.1±0.9 | -3.7±1.7* | 4.0±1.1† | 4.0±1.4† |
| Lactate (mmol/L): Baseline | 2.2±0.2 | 2.0±0.1 | 2.2±0.2 | 2.0±0.2 |
| at time 30 | 1.9±0.1 | 4.1±0.2* | 3.3±0.2 | 5.3±0.6* |
| 60 | 1.7±0.1 | 6.6±0.6* | 5.1±0.8* | 5.5±0.4* |
| 90 | 1.7±0.2 | 8.9±1.9* | 4.3±0.7*† | 4.9±0.4*† |
| 120 min | 1.5±0.2 | 9.3±1.5* | 3.8±0.6*† | 5.2±0.8*† |
| SvO2 (%): Baseline | 79.0±3.3 | 73.4±2.4 | 76.0±1.2 | 79.4±2.2 |
| at time 30 | 79.4±2.2 | 54.3±6.5* | 52.2±6.5* | 66.5±6.4 |
| 60 | 78.2±2.5 | 62.1±6.5 | 59.1±3.7* | 71.7±4.2 |
| 90 | 74.4±1.4 | 71.3±7.4 | 54.2±5.6* | 71.8±4.3 |
| 120 min | 77.1±2.6 | 49.4±10.4* | 56.5±4.8* | 67.3±6.1 |
| Hemoglobin (g/dl): Baseline | 8.3±0.3 | 8.4±0.17 | 8.6±0.2 | 8.1±0.2 |
| at time 30 | 8.1±0.4 | 8.31±0.23 | 8.6±0.4 | 7.8±0.4 |
| 60 | 8±0.4 | 8.25±0.27 | 6.9±0.6* | 4.5±0.4* |
| 90 | 7.9±0.3 | 6.6±1.0 | 6.3±0.6 | 4.6±0.5‡† |
| 120min | 8.3±0.3 | 7.1±0.7 | 6.7±0.37† | 4.4±0.4†* |
| Hct (%): Baseline | 24.5±1.06 | 24.7±0.5 | 25.4±0.6 | 23.8±0.8 |
| at time 30 | 25.2±1.2 | 24.5±0.7 | 25.3±1.2 | 23.0±1.2 |
| 60 | 24.2±1.4 | 23.2±1.3 | 19.4±1.8 | 13.2±1.0*†‡ |
| 90 | 23.5±1.2 | 19.4±2.8 | 18.4±1.6 | 12.8±1.4*†‡ |
| 120min | 25.2±1.2 | 21.0±2.1 | 19.7±1.1* | 12.4±1.1*†‡ |
| Potassium (mmol/L): Baseline | 4.1±0.0 | 4.0±0.1 | 3.9±0.1 | 3.9±0.1 |
| at time 30 | 4.2±0.1 | 4.7±0.1 | 4.6±0.3 | 5.1±0.3* |
| 60 | 4.2±0.1 | 5.1±0.2* | 4.4±0.3† | 3.8±0.1† |
| 90 | 4.4±0.1 | 5.2±0.4 | 4.4±0.1 | 4.3±0.1 |
| 120 min | 4.5±0.1 | 6.2±0.7* | 4.6±0.1† | 4.8±0.1† |
Disclaimer/Publisher’s Note: The statements, opinions and data contained in all publications are solely those of the individual author(s) and contributor(s) and not of MDPI and/or the editor(s). MDPI and/or the editor(s) disclaim responsibility for any injury to people or property resulting from any ideas, methods, instructions or products referred to in the content. |
© 2023 by the authors. Licensee MDPI, Basel, Switzerland. This article is an open access article distributed under the terms and conditions of the Creative Commons Attribution (CC BY) license (http://creativecommons.org/licenses/by/4.0/).


