Submitted:
16 December 2023
Posted:
18 December 2023
You are already at the latest version
Abstract
Keywords:
1. Introduction
2. Materials and Methods
2.1. Bean leaves
2.2. Bromathological and phytochemical characterization of the common bean leaves
2.2.1. Bromatological characterization of the common bean leaves
2.2.2. Extraction of phenolic compounds
2.2.3. Determination of total phenols
2.2.4. Determination of total flavonoids
2.2.5. Quantification of condensed tannins
2.2.6. Quantification of total saponins
2.2.7. Identification and quantification of phenolic and flavonoids in bean leaves by UPLC-ESI-MS/MS
2.3. Experimental design
2.3.1. Experimental animals
2.3.2. Design of diets for experimental animals
2.3.3. Energy and nutritional content of diets
2.3.4. Experimental design
2.4. Changes in body composition from the consumption of bean leaves and the change to a healthy diet.
2.4.1. Body composition
2.4.2. Quantification of adipose tissue
2.5. Role of bean leaves consumption and the change to a healthy diet in lipid metabolism.
2.5.1. Determination of the content of total cholesterol and triglycerides in serum.
2.5.2. Total lipids and triglycerides in feces
2.5.3. Pancreatic lipase activity in vitro
2.6. Euthanasia
2.7. Impact of bean leaves consumption and healthy diet change on intestinal integrity and metabolic endotoxemia.
2.7.1. Intestinal permeability by the FITC-dextran assay
2.7.2. Histopathological and morphometric analysis of jejunum and proximal colon
2.7.3. Determination of LPS and IL-6 levels in serum
2.8. Statistical analysis
3. Results
3.1. Quantification of dietary fiber and phytochemical compounds.
3.2. Effect of bean leaves on energy intake
3.3. Treatment with bean leaves and its effect on body composition
3.3.1. Body weight and the increase in the abdominal circumference.
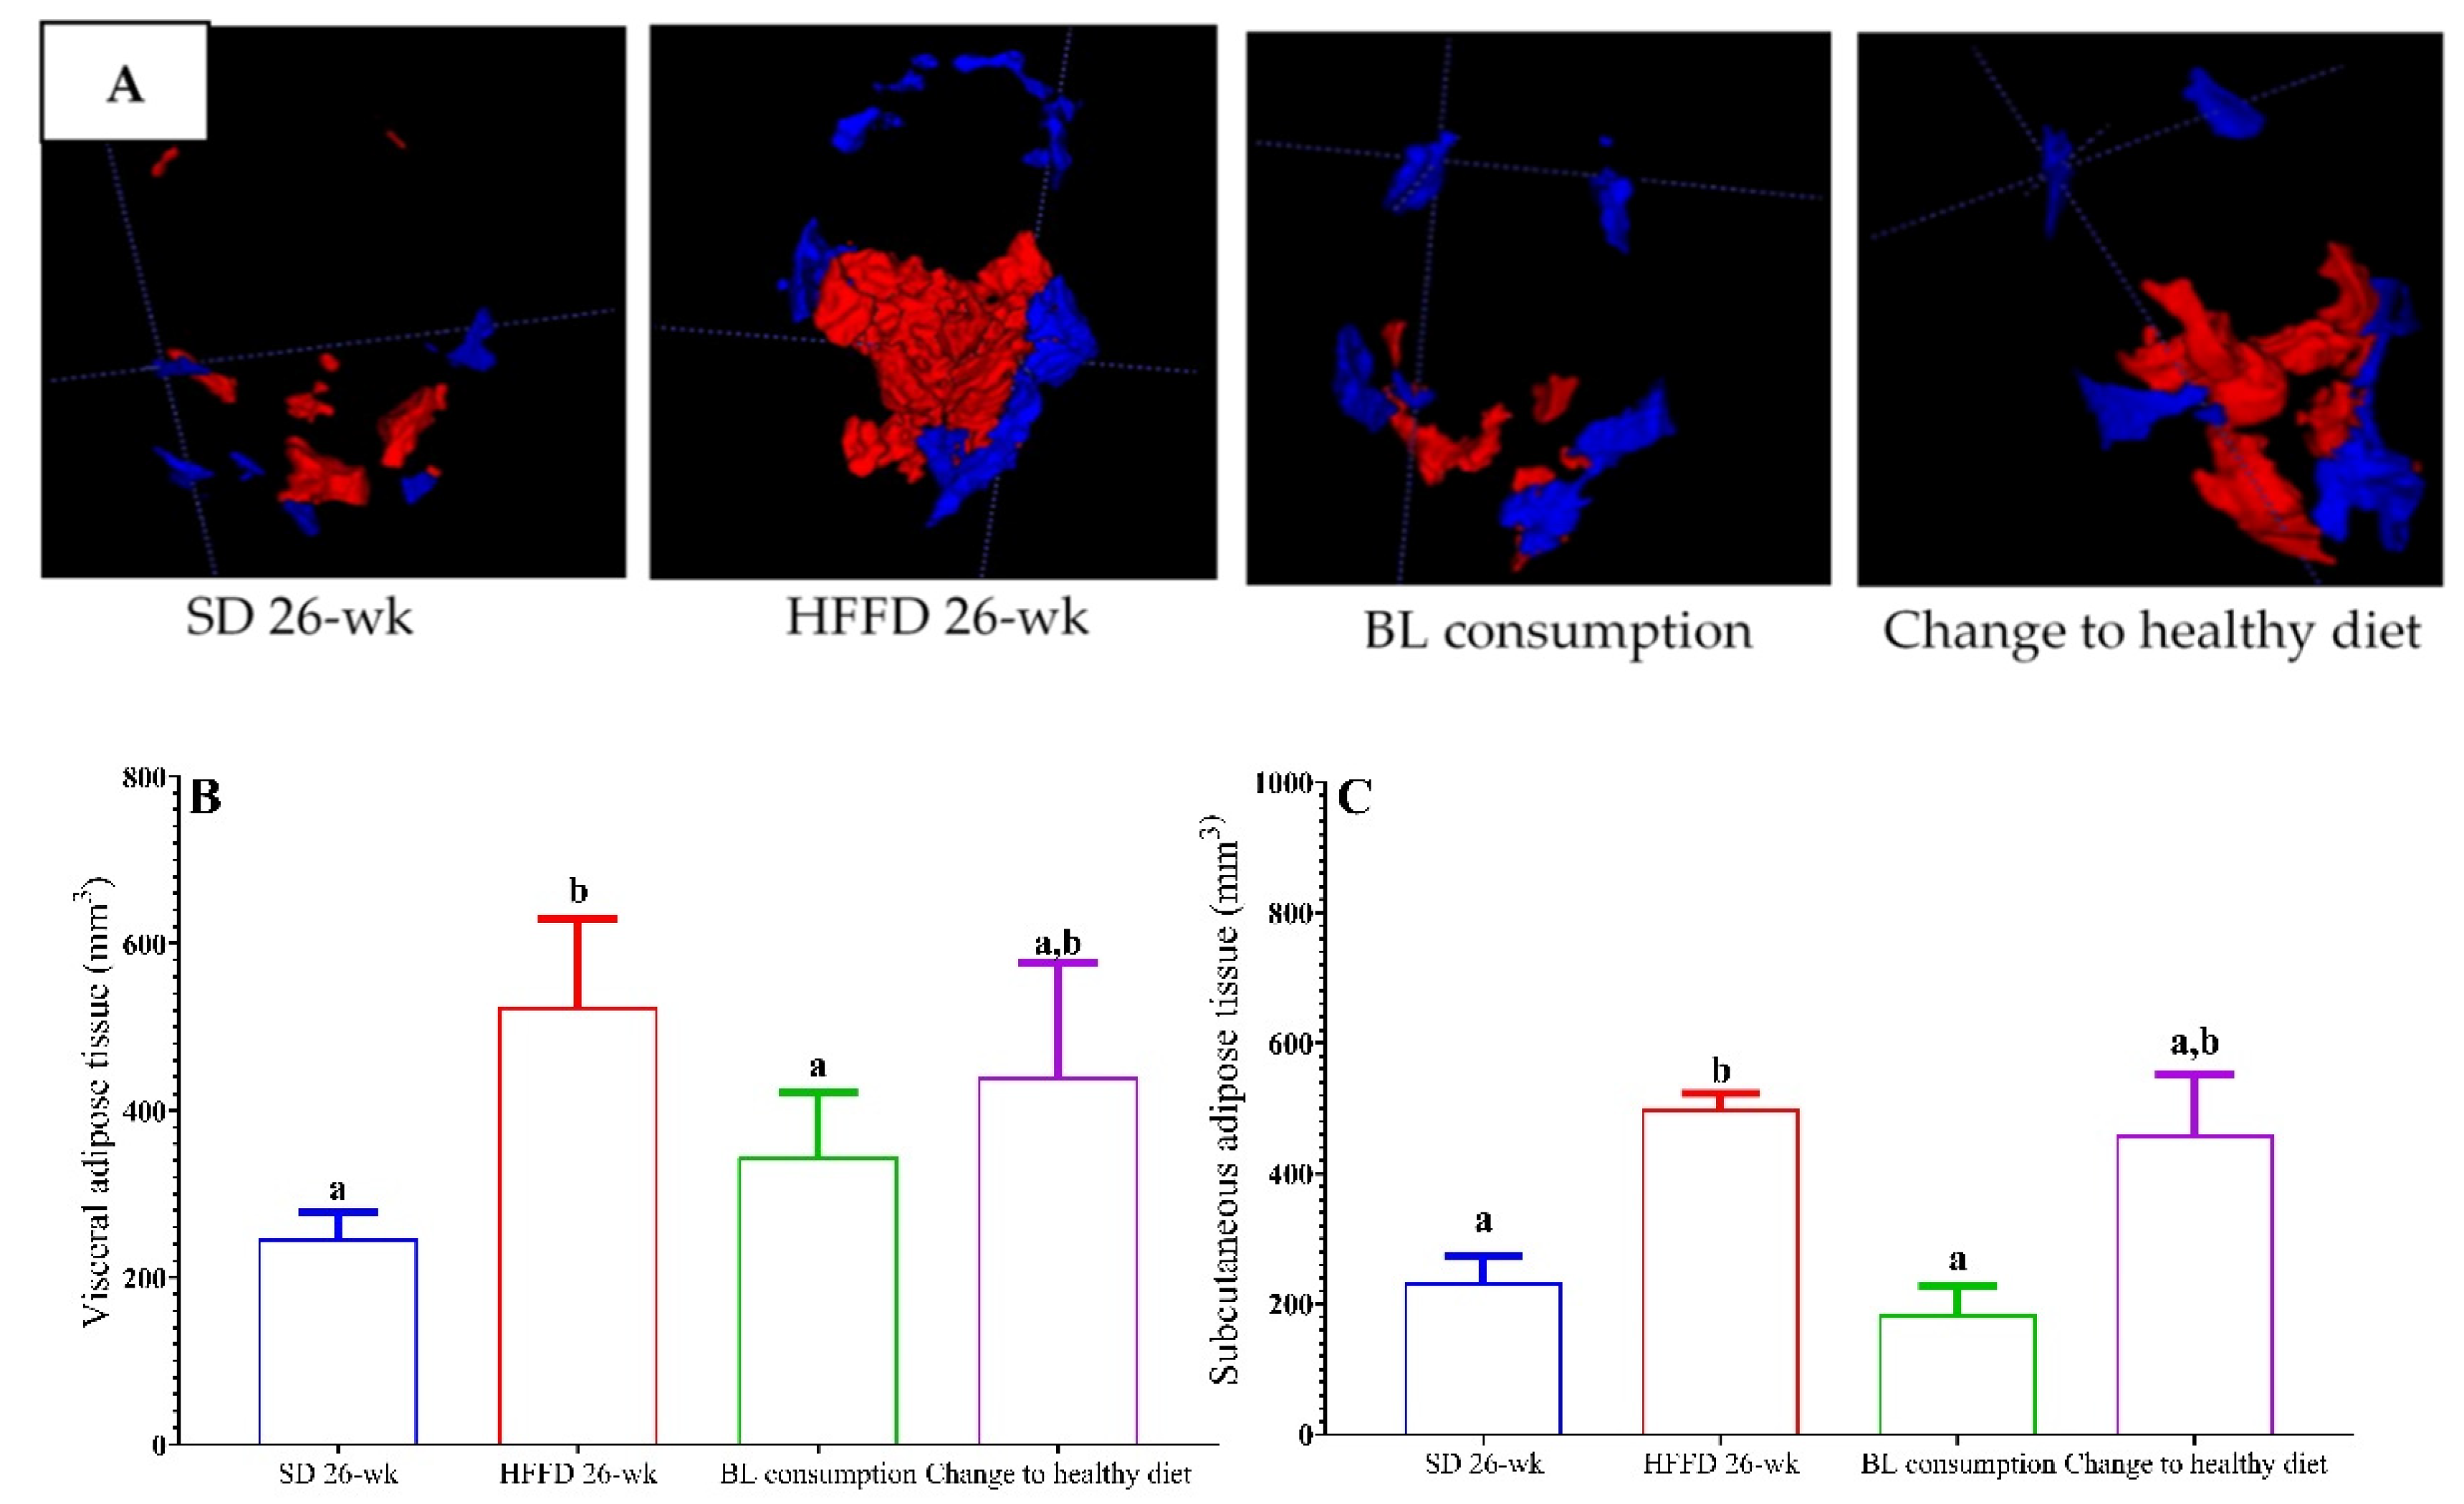
3.3.2. Determination of volume adipose tissue.
3.4. Impact of the consumption of different diets on the lipid profile.
3.4.1. Serum cholesterol and triglycerides concentration.
3.4.2. Lipid excretion
3.4.3. Inhibition of pancreatic lipase in vitro.
3.5. Changes in morphometry and histopathology in the intestine and colon
3.5.1. Relative weight and length of the small intestine and colon.
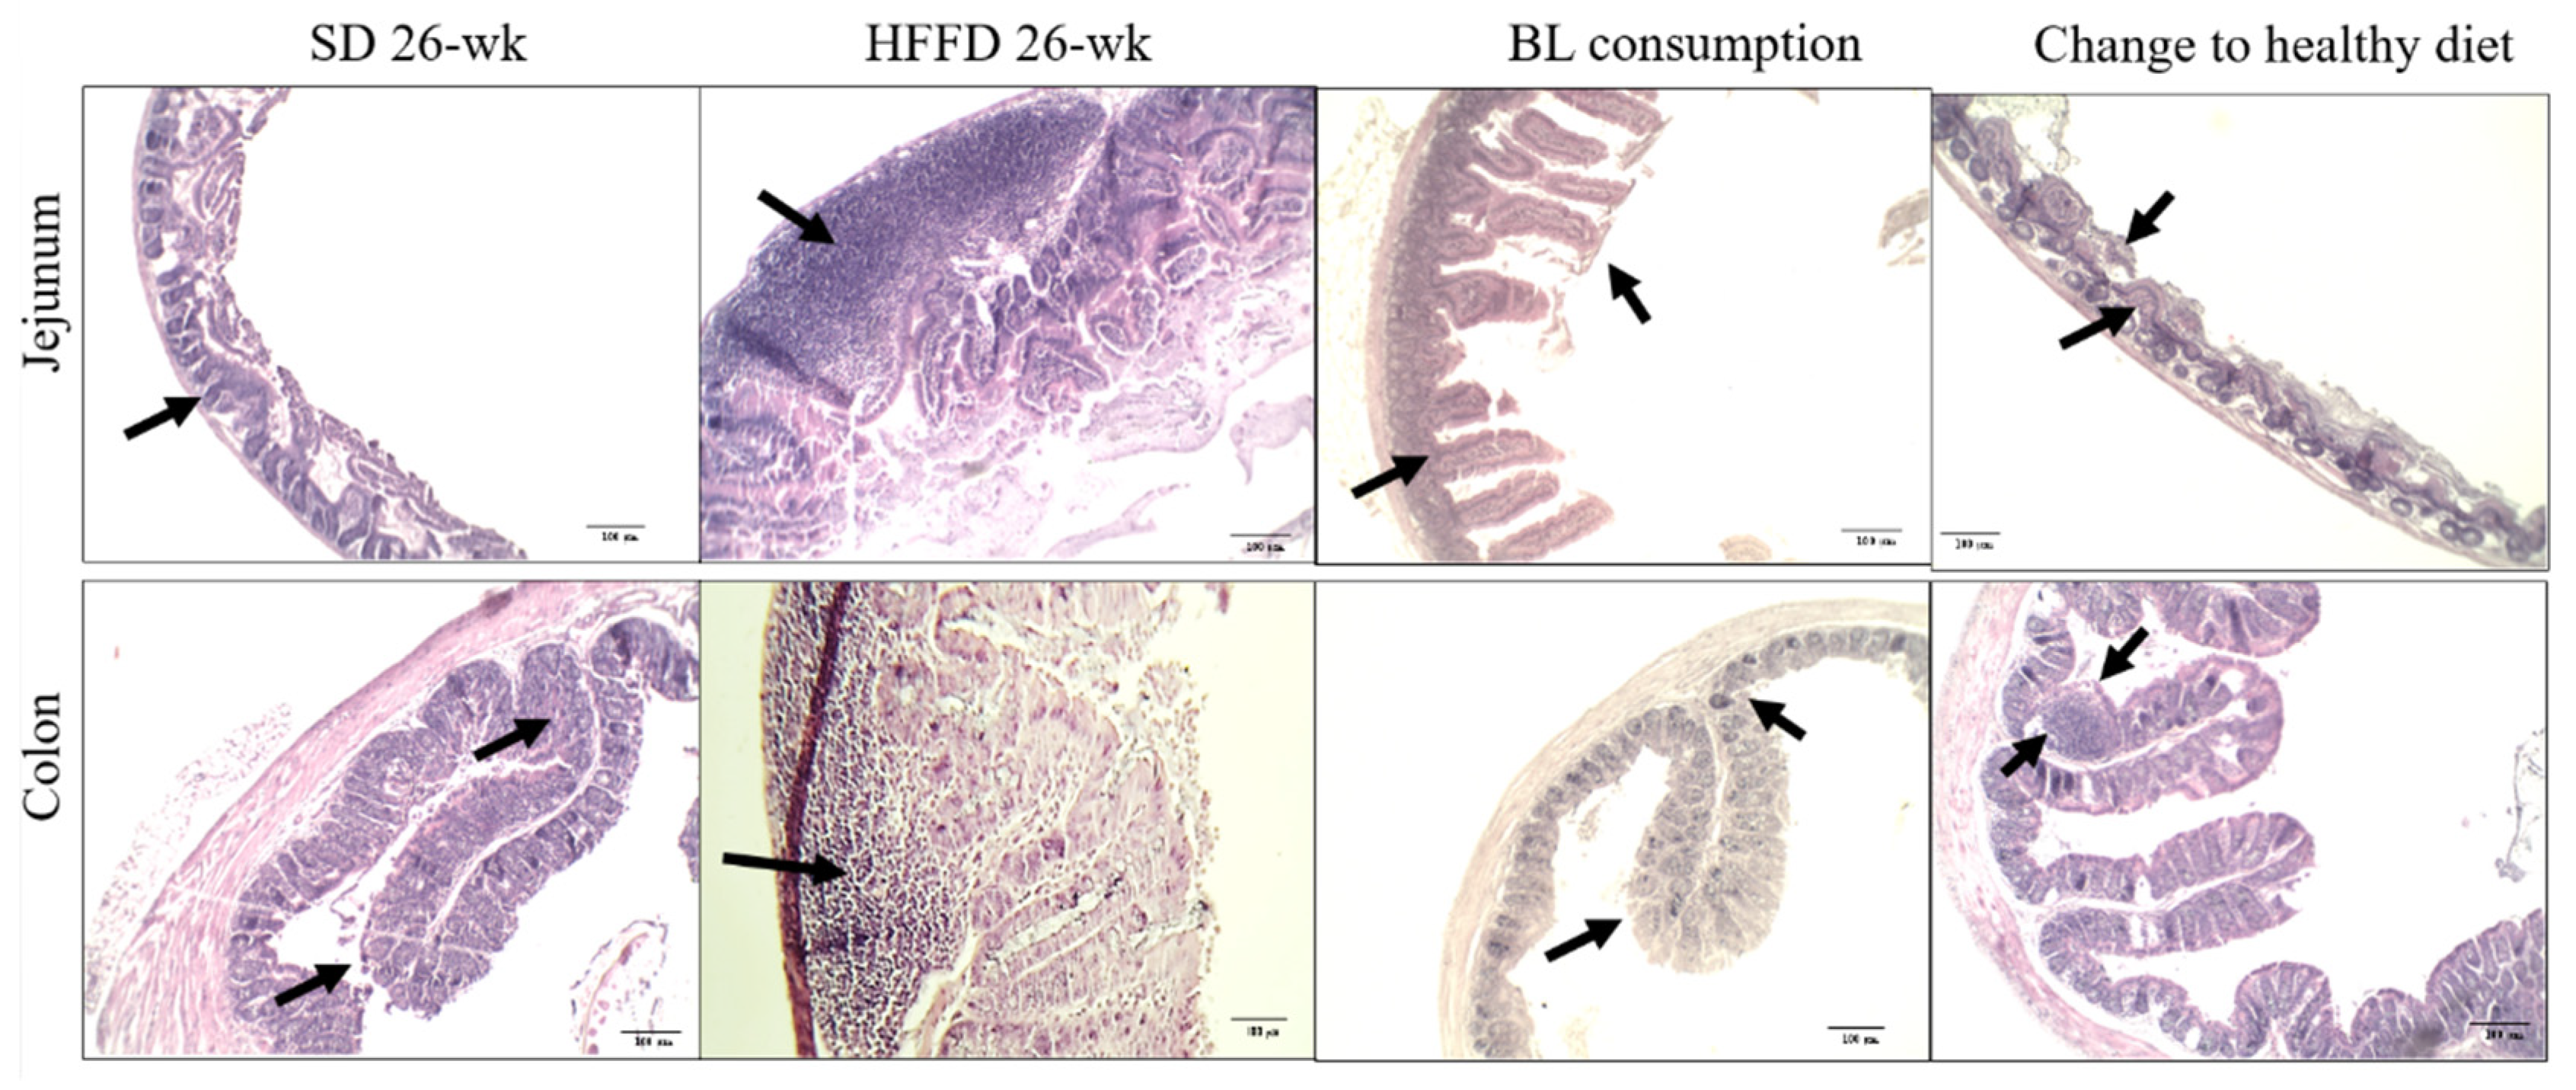
3.5.2. Histological change in intestine and colon.
3.6. Intestinal permeability and metabolic endotoxemia.
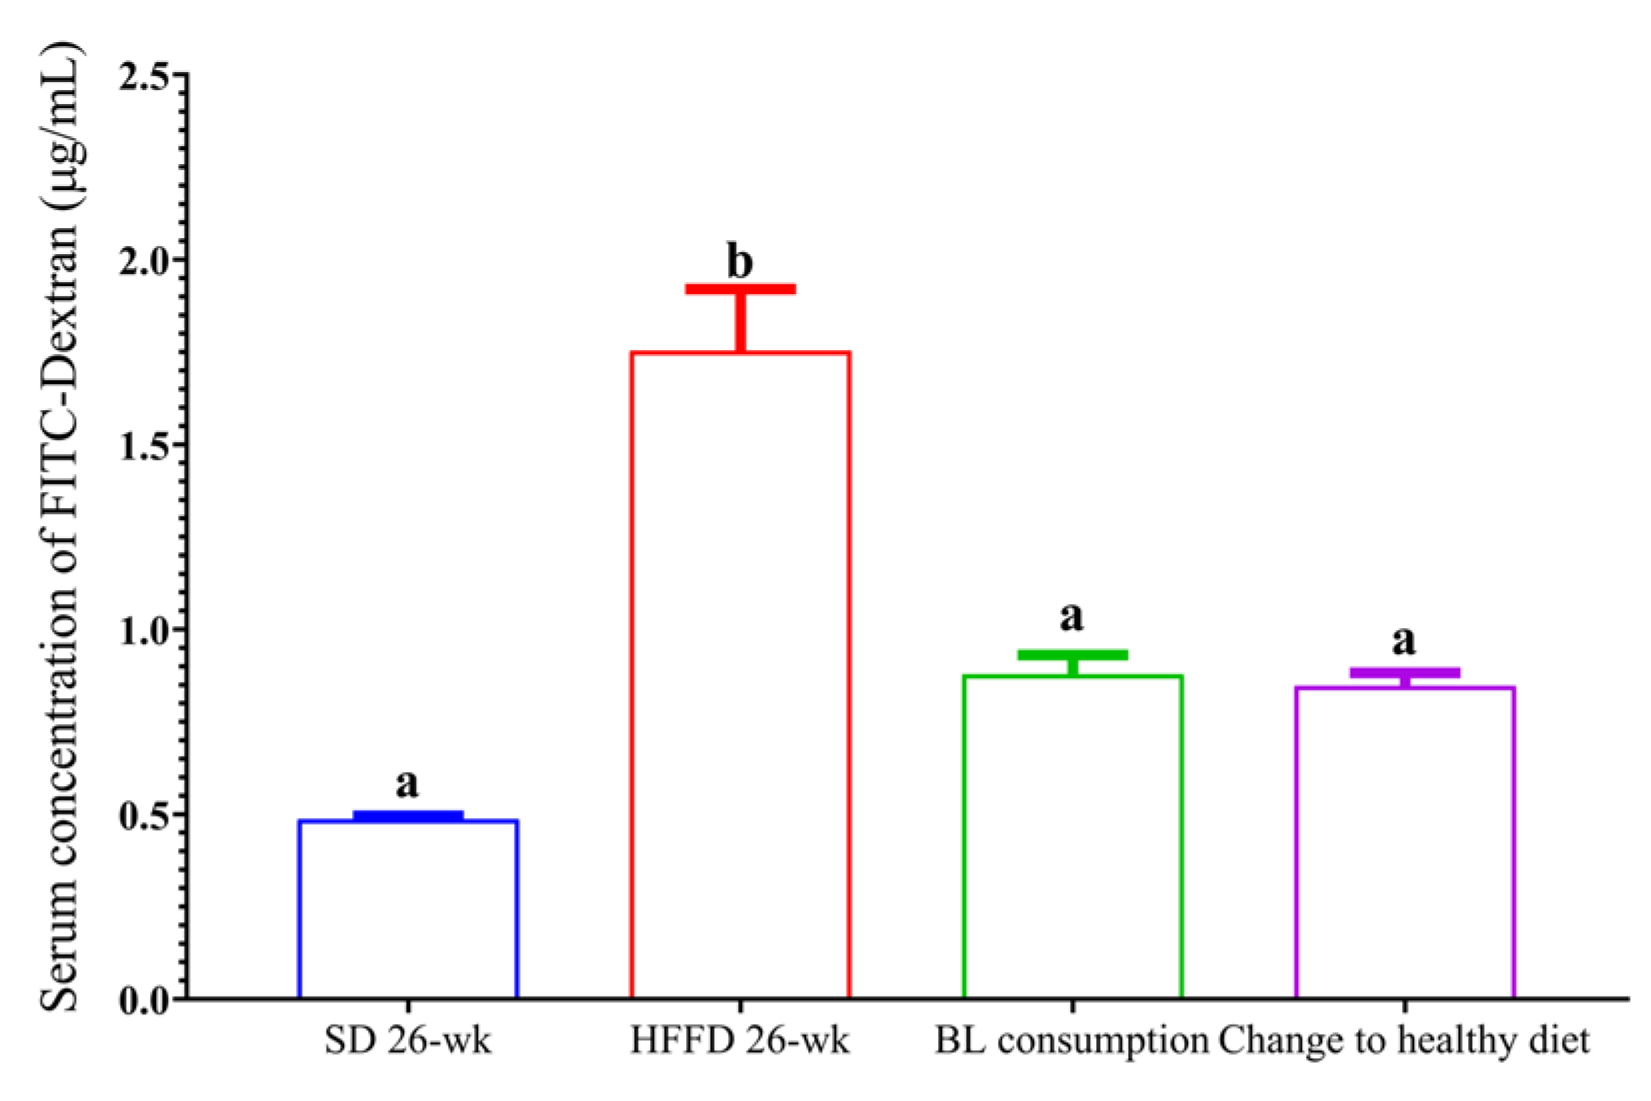
3.6.1. Intestinal permeability.
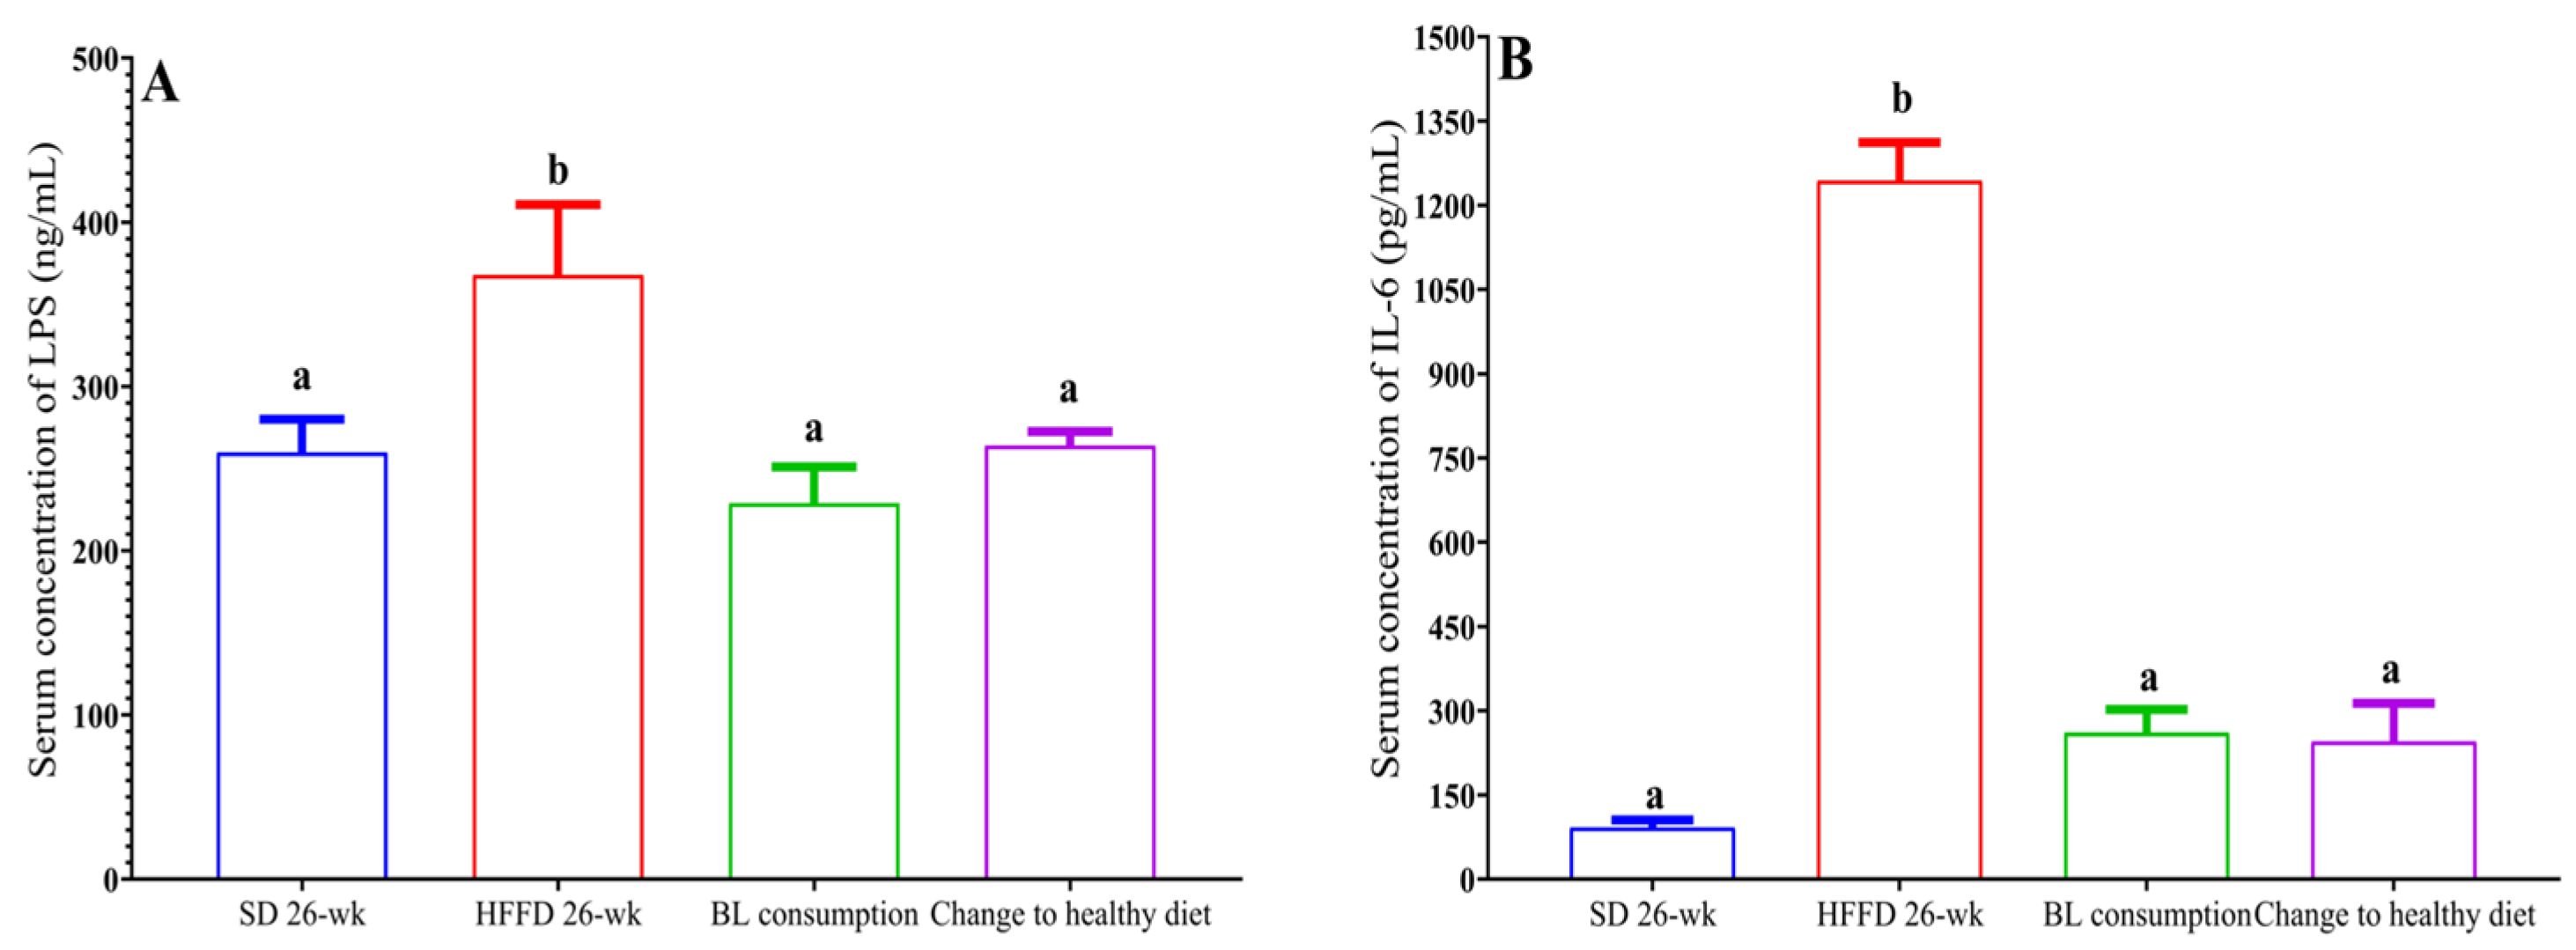
3.6.2. Metabolic endotoxemia and inflammation
3.6.3. Intake of dietary fiber and total phenols.
4. Discussion
5. Conclusions
Author Contributions
Funding
Institutional Review Board Statement
Data Availability Statement
Acknowledgments
Conflicts of Interest
References
- Kim, S.J.; Kim, S-E.; Kim, A-R.; Kang, S.; Park, M-Y.; Sung, M-K. Dietary fat intake and age modulate the composition of the gut microbiota and colonic inflammation in C57BL/6J mice. BMC Microbiol. 2019; 19, 1–11. [CrossRef]
- Bouwman, M.S.; Nieuwenhuizen, A.G.; Swarts, J.M.; Piga, R.; van Schothorst, E.M.; Keijer, J. Metabolic effects of the dietary monosaccharides fructose, fructose–glucose, or glucose in mice fed a starch-containing moderate high–fat diet. Physiol Rep. 2020; 8, 1–12. [CrossRef]
- Pérez-Campos Mayoral, L.; Mayoral Andrade, G.; Pérez-Campos Mayoral, E.; Hernandez Huerta, T.; Pia Canseco, S.; Rodal Canales, F.J.; Cabrera-Fuentes, H.A.; Martinez Cruz, M.; Pérez Santiago, A.D.; Alpuche, J.J.; Zentero, E.; Martinez Ruiz, H.; Martinez Cruz, R.; Hernandez Jeronimo, J.; Perez-Campos, E. Obesity subtypes, related biomarkers & heterogeneity. Indian J Med Res. 2020;151, 11–21. [CrossRef]
- Agustí, A.; García-Pardo, M.P.; López-Almela, I.; Campillo, I.; Maes, M.; Romani-Perez, M.; Sanz, Y. Interplay between the gut-brain axis, obesity and cognitive function. Front Neurosci. 2018; 12, 1–17. [CrossRef]
- Horne, R.G.; Yu, Y.; Zhang, R.; Abdalqadir, N.; Rossi, L.; Surette, M.; Sherman, P.M.; Adeli, K. High fat-high fructose diet-induced changes in the gut microbiota associated with dyslipidemia in Syrian hamsters. 2020, 12, 1–20. [CrossRef]
- Soares, A.; Beraldi, E.J.; Ferreira, P.E.; Bazotte, R.B.; Buttow, N.C. Intestinal and neuronal myenteric adaptations in the small intestine induced by a high-fat diet in mice. BMC Gastroenterol. 2015; 15, 1-9. [CrossRef]
- Dailey, M.J. Nutrient-induced intestinal adaption and its effect in obesity. Physiol Behav. 2014;0, 74–78. [CrossRef]
- Álvarez, J.; Fernández Real, J.M.; Guarner, F.; Guelmonde, M.; Rodriguez, J.M.; Saens de Pipaon, M.; Sanz, Y. Gut microbes and health. Gastroenterol Hepatol. 2021; 44, 519–535. [CrossRef]
- Organización Mundial de la Salud (OMS). (2018). Dieta saludable. Página web. Recuperado, Junio 2022. Available online: https://www.who.int/es/news-room/fact-sheets/detail/healthy-diet.
- SAGARPA. Planeación agrícola nacional 2017-2030. Frijol mexicano. Secretaría de Agricultura, Ganadería, Desarrollo rural, Pesca y Alimentación. 2017. México. Recuperado junio 2022. Available online: https://docplayer.es/83182578-Planeacion-agricola-nacional-frijol.html.
- Mateos-Maces, L.; Chávez-Servia, J.L.; Vera-Guzmán, A.M.; Aquino-Bolaños, E.N.; Alba-Jiménez, J.E.; Villagómez-González, B.B. Edible leafy plants from Mexico as sources of antioxidant compounds, and their nutritional, nutraceutical and antimicrobial potential: A review. Antioxidants, 2020, 9, 1–24. [Google Scholar] [CrossRef] [PubMed]
- Becerril-Campos, A.A.; Ocampo-Anguiano, P. V.; Mondragón-Jacobo, C.; Escobar-García, K.; Camacho-Barrón, M.; Anaya-Loyola, M.A.; Feregrino-Pérez, AA; García-Gasca, G.; Ahumada-Solórzano, S.M. Phaseolus vulgaris L. leaves increase short-chain fatty acid (SCFA) production, ameliorating early metabolic alterations. Plant Foods Hum Nutr. 2022; 77, 421–426. [CrossRef]
- Martinez-Zavala, M.; Mora-Avilés, M.A.; Anaya-Loyola, M.A.; Guzmán-Maldonado, O.; Aguilera-Barreyro, A.; Blanco-Labra, A.; García-Gasca, T. Common bean leaves as a source of dietary iron. Plant Foods Hum Nutr. 2016: 71, 1–6. [CrossRef]
- Becerril-Campos, A.A.; Ramos-Gómez, M.; de los Ríos-Arellano, E.A.; Ocampo-Anguiano, P.V.; Gónzalez-Gallardo, A.; Macotela, Y.; García-Gasca, T.; Ahumada-Solórzano, S.M. Bean leaves ameliorate lipotoxicity in fatty liver disease. Nutrients. 2023; 15, 1–23. [CrossRef]
- Heredia-Ortega, J.; Aguilera, T.; Resis, M.; Bernal, K. Fibra dietética total: métodos de determinación en pastas de oleaginosas. Facultad de Ciencias Naturales UAQ. 2020, 91–102. [Google Scholar]
- Herrera-Rocha, K.M.; Rocha-Guzmán, N.E.; Gallegos-Infante, J.A.; González-Laredo, R.F.; Larrosa-Pérez, M.; Moreno-Jiménez, M.R. Phenolic acids and flavonoids in acetonic extract from quince (Cydonia oblonga Mill.): Nutraceuticals with antioxidant and anti-inflammatory potential. Molecules. 2022; 27, 1–14. [CrossRef]
- Baek, S.; Choi, N.H.; Lee, K.P.; Jhun, H.; Kim, J. Smallanthus sonchifolius leaf attenuates neuroinflammation. J Exerc Nutr Biochem 2018, 22, 31–35. [Google Scholar] [CrossRef] [PubMed]
- Singleton, V.; Rosi, J. Colorimetry of total phenolics with phosphomolybdic-phosphotungstic acid reagents. Am J Enol Vitic. 1965; 16, 58–144. [CrossRef]
- Campos-Vega, R.; Reynoso-Camacho, R.; Pedraza-Aboytes, G.; Acosta Gallegos, J.A.; Guzmán-Maldonado, S.H.; Paredes López, O.; Oomah, B.D.; Loarca-Piña, G. Chemical composition and in vitro polysaccharide fermentation of different beans (Phaseolus vulgaris L.). J Food Sci. 2009; 74, 59–65. [CrossRef]
- Feregrino-Pérez, A.A.; Berumen, L.C.; García-Alcocer, G.; Guevara-Gonzalez, R.G.; Ramos-Gomez, M.; Reynoso-Camacho, R.; Acosta-Gallegos, J.A.; Loarca-Piña, G. Composition and chemopreventive effect of polysaccharides from common beans (Phaseolus vulgaris L.) on azoxymethane-induced colon cancer. J Agric Food Chem. 2008; 56, 8737–8744. 8744. [CrossRef]
- Dini, I.; Tenore, G.C.; Dini, A. Saponins in ipomoea batatas tubers: Isolation, characterization, quantification and antioxidant properties. Food Chem. 2009; 113, 411–419. [CrossRef]
- Buettner, R.; Schölmerich, J.; Bollheimer, LC. High-fat diets: modeling the metabolic disorders of human obesity in rodents. Obesity 2007, 15, 798–808. [CrossRef]
- Martínez-Orozco, H.; Reyes-Castro, L.A.; Lomas-Soria, C.; Sandoval-Salazar, C.; Ramírez-Emiliano, J.; Díaz-Cintra, S.; Solís-Ortiz, S. High-fat and combined high-fat–high-fructose diets impair episodic-like memory and decrease glutamate and glutamine in the hippocampus of adult mice. Nutr Neurosci 2022, 25, 2479-2489. [CrossRef]
- Kraus, D.; Yang, Q.; Kahn, B. Lipid Extraction from Mouse Feces. BIO-PROTOCOL. 2015; 5, 1–5. 5. [CrossRef]
- Pérez-Ramírez, I.F.; González-Dávalos, M.L.; Mora, O.; Gallegos-Corona, M.A; Reynoso-Camacho, R. Effect of Ocimum sanctum and Crataegus pubescens aqueous extracts on obesity, inflammation, and glucose metabolism. J Funct Foods. 2017; 35, 24–31. [CrossRef]
- Shi, H.; Wang, Q.; Zheng, M.; Hao, S.; Lum, J.S.; Chen, X.; Huang, X.F.; Yu, Y.; Zheng, K. Supplement of microbiota-accessible carbohydrates prevents neuroinflammation and cognitive decline by improving the gut microbiota-brain axis in diet-induced obese mice. J Neuroinflammation. 2020; 17, 1–21. [CrossRef]
- van de Wouw, M.; Boehme, M.; Lyte, J.M.; Wiley, N.; Strain, C.; O’Sullivan, O.; Clarke, G.; Stanton, C.; Dinan, T.G.; Cryan, J.F. Short-chain fatty acids: microbial metabolites that alleviate stress-induced brain–gut axis alterations. J Physiol. 2018; 596, 4923–4944. [CrossRef]
- Quesenberry KE, Carpenter JW. Rats and mice. In Book Ferrets, rabbits and todents: Clinical medicine and surgery. 4th ed.; Elsevier; United States, 2012, pp. 345–365.
- Martinez, K.B.; Mackert, J.D.; McIntosh, M.K. Chapter 18: Polyphenols and Intestinal Health. Editor: Ronald Ross Watson, Academic Press; United States, 2017, pp. 191–210. [CrossRef]
- Yoon, D.S.; Cho, S.Y.; Yoon, H.J.; Kim, S.R.; Jung, U.J. Protective effects of p-coumaric acid against high-fat diet-induced metabolic dysregulation in mice. Biomed Pharmacother. 2021;142, 1–8. [CrossRef]
- Jihyeon, Y.; Chu-Sook, K.; Thai Hien, T.; Min-Seon, K.; Tsuyoshi, G.; Teruo, K.-, Myug-Sook, C.; Taesun, P.; Mi-Kyung, S.; Jong Won, y.; Suck-Young, C.; Jee Hye, L.; Yeonsoo, J.; Hye-Seon, C.; Sung Hoon, B.; Hun Taeg, C.; Rina, Y. Quercetin protects obesity-induced hypothalamic inflammation by reducing microglia-mediated inflammatory responses via HO-1 induction. Nutrients. 2017; 9, 1–14. Nutrients. [CrossRef]
- Alkhalidy, H.; Moore, W.; Wang, A.; Luo, J.; McMillan, P.; Wang, Y.; Zhen, W.; Hulver, M.T.; Liu, D. Kaempferol ameliorates hyperglycemia through suppressing hepatic gluconeogenesis and enhancing hepatic insulin sensitivity in diet-induced obese mice. J Nutr Biochem. 2018; 58, 1–25. [CrossRef]
- Wang, T.; Wu, Q.; Zhao, T. Preventive effects of kaempferol on high-fat diet-induced obesity complications in C57BL/6 Mice. Biomed Res Int. 2020; 2020, 1–20. [CrossRef]
- Bian, Y.; Lei, J.; Zhong, J.; Wang, B.; Wan, Y.; Li, J.; Liao, C.; He, W.; Liu, Z.; Ito, K.; Zhang, B. Kaempferol reduces obesity, prevents intestinal inflammation, and modulates gut microbiota in high-fat diet mice. J Nutr Biochem. 2022; 99, 1–11. [CrossRef]
- Santiago-Saenz, Y.O.; Hernández-Fuentes, A.D.; López-Palestina, C.U.; Garrido-Cauich, J.H.; Alatorre-Cruz, L.M.; Monroy-Torres, R. Nutritional importance and biological activity of compounds from quelites consumed in Mexico. Rev. Chil. Nutr. 2019; 46, 593–605. [CrossRef]
- Sallam, I.E.; Abdelwareth, A.; Attia, H.; Aziz, R.K.; Homsi, M.N.; von Bergen, M.; Farag, M.A. Effect of gut microbiota biotransformation on dietary tannins and human health implications. Microorganisms. 2021; 9, 1-34. [CrossRef]
- Toney, A.M.; Albusharif, M.; Works, D.; Polenz, L.; Schlange, S.; Chaidez, V.; Ramer-Tait, A. E.; Chung, S. Differential effects of whole red raspberry polyphenols and their gut metabolite urolithin a on neuroinflammation in BV-2 microglia. International Journal of Environmental Research and Public Health. 2021; 18, 1–11. [CrossRef]
- Do, M.H.; Lee, E.; Oh, M.J.; Kim, Y.; Park, H.Y. High-glucose or-fructose diet cause changes of the gut microbiota and metabolic disorders in mice without body weight change. Nutrients. 2018; 10, 1–14. [CrossRef]
- Lutsiv, T.; Weir, T.L.; McGinley, J.N.; Neil, E.S.; Wei, Y.; Thompson, H.J. Compositional changes of the high-fat diet-induced gut microbiota upon consumption of common pulses. Nutrients. 2021; 13, 1–20. [CrossRef]
- Moreno-Fernández, S.; Garcés-Rimón, M.; Vera, G.; Astier, J.; Landrier, J.F.; Miguel, M. High fat/high glucose diet induces metabolic syndrome in an experimental rat model. Nutrients. 2018; 10, 1–15. [CrossRef]
- Tan, R.; Dong, H.; Chen, Z.; Jin, M.; Yin, J.; Li, H.; Shi, D.; Shao, Y.; Wang, H.; Chen, T.; Yang, D.; Li, J. Intestinal microbioa mediate high-fructose and high-fat diets to induce chronic intestinal inflammation. Front Cell Infect Microbiol. 2021; 11, 1–14. [CrossRef]
- Shamah-Levy, T.; Vielma-Orozco, E.; Heredia-Hernández, O. Encuesta Nacional de Salud y Nutrición 2018-19 Resultados Nacionales.; 2020. Accessed 4 December 2022. Available online: https://ensanut.insp.mx/encuestas/ensanut2018/doctos/informes/ensanut_2018_informe_final.pdf.
- Bala, C.; Craciun, A.E.; Hancu, N. Updating the concept of metabolically healthy obesity. Acta Endocrinol (Copenh). 2016; 12, 197–205. [CrossRef]
- Zou, Y.; Sheng, G.; Yu, M.; Xie, G. The association between triglycerides and ectopic fat obesity: An inverted U-shaped curve. PLoS One 2020, 15, 1-13. [CrossRef]
- Obonyo, H.R.; Selvi, S.V. Evaluation of hydrated extract of Phaseolus vulgaris L. (bean plant) on hypoglycemia and hypolipidemic in streptozotocin-induced diabetic albino wistar rats. Int J Res Pharm Sci. 2019; 10, 3704–3710. [CrossRef]
- Thompson, H.J.; McGinley, J.N.; Neil, E.S.; Brick, M.A. Beneficial effects of common bean on adiposity and lipid metabolism. Nutrients. 2017; 9, 1–12. [CrossRef]
- Li, N.; Liu, X.; Zhang, J.; Yan-Zhi, L.; Lu, L.; Mi, J.; You-Long, C.; Ya-Mei, Y.; Lin-Wu, R. Preventive effects of anthocyanins from lycium ruthenicum murray in high-fat diet-induced obese mice are related to the regulation of intestinal microbiota and inhibition of pancreatic lipase activity. Molecules. 2022; 27, 1–18. [CrossRef]
- Escobar-Ortiz, A.; Hernández-Saavedra, D.; Lizardi-Mendoza, J.; Pérez-Ramírez, I.F.; Mora-Izaguirre, O.; Ramos-Gómez, M.; Reynoso-Camacho, R. Consumption of cricket (Acheta domesticus) flour decreases insulin resistance and fat accumulation in rats fed with high-fat and -fructose diet. J Food Biochem. 2022; 46, 1–15. [CrossRef]
- Horne, R.G.; Yu, Y.; Zhang, R.; Abdalqadir, N.; Rossi, L.; Surette, M.; Sherma, P.M.; Adeli, K. High fat-high fructose diet-induced changes in the gut microbiota associated with dyslipidemia in Syrian hamsters. Nutrients. 2020; 12, 1–20. [CrossRef]
- Jang, C.; Hui, S.; Lu, W.; Cowan, A.J.; Morscher, R. J.; Lee, G.; Liu, W.; Tesz, G.J.; Birnbaun, M.J.; Rabinowitz, J.D. The small intestine converts dietary fructose into glucose and organic acids. Cell Metab. 2018; 27, 351–361. [CrossRef]
- Lecomte, V.; Kaakoush, N.O.; Maloney, C.A.; Raipuria, M.; Huinao, K.D.; Mitchell, H.M.; Morris, M.J. Changes in gut microbiota in rats fed a high fat diet correlate with obesity-associated metabolic parameters. PLoS One. 2015; 10, 1–22. [CrossRef]
- Costes, L.M.M.; Lindenbergh-Kortleve, D.J.; van Berkel, L.A.; Veenbergen, S.; Raatgeep, H.C.; Simons-Oosterhuis, Y.; van Haaften, D.H.; Karrich, J.J.; Escher, J.C.; Groeneweg, M.; Clausen, B.E.; Cupedo, T.; Samson, J.N. IL-10 signaling prevents gluten-dependent intraepithelial CD4+ cytotoxic T lymphocyte infiltration and epithelial damage in the small intestine. Mucosal Immunol. 2019; 12, 479–490. [CrossRef]
- Ye, X.; Liu, Y.; Hu, J.; Gao, Y.; Ma, Y.; Wen, D. Chlorogenic acid-induced gut microbiota improves metabolic endotoxemia. Front Endocrinol (Lausanne). 2021; 12, 1–22. [CrossRef]
- McGinley, J.N.; Fitzgerald, V.K.; Neil, E.S.; Omerigic, H.M.; Heuberger, A.L.; Weir, T.L.; McGee, R.; Vandemark, G.; Thompson, H.J. Pulse crop effects on gut microbial populations, intestinal function, and adiposity in a mouse model of diet-induced obesity. Nutrients. 2020; 12, 1–17. [CrossRef]
- Wei, B.; Zhong, Q.W.; Ke, S.Z.; Zhou, T.S.; Wu, Q.L.; Wang, S.J.; Chen, J.W.; Zhang, H.W.; Jin, W.H.; Wang, H. Sargassum fusiforme polysaccharides prevent high-fat diet-induced early fasting hypoglycemia and regulate the gut microbiota composition. Mar Drugs. 2020; 18, 1–13. [CrossRef]
- Di, Tommaso, N.; Gasbarrini, A.; Ponziani, F.R. Intestinal barrier in human health and disease. Int J Environ Res Public Health. 2021; 18, 1-23. [CrossRef]


| Energy (kcal/g) |
Proteins (%) | Carbohydrates (%) |
Lipids (%) |
Crude fiber (g /100 g) |
Total dietary fiber (g/100 g) |
Fructose (%) | Lard (%) | Total phenolic compounds (mg/g) | |
|---|---|---|---|---|---|---|---|---|---|
| SD | 3.40 | 28.54 | 58.15 | 13.43 | 5.10 | 36.92 | 0.00 | 0.00 | 2.53 |
| HFFD | 4.70 | 14.28 | 40.90 | 44.81 | 3.07 | 17.31 | 19.98 | 40.17 | 1.55 |
| BL consumption | 4.70 | 13.79 | 41.20 | 45.02 | 3.16 | 21.00 | 20.26 | 40.73 | 3.26 |
| Group | Diet |
|---|---|
| SD 26-wk | Standard diet by 26 weeks |
| HFFD 26-wk | HFFD by 26 weeks |
| BL consumption | HFFD + 10% BL by 12 weeks |
| Change healthy diet | Standard diet by 12 week |
| Compounds | µg/g |
|---|---|
| Phenolic acids | |
| Quinic acid | 97.44 ± 7.08 |
| Caffeic acid (derivative) | 57.14 ± 3.95 |
| Cinnamic acid (derivative) | 72.41 ± 13.00 |
| Protocatechoic acid | 8.31 ± 2.17 |
| Caftaric acid | 207.21 ± 22.20 |
| 4-hydroxybenzoic acid | 106.59 ± 2.18 |
| Coumaric acid (derivative) | 1283.81 ± 110.87 |
| Ferulic acid (derivative) | 95.53 ± 11.82 |
| 2-hydroxybenzoic acid | 96.76 ± 10.79 |
| Benzoic acid | 49.55 ± 0.54 |
| Flavonoids | |
| Rutin | 971.18 ± 73.19 |
| Quercetin 3-O-ß-glucuronide | 6892.20 ± 99.42 |
| Quercetin 3-O-glucoside | 73.05 ± 7.53 |
| Kaempferol 3-O-glucoside | 11.24 ± 0.10 |
| Naringin | 1.01 ± 0.36 |
| Naringenin | 2.29 ± 0.61 |
| Obesity induction phase | Experimental treatment phase | |||||
|---|---|---|---|---|---|---|
| SD 14 wk | HFFD 14 wk | SD 26 wk | HFFD 26 wk | BL consumption | Change to healthy diet | |
| Food intake (g/day) |
4.59 ± 0.50 | 4.88 ± 0.30 | 3.79 ± 0.40a | 5.13 ± 0.80a | 4.54 ± 0.60a | 5.09 ± 0.50a |
| Energy intake (Kcal/day) |
15.75 ± 1.50 | 22.94 ± 1.30* | 12.89 ± 1.50a | 23.48 ± 3.80b | 20.80 ± 2.70b | 17.11 ± 1.50a |
| Water intake (mL/day) |
4.62 ± 0.50 | 4.92 ± 0.40 | 5.05 ± 0.40a | 5.61 ± 0.50a | 4.90 ± 0.70a | 6.10 ± 0.80a |
| Obesity induction phase | Experimental treatment phase | |||||
|---|---|---|---|---|---|---|
| SD 14-wk | HFFD 14-wk | SD 26-wk | HFFD 26-wk | BL consumption | Change to healthy diet | |
| Body weight (g) | 25.63 ± 0.57 | 33.47 ± 0.72 * | 27.96 ± 0.65a | 30.50 ± 0.52b | 28.09 ± 0.84ab | 29.47 ± 0.42a |
| Abdominal circumference (cm) | 7.50 ± 0.46 | 10.40 ± 0.43* | 7.79 ± 0.29a | 8.33 ± 0.28a | 8.50 ± 0.39a | 6.83 ± 0.17b |
| Thoracic circumference (cm) | 7.13 ± 0.43 | 9.2 ± 0.73 | 7.36 ± 0.26ª | 8.17 ± 0.25ª | 8.50 ± 0.55ª | 7.33 ± 0.33ª |
| Serum cholesterol (mg/dL) | 92.60 ± 8.60 | 122.80 ± 11.90* | 98.30 ± 0.90a | 119.70 ± 3.40b | 114.40 ± 3.50b | 104.90 ± 4.20b |
| Serum triglycerides (mg/dL) | 77.70 ± 7.60 | 137.30 ± 17.50* | 99.50 ± 3.90a | 141.10 ± 4.20b | 110.70 ± 7.30a | 106.80 ± 7.70a |
| Obesity induction phase | Experimental treatment phase | ||||||
|---|---|---|---|---|---|---|---|
| Length (cm) | SD 14-wk | HFFD 14-wk | SD 26-wk | HFFD 26-wk | BL consumption | Change to healthy diet | |
| Small intestine | 44.00 ± 2.91 | 36.63 ± 1.58* | 39.85 ± 1.72a | 34.31 ± 0.97a | 37.95 ± 1.04a | 37.24 ± 1.67a | |
| Total colon | 8.86 ± 0.50 | 6.98 ± 0.50 | 7.28 ± 0.45a | 6.58 ± 0.52a | 7.41±0.48a | 5.43 ± 0.53b | |
| Percentage (%) | SD 26-wk | HFFD 26-wk | BL consumption | Change to healthy diet |
|---|---|---|---|---|
| Colon | 1.82 ± 0.06a | 1.23 ± 0.03b | 1.24 ± 0.02b | 1.31 ± 0.09b |
| Small intestine | 7.06 ± 0.28a | 5.77 ± 0.27b | 6.25 ± 0.14ab | 6.09 ± 0.14b |
| Liver | 4.81 ± 0.14a | 5.93 ± 0.28ab | 5.58 ± 0.59a | 4.68 ± 0.21ac |
| Intake (g/day) | SD 26-wk | HFFD 26-wk | BL consumption | Change to healthy diet |
|---|---|---|---|---|
| Soluble fiber | 0.21 ± 0.02a | 0.08 ± 0.01b | 0.24 ± 0.03a | 0.33 ± 0.04a |
| Insoluble fiber | 0.81 ± 0.08a | 0.23 ± 0.02b | 0.70 ± 0.09a | 1.08 ± 0.13a |
| Total dietary fiber | 1.20 ± 0.10a | 0.27 ± 0.02b | 0.94 ± 0.02c | 1.40 ± 0.16d |
| Total phenolic compounds | 9.59 ± 1.02a | 7.95 ± 1.24a | 14.8 ± 2.72b | 12.87 ± 1.27b |
Disclaimer/Publisher’s Note: The statements, opinions and data contained in all publications are solely those of the individual author(s) and contributor(s) and not of MDPI and/or the editor(s). MDPI and/or the editor(s) disclaim responsibility for any injury to people or property resulting from any ideas, methods, instructions or products referred to in the content. |
© 2024 by the authors. Licensee MDPI, Basel, Switzerland. This article is an open access article distributed under the terms and conditions of the Creative Commons Attribution (CC BY) license (https://creativecommons.org/licenses/by/4.0/).


