1. Introduction
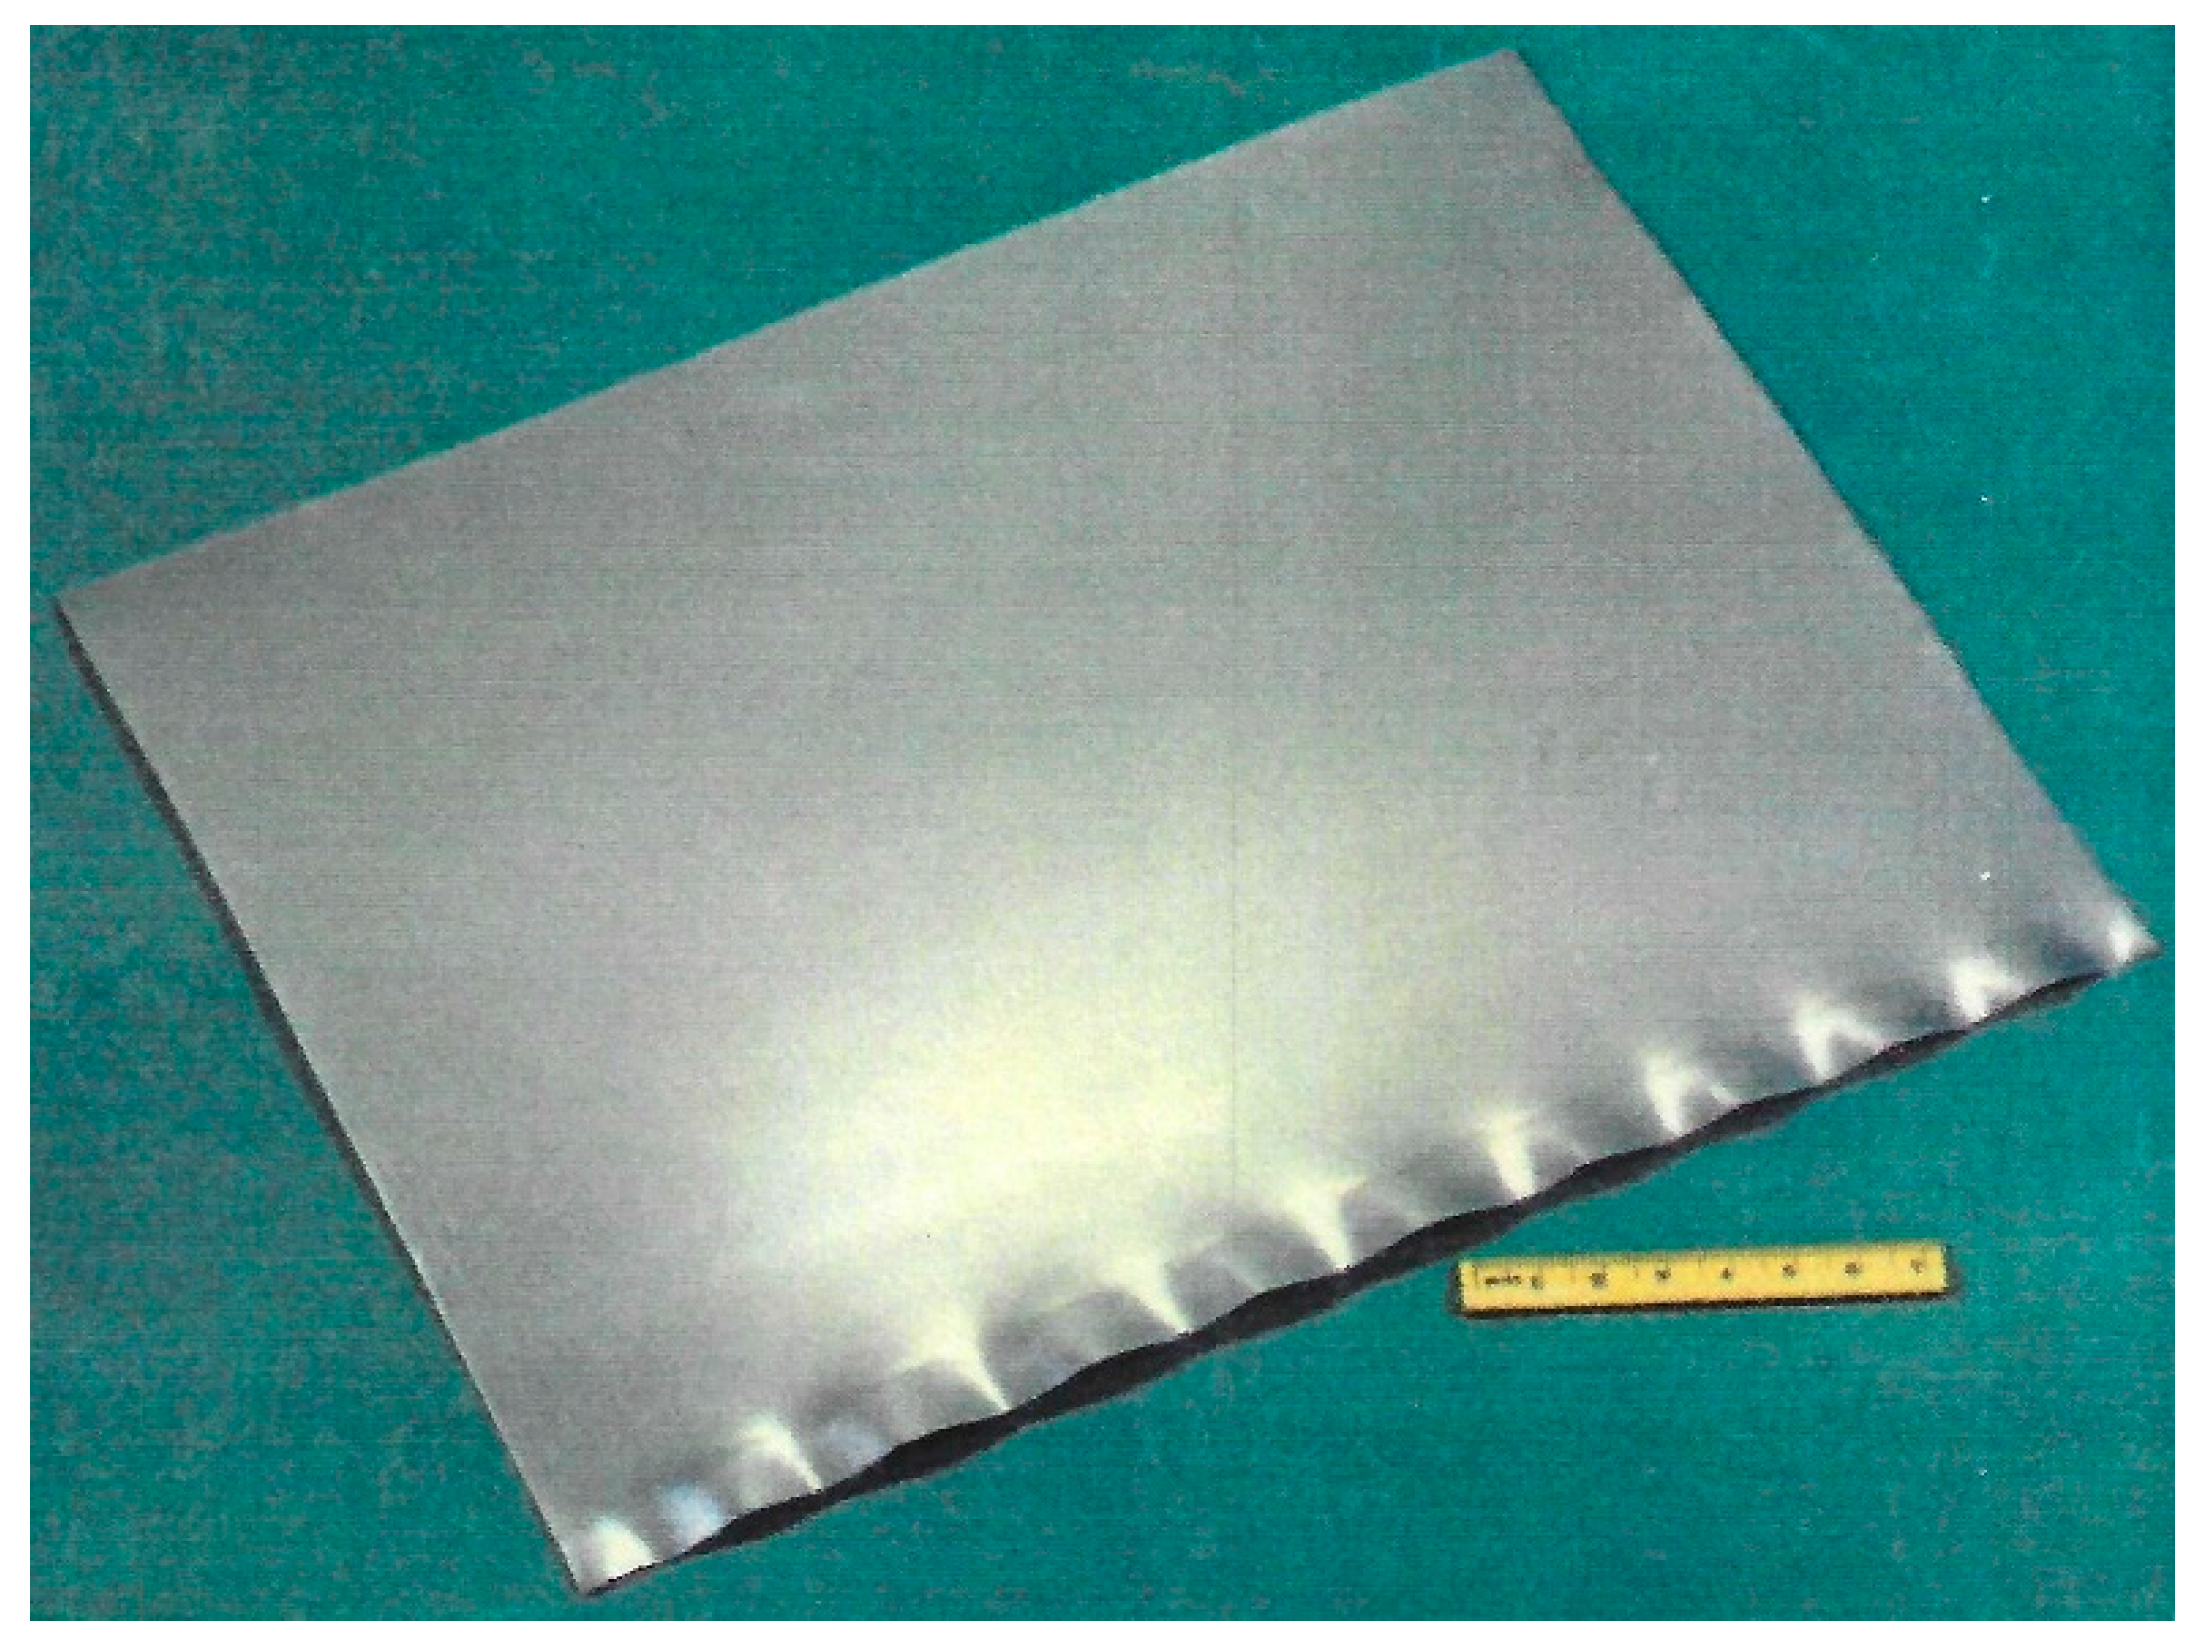
The flatness, profile and thickness of strip are some of the most important variables of superficial quality of steel processed by flat rolling. Nowadays there are many studies and developments of technology aiming to improve the quality of the strip. It is a complex matter because in flat rolling process there are a lot of variables which modify considerably the shape of the strip, mainly the flatness, profile, and thickness, which is most critical in the strip edge, because it could cause the production of strip to be out of standard or in extreme cases produce scrap coils due to the phenomenon known as drop end or edge drop. The edge drop is a little difference in the thickness of the strip between the center line and the strip edge, it could be critical if it is not controlled causing a visual defect as shown in
Figure 1.
Edge drop has been studied for some scientists, considering the importance of variables such as width of strip, rolled material, taper roll contour, crown, etc., all of them used a FEM to analyze and propose a model of control for this phenomenon on a 4-high cold rolling mill [
1,
2,
3]. Chi et. al. [
4] studied the same but applied to a 4-high hot rolling mill; the difference between the studies was the influence of wear, which is more severe in hot rolling mills. The control and distribution of rolling forces is one of the variables that must be perfectly controlled, the modern 6-high tandem cold rolling mills and sendzimir mills play an important role in controlling the edge drop control work roll (EDW). Cao et. al and Hongbo et. al. [
5,
6] included in their studies the use of roll shifting system, their conclusion was that cold rolling is the key process for the thin strip edge-drop control. Chang et al., Lu et al., and Xuan et al. [
7,
8,
9] developed a model of roll stacks and strip deformation, and proposed the reasons of edge drop in the silicon strips cold rolling for the four-high rolling mills and six-high rolling mills, and the edge drop was improved considerably.
Edge drop and profile of strip are closely related, hence, the influence of the roll contours must be analyzed to understand and decrease this phenomenon. Yang et al. and Li et al. [
10,
11] studied the effect of smart crown on BUR for cold rolling mills and hot rolling mills, respectively. Wang et al. and Cao et al. [
12,
13] complement their studies using Continuous Variable Crown (CVC) in BUR and WR, the conclusion of their studies was that the profile of strip is closely related to contact pressure concentration between BUR and WR which is the responsible of the deformation of the strip. Xiawei et.al. [
14] confirmed the relationship between the profile of strips and contours of WR. Since the transverse thickness distribution of the strip is strongly dependent on roll’s shape, it is imperative to consider work roll’s non-circular shape, particularly in thin strip edge drop, during the rolling process.
The edge drop is a problem located on the strip edge, some other research focused in this particular area, such as the analysis of the pressure distribution on the strip edge in cold [
15] and hot [
16] rolling mills, in these cases, the results showed peaks of pressure near the ends of the barrel of BUR. Kong et al. and Cao et.al. [
2,
17] determined that the pressure distribution is related to the strip width and can be modified by the chamfers at the ends of the barrel of BUR, trying to produce flexion on WR and distribute the pressure to decrease the problem of profile and consequently the problem on strip edge. Yanlin et. al. [
18] attribute the peaks of rolling pressure to the influence of temperature on the edge of the strip, they analyzed the strip edge temperature drop and the influence of phases in electrical steel when there is a change of temperature.
The precision of thickness distribution and profile of strip are directly related to the rolling forces applied. Several scientists have developed analytical models for the prediction and control of strip profile in flat rolling [
19,
20,
21,
22], including in recent years the application of neural-networks to improve the accuracy of roll forces [
23,
24]. Other scientists have studied strip profiles in asymmetrical rolling mills, investigating the influence of work roll crossing angle and work roll shifting; the results show that the thickness of strip is consistent, and the profile of strip is nearly flat [
25].
In past years, many researchers had focused on edge drop control, and some positive results have been obtained, however, the problem of edge drop continues on the edge of the strip, thus, it is necessary to complement the study with the analysis of the elastic curve due to distribution of rolling forces, moments of inertia and the response with the aid of FEM software, validating the results with industrial data of compact X-ray thickness gauge from a 4-high rolling mill.
2. Materials and Methods
The process of flat rolling for a 4-high cold mill involves many variables of the operation process, geometrical dimensions and mechanical properties of components implicated in the production of strip. The analysis of plastic deformation of rolls, application and transmission of rolling forces used to reduce the thickness of strip is analyzed considering the system as a simply supported beam. The flat rolling process is a structural member that supports loads which are applied perpendicular to its longitudinal axis. For the determination of stress, distribution of pressure in this structural member and bending of rolls under rolling load, it is necessary to consider the equilibrium, the response of materials and geometry of the whole the system. The
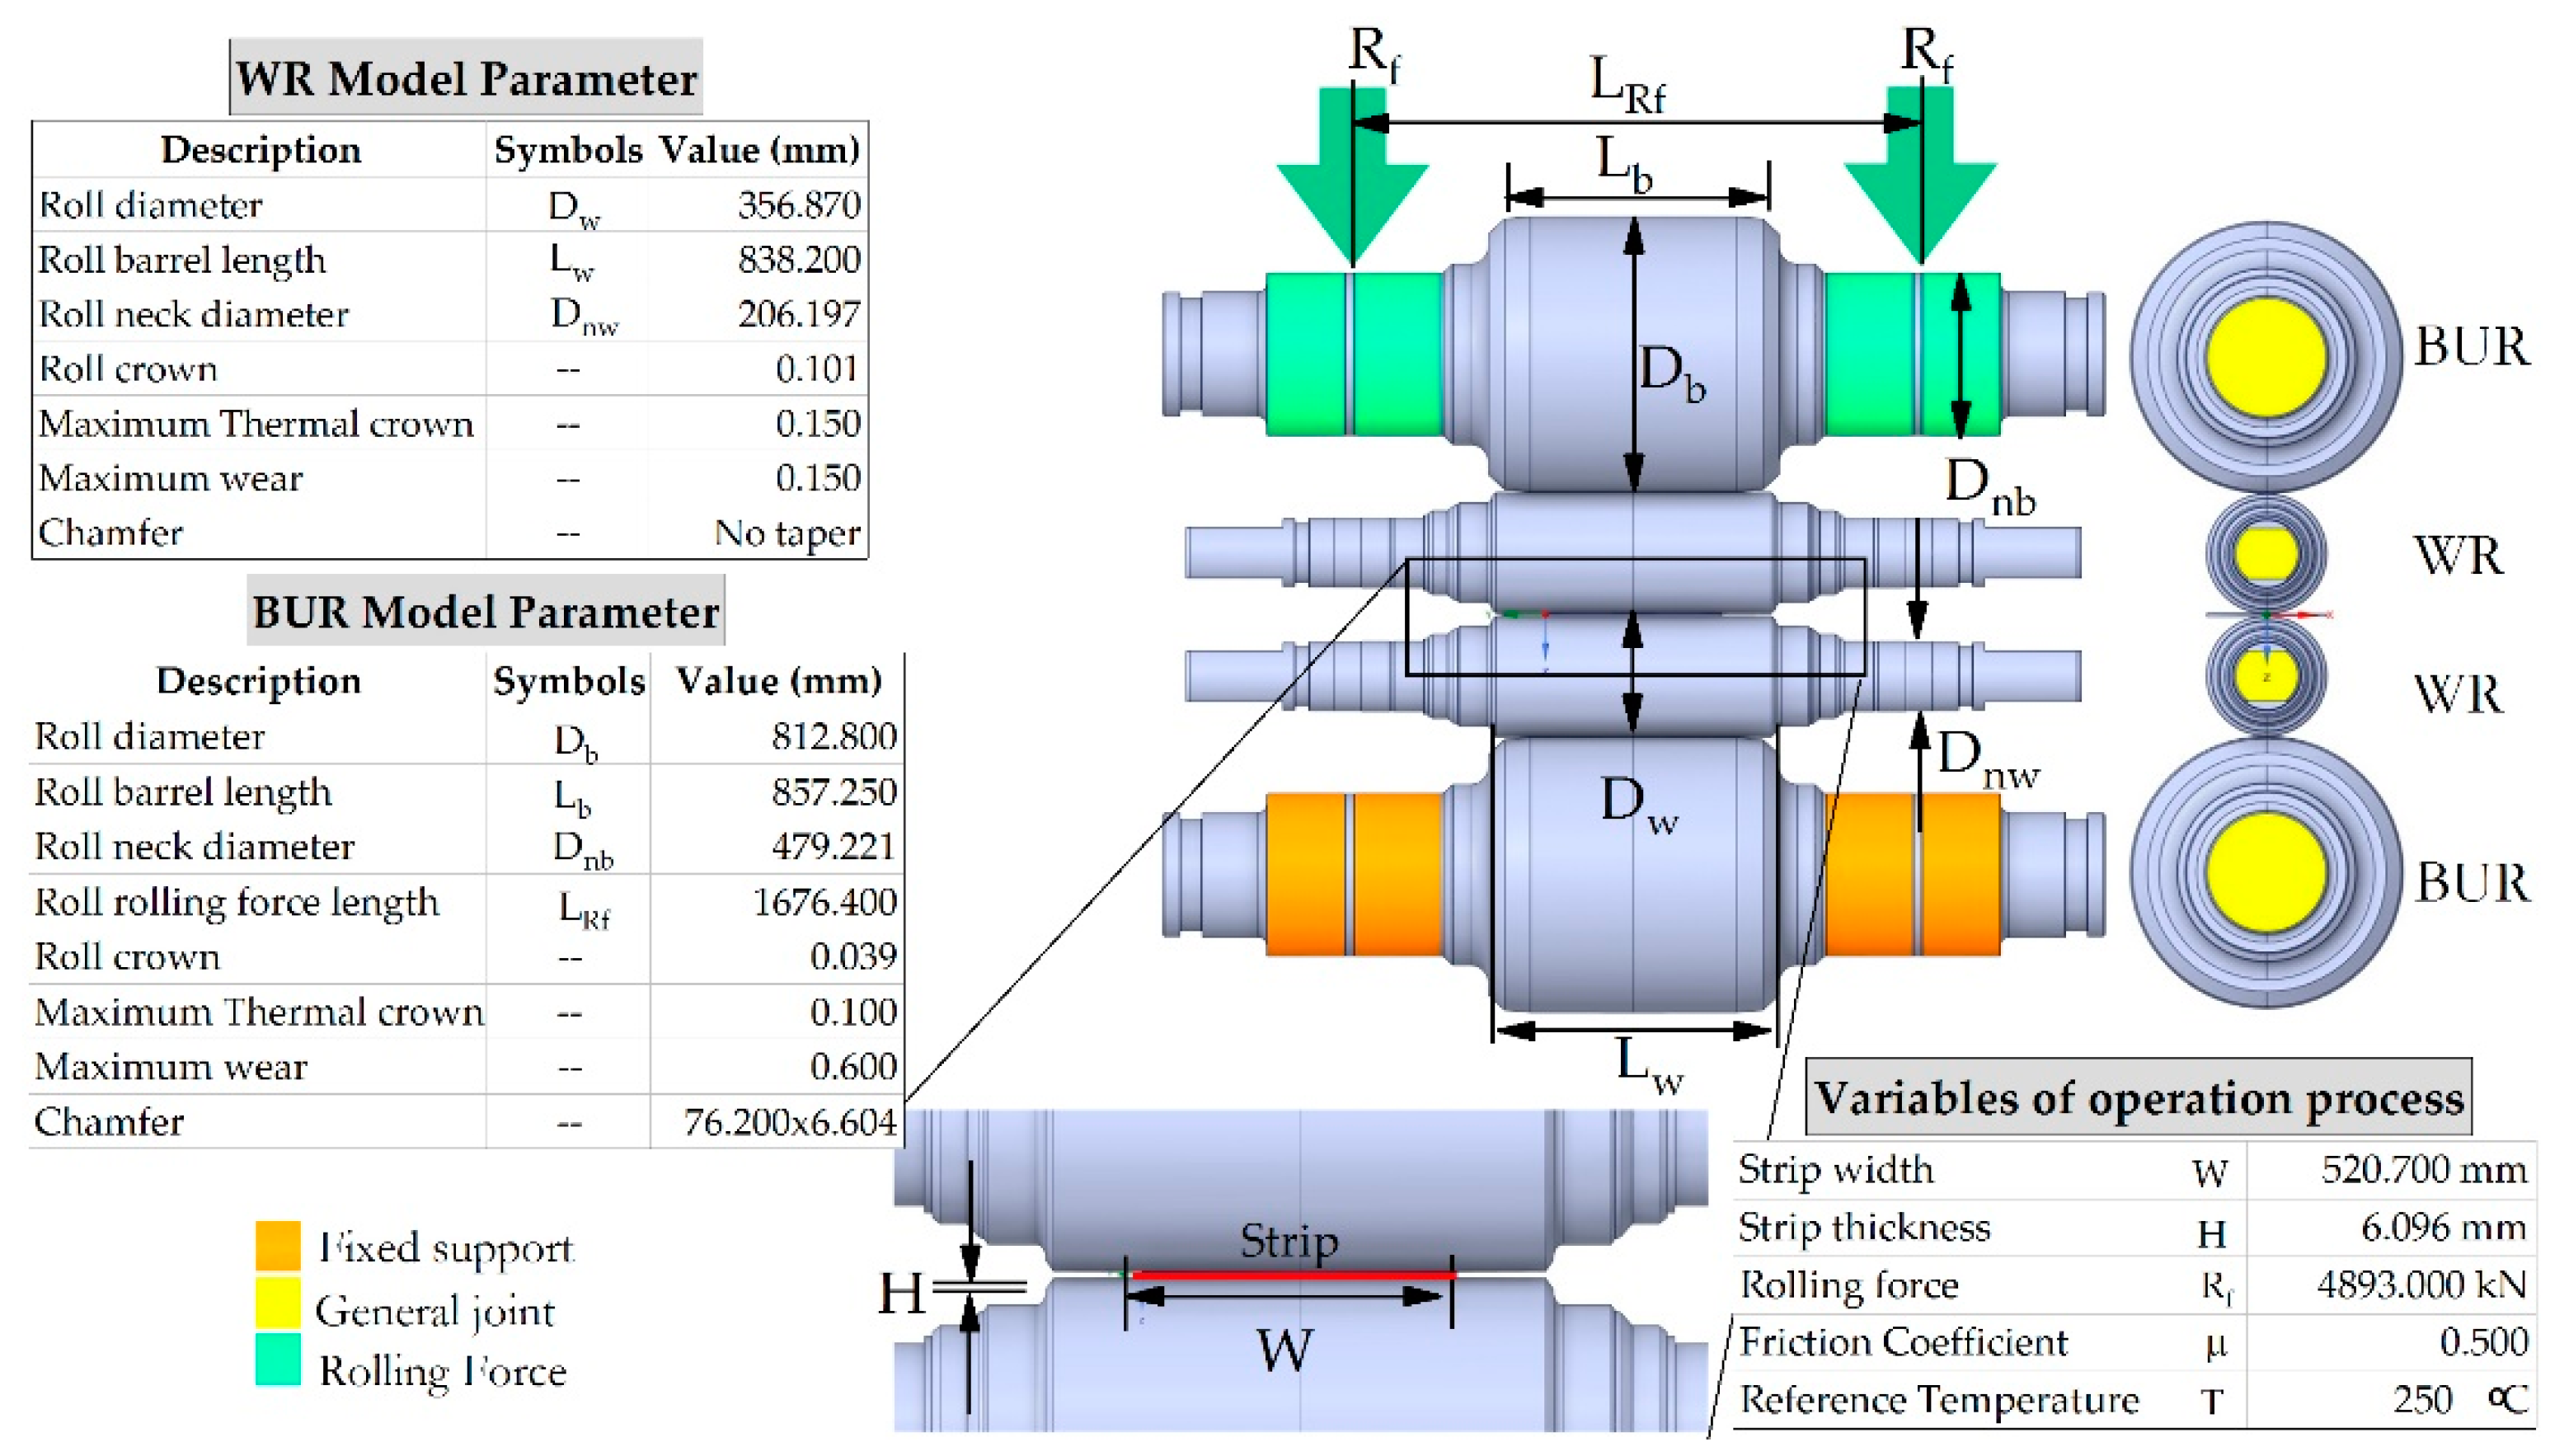
Figure 2 presents the illustration of the geometrical variables necessary for this analysis and the operational variables for cold rolling process, which are defined for this particular case. The cold strip stand mill consist of four rolls, two BUR and two WR, mechanical and metallurgical properties of rolls and strip are indicated in
Table 1. The structural mechanism of flat rolling process is considered as a simply supported beam, analyzing the plastic deformation of rolls considering +0.039mm crown on BUR and +0.101mm on WR, chamfer of 76.2 mm x 6.604 mm on BUR and no taper on WR.
The simulation for the rolling process is based on a FEM, using the ANSYS Mechanical Static Structural Software (ANSYS 2023R2, Ansys Inc. Canonsburg, PA, USA) considering the geometrical dimensions of mechanical components involved in the process. The rolling forces are uniformly distributed and are applied in the bearing areas of top BUR. Elastic deformation is considered for the rolls and strip by means of a model with linear relationship of stress-strain. General joints in the lateral face of the rolls are considered, which only allow for vertical movement in the direction of force application. The bottom rolls are fixed and the boundary conditions of the simulation are shown in
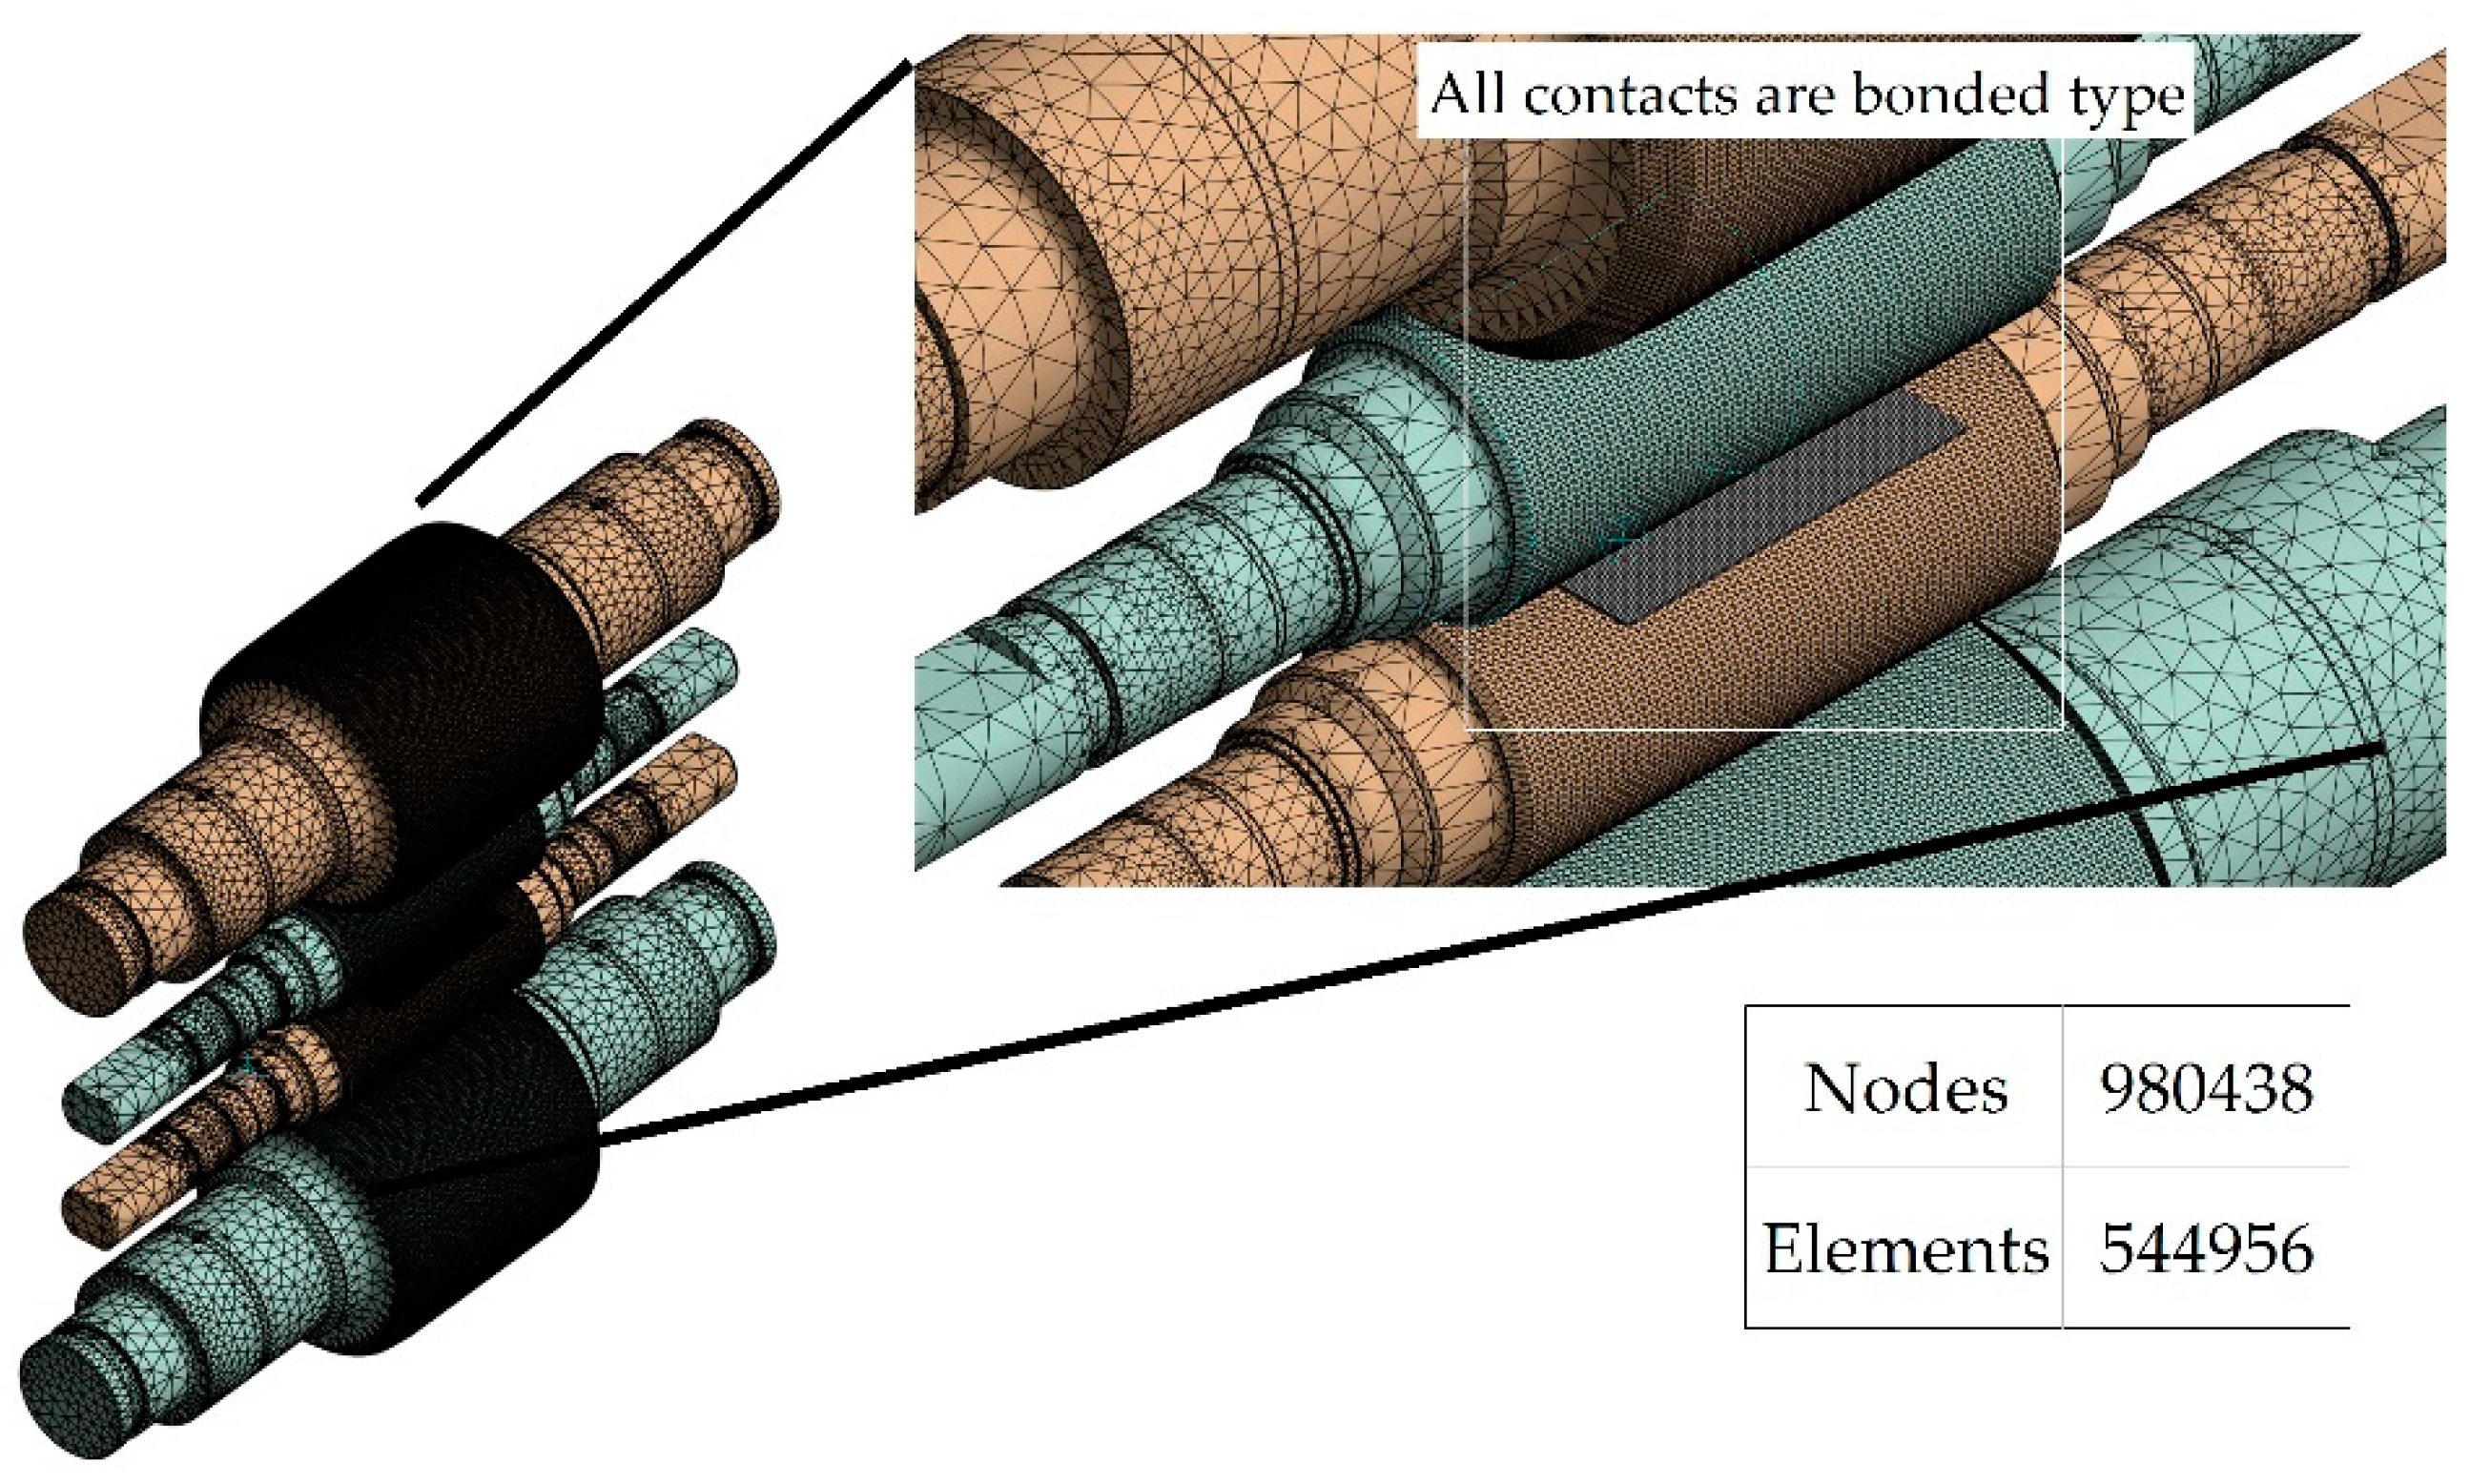
Figure 2. The mesh was generated by ANSYS, using intelligent meshing with an element size of 0.05 m as shown in
Figure 3. The mesh element used for the simulations was a SOLID186, element defined by 20 nodes with three degrees of freedom per node, translation in the nodal x,y and z directions. This element can take hexahedral, tetrahedral, pyramid or prism shape in function of the complexity of the geometry. The mesh had a total of 980,438 nodes and 544,956 elements. The contact region mesh (BUR-WR-Strip) was considered with a bonded system, no sliding or separation between face and edges is implement without penetration [
26].
Results obtained with theoretical analysis and simulation with FEM will be validated with results obtained from a compact X-ray thickness gauge installed in the last stand of a 4-high cold mill. Thickness and Profile Gauge System with x-rays operate on the principle of transmission radiation. X-ray or isotope radiation emitted by a radiation source passes through the strip. A detector located on the other side of the strip measures the intensity of the radiation. As the radiation passes through the strip, the strip material absorbs some. The remaining non-absorbed radiation arrives at the detector. The detector measures the intensity of this radiation and produces an ionization current, which is proportional to the thickness of the strip. The ionization current is converted into a digital signal in a measuring transducer. It is then transmitted to the gauge signal-processing computer via an Ethernet link. The output signal from the gauge computer represents the strip thickness. The results are shown in the computer of the control pulpit.
3. Results
3.1. Theorical Analysis
The principal problem of mechanical of materials is the determination of relationships between stresses and deformation produced by the applied forces in a structure or mechanical component. The bending study is complicated because the effect of applied forces is variable along the beam, these variables are clearly identified as shear forces, bending moment and elastic curve.
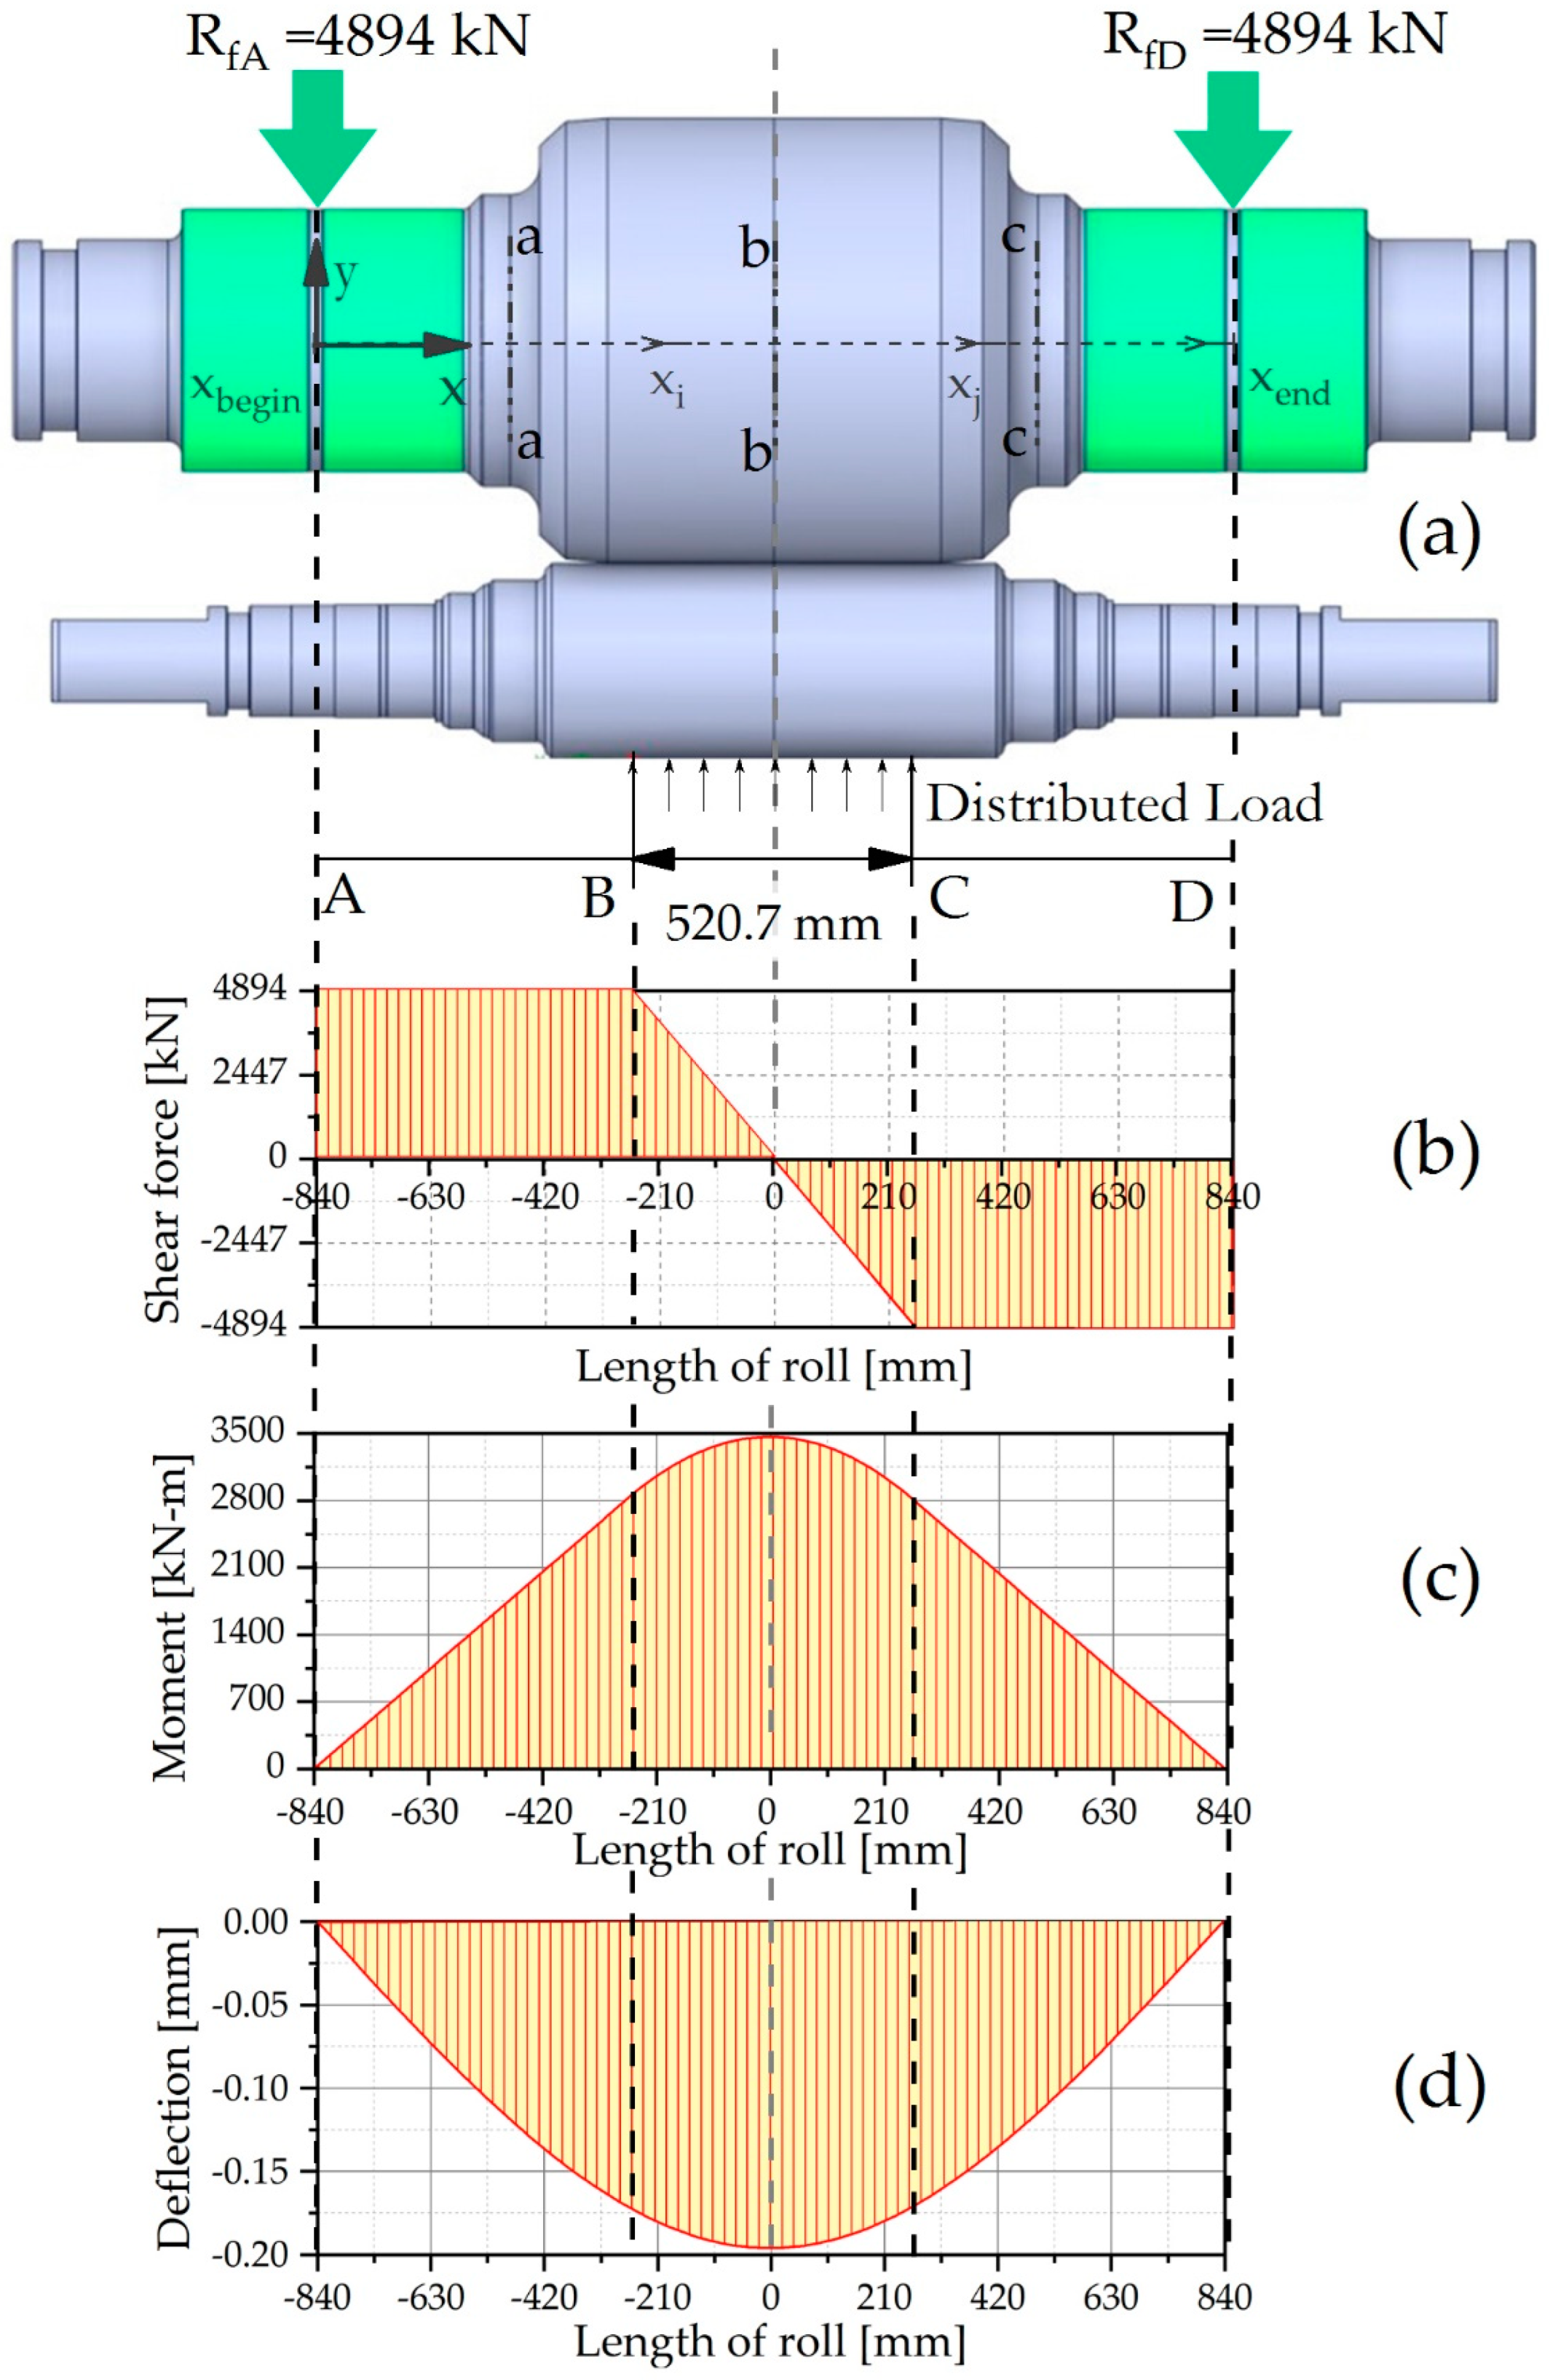
For our analysis, the flat Rolling process is a statically determinate system of simply supported beam, such as shown in
Figure 4a, where the uniformly distributed load is applied on the strip while on the rolls several stresses are produced, and the deformation must be controlled to minimize edge drop. For our case, the two rolling forces of 4,893 kN distribute along the strip width of 520.7 mm resulting in the uniformly distributed load of 18,793.93 kN/m. The sections of the beams where load conditions are variable, normally are called points of change or points of discontinuity, identified with the letters A, B, C and D.
For any plane a-a, located along the segment A-B in the beam, the shear force maintained the constant value of 4893 kN, and the bending moment is defined by the following equation:
In the case of the planes b-b, located in the section between points B and C, the shear forces are varying from 4893 kN to -4893 kN, and the bending moment is defined by the following equation:
To complete analysis of all the beam, considering any plane c-c, located along the segment C-D, the shear force maintained the constant value of -4893 kN and the equation for the bending moment is determined with the following equation:
where
Considering that the differential equation of the elastic curve is:
Integrating Equation (4), supposing that EI is constant, we find the slope of the bending moment equation, which is:
Solving the equation for our case, the equation is:
Integrating one more time the slope of the bending moment equation, we obtain the elastic curve, which is:
Solving the double integration for our case, the final equation of the elastic curve is:
The numerical values of the constants of integration C1 y C2 are calculated according to boundary conditions.
The shear forces shown in
Figure 4b, are used for calculating the bending moment. The most important area of the analysis is the section between the points B and C (Strip edge), because at this zone the shear forces are changing from 4893 kN to -4893 kN. At this zone the phenomenon of reduction of strip by cold rolling is done, as shown in
Figure 4c. At the points B and C the bending moment is lower than that at the center line mill, there is a difference of 637 kNm which represents a 18.37% of the total bending moment. In the case of the graph shown in
Figure 4d, the elastic curve has a similar result, the difference of bending from strip edge to centerline mill is 0.024 mm, which represent 12.24% of total bending.
3.2. Results of the Simulation
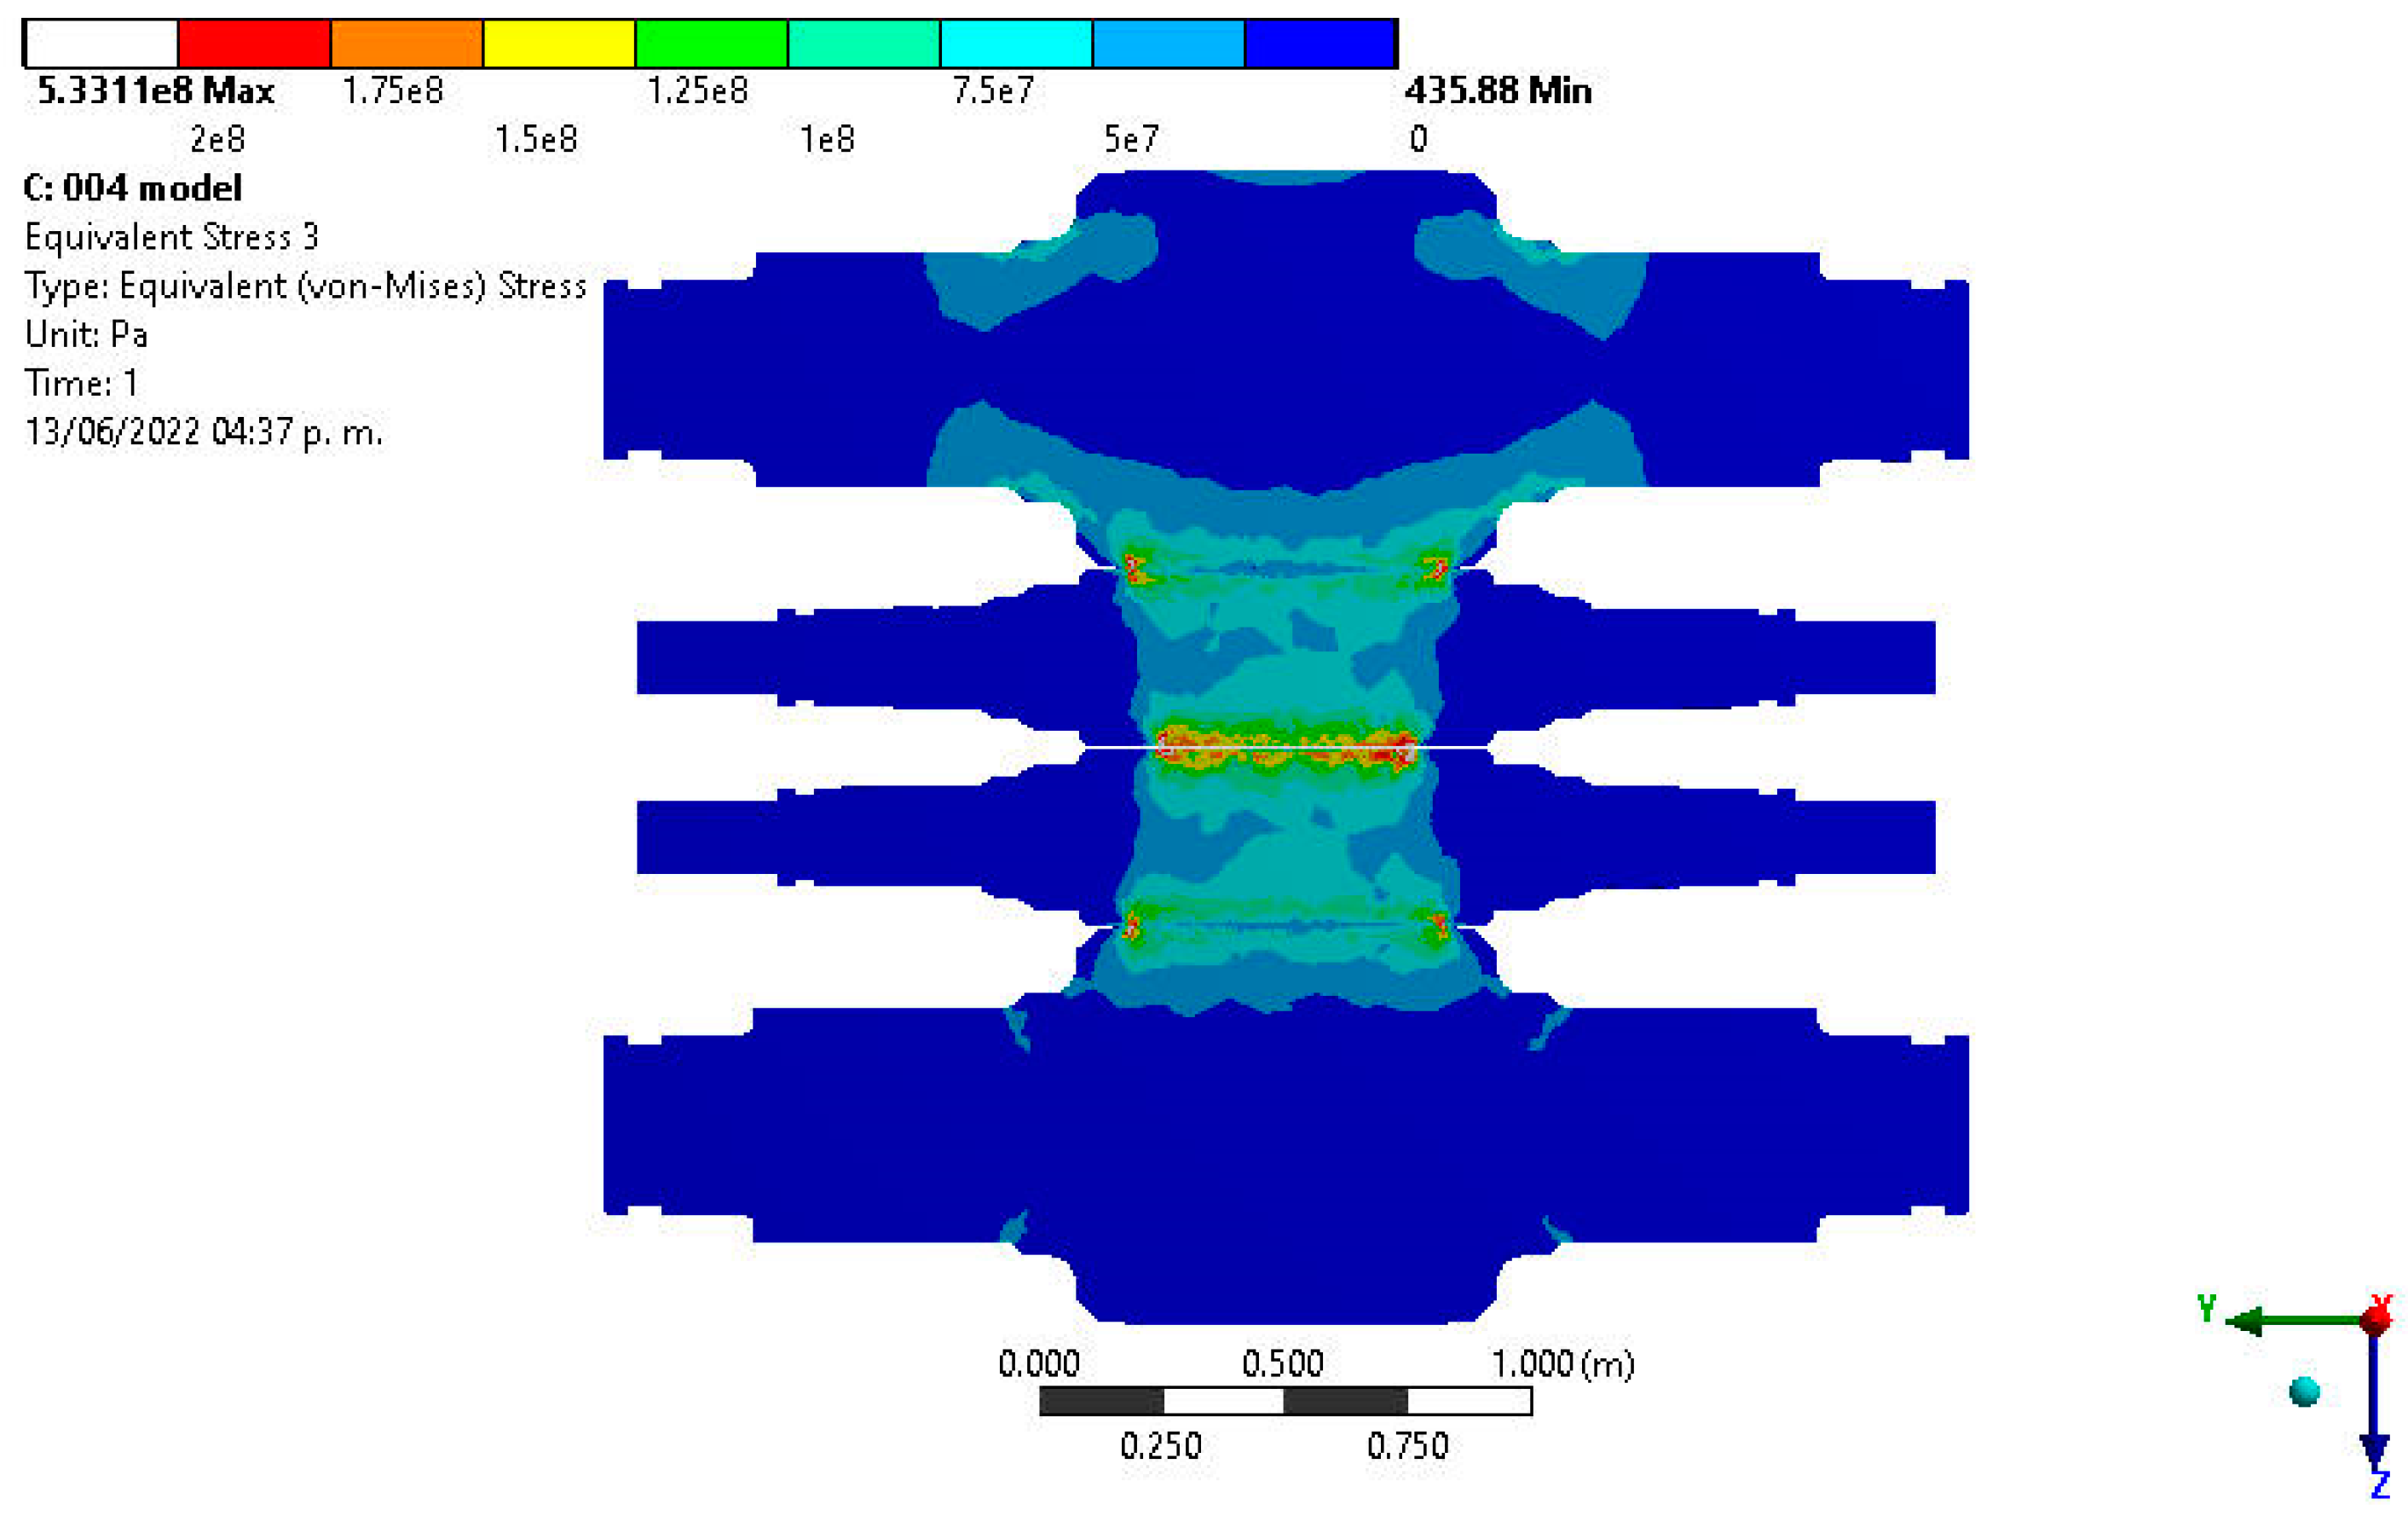
Using the variables of production for cold strip mill described above, the study is complemented with the distribution of stress and deformation of the strip. In the case of the analysis of stress, the
Figure 5 shows the distribution of stress, we can observe maximum stress values of 200 MPa located in two contact zones, the first contact zone is between BUR and WR, and the second one is between the strip and WR; for the analysis of edge drop the most important zone of the analysis is in the contact of WR with the strip. In this case the illustration of
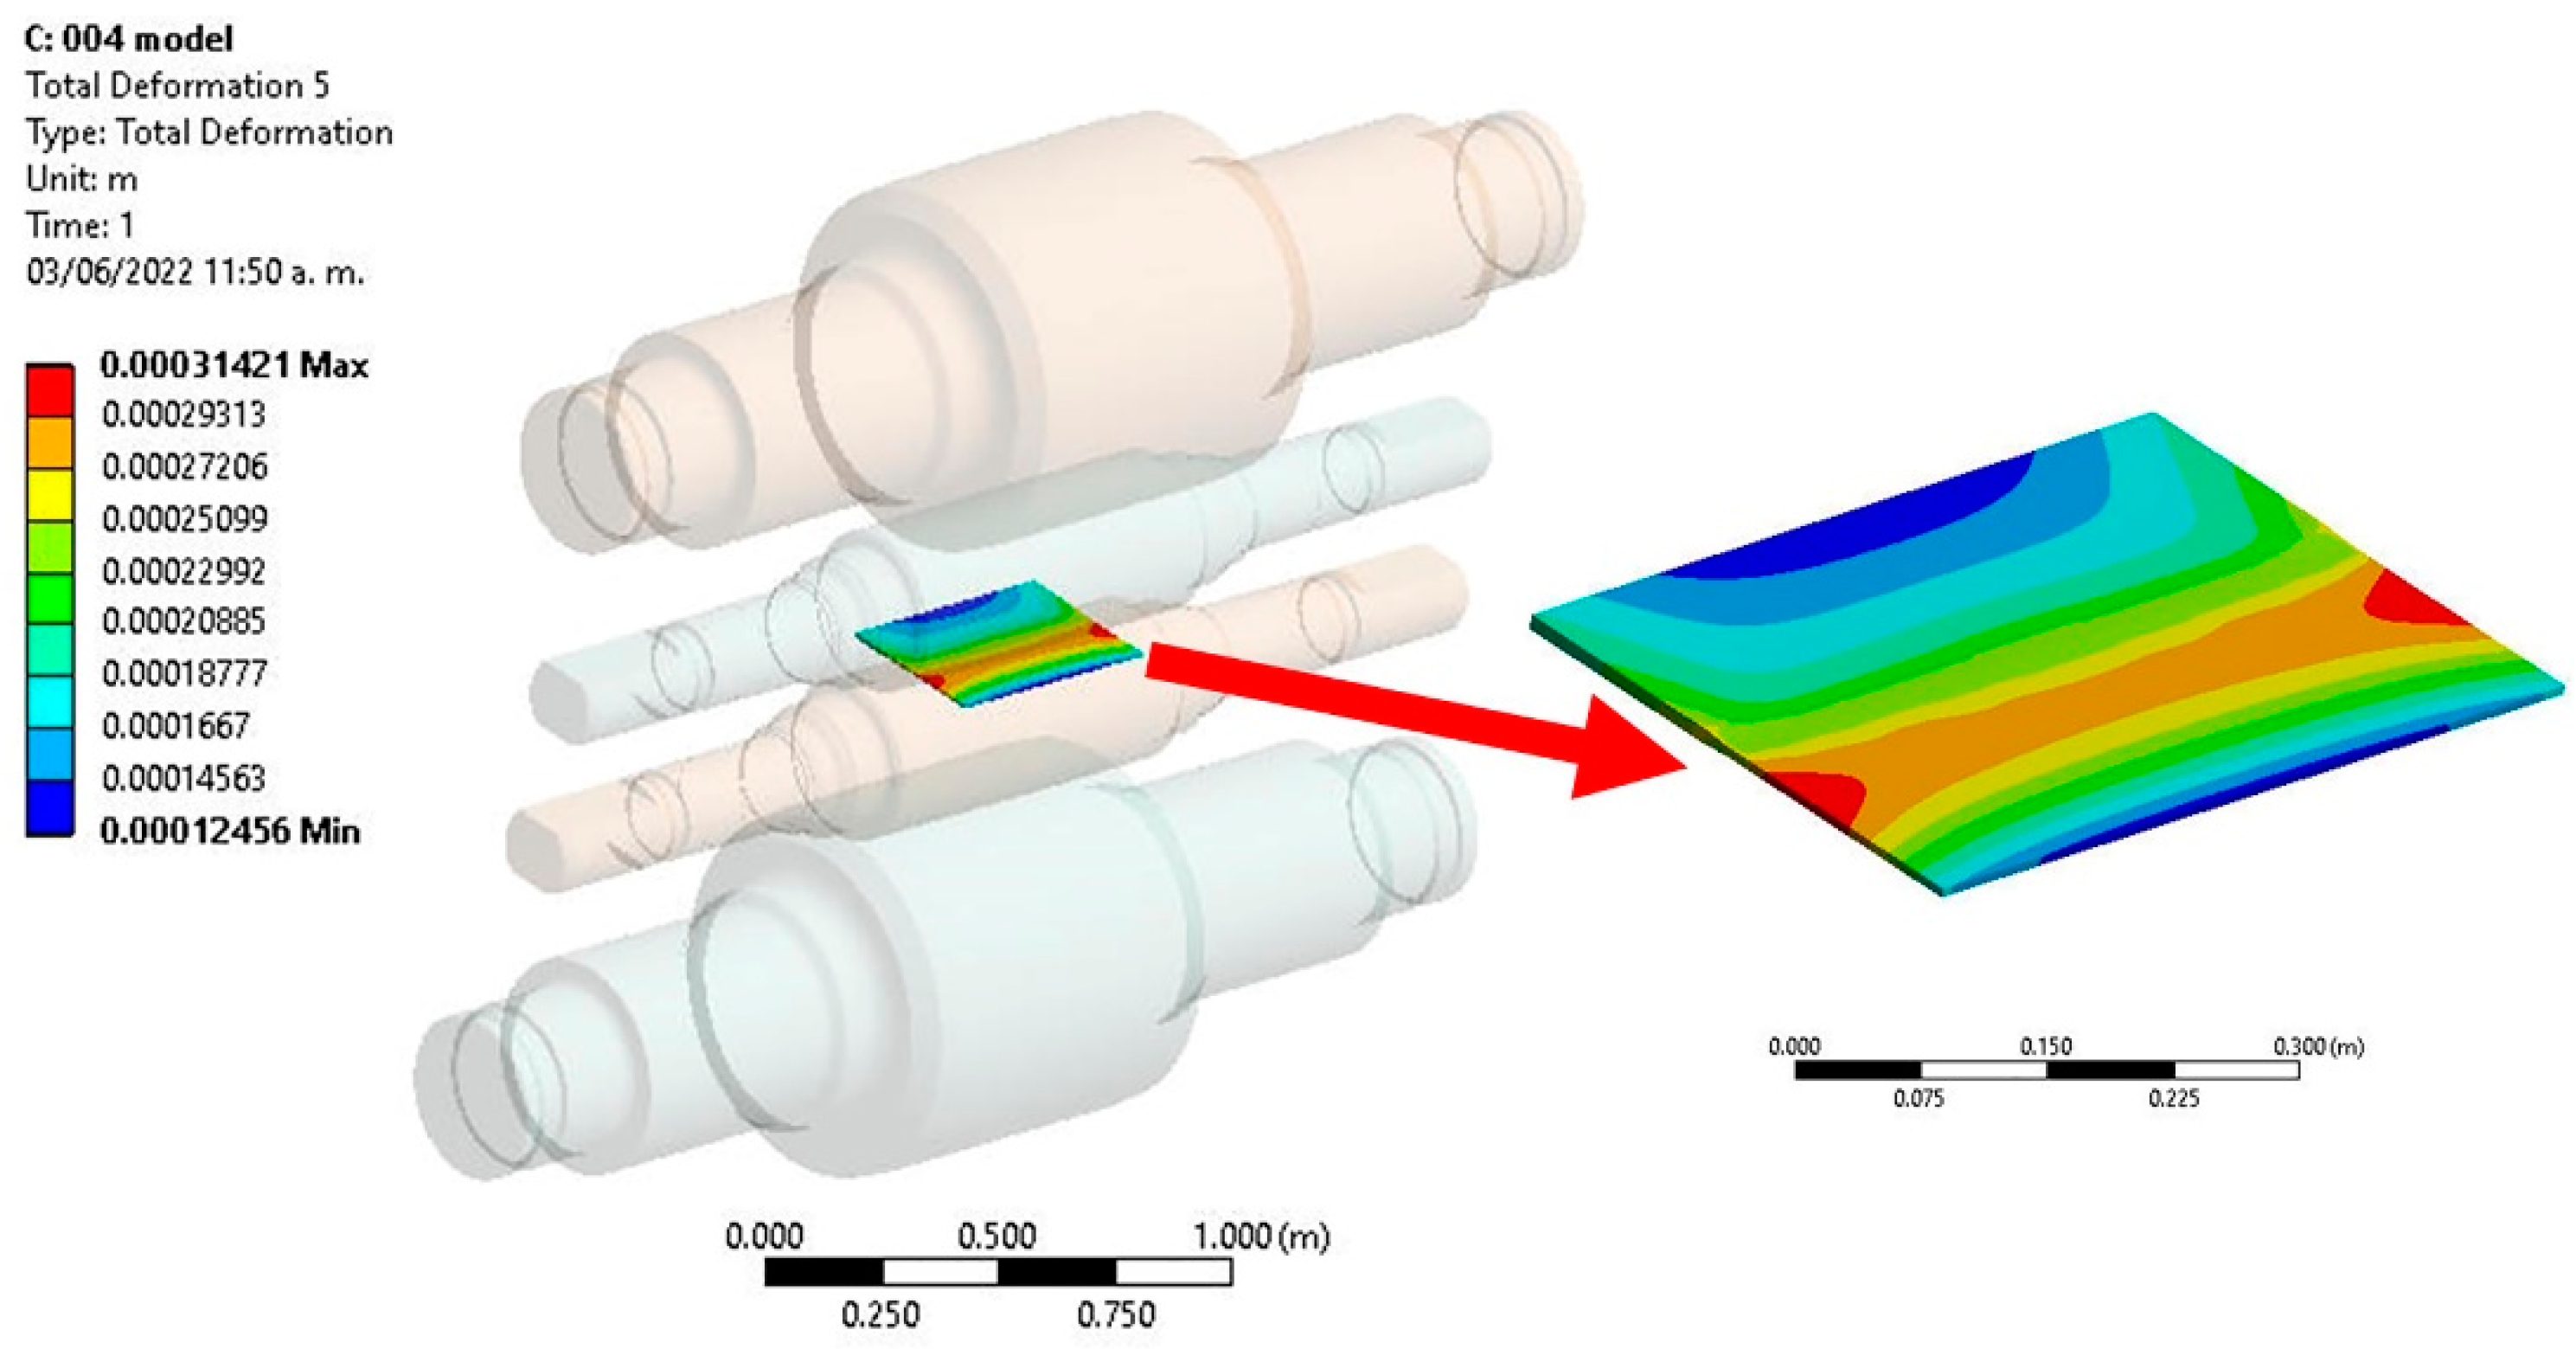
Figure 5 shows the stress concentration in the strip edge, therefore, in this area is normal to get the edge drop on the strip; it can be confirmed with the results of the simulation shown in a schematic illustration of
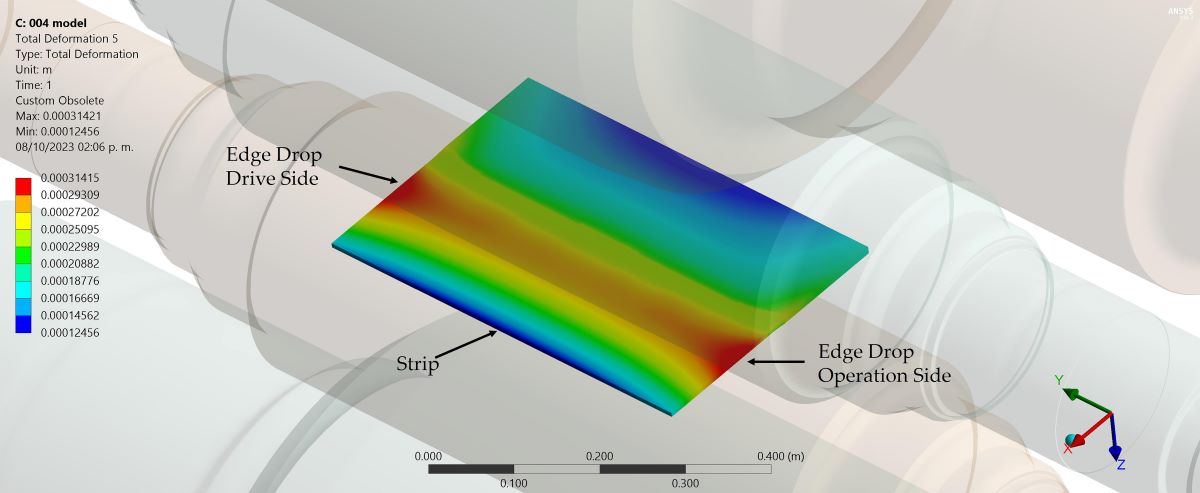
Figure 6, where we can observe the maximum deformation on the strip edge.
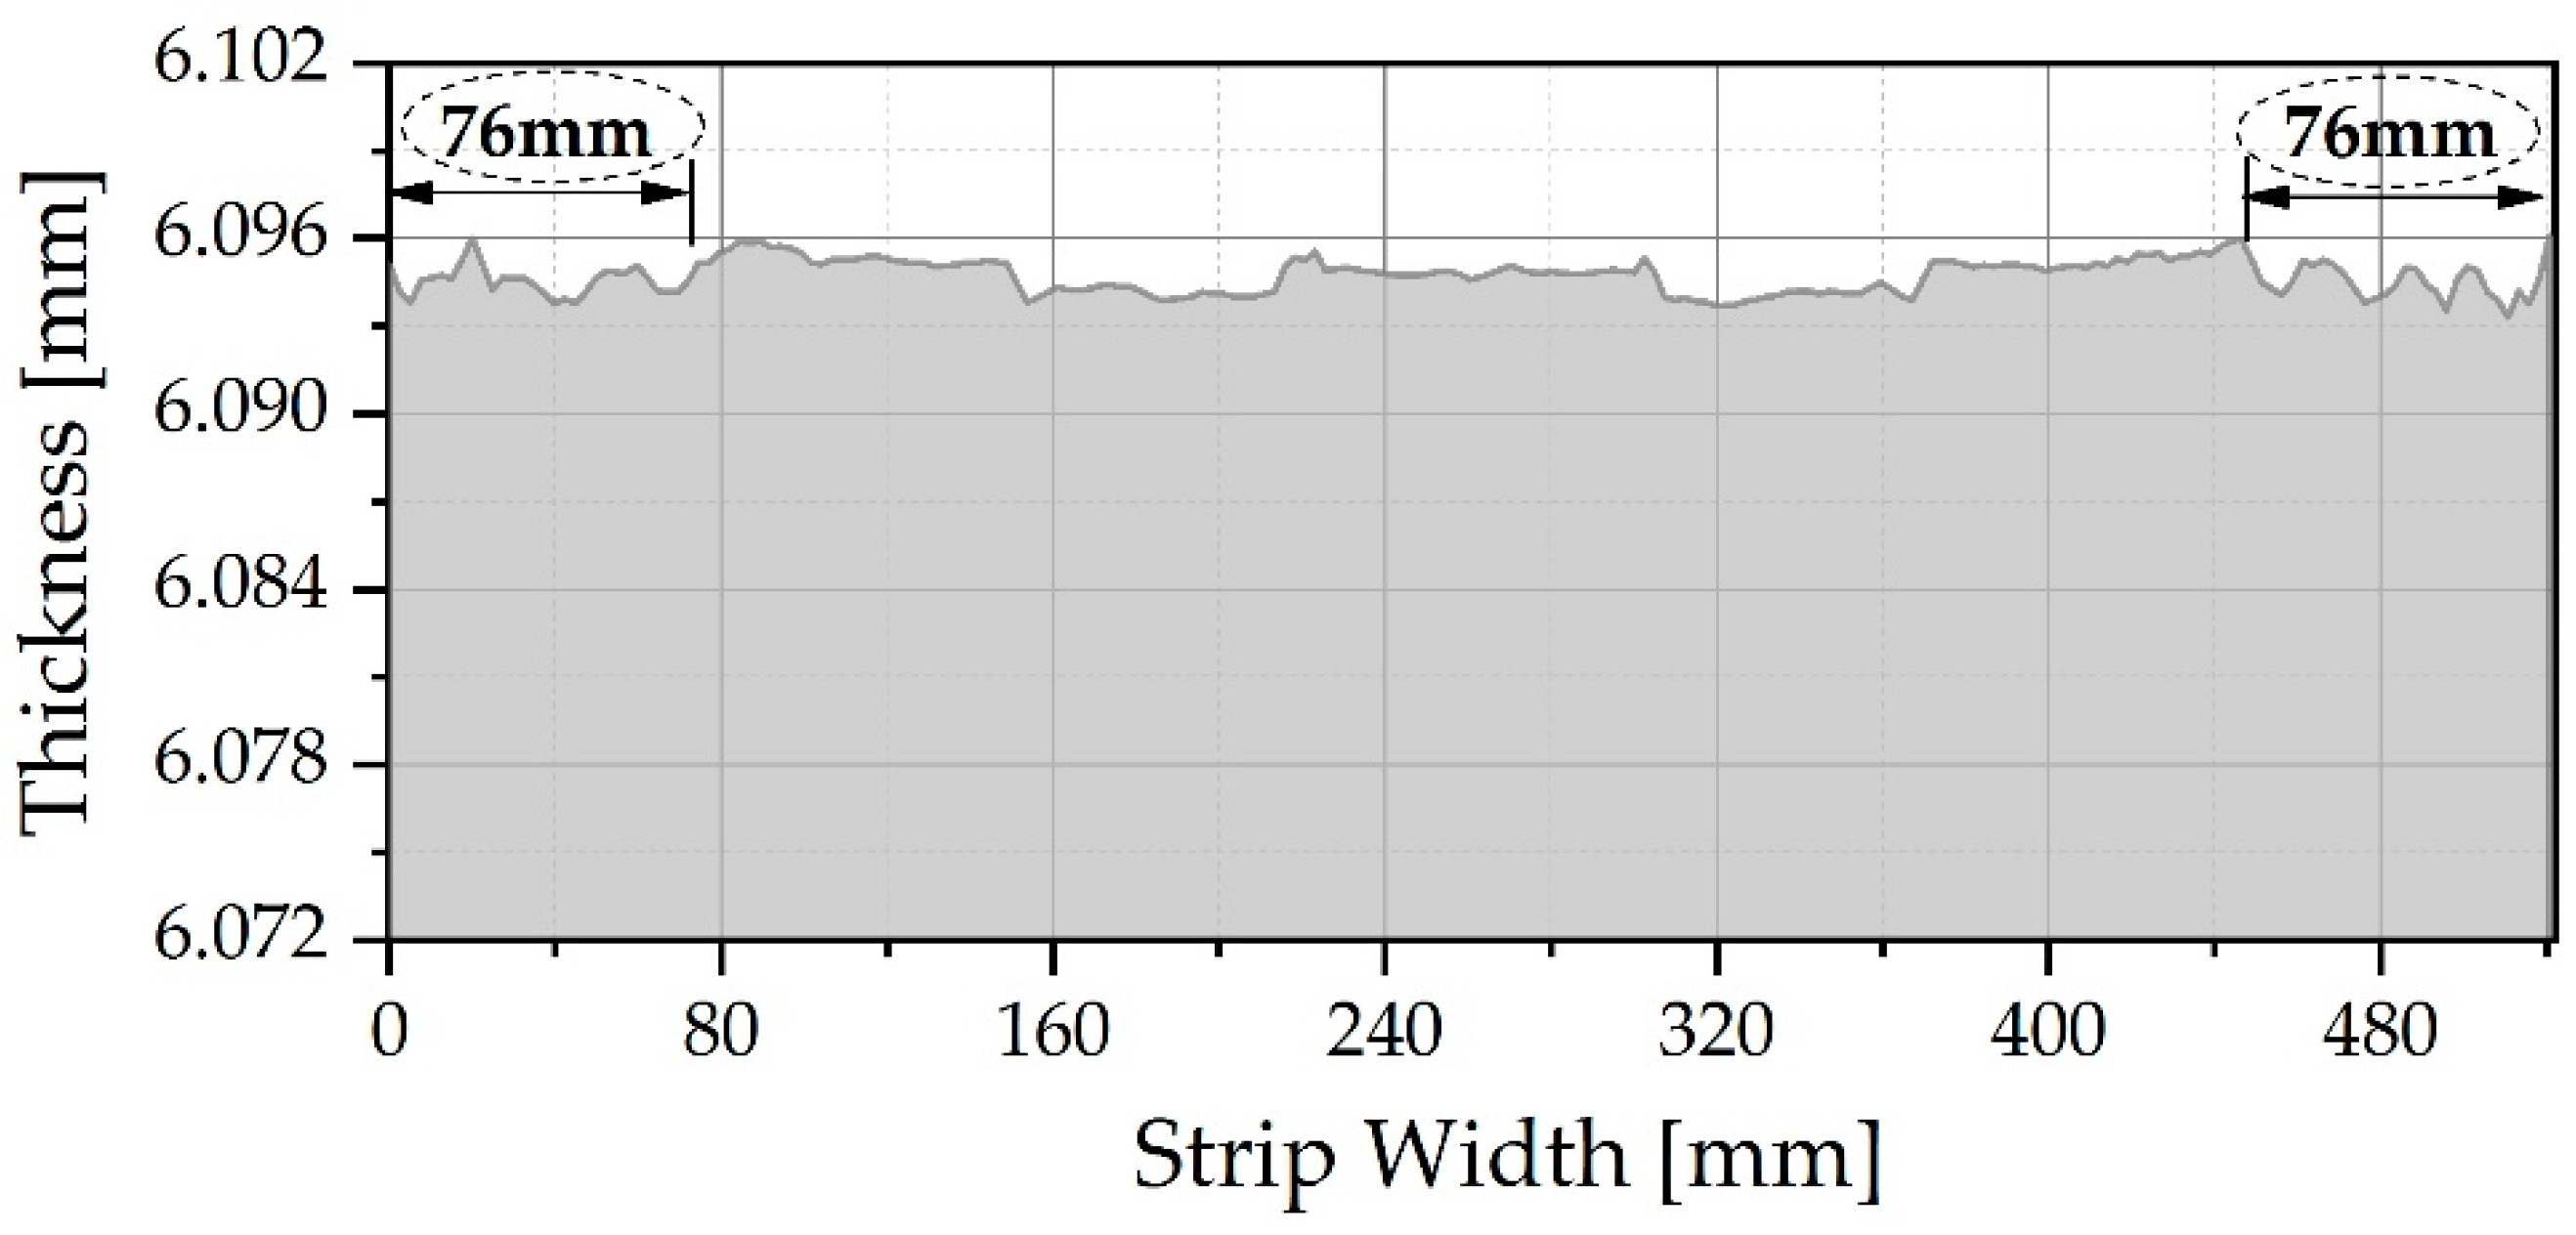
The thickness of the strip obtained from the FEM simulation is shown in
Figure 7, this illustration shows instability in all the width of strip, however, in the strip edge the variation is more critical, the zone of instability has a length of approximately 76 mm, the effect is similar on both edges of the strip. Comparing the last three figures of Stress, deformation, and thickness, all of them confirm that the strip edges revealed a zone of stress concentration and instability causing the edge drop.
To get an idea of the elastic curve during the cold rolling process, the
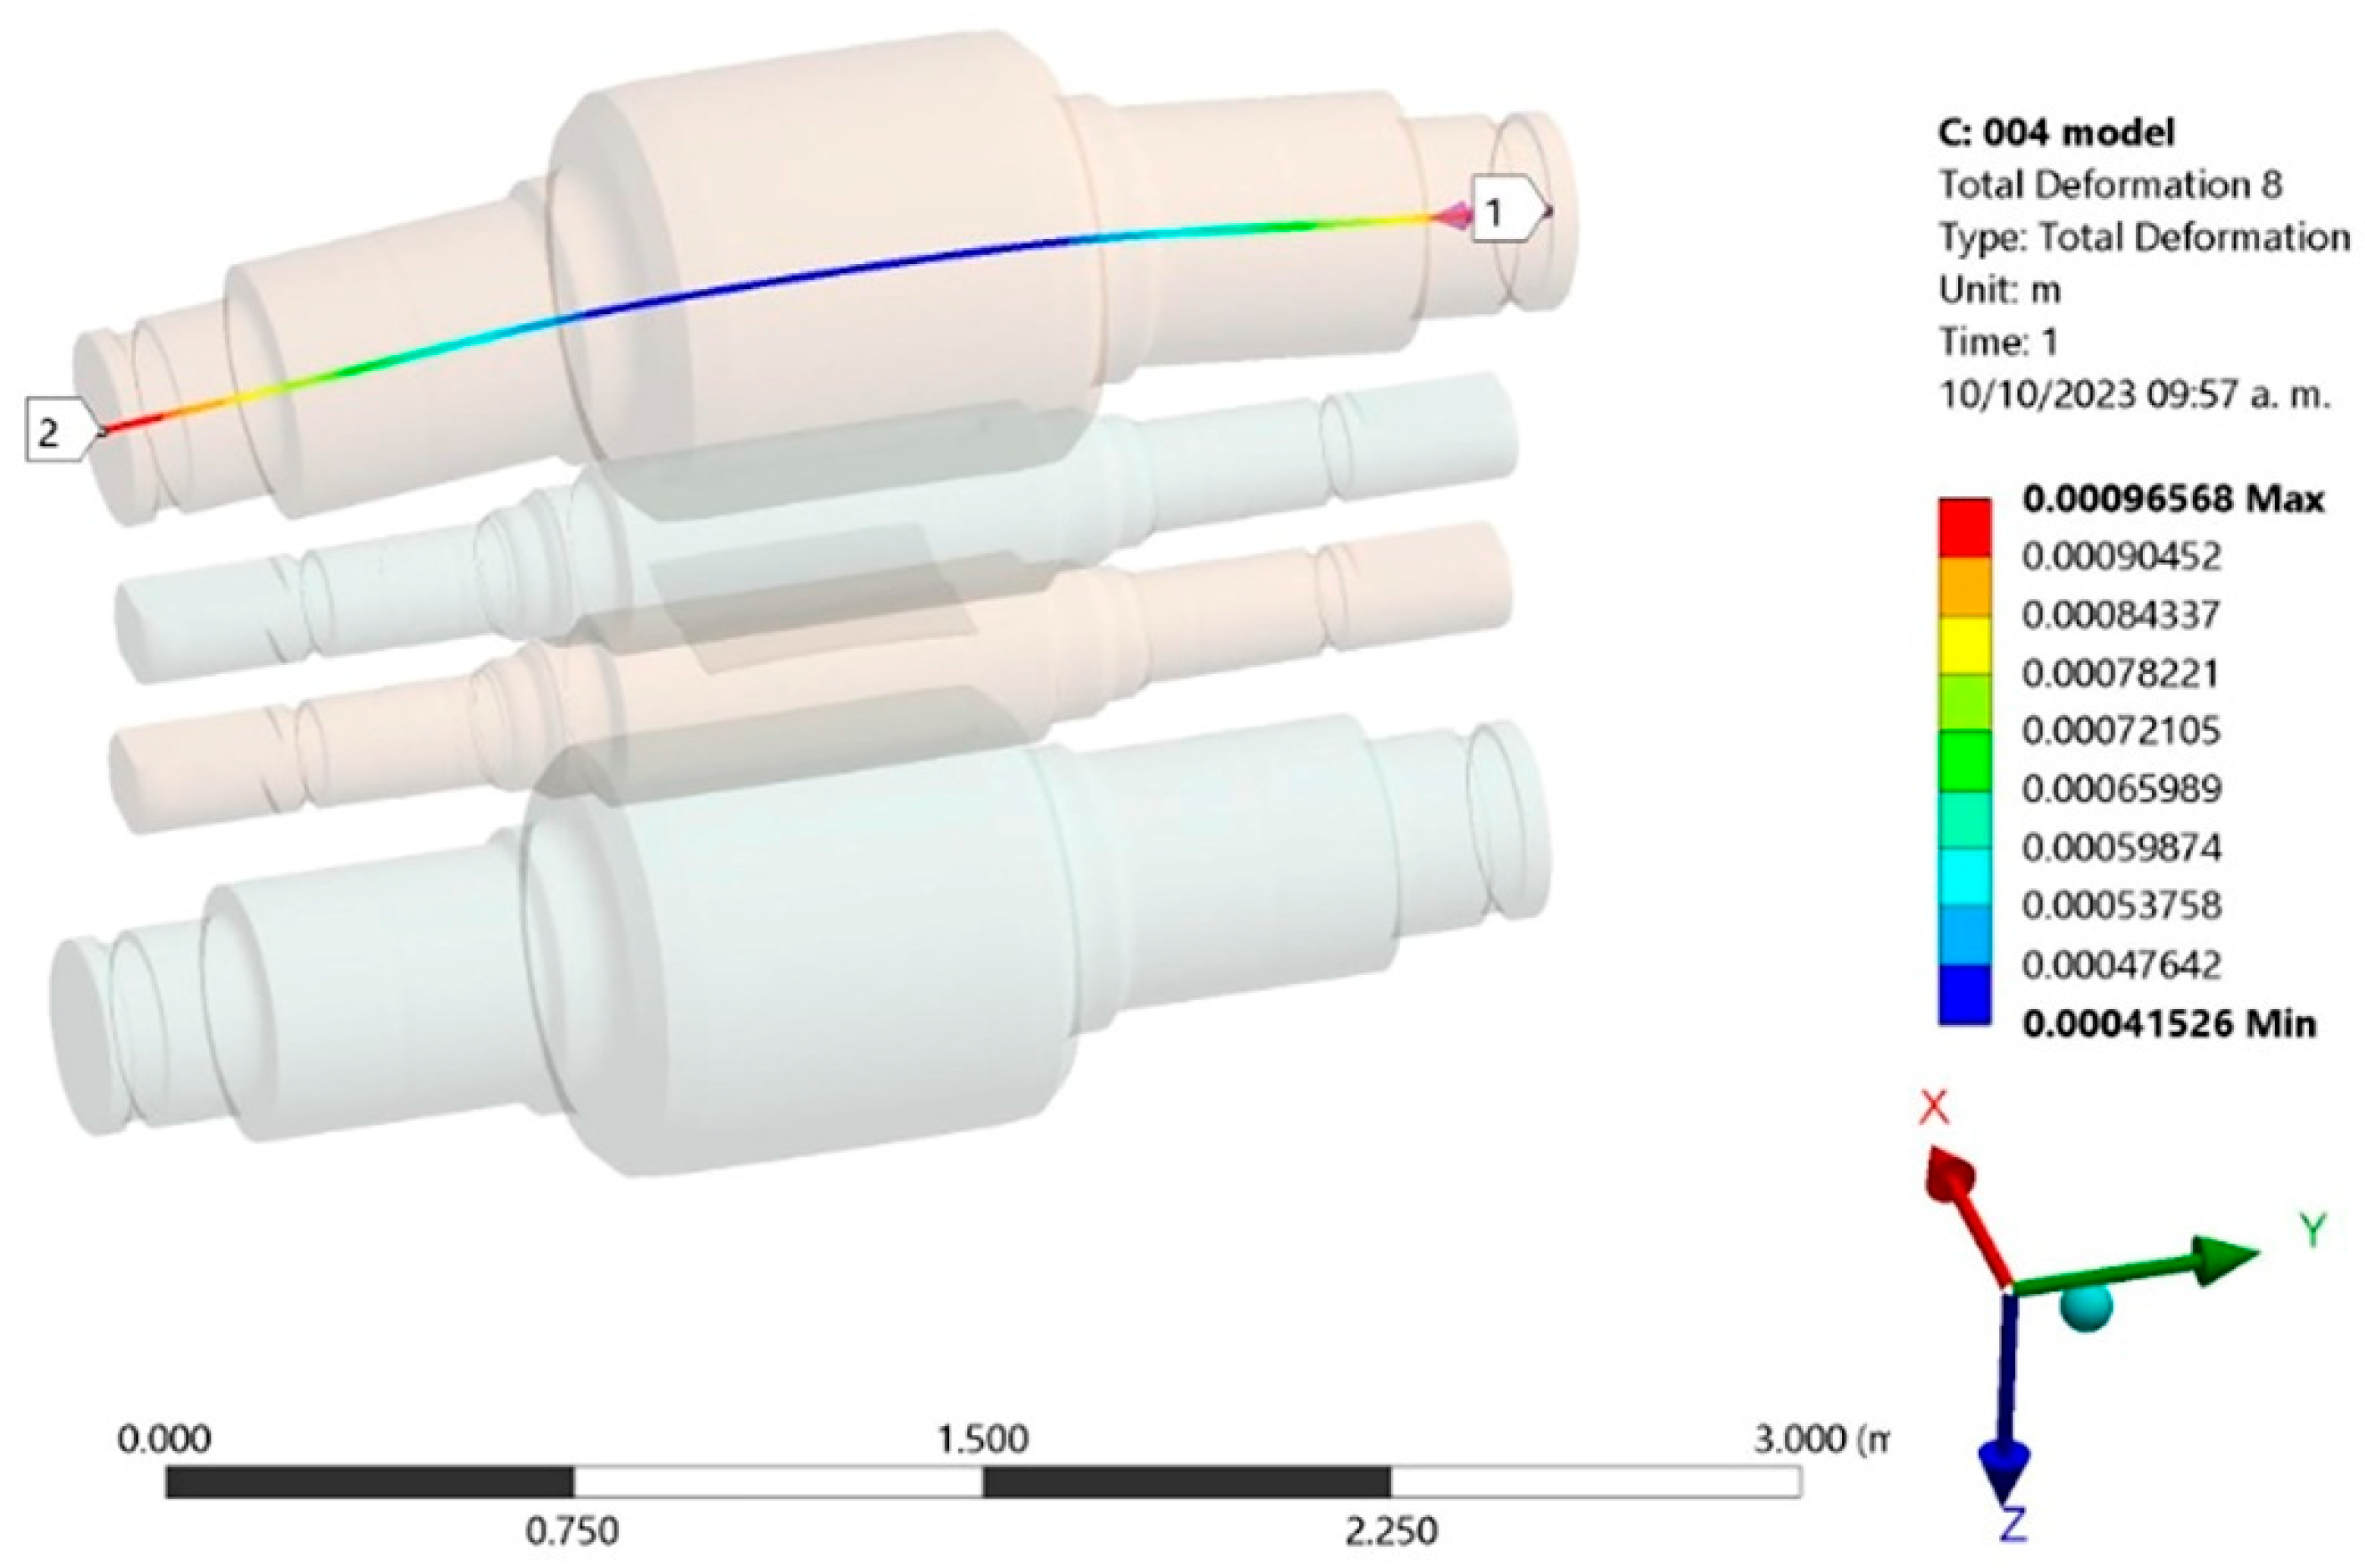
Figure 8 shows the illustration of bending in the axis of BUR. In this illustration we can see the maximum bending and deformation at the end of the neck for BUR, however, the zone of interest for the process of rolling and quality of the shape in the strip is the zone of contact between the rolls and the strip, particularly in this case in the strip width of 520.7 mm. The simulation results of this zone are compared in
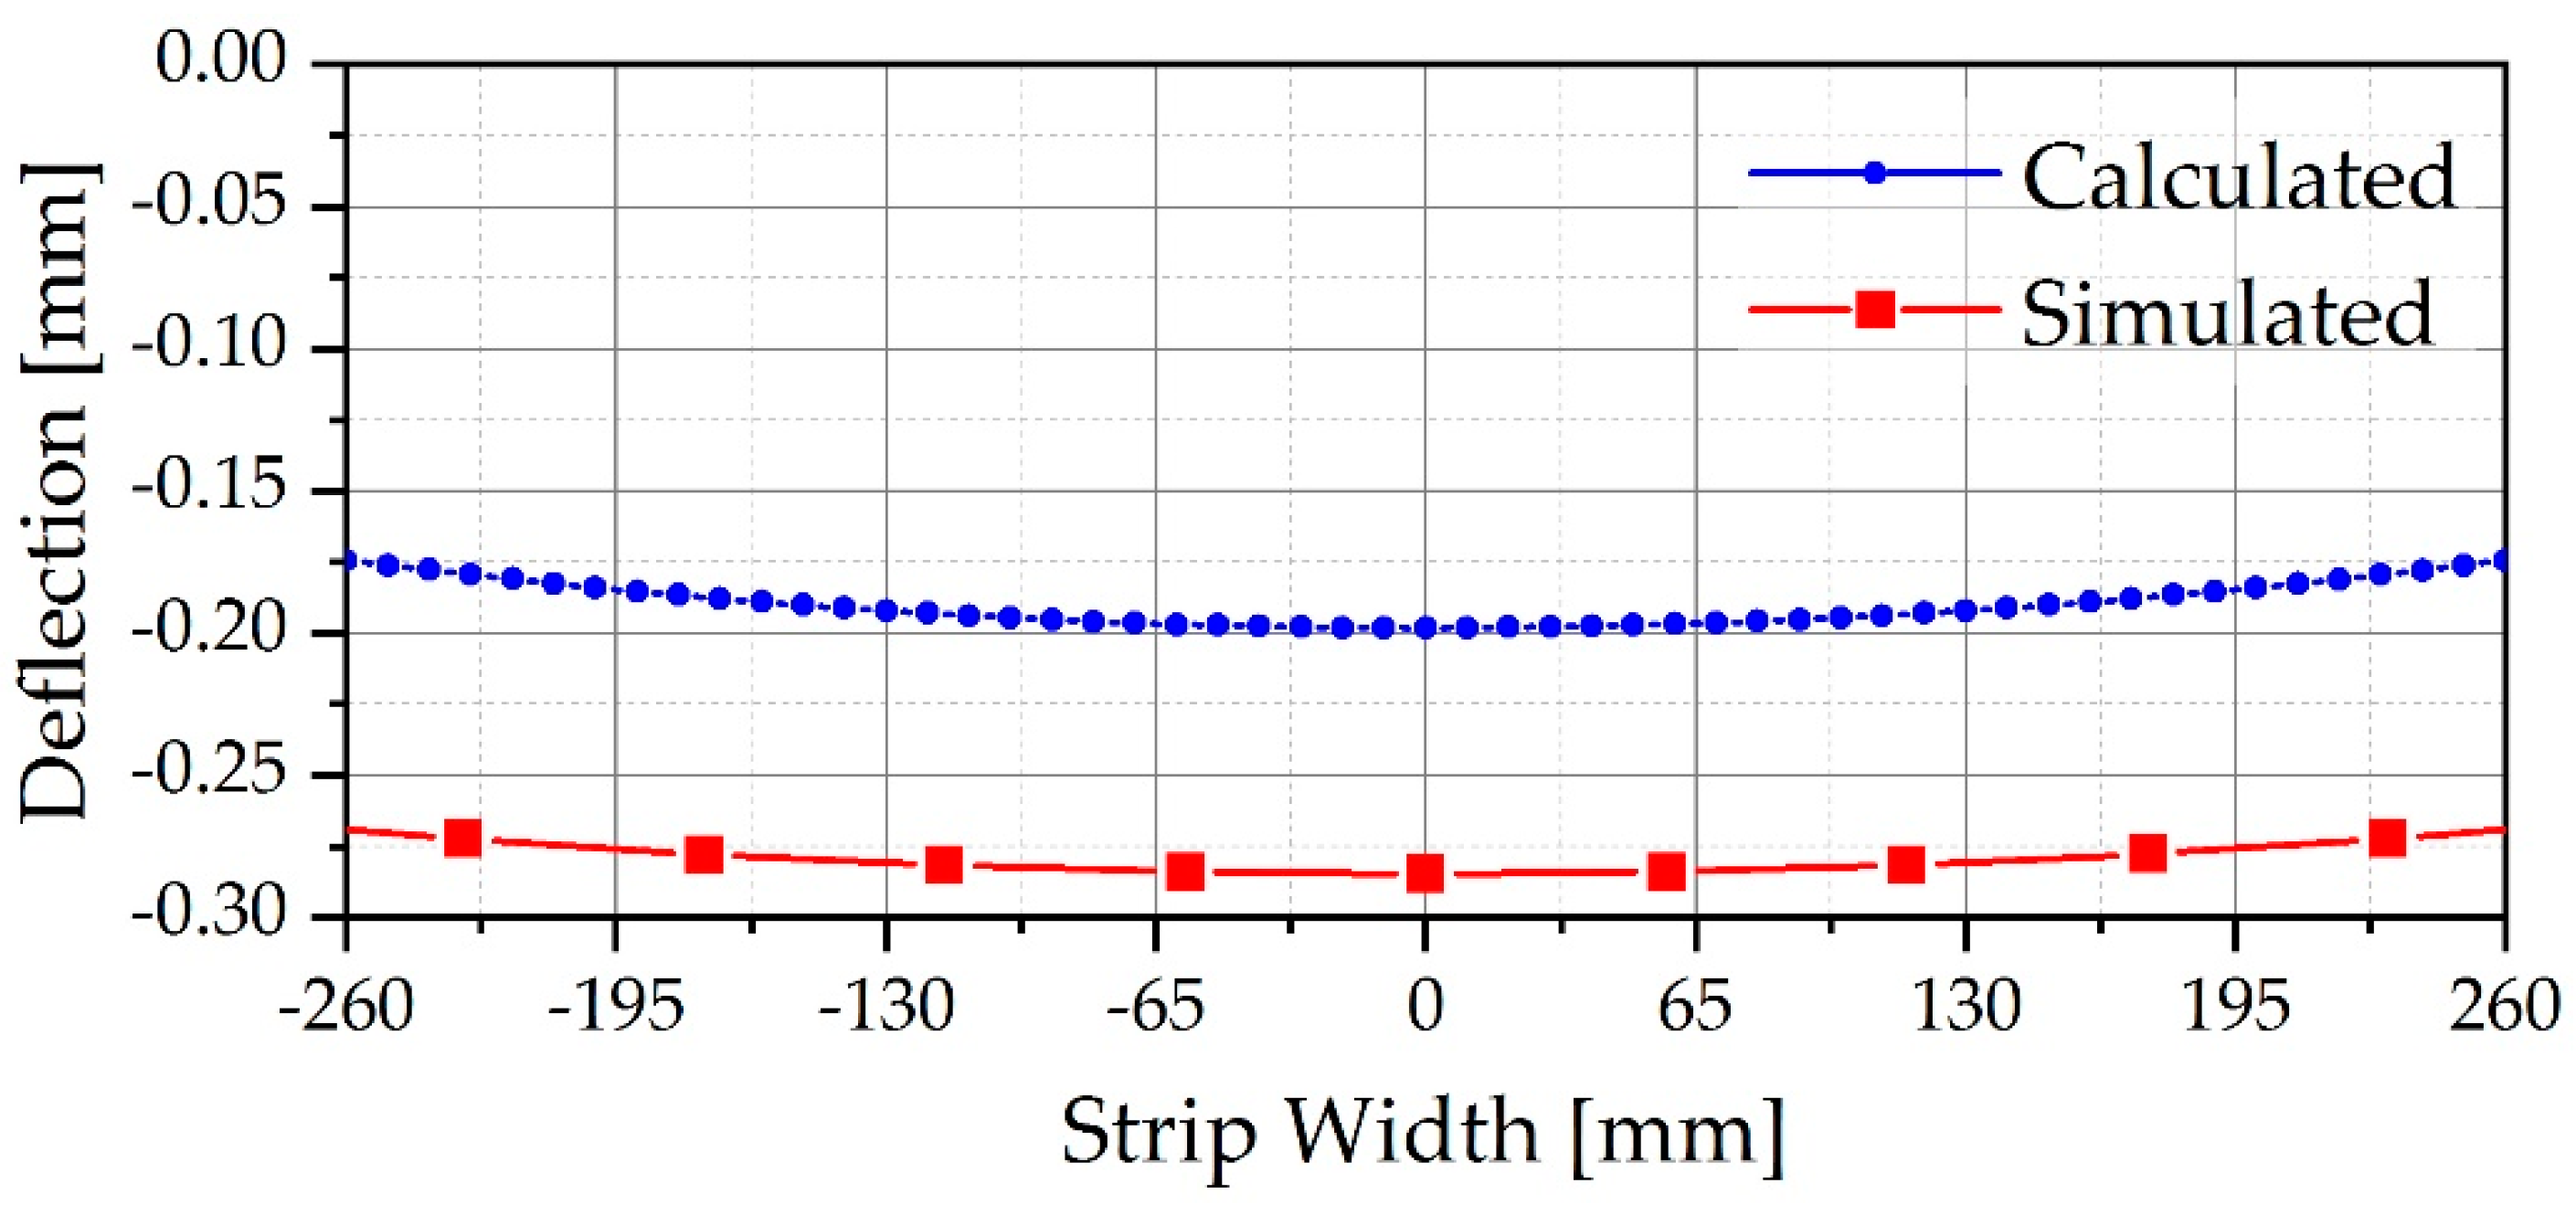
Figure 9 with the graph of the mathematical equation of elastic curve obtained from the theoretical analysis. The values have a small difference of 0.08 mm, however, the geometry of them is exactly the same, this means that the simulation analysis of the rolling process for a 4-high cold Mill is in agreement with the theoretical analysis of the process as a simply supported beam.
3.3. Industrial Results
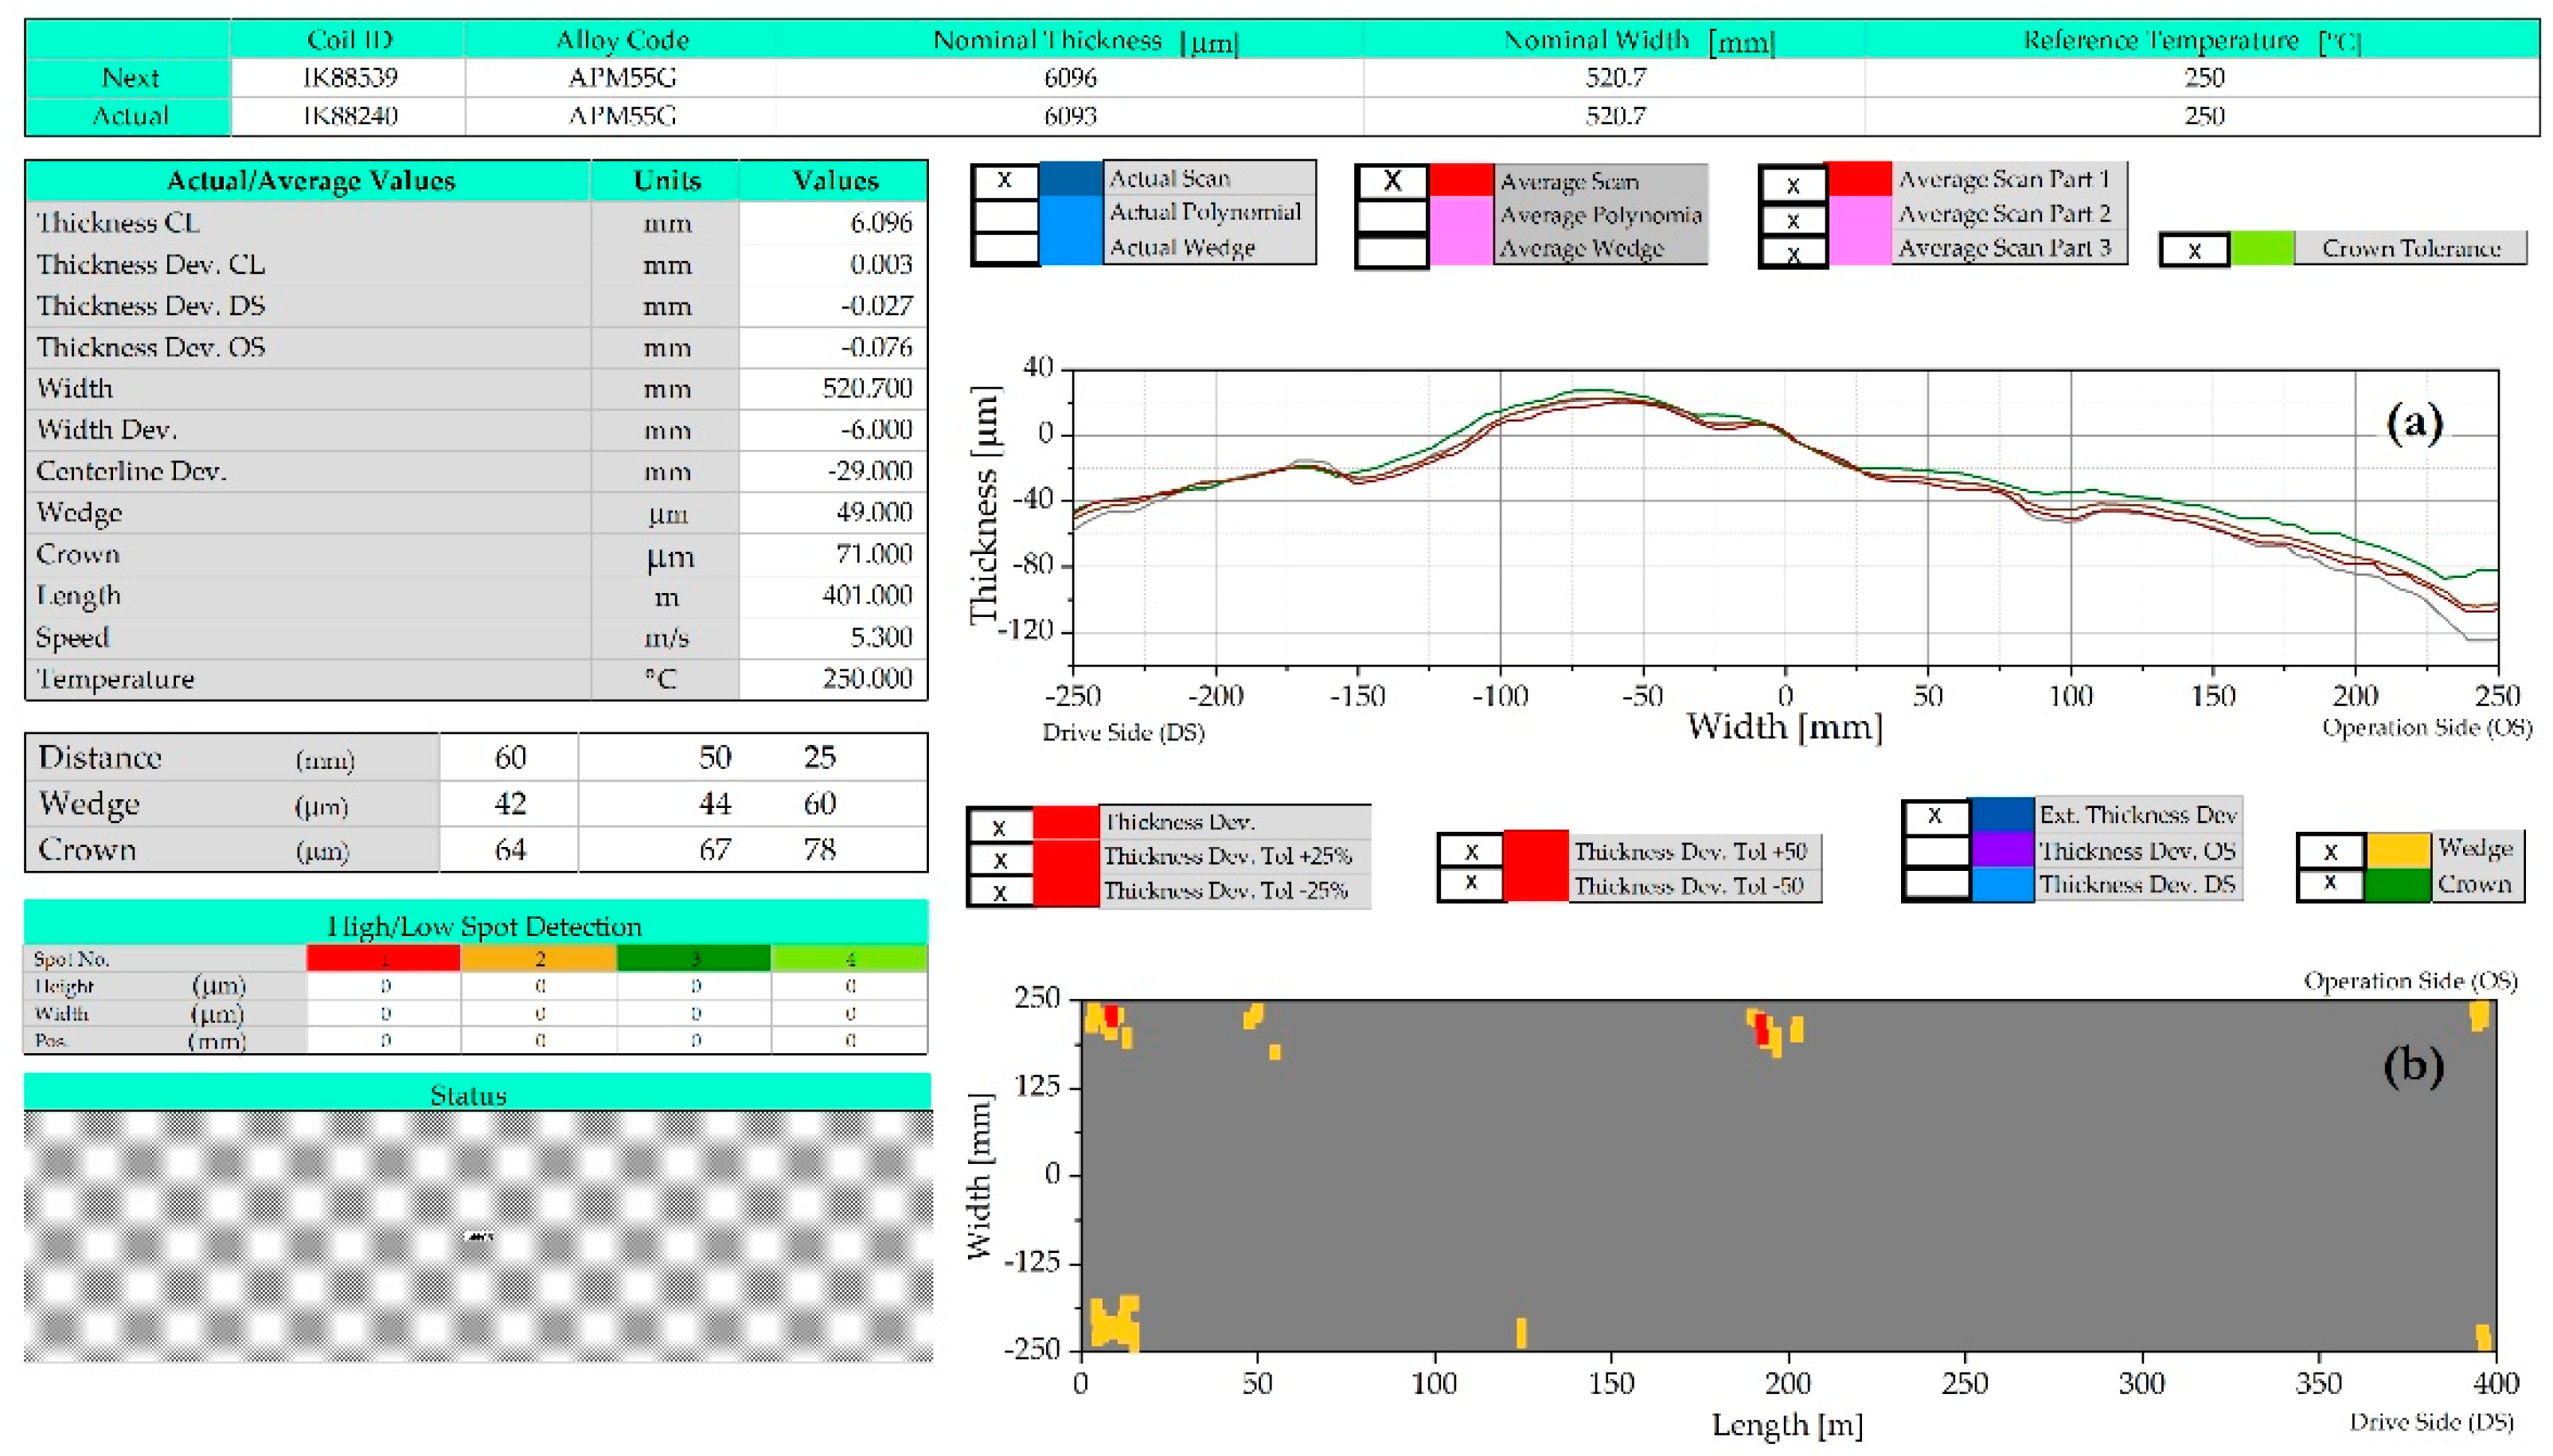
The industrial validation of the scientific analysis is an essential tool to guarantee the efficiency of the study, the objective of the industrial validation is to prove that the obtained results with simulation and calculated values of edge drop agree with the industrial results obtained with the use of compact X-ray thickness gauge installed in a 4-high cold mill. The
Figure 10a displays an illustration of the average of profile width showing that in the strip there is a thickness variation of 180 µm, with more instability in the Operation Side (OS, -140 µm) than in the Drive Side (DS, 40 µm). It is confirmed in the
Figure 10b with the marks of alarm, showing that in the total coil length of 400 m the thickness deviation appears more frequently on OS than on DS.
According to the results of the graphs from control pulpit, the problem of edge drop is always critical in the strip edge, it is confirmed in the images of
Figure 11.
Figure 11a illustrates in the strip edge a little difference in the color, it represents a value close to 73 µm which is considered as edge drop, indicating that there is a disturbance on the thickness of the strip of almost 70 mm width, moreover, the most critical case is in the entry and tail of coils, because in this interval of time there is an instability, shown in
Figure 11b, almost in 20 m long in the entry and tail of coils.
4. Discussion
Rolling forces applied on the bearing zone produce the elastic curve on BUR and consequently the shape of the strip, affecting the flatness, profile, and reduction on thickness; to distribute the pressure and avoid the stress concentration variables as taper roll contour, crown and chamfers at the ends has been studied, however the problem of drop edge continues on the strip edge. The points of change or points of discontinuity B and C correspond to the strip edge. The geometry of curves for bending moment and elastic curve are symmetrically opposite, but the profile is similar. Analyzing the points of change B and C, the results showed that the difference between the values in the centerline and those of the strip edge are very similar for bending moment and elastic curve, 18.37% vs 12.24% respectively.
The stress concentration indicates instability and consequently alterations on the flatness and thickness of the strip, the images of the simulation shown in
Figure 5 are in agreement with the edge drop obtained in the strip edge shown in
Figure 10b and
Figure 11a. Moreover, the 76 mm width of instability obtained by simulation in the edges shown in
Figure 7 matches the results of edge drop shown in
Figure 10b and
Figure 11a.
The geometry of the elastic curve obtained on BUR with theorical analysis shown in
Figure 4d has the same profile of the elastic curve obtained by simulation software according to the image shown in
Figure 8, WR transmit the mechanical contact and compress the thickness of strip generating the profile of strip shown in
Figure 10a, it has a similar appearance with the profile of elastic curves described hereto; this means that mathematical model, simulation, and industrial results are in agreement.
According to the results obtained with the theoretical analysis and simulation software, there is a relationship between all the analyzed variables with edge drop produced on the strip, it is critical in the strip edge or points B and C stablished in this study, moreover, industrial results indicated that edge drop is more critical in the entry and tail of coil, due to a disturbance on the thickness and instability of the process.
The geometry of theoretical and simulated results for elastic curve shown in
Figure 9, are similar and symmetric on both sides of the strip, it is due to the conditions, considered as an ideal system, however, in the geometry of the strip shown in
Figure 10a, there is a thickness deviation that appears more frequently in OS than in DS; Rongrong et. al. [
27] described the destabilizing of rolling mill due to the evident energy exchange process between BUR and WR, which is transmitted to the strip.
5. Conclusions
The profile on strip takes the geometry of the elastic curve of BUR. The phenomenon of edge drop in rolling process is a common problem, a result of static distribution of forces and stress concentration in strip edge, to avoid it, it is necessary to carry out an analysis of every roll mill as a particular case, looking to decrease or invert the elastic curve of BUR.
The elastic curve is a function of rolling mill design, mechanical properties of rolls and operation variables for the rolling process; the problem of edge drop is a function of these variables, to decrease the elastic curve it is necessary the use of adequate crowns on rolls for every particular case of each rolling mill combined with the use of roll bending moment.
The present study analyzed the rolling mill process, considering it as a simply supported beam, however, in the centerline the shear force is zero, meaning that it could be analyzed as a cantilever beam system.
The evidence documents that the mathematical analysis and simulation are validated on an industrial scale and consistent results can be obtained, which helps considerably to understand the principle of edge drop. To reduce the edge drop and significantly improve the surface quality of the strip the authors recommend to complement the FEM simulation compensating the elastic curve of BUR in the process applying bending on WR combined with the use of positive crowns on it.
Author Contributions
Conceptualization, R.S. and I.C.; methodology, I.C. and A.P.; software, S.A.A. and A.R.M.; validation, R.S., I.C. and S.A.A; formal analysis, A.P. and H.J.V.; investigation, R.S., I.C., S.A.A., and A.P.; resources, A.R.M. and H.J.V.; writing—original draft preparation, R.S. and I-C-; writing—review and editing, R.S., I.C. and S.A.A.; supervision, R.S. and I.C.; project administration, A.P., A.R.M and H.J.V. All authors have read and agreed to the published version of the manuscript.
Funding
This research received no external funding.
Data Availability Statement
Not applicable.
Acknowledgments
The authors thank to Dirección de Investigación y Posgrado from UAdeC for their continuous support to the Mechanical Engineering Department.
Conflicts of Interest
The authors declare no conflict of interest.
References
- Guang-hui Yang, Jie Zhang, Jian-guo Cao. Edge drop constituent analysis of cold rolled strip. Applied Mechanics and Materials. (2012) Vols. 117-119, pp 134-137. [CrossRef]
- Cao Jian-guo, Chai Xue-ting, Li Yan-lin, Kong Ning, Jia Sheng-hui, Zeng Wei. Integrated Design of Roll Contours for Strip Edge Drop and Crown Control in Tandem Cold Rolling Mills. Journal of Materials Processing Technology. (2018) Volume 252, pp 432-439. [CrossRef]
- Guang-hui Yang, Jie Zhang, Hong-bo Li, Jian-guo Cao, Sheng-hui Jia. Taper Roll Contour Design for Edge Drop Control of Non-oriented Electrical Steel on Tandem Cold Rolling Mill. Applied Mechanics and Materials. (2012) Vols 166-169 pp 670-673. [CrossRef]
- Chi-huan Yaoa, An-rui Hea, Jian Shaoa, Yun-jin Zhangb and Hai-shan Zhaob. Edge drop and high spot control of hot-rolled non-oriented electrical steel strip by taper roll shifting strategy. Ironmaking & Steelmaking, (2018) 1743-2812. [CrossRef]
- Cao Jian-guo, Wang Yan-lin, Li Hong-bo, Song Mu-qing, Jia Sheng-hui, Gong Gui-liang. Study on the Shifting Model of Edge Drop Control in Ultra-Wide 6-high Tandem Cold Rolling Mill. Advanced Materials Research. (2012) Vols. 452-453 pp 1257-1261. [CrossRef]
- Hongbo Li, Zhenwei Zhao, Dawei Dong, Guomin Han, Jie Zhang, Haichao Liu and Xuechang You. Edge-Drop Control Behavior for Silicon Strip Cold Rolling with a Sendzimir Mill. Metals. (2018), 8, 783. [CrossRef]
- Chang, A.; Di, H.S.; Bai, J.L.; Dong, Q.; Yang, D.J. Effect of Rolling Parameters on Edge-Drop in Cold Rolling. Iron Steel. (2007), 42, 51–56. [CrossRef]
- Lu, H.T.; Cao, J.G.; Zhang, J.; Zeng, J.S.; Zeng, W.; Qin, S.G. Edge drop control of a taper roll during continuous cold rolling. J. Univ. Sci. Technol. Beijing. (2006), 28, 774–777. [CrossRef]
- Xuan, K.L.; Yu, W.; Tang, W.; Xiong, A.M.; Zhang, X.F.; Ren, X.Y. Simulation study of strip edge control performance of six-high cold rolling mill. Steel Rolling. (2017), 34, 33–37. [CrossRef]
- Guanghui, Y.; Jianguo, C.; Jie, Z.; Shenghui, J.; Renwei, T. Backup roll contour of a Smart Crown tandem cold rolling mil. J. Univer. Sci. Technol. Mater. (2008), 15, 357–361. [CrossRef]
- Li, H.; Xu, J.; Wang, G.; Shi, L.; Xiao, Y. Development of Strip Flatness and Crown Control Model for Hot Strip Mills. J. Iron Steel Res. Int. (2010), 17, 21–27. [CrossRef]
- Wang, X.D.; Li, F.; Li, B.H.; Zhu, G.S.; Li, B. Design and Application of an Optimum Backup Roll Contour Configured with CVC Work Roll in Hot Strip Mill. ISIJ Int. (2012), 52, 1637–1643. [CrossRef]
- Cao, J.; Wei, G.; Zhang, J.; Chen, X.; Zhou, Y. VCR and ASR technology for profile and flatness control in hot strip mills. J. Cent. South. Univ. Technol. (2008), 15, 264–270. [CrossRef]
- Xiawei Fenga, Xiaochen Wang, Quan Yang, Jiquan Sun, Zedong Wua and Yuhua Guo. Analysis of thin strip edge drop formation during cold rolling process. Australian Journal of Mechanical Engineering. (2020) 2204-2253. [CrossRef]
- Liu Xiang-hua, Xu Shi, Li Shan-qing, Xu Jian-yong, Wang Guo-dong. FEM Analysis of Rolling Pressure Along Strip Width in Cold Rolling Process. J Iron Steel Res Int. (2007), 14, 22-26. [CrossRef]
- Zhang Guo-min, Xiao Hong, Wang Chun-hua. Three-Dimensional Model for Strip Hot Rolling. J Iron Steel Res Int. (2006), 13, 23-26. [CrossRef]
- Kong Ning, Cao Jianguo, Wang Yanping, Tieu A. Kiet, Yang Lianhong, Hou Anquan and Wang Zebin. Development of Smart Contact Backup Rolls in Ultrawide Stainless Strip Rolling Process. Mater Manuf Process., (2014), 129-133. [CrossRef]
- Yanlin Li, Jianguo Cao, Lan Qiu, Ning Kong, Anrui He and Yizhong Zhou. Effect of strip edge temperature drop of electrical steel on profile and flatness during hot rolling process. Advances in Mechanical Engineering (2019), Vol. 11(4) 1–11. [CrossRef]
- Kim T. H., Lee W. H. and Hwang S. M. An Integrated FE Process Model for the Prediction of Strip Profile in Flat Rolling. ISIJ International, (2003) Vol. 43, No. 12, pp. 1947–1956. [CrossRef]
- Abdelkhalek S., P.Montmitonnet P., Legrand N., Buessler P. Coupled approach for flatness prediction in cold rolling of thin strip. International Journal of Mechanical Sciences. (2011) Volume 53, Issue 9, pp. 661-675. [CrossRef]
- Sun Jian-liang, Peng Yan, Liu Hong-min. Dynamic characteristics of cold rolling mill and strip based on flatness and thickness control in rolling process. J. Cent. South Univ. (2014) 21: 567−576. [CrossRef]
- Babak Moazeni and Mahmoud Salimi. Investigations on relations between shape defects and thickness profile variations in thin flat Rolling. Int J Adv Manuf Technol. (2015) 77, 1315–1331. [CrossRef]
- Dukman Lee, Yongsug Lee. Application of neural-network for improving accuracy of roll-force model in hot-rolling mill. Control Engineering Practice. (2002) 10 473–478. [CrossRef]
- Sikdar, S., Kumari, S.: Neural network model of the profile of hot-rolled strip. Int. J. Adv. Manuf. Technol. (2009) 42, 450–462. [CrossRef]
- Abdulrahman Aljabri, Hasan Tibar, Essam R. I. Mahmoud, Hamad Almohamadi, Feijun Qu and Zhengyi Jiang. Theoretical Analysis of Rolling Force during Cold Rolling with Roll Crossing and Shifting System. J. Manuf. Mater. Process. (2023), 7, 104. [CrossRef]
- Servin R., Arreola S., Calderón I., Perez A. and San Miguel S. Effect of Crown Shape of Rolls on the Distribution of Stress and Elastic Deformation for Rolling Processes; Metals. (2019), 9, 1222. [CrossRef]
- Rongrong Peng, Xingzhong Zhang and Peiming Shi. Vibration Characteristics of Hot Rolling Mill Rolls Based on Elastoplastic Hysteretic Deformation. Metals (2021), 11,869. [CrossRef]
|
Disclaimer/Publisher’s Note: The statements, opinions and data contained in all publications are solely those of the individual author(s) and contributor(s) and not of MDPI and/or the editor(s). MDPI and/or the editor(s) disclaim responsibility for any injury to people or property resulting from any ideas, methods, instructions or products referred to in the content. |
© 2023 by the authors. Licensee MDPI, Basel, Switzerland. This article is an open access article distributed under the terms and conditions of the Creative Commons Attribution (CC BY) license (http://creativecommons.org/licenses/by/4.0/).
