Submitted:
18 December 2023
Posted:
19 December 2023
You are already at the latest version
Abstract
Keywords:
1. Introduction
2. Results
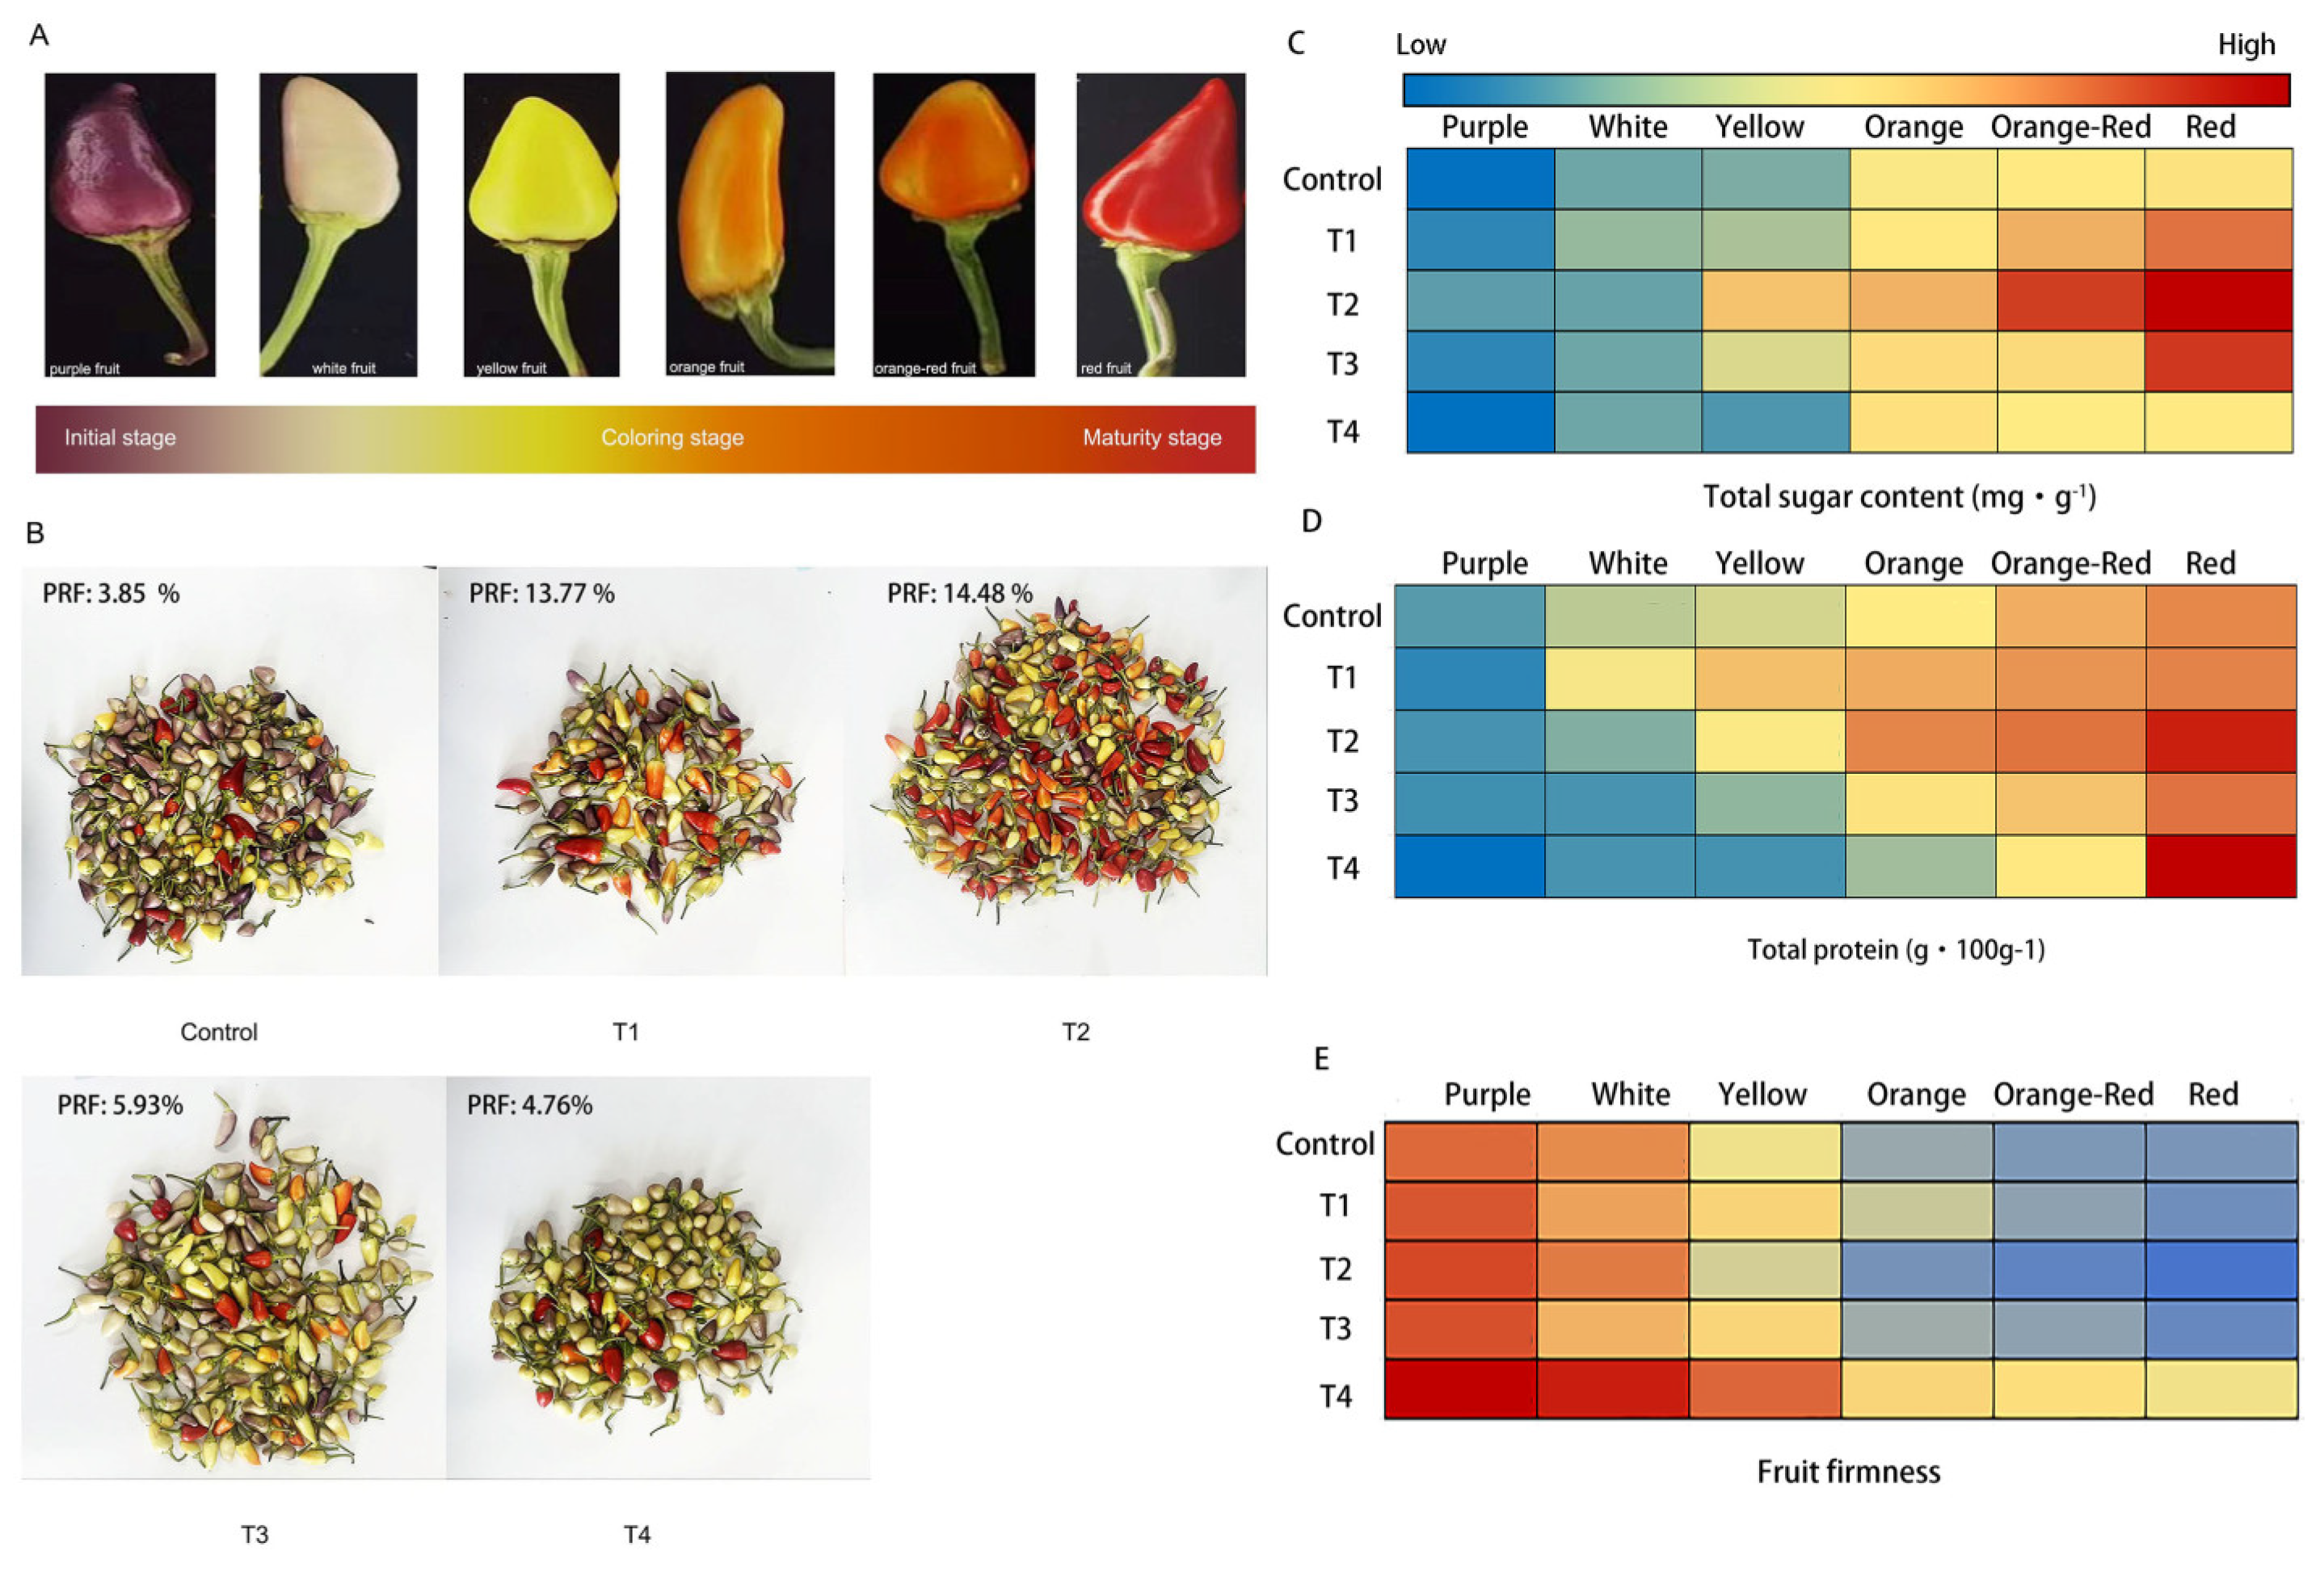
2.1. Fruit coloring in hot pepper under different LED light qualities
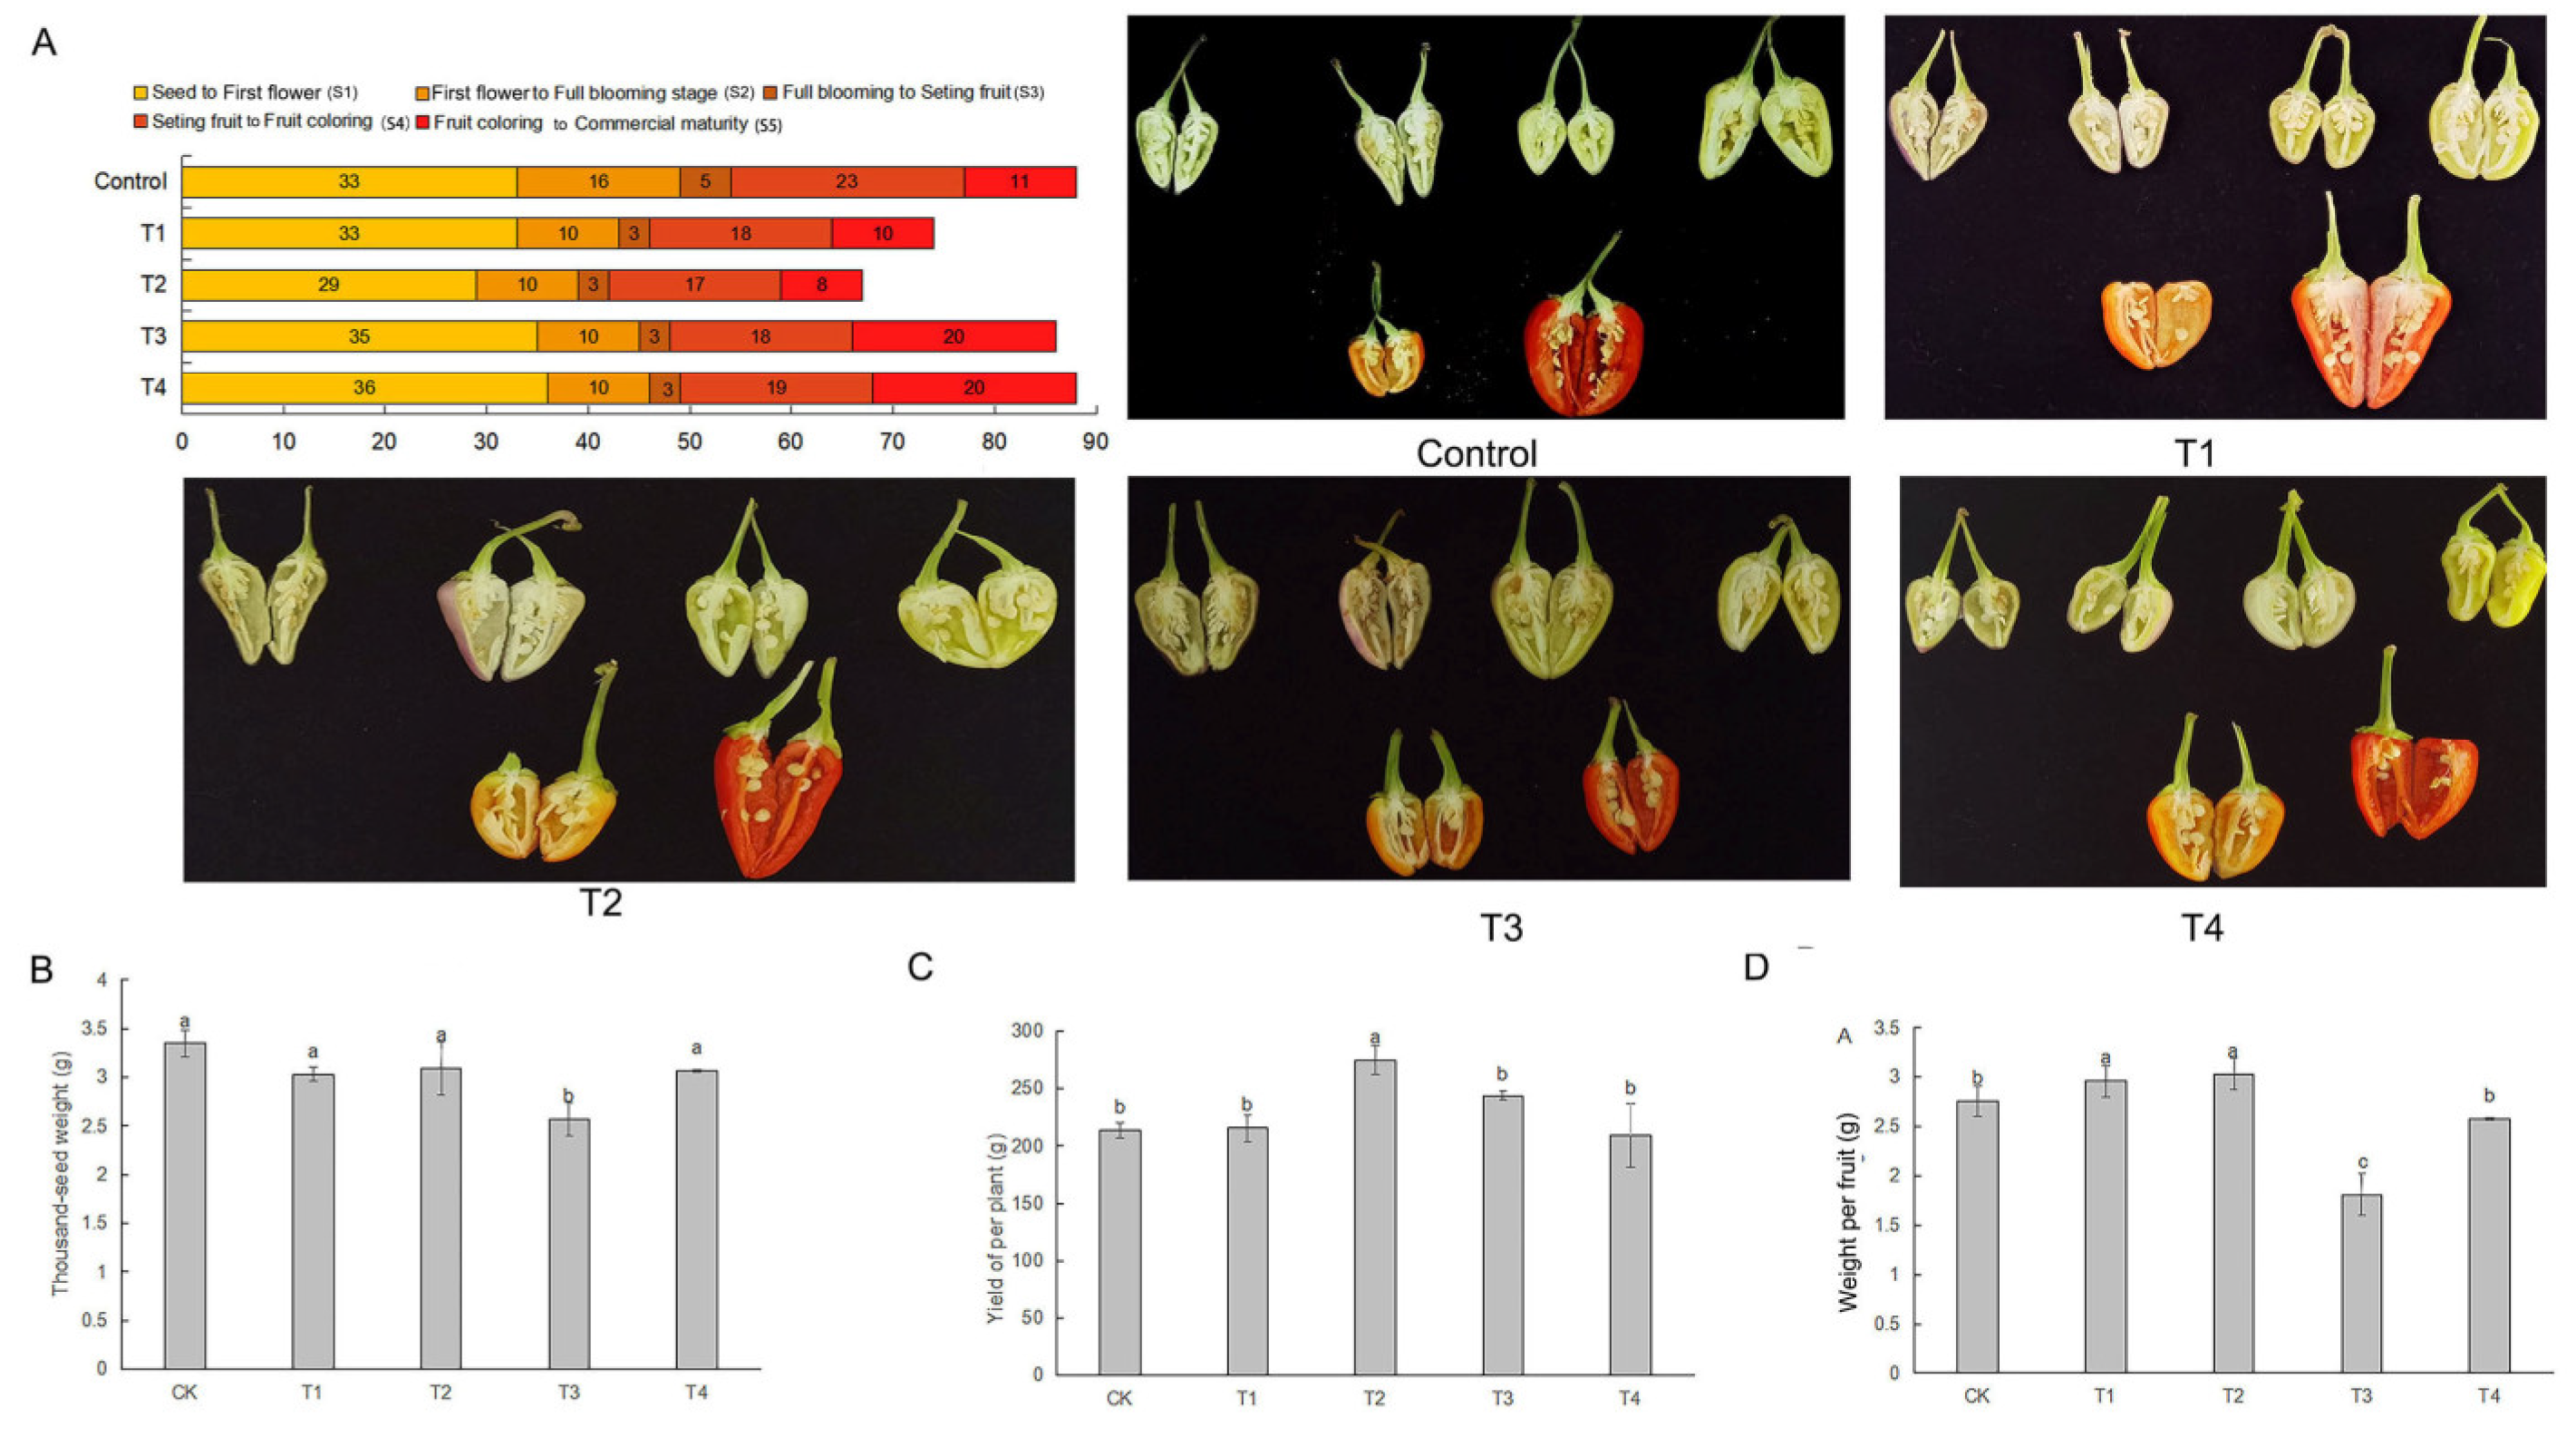
2.2. Changes in fruit maturity period under LED light qualities
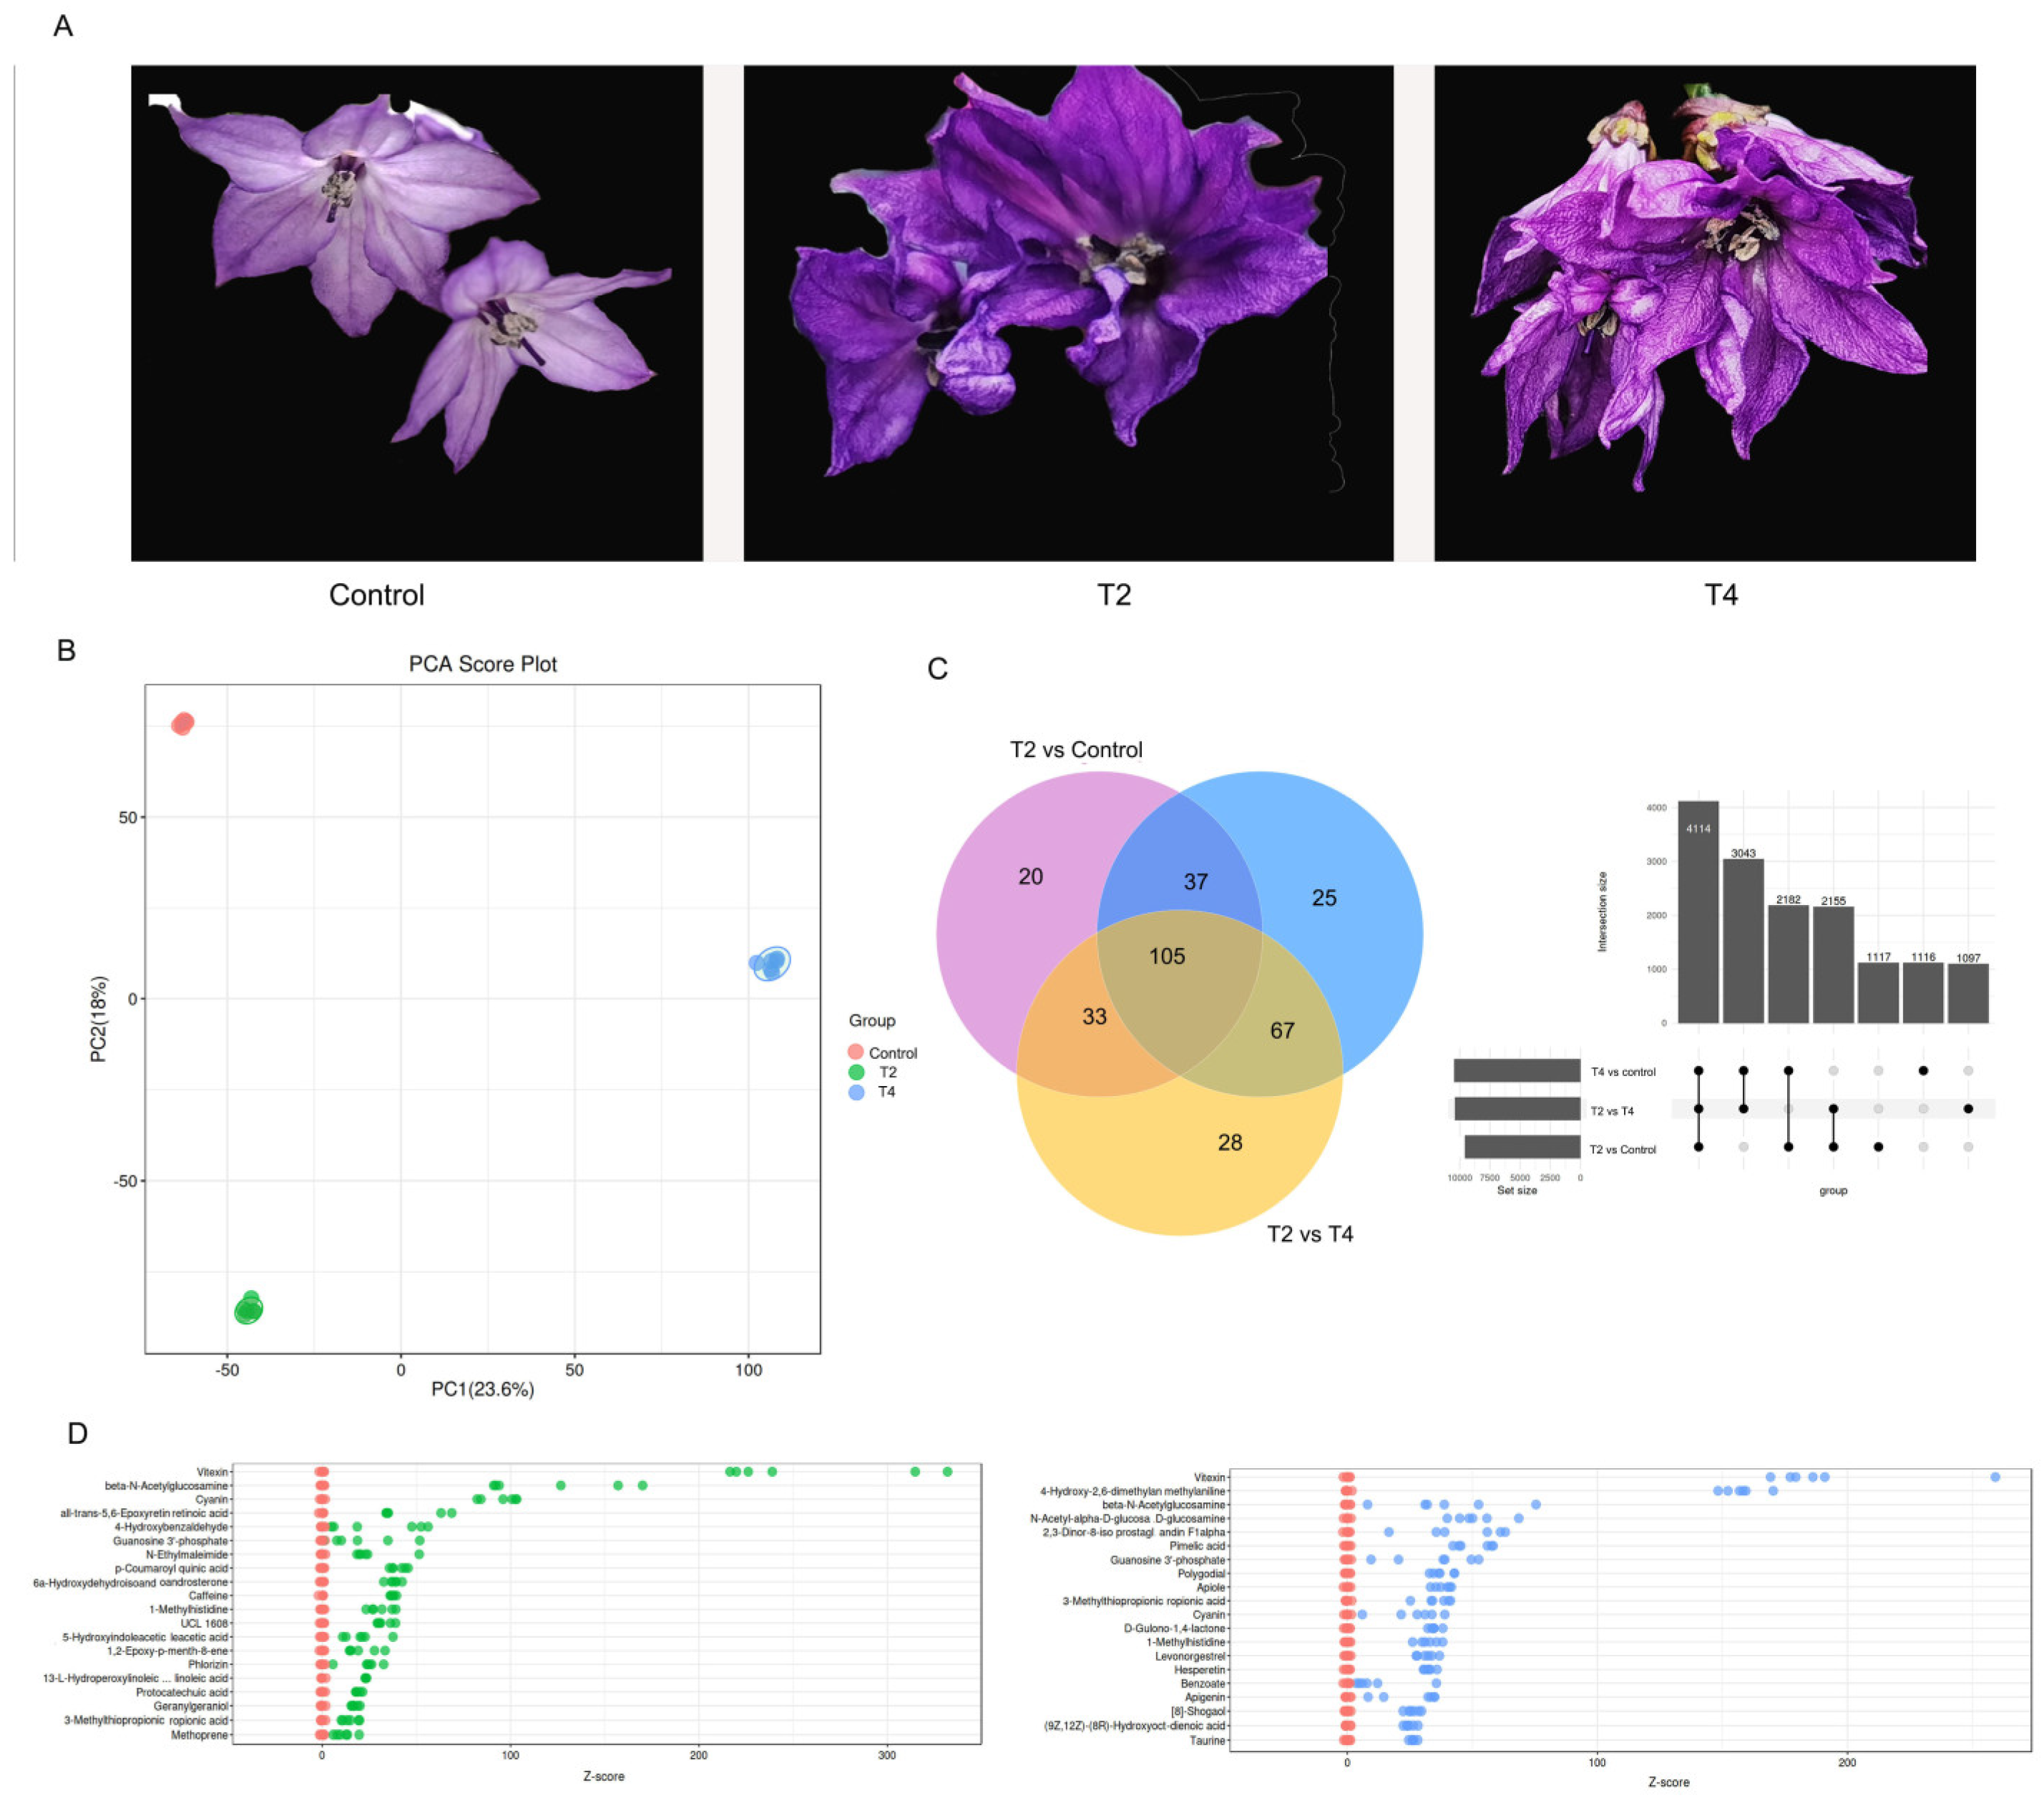
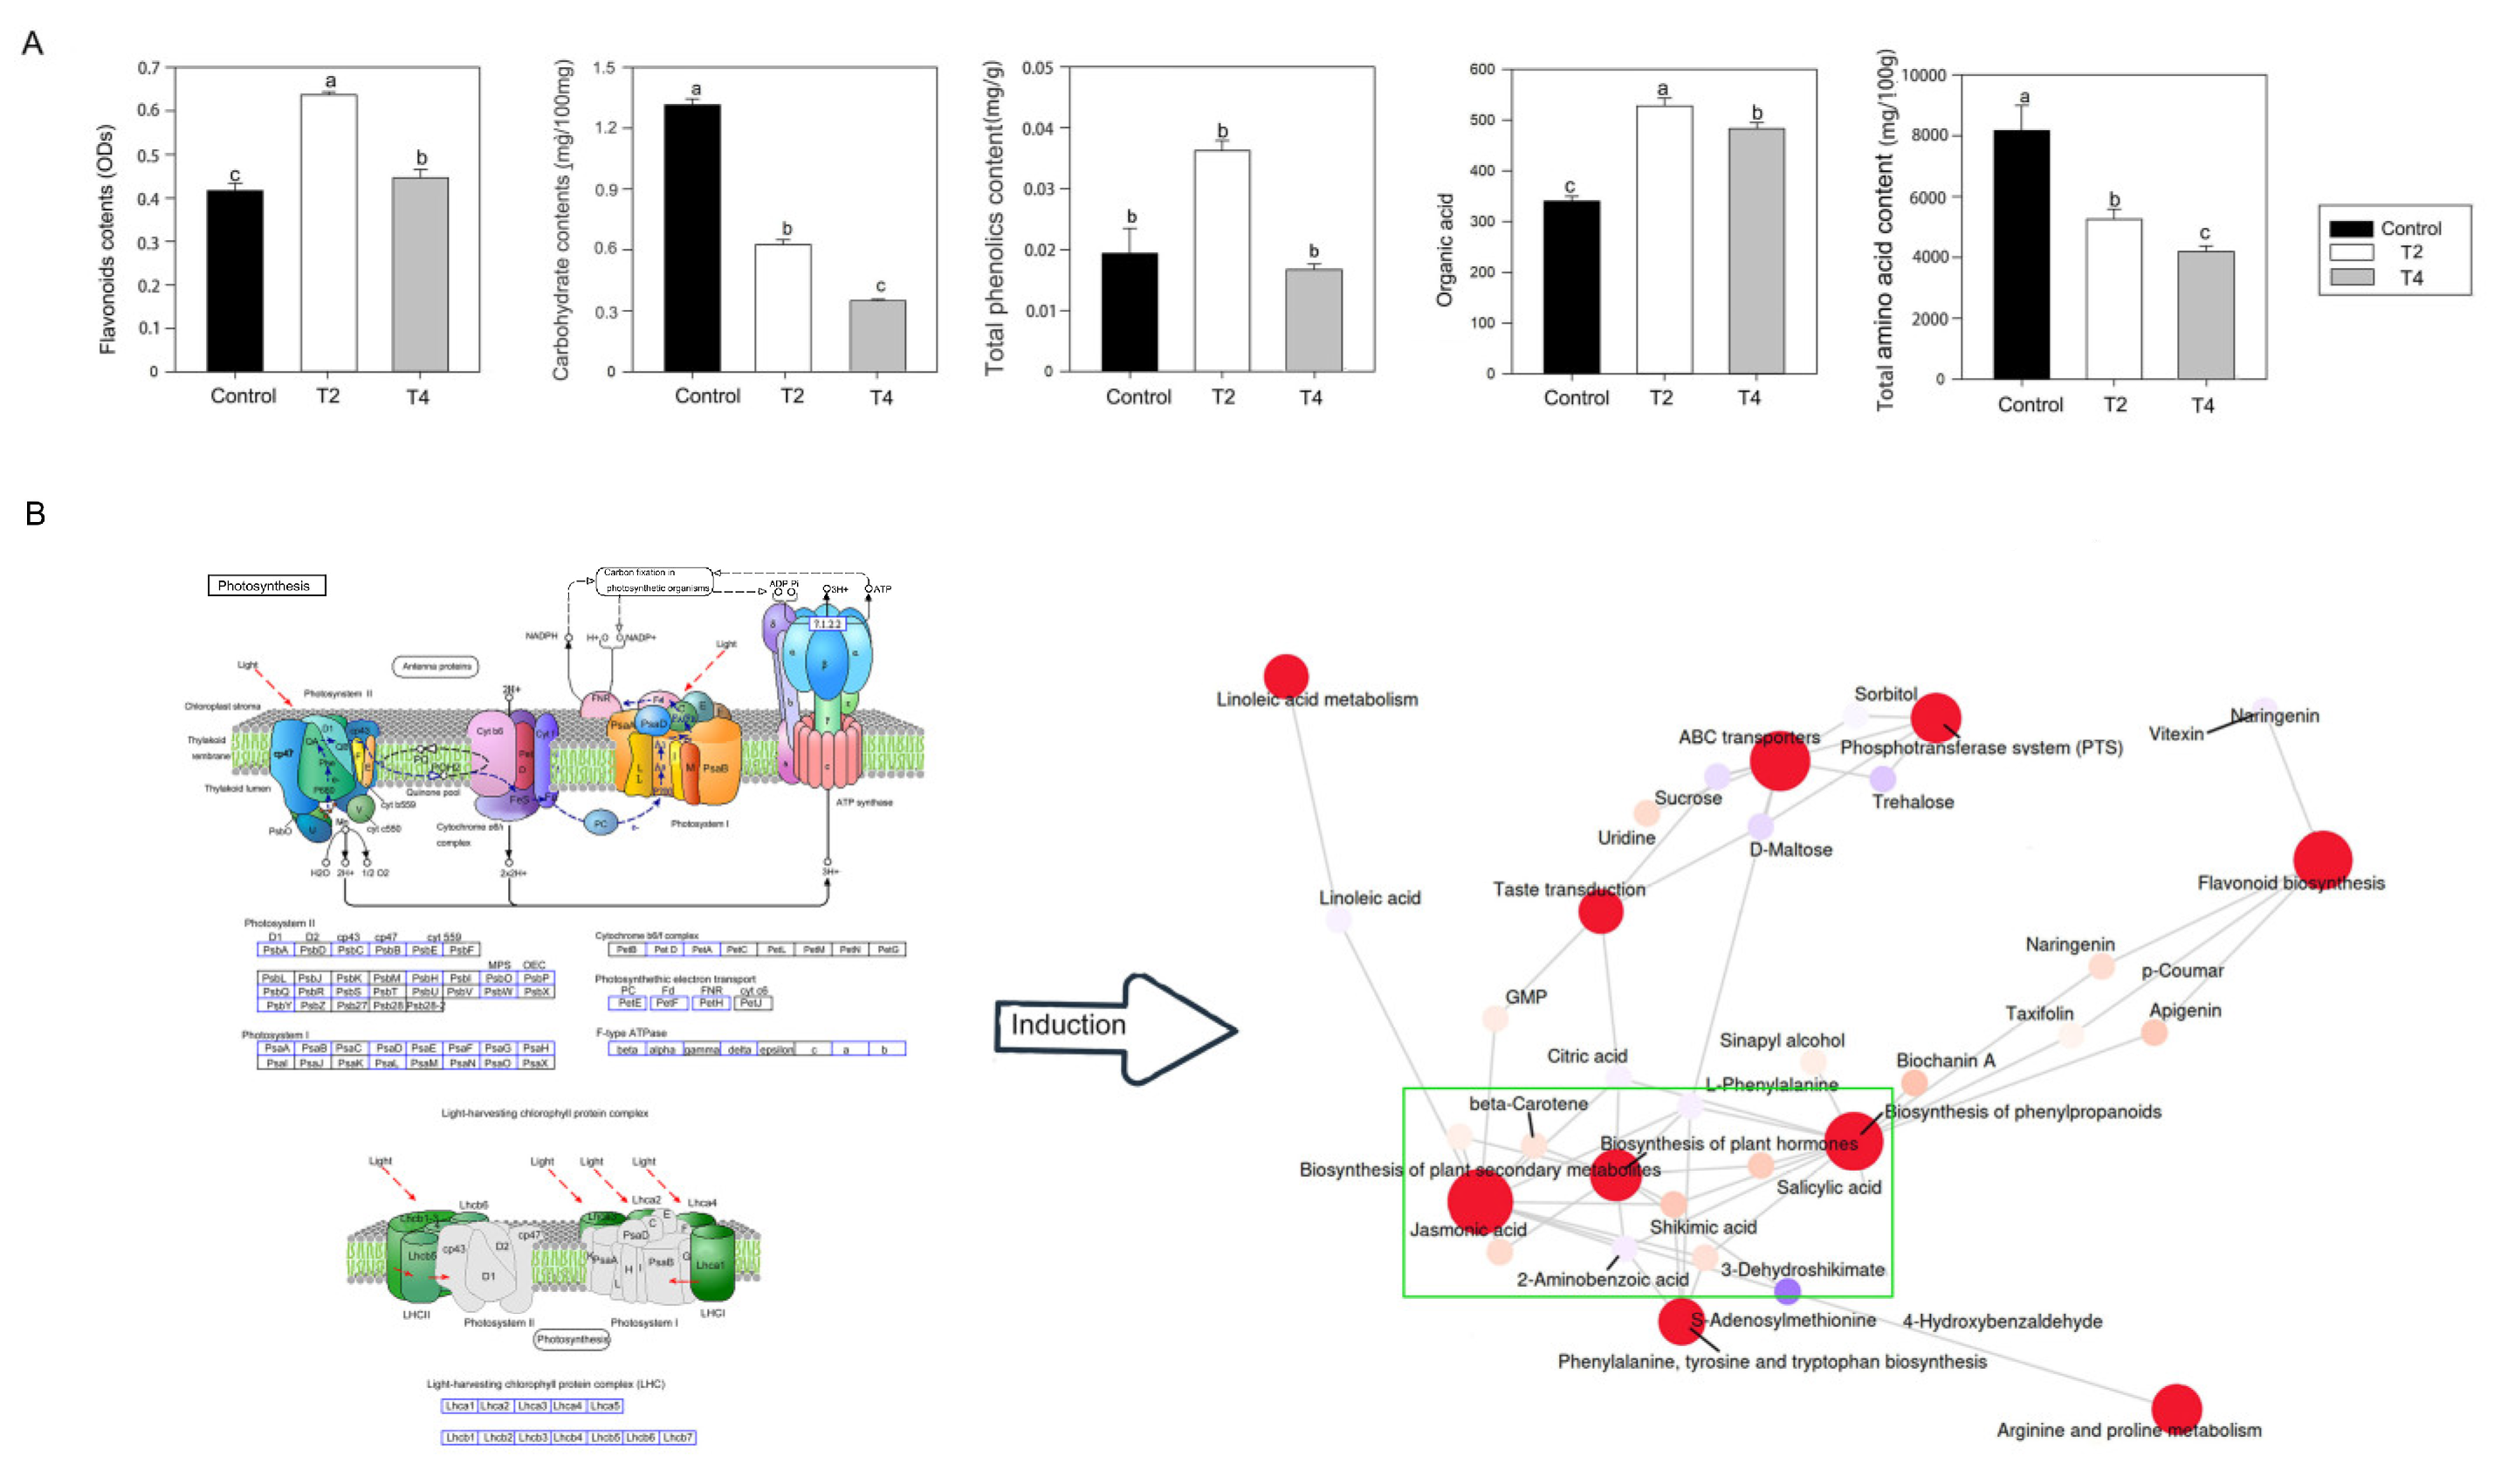
2.3. Change of metabolites under LED light qualities
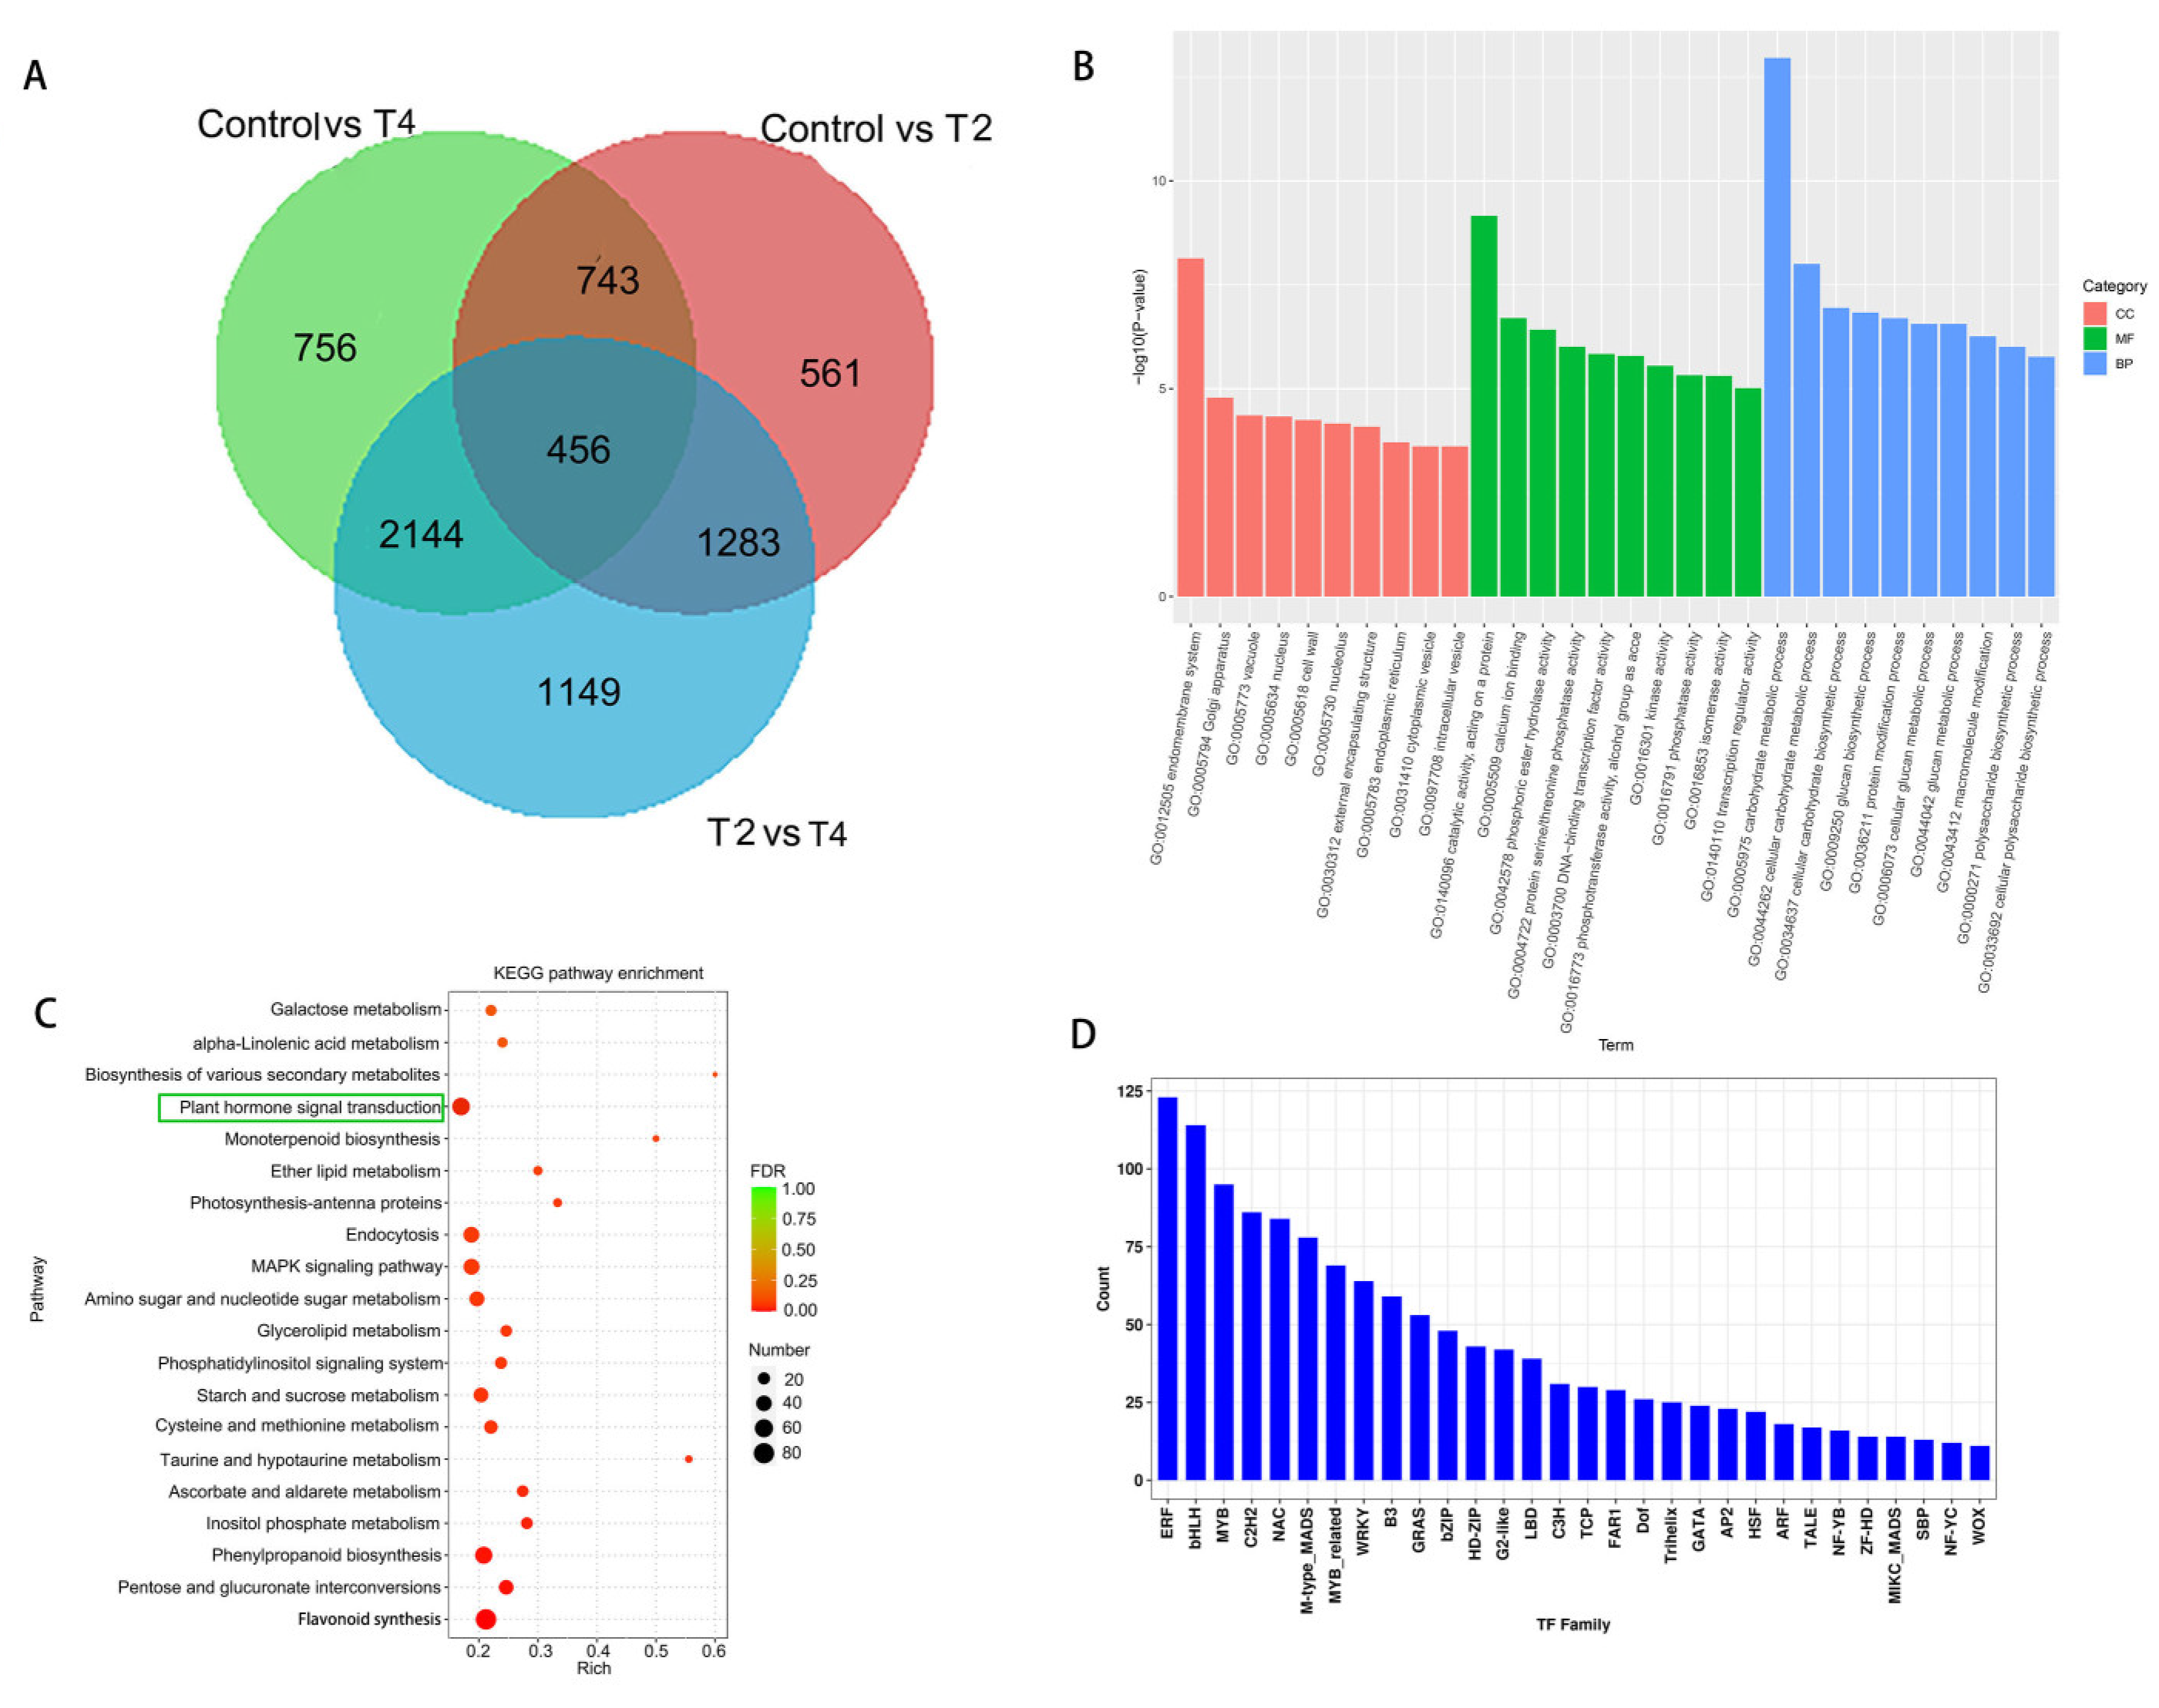
2.4. Changes in DEGs under different LED light qualities
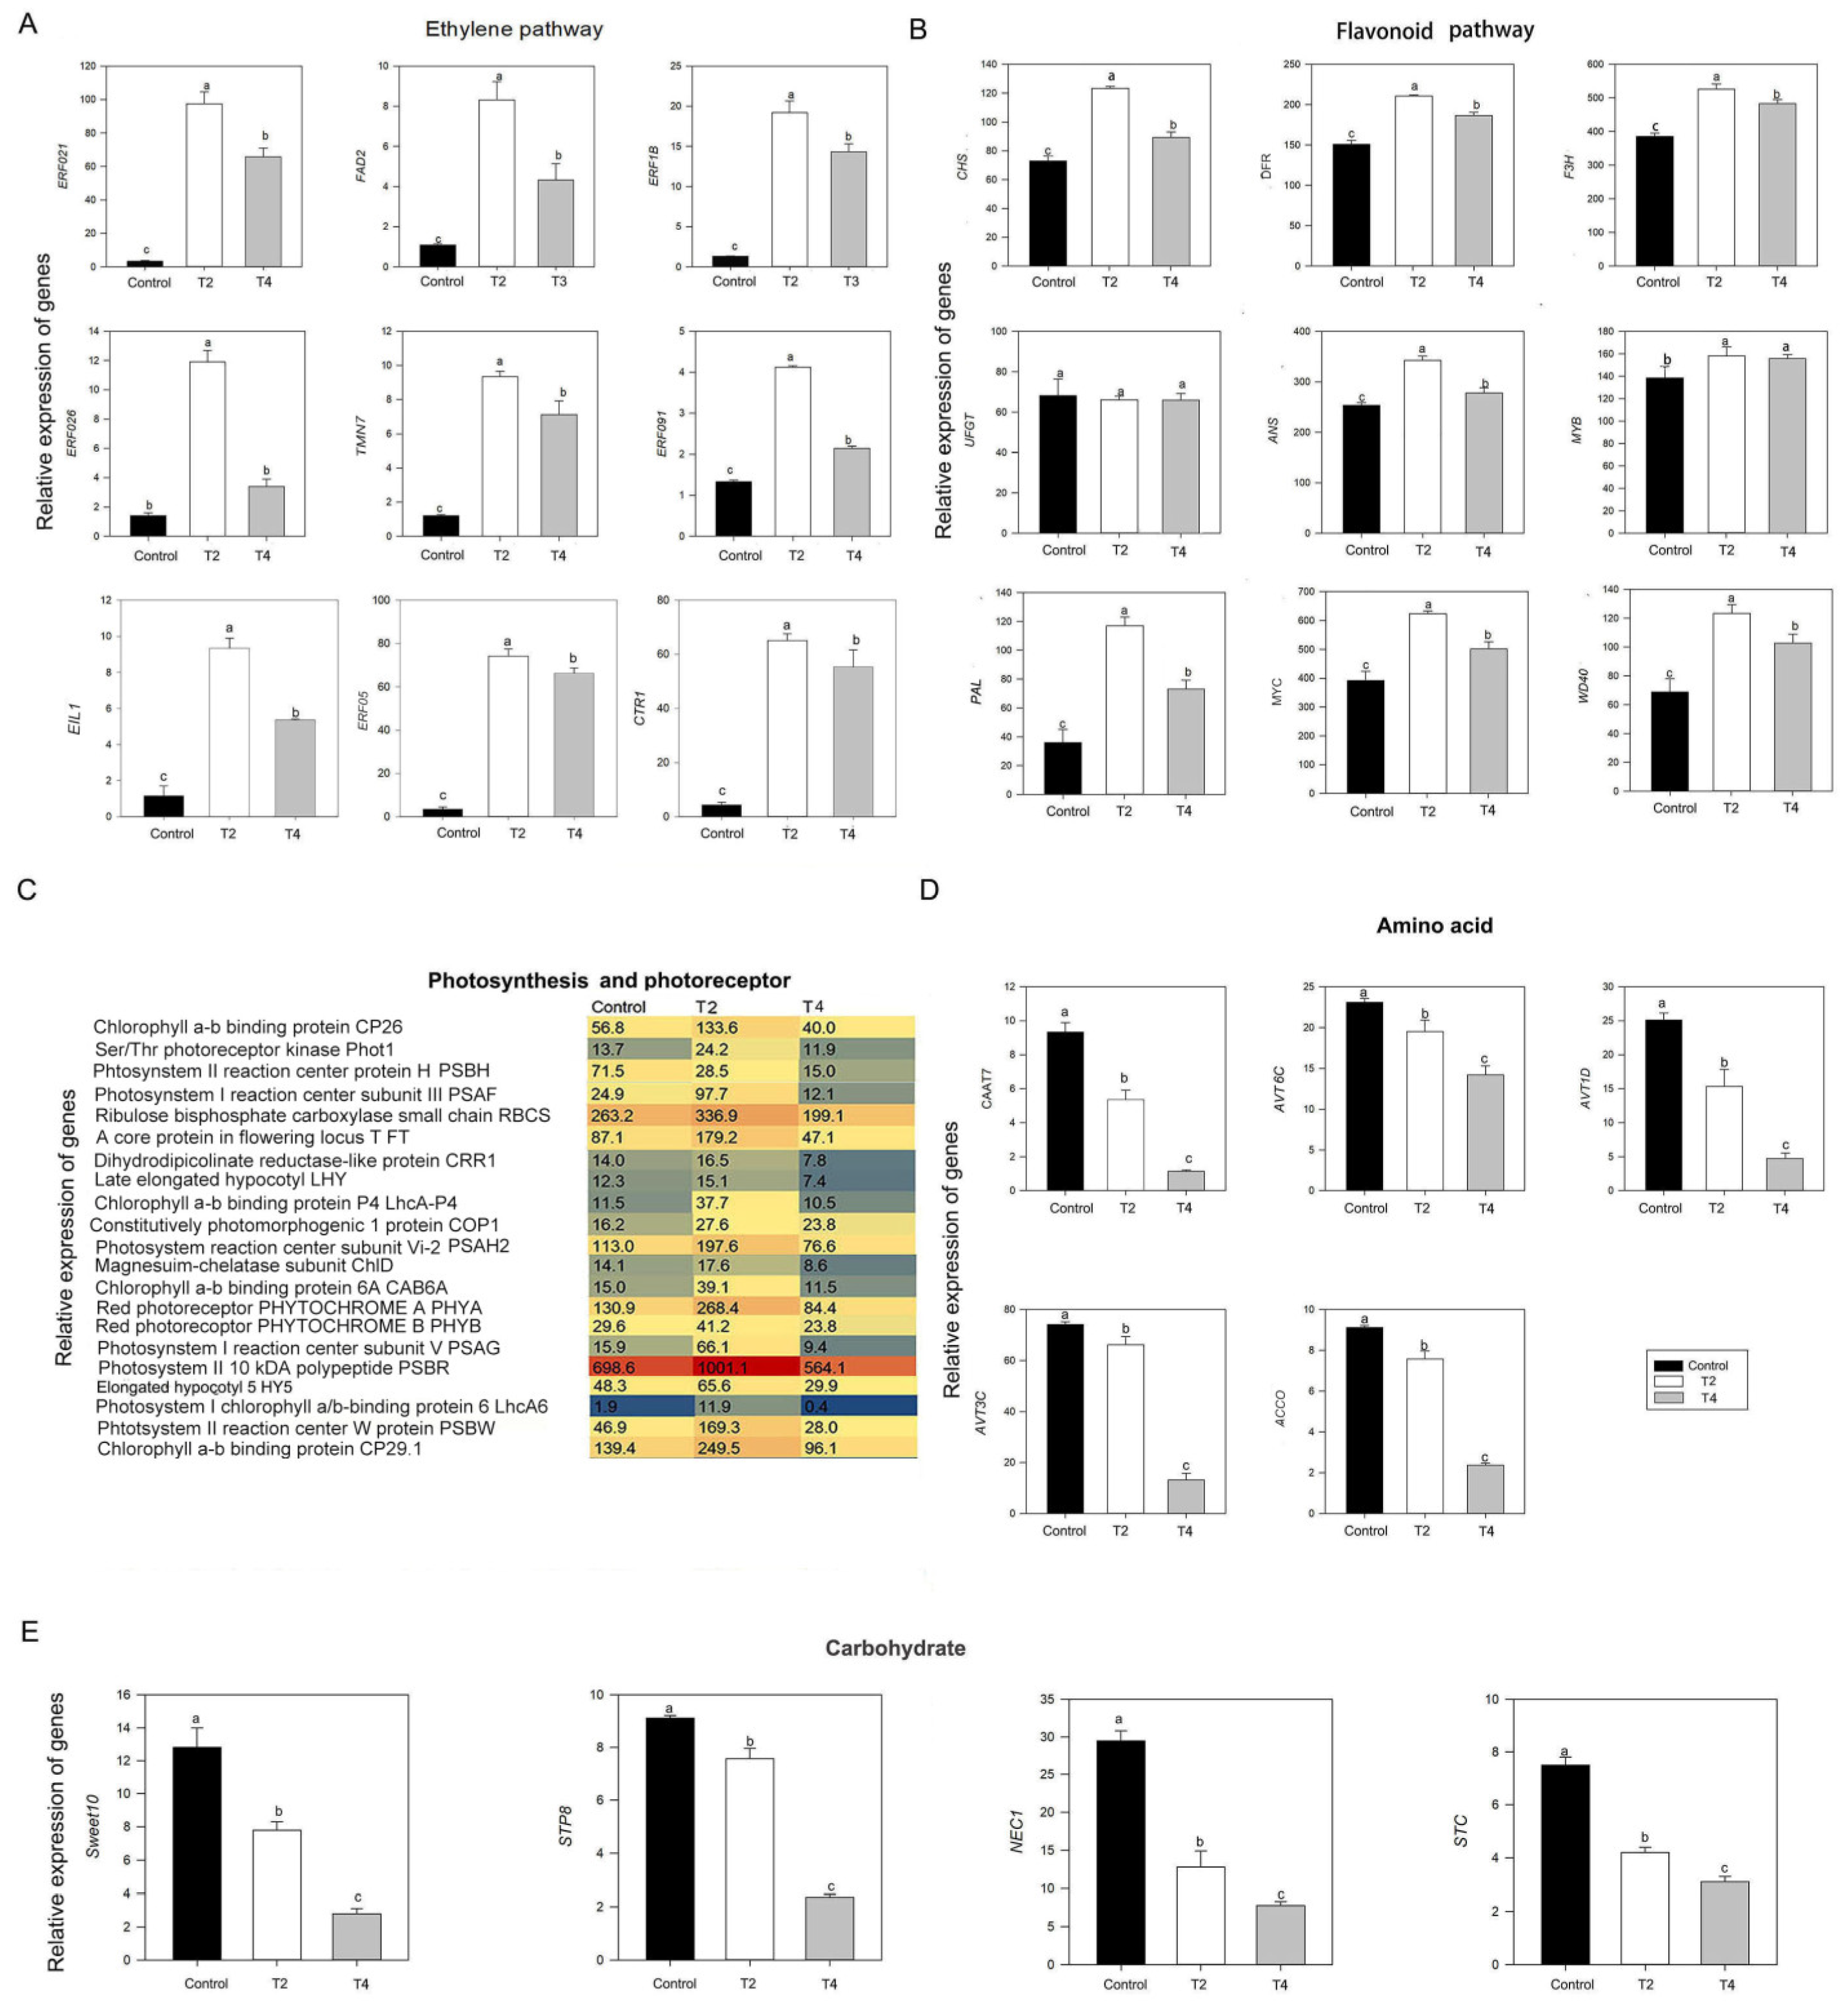
2.5. Integrative analysis of DEGs and DEGs and qRT-PCR
3. Discussion
4. Materials and Methods
4.1. Plant materials and treatments
4.2. Contributed parameters related to phenotype and physiology during fruit ripening
4.3. Untarget metabolite profiling using liquid chromatography-mass spectrometry (LC-MS)
4.4. Measurement of target metabolites
4.5. RNA extraction and analysis of trancriptom
4.6. Quantitative real-time PCR analysis (qPCR)
4.7. Statistical Analysis
5. Conclusions
Supplementary Materials
Author Contributions
Funding
Institutional Review Board Statement
Informed Consent Statement
Acknowledgments
Conflicts of Interest
References
- Liu, K.; He, R.; He, X.; Tan, J.; Chen, Y.; Li, Y.; Liu, R.; Huang, Y.; Liu, H. Speed Breeding Scheme of Hot Pepper through Light Environment Modification. Sustainability-basel 2022, 14, 12225. [Google Scholar] [CrossRef]
- van der Meer, M.; Lee, H.; de Visser, P. H. B.; Heuvelink, E.; Marcelis, L. F. M. Consequences of interplant trait variation for canopy light absorption and photosynthesis. Front. Plant Sci. 2023, 14, 1012718. [Google Scholar] [CrossRef] [PubMed]
- Larsen, D. H.; Li, H.; van de Peppel, A. C.; Nicole, C. C. S.; Marcelis, L. F. M.; Woltering, E. J. High light intensity at End-Of-Production improves the nutritional value of basil but does not affect postharvest chilling tolerance. Food Chem. 2022, 369, 130913. [Google Scholar] [CrossRef]
- Ballester, A.-R.; Lafuente, M. T. , LED Blue Light-induced changes in phenolics and ethylene in citrus fruit: Implication in elicited resistance against Penicillium digitatum infection. Food Chem. 2017, 218, 575–583. [Google Scholar] [CrossRef]
- Rashidi, A.; Tehranifar, A.; Samiei, L. Modifying spectral distributions during the seedling stage influences the flowering and branching of Petunia × hybrida. Sci. Hortic-Amsterdam 2023, 309, 111664. [Google Scholar] [CrossRef]
- Nie, W.-F.; Li, Y.; Chen, Y.; Zhou, Y.; Yu, T.; Zhou, Y.; Yang, Y. Spectral light quality regulates the morphogenesis, architecture, and flowering in pepper (Capsicum annuum L.). J. Photoch. Photobio. B. 2023, 241, 112673–112673. [Google Scholar] [CrossRef] [PubMed]
- Yang, C.; Qin, J.; Xie, F.; Zhou, K.; Xi, W. Red light-transmittance bagging promotes carotenoid accumulation through xanthophylls esterification during the ripening of blood orange fruit. Food Chem. 2023, 404, 134578. [Google Scholar] [CrossRef]
- Su, L.; Hou, P.; Song, M.; Zheng, X.; Guo, L.; Xiao, Y.; Yan, L.; Li, W.; Yang, J. Synergistic and Antagonistic Action of Phytochrome (Phy) A and PhyB during Seedling De-Etiolation in Arabidopsis thaliana. Food Chem. 2023, 404, 134578. [Google Scholar] [CrossRef]
- Hajdu, A.; Adam, E.; Sheerin, D. J.; Dobos, O.; Bernula, P.; Hiltbrunner, A.; Kozma-Bognar, L.; Nagy, F. High-level expression and phosphorylation of phytochrome B modulates flowering time in Arabidopsis. Plant J. 2015, 83, 794–805. [Google Scholar] [CrossRef]
- Mao, J.; Zhang, Y. C.; Sang, Y.; Li, Q. H.; Yang, H. Q. A role for Arabidopsis cryptochromes and COP1 in the regulation of stomatal opening. Pro. Natl Aca. Sci. USA 2005, 102, 12270–12275. [Google Scholar] [CrossRef]
- Holub, D.; Kubar, T.; Mast, T.; Elstner, M.; Gillet, N. , What accounts for the different functions in photolyases and cryptochromes: a computational study of proton transfers to FAD. Phys. Chem. Chem. Phy. 2019, 21(22), 11956–11966. [Google Scholar] [CrossRef] [PubMed]
- Oh, S.-Y.; Koh, S. C. , Fruit Development and Quality of Hot Pepper (Capsicum annuum L.) under Various Temperature Regimes. Hort. Sci. Technol. 2019, 37, 313–321. [Google Scholar] [CrossRef]
- Xiang, N.; Qi, X.; Hu, J.; Wang, S.; Guo, X. l-Tryptophan synergistically increased carotenoid accumulation with blue light in maize (Zea mays L.) sprouts. Food Chem. Mol. Sci. 2023, 6, 100161. [Google Scholar] [CrossRef] [PubMed]
- Quian-Ulloa, R.; Stange, C. Carotenoid Biosynthesis and Plastid Development in Plants: The Role of Light. Inter. J. Mol. Sci. 2021, 22, 1184. [Google Scholar] [CrossRef] [PubMed]
- Wang, S.; Liu, X.; Liu, X.; Xue, J.; Ren, X.; Zhai, Y.; Zhang, X. The red/blue light ratios from light-emitting diodes affect growth and flower quality of Hippeastrum hybridum 'Red Lion'. Front. Plant Sci. 2022, 13, 1048770. [Google Scholar] [CrossRef] [PubMed]
- Walker, C. H.; Bennett, T. A distributive '50% rule' determines floral initiation rates in the Brassicaceae. Nat. Plants 2019, 5, 940–943. [Google Scholar] [CrossRef] [PubMed]
- Jaudal, M.; Wen, J.; Mysore, K. S.; Putterill, J. Medicago PHYA promotes flowering, primary stem elongation and expression of flowering time genes in long days. Bmc Plant Biol. 2020, 20, 329. [Google Scholar] [CrossRef]
- Ye, Y.; Liu, Y.; Li, X.; Chen, Q.; Zhang, Y.; Luo, Y.; Liu, Z.; Wang, Y.; Lin, Y.; Zhang, Y.; Wang, X.; Tang, H. Transcriptome Profile Analysis of Strawberry Leaves Reveals Flowering Regulation under Blue Light Treatment. Int. J. Genomics 2021, 2021, 5572076. [Google Scholar] [CrossRef] [PubMed]
- Danziger, N.; Bernstein, N. Light matters: Effect of light spectra on cannabinoid profile and plant development of medical cannabis (Cannabis sativa L.). Ind. Crop. Prod. 2021, 164, 113351. [Google Scholar] [CrossRef]
- Gonzalez-Barrios, P.; Bhatta, M.; Halley, M.; Sandro, P.; Gutierrez, L. Speed breeding and early panicle harvest accelerates oat (Avena sativa L.) breeding cycles. Crop Sci. 2021, 61, 320–330. [Google Scholar] [CrossRef]
- Vidana Gamage, G. C.; Lim, Y. Y.; Choo, W. S. Anthocyanins From Clitoria ternatea Flower: Biosynthesis, Extraction, Stability, Antioxidant Activity, and Applications. Front. Plant Sci. 2021, 12, 792303. [Google Scholar] [CrossRef] [PubMed]
- Zhang, Y.; Jiang, L.; Li, Y.; Chen, Q.; Yuntian, Y.; Zhang, Y.; ya, L.; Sun, B.; Wang, X.-r.; Tang, H. Effect of Red and Blue Light on Anthocyanin Accumulation and Differential Gene Expression in Strawberry (Fragaria × ananassa). Molecules 2018, 23, 820. [Google Scholar] [CrossRef]
- Liu, X.; Yuan, M.; Dang, S.; Zhou, J.; Zhang, Y. Comparative transcriptomic analysis of transcription factors and hormones during flower bud differentiation in 'Red Globe' grape under red‒blue light. Sci. Rep. 2023, 13, 8932–8932. [Google Scholar] [CrossRef] [PubMed]
- Prisca, M.; Maarten, V.; Jan, V. D.; Bart, N.; Wouter, S.; Timo, H.; Barbara, D. C.; Bram, V. d. P. Blue and far-red light control flowering time of woodland strawberry (Fragaria vesca) distinctively via CONSTANS (CO) and FLOWERING LOCUS T1 (FT1) in the background of sunlight mimicking radiation. Environ. Exp. Bot. 2022, 198, 104866. [Google Scholar] [CrossRef]
- He, R.; Wei, J.; Zhang, J.; Tan, X.; Li, Y.; Gao, M.; Liu, H. Supplemental Blue Light Frequencies Improve Ripening and Nutritional Qualities of Tomato Fruits. Front. Plant Sci. 2022, 13, 888976. [Google Scholar] [CrossRef] [PubMed]
- Han, X.; Tohge, T.; Lalor, P.; Dockery, P.; Devaney, N.; Esteves-Ferreira, A. A.; Fernie, A. R.; Sulpice, R. Phytochrome A and B Regulate Primary Metabolism in Arabidopsis Leaves in Response to Light. Front. Plant Sci. 2017, 8, 1394. [Google Scholar] [CrossRef] [PubMed]
- Li, D.; He, Y.; Li, S.; Shi, S.; Li, L.; Liu, Y.; Chen, H. Genome-wide characterization and expression analysis of AP2/ERF genes in eggplant (Solanum melongena L.). Plant Physiol. Biochem. 2021, 167, 492–503. [Google Scholar] [CrossRef]
- Jin, J.-H.; Wang, M.; Zhang, H.-X.; Khan, A.; Wei, A.-M.; Luo, D.-X.; Gong, Z.-H. Genome-wide identification of the AP2/ERF transcription factor family in pepper (Capsicum annuum L.). Genome 2018, 61, 663–674. [Google Scholar] [CrossRef]
- Gong, D.; Cao, S.; Sheng, T.; Shao, J.; Song, C.; Wo, F.; Chen, W.; Yang, Z. Effect of blue light on ethylene biosynthesis, signalling and fruit ripening in postharvest peaches. Sci. Hortic-Amsterdam 2015, 197, 657–664. [Google Scholar] [CrossRef]
- Ni, J.; Bai, S.; Zhao, Y.; Qian, M.; Tao, R.; Yin, L.; Gao, L.; Teng, Y. Ethylene response factors Pp4ERF24 and Pp12ERF96 regulate blue light-induced anthocyanin biosynthesis in ‘Red Zaosu’ pear fruits by interacting with MYB114. Plant Mol. Biol. 2019, 99, 67–78. [Google Scholar] [CrossRef]
- Medda, S.; Dessena, L.; Mulas, M. Monitoring of the PAL Enzymatic Activity and Polyphenolic Compounds in Leaves and Fruits of Two Myrtle Cultivars during Maturation. Agriculture-Basel 2020, 10, 39. [Google Scholar] [CrossRef]
- Min, T.; Liu, E.; Xie, J.; Yi, Y.; Wang, L.; Ai, Y.; Wang, H. Effects of Vacuum Packaging on Enzymatic Browning and Ethylene Response Factor (ERF) Gene Expression of Fresh-cut Lotus Root. Hortscience 2019, 54, 331–336. [Google Scholar] [CrossRef]
- Sun, M.; Shi, M.; Wang, Y.; Huang, Q.; Yuan, T.; Wang, Q.; Wang, C.; Zhou, W.; Kai, G. The biosynthesis of phenolic acids is positively regulated by the JA-responsive transcription factor ERF115 in Salvia miltiorrhiza. J. Exp. Bot. 2019, 70, 243–254. [Google Scholar] [CrossRef] [PubMed]
- Kanauchi, O.; Mitsuyama, K.; Komiyama, Y.; Yagi, M.; Andoh, A.; Sata, M. Preventive effects of enzyme-treated rice fiber in a restraint stress-induced irritable bowel syndrome model. Int. J. Mol. Med. 2010, 25, 547–555. [Google Scholar] [CrossRef] [PubMed]
- Liu, H.; Fu, Y.; Hu, D.; Yu, J.; Liu, H. Effect of green, yellow and purple radiation on biomass, photosynthesis, morphology and soluble sugar content of leafy lettuce via spectral wavebands "knock out". Sci. Hortic-Amsterdam 2018, 236, 10–17. [Google Scholar] [CrossRef]
- Li, M.; Wen, X.; Peng, Y.; Wang, Y.; Wang, K.; Ni, Y. Functional properties of protein isolates from bell pepper (<i>Capsicum annuum</i> L. var. <i>annuum</i>) seeds. Lwt-Food Sci. Technol. 2018, 97, 802–810. [Google Scholar]
- Mi, S.; Zhang, X.; Wang, Y.; Zheng, M.; Zhao, J.; Gong, H.; Wang, X. Effect of different genotypes on the fruit volatile profiles, flavonoid composition and antioxidant activities of chilli peppers. Food Chem. 2022, 374, 131751. [Google Scholar] [CrossRef] [PubMed]
- Zelena, E.; Dunn, W. B.; Broadhurst, D.; Francis-McIntyre, S.; Carroll, K. M.; Begley, P.; O'Hagan, S.; Knowles, J. D.; Halsall, A.; Wilson, I. D.; Kellt, D. B.; Consortium, H. Development of a Robust and Repeatable UPLC-MS Method for the Long-Term Metabolomic Study of Human Serum. Analytical Chem. 2009, 81, 1357–1364. [Google Scholar] [CrossRef] [PubMed]
- Want, E. J.; Masson, P.; Michopoulos, F.; Wilson, I. D.; Theodoridis, G.; Plumb, R. S.; Shockcor, J.; Loftus, N.; Holmes, E.; Nicholson, J. K. Global metabolic profiling of animal and human tissues via UPLC-MS. Nat. Protoc. 2013, 8, 17–32. [Google Scholar] [CrossRef]
- Masuko, T.; Minami, A.; Iwasaki, N.; Majima, T.; Nishimura, S. I.; Lee, Y. C. Carbohydrate analysis by a phenol-sulfuric acid method in microplate format. Analytical Biochemistry 2005, 339(1), 69–72. [Google Scholar] [CrossRef]
- Lee, J. G.; Yi, G.; Choi, J. H.; Lee, E. J. Analyses of targeted/untargeted metabolites and reactive oxygen species of pepper fruits provide insights into seed browning induced by chilling. Food Chem. 2020, 332, 127406. [Google Scholar] [CrossRef] [PubMed]
- Lu, B.-Y.; Cheng, G.-X.; Zhang, Z.; Sun, J.-T.; Ali, M.; Jia, Q.-L.; Luo, D.-X.; Gong, Z.-H.; Li, D.-W. CaMYC, A Novel Transcription Factor, Regulates Anthocyanin Biosynthesis in Color-leaved Pepper (Capsicum annuum L.). J. Plant Growth Regul. 2019, 38, 574–585. [Google Scholar] [CrossRef]
- Wang, Y.; Gao, S.; He, X.; Li, Y.; Zhang, Y.; Chen, W. Response of total phenols, flavonoids, minerals, and amino acids of four edible fern species to four shading treatments. Peerj 2020, 8, 8354. [Google Scholar] [CrossRef] [PubMed]

| Metabolites | Gene ID | Fold change | Description |
|---|---|---|---|
| Plant hormone | CA09g03230 | 6.43 | pathogenesis-related leaf protein 4-like [Capsicum annuum] |
| CA03g34530 | -5.06 | auxin-induced protein AUX22-like [Capsicum annuum] | |
| CA06g10200 | 2.78 | small auxin-up protein 58 | |
| CA01g31150 | 6.97 | pathogenesis-related protein 1A-like [Capsicum annuum] | |
| CA07g13330 | 4.50 | jasmonic acid-amido synthetase JAR1-like isoform X1 | |
| CA12g03510 | -2.5 | serine/threonine-protein kinase SAPK2-like | |
| CA01g18900 | 2.2 | auxin-responsive protein IAA8-like | |
| CA10g20850 | -3.2 | transcription factor TGA2-like | |
| CA11g01500 | 2.9 | transcription factor HBP-1b(c38)-like | |
| CA03g21920 | 2.2 | uncharacterized protein LOC107864989 | |
| Flavonoid | CA04g12020 | 3.40 | flavonoid 3'-monooxygenase-like |
| CA04g13910 | 6.16 | cytochrome P450 71A1-like | |
| CA01g04460 | 2.22 | flavonoid 3'-monooxygenase-like | |
| CA02g21520 | -2.33 | flavanone 3 beta-hydroxylase | |
| Amino acid | CA03g02860 | -4.09 | probable indole-3-pyruvate monooxygenase YUCCA3 |
| CA03g25930 | -7.10 | cytochrome P450 71A6-like | |
| CA01g33440 | 2.82 | hydroxymethylglutaryl-CoA synthase-lik | |
| CA12g20610 | -2.17 | adenosylhomocysteinase | |
| CA10g05940 | -3.54 | 1-aminocyclopropane-1-carboxylate synthase 4-like | |
| CA08g13390 | 3.43 | uncharacterized protein LOC104242730 | |
| CA04g06460 | -2.17 | 1-aminocyclopropane-1-carboxylate synthase 3-like | |
| CA09g16560 | -2.63 | probable polyamine oxidase 5 | |
| CA03g25960 | -6.88 | LOW QUALITY PROTEIN: (+)-menthofuran synthase-like | |
| CA12g15620 | -3.23 | 1-aminocyclopropane-1-carboxylate oxidase 1 | |
| CA08g07360 | -3.93 | bifunctional L-3-cyanoalanine synthase/cysteine synthase 2, mitochondrial isoform X1 | |
| CA07g11190 | -2.81 | 1-aminocyclopropane-1-carboxylate oxidase 3-like | |
| CA06g11020 | -3.07 | S-adenosylmethionine decarboxylase proenzyme 4-like | |
| CA05g16500 | 2.74 | isoleucine N-monooxygenase 1-like | |
| CA03g02860 | -4.09825977 | probable indole-3-pyruvate monooxygenase YUCCA3 | |
| CA03g25930 | -7.10 | cytochrome P450 71A6-like | |
| CA01g33440 | 2.82 | hydroxymethylglutaryl-CoA synthase-like | |
| CA12g20610 | -2.17 | adenosylhomocysteinase | |
| CA10g05940 | -3.54 | 1-aminocyclopropane-1-carboxylate synthase 4-like | |
| CA08g13390 | 3.43 | uncharacterized protein LOC104242730 | |
| CA04g06460 | -2.17 | 1-aminocyclopropane-1-carboxylate synthase 3-like | |
| CA09g16560 | -2.63 | probable polyamine oxidase 5 | |
| CA03g25960 | -6.88 | LOW QUALITY PROTEIN: (+)-menthofuran synthase-like | |
| CA12g15620 | -3.23 | 1-aminocyclopropane-1-carboxylate oxidase 1 | |
| CA08g07360 | -3.93 | bifunctional L-3-cyanoalanine synthase/cysteine synthase 2, mitochondrial isoform X1 | |
| CA07g11190 | -2.81 | 1-aminocyclopropane-1-carboxylate oxidase 3-like | |
| CA06g11020 | -3.07 | S-adenosylmethionine decarboxylase proenzyme 4-like | |
| CA05g16500 | 2.74 | isoleucine N-monooxygenase 1-like [Capsicum annuum] | |
| Carbohydrate | CA04g15380 | 3.369706641 | 7-deoxyloganetin glucosyltransferase-like |
| CA12g05960 | -2.559152027 | beta-D-glucosyl crocetin beta-1,6-glucosyltransferase-like ] | |
| CA12g19750 | 2.681845577 | limonoid UDP-glucosyltransferase-like isoform X2 | |
| CA12g09020 | 4.314617163 | antifungal protein | |
| CA03g28260 | 2.656431408 | UDP-glycosyltransferase 90A1-like | |
| CA01g22510 | 2.63238818 | anthocyanidin 3-O-glucosyltransferase 2-like | |
| CA02g28410 | 2.57066522 | aldose 1-epimerase-like | |
| CA12g19660 | 2.784774378 | UDP-glycosyltransferase 74E2-like | |
| CA03g00610 | -3.33150609 | germacrene C synthase-like isoform X2 | |
| CA07g09480 | 5.117071724 | antifungal protein | |
| CA12g02820 | 6.208983562 | LOW QUALITY PROTEIN: rhamnogalacturonate lyase-like | |
| CA02g08210 | -2.364017925 | alpha-1,4-glucan-protein synthase [UDP-forming] 1-like | |
| CA03g30170 | 7.594115814 | chitin-binding lectin 1-like | |
| CA12g19670 | 2.84487617 | UDP-glycosyltransferase 74E2-like | |
| CA06g16330 | -3.952708828 | inorganic pyrophosphatase 1-like | |
| CA03g35740 | -2.14010396 | beta-fructofuranosidase, insoluble isoenzyme CWINV1-like | |
| CA06g18490 | 8.087637601 | D: UDP-glucose 6-dehydrogenase 1-like | |
| CA02g17640 | 6.038102413 | alpha-farnesene synthase-like, partial | |
| CA02g21050 | 3.962130051 | acidic 27 kDa endochitinase | |
| CA05g00420 | 5.203134101 | glucan endo-1,3-beta-glucosidase, acidic, partial | |
| CA03g10530 | 2.406883633 | protein NDH-DEPENDENT CYCLIC ELECTRON FLOW 5 | |
| CA07g13240 | 2.470378336 | endochitinase 4 | |
| CA03g24000 | 6.93069508 | UDP-arabinopyranose mutase 3-like isoform X2 | |
| CA07g06280 | -2.608737749 | 7-deoxyloganetin glucosyltransferase-like | |
| CA09g17310 | -2.578056349 | pyruvate dehydrogenase E1 component subunit alpha-3, chloroplastic-like | |
| CA02g21020 | 4.228337947 | basic endochitinase-like | |
| CA01g04790 | -2.085738523 | acid beta-fructofuranosidase | |
| CA05g05560 | -3.708332213 | beta-xylosidase/alpha-L-arabinofuranosidase 2-like | |
| CA01g20700 | -2.639117089 | polygalacturonase-like | |
| CA12g19530 | -3.894926195 | polygalacturonase-like | |
| CA02g24560 | -2.091080347 | probable hexokinase-like 2 protein | |
| CA12g00950 | -2.622367834 | glucan endo-1,3-beta-glucosidase 8-like | |
| CA12g19520 | -5.39008693 | polygalacturonase-like | |
| CA11g08190 | -2.832023018 | polygalacturonase At1g48100-like | |
| CA04g18770 | 6.215998482 | alpha-amylase-like | |
| Organic acid | CA08g15160 | 3.313126727 | 12-oxophytodienoate reductase-like protein isoform X1 |
| CA12g22620 | 5.911464401 | delta(12)-acyl-lipid-desaturase-like | |
| CA07g16860 | 2.109237399 | gamma-glutamyl hydrolase 1-like isoform X1 | |
| CA04g15770 | 3.769308934 | LOW QUALITY PROTEIN: alcohol dehydrogenase-like 1 | |
| CA01g17610 | 2.733481441 | stearoyl-[acyl-carrier-protein] 9-desaturase 6, chloroplastic-like | |
| CA01g02250 | 3.694905784 | phosphoglycerate mutase-like protein AT74 | |
| CA01g00840 | 3.817028485 | 3-oxoacyl-[acyl-carrier-protein] synthase I, chloroplastic-like | |
| CA12g22610 | 3.857220972 | delta(12)-acyl-lipid-desaturase-like | |
| CA10g12320 | 2.630639785 | 12-oxophytodienoate reductase 1-like | |
| CA12g22630 | 4.647795771 | delta(12)-acyl-lipid-desaturase-like | |
| CA09g03700 | 2.316060915 | L-ascorbate peroxidase 2, cytosolic | |
| CA08g04180 | 3.043702607 | delta(12)-fatty-acid desaturase FAD2-like | |
| CA06g17700 | 5.393154636 | phosphoethanolamine N-methyltransferase 1-like | |
| ABC transporter | CA02g05780 | 3.175 | ethylene-responsive transcription factor ERF113-like |
Disclaimer/Publisher’s Note: The statements, opinions and data contained in all publications are solely those of the individual author(s) and contributor(s) and not of MDPI and/or the editor(s). MDPI and/or the editor(s) disclaim responsibility for any injury to people or property resulting from any ideas, methods, instructions or products referred to in the content. |
© 2023 by the authors. Licensee MDPI, Basel, Switzerland. This article is an open access article distributed under the terms and conditions of the Creative Commons Attribution (CC BY) license (http://creativecommons.org/licenses/by/4.0/).


