1. Introduction
In the maintenance of cracked components and structures, the rate at which the crack front advances needs to be established and monitored [
1,
2,
3] as well as the crack path (CP) in case there is mixed-mode loading. However, CP prediction is not entirely understood [
1,
2,
4,
5,
6]. Nevertheless, for crack kinking and equivalent SIF, there are already several postulated criteria [
1,
7], mainly based on linear elastic fracture mechanics (LEFM), being the maximum tangential stress criteria the most used for mixed-mode loading [
6]. However, the applicability of LEFM must be checked before a suitable model can be applied. Using a model that checks the applicability and predicts CP simplifies those two tasks.
Overall, it can be said that all CP prediction models state a hypothesis for a crack to change direction by a small
Δθ from its original path. Such increment is generally created when an equivalent SIF (
Keq) exceeds material toughness (
KIc) [
6] in the LEFM approach. Wasiluk and Golos [
4] proposed a model based on a dimensionless plastic zone radius, P
zr. Ren et al. [
8] proposed a model based on the plastic zone radius and evaluated it for plane stress and plane strain conditions. Both models were devised for a central crack. Comprehensive reviews of CP models can be found in [
1,
7].
Although the CP models described here use SIF (monotonic load), in literature [
7,
9,
10], a swap between monotonic SIF (
K) and fatigue SIF range (
ΔK) for proportional load is found acceptable. Consequently, such exchange implies that if a monotonic criterion assumes a crack increment when the equivalent SIF (
Keq) exceeds fracture toughness (
Kc), then a crack under fatigue loading grows when
ΔKeq exceeds the fatigue threshold (
ΔKth), as it has been postulated before [
9].
Although both evaluated models were proposed for central cracks in infinite plates, this paper evaluates them on lateral cracks. The first set of experimental data is for proportional fatigue load [
11], whereas the second is for proportional monotonic load [
12], both under different mode-mixity ratios (
KII/KI). The first data set was obtained with the Digital Image Correlation (DIC) technique, whereas the second set was obtained through finite element modeling (FEM) and validated with photoelasticity. The performance of both CP models is shown along the crack length.
2. Criteria for crack path
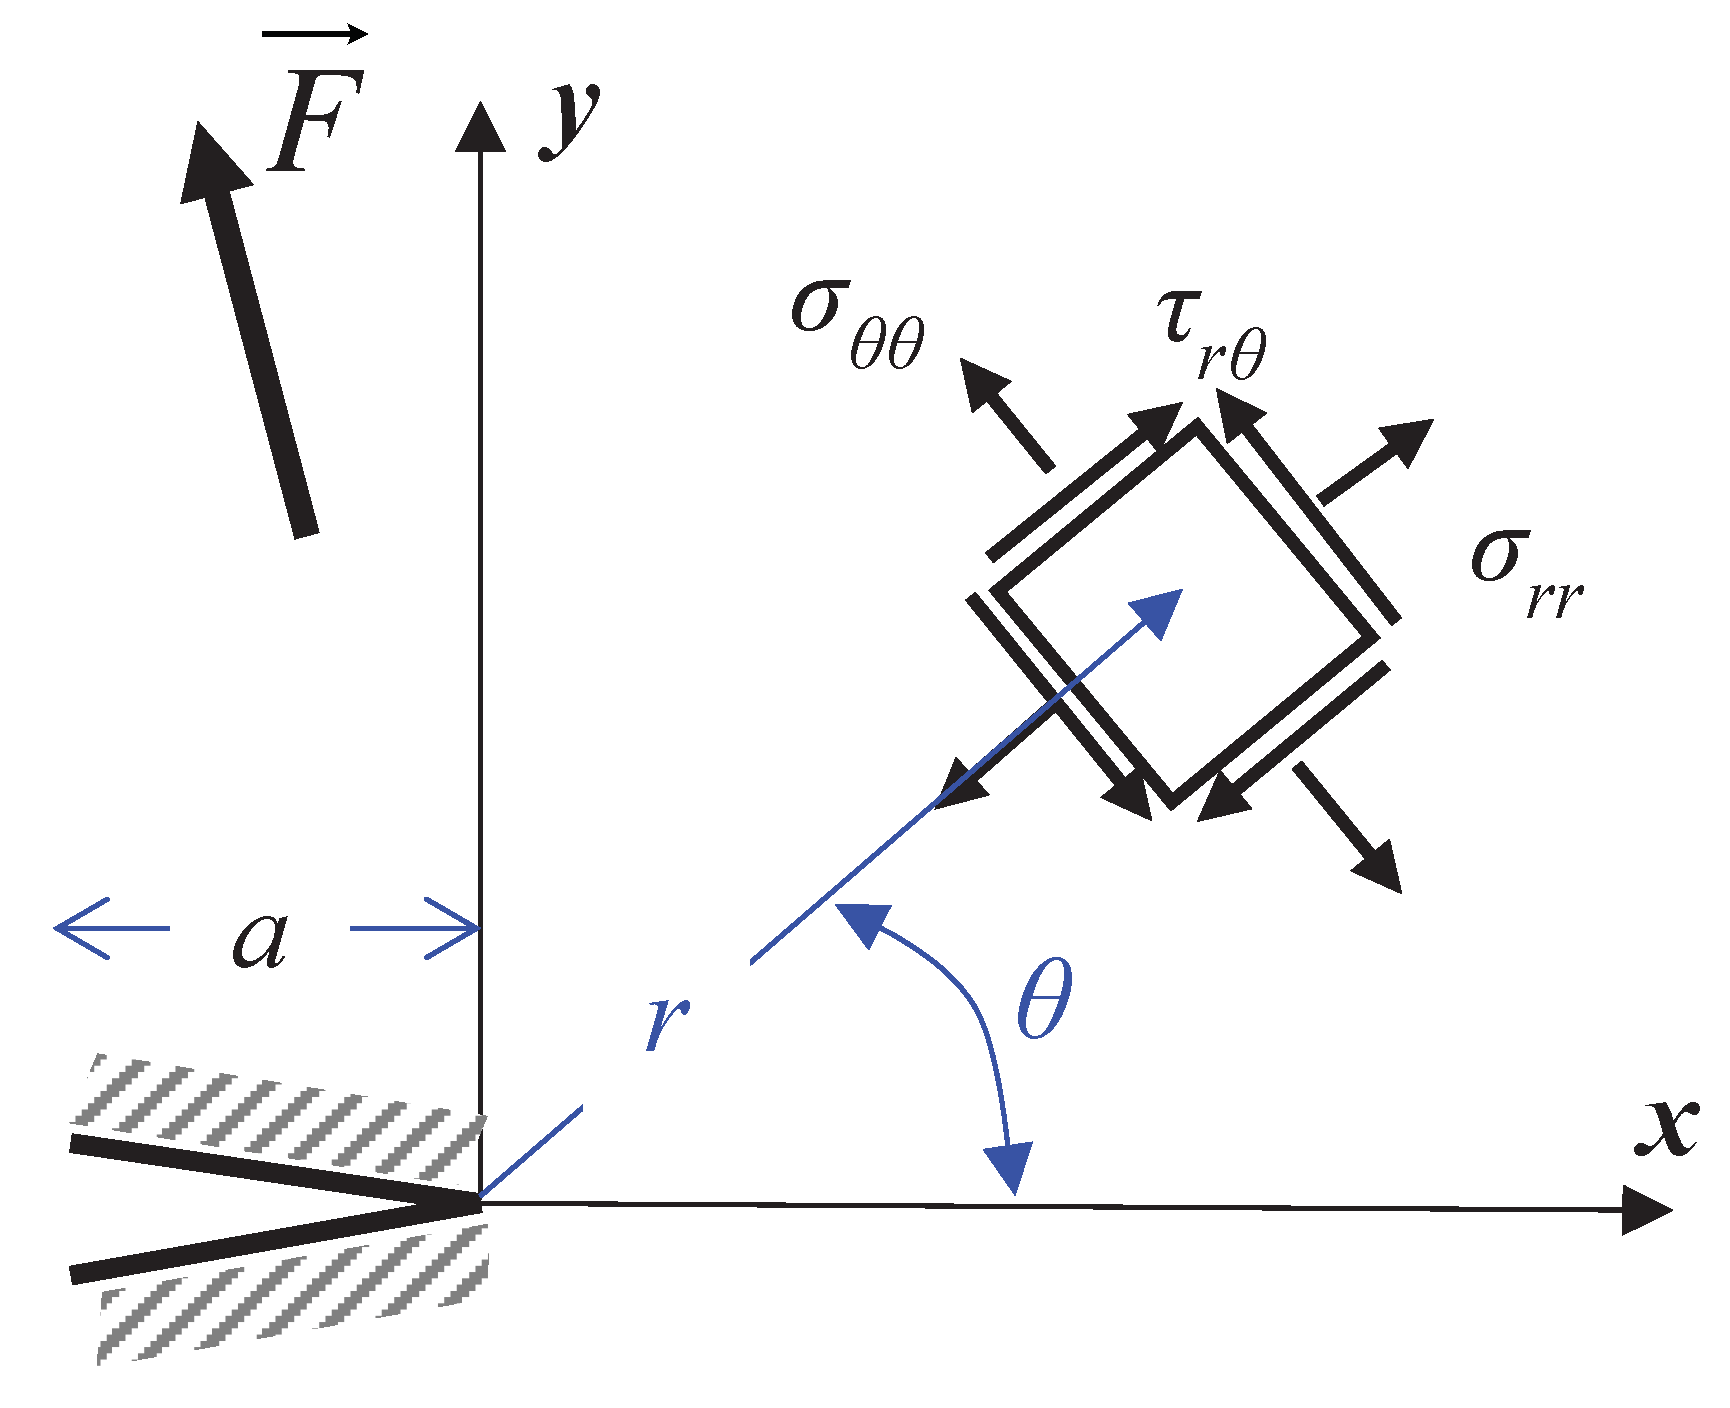
The stress field in a cracked body under an applied force F is schematically represented in
Figure 1, where
σ and
τ are the normal and shear stress respectively,
r and
θ are radial and tangential directions respectively, and
a is crack length.
In 2000, Wasiluk and Golos proposed the W-criterion [
4]. It states that a central crack under mixed-mode loading grows in the direction where the radius from the crack tip to the boundary of the plastic zone is the shortest [
4]. They started from the radius of the plastic zone,
rpz, proposed by Pook [
13] for mode I and II loading and compared the stress field with the Von Misses yield criteria for a plate with a centrally inclined crack, as shown in Equation (1).
where
σy is yield stress,
KI and
KII are SIF in modes I and II, respectively. Then, naming
W the factor of dividing
rpz over half the crack length and using
KI=σsin2θ√πa and
KII=σsinθcosθ√πa, they obtained Equation (2).
Thus, taking the first and second derivative of
W, Equation (2) with respect to
θ, as seen in Equation (3), it gives a
Wmin at which the direction of crack growth,
θW, will happen.
Then, if the applied load is cyclic, SIF,
K, becomes SIF range,
ΔK, and the fracture toughness,
Kc, becomes fatigue threshold,
ΔKth, as proposed and tested in [
10], so Equation (1) can be rewritten as Equation (4).
On the other hand, in 2014, Ren [
8] proposed a model based on the PZ radius and evaluated it for plane stress and plane strain conditions for a centrally inclined crack. The radius of the plastic zone is shown in Equation (5).
where
ν is Poisson’s modulus. Moreover, assuming the interchangeability of
K, and
ΔK and
Kc with
ΔKth Equation (5) for monotonic loading can be rewritten as Equation (6) for fatigue loading.
where
ΔK is the FIT range, and
ΔKth is the fatigue threshold. It is noted how the PZ can give an insight or crack initiation at the shortest radius. Furthermore, an analysis of Equation (4) and Equation (6) gives the angles at which the minimum radius occurs. That is 0º for mode I and 82.5º for pure mode II in the R-R-criterion and 77º in the W-criterion. Furthermore,
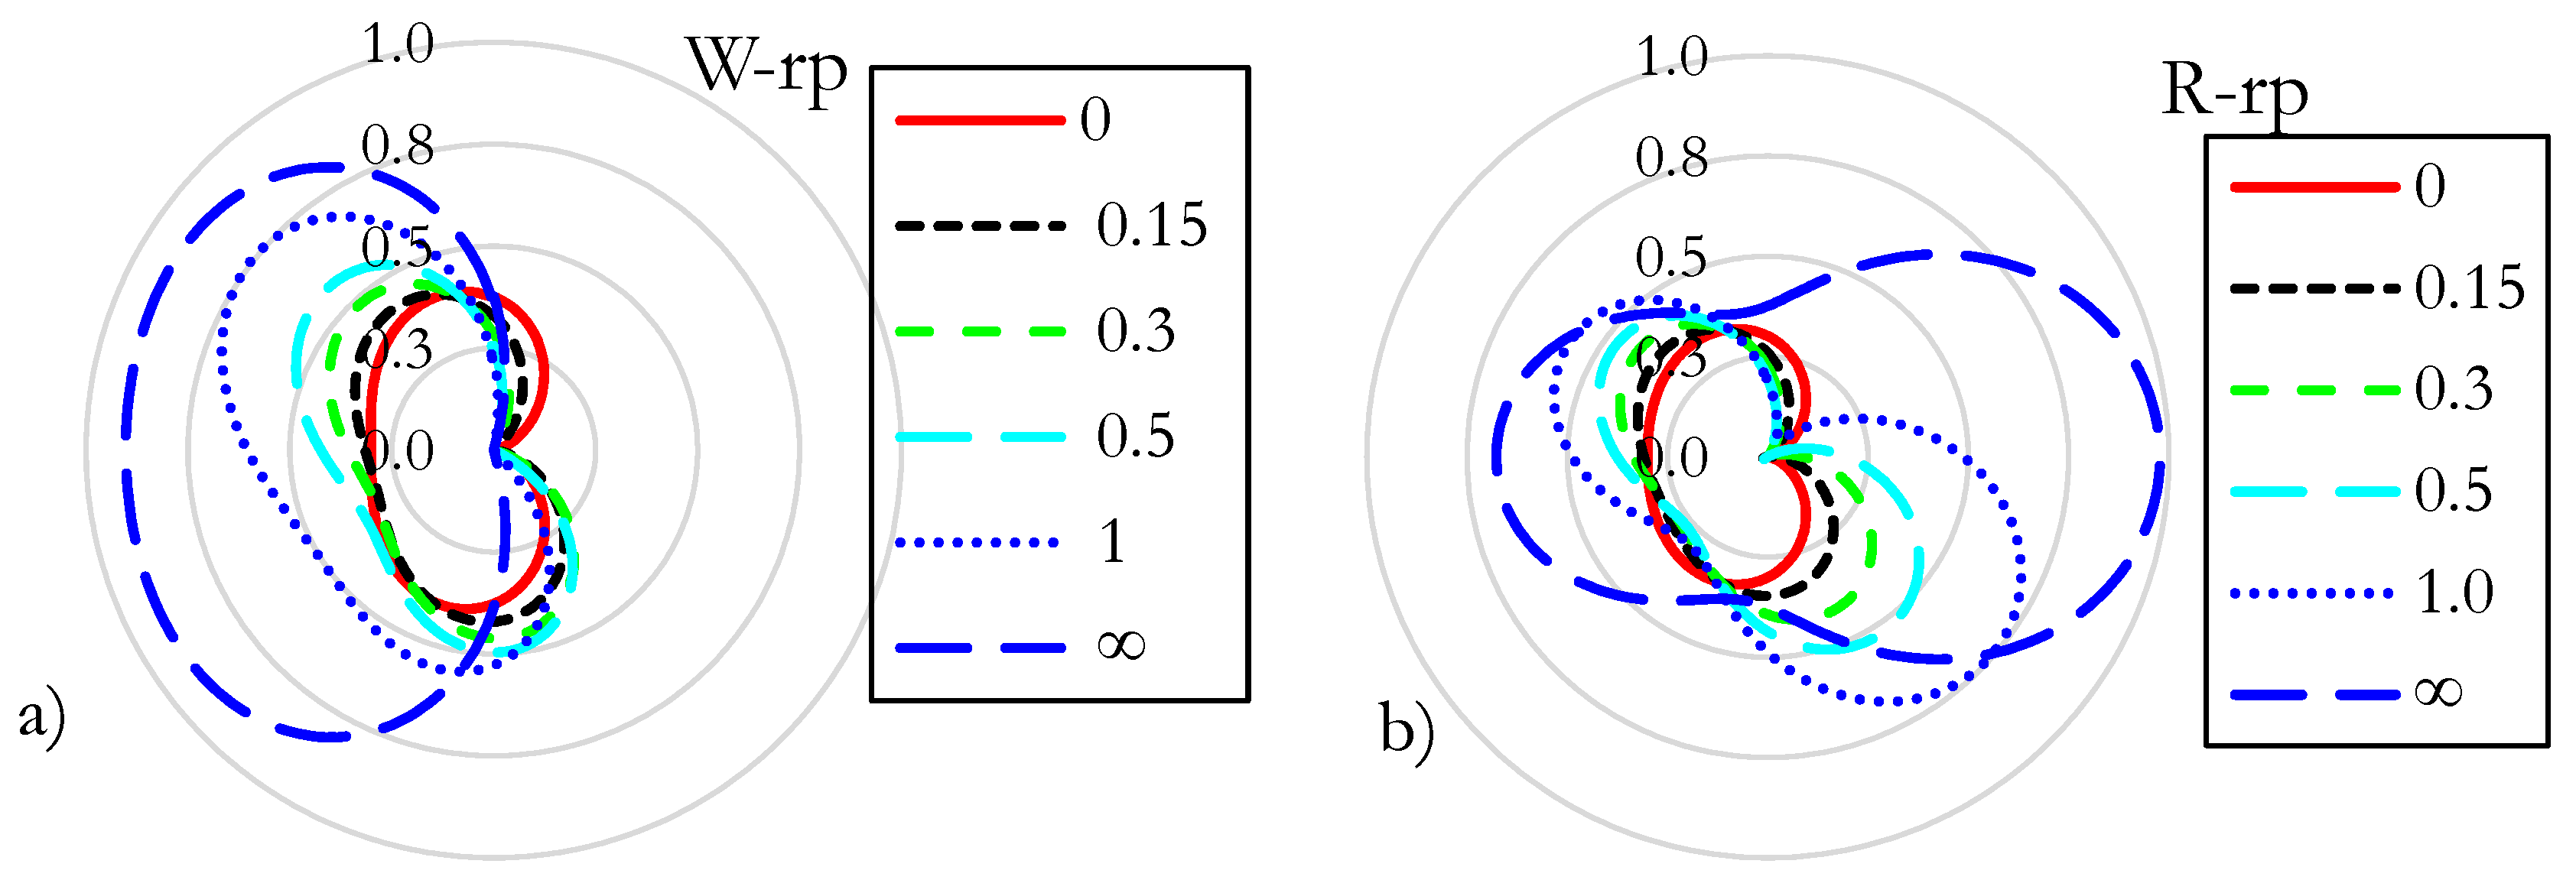
Figure 2 shows how the PZ changes for different mode-mixity (
KII/KI) ratios for both the W and R criteria, the latest plotted for plain stress. The PZ is plotted for different mode-mixity ratios, from pure mode I,
KII/KI=0 until pure mode II,
KII/KI = ∞, but keeping
Keq constant, √(K
I2+K
II2) = 1. Both K
I and K
II were always kept positive. A negative K
I does not make physical sense as it requires the crack lips to overlap, whereas a negative K
II implies the relative displacements of two opposite-to-crack points. It is seen how the PZ changes the applied load’s direction.
One can see in
Figure 2 that the crack orientation of the PZ changes from perpendicular-to-the-tensile stress, mode I to parallel-to-shear stress, mode II. Therefore, a parameter
M [
5,
14], is used to tell whether the crack growth is dominated by tensile or shear mode, as shown in Equation (7).
3. Materials and methods
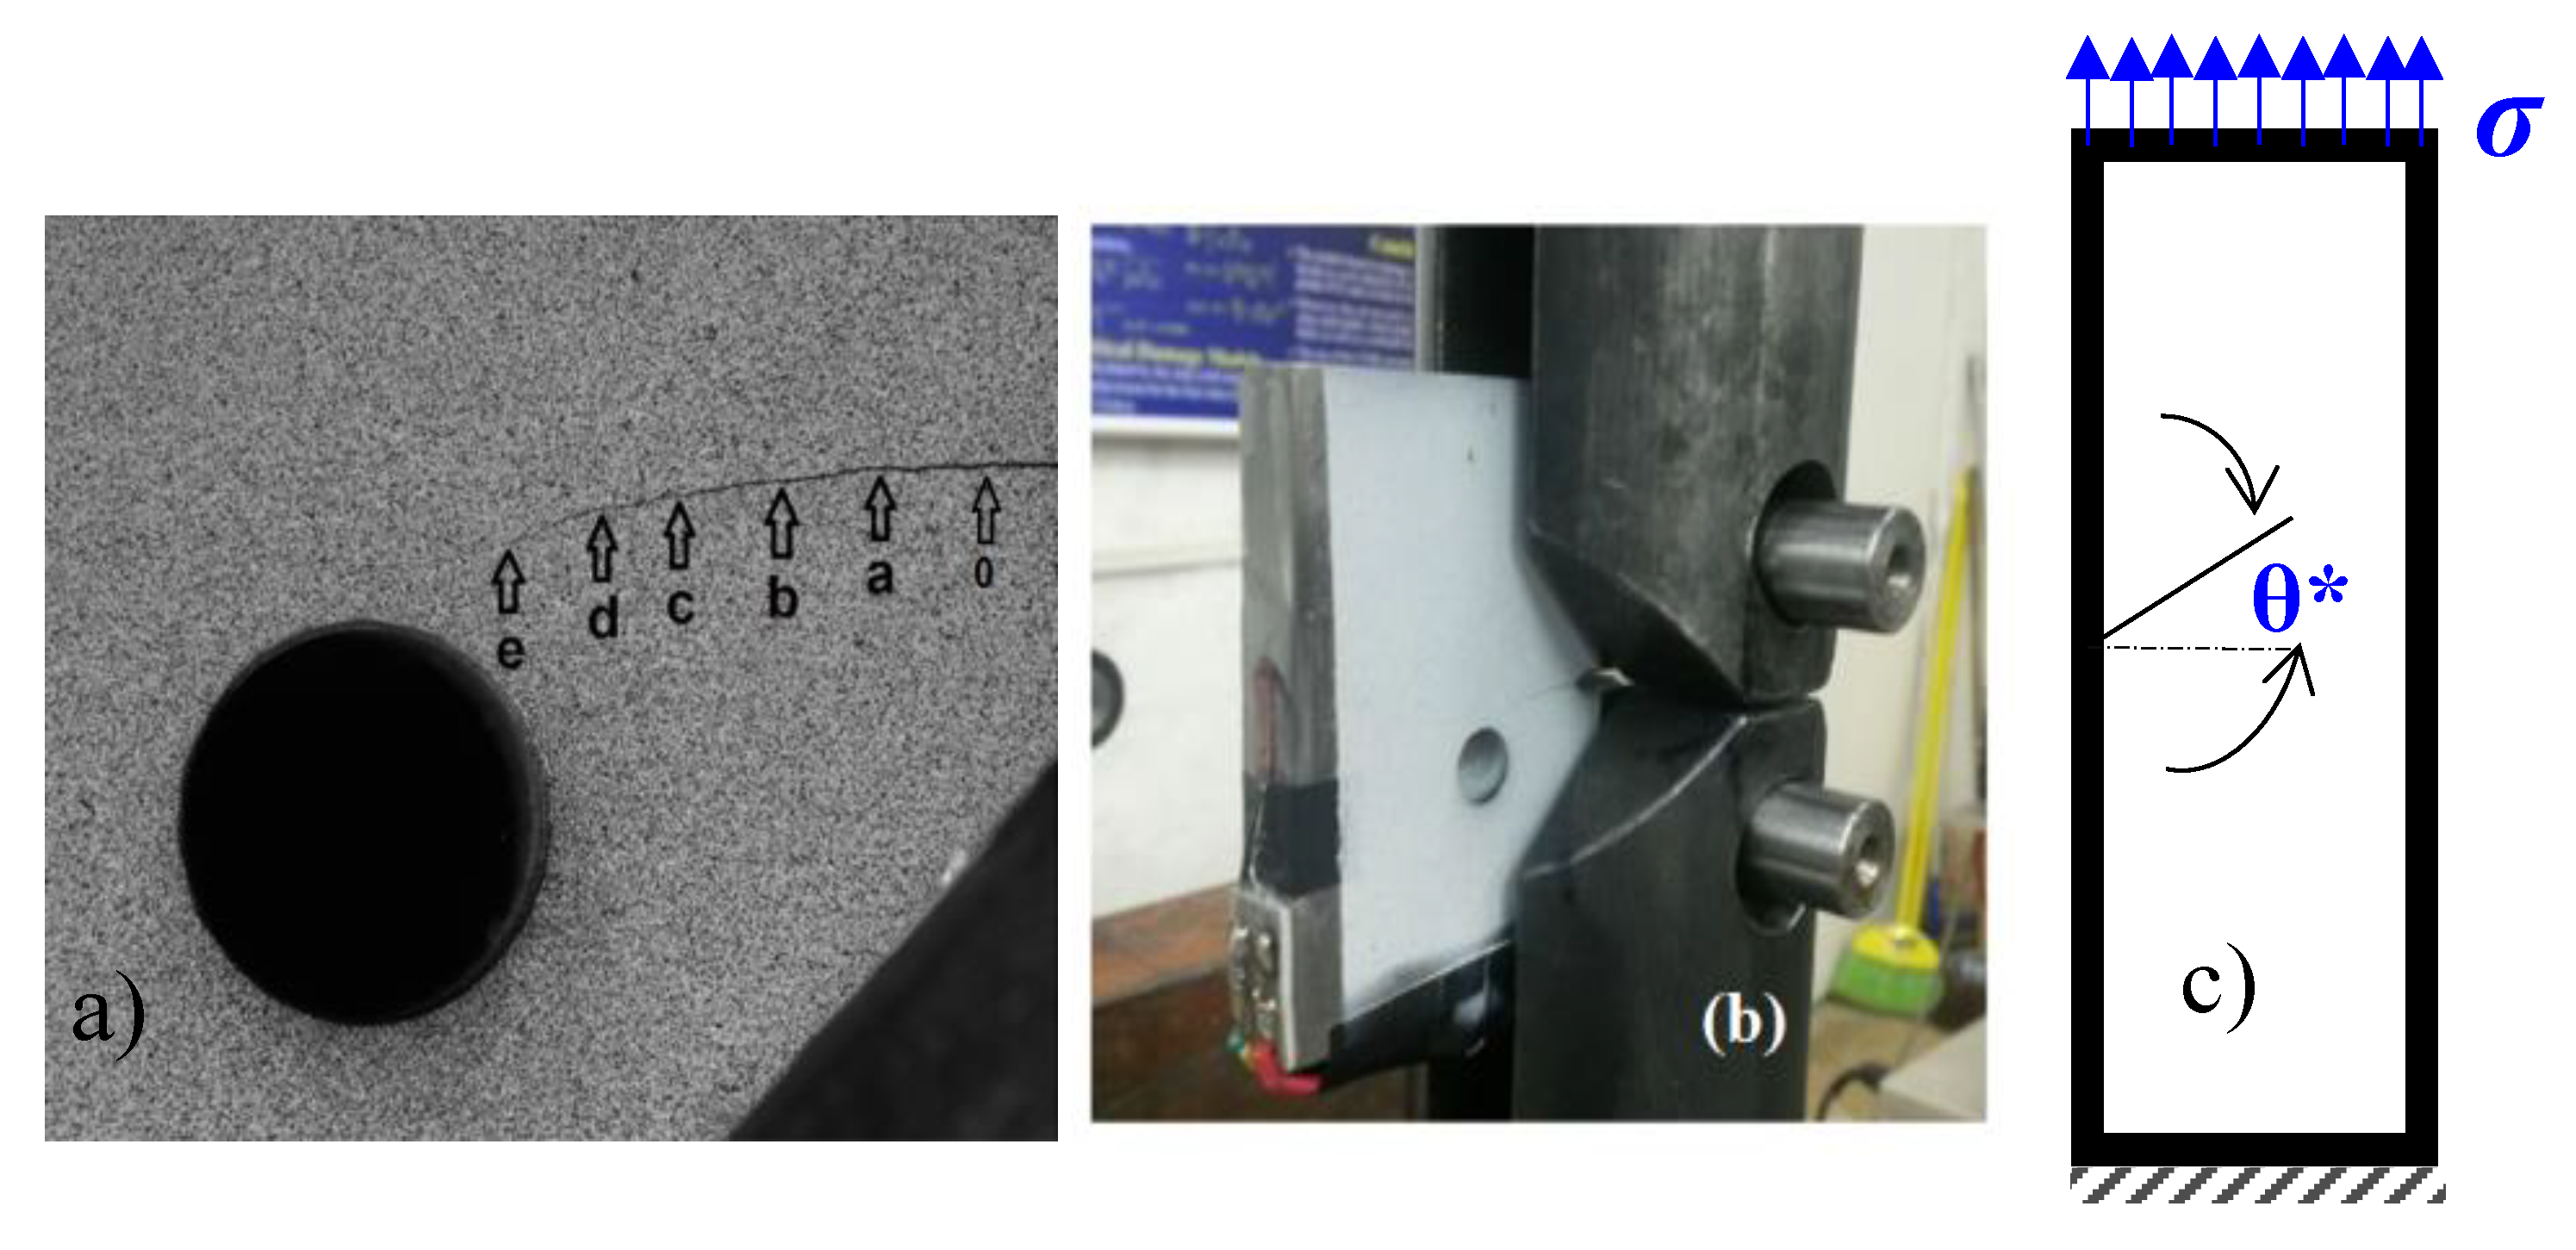
Data used to evaluate the two CP models was obtained from two samples subjected to proportional loading tests. The first was an 8.7 mm thick modified compact test C(T) specimen made out of low carbon steel with a drilled hole in front of the CP to modify the stress field [
11], as seen in
Figure 3a, where the testing set up shown in
Figure 3b. Miranda tested a similar sample [
15], whose results were computationally verified later on [
16]. The experimentally observed CP for this sample and the six measured points are shown in
Figure 3a. The hole modified the stress field, which curved the crack and induced opening mode II over the applied mode I load. Moreover, because the load inversion ratio was 0.1, the SIF range (
ΔK) was calculated as Kmax-Kmin from DIC displacement measurements and verified through FEM. A general reference for DIC, capabilities, limitations, and implementation can be found in [
17,
18].
Table 1 shows this sample’s retrieved crack length, CP angle, SIF ranges, and mode-mixity for the six measured points.
Because the applied load on this sample was cyclic, Equation (4) and Equation (6) were used to establish the sample’s PZ radius and shape. Extensive details about this test and specifics on how the SIFs were calculated are found in [
11].
The second type of samples was two 3 mm thick polycarbonate SENT samples [
12], see schematics in
Figure 3c, subjected to simple remote tension with a 22.5º and another with 45º inclined preexisting crack produced mixed-mode (I and II) loading conditions. The retrieved data included SIF modes I and II, obtained through numerical simulation and validated with photoelasticity, shown in
Table 2. Because the applied loading on these samples was monotonic, Equation (1) and Equation (5) were used to establish the PZ radius and shape.
Finally, the performance of the CP models was evaluated with the expression proposed in Equation (8), as recently proposed [
19].
where
θexp is the experimental CP angle and
θ* is the angle predicted by either model.
4. Results and Discussion
4.1. CP prediction for modified C(T)
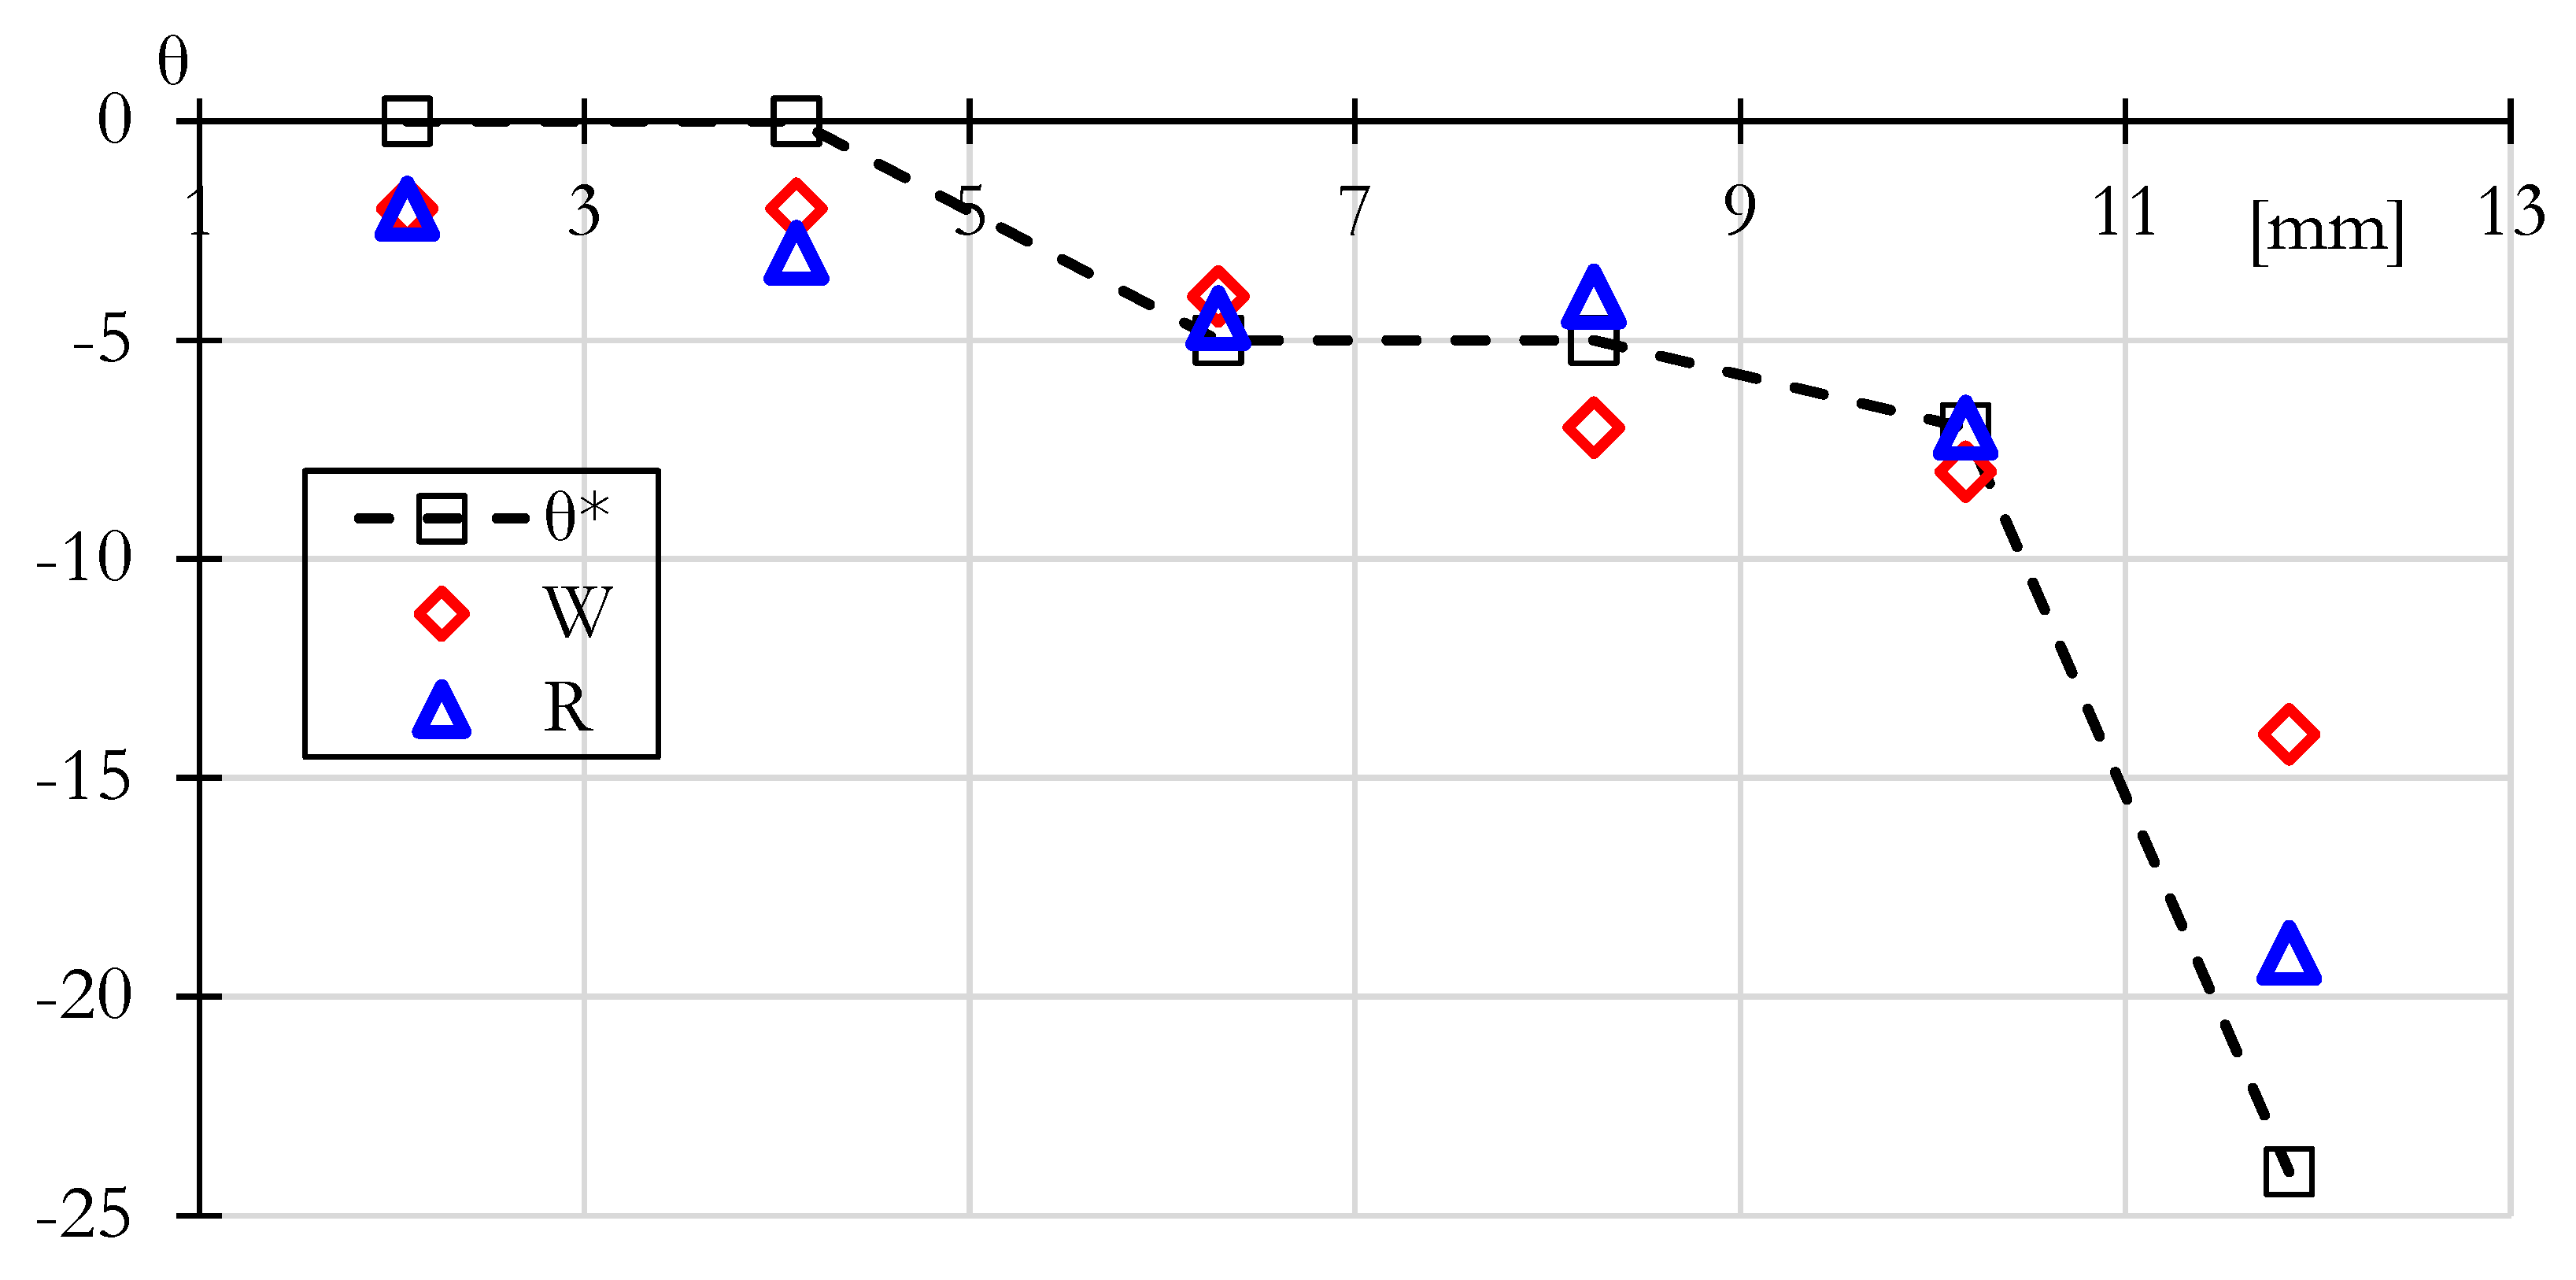
Figure 4 compares the experimentally observed CP for the W and R criteria predicted angle for the six measured points in the modified C(T) sample. One can see the prediction is very close for short cracks as the mode mixity-ratio, ΔK
II/ΔK
I, is low. However, at the last measurement before unstable crack growth, the ΔK
II/ΔK
I rises to 0.13, and the predicted angle gives a 6% error for the W-criterion. In contrast, the R-criterion shows a 1.7% error.
The W-criteria makes a close prediction for most of the crack lengths.
Figure 5 shows the comparative size and shape of the PZ, Equation (4) W-criterion, and Equation (5) R-criterion, for six different crack lengths in this specimen. It is seen how the PZ orientation turns as the crack length increases and the mode-mixity changes. This turning is attributed to the increase of
ΔKII, which makes the crack deviate from the applied more I load. Moreover, it is observed that the size of the largest PZ, about 2.54 mm for the W-criterion and about 2.9 mm for the R-criterion, in their largest axis, is below the thickness of the specimen 8.7mm. Thus, LEFM adequately describes the stress field. For this sample, the W criterion showed larger PZ for the first five crack sizes, whereas the R criterion retrieved a more extensive zone for the last one, where
KII reaches a 3.55 MPa√m and the mode-mixity, K
II/K
I, is 0.13.
4.2. CP prediction for SENT samples
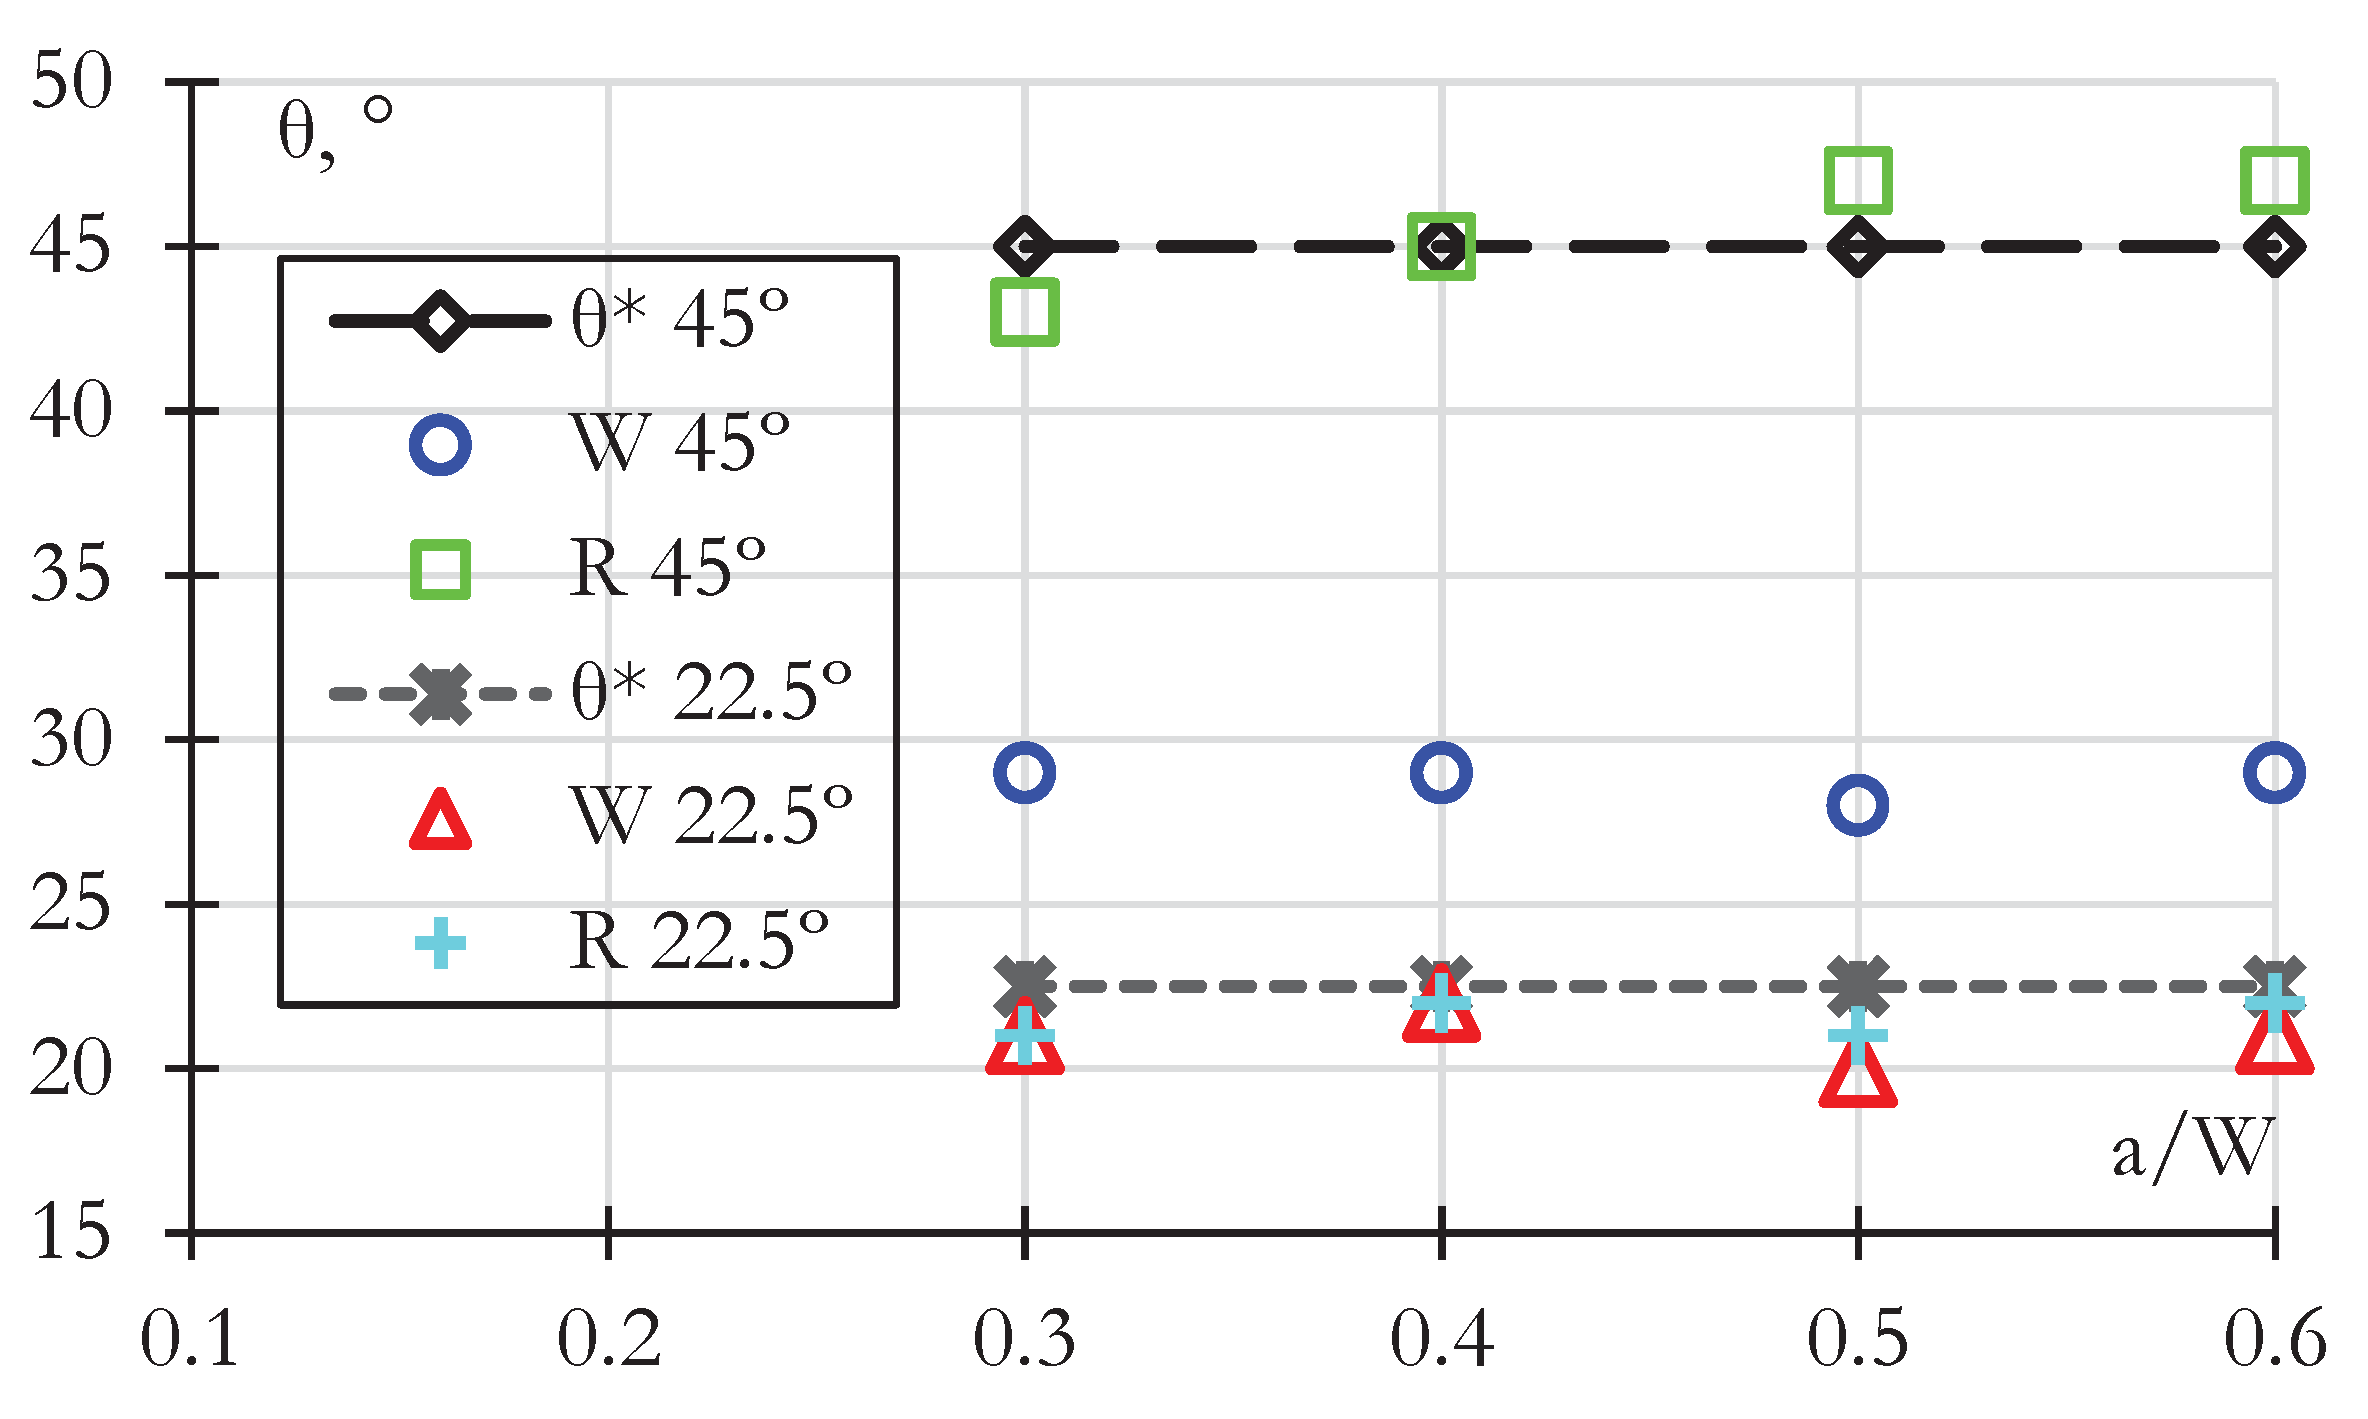
On the other hand, the performance of the CP models for both SENT specimens for dimensionless crack length is shown in
Figure 6. The models were evaluated with the retrieved
KI and
KII. Unlike the C(T) sample, the applied load is monotonic, so there is no need to assume that K is ΔK and K
c is ΔK
th. The SENT with a 45º crack showed a K
II/K
I ratio from 0.46 at the longest to 0.58 for the shortest a/W. Polycarbonate is a material prone to shear-dominated failure and the 45º crack induces a high K
II/K
I ratio. Therefore, the W criterion is not expected to perform well under these conditions, so it predicts a quasi-constant 29º, whereas the R criterion predicts a closer CP between 43 and 47º.
Conversely, the SENT with a 22.5º crack showed a quasi-constant KII/KI ratio of 0.23. Because of this constant KII/KI ratio, the predicted CP angle is also quasi-constant, about 21º degrees for the W criterion, very close to the experimentally observed angle of 22.5º. Conversely, the R criterion predicts a quasi-constant angle of 17º.
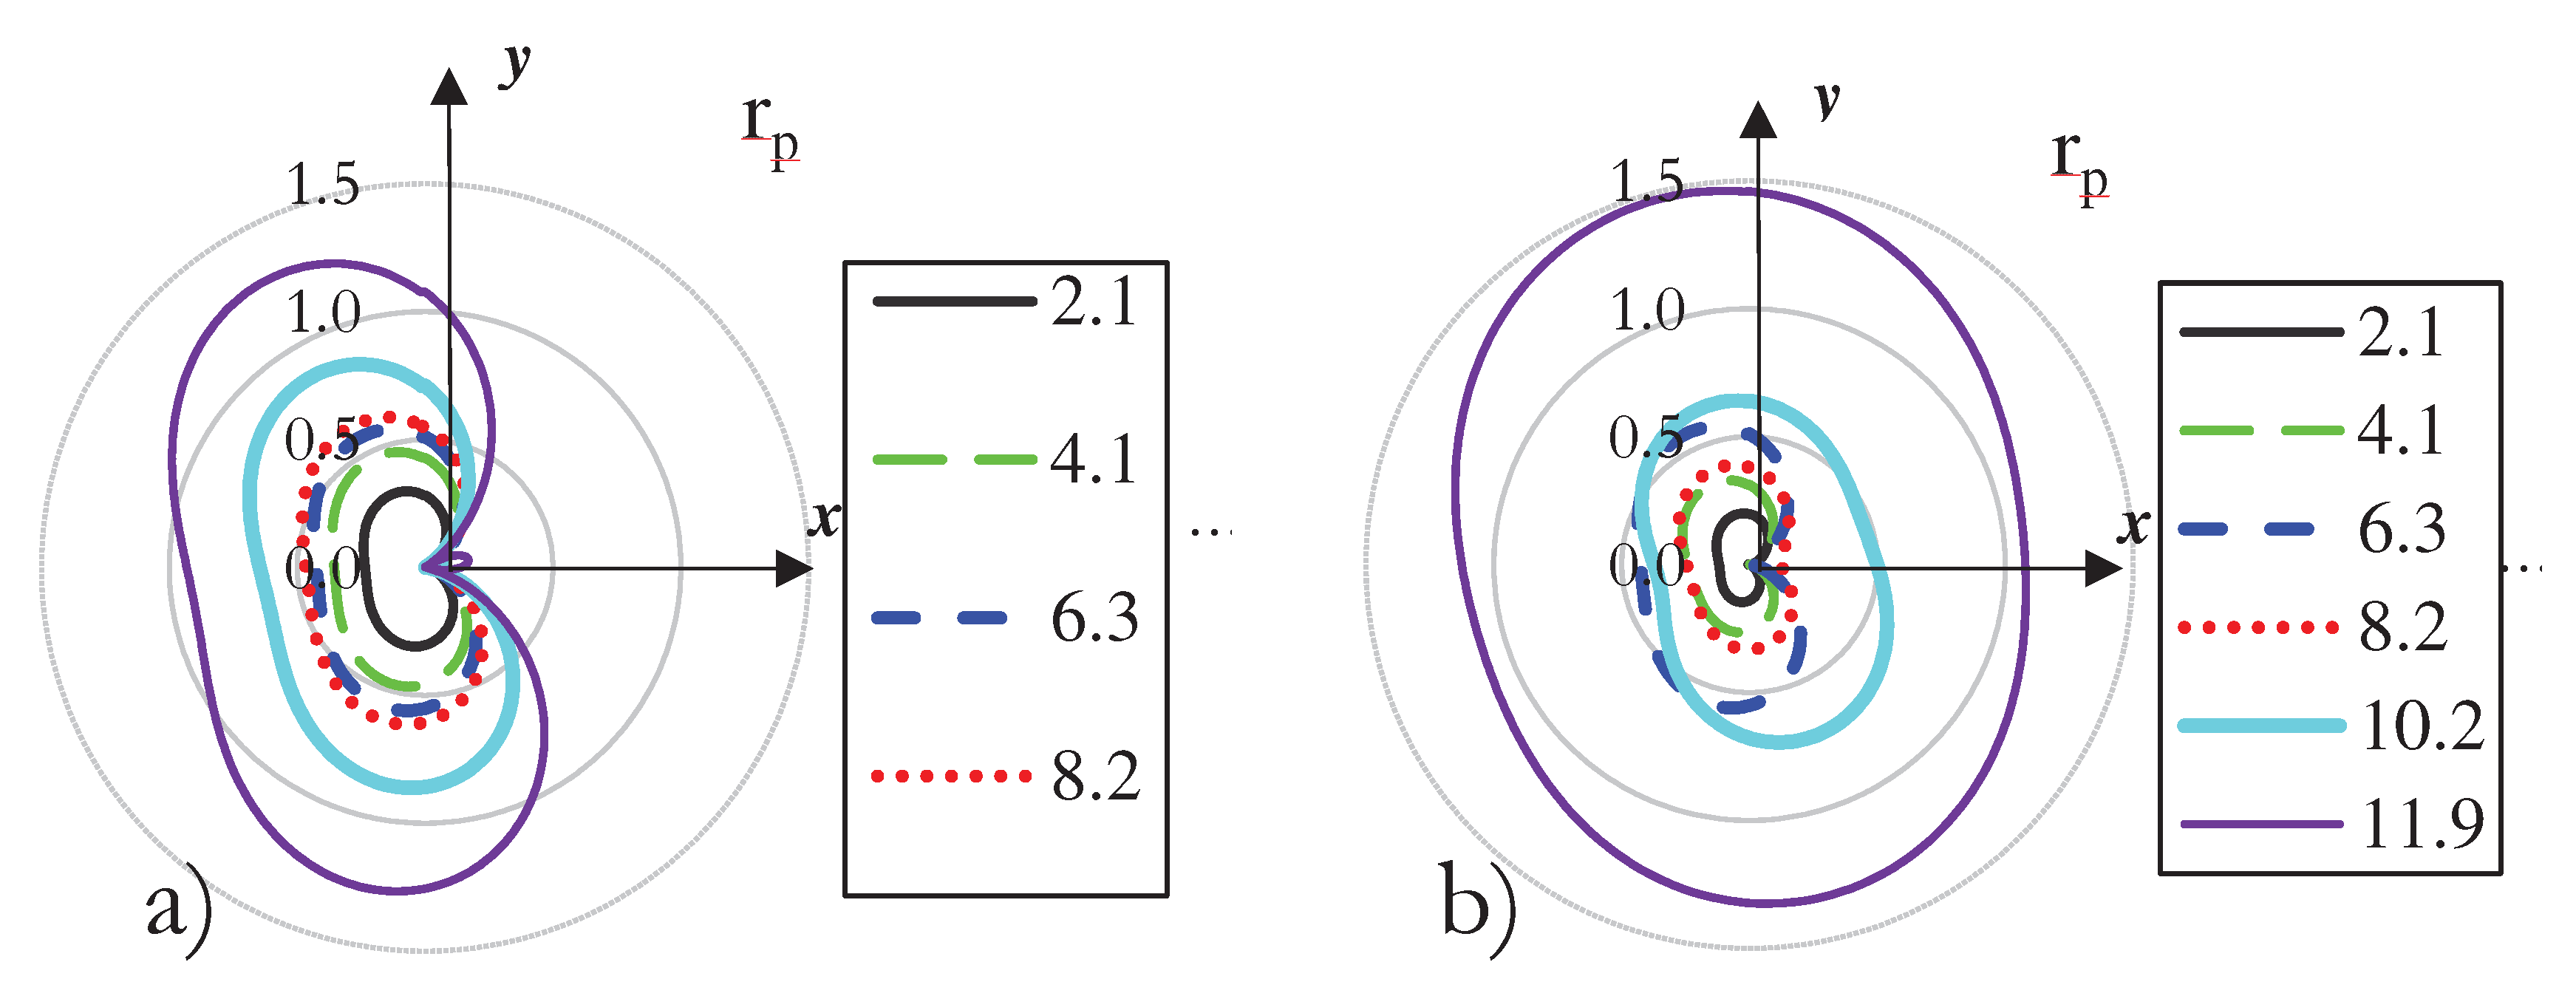
The shape and size of the plastic zone are shown in
Figure 7 for the SENT with an initial crack of 45º for the four different reported crack lengths. It is seen how the orientation of the plastic zone stays pretty much constant as the crack length increases for the W and R criteria. This situation is attributed to the steady K
II/K
I ratio, as seen in
Table 2, making the crack grow straight from its original path, even though only the mode I applied. Moreover, it is observed that the size of the largest plastic zone on its largest axis is about 0.7 mm for the W criterion and 0.58 mm for the R criterion. In both cases, this size is below the thickness of the specimen, 3.0 mm, so LEFM can be used to describe the stress field satisfactorily. Finally, it is noted that the W criterion predicts a slightly larger PZ than the R criterion.
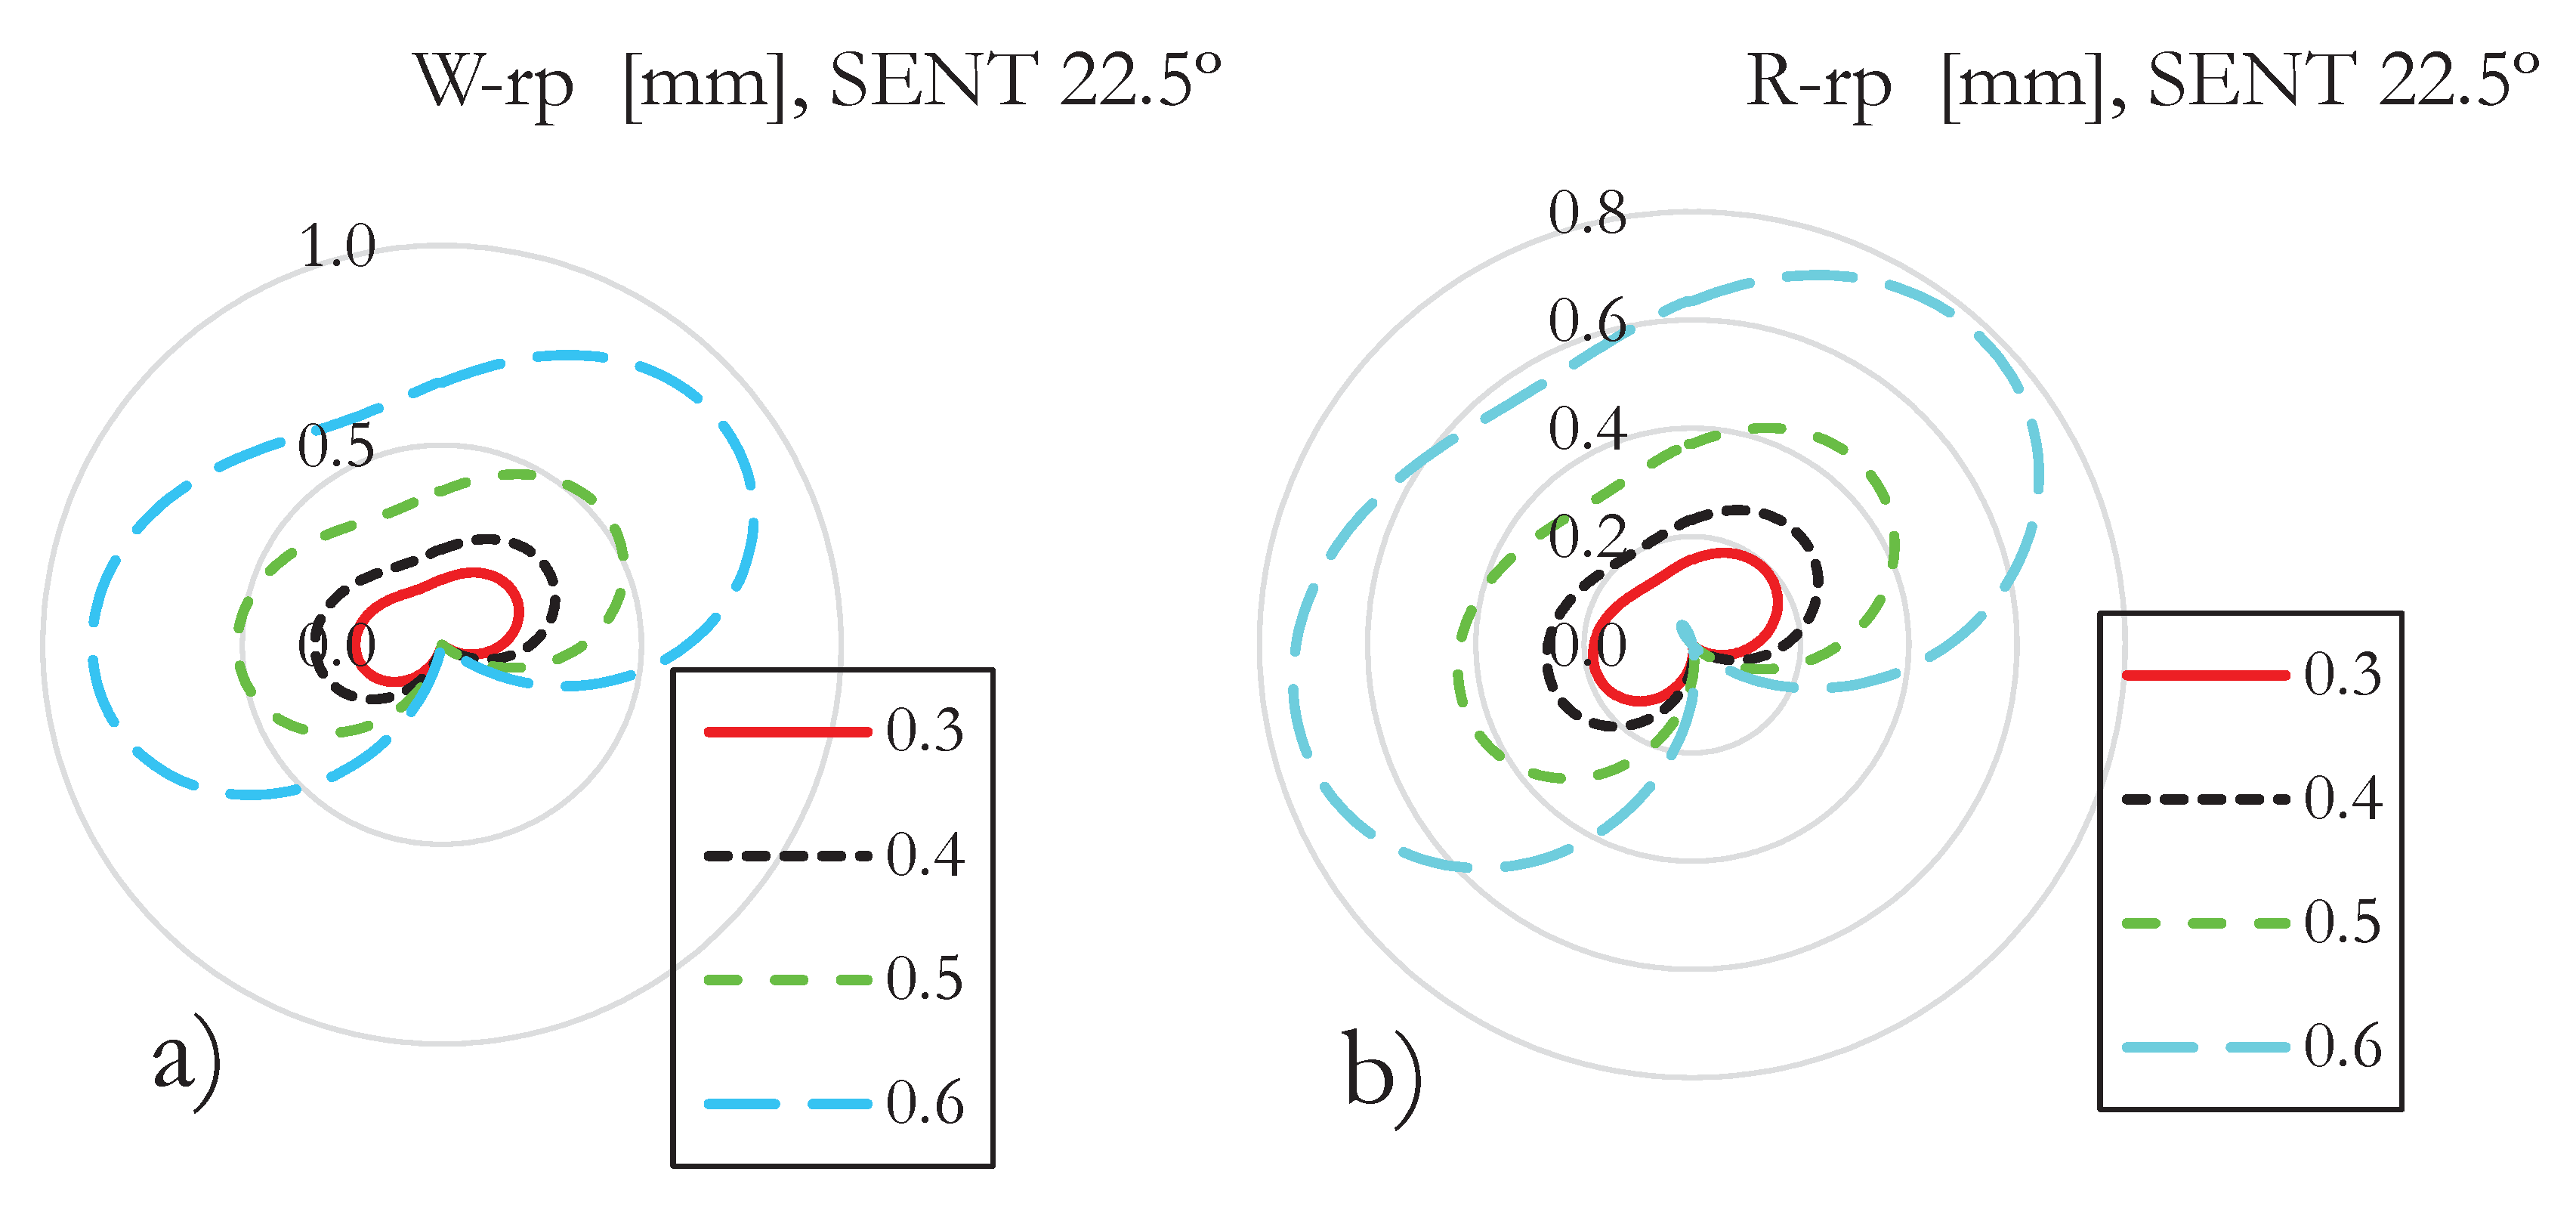
Figure 8 shows the PZ size for the SENT with an initial crack of 22.5º for the four different reported crack lengths. It is seen how the orientation of the plastic zone stays pretty much constant as the crack length increases. This situation is attributed to the steady K
II/K
I ratio, making the crack grow straight from its original inclined path, even though there is an applied load in mode I. Moreover, it is observed that the size of the largest PZ, about 1.8 mm for the W criterion and about 1.54 mm for the R criterion in its largest axis, is below the thickness of the specimen, 3.0 mm, so LEFM can be used to describe properly the stress field. In this sample, it is also observed that the W criterion predicts a slightly larger PZ than the R criterion.
4.3. Discussion
Highsmith [
6] stated that a crack under mixed-mode will grow when the equivalent SIF exceeds the material toughness,
Kc, or the equivalent SIF range exceeds the material fatigue threshold,
Kth. In both cases, the crack grew under either monotonic or fatigue loading. So, the
Keq was larger than the
Kc for the monotonic load, and the
ΔKeq was larger than the
Kth for the cycling load. However, because more than one loading mode was present, the CP must be established to describe crack growth completely [
19].
On the other hand, Vormwald et al. [
5] argued that the mode-mixity ratio [
14] might be the parameter that could tell when a crack growth scenario can change from tensile to shear-dominating load. It could make a crack turn when it reaches 0.5.
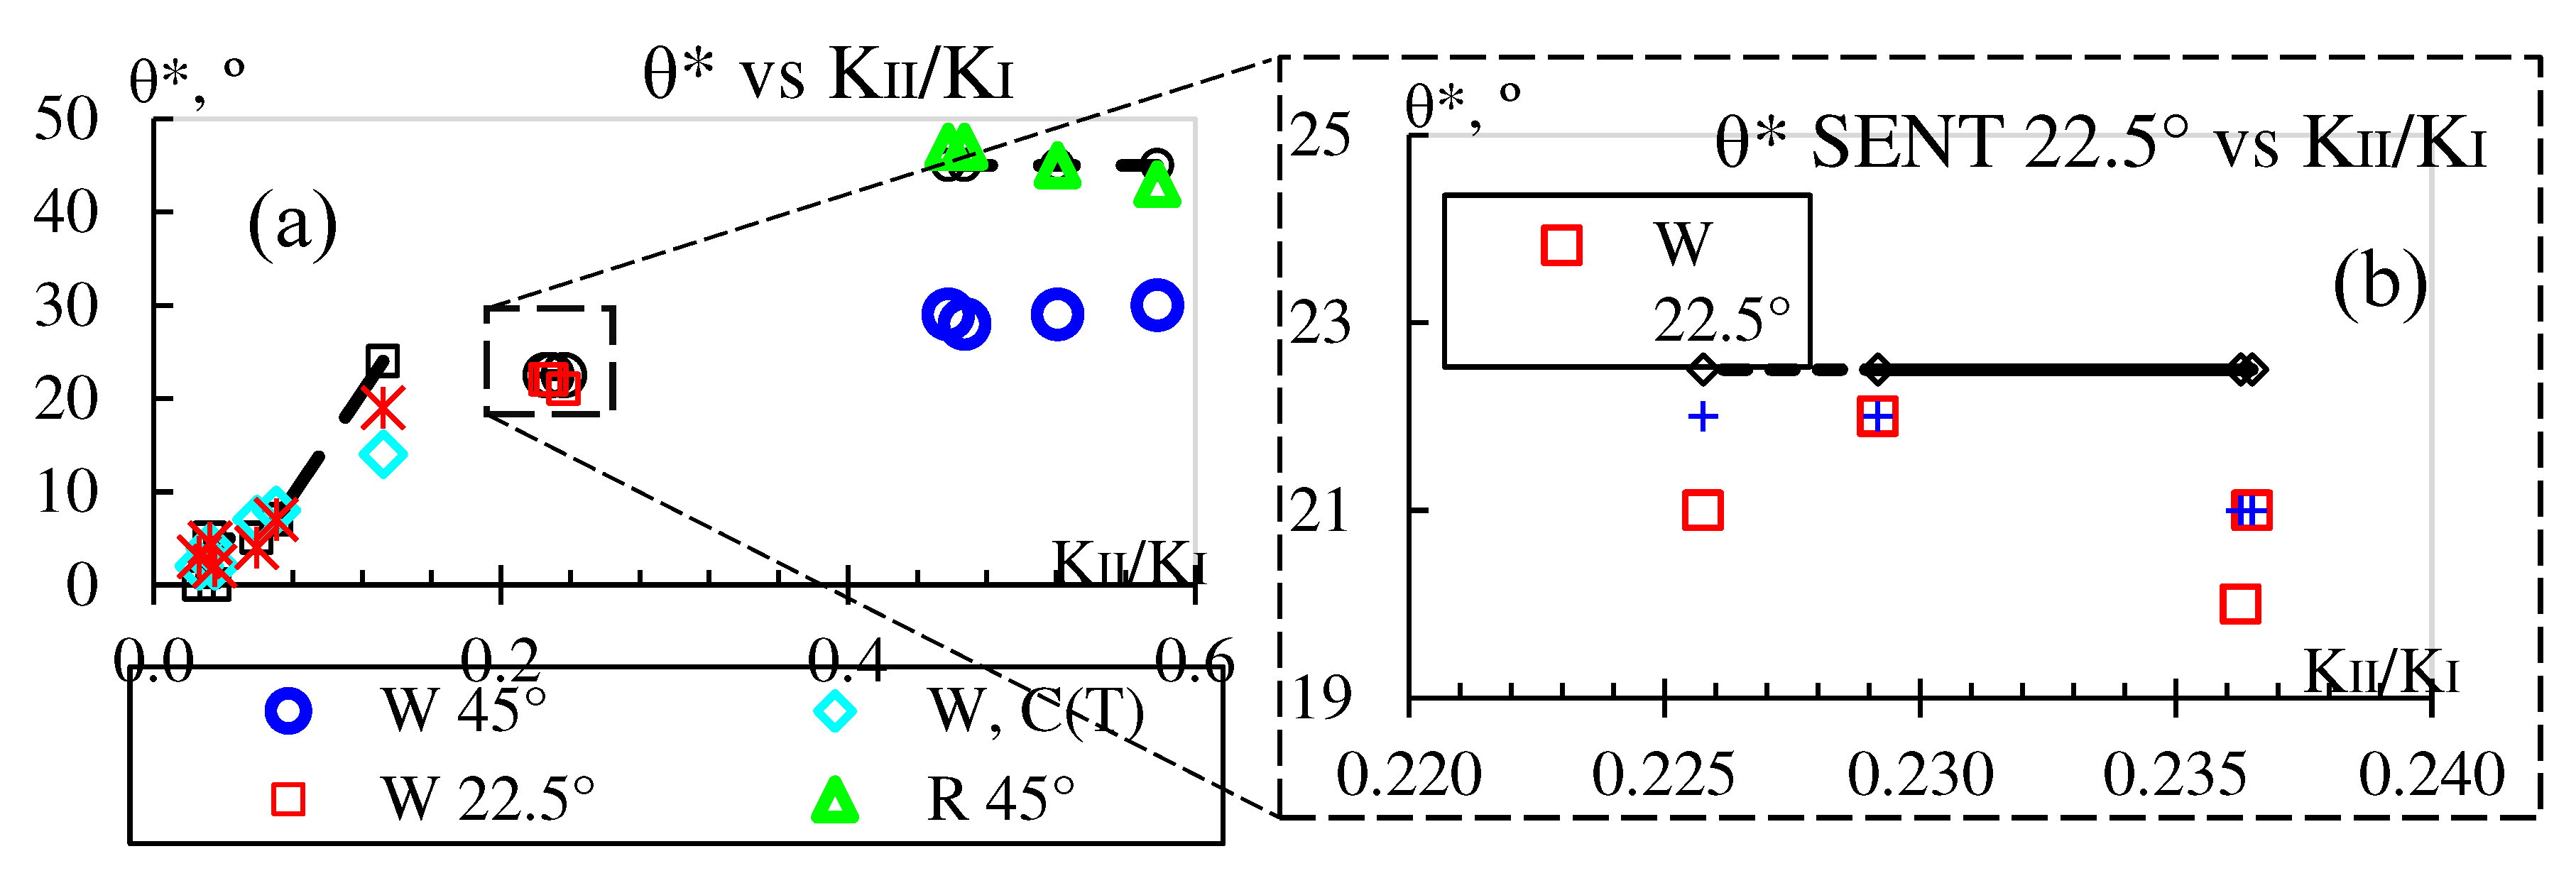
Figure 9 shows the variation of CP angle with mode-mixity for both samples. For the SENT samples, neither the load nor the mode-mixity changed much with crack length. For the 22.5º SENT, the K
II/K
I ratio kept a 0.24 constant value, whereas, for the 45º sample, the K
II/K
I ratio went from 0.56 to 0.46, as seen in
Figure 6. Vormwald et al. [
5] argued that when transitioning from tensile to entirely dominated shear crack growth, such mode-mixity parameter might not be able to tell the CP. Therefore, the CP for the SENT samples was not expected to deviate from its initial angle. This is seen in
Figure 9a for the three samples and
Figure 9b for a close-up of the SENT 22.5°.
On the other hand, for the modified C(T) sample, the mode-mixity changes constantly, starting at 0.04 and reaching 0.13. As a result, the CP for the modified C(T) sample changes as well, as seen in
Figure 9 in the black. Thus, the mode-mixity indeed influences the CP angle. This analysis shows that a change in the
KII/KI ratio involves a change in the CP angle.
Furthermore, in
Figure 8, one can see the size of the largest plastic zone is about 1.5 mm, so it does not exceed the holed C(T) sample thickness, 8.7 mm. On the other hand, the largest plastic zone size for the SENT sample is seen in
Figure 7 for the 22.5º and
Figure 8 for the 45º sample, where the plastic zone does not exceed the 3 mm sample thickness. Therefore, the applicability of LEFM is checked at once.
On the other hand, the CP prediction error is shown in
Table 3. Both criteria are close in prediction with errors as low as 0.28% and as high as 1.67% for the modified C(T). For the largest mode-mixity on the modified C(T), the W criterion shows a 5.56, whereas the R criterion shows a 2.78% error. The same case for the SENT 45° sample is 8.33 versus 1.11% error, respectively. In both cases, the mode-mixity (ΔK
II/ΔK
I) had a wide range of about 0.1, in both cases. For the SENT 22.5 sample, both are really close to each other; the largest difference being 0.56%. In this case, it could be explained by the quasi-constant ΔK
II/ΔK
I.
On a final note, it has to be said that the computational cost of these two criteria is high compared to other criteria, as recently evaluated [
19]. For that reason, the computational cost, in terms of floating-point operations (FLOPS), is compared in
Table 4. The R criterion is slightly less costly than the W criterion.
5. Conclusion
The crack path was calculated for specimens under fatigue and monotonic load using the LEFM-based plastic zone radius criteria. The LEFM parameters for the fatigued sample were characterized experimentally with DIC, whereas the monotonic samples were characterized numerically with FEM and validated with photoelasticity, both obtained from the literature. An advantage of plastic zone-based criteria is that the applicability of LEFM is checked in the same Equation. Furthermore, using prediction models rather than FEM modeling makes a faster prediction by avoiding time-consuming modeling and simulation. Finally, the selected models worked for numerical and experimentally obtained SIF. The literature has discussed how the experimentally acquired SIFs include nonlinear effects such as rugosity, plasticity-induced closure, and crack flank interlocking.
The W and R criteria were devised for monotonic load, and here, they were tested for monotonic and fatigue load. The swap of K with ΔK was checked, which was found applicable in these cases. The error analysis showed that the W and R criteria predicted angles very close for short cracks as the mode mixity-ratio, ΔKII/ΔKI, is below 0.25, with the R criterion exhibiting lower error values. However, at the last measurement for the modified C(T) low carbon steel sample before unstable crack growth, the ΔKII/ΔKI doubles its value and makes an unstable W-criterion prediction. The R criterion has about 88% of the W’s computational cost, which could impact performance for recurrent calculations. Furthermore, the models were devised for central cracks, and here, they were tested in lateral cracks. The predicted versus experimental CP comparison showed that the models could be used for fatigue and monotonic loads.
Acknowledgments
The authors acknowledge the financial support from Pontifícia Universidade Católica do Rio de Janeiro—PUC-RJ.
References
- Mróz, K.P.; Mróz, Z. On Crack Path Evolution Rules. Eng Fract Mech 2010, 77, 1781–1807. [Google Scholar] [CrossRef]
- Yu, X.; Li, L.; Proust, G. Fatigue Crack Growth of Aluminium Alloy 7075-T651 under Proportional and Non-Proportional Mixed Mode I and II Loads. Eng Fract Mech 2017, 174, 155–167. [Google Scholar] [CrossRef]
- Kujawski, D. Discussion and Comments on KOP and ∆Keff. Materials 2020, 13, 4959. [Google Scholar] [CrossRef] [PubMed]
- Wasiluk, B.; Golos, K. Prediction of Crack Growth Direction under Plane Stress for Mixed-Mode I and II Loading. Fatigue Fract Eng Mater Struct 2000, 23, 381–386. [Google Scholar] [CrossRef]
- Vormwald, M.; Hertel, O.; Zerres, P. Fatigue of Engineering Structures under Combined Nonproportional Loads: An Overview. Fatigue Fract Eng Mater Struct 2018, 41, 1449–1468. [Google Scholar] [CrossRef]
- Highsmith, S. Crack Path Determination for Non-Proportional Mixed-Mode Fatigue, Georgia University of Technology, 2009.
- Rozumek, D.; Macha, E. A Survey of Failure Criteria and Parameters in Mixed-Mode Fatigue Crack Growth. Materials Science 2009, 45, 190–210. [Google Scholar] [CrossRef]
- Ren, L.; Zhu, Z.; Wang, M.; Zheng, T.; Ai, T. Mixed-Mode Elastic-Plastic Fractures: Improved R-Criterion. J Eng Mech 2014, 140, 04014033. [Google Scholar] [CrossRef]
- Richard, H.A.; Fulland, M.; Sander, M. Theoretical Crack Path Prediction. Fatigue Fract Eng Mater Struct 2005, 28, 3–12. [Google Scholar] [CrossRef]
- Vormwald, M.; Hos, Y.; Freire, J.L.F.; Gonzáles, G.L.G.; Díaz, J.G. Variable Mode-Mixity during Fatigue Cycles—Crack Tip Parameters Determined from Displacement Fields Measured by Digital Image Correlation. Frattura ed Integrità Strutturale 2017, 11, 314–322. [Google Scholar] [CrossRef]
- Díaz Rodríguez, J.G.; Gonzales, G.; Ortiz Gonzalez, J.A.; Freire, J. Analysis of Mixed-Mode Stress Intensity Factors Using Digital Image Correlation Displacement Fields. In Proceedings of the 24th ABCM International Congress of Mechanical Engineering; ABCM, Ed.; ABCM: Curitiba, 2017. [Google Scholar]
- Merah, N.; Albinmousa, J. Experimental and Numerical Determination of Mixed Mode Crack Extension Angle. J Test Eval 2009, 37, 95–107. [Google Scholar] [CrossRef]
- Pook, LP. The Effect of Crack Angle on Fracture Toughness. Eng Fract Mech 1971, 3, 205–218. [Google Scholar] [CrossRef]
- Aliha, M.R.M.; Berto, F.; Mousavi, A.; Razavi, S.M.J. On the Applicability of ASED Criterion for Predicting Mixed Mode I+II Fracture Toughness Results of a Rock Material. Theoretical and Applied Fracture Mechanics 2017, 92, 198–204. [Google Scholar] [CrossRef]
- Miranda, A.C.O.; Meggiolaro, M.A.; De Castro, J.T.P.; Martha, L.F. Fatigue Life Prediction of Complex 2D Components under Mixed-Mode Variable Amplitude Loading. Int J Fatigue 2003, 25, 1157–1167. [Google Scholar] [CrossRef]
- Chatzigeorgiou, A.; Theotokoglou, E.; Tsamasphyros, G.I. Code Development for the Computational Analysis of Crack Propagation in Structures. Frattura ed Integrità Strutturale 2020, 14, 306–324. [Google Scholar] [CrossRef]
- Castillo, I.M.; Peñaranda, A.E.; Diaz, J.G. Implementación de La Técnica de Correlación de Imágenes Digitales Con Software Libre. Aibi 2020, 8, 25–32. [Google Scholar] [CrossRef]
- Díaz-Rodríguez, J.G. Comparison of Stress Separation Procedures. Experiments versus Theoretical Formulation. Engineering Solid Mechanics 2022, 10, 153–164. [Google Scholar] [CrossRef]
- Díaz, J.G.; Freire, J.L. de F. LEFM Crack Path Models Evaluation under Proportional and Non-Proportional Load in Low Carbon Steels Using Digital Image Correlation Data. Int J Fatigue 2022, 156, 106687. [Google Scholar] [CrossRef]
|
Disclaimer/Publisher’s Note: The statements, opinions and data contained in all publications are solely those of the individual author(s) and contributor(s) and not of MDPI and/or the editor(s). MDPI and/or the editor(s) disclaim responsibility for any injury to people or property resulting from any ideas, methods, instructions or products referred to in the content. |
© 2023 by the authors. Licensee MDPI, Basel, Switzerland. This article is an open access article distributed under the terms and conditions of the Creative Commons Attribution (CC BY) license (http://creativecommons.org/licenses/by/4.0/).
