1. Introduction
During the last decades, important advances have been made in the development of methodologies that improve the productivity of production processes. These advances have focused on the prediction, reduction or elimination of sources that generate interruptions or waste in processes, guided mainly by Lean methodologies, statistical control systems and standardization standards [
1].
Currently, the question arises about the impact that the implementation of Industry 4.0 technologies will have on maintaining productivity growth rates, and to what extent they will be linked to the capacity of human-machine systems. The changes are evident in the way human work is carried out and organized [
2], how to react quickly to special situations or anomalous patterns that arise in production processes will depend largely on the human factor, which requires constant control, direction and coordination to achieve optimal results.
Ref.[
3] states that conventional production control methods are inefficient and incapable of responding to systems with frequent interruptions, so developing multi-agent systems capable of coordinating tasks between peers becomes imperative, aging of workers, ergonomics in equipment design, risk minimization and labor laws are challenges that are increasingly worrying industrialized countries[
4]. Ref. [
5]indicates that Industry 5.0 reaffirms the unmet objectives of Industry 4.0 and puts humans at the center of smart manufacturing systems (SMS) where machines and humans can generate knowledge and learn from each other, creating a virtuous co-evolution, so human-machine interaction must be deeply understood to create effective collaboration between people and SMS.
Multiple scientific articles declare that humans in future production and logistics systems will not always see their active role reduced, but will collaborate and make important decisions based on the information that new technologies make available to them [
6]. Human-system interactions are relevant in decision-making processes in industrial maintenance departments. This interaction is affected by four factors: Confidence in the predictive model, control in the decision-making process, availability of cognitive resources. sufficient and adequate organization in the decision-making process[
7].
The objective of our work is to develop an empirically based industrial operations management model, to enhance productivity, focusing on the human being.
The developed model emerged from practice, being simple and integrable to Lean, control and standardization methodologies. As a result of its implementation, it was possible to achieve significant improvements in productivity and a digital record of situations that complements Big Data, in a relatively short implementation time and without large investments. Additionally, allowing the permanent establishment of group communication channels that strategically link individuals, raising situational awareness at higher levels of the organization, allowing more agile decision-making during interruptions.
In this publication we complement preventive efforts with an efficient corrective approach, which will define how to handle production interruption situations, in order to minimize their impacts and maximize the resilience of the production system as a whole.
Our article begins with literature review, then we declare our contribution, afterward we describe the proposed model, following that we detail a methodology and the stages of implementation of the model, we continue with a description of the model application process in a real case and ending with the results, analysis and conclusions.
2. Literature review
Avoiding and preventing interruptions in a production process or a supply chain has been the focus of recent years, with little attention paid to fault management and the consequences of these situations after they have occurred[
8], focusing mainly on identifying its origin and in taking measures to prevent its occurrence, with multiple methodologies for preventing and predicting risk situations[
9].
Ref.[
10] mentions that the five main sources of variability in manufacturing processes are:
Variations in the process: These are the fluctuations inherent to the manufacturing process, which can be caused by factors such as machinery, raw materials or the environment.
Method variations: These refer to differences in the way the manufacturing process is carried out, such as the speed of production, the sequence of operations, and the quality of work.
Variations in the operator: They are related to the skills and characteristics of the personnel in charge of carrying out the manufacturing process, such as their experience, training and motivation.
Equipment variations: These refer to differences in the performance and characteristics of the machinery used in the manufacturing process, such as its capacity, maintenance and adjustment.
Variations in the environment: These are fluctuations that can be caused by factors external to the manufacturing process, such as climate, lighting and environmental pollution.
Ref. [
11]emphasizes the importance of a real-time process control approach in the chemical industry, demanding precise systems that allow timely measures to be taken that help operators avoid dangers and reduce the probabilities of risk, guaranteeing the efficiency and quality in production processes, always managing interruptions early. Following this line, Ref.[
12] established an analogy between the response of the human body's immune system and interruptions in productive processes. Their proposal consists of designing a system that detects, identifies interruptions and evaluates their consequences to act in a timely manner. They also suggest the development of effective tools, less expensive than the implementation of systems based on artificial intelligence and machine learning, in order to improve productivity. Complementing this approach, Ref. [
13] identified that interruptions in a supply process can generate adverse consequences, such as the bullwhip effect. However, they also observed that fluid and effective communication between the participants in the process can reduce these negative effects.
Endsley M. [
14] described situational awareness as a continuous process, composed of three essential levels: perception, comprehension and projection of the situation. These levels are essential so that individuals can adapt to changes in their environment, make effective decisions and achieve their goals. At the level of perception, we find the fundamental basis of situational awareness and refers to the ability to perceive and capture relevant elements and events in the environment. The level of comprehension involves the interpretation and analysis of the information perceived at the previous level and seeks to understand the situation in its entirety, establishing connections between the different elements. Finally, at the projective level it seeks to project the future and anticipate changes, making decisions based on available information and considering possible future scenarios. Ref. [
15] describes how situational awareness models can be adapted for a specific context and how information from multiple sources can be integrated to improve decision-making accuracy.
Endsley M. [
16] stated that situation awareness models enable decision-making and support systems to collect, analyze and present relevant information in real time to support timely and accurate decisions.
The technological tools of industry 4.0, with their perception, comprehension and projection capabilities in real time, are proving to be powerful but challenging tools for operators, who still feel distrustful of the systems, especially people with greater experience in processes [
7].
The situational awareness model has had various areas of application, such as construction [
17], medical services [
18], aviation security [
19], port security [
20], security of the internet of things [
21]., disaster management [
22] and sports [
23].
Ref [
24] used the Fuzzy DEMATEL method to investigate the interactions between key variables affecting situational awareness. The results of the study prioritized the variables that most influence situational awareness, including "Communication and coordination between teams", "Staff experience", "Support equipment and tools", "Staff cognitive ability", "Staff strategies and policies". the organization", "Staff training and education", "Information and communication technology", and "Sources of information", concluding that the organizational variables and some individual variables were the critical factors that affected the level of situational awareness of the workers who were injured in the industrial processes investigated.
The distrust detected by [
7] in production systems that have implemented 4.0 technologies and the variables that affect the levels of situational awareness explained by [
24]support the suggestion of [
25] who suggest that greater collaboration and communication between workers on different shifts, and promoting a culture of learning and development, can be beneficial for knowledge transfer and learning in manufacturing and other rotating shift work environments.
Ensley M. [
26] indicates that, in the future, semi-automatic security systems will prevail as hybrid teams between humans and AI, overcoming their limitations of perception, biases due to limited training, limitations regarding the projection of developing situations and fragilities in the identification of new situations.
Information flows among humans have been modeled by various authors, these models were summarized by Mcquail D. [
27], and the aspects of each model have been interpreted in a communication tool normally used by people within the processes by the year 2023. (WhatsApp
MT) and the following has been obtained:
• Lasswell Model: This model focuses on five questions that every message must answer: who, what, to whom, through what channel and with what effect. With the WhatsAppMT application, users can send messages (what) to other contacts (who) through an Internet network (channel) with the aim of achieving some desired effect.
• Shannon and Weaver model: The model focuses on how information is transmitted from one point to another. In WhatsAppMT, the information (message) is encoded by the sender, sent through an Internet network and decoded by the receiver. The model also suggests that there may be noise and distortions in communication, which in WhatsAppMT can manifest in connection problems or in the erroneous interpretation of the message.
• Berlo's interpersonal communication model: This model focuses on the communication process in face-to-face interaction. In WhatsAppMT, users can communicate via text, voice or video messages, allowing the simulation of an interpersonal interaction. You can also share images, links, files and other content that allows for greater interpersonal connection.
•
McQuail's model of mass communication: McQuail's model focuses on communication that is carried out through mass media, such as television or newspapers [
28]. In the case of WhatsApp
MT, groups can be created in which users can send messages to many contacts at the same time, which is similar to mass communication
• Grunig's model of symmetric and asymmetric communication: This model suggests that communication can be symmetric or asymmetric depending on the relationship between the sender and the receiver. In WhatsAppMT, communication can be symmetrical, where both users have the same influence and power in the relationship, or asymmetrical, where one of the users has more power than the other (for example, in a teamwork relationship). .
• Schultz's integrated marketing communication model: This model focuses on the integration of the different forms of communication that a company uses to communicate with its customers. In the case of WhatsAppMT, companies can use the application to communicate with their customers, through personalized messages or Chat Bot that act as intermediaries between customers and the company.
• Hall's model of intercultural communication: Hall's model focuses on how cultural differences can affect communication. On WhatsAppMT, users can interact with people from different areas of a company, cultures and countries, which may require greater care in communication to avoid misunderstandings or misinterpretations.
• Buber's dialogic communication model: This model focuses on the importance of dialogue in communication, emphasizing the interaction between people. In WhatsAppMT, users can interact directly and bidirectionally, allowing for more effective communication focused on dialogue.
• Habermas's communication model: This model focuses on communication as a means to achieve mutual comprehension and problem resolution in a democratic society. In the context of WhatsAppMT, this platform can be used for decision-making in work groups and in the organization of events and activities.
• Noelle-Neumann spiral of silence model: This model focuses on how minority opinions can be silenced by majority opinions in society. In the case of WhatsAppMT, chat groups can be a place where majority opinions are created and minority opinions are limited, which can lead to a spiral of silence.
• Deetz's participatory communication model: focuses on the decision-making process within an organization, promoting horizontal and participatory communication among all members. In the case of WhatsAppMT, this platform can be a useful tool to encourage participatory communication between members of a team or an organization, allowing two-way communication in real time.
The information flows in the processes are varied and, together, constitute what we know as Big Data. Although industry 4.0 has generated a considerable volume of information, allowing artificial intelligence to access and detect useful patterns to comprehension and predict failures or deviations in processes, communication between human beings cannot always be controlled, especially when it is not possible. there is an explicit digitization of all information flows. This is even more complex in situations of implicit communication or in learning flows between apprentice and master, all subject to legal regulations that protect the privacy of workers.
The explicit part of human communication has occurred through various technologies, the experience of Konak A. and Kulturel-Konak S. [
29] indicated that in teamwork, the main tools are: email, instant messaging, video conferencing, online document sharing and online project management systems.
Although we can also say that the following applications with their respective creation date are widely used for teamwork: JiraMT (2002), SkypeMT (2003), BasecampMT (2004), ConfluenceMT (2004), AsanaMT (2008), WhatsAppMT (2009), TrelloMT (2011), MiroMT (2011), ZoomMT (2011), Monday.comMT (2012), AirtableMT (2012), FigmaMT (2012), SlackMT (2013), NotionMT (2016), ClickUpMT (2017) , Microsoft TeamsMT (2017), Google MeetMT (2017), just to name the most relevant.
Ref. [
30]carried out a study to evaluate the choice and effectiveness of the media in the resource request process, detecting that during the choice process there are social costs (such as the fear of being scolded or not attended to) that affect the choice, concluding that the efficiency of face-to-face communication is superior to that carried out using email as a means of communication. Related to this, some claim that face-to-face meetings are not effective and even harmful to productivity, taking awya factory supervisors valuable time.subtracting time. [
31,
32], others argue that the way a meeting is organized is important, especially videoconferences, where it is recommended that they be brief and with few people [
33].
During the Covid-19 pandemic, [
34] successfully employed the WhatsApp
MT tool as a communication channel in a hospital environment. On the other hand, Ref. [
35] showed the effectiveness of WhatsApp
MT as a communication tool between teachers and students. Likewise, Ref. [
36] suggests that the use of WhatsApp
MT could be a valuable resource to drive innovation in the work environment, as long as it is managed appropriately in consideration of the stressors and workload of employees.
Ref. [
37] aimed to evaluate driver distraction resulting from the use of smartphones, in particular the WhatsApp
MT application, in different age groups. The participants were classified into three groups: young people (18-25 years old), adults (26-45 years old) and older people (over 45 years old). It was found that younger drivers presented higher levels of distraction compared to adults and older drivers. Additionally, distraction was observed to increase significantly when drivers used the app while driving, compared to when they were not using it. The results of this study suggest the need to implement safety measures to prevent distraction caused by the use of smartphones while driving, especially in young drivers.
Information flows are not always formal. Ref. [
38] examined the role of shadow IT in knowledge management in manufacturing processes. The authors used a multiple case study approach to investigate how employees in different organizations use unauthorized IT tools (such as WhatsApp
MT) to manage and share information. The findings revealed that Shadow IT tools can be an effective way to improve knowledge management, but also present security risks and integration challenges with authorized IT tools. The authors conclude that organizations must adopt a balanced approach that allows the use of Shadow IT in a controlled and secure manner to improve knowledge management.
How we control industrial processes is a question that has occupied us since the beginning of the industry, the PID (Proportional, Integral and Derivative) control model, conceived by the contributions of James Clerk Maxwell, Nicolas Minorsky and Edson Briggs in the 19th century. and the beginning of the 20th century, allows the regulation and stabilization of industrial systems effectively, being fundamental in the automation of industrial processes.
A PID control system can control one or multiple variables, but there may be the case in which the variables are combined in a new way, or a new qualitative variable or external event appears that generates a new scenario. Ref. [
39] defined a situational pattern as an abstraction that represents a recurring scenario that can be found in a variety of situations or contexts in a process. That is, a situational pattern is a way to capture experience in a process and use it to solve recurring problems more effectively. It is important to highlight that we will find new patterns in a process that are invisible to artificial or human intelligence and that only after observing their consequences will we have any possibility of identifying them.
We must not forget operations management as a catalyst for improving productivity, Ref. [
40]studied the importance of the synergy between LEAN methodologies and a coordination model to improve efficiency in processes, where they declare that simply Automating a process without previously improving it does not guarantee its efficiency, which is why it is necessary to apply continuous improvement methodologies such as LEAN to identify improvement opportunities and then implement them effectively. They also discuss the importance of an organizational culture focused on continuous improvement. The communication within organizations must be designed openly, broadly, symmetrically, and multidirectional [
41].
3. Contribution
In our review of the literature, we have not found evidence of the development of a model that helps the coordination and immediate reaction of human resources to situations or situational patterns that interrupt production or reduce the productivity of a productive process. There are numerous publications and methodologies focused on prevention, prediction and subsequent analysis of failures, interruptions or results of a production process, but there are very few that focus reactively and in real time.
To address this gap we have focused on generating a model that faces a situation or situational pattern (scenario) in real time, complementing the existing literature, always with the objective of improving operations management.
We innovate by uniting the situational awareness models of Endsley M. [
14], the PID (proportional integrative derivative) model and real-time communication technology, seeking to provide a better comprehension of operational activities and a more effective response capacity to address the process variability.
4. Description of the proposed model
Our model requires the selection of key areas of the manufacturing process, which will be responsible for perceiving and transmitting situations or events in real time. The selection of these key areas depends on each case in which it is implemented and are mainly defined considering the sources that generate interruptions in the process and work teams already trained in the operation.
The communication tool or technology that will be used as a medium must be selected based on management requirements, allowing at least a flow of information, recording of operation situations and fluid communication between participants.
The proposed group situational awareness model for industrial process management (see
Table 1) is a combination of Endsley M.'s situational awareness approach [
14] and the PID (Proportional, Integral and Derivative) control model. The situational awareness model provides a framework for comprehension how people perceive, comprehension and project the situation in an operational environment, while the PID control model is a control algorithm used to continuously adjust a process variable based on deviations measures.
This new model of group situational awareness focuses on effective collaboration and communication between team members with the goal of managing manufacturing operations efficiently. By combining situational awareness with PID control, the aim is to improve coordination and decision making in the environment of an industrial process. This joint approach offers benefits such as greater awareness of the current and future situation, more informed decision making, precise control of process variables, and improved efficiency and productivity in manufacturing operations. This model could find applications in various industries, such as logistics, manufacturing and health services.
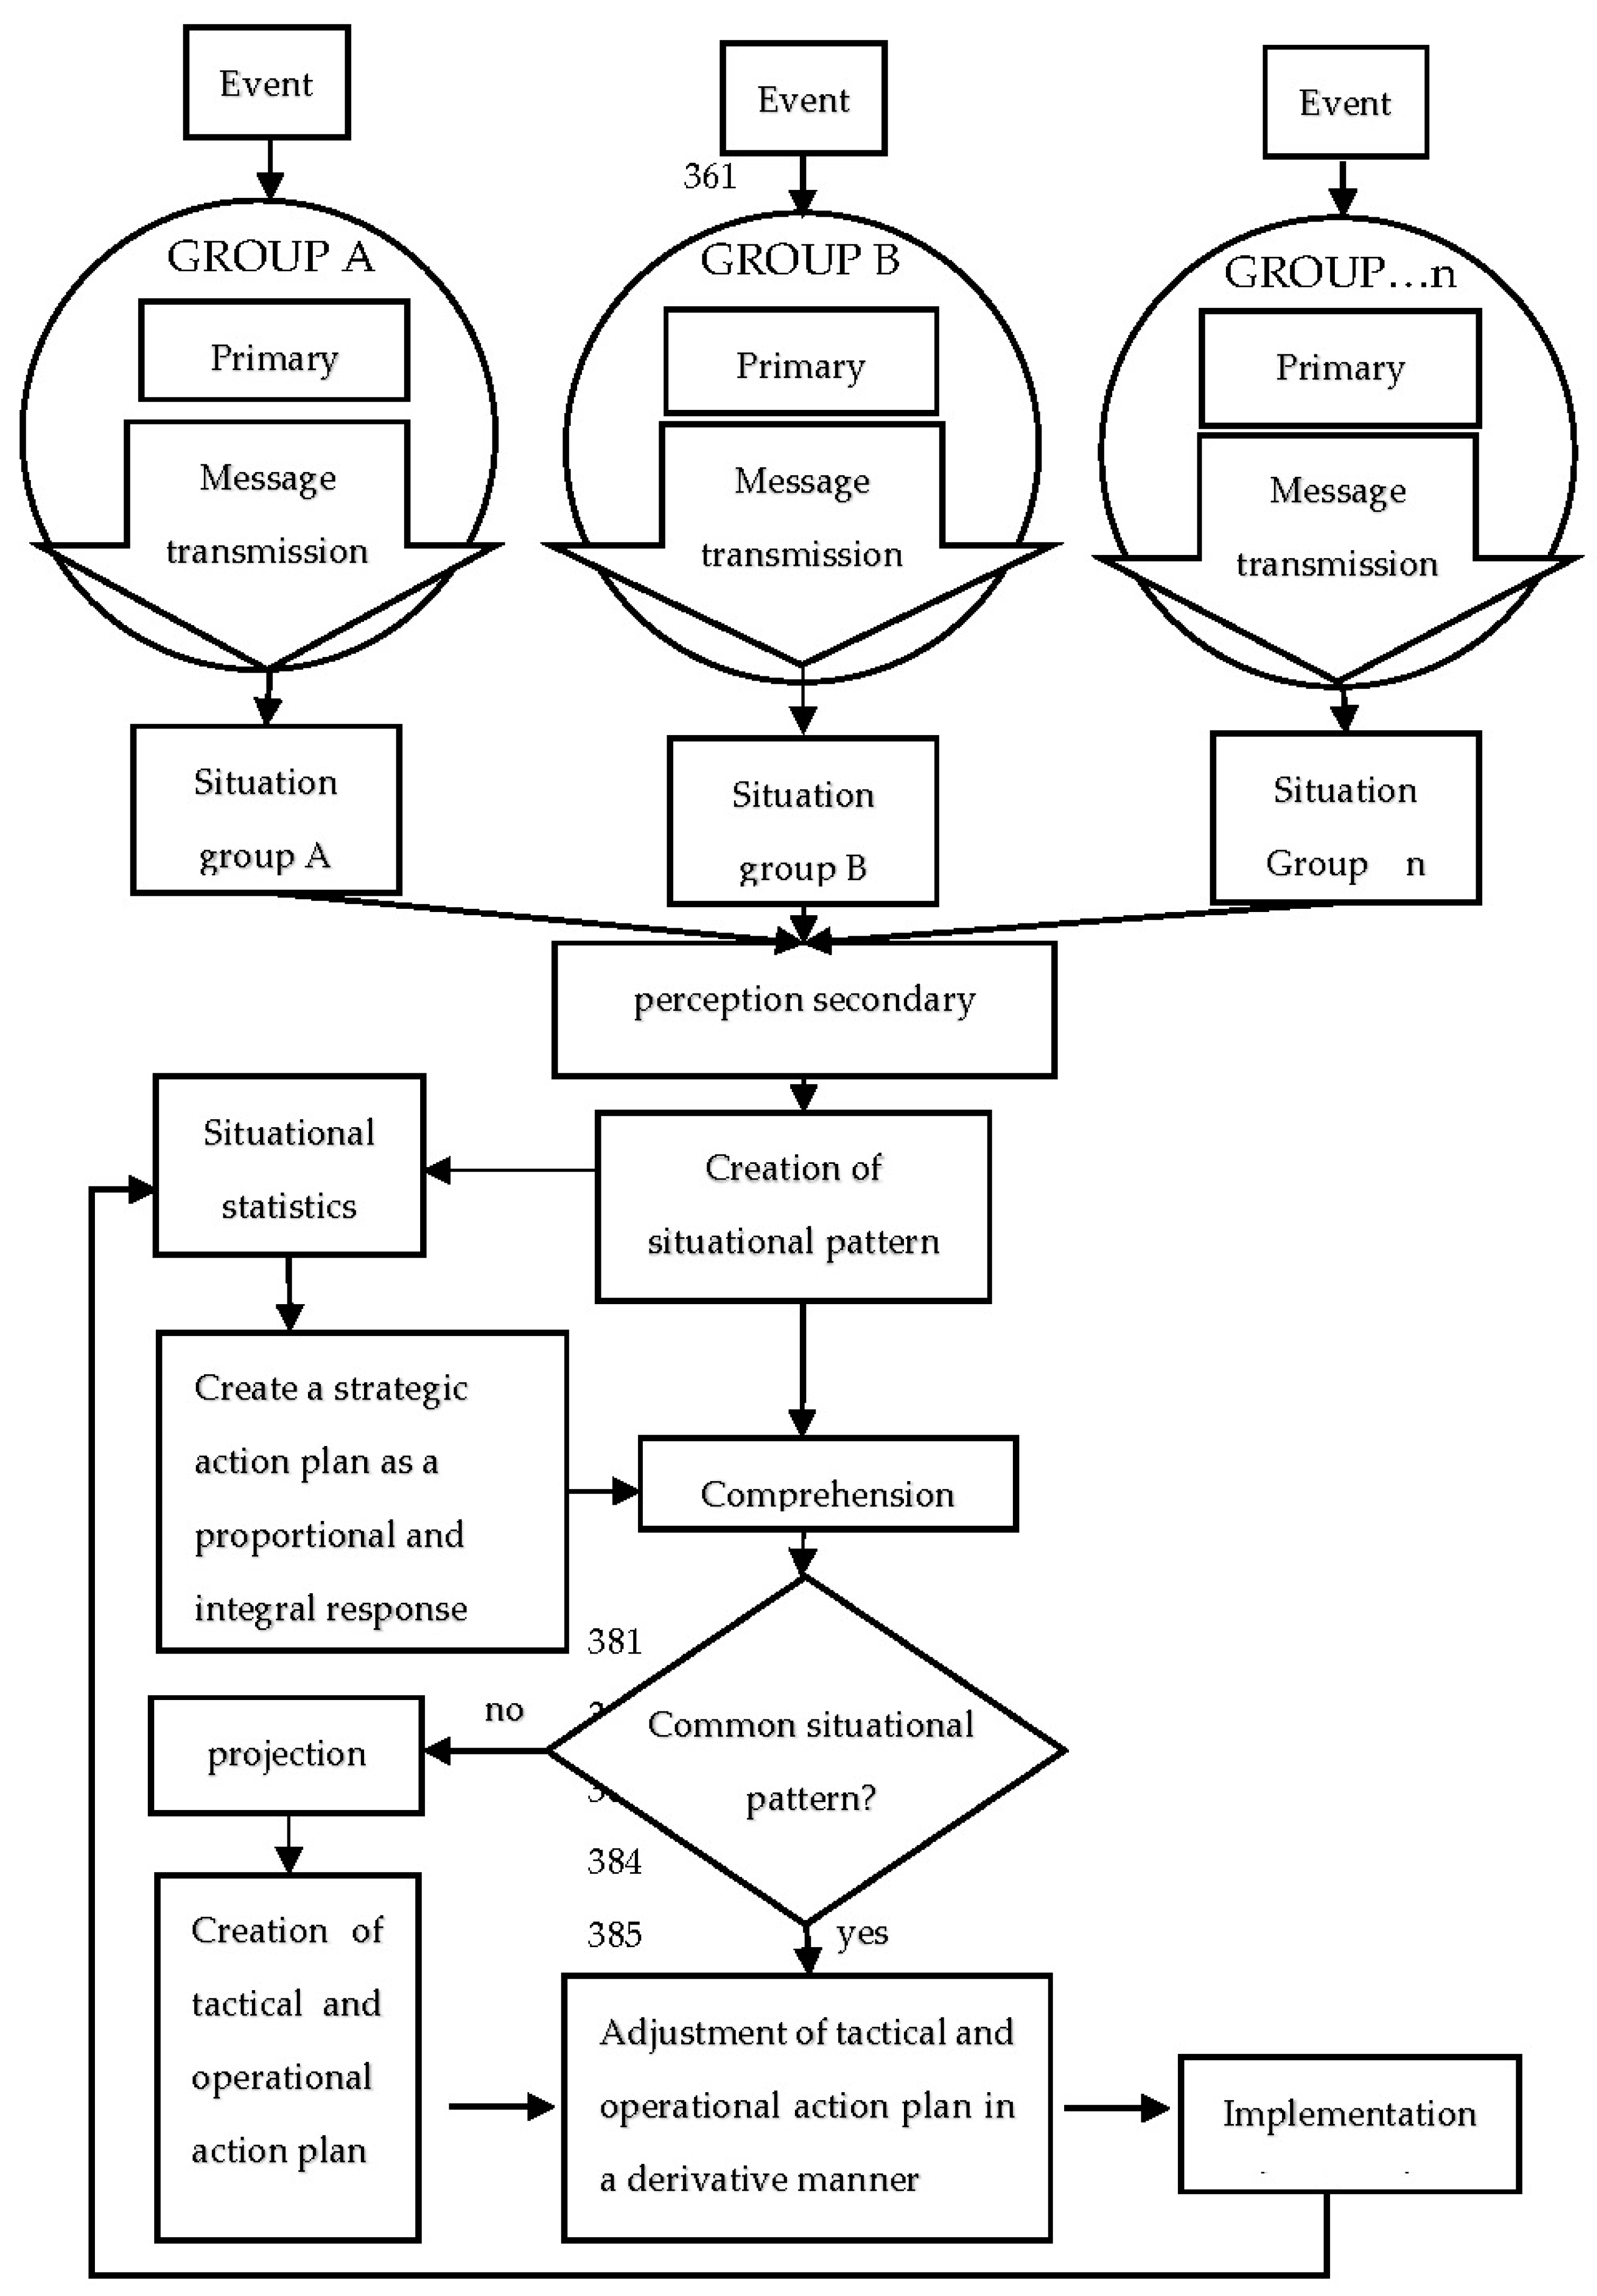
Figure 1 shows a diagram that represents the operation of the model. Initially, events, which are occurrences, incidents, data, or trends of control variables, act as signals that are perceived by process participants. This stage is called primary perception. One or more participants who are part of the coordination groups then encode these events as messages and transmit them in real time using communication technology. These messages are expected to be structured in a predefined way.
At this point, the coordination group is in a specific situation, known to all participants in that particular group. However, there are participants who are part of more than one group, whom we will call transversal participants. These transversal participants have a higher level of perception, which we will call secondary perception, since it is based on the perception of multiple groups. Cross-cutting participants are responsible for perceiving situations between different groups and creating situational patterns or scenarios.
These patterns or scenarios may be difficult to perceive by participants in primary operational areas.
Primary and secondary perception and the detection of situational patterns are fundamental for the comprehension stage, which involves both individual and group cognitive work. This cognitive process depends on the skills, experience and talents of the participants involved. During this stage, comprehension can be expressed explicitly through a message shared by one of the participants in the communication group. There is also the possibility of implicit comprehending, in which group participants are assumed to have complete knowledge of the situation or scenario, even if it is not explicitly discussed.
Explicit comprehension triggers an incremental process where participants share their opinions regarding the situation. This interaction is affected by factors such as the degree of influence of the participants, experience and knowledge.
Although comprehension is not a projection of future situations, it delivers as a product a diagnosis that determines the actions to follow.
Before defining an action plan, it is crucial to carry out a careful evaluation to determine if the situation in question is known and if there is a previously established action plan, or if it is a special circumstance that has not yet been addressed by the team and requires additional analysis.
In a second diagram (
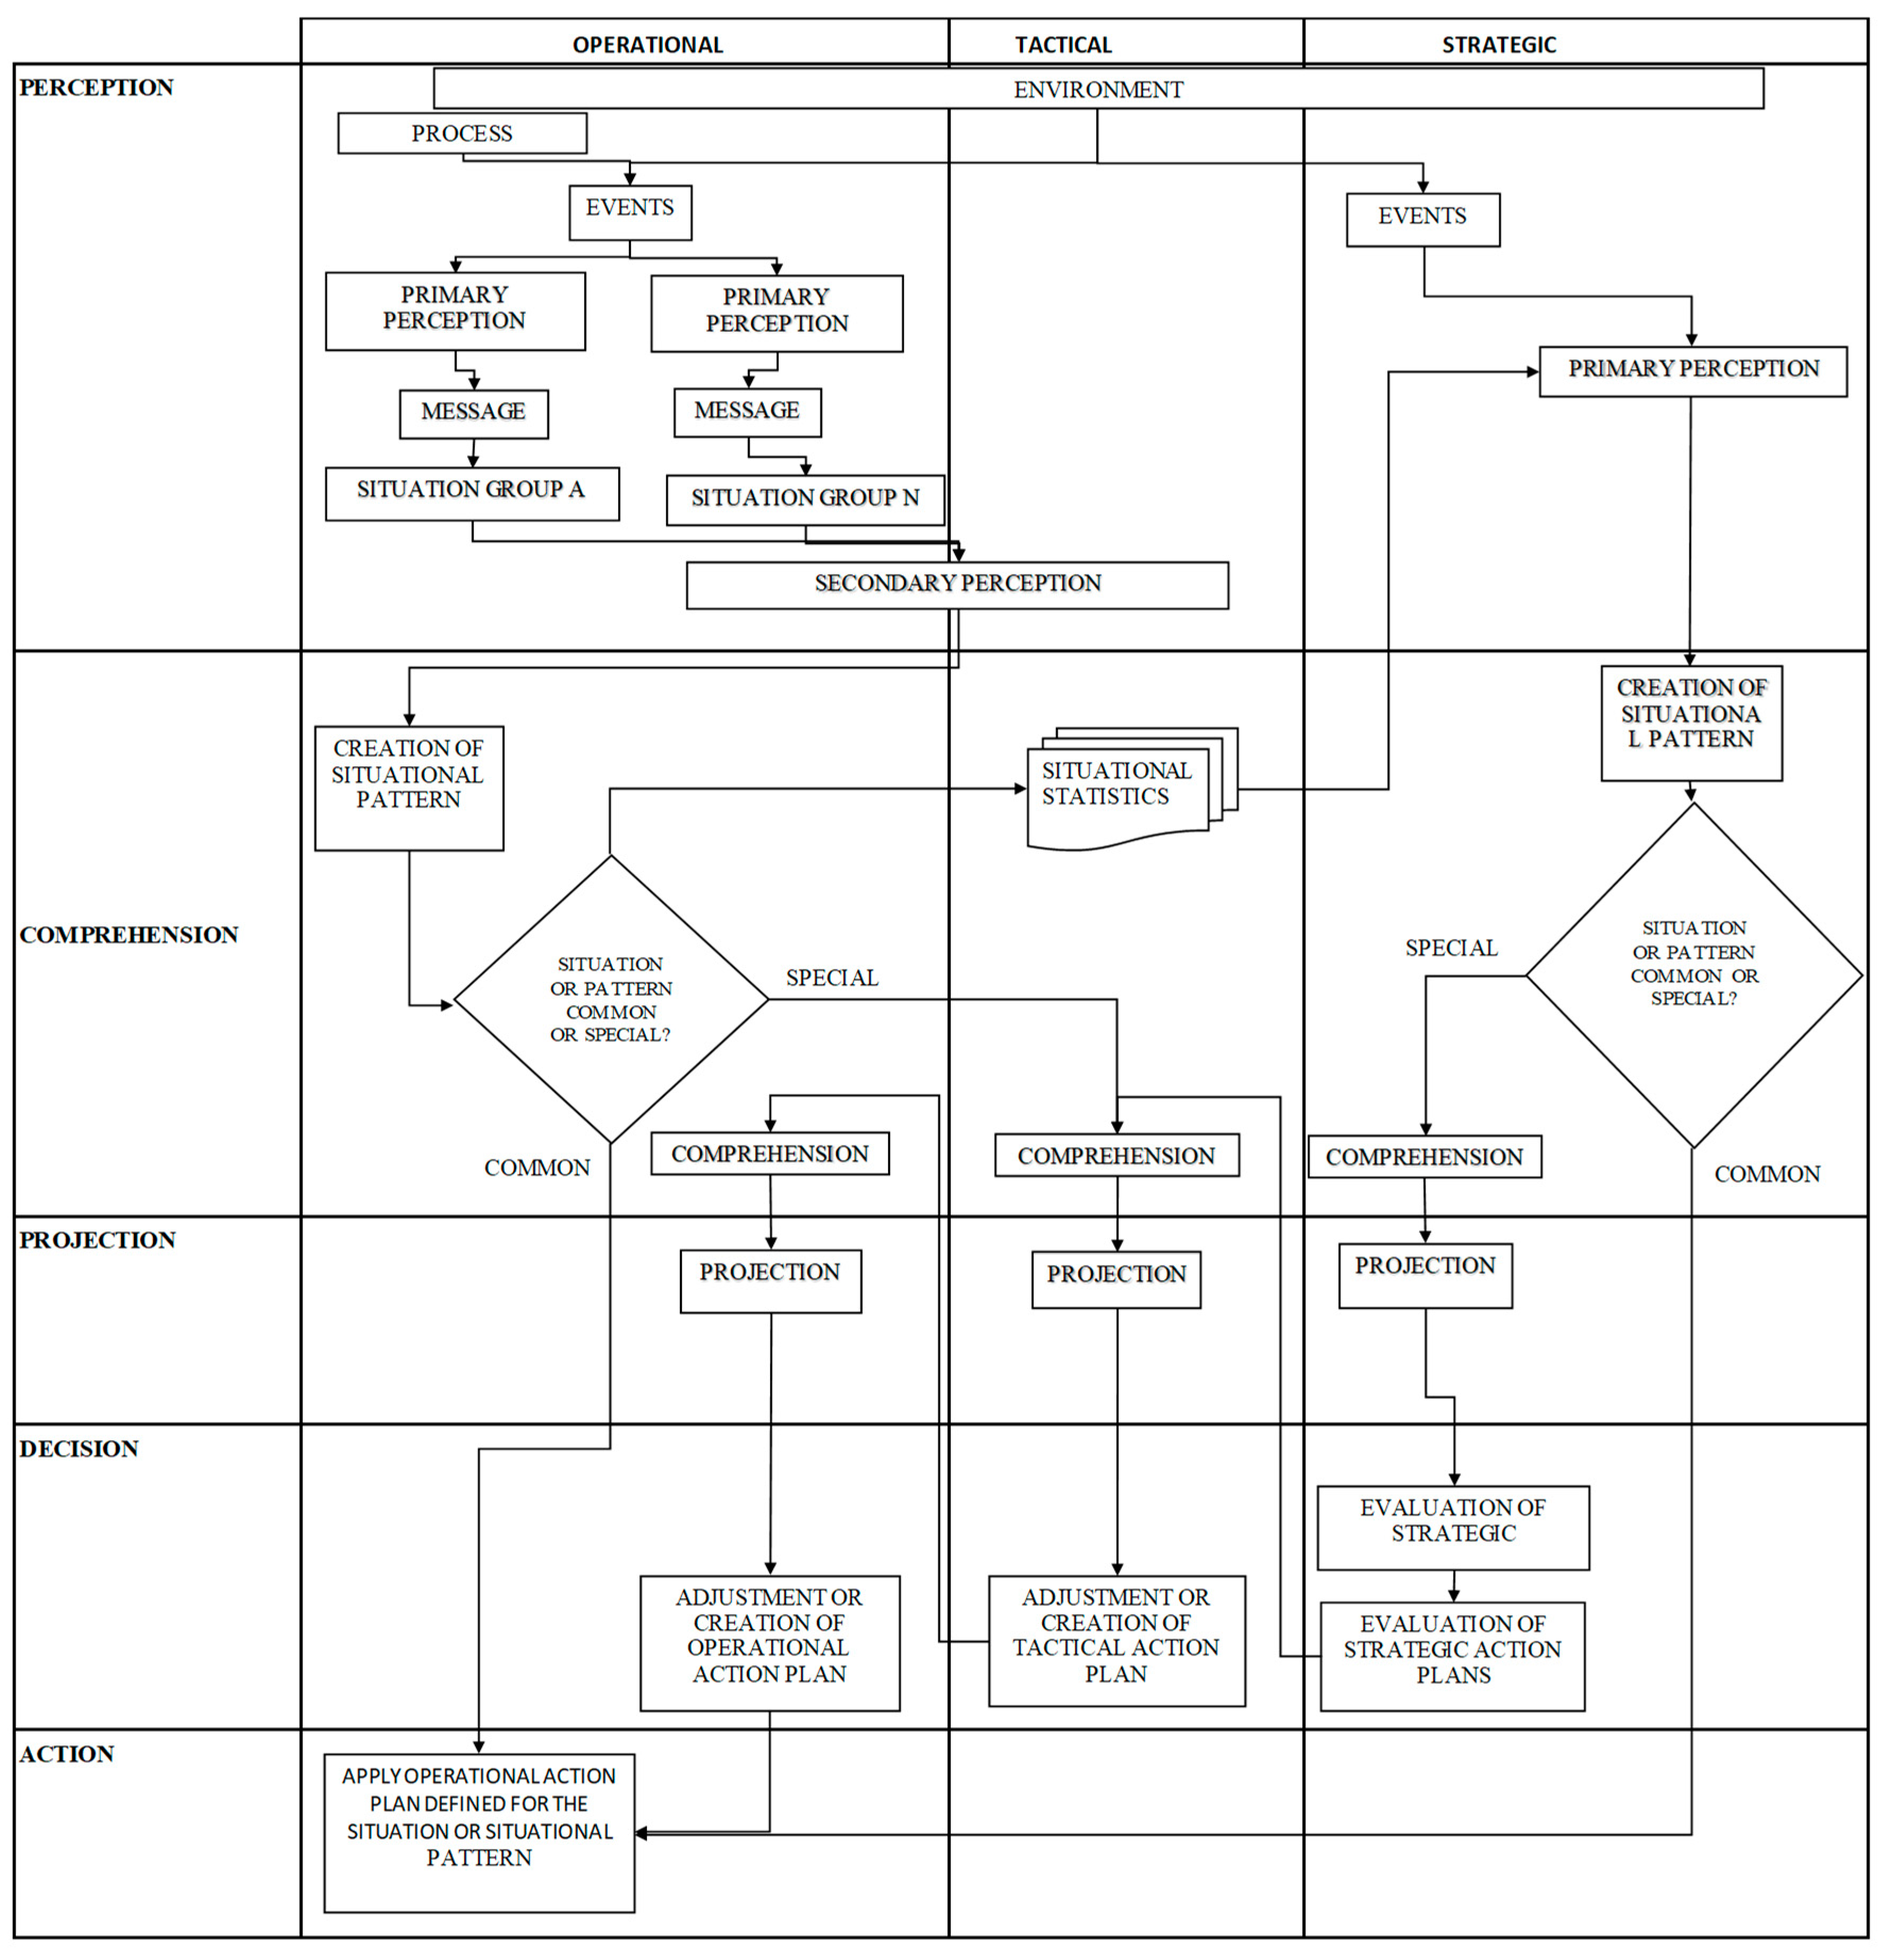
Figure 2) the model adjusted to the management of industrial processes is presented, allowing the functions of the operational, tactical and strategic levels to be visualized in the activities of perception, comprehension, projection, decision and action of the group situational awareness model. Each stage is described below:
• Perception at the operational level: begins with the real-time capture of the state of the process and environment variables. In this stage, similar to an analog-digital converter (ADC) that converts an analog signal into a digital interpretation, the participants of the coordination system perceive the state of the variables or their rate of change and transform it in a message. This allows information to be shared in real time, improving both individual and group awareness. Furthermore, cross-sectional participants carry out secondary perception by perceiving the status of different groups. This secondary perception becomes the output of this stage.
• Perception at the tactical level: the participants of the communication groups that belong to the tactical functional departments are generally transversal participants and their main contribution is to influence the comprehension of the state of the system with their opinions.
• Perception at a strategic level: the directors in charge of generating strategy are responsible for perceiving the external and internal events of the company, for this they must build constant monitoring and follow-up systems, which aim to maximize internal and external situational perception.
• Comprehension at an operational level: begins with the creation or clear identification of a situation or situational pattern. This information feeds a situational statistic and then advances to a stage in which the established guidelines are consulted to proceed in common or special situations or patterns. Quick identification of a situation or pattern is crucial to ensure prompt implementation of the action plan. However, special situations require a thorough review by the tactical area, since tactical action plans must adjust to the manufacturing strategy.
• Comprehension at the tactical level: implies a high degree of situational awareness, since at this level information from both the operational and strategic levels is integrated. This allows for a complete comprehension of the situation and, therefore, the responsibility for managing and creating situational statistics falls at this level.
• Comprehension at a strategic level: It involves analysing the competitive position, identifying opportunities and challenges, and establishing strategic direction. The perception of relevant information, the visualization of situational patterns and multi-criteria evaluation are key elements in this level of comprehension. Furthermore, the importance of carefully reviewing special situations to evaluate their impact on the different strategic perspectives is highlighted.
• Projection at a strategic level: it is a key stage for the future of the company, which is based on the perception and comprehension of the environment and interior of the company, subject to the objectives and strategic plans, the projection defines the company`s path to follow.
• Projection at the tactical level: after comprehension the adjustments made by management to the objectives and strategic plans, the tactical area projects the use of productive factors subject to capacity restrictions, the planning of new situations is often only an estimated value and is awaiting the results of the implementation.
• Projection at the operational level: once the operational area has understood the action plans adjusted by the tactical area, it proceeds to make a projection of the implementation of said plans. This projection involves simulating how current resources will execute new methods, product modifications, the use of new tools or changes in working conditions. In common situations, this projection is known and the results are estimated with high precision, which allows an immediate response; in special or new situations, you must wait for execution to see results.
• Decisions at a strategic level: corresponds to decisions to adjust the objectives and strategic action plans contained in the company's strategic map. On some occasions, change programs are generated that require modifications in capacity, productivity, quality, technology and cultural.
• Decision at a tactical level: corresponds to the decisions to adjust the strategic requirement, in the face of a special or new situation, these adjustments are related to the requirements of productivity, quality, design, technology.
• Decision at the operational level: corresponds to the decisions to adjust the tactical requirement, in face of a special or new situation, these adjustments are mainly related to the standard method and times.
• Action at the operational level: it is the application of methods, talent and technology in the operation. This implementation is aligned with the tactical and strategic levels, and in tune with the organizational culture.
5. Model implementation Methodology
For the implementation of the proposed model, a sequence consisting of eight stages was first developed and then with an action researcher approach developed by Coghlan P., Coghlan, D. in 2002 [
42], each of the stages was implemented in a real production process.
5.1. Stages for the implementation of the group situational awareness model for the management of industrial processes:
Table 2.
stages of implementation of the group situational awareness model in the industrial process management.
Table 2.
stages of implementation of the group situational awareness model in the industrial process management.
| Implementation stages: |
Aim: |
|
Identify the current state of manufacturing and communication processes. |
- 2.
Establish with management: scope, deadlines, objectives, goals and restrictions of the productivity improvement project. |
Achieve a commitment between the company management and the productivity improvement project, using improved communication processes. |
- 3.
Select the technology to use in communication processes. |
Incorporate a tool that meets management requirements and efficient group communication in real time. |
- 4.
Define communication groups. |
Identify the main sources of interruptions in the operation and the company's organizational chart, based on this define the communication groups. |
- 5.
Define the people who will participate in each group. |
Establish the suitable people who will participate in the project. |
- 6.
Conduct training for the correct use of the communication and resource delivery tool. |
Train, engage and motivate participants in the use of the selected communication tool, establish communication rules, transmit productivity improvement objectives and deliver resources. |
- 7.
Establish project evaluation cycles with communication groups and carry out reviews. |
- Define the frequency of review of the communication system.
- Review of What?, How?, Who? And when? issue messages through the communication channel.
- Analysis of situations that seek to increase the perception, comprehension and projection capabilities of the participants.
- Define and review corrective, preventive actions and improvement options in communication activities. |
- 8.
Establish the evaluation cycles of the improvement project with management. |
-Define the frequency of review of the communication system.
-Presentation of results regarding the goal.
-Analysis of special situational patterns.
- Evaluate strategic actions. |
5.1.1. Description of the implementation stages
Identify elements (products, equipment, people, facilities, services, software, etc.), variables (qualitative and quantitative), situations and scenarios, to be analyzed with management according to the guidelines established by Platts K. and Gregory M. in 1990 [
43].
A series of meetings is established with management based on the information obtained in the audit and historical statistics, defining the scope, objectives, goals, deadlines, resources, technology and restrictions of the productivity improvement project. which will have as its main tool an improvement in communication processes using technology.
The technology must be selected considering management requirements in terms of budget, information security, access and features for efficient communication. This definition must be agreed upon with management.
Based on the statistical information, the organization chart, the information generated by the audit and the researcher's criteria in action, the groups must be defined. In our case, the model pre-establishes the quality, maintenance and supervision groups, but They can establish groups such as human resources, logistics, purchasing, sales, etc. depending on the specific case.
Before deciding who will participate in the groups, it is important to carry out an evaluation of the human resource that helps us determine if it has any incompatibility with the project. After this, a meeting must be held with the operations management to define who will participate. in the groups.
The objectives, goals and deadlines for the implementation of the productivity improvement project must be transmitted to the staff, improving coordination with a communication tool in the processes. Communication norms must be established and taught to participants, establishing schedules, type of information to be transmitted, language to be used, confidentiality rules, etc.
The action researcher, together with the head of operations, must coordinate periodic instances of physical or remote meetings with the participants of each group, where the functioning of the coordination system and its relationship with the objectives of the productivity improvement action plan must be reviewed.. In these meetings, the statistics of the previous cycle or period will be presented, the progress made regarding the goals, the individual situations of each group will be analyzed and they will be shared with the participants of other groups to increase their level of group situational awareness.
The action researcher together with the operations manager must coordinate physical or remote meeting instances with management, where situational statistics, special situational patterns, performance regarding goals will be reviewed, and strategic actions will be evaluated.
5.2. Application of the model in a real case
The application of the model was carried out during the implementation stage of the prioritized strategic action plans according to the work carried out by Quezada L. in 2022 [
44], in a company in Chile.
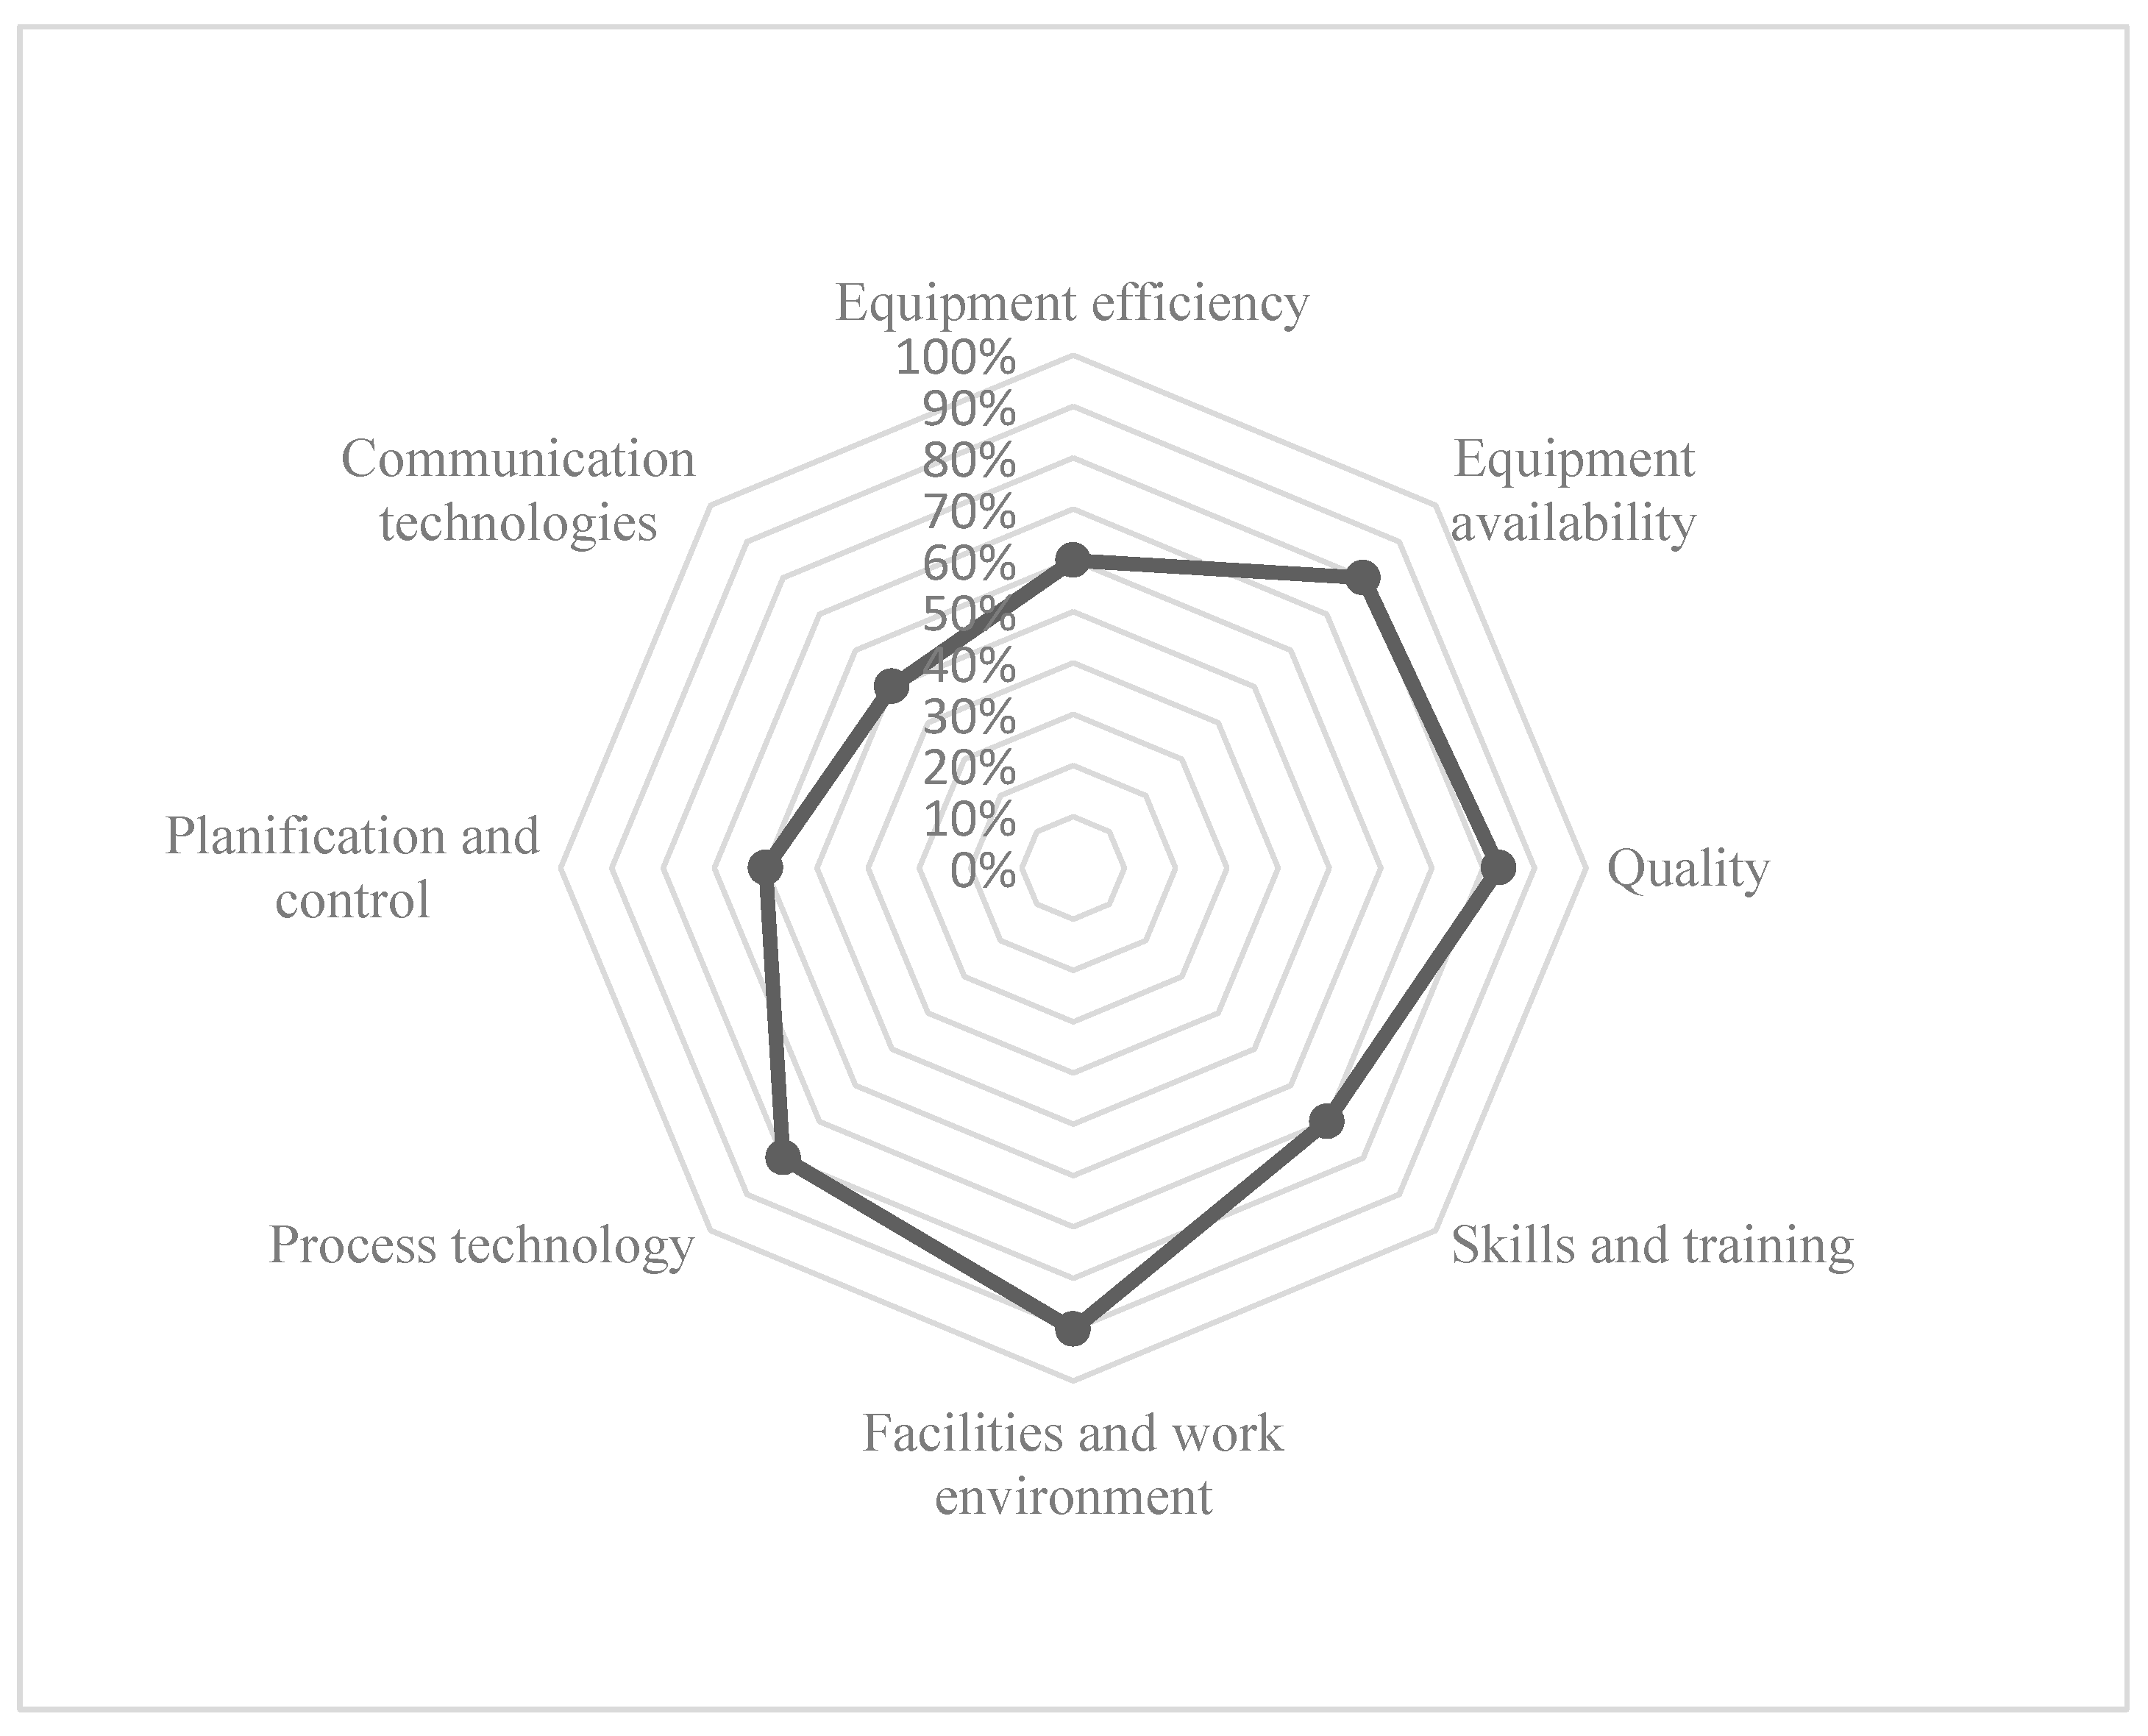
Stage 1. An audit of the manufacturing process is carried out and it is observed that the largest gaps are in the following factors: equipment performance, communication technology, planning and control, and skills and training.
Figure 3.
Gaps in the area of operations.
Figure 3.
Gaps in the area of operations.
Stage 2. After observing the decision making of the operational and tactical levels, the action researcher proceeded to participate in a series of meetings with management, from where the level of awareness of the management situation could be perceived and comprehension and project the company's strategic objectives and plans.
The objectives and goals defined by management for the productivity improvement project were:
The restrictions were: not to make large investments and minimize layoffs.
The scope of the improvement plan was defined as: the manufacturing operations area, including the quality, maintenance, planning, and operations supervision departments.
In addition to the above and before being able to intervene in operations at an operational level, management requested a series of implementations that aimed to collaborate with tactical management:
1. Redesign of production programs.
2. Identification of factors that affected the productivity of the process.
3. Establish planning rules.
4. Implement a planning module that is integrated into the company's ERP.
5. Implement a production and inventory control module.
6. Implement the quality management and production control department.
Once the actions that strengthen the tactical level of operations have been implemented, the Action Researcher assumes the role of Production Manager and begins with the interventions. This is done with a permanent presence in field operations, observing problems and situations in real time. , comprehension how operators, supervisors, area managers and planners decided in situations and scenarios that emerged during the operation. The period defined by management to achieve the goals was 9 months.
Stage 3. In the technology selection stage we found various applications available, but without many inconveniences it was agreed with management to use WhatsAppMT as the communication tool for the productivity improvement project, this mainly due to its popularity, low barriers to entry, stability of operation and the multiple possibilities of issuing a message.
Stage 4. Coordination groups were established based on:
• The functional areas with the greatest impact on meeting the goals of the improvement project.
• Roles and responsibilities
As a result and after a review with operations management, the following communication groups were defined:
1. Quality
2. Maintenance
3. Supervision
Stage 5. The decision of those who participated in each group was based on the following criteria:
1. The number of participants in each group should not be too high to facilitate agile decision-making, but not so small to avoid biased decisions.
2. Participants in each group must have technical knowledge, connection to the process in question, availability and commitment.
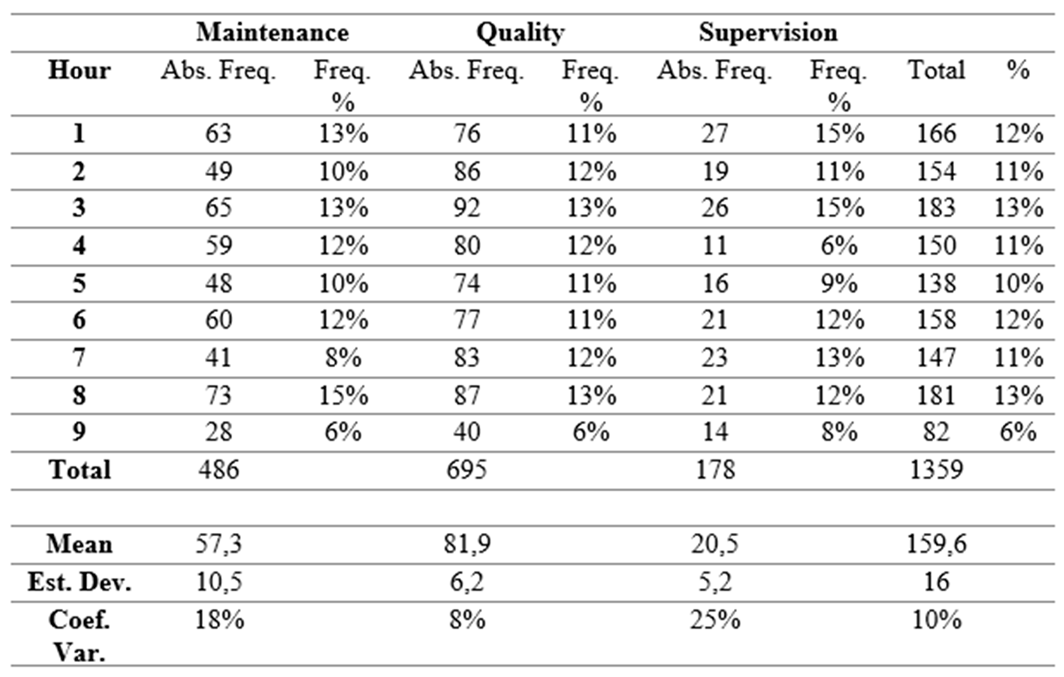
The groups were made up of 19 people in maintenance, 15 in quality and 12 in supervision. It is important to highlight that the number of people aware and connected to the communication system depends on the company's policies, in this case only if it is within the people`s work Schedule (see
Table 3).
Stage 6. Three initial meetings were held which had the following objectives:
1° Transmit to the participants the objectives, goals and deadlines of the productivity improvement project, bridging the most significant gaps and using communication as a fundamental tool.
2° The head of operations, the person in charge of occupational risk prevention and the action researcher established the basic aspects to regulate:
• Hours of use
• Safe places for review and issuance of information
• Way (text message, audio, video or file) to issue a message depending on the situation
• Content and length of messages
• Confidentiality
• Recommended formats for emergency communications, coordination, suggestions and changes.
3° In this third meeting, the follow-up and monitoring indicators were defined, the resources (cell phones) were delivered and the communication system using mobile technology was started.
Stage 7. Meetings with project participants were established on a monthly basis, the work plan was based on compliance with the PDCA cycle (plan, do, check, act), which was repeated during the project. The activities of each stage of the cycle were:
Plan: the production manager (action researcher) assumed responsibility for this stage, establishing objectives, goals, metrics, those responsible and the execution schedule of the action plans for each cycle.
Do: is a stage of responsibility distributed among the participants, which seeks the rapid implementation of the defined action plans when specific situations arise.
Verify: the production control area must generate situational statistics and analyze the existence of situational patterns, generating a relationship with the metrics and objectives of the improvement project, evaluating the strengths and weaknesses in communication via WhatsAppMT.
Act: it is a stage of responsibility distributed among the participants, the aim is to make adjustments or modifications to the communication standards and implement the necessary changes or adjustments in the process.
This cycle is repeated monthly, allowing continuous monitoring of the improvement process, adjusting the plan based on the results obtained.
Stage 8. The action researcher and the operations manager scheduled monthly meetings with management, where situational statistics, special situational patterns, and performance regarding goals, objectives, and strategic action plans were reviewed in each instance, considering the company`s external and internal environment.
6. Results
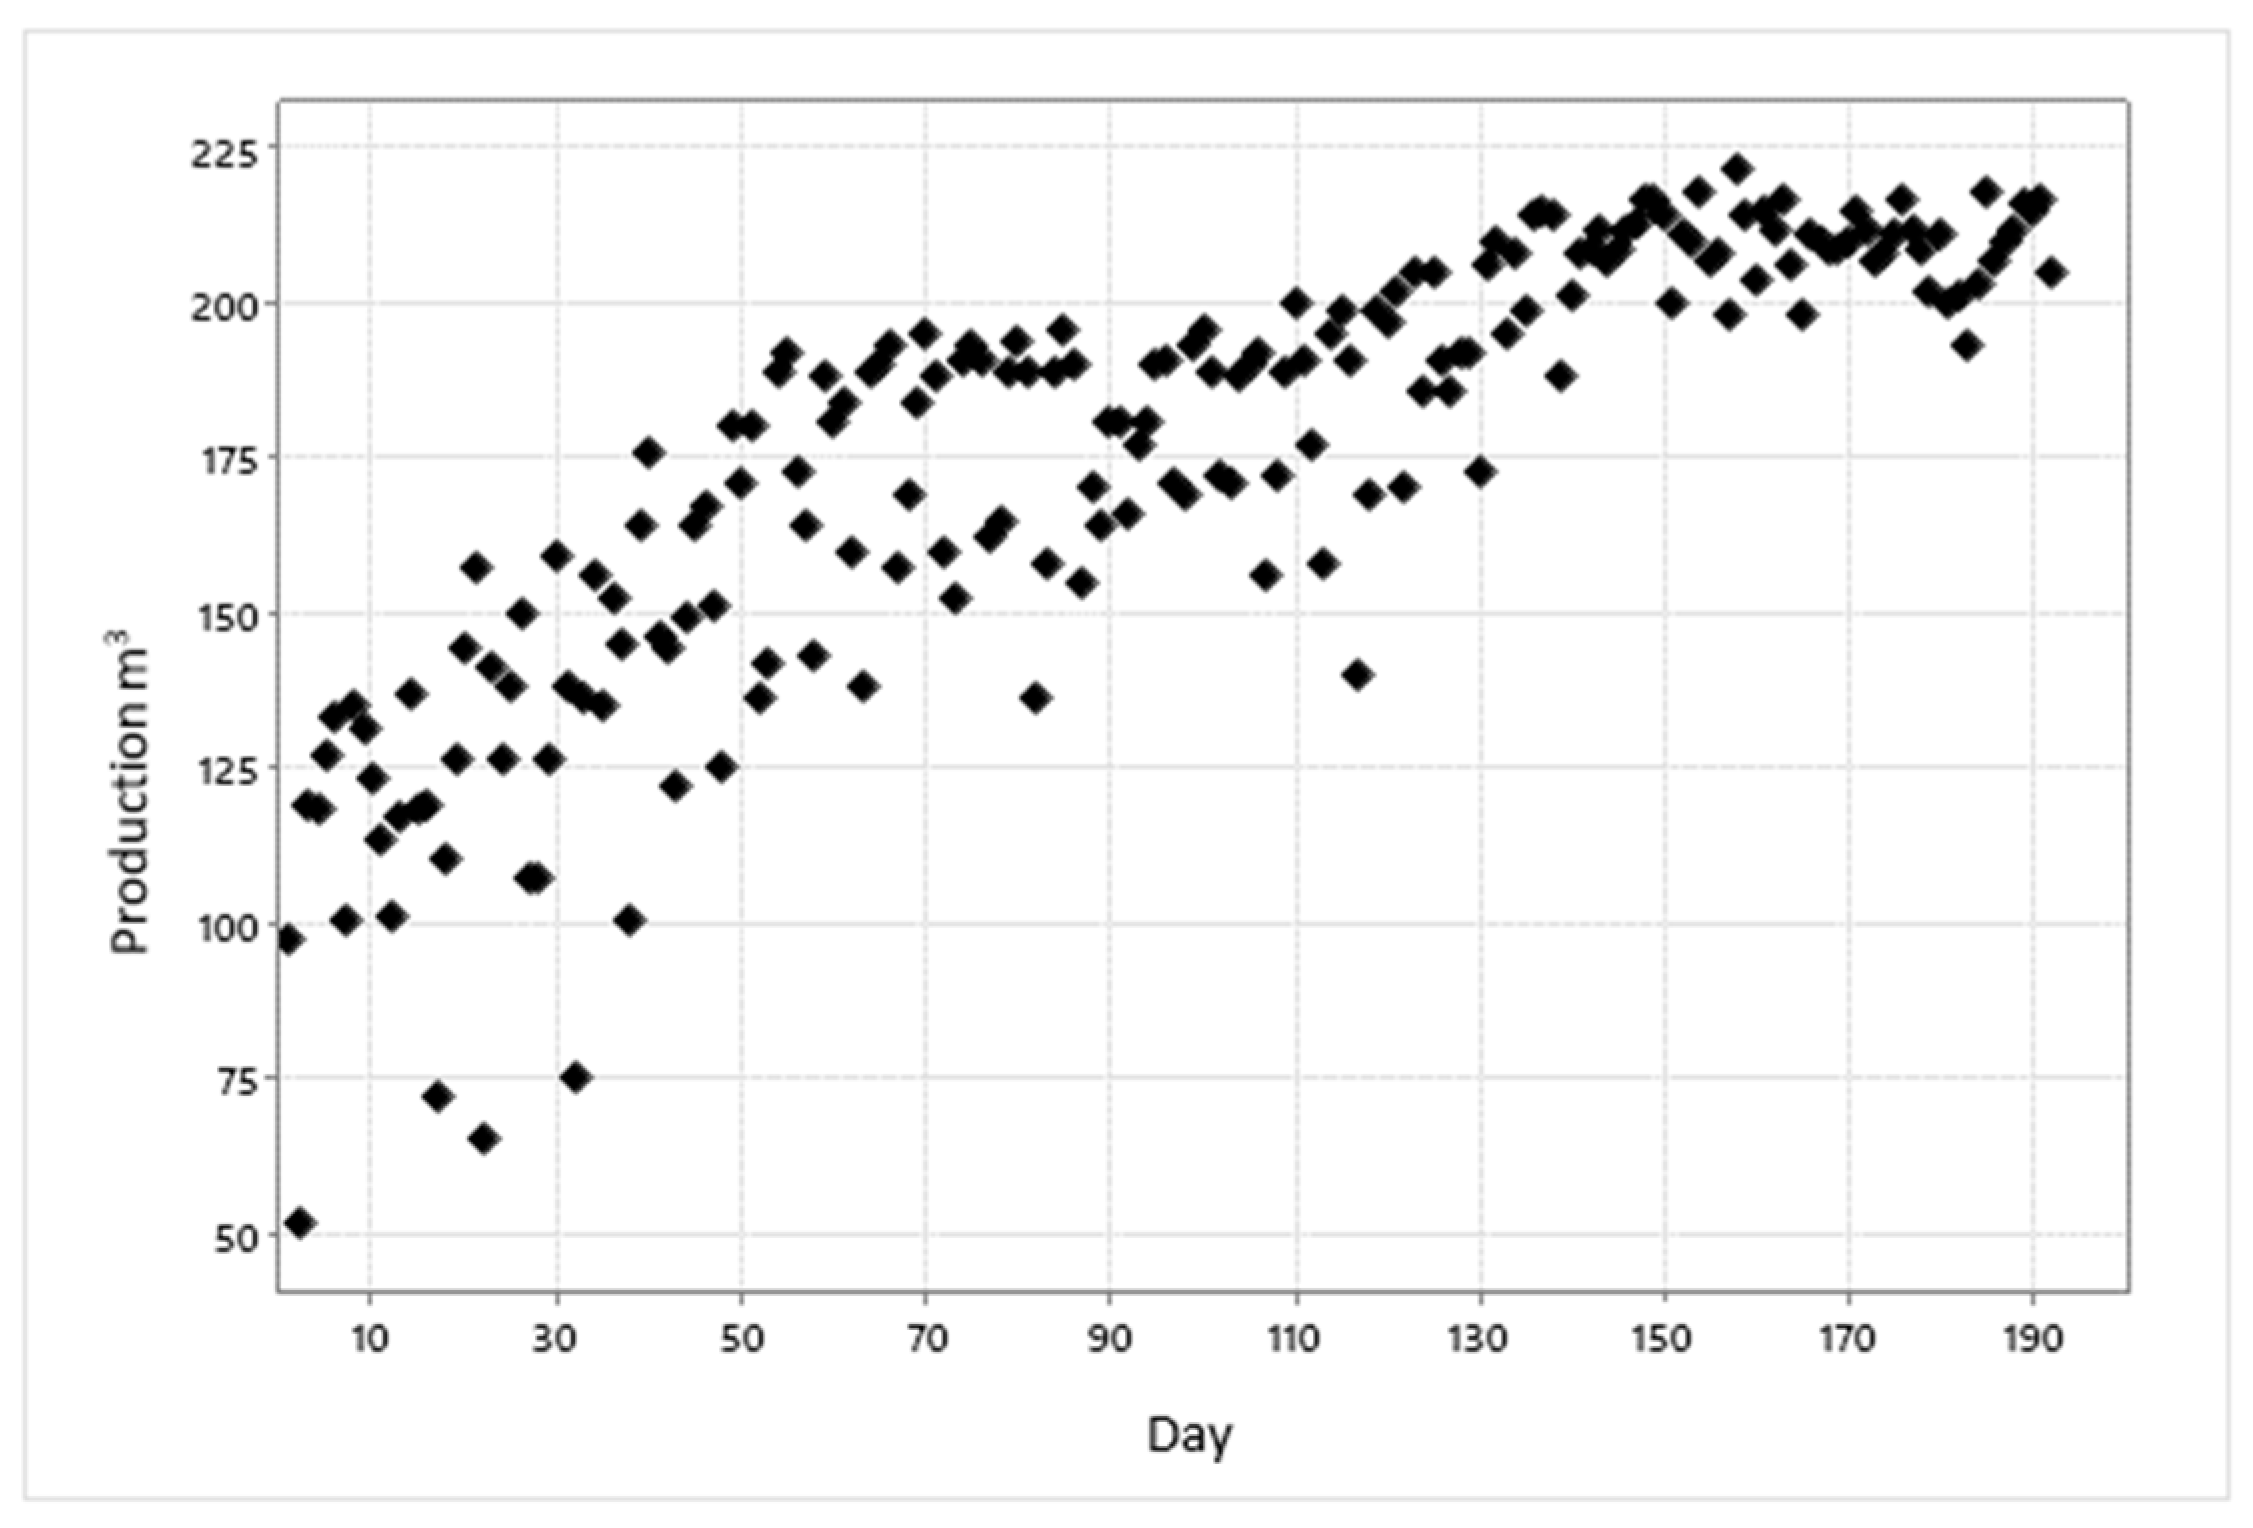
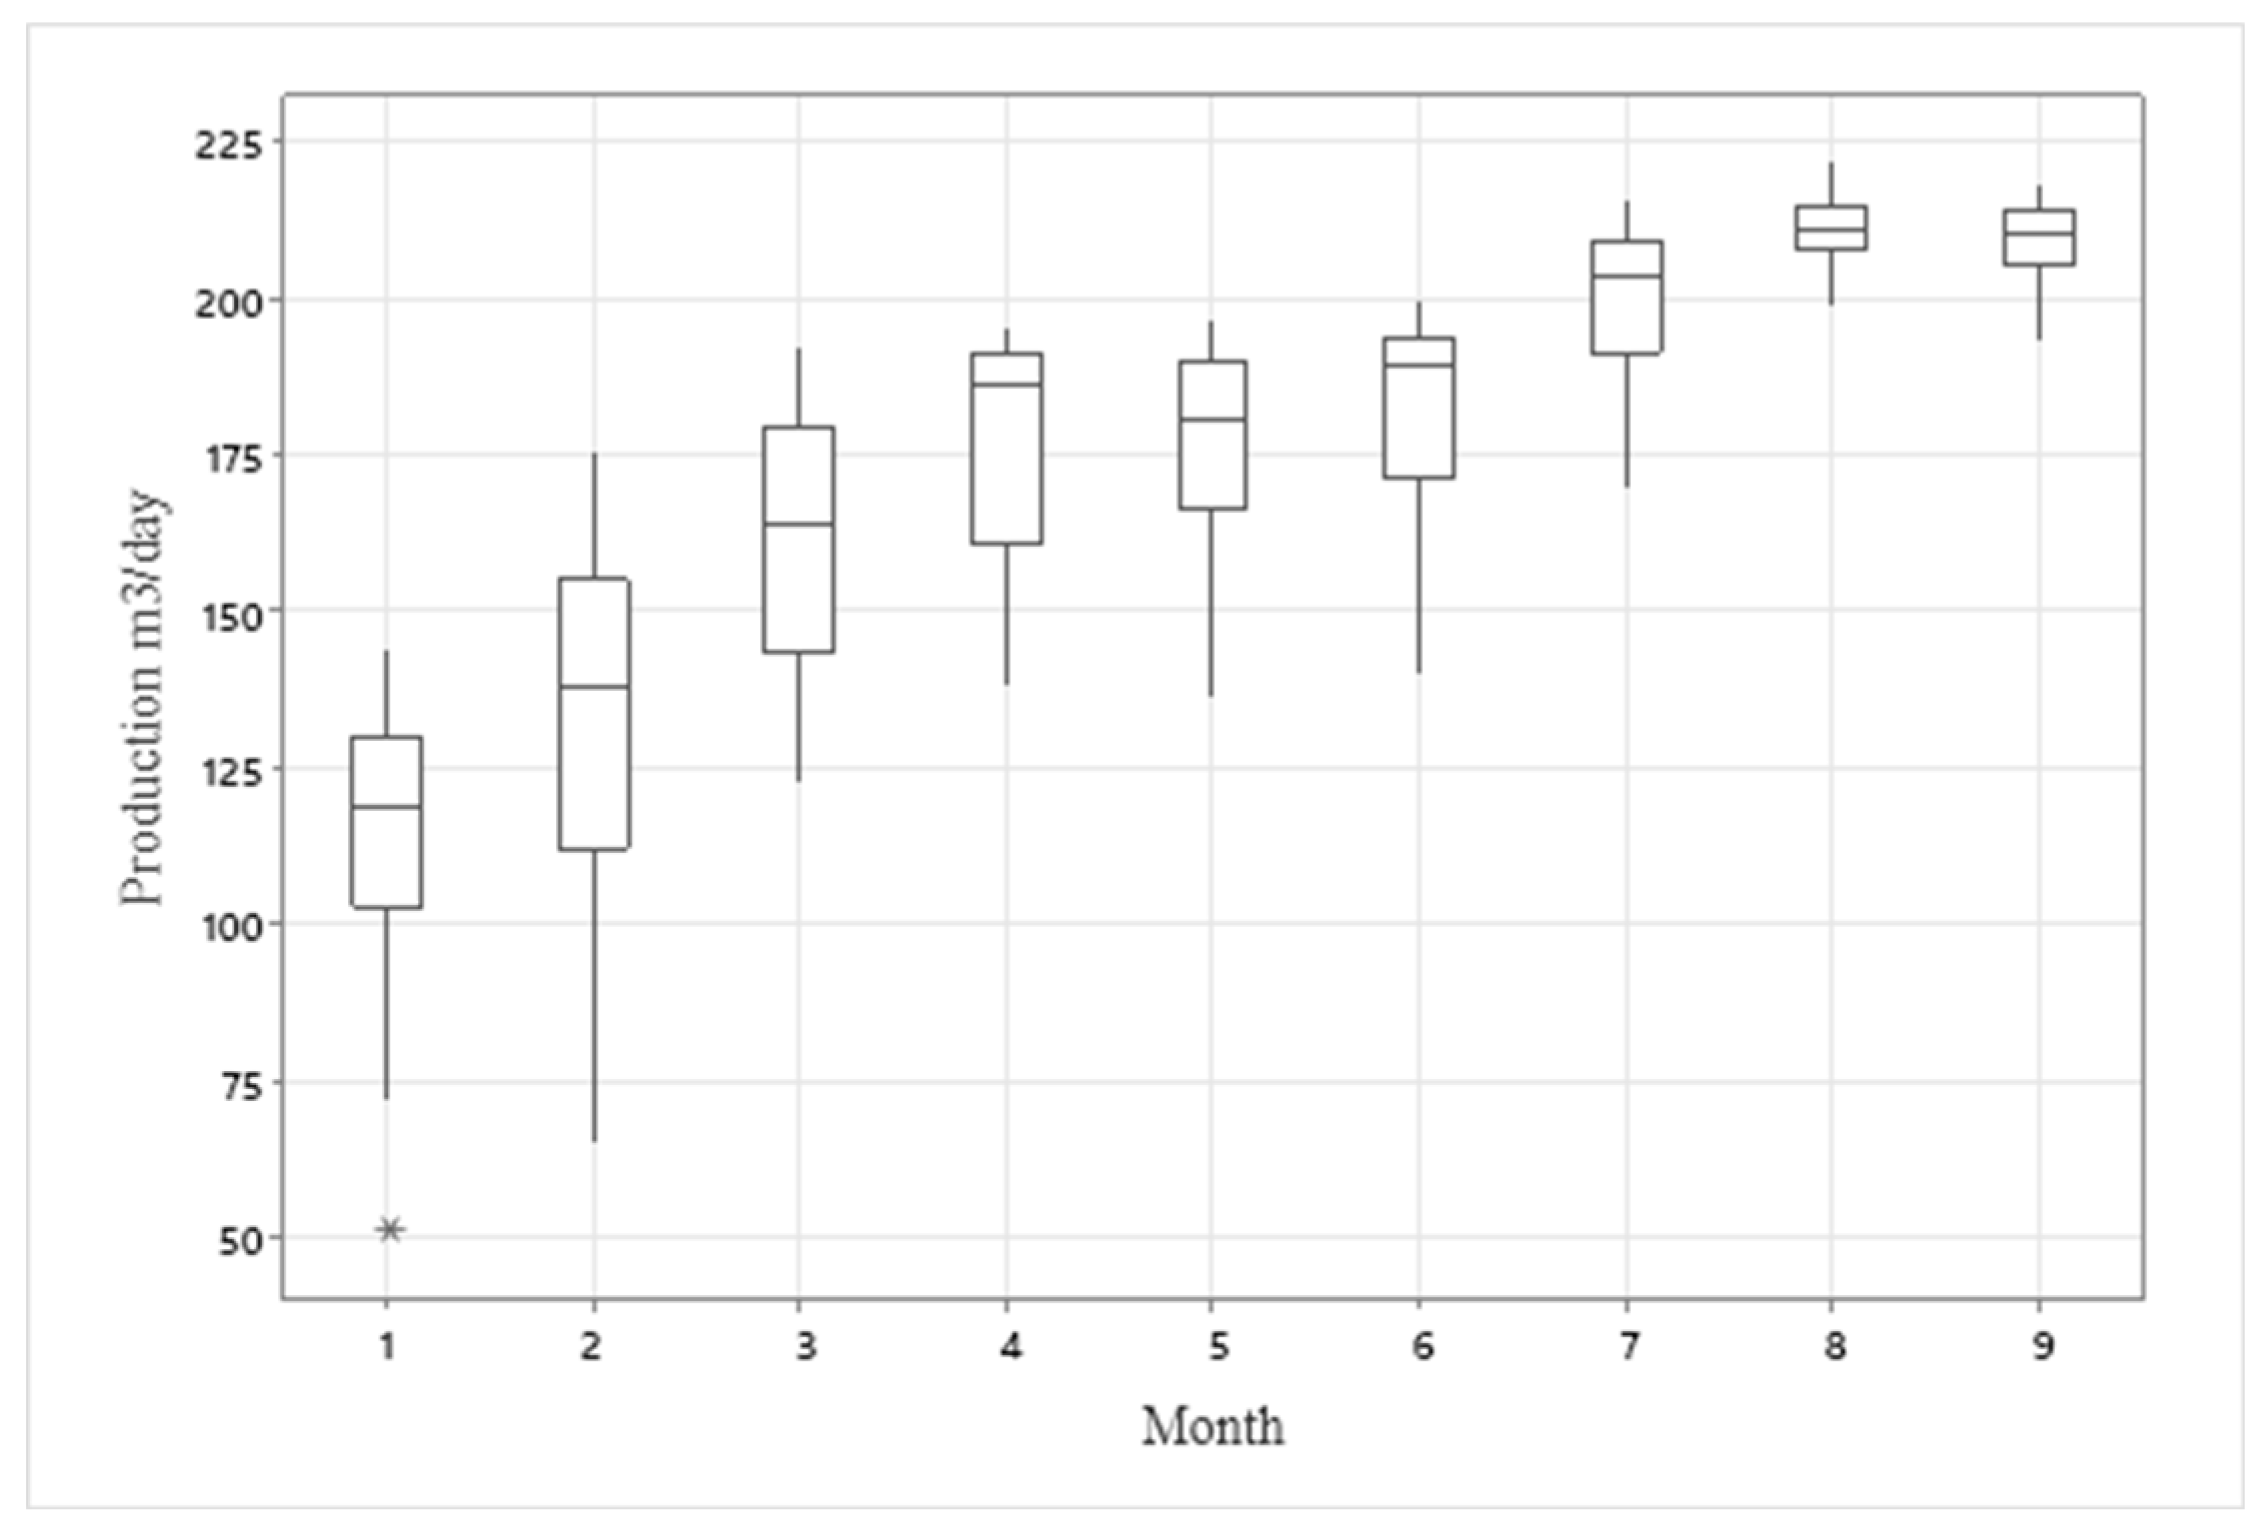
The production level achieved by the process during the 192 days of execution of the productivity improvement plan is presented in
Figure 4 and
Figure 5.
The production achieved during the first month of intervention was on average 125 m3/day and a standard deviation of 18 m3/day, equivalent to a coefficient of variation of 14.4%, in the last month of the study the average production was 209 m3 /day and a standard deviation of 6.3 m3/day with a coefficient of variation of 3%.
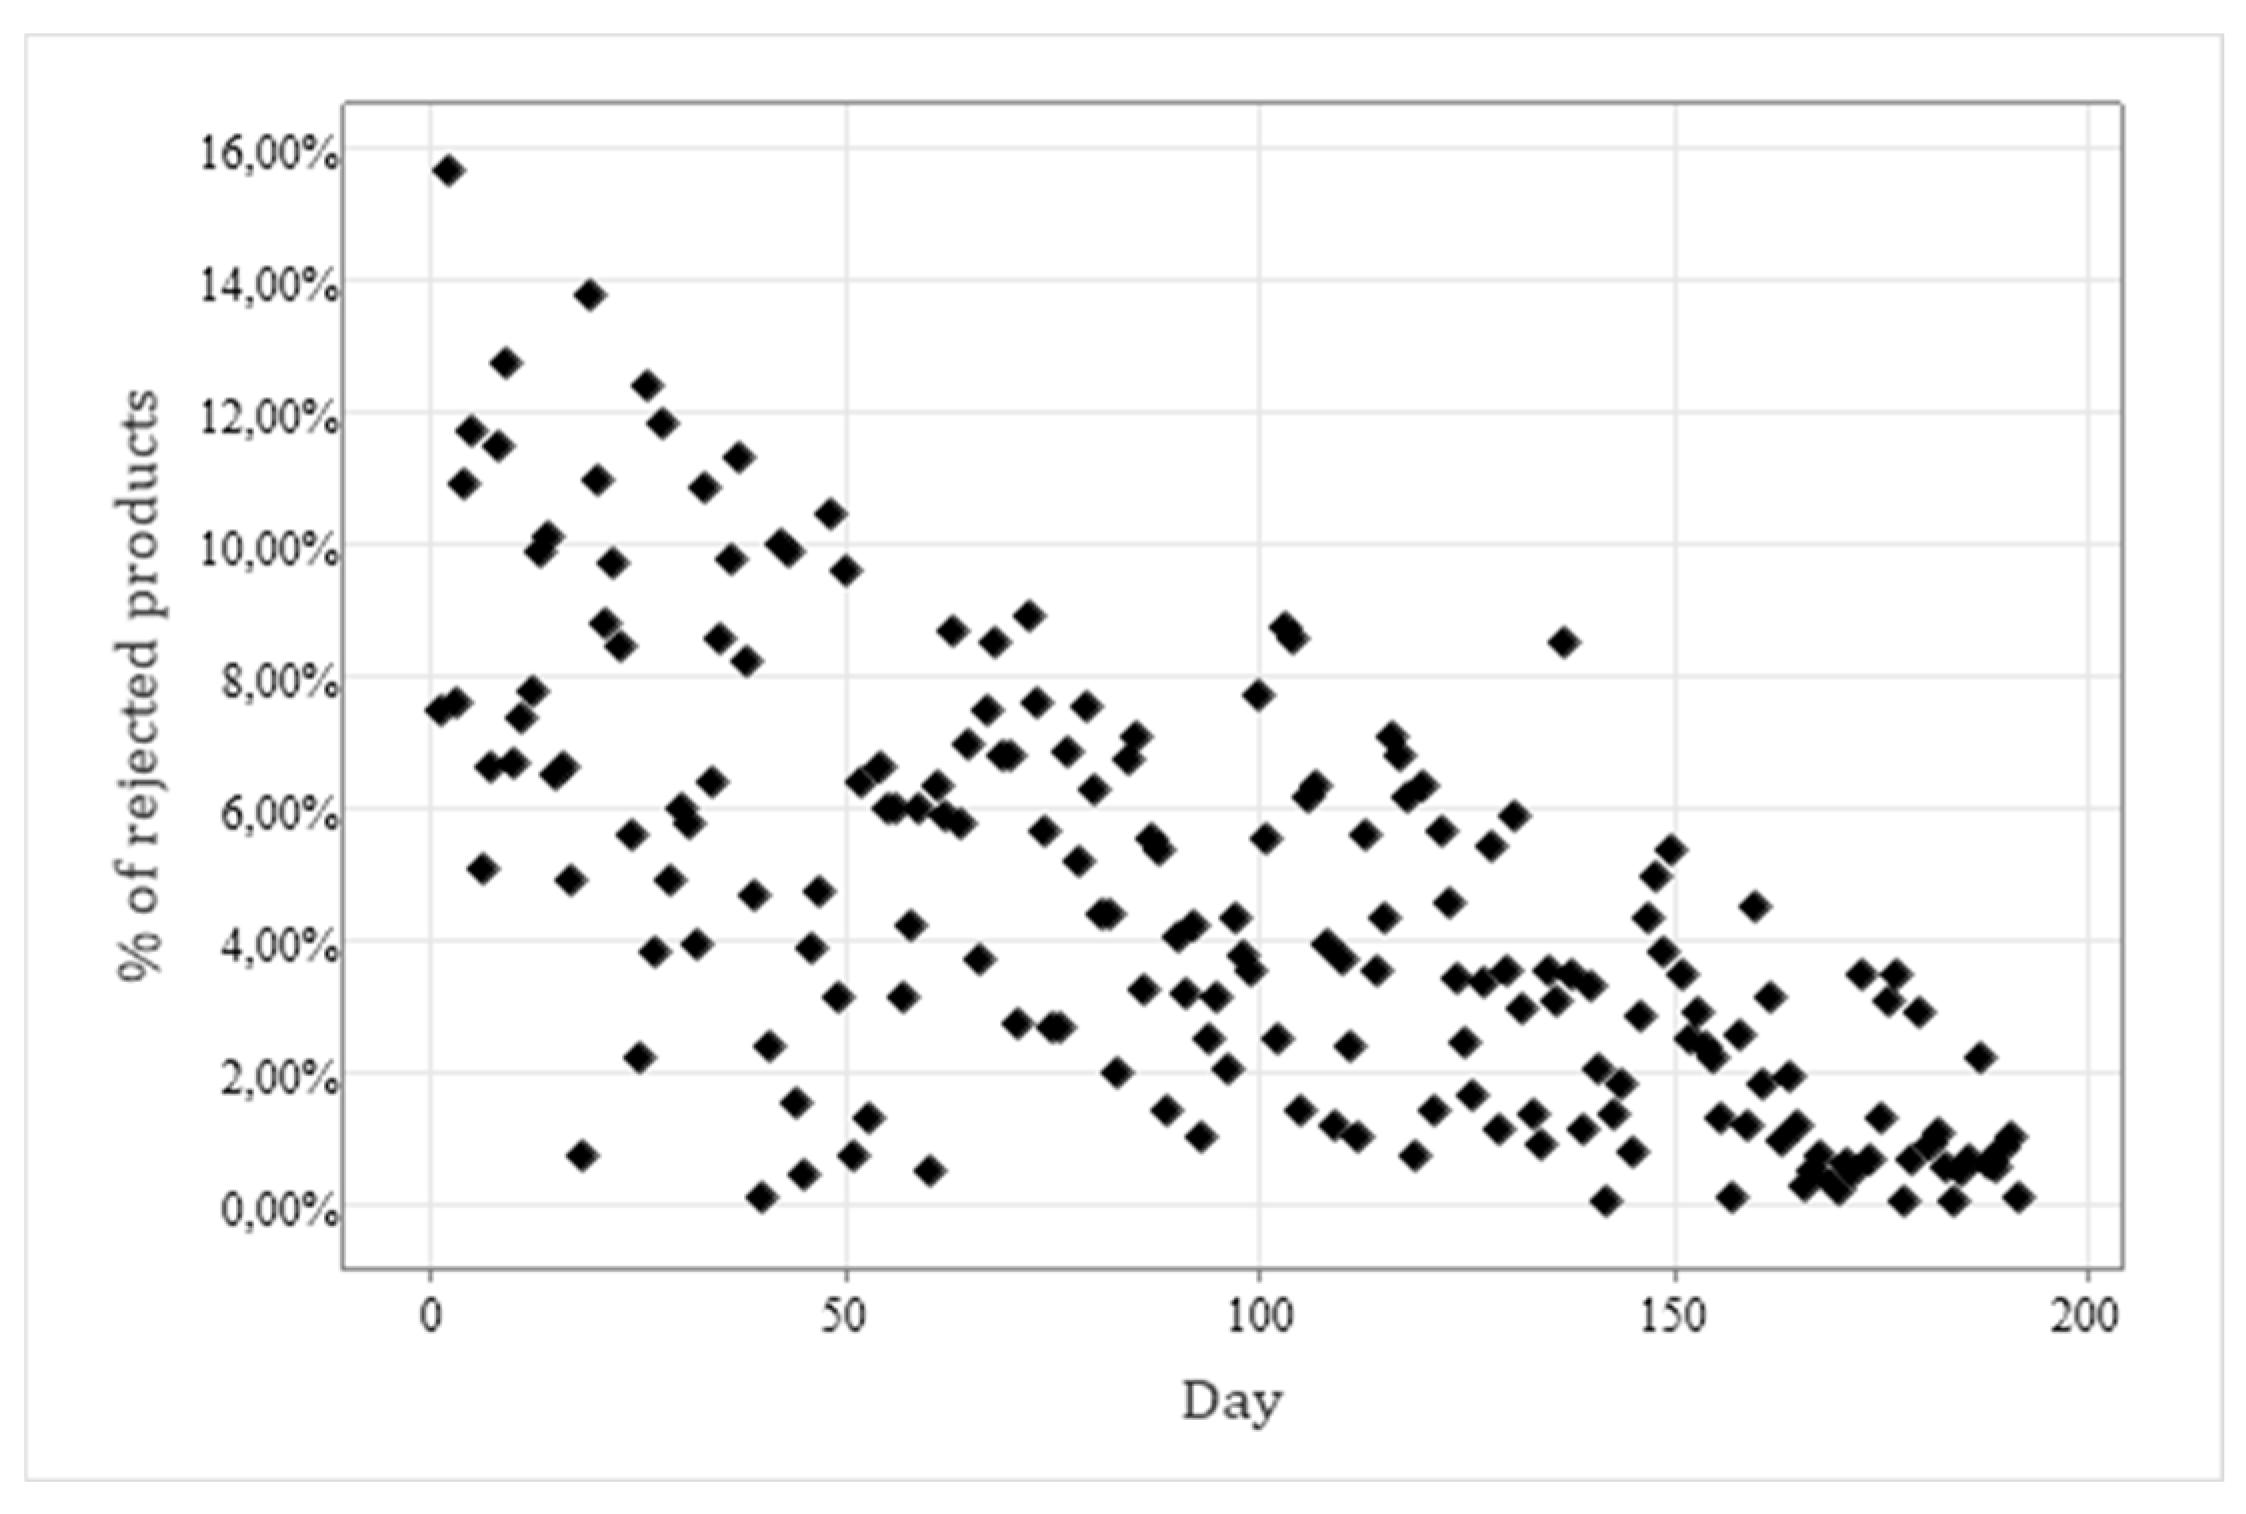
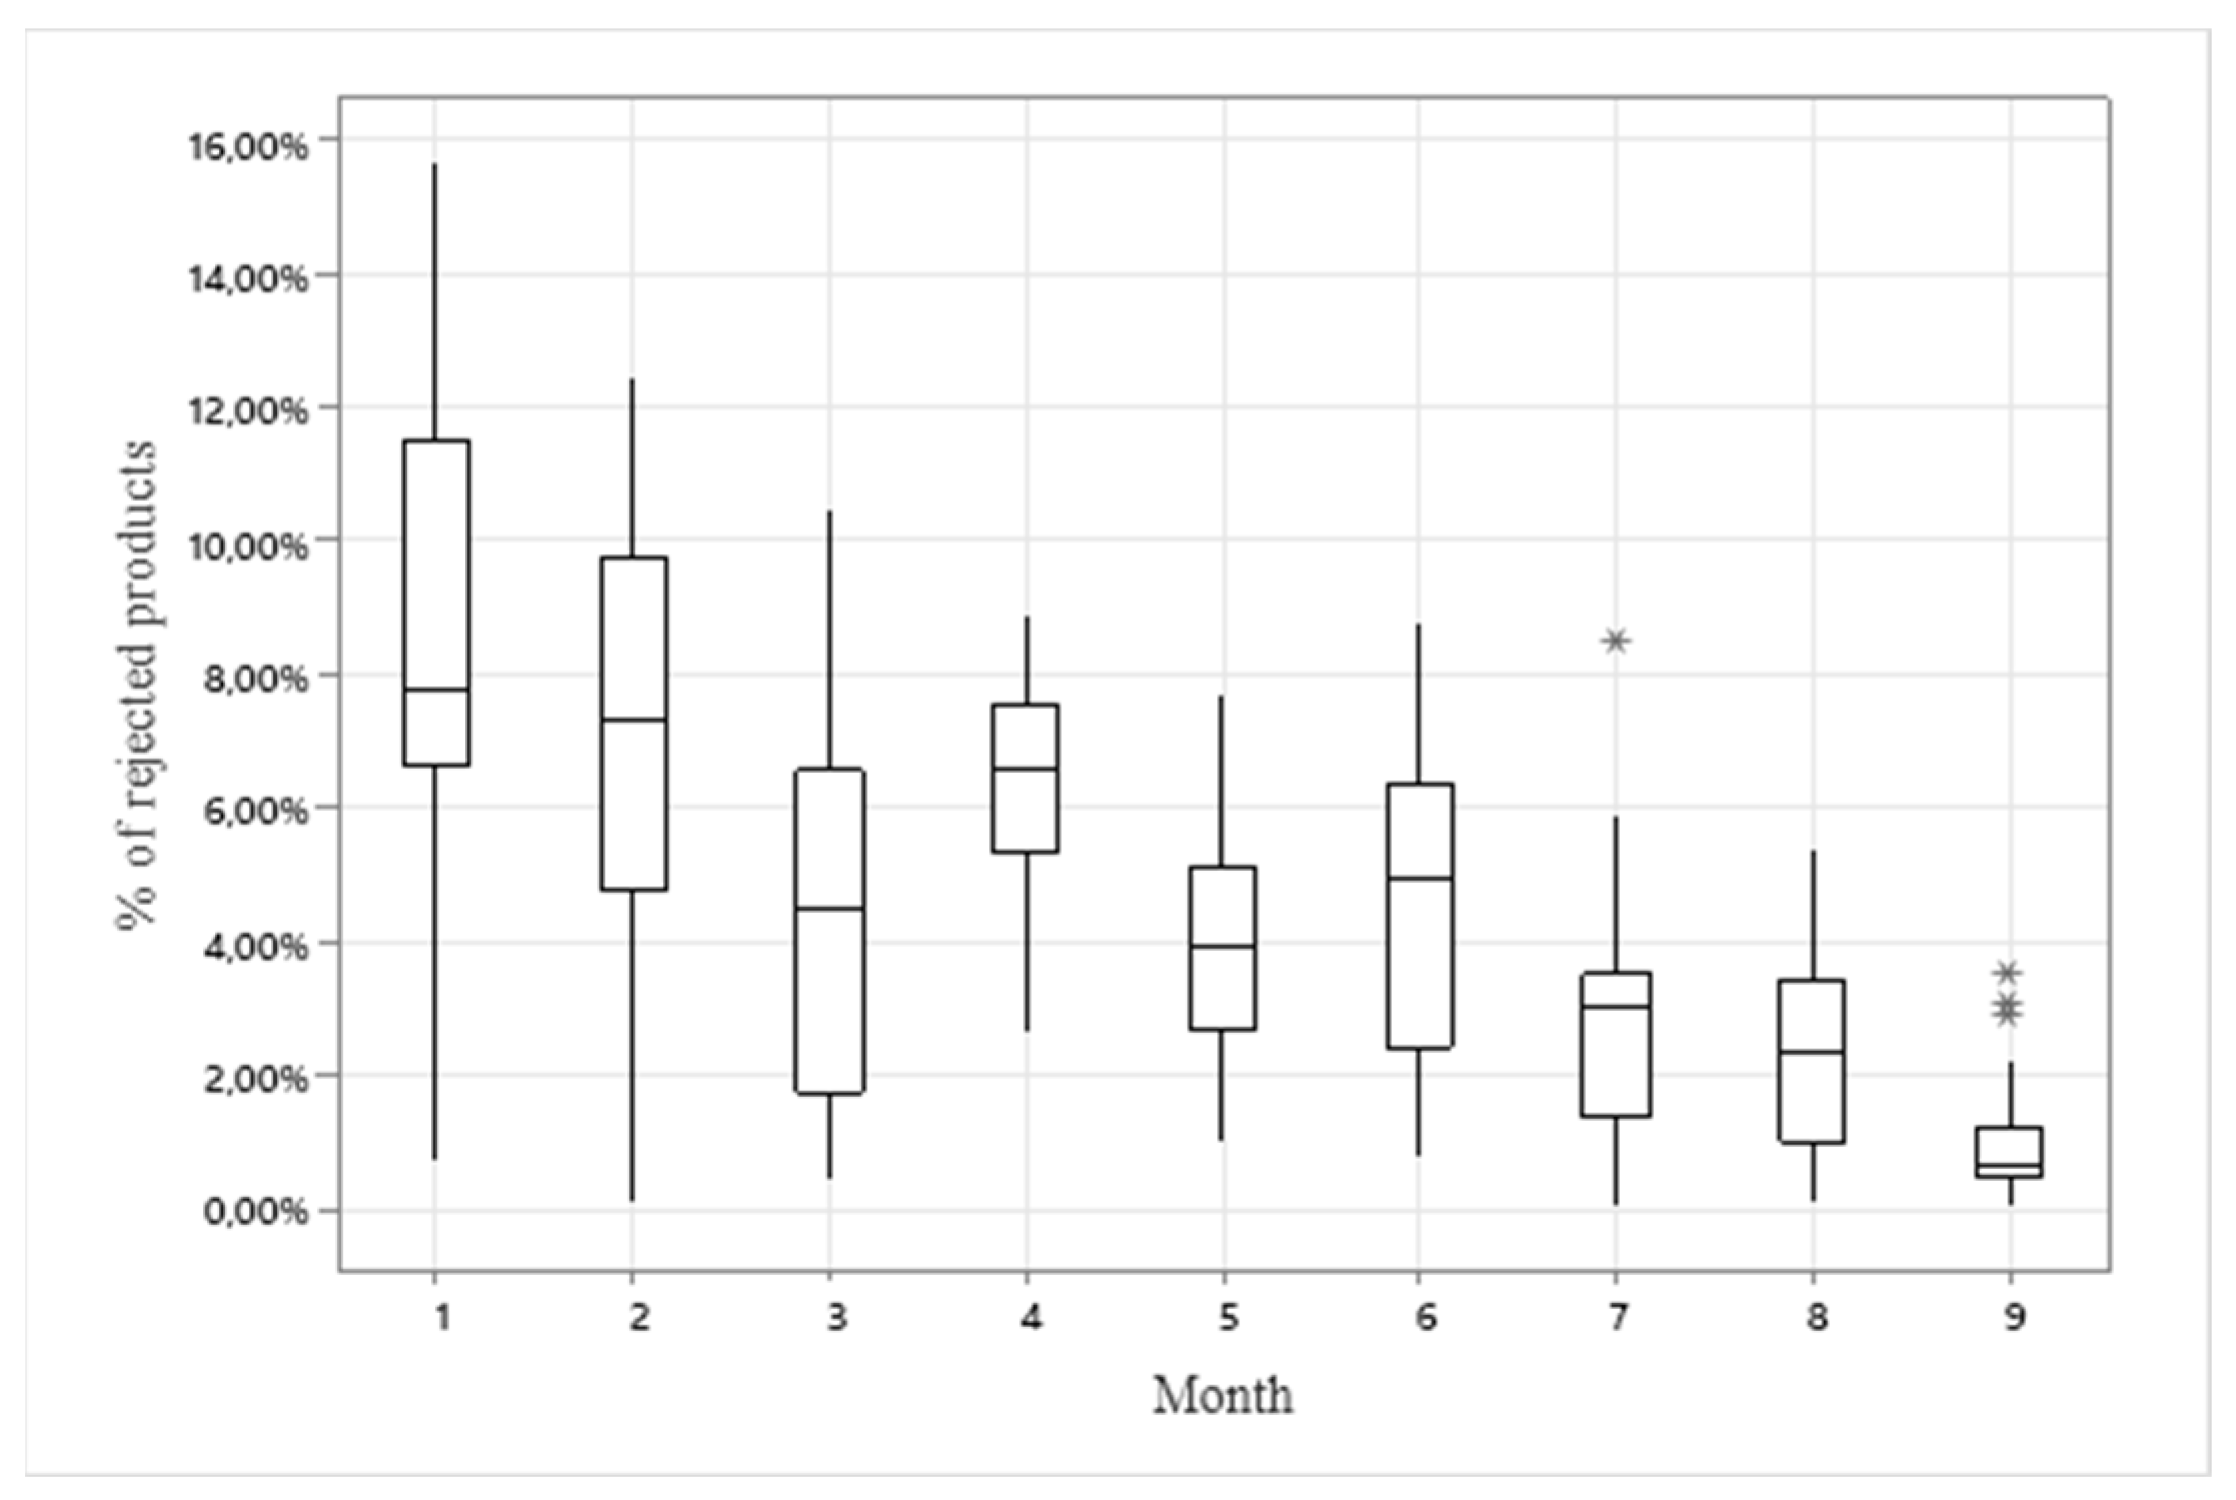
The percentage of rejected production without recovery during the production process of the 192 days of execution of the productivity improvement plan is presented in
Figure 6 and
Figure 7. The percentage of rejected product during the first month of implementation of the plan of improvement had a median of 7.8% and an interquartile range of 4.9%, in the last month of the study the median of rejected products was 0.7% and an interquartile range of 0.8%.
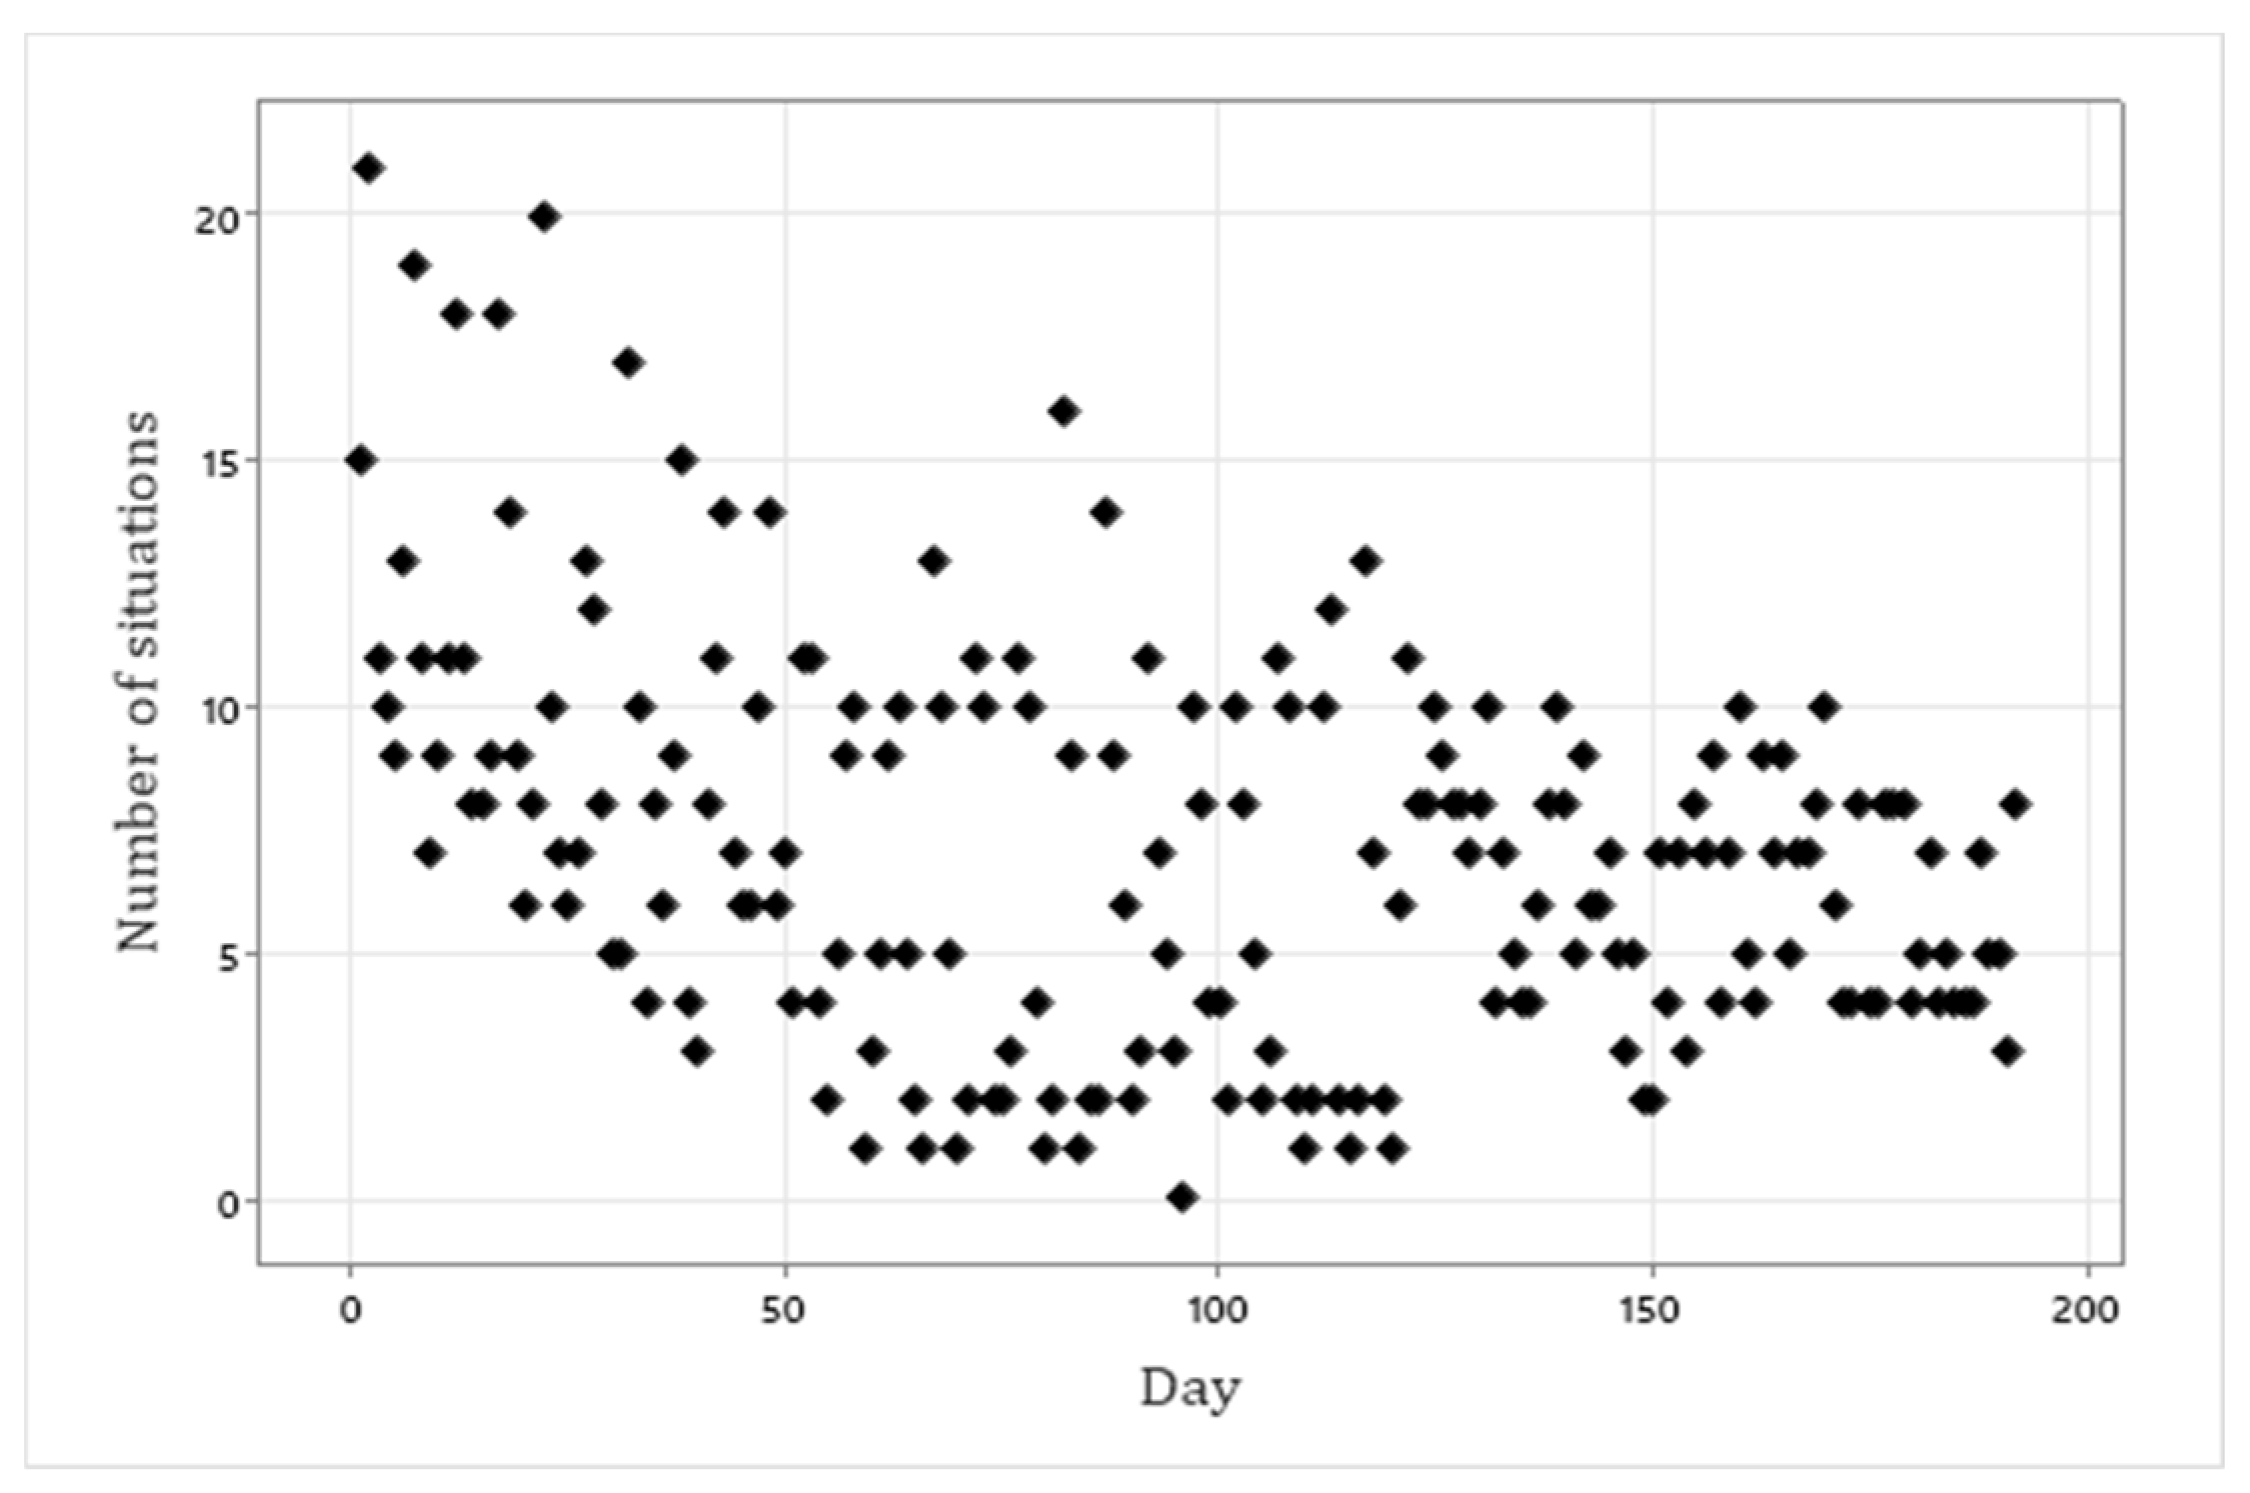
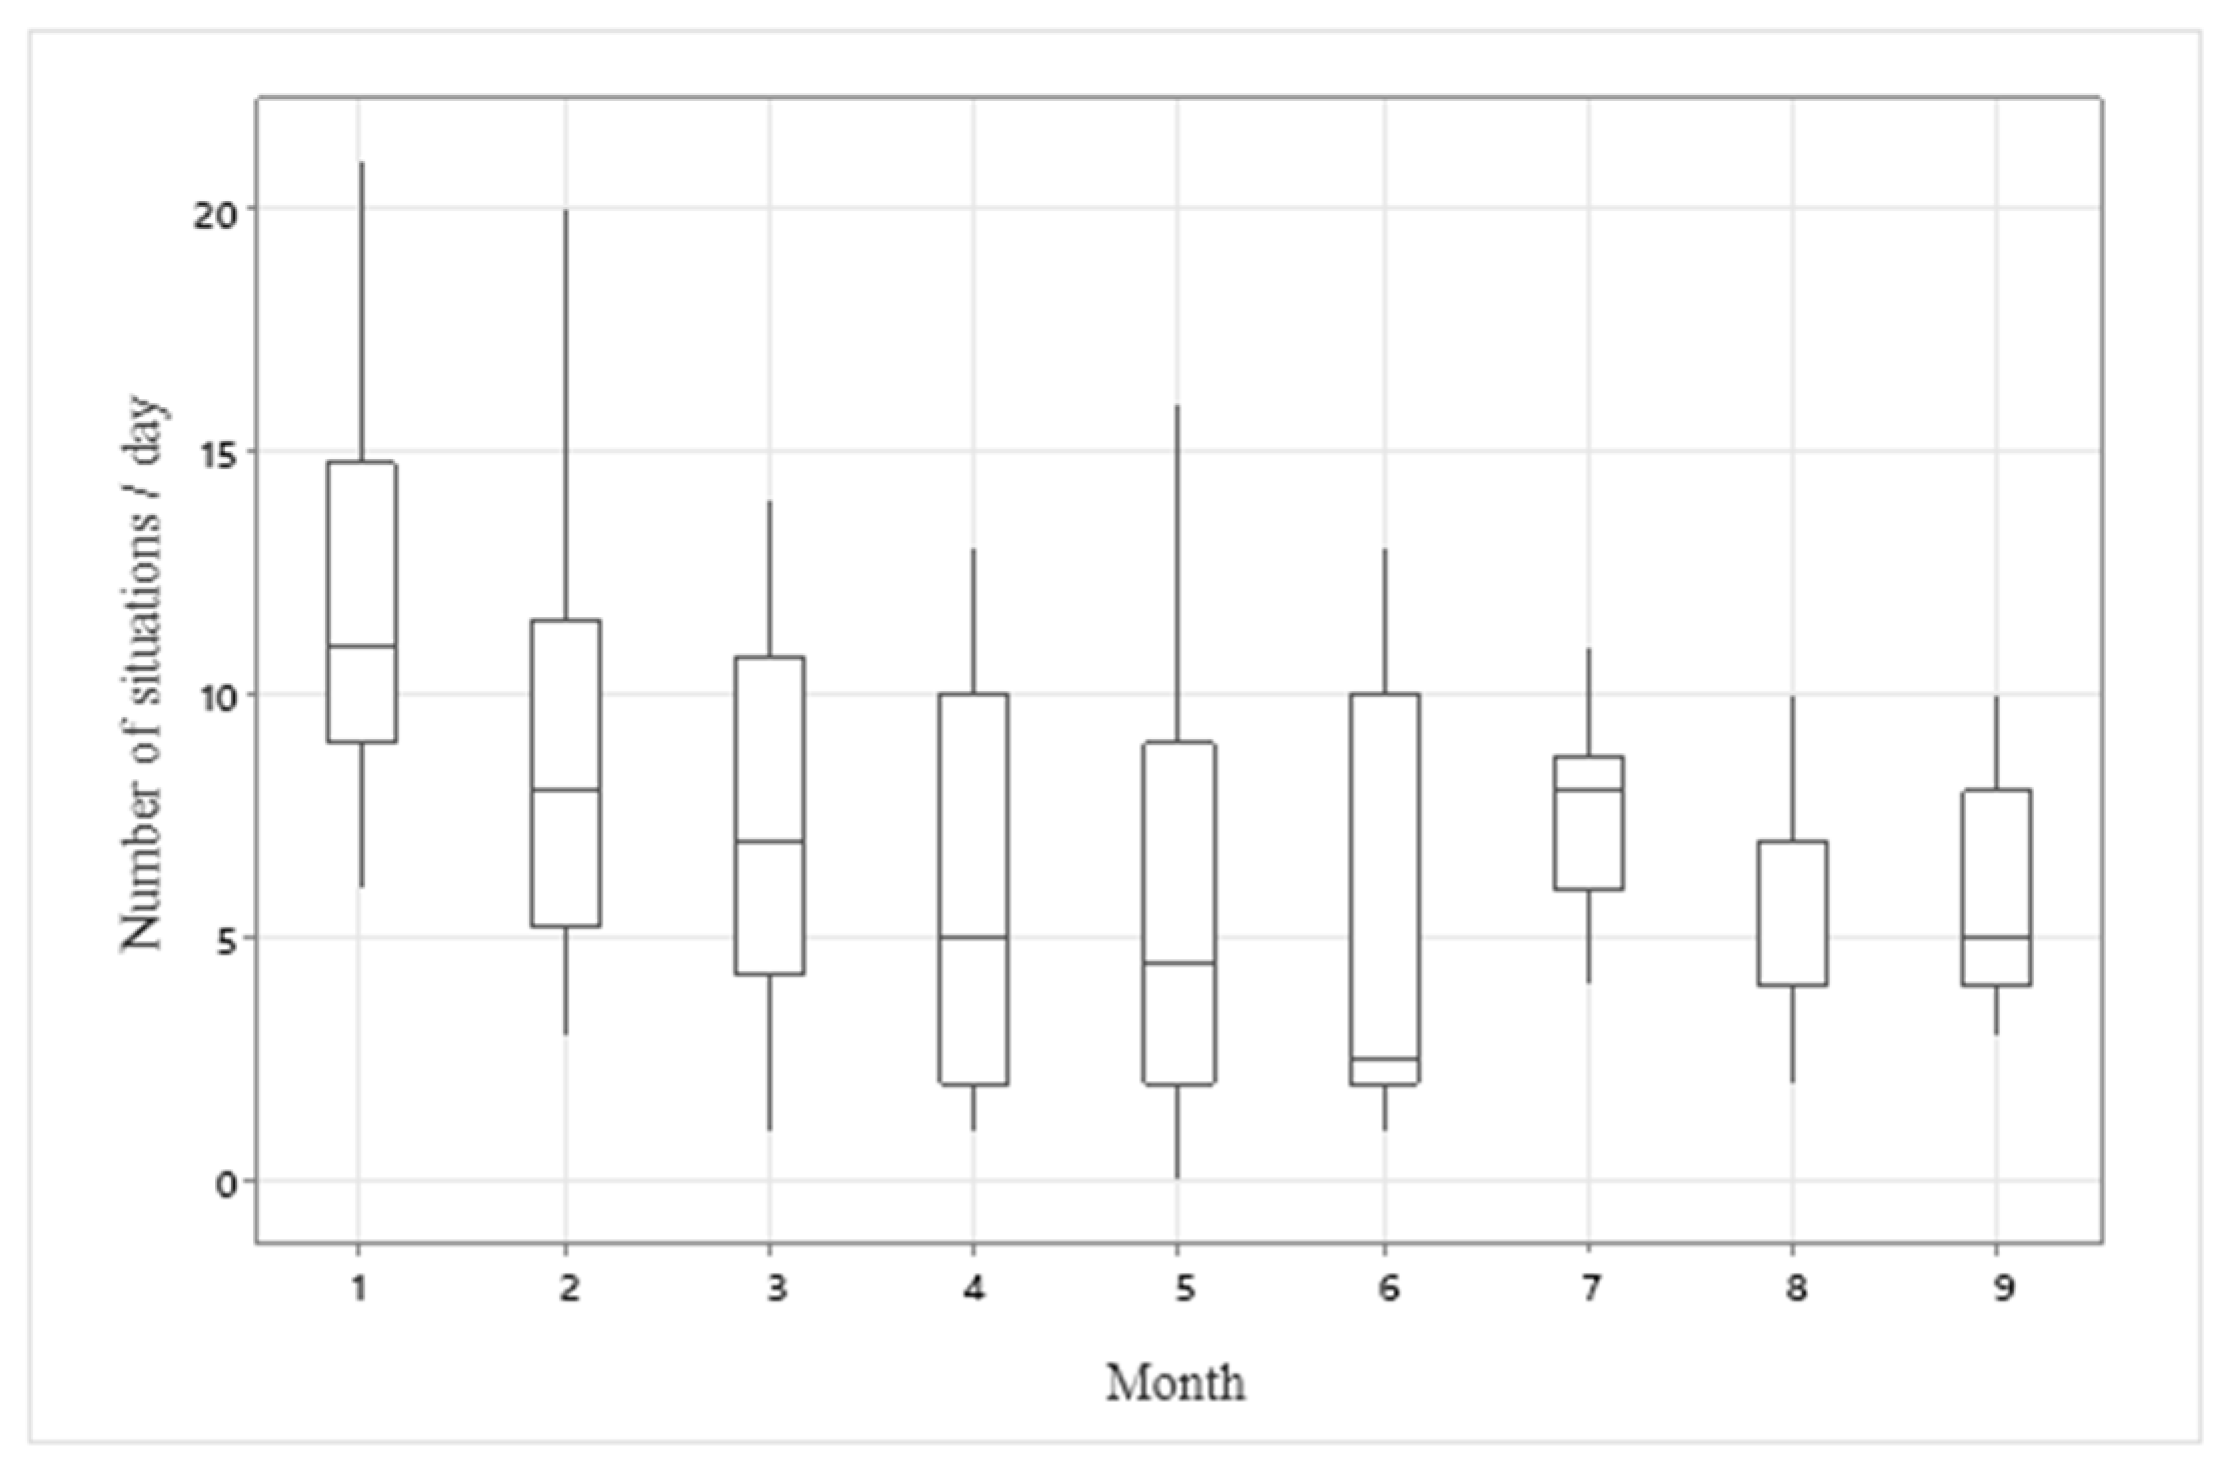
The number of special situations or events that occurred during the course of the study can be seen in
Figure 8 and
Figure 9.
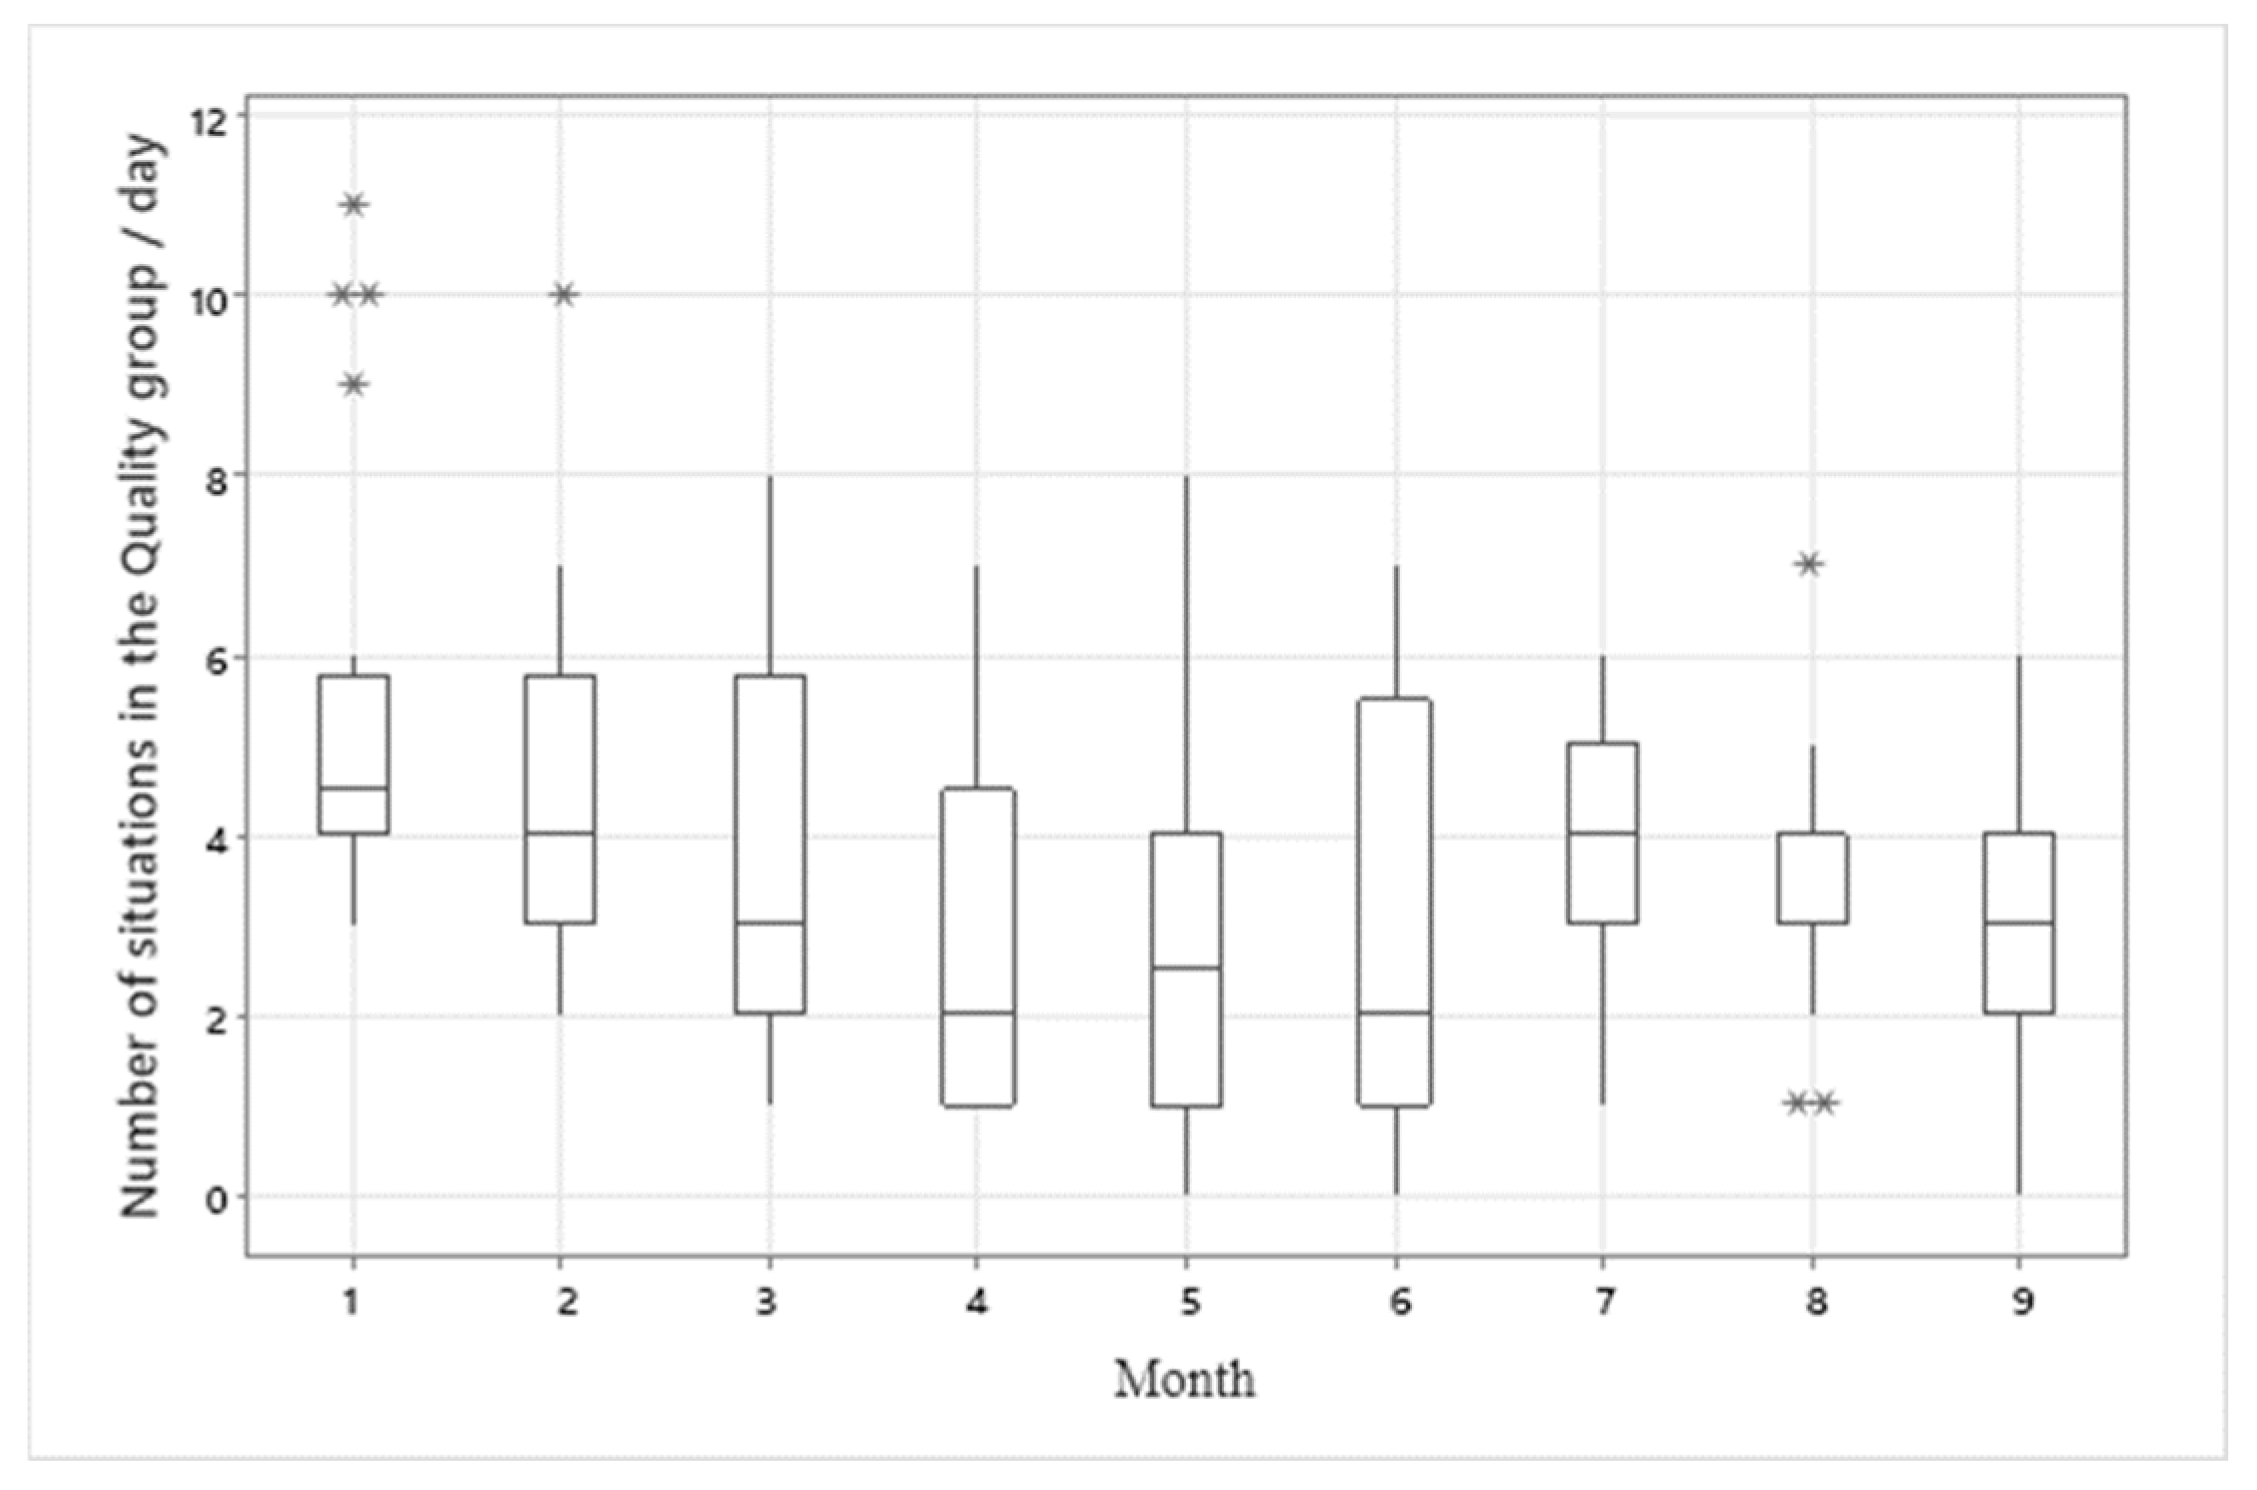
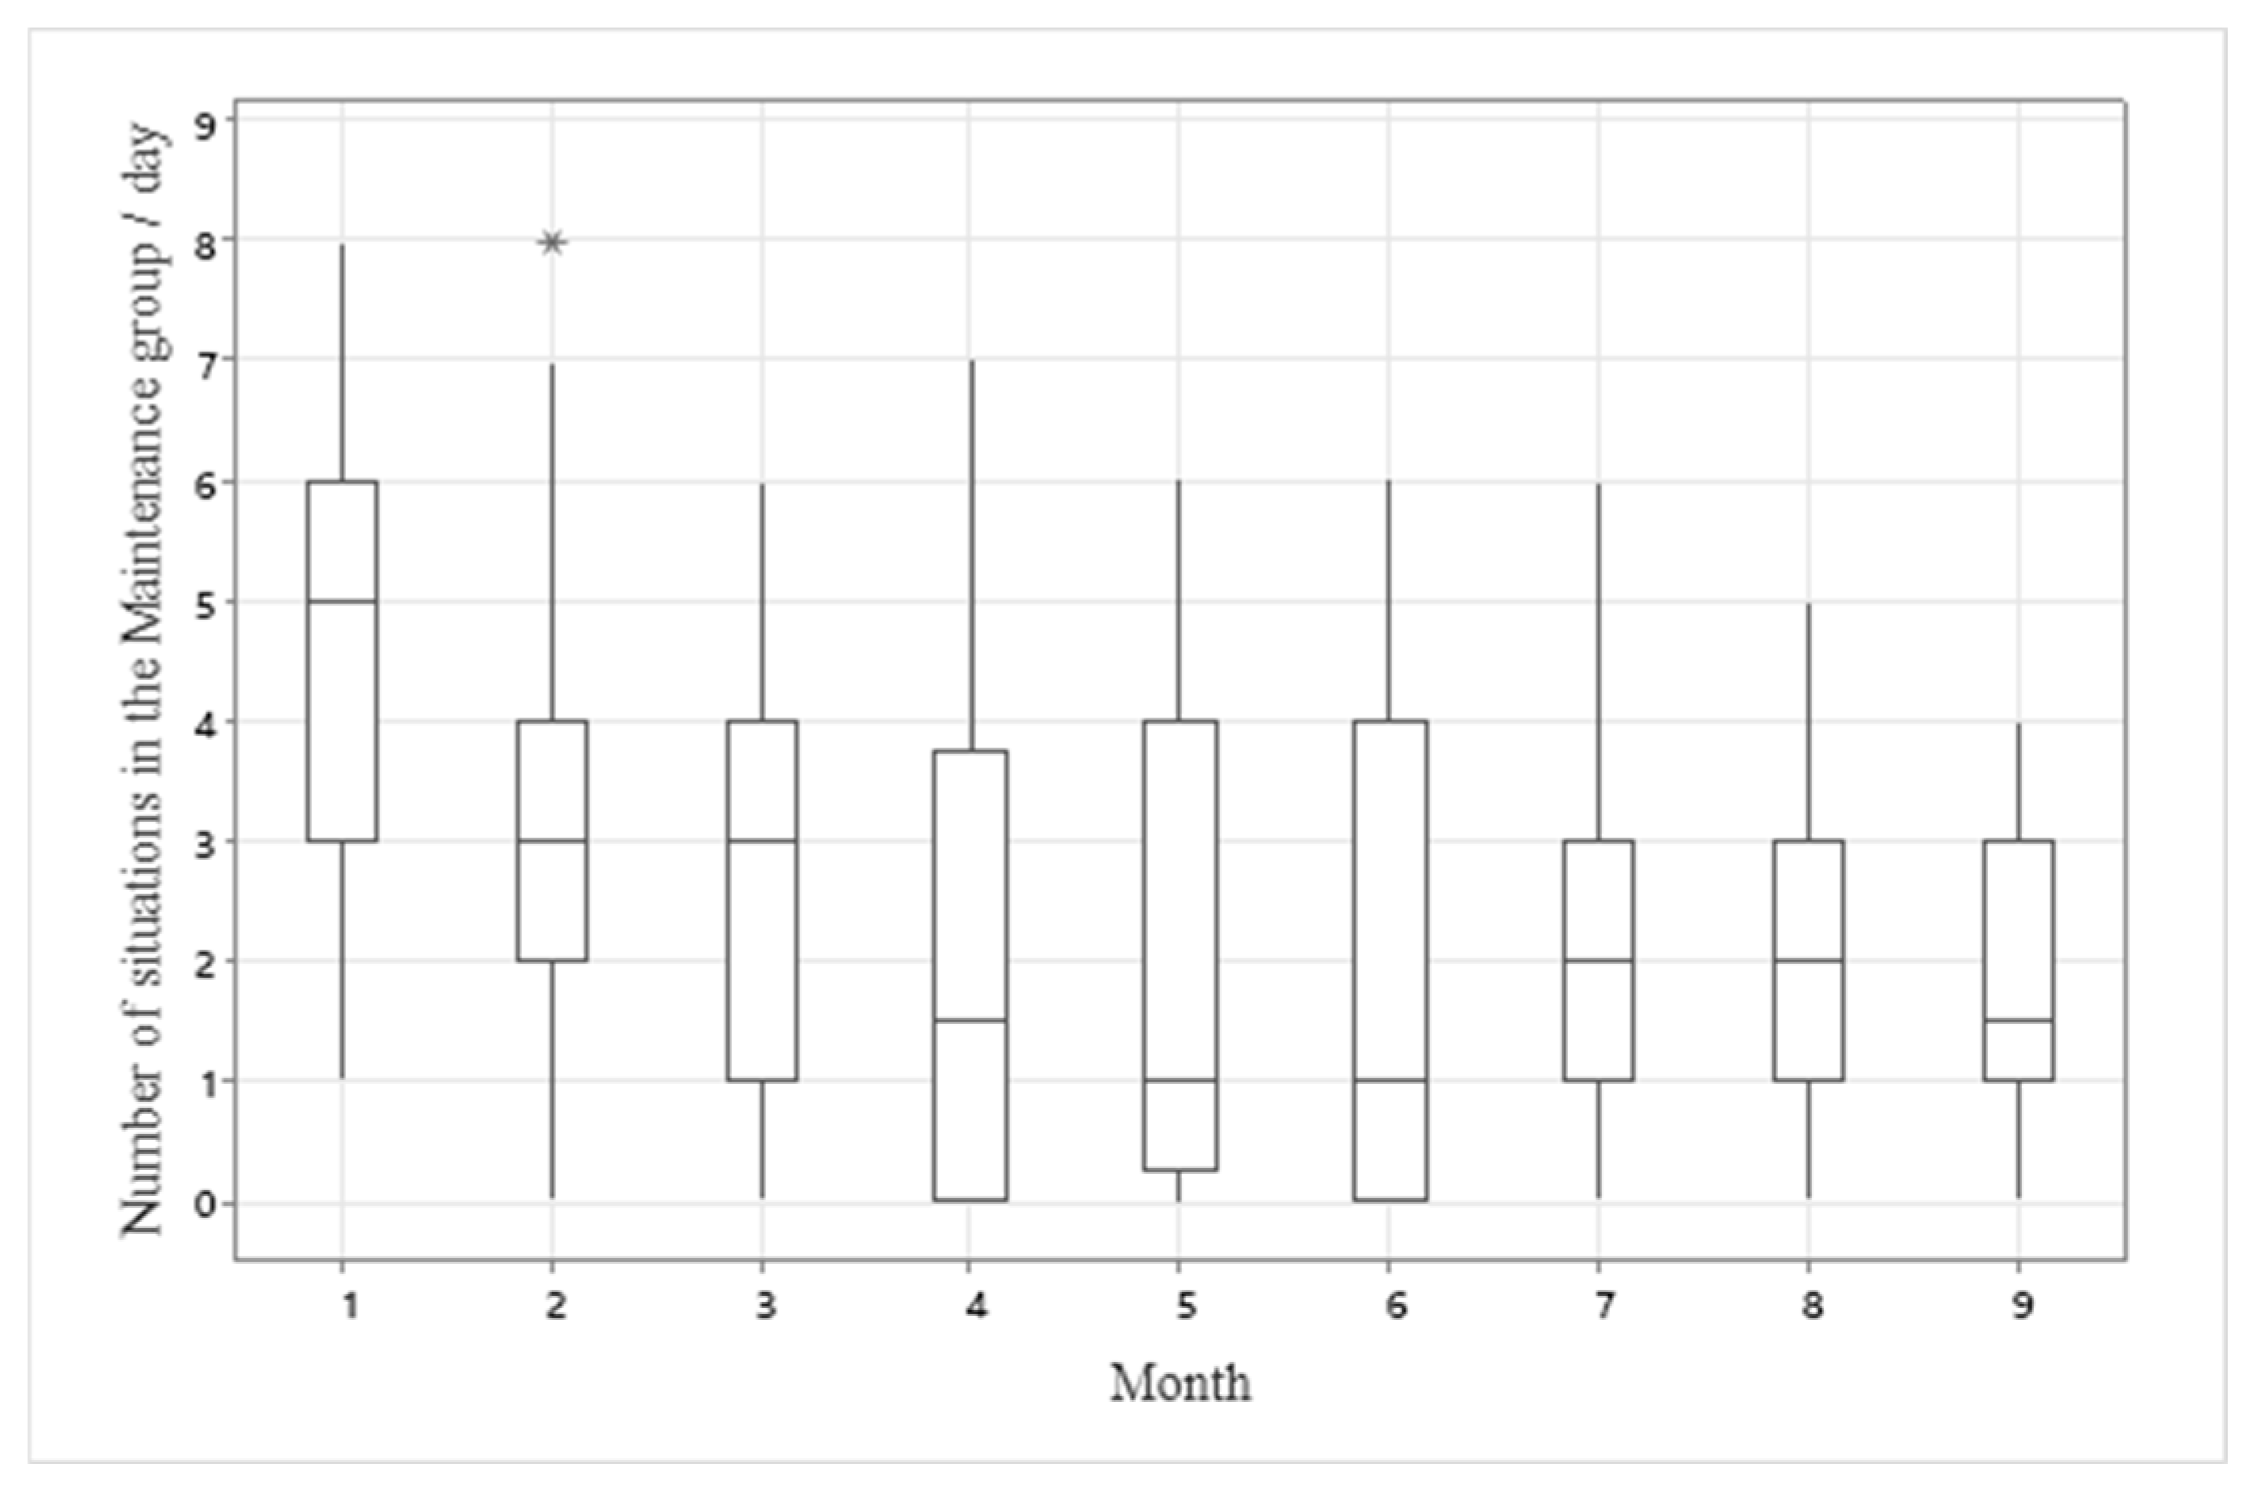
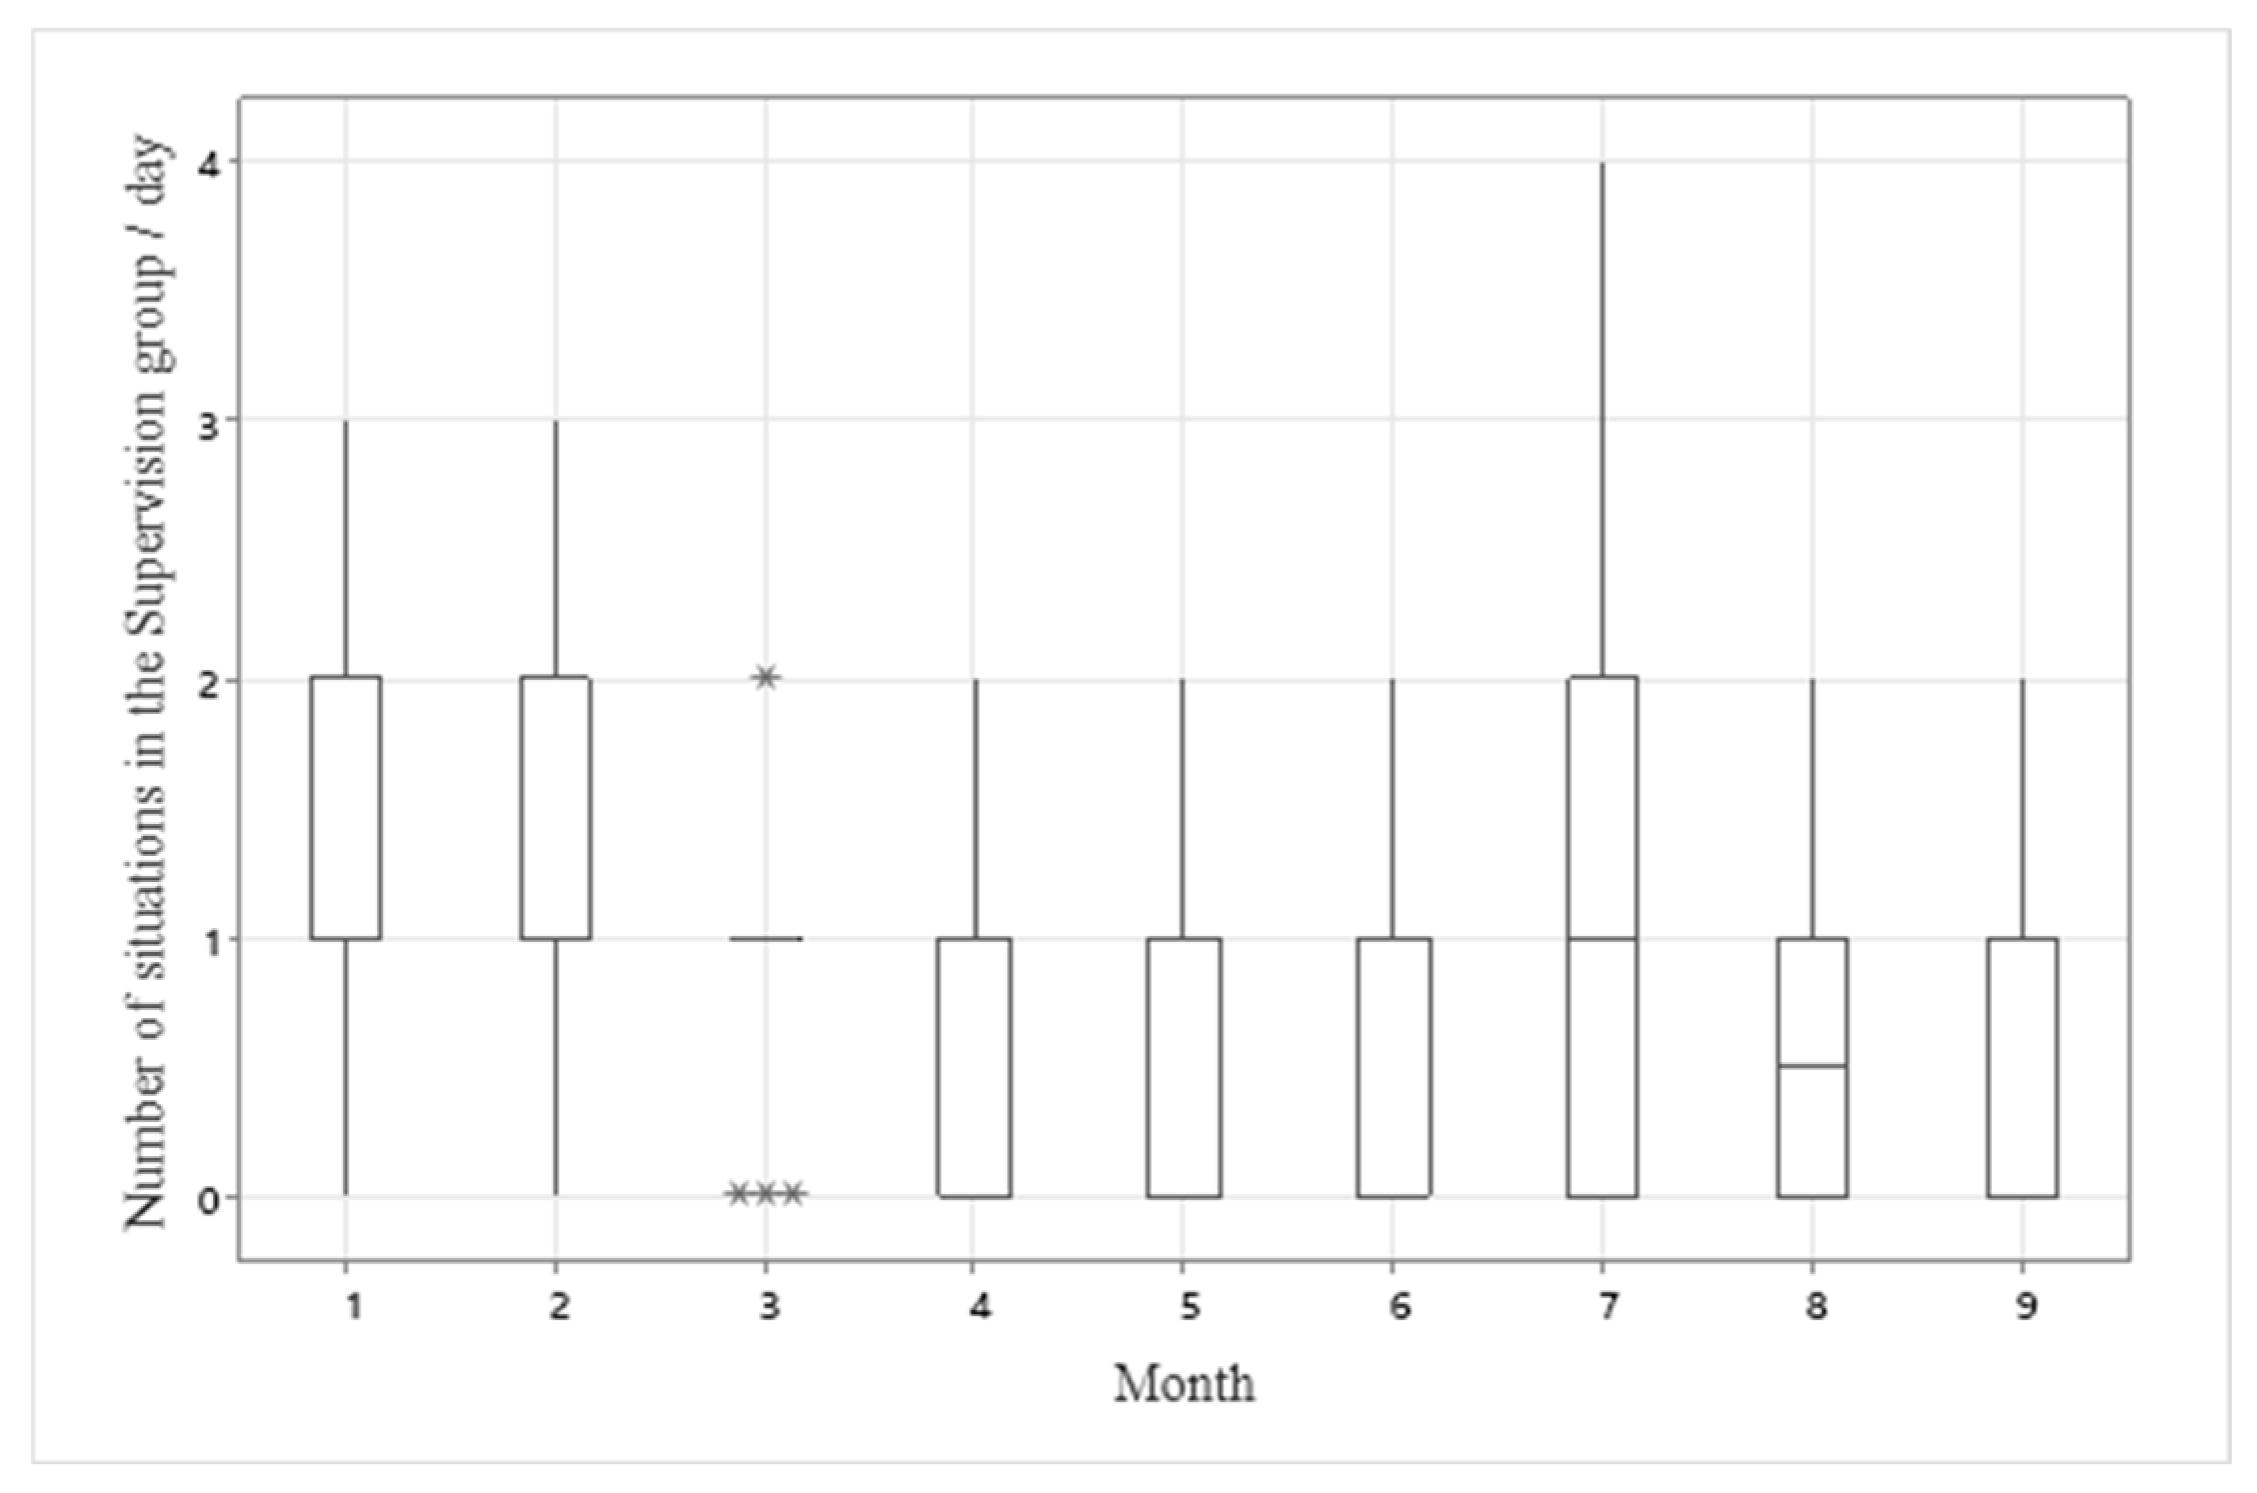
The number of coordinated situations in the Whatsapp
MT groups of “Quality” (
Figure 10), “Maintenance” (
Figure 11) and “Supervision” (
Figure 12), are seen in the following graphs from where we can observe in the 3 cases a decrease in the number of coordinated situations.
Table 4.
Frequency of maintenance-quality-supervision patterns / hour.
Table 4.
Frequency of maintenance-quality-supervision patterns / hour.
Table 5.
Situational frecuency distribution table.
Table 5.
Situational frecuency distribution table.
In the implementation process, different activities were developed, not being free of drawbacks, both cases are detailed in
Table 6 and
Table 7 respectively:
7. Análisis
•
Stage one: the audit process guided by Platts K.'s guidelines [
42] helped us identify the gaps of the main factors that affect productivity and the action plan prioritization methodology designed by Quezada L.[
43], allowed us to sequence and focus resources.
• Stage two: The process of analyzing the gaps and their statistics with management was delicate, since numerous complaints were generated from senior management towards operations management. These complaints were expressed in phrases such as: "Why didn't we do it sooner?" or “Why are we only addressing this now?” During the meetings, much of the time was spent explaining the processes at a tactical and operational level to senior management, revealing important gaps and opportunities for improvement.
• Stage three: When choosing a technology for communication in the coordination of operations in manufacturing, it is important to take into account several key aspects. These include security, reliability, latency and cost. These elements are fundamental to guarantee effective and efficient communication. In addition, it is also beneficial to consider the ability to integrate with other management and control systems in real time, which can optimize coordination and improve productivity in the manufacturing environment.
• Stage four: The groups were defined based on the functional areas, as well as the objectives and goals established by management. In our case, the factor of geographical location or other types of organization other than the functional one, such as the matrix structure, were not taken into account. These aspects are relevant especially in large companies or with resources shared between different areas.
• Stage five: During the configuration stage of the communication groups, various factors played a fundamental role in their formation. Among them are the complementarity of skills, the role and responsibilities of the participants, as well as information flows. Identifying the talents of each participant helps with the projection of the behavior of some elements in the group, allowing for the projection and configuration of more stable groups over time.
• Stage six: Establishing goals, standards, metrics and formalizing the delivery of resources is crucial to demonstrate management's commitment to the improvement plan. Incorporating these agreements in employment contracts reinforces the importance of these aspects, even though there is no current specific legislation in this regard.
• Stage seven: during the implementation of the PDCA cycles (plan, do, check, act), considerable increases in production levels and decreases in rejections were achieved, exceeding the goals established by management. The improvement plans were driven and diminished by a series of factors, which can be seen in
Table 6 and
Table 7.
To the extent that senior management better perceived and understood the events that occurred in the production process, they could project with a higher level of confidence the impact of the implementation of improvement options, authorizing resources more quickly.
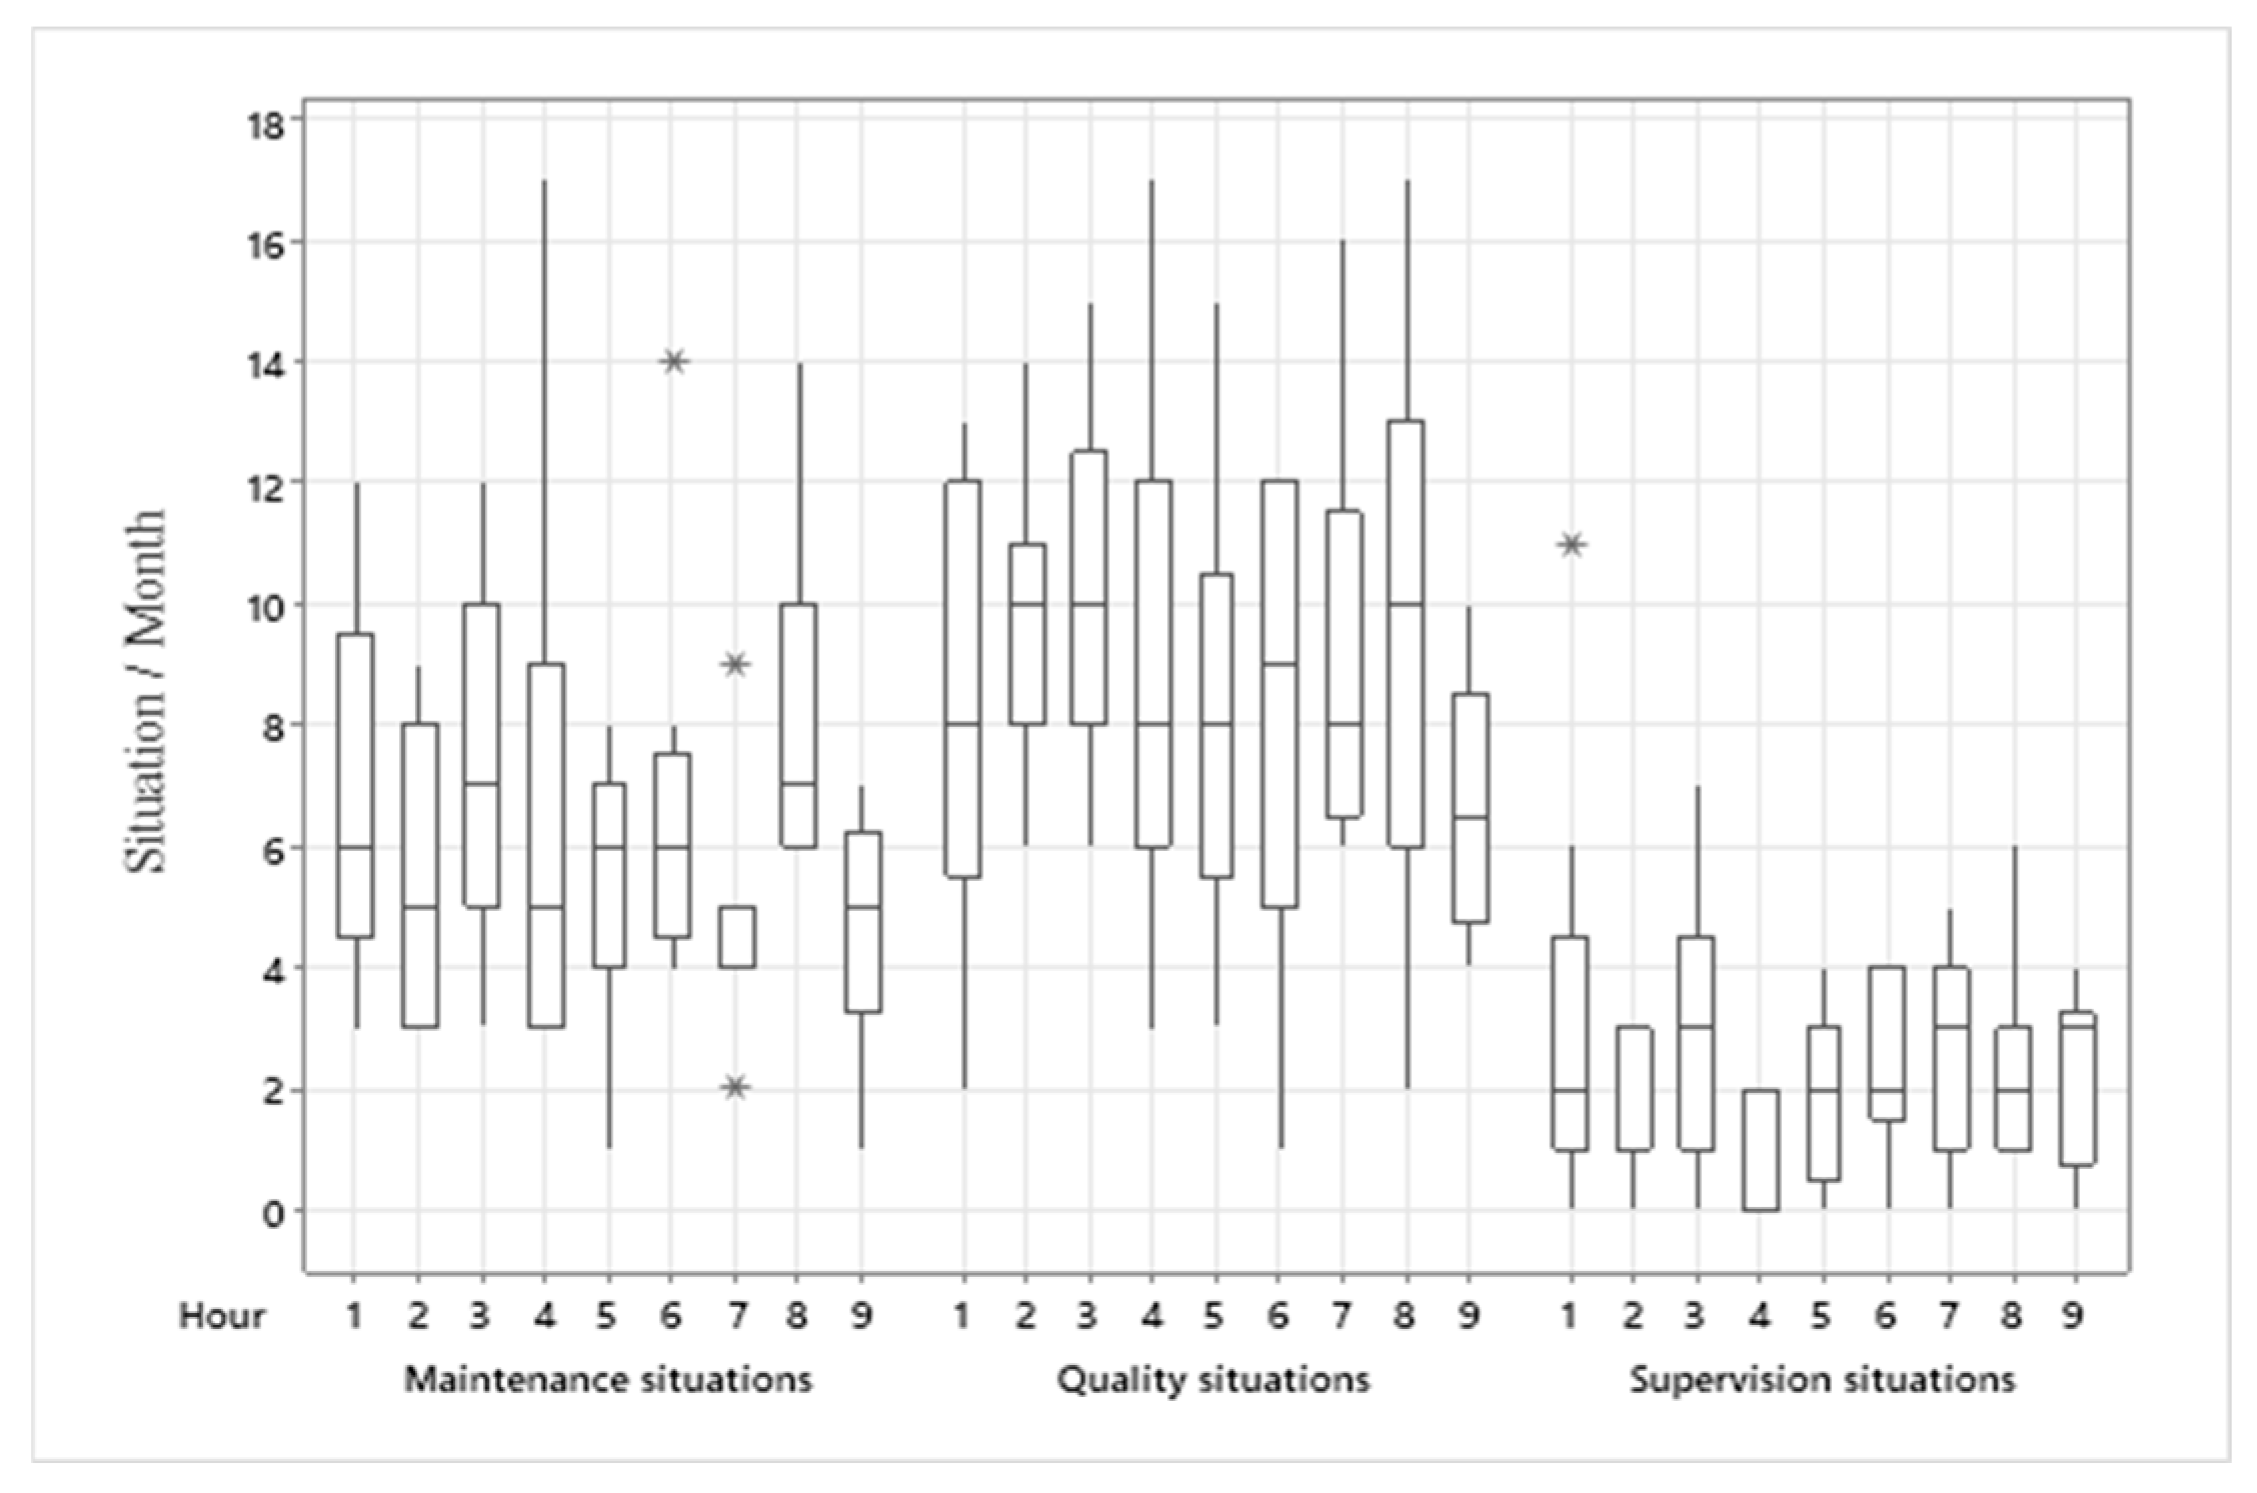
As the model is put into action, two main products are generated: action plans and learning, a decrease in the number of situations that require coordination is also highlighted, as shown in
Figure 8,
Figure 9,
Figure 10,
Figure 11,
Figure 12 and
Figure 13, a product derived from learning is the faster reaction to a known situation, as well as faster coordination to new situations or situational patterns.
In
Figure 13 we can see that there is no behavior that relates the number of situations and the work shift schedule, in
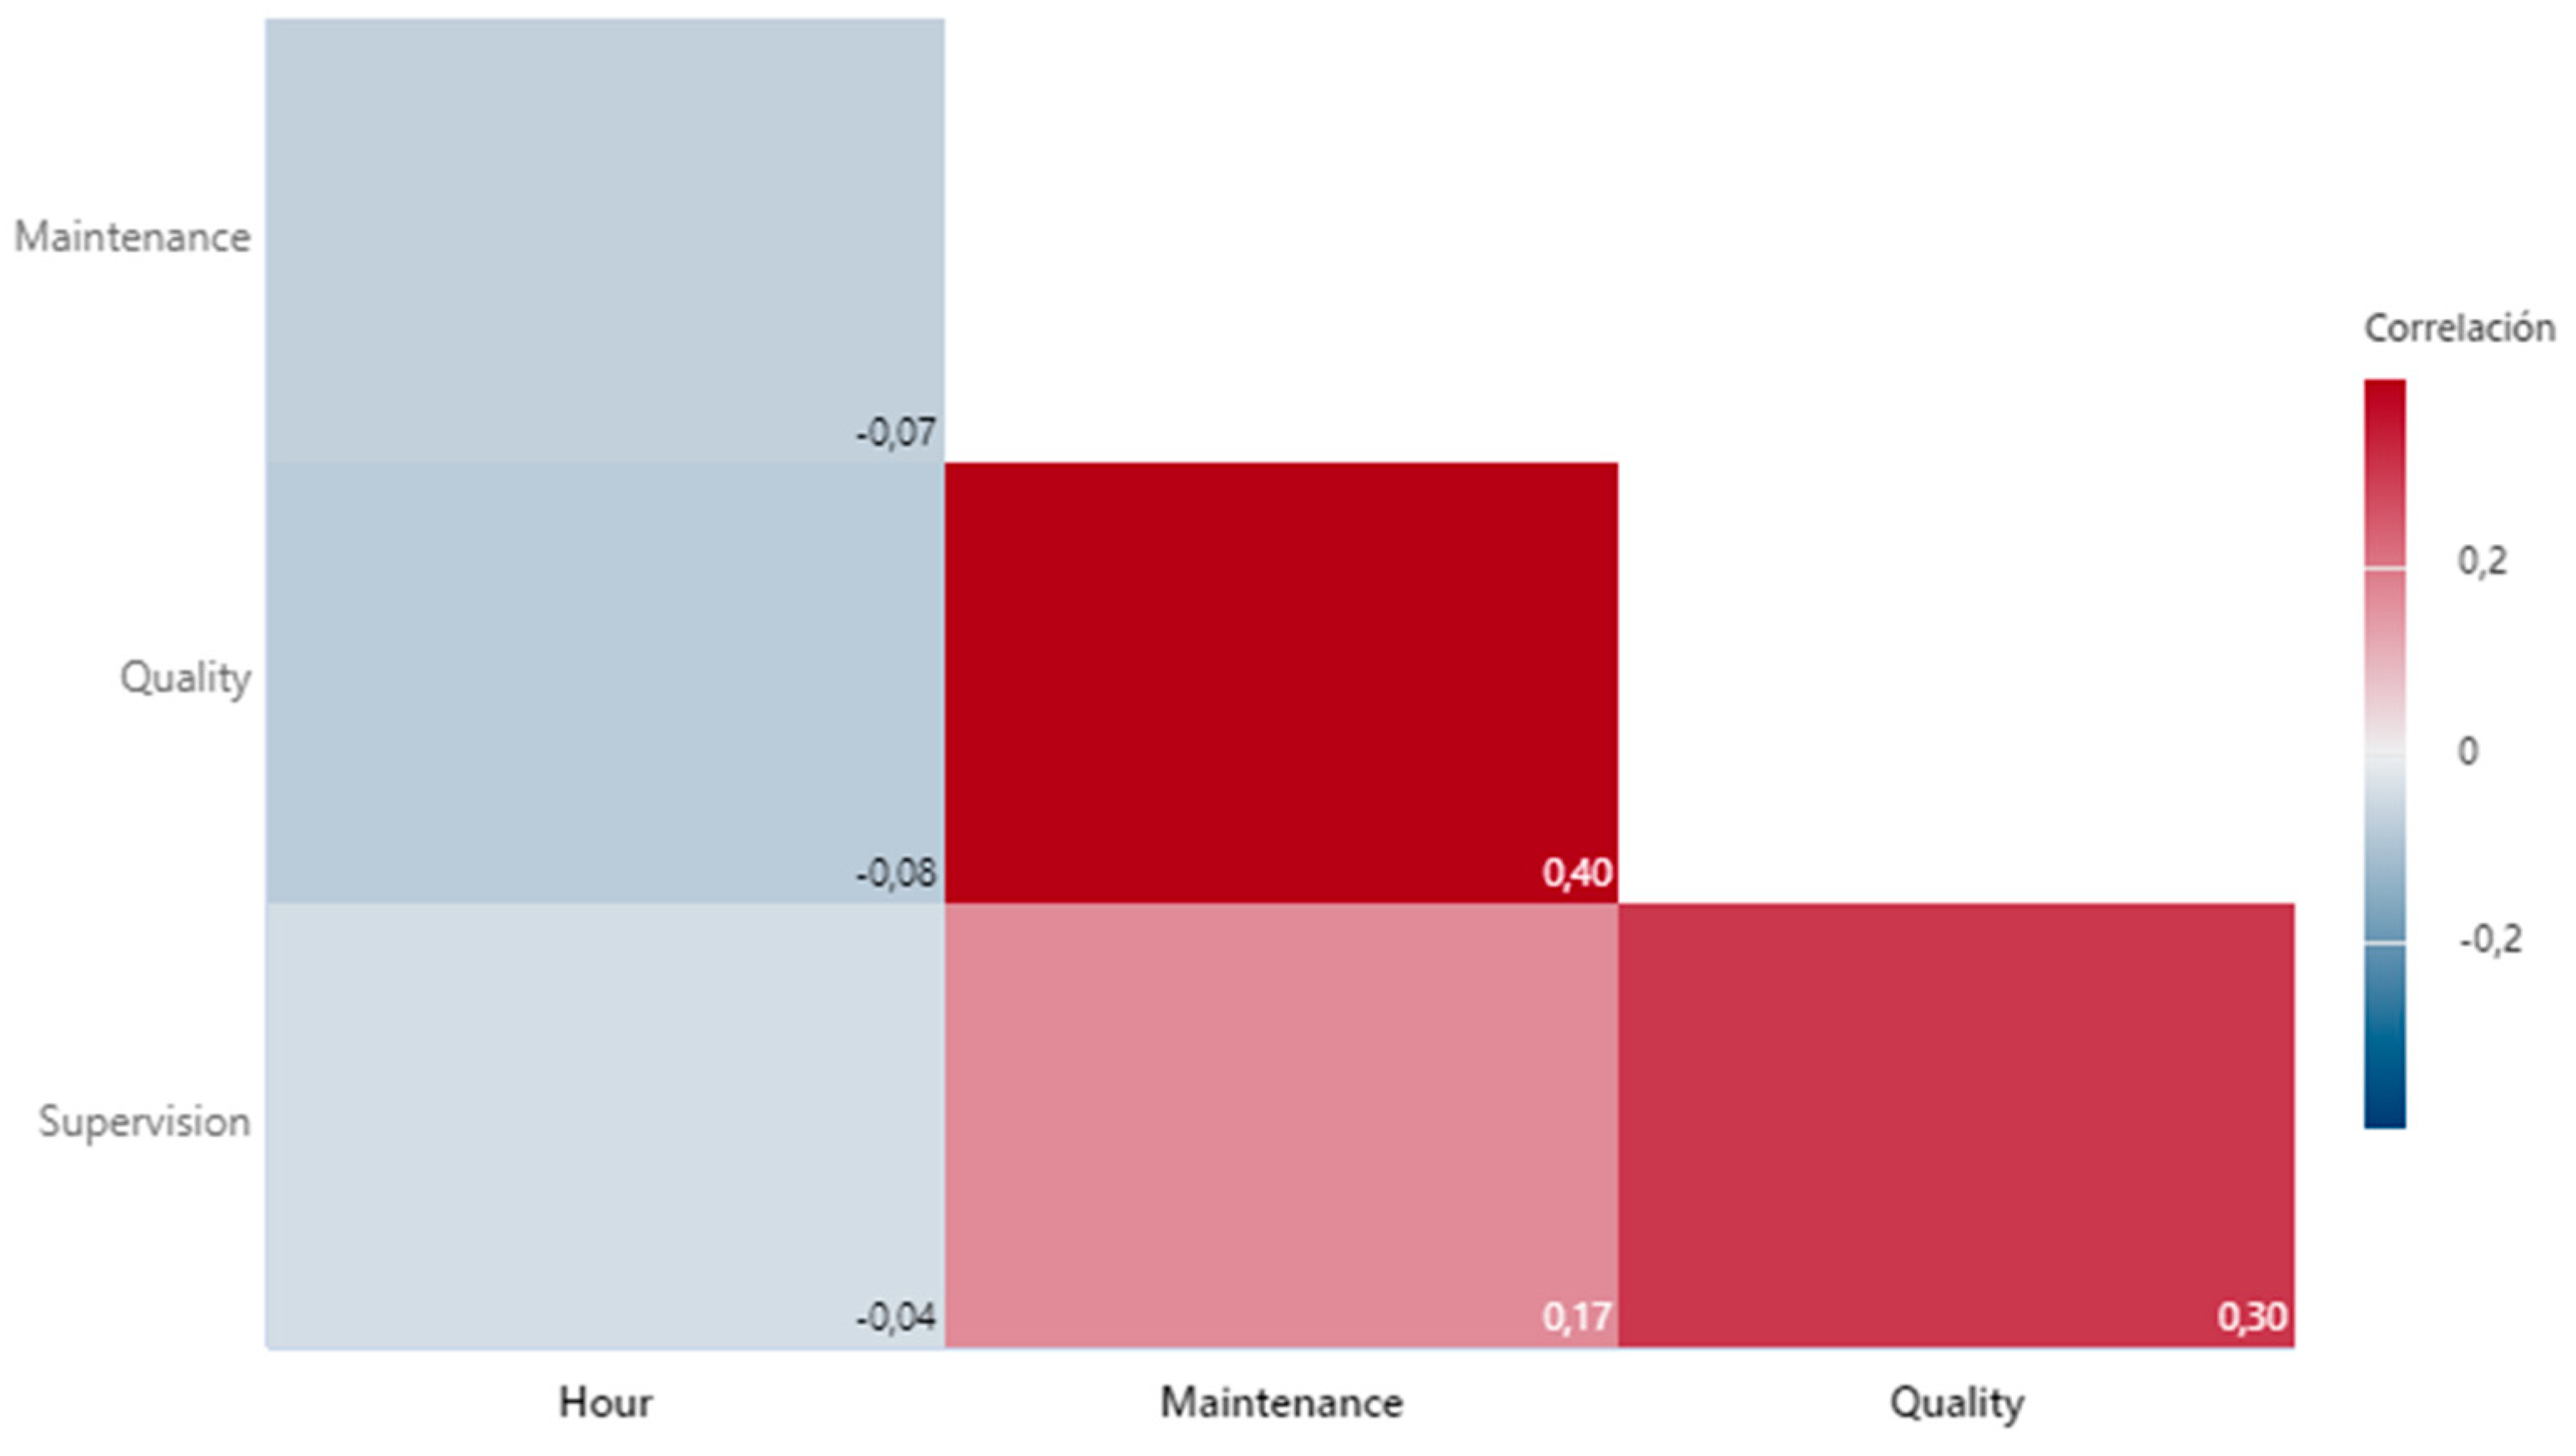
Figure 14 we can see that there is a very low correlation between the time variable (schedule of the shift) and the number of situations in the three coordination groups.
Figure 14 shows a slight positive correlation (r: 0.17) between the number of situations variables in the maintenance group and the supervision group, which would allow us to say that these variables are weakly but positively related. The number of situations in the maintenance group and the quality group presented a positive correlation (r: 0.40), providing evidence that to the extent that there are more situations due to maintenance, there are more situations to coordinate in the quality group. Also, we detected a positive correlation (r: 0.30) between the number of situations between the quality and supervision group.
In
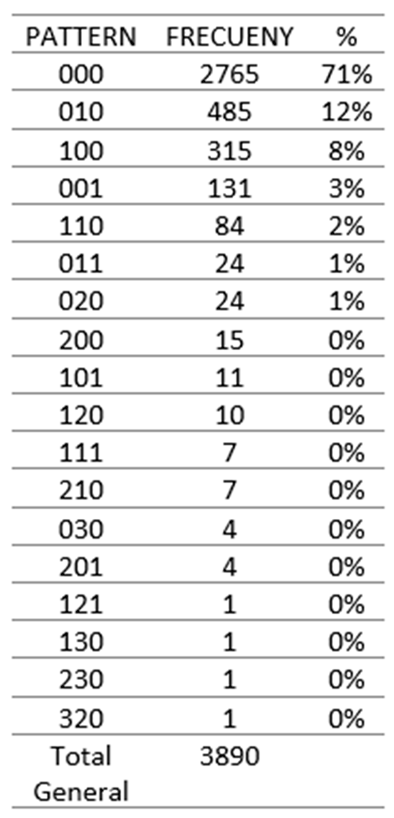
Table 4 we can observe the frequency of the situational patterns per hour, this indicates that 71% of the hours studied a pattern (0 0 0) was presented, which indicates that there were 0 situations in the maintenance group, 0 in the quality group and 0 in the supervision group, the pattern (0 1 0) had a relative percentage frequency of 12%, being the second most frequent pattern and the pattern (1 0 0) is the third most frequent pattern. -account for a 3% probability of occurrence, the other possible combinations together represent a 14% probability of occurrence.
• Stage eight: the periodic meetings with management at the beginning were quite complex due mainly to the low situational awareness that management had of the events and scenarios faced by the operations management and the tactical and operational areas, but as the process progressed , their learning was a valuable catalyst for change, significantly improving the quality of decision making.
8. Conclusion
In this study, a novel approach was devised, merging a qualitative model of situational awareness with the operational principles of a quantitative Proportional, Integral and Derivative method.
We introduced innovation by establishing the concept of "levels of primary and secondary perception," which can be managed based on the design of communication groups. Additionally, we defined cognitive work involving the visualization of a "common or special situational pattern" as a discrete event. This, in turn, facilitates comprehension, learning, and the generation of corrective and preventive action plans, which are created proportionally and integrally and applied to the process derivatively. This holistic approach considers the asymmetry that characterizes information flows in productive processes but strategically delivers a level of symmetry in communication within groups, thereby increasing levels of situational awareness in leadership, streamlining resource allocation, and consequently, improving the system's responsiveness to deviations in process variables. The latter was achieved by designing an integrated communication system comprising operational, tactical, and strategic levels within a company.
The group situational awareness model proposed in this document and implemented in an industrial process obtained a success story by efficiently coordinating the information provided by both the external and internal environment to the process, generating a virtuous circle of information, which allowed achieving a very relevant level of productivity improvement and reduction of the rejected (waste).
The action researcher methodology was perfectly adjusted to the situation under study; participating directly with the teams, being mainly a facilitating agent and main source of theoretical knowledge applicable to process management.
The WhatsappMT tool efficiently met the required needs, despite being a generic and not very specific application, it managed to be useful in all the situations to be coordinated.
Real-time operations management is a challenge for directors and the entire operation team, but at the same time it provides great benefits by more directly connecting the operation with the strategy.
Author Contributions
Methodology, L.Q.; supervision A.O.; Investigation & Writing C.O.
Funding
This paper was supported by the Department of Industrial Engineering of Universidad de Santiago de Chile.
Data Availability Statement
All data generated or analyzed during this study are included in this manuscript.
Acknowledgments
We want to thank Chilean entrepreneurs Jaime Arrieta and José Cox for facilitating the development of this research in their company MAFORSA.
Conflicts of Interest
The authors declare no conflict of interest.
References
- Wagner T, Herrmann C, Thiede S (2017) Industry 4.0 Impacts on Lean Production Systems. Procedia CIRP 63:125–131. [CrossRef]
- Neumann WP, Winkelhaus S, Grosse EH, Glock CH (2021) Industry 4.0 and the human factor – A systems framework and analysis methodology for successful development. Int J Prod Econ 233:107992. [CrossRef]
- Leng J, Sha W, Lin Z, et al (2023) Blockchained smart contract pyramid-driven multi-agent autonomous process control for resilient individualised manufacturing towards Industry 5.0. Int J Prod Res 61:4302–4321. [CrossRef]
- Alves J, Lima TM, Gaspar PD (2023) Novel Design of Assistive Technologies Based on the Interconnection of Motion Capture and Virtual Reality Systems to Foster Task Performance of the Ageing Workforce. Designs (Basel) 7:23. [CrossRef]
- Peruzzini M, Prati E, Pellicciari M (2023) A framework to design smart manufacturing systems for Industry 5.0 based on the human-automation symbiosis. Int J Comput Integr Manuf 1–18. [CrossRef]
- Grosse EH, Sgarbossa F, Berlin C, Neumann WP (2023) Human-centric production and logistics system design and management: transitioning from Industry 4.0 to Industry 5.0. Int J Prod Res 61:7749–7759. [CrossRef]
- van Oudenhoven B, Van de Calseyde P, Basten R, Demerouti E (2023) Predictive maintenance for industry 5.0: behavioural inquiries from a work system perspective. Int J Prod Res 61:7846–7865. [CrossRef]
- Heckmann I, Comes T, Nickel S (2015) A critical review on supply chain risk – Definition, measure and modeling. Omega (Westport) 52:119–132. [CrossRef]
- Marhavilas PK, Koulouriotis D, Gemeni V (2011) Risk analysis and assessment methodologies in the work sites: On a review, classification and comparative study of the scientific literature of the period 2000–2009. J Loss Prev Process Ind 24:477–523. [CrossRef]
- WHEELER DJ; CDS (2010) Understanding Statistical Process Control, 3a. SPC Press, Knoxville - Tennessee.
- Musulin E, Roda F, Basualdo M (2012) Ontology-based expert system for process supervision. pp 957–961.
- Bayar N, Darmoul S, Hajri-Gabouj S, Pierreval H (2016) Using immune designed ontologies to monitor disruptions in manufacturing systems. Comput Ind 81:67–81. [CrossRef]
- Yang T, Fan W (2016) Information management strategies and supply chain performance under demand disruptions. Int J Prod Res 54:8–27. [CrossRef]
- Endsley MR (1988) Design and Evaluation for Situation Awareness Enhancement. Proceedings of the Human Factors Society Annual Meeting 32:97–101. [CrossRef]
- Feng Y-H, Teng T-H, Tan A-H (2009) Modelling situation awareness for Context-aware Decision Support. Expert Syst Appl 36:455–463. [CrossRef]
- Endsley MR (2016) Designing for Situation Awareness. CRC Press.
- Martinez JG, Yeung T, Sacks R, et al (2023) Situational Awareness in Construction Using a Serious Game. J Constr Eng Manag 149:. [CrossRef]
- Ghaderi C, Esmaeili R, Ebadi A (2022) Situation awareness in intensive care unit nurses: A qualitative directed content analysis. Front Public Health 10:. [CrossRef]
- Lu T, Li Y, Zhou C, et al (2023) The Influence of Emotion Induced by Accidents and Incidents on Pilots’ Situation Awareness. Behavioral Sciences 13:231. [CrossRef]
- Huang Y, Chen L, Chen P, et al (2020) Ship collision avoidance methods: State-of-the-art. Saf Sci 121:451–473. [CrossRef]
- Tan L, Yu K, Ming F, et al (2022) Secure and Resilient Artificial Intelligence of Things: A HoneyNet Approach for Threat Detection and Situational Awareness. IEEE Consumer Electronics Magazine 11:69–78. [CrossRef]
- Laurila-Pant M, Pihlajamäki M, Lanki A, Lehikoinen A (2023) A protocol for analysing the role of shared situational awareness and decision-making in cooperative disaster simulations. International Journal of Disaster Risk Reduction 86:103544. [CrossRef]
- Huffman S, Crundall D, Smith H, Mackenzie A (2022) Situation Awareness in sports: A scoping review. Psychol Sport Exerc 59:102132. [CrossRef]
- Mohammadfam I, Mirzaei Aliabadi M, Soltanian AR, et al (2019) Investigating interactions among vital variables affecting situation awareness based on Fuzzy DEMATEL method. Int J Ind Ergon 74:102842. [CrossRef]
- Bosua R, Venkitachalam K (2015) Fostering Knowledge Transfer and Learning in Shift Work Environments. Knowledge and Process Management 22:22–33. [CrossRef]
- Endsley MR (2023) Supporting Human-AI Teams:Transparency, explainability, and situation awareness. Comput Human Behav 140:107574. [CrossRef]
- McQuail D ;Windahl, S (1997) Communication models for the study of mass communications, 3rd ed. Eunsa, Navarra.
- McQuail D (1985) Sociology of Mass Communication. Annu Rev Sociol 11:93–111. [CrossRef]
- Konak A, Kulturel-Konak S (2019) Impact of Online Teamwork Self-Efficacy on Attitudes Toward Teamwork. International Journal of Information Technology Project Management 10:1–17. [CrossRef]
- Roghanizad MM, Turetken O (2024) Resource-seeking and media choice process: A case of irrational decision making. Int J Inf Manage 74:102714. [CrossRef]
- Bagire V, Byarugaba J, Kyogabiirwe J (2015) Organizational meetings: management and benefits. Journal of Management Development 34:960–972. [CrossRef]
- Harolds J (2011) Planning and Conducting Meetings Effectively, Part I. Clin Nucl Med 36:1106–1108. [CrossRef]
- Queiroz ACM, Lee AY, Luo M, et al (2023) Too tired to connect: Understanding the associations between video-conferencing, social connection and well-being through the lens of zoom fatigue. Comput Human Behav 149:107968. [CrossRef]
- Helou RI, Waltmans–den Breejen CM, Severin JA, et al (2022) Use of a smartphone app to inform healthcare workers of hospital policy during a pandemic such as COVID-19: A mixed methods observational study. PLoS One 17:e0262105. [CrossRef]
- Urien B, Erro-Garcés A, Osca A (2019) WhatsApp usefulness as a communication tool in an educational context. Educ Inf Technol (Dordr) 24:2585–2602. [CrossRef]
- Kasim NM, Fauzi MA, Yusuf MF, Wider W (2022) The Effect of WhatsApp Usage on Employee Innovative Performance at the Workplace: Perspective from the Stressor–Strain–Outcome Model. Behavioral Sciences 12:456. [CrossRef]
- Ortiz C, Ortiz-Peregrina S, Castro JJ, et al (2018) Driver distraction by smartphone use (WhatsApp) in different age groups. Accid Anal Prev 117:239–249. [CrossRef]
- Richter S, Waizenegger L, Steinhueser M, Richter A (2019) Knowledge Management in the Dark. International Journal of Knowledge Management 15:1–19. [CrossRef]
- Agh H, Ramsin R (2016) A pattern-based model-driven approach for situational method engineering. Inf Softw Technol 78:95–120. [CrossRef]
- Sartal A, Llach J, León-Mateos F (2022) “Do technologies really affect that much? exploring the potential of several industry 4.0 technologies in today’s lean manufacturing shop floors.” Operational Research 22:6075–6106. [CrossRef]
- Grunig JE, Grunig LA, Ferrari MA (2015) Perspectivas de las Relaciones Públicas: resultados del Excellence Study para la comunicación en las organizaciones. Revista Mediterránea de Comunicación 6:9. [CrossRef]
- Coughlan P, Coghlan D (2002) Action research for operations management. International Journal of Operations and Production Management 22:220–240. [CrossRef]
- Platts KW, Gregory MJ (1990) Manufacturing Audit in the Process of Strategy Formulation. International Journal of Operations & Production Management 10:5–26.
- Quezada LE, López-Ospina HA, Ortiz C, et al (2022) A DEMATEL-based method for prioritizing strategic projects using the perspectives of the Balanced Scorecard. Int J Prod Econ 249:108518. [CrossRef]
|
Disclaimer/Publisher’s Note: The statements, opinions and data contained in all publications are solely those of the individual author(s) and contributor(s) and not of MDPI and/or the editor(s). MDPI and/or the editor(s) disclaim responsibility for any injury to people or property resulting from any ideas, methods, instructions or products referred to in the content. |
© 2023 by the authors. Licensee MDPI, Basel, Switzerland. This article is an open access article distributed under the terms and conditions of the Creative Commons Attribution (CC BY) license (http://creativecommons.org/licenses/by/4.0/).
