1. Introduction
Agriculture relies heavily on electricity and fossil fuels to produce primary foods such as fruits, vegetables, and cereals. The most significant expenditure of electrical energy is in the early stages of the production chain, including pumping, filtering and injecting water into modernized irrigation systems, purifying and disinfecting water for safe vegetables, and operation of greenhouses. Climate change has led to an increase in the cultivation of crops in greenhouses, where control of ambient conditions, irrigation, and use of pesticides can be done more effectively. This change in the way agriculture is conducted has required the use of electricity. This is a major issue, as many agricultural operations take place in rural areas that lack an electricity distribution grid or have one that is unreliable and poor quality. Therefore, to meet the demand for electricity, diesel generators are often employed, which is not ideal from a sustainability point of view, since fossil fuels should be partially replaced with renewable sources. Here, photovoltaic (PV) technology plays an essential role in creating a more sustainable agricultural system.
The use of PV technology as an alternative to generate clean and renewable electricity has increased in recent years, particularly in the agricultural sector; this has led to the emergence of
agrivoltaics, a new field of research and technology development. Agrivoltaics is focused on the development of integrated systems that allow the simultaneous cultivation of crops and production of PV energy on the same piece of land [
1,
2]. Among the main advantages of agrivoltaics are optimization of land and water use [6,9], crop protection against rare weather conditions such as severe solar radiation and hail storms, rural electrification, and stimulation of economic growth in the local community. In terms of productivity, research reported in [7] shows that partially covered crops with photovoltaic panels—with a reduction 57% in the received light—reduced their productivity only by 19%, and could increase the overall productivity of the soil by 35-73%. A similar result of an increase in global productivity of up to 70% is reported in [8].
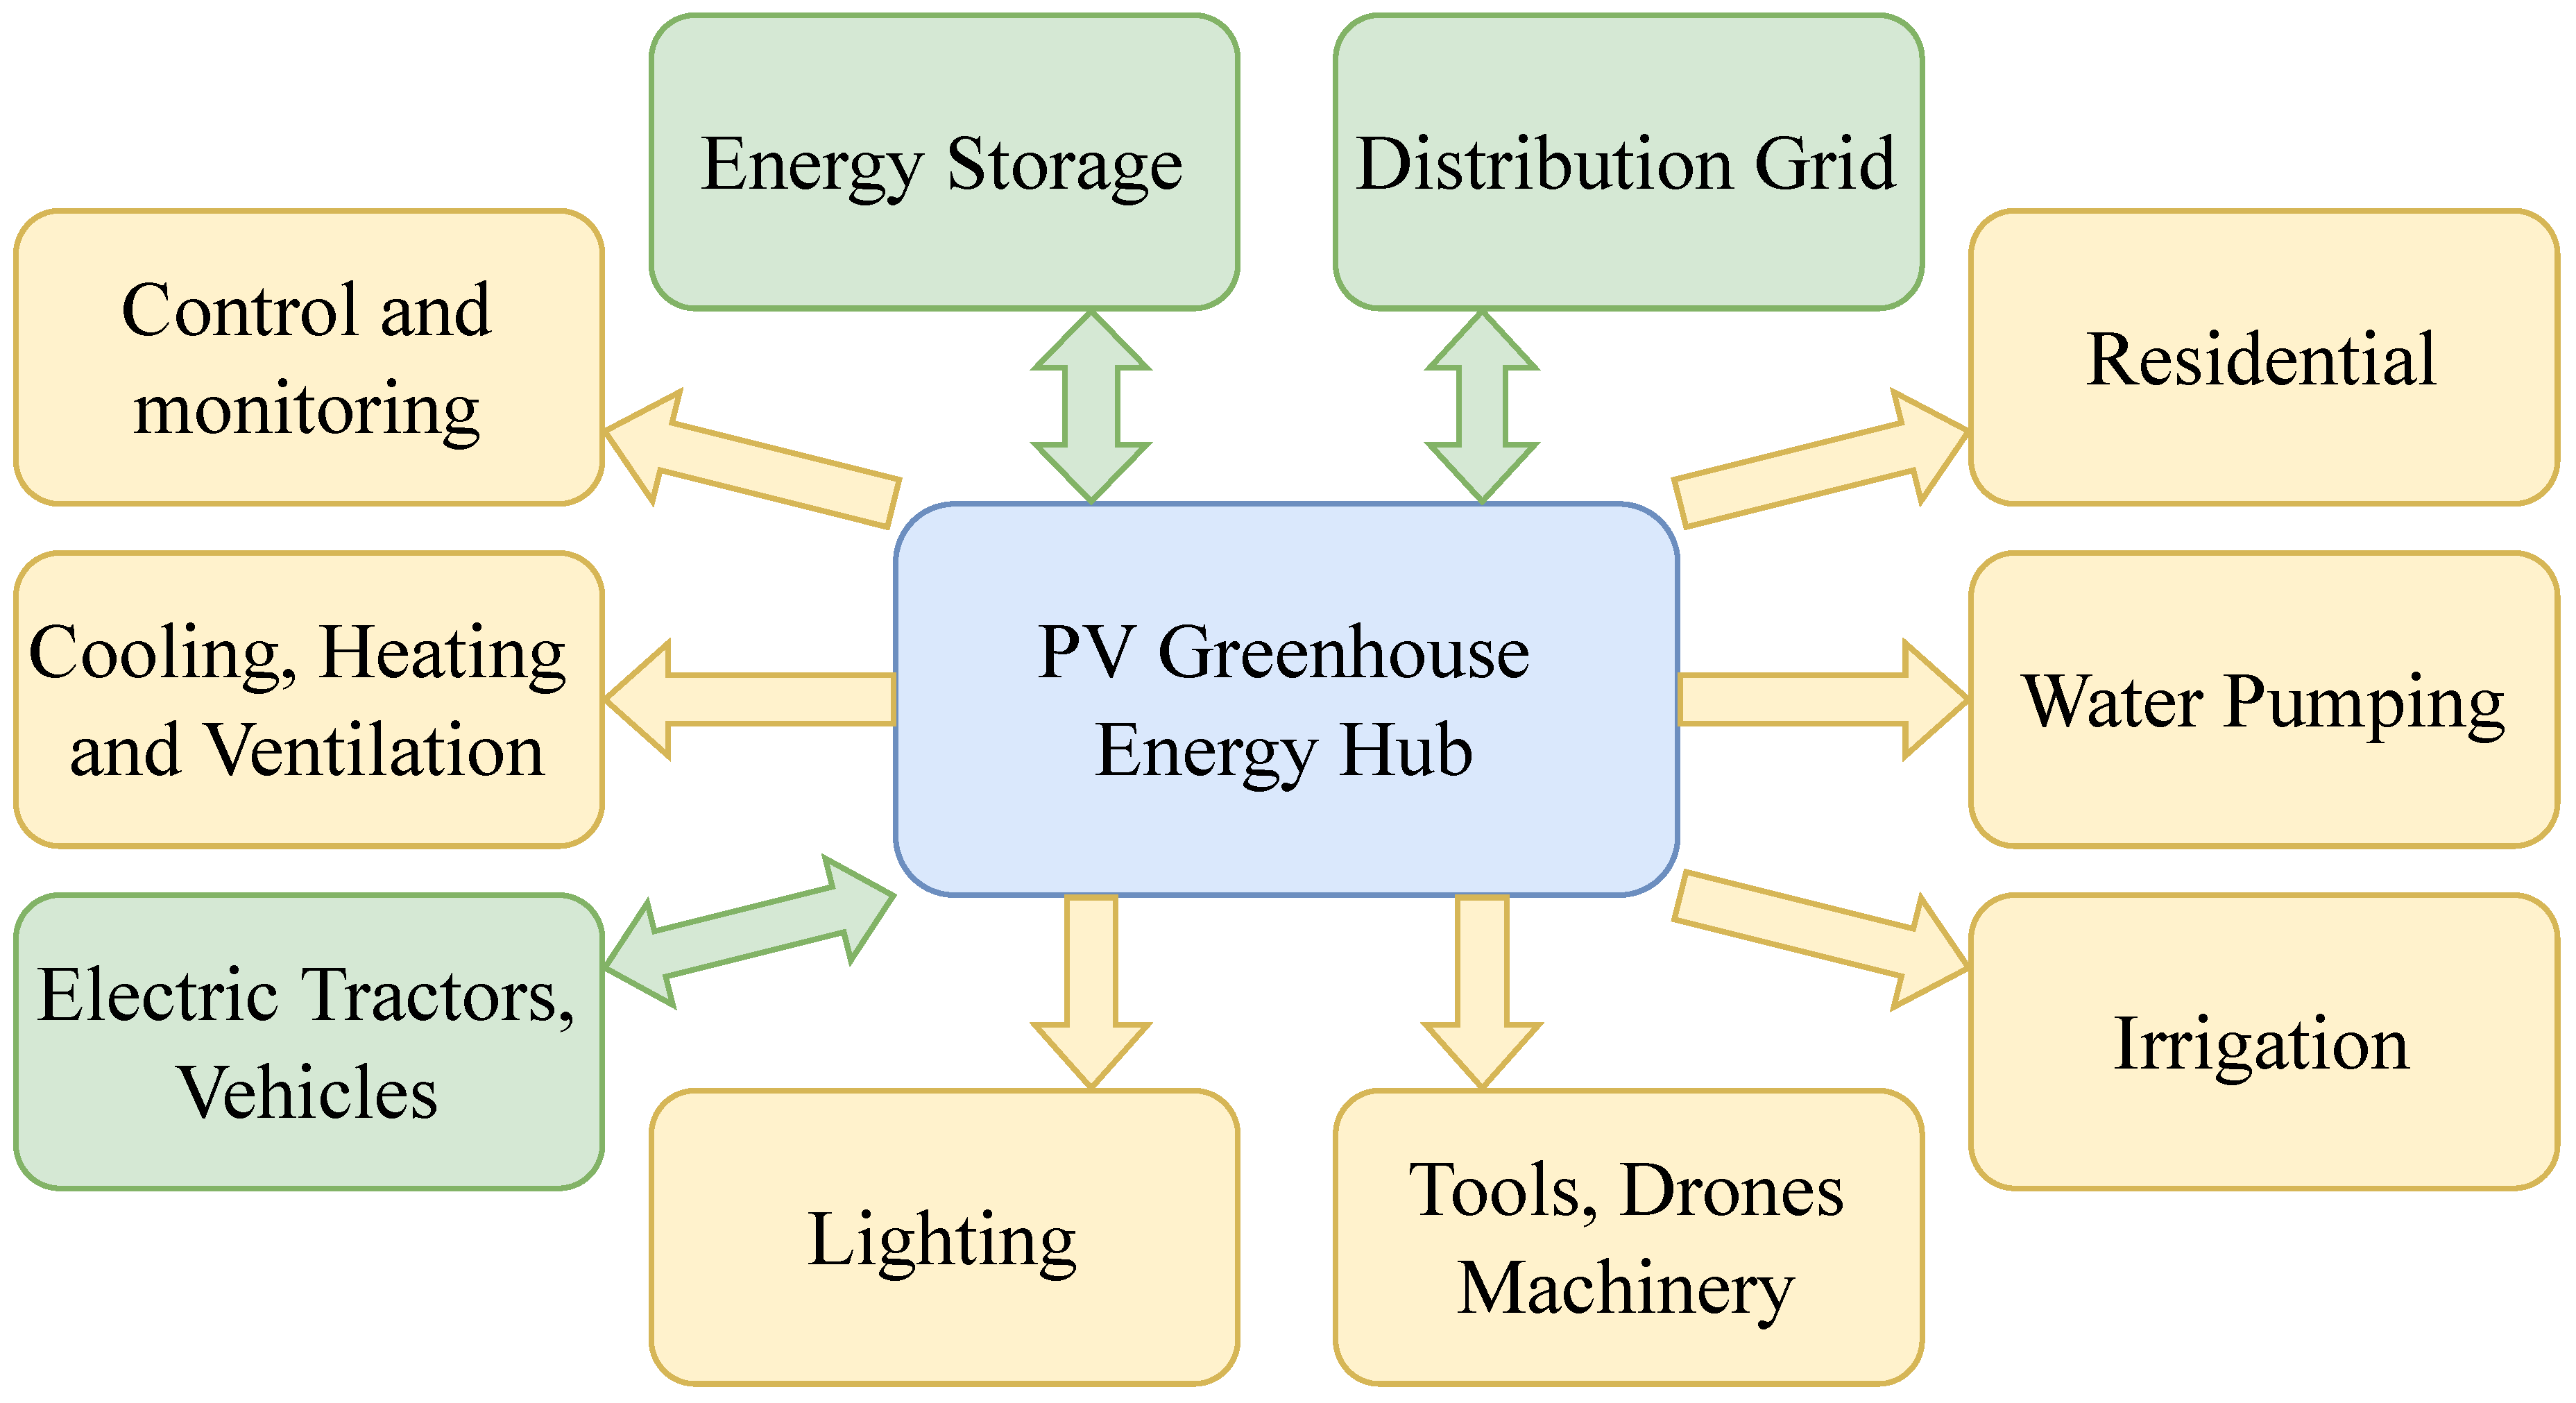
One of the most common uses of agrivoltaics is the installation of conventional PV panels in greenhouses, known as the photovoltaic greenhouse (PVG). As an example, we can look at China, a pioneering country in the research, innovation, and development of agrivoltaics. At the end of 2020, the installed capacity of photovoltaic agriculture projects connected to the grid in China was approximately 7% of the total installed photovoltaic power capacity (250 GW) [12]. It is clear that photovoltaics (PV) is becoming an increasingly popular renewable energy source in China and many other countries. This trend is likely to continue, leading to the construction of more PV plants on agricultural land. As a result, agrivoltaics is likely to become a common practice. To ensure a successful, clean, and sustainable energy-food system, it is essential to understand how to effectively combine PV and agriculture. This research introduces the concept of PVG as an energy hub (EH) for modern agriculture, with the greenhouse playing a significant role [
3,
4,
5].
Figure 1 illustrates the concept with the PVG at its core and the various tasks, loads, and resources connected to it. The arrows in the diagram show the direction of the electrical power flow between the components.
The rest of the work is organized as follows:
Section 2 presents the design of the PV greenhouse and the study to evaluate its energy production. In
Section 3 the elements that form the microgrid of the energy hub are presented. Then the optmization problem is formulated and the predictive control strategy introduced. In addition, as part of the problem formulation, microgrid generation and load profiles are defined. In the last part, study cases, simulations, and results analysis are presented. Finally,
Section 4 summarizes the work and its main findings.
2. Study of the Photovoltaic Greenhouse
Agrivoltaics commonly utilizes conventional PV panels, which are monofacial, meaning they only capture photons on the front side where the PV cells are located. The back of the panel is covered with an opaque protective sheet, which limits the amount of light that can pass through the greenhouse roof. This prevents the entire roof surface from being covered with conventional photovoltaic panels, thus reducing the amount of electricity that can be produced and potentially not meeting the energy demand of the energy-harvesting system. This presents an opportunity for other photovoltaic technologies to be used in greenhouses, either as a replacement or supplement to conventional PV systems, to maximize electricity production. Therefore, for the current design, we propose evaluating the use of semitransparent photovoltaic panels. The rest of this section is based on our previous work [
3], where more detailed information on the design and evaluation of the PVG can be found.
This section focuses on quantifying the energy production loss. Although manufacturers provide the nominal efficiency of their equipment, other environmental factors, such as dirt, can cause a greater decrease in output. In the case of greenhouses, the panels are installed in agricultural areas where the soil is often moved by machinery. Furthermore, it is assumed that the PV panels are not cleaned, as it is not a typical agricultural task and requires water, which is usually scarce. This accumulation of dirt has a major effect on the energy production of a PV system, and is one of the aspects we are looking to evaluate in this study.
2.1. Characterization of the Greenhouse
The greenhouse is located on the Colchagua Campus of the Universidad de O’Higgins (UOH) with the coordinates shown in
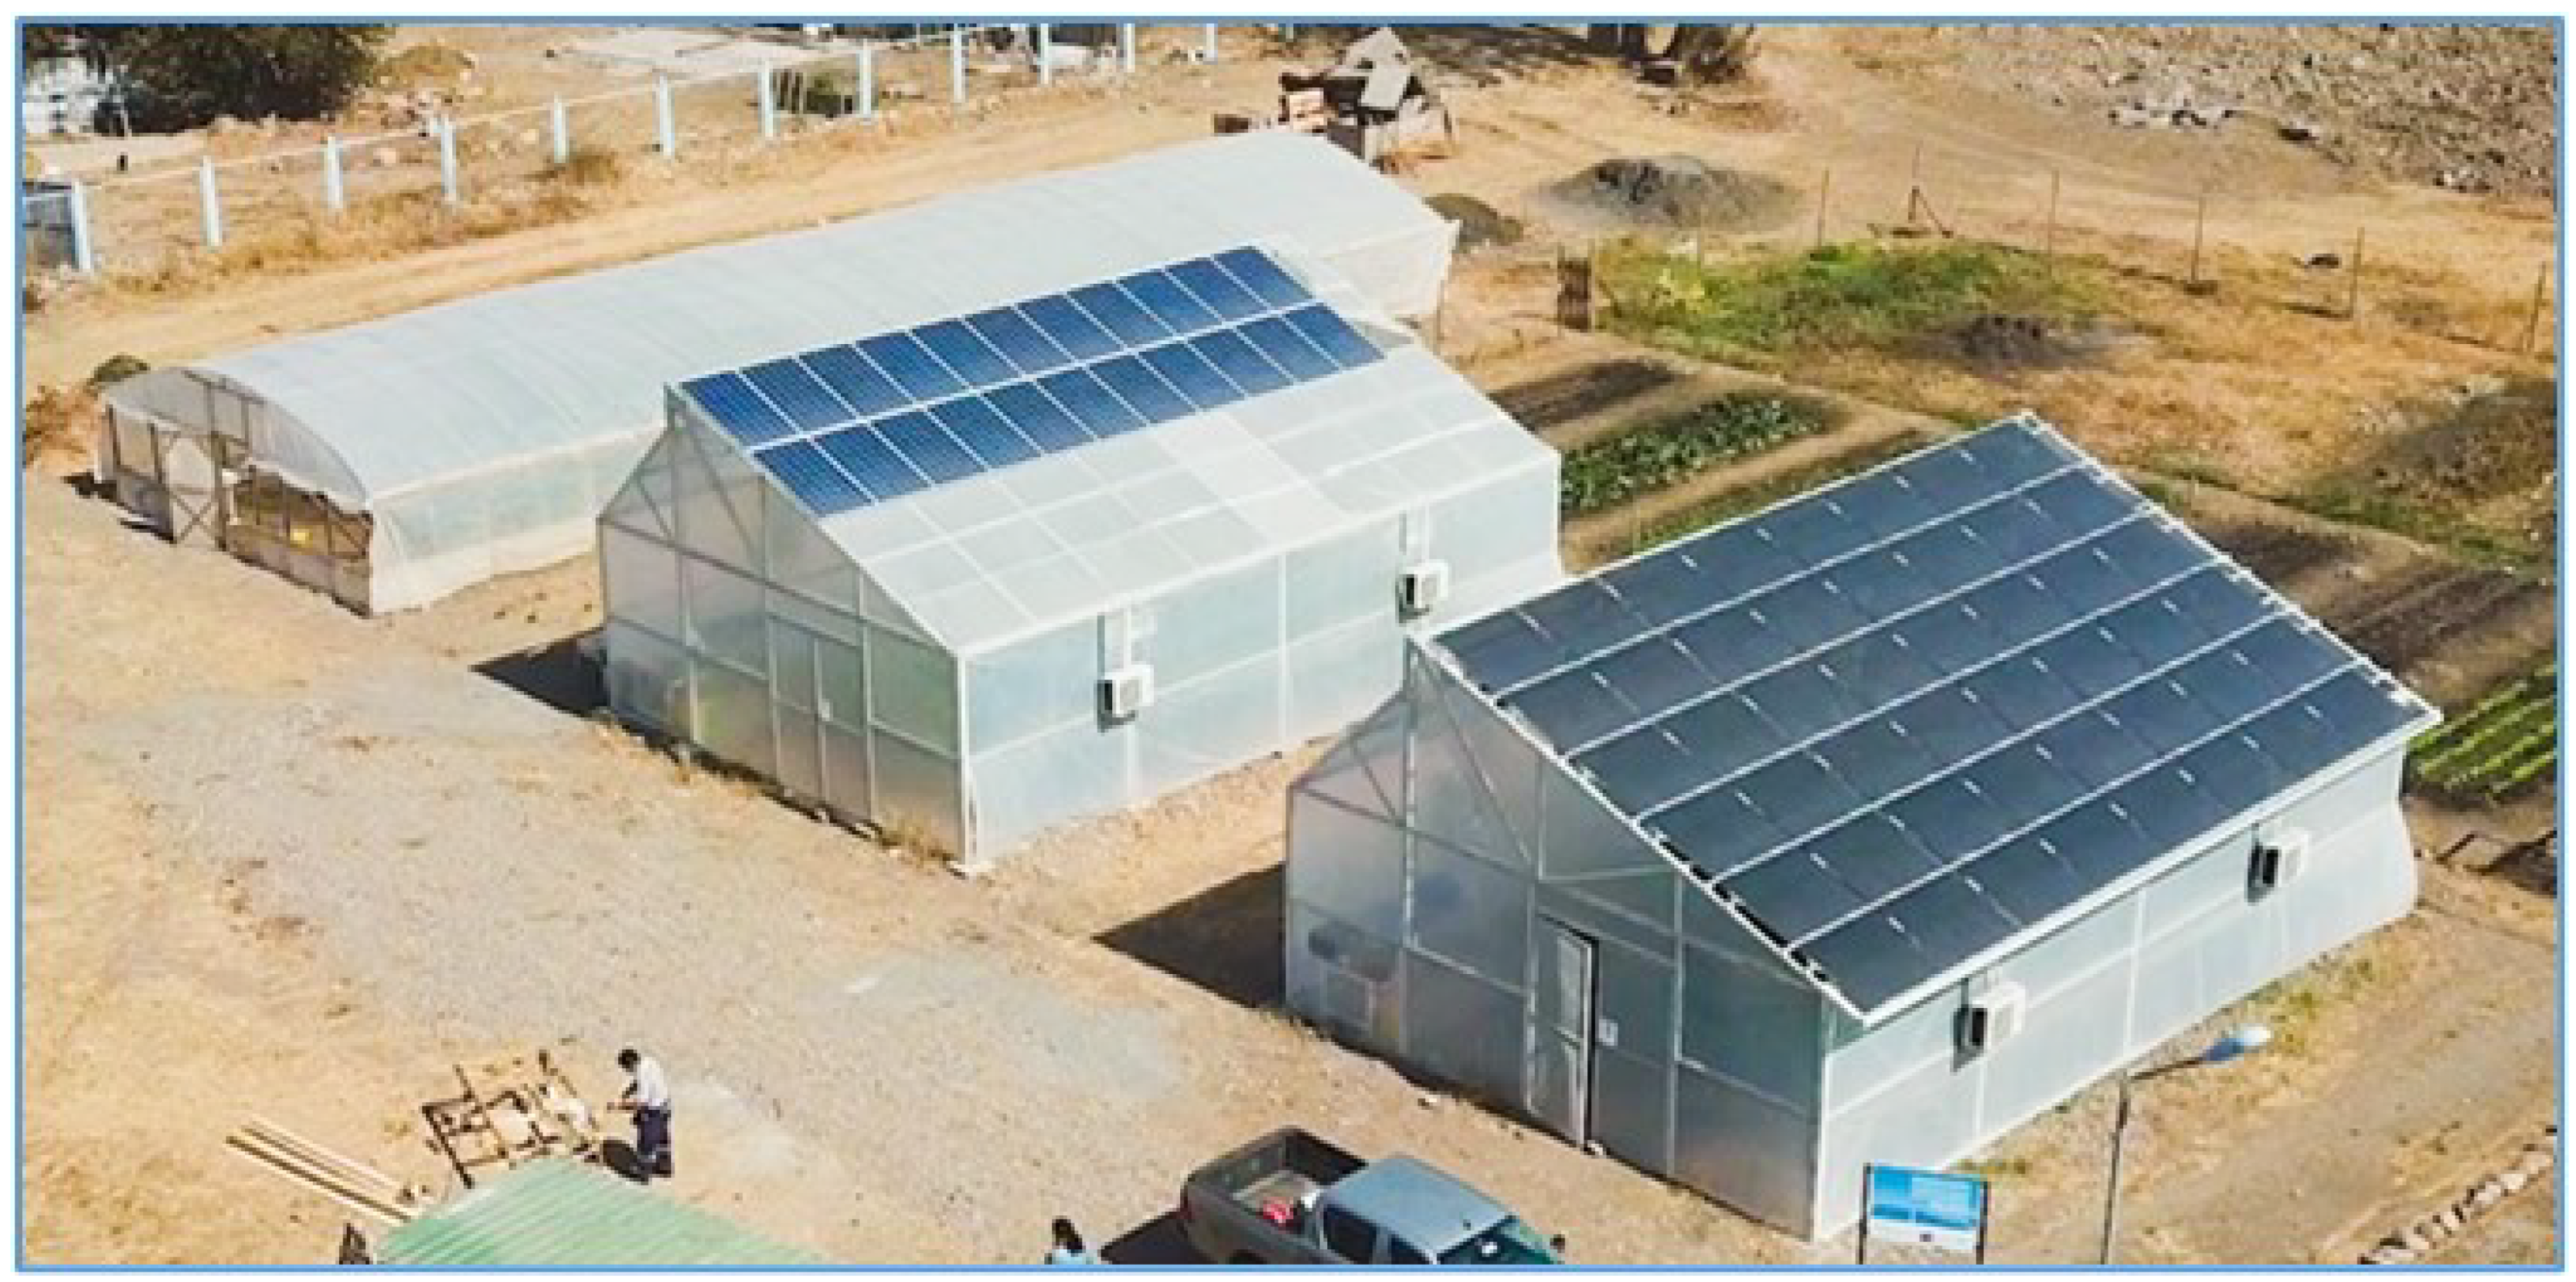
Table 1, and it has 48 glass-glass thin film 20% transparency 110Wp panels that cover its entire roof. The greenhouse is referred to as the semi-transparent photovoltaic greenhouse (ST-PVG).
Figure 2 shows an overview of the facilities: in the bottom right, the ST-PVG that is part of the present study; in the center, the PVG with conventional PV panels; and in the top left, a typical tunnel greenhouse. Note that the last two greenhouses are not part of the present study.
Using the online platform
Solar Explorer a simulation is carried out for ST-PVG, considering the inclination of the roof of 23°, an azimuth angle of -8° representing the orientation of ST-PVG, a temperature coefficient for PV panels of -0.45%/°C, an inverter efficiency of 96% and total losses of 14%. The results are summarized in
Table 2.
2.2. Methodology
The methodology for the analysis of the energy production data includes the following steps:
Read energy production historical data from inverter manufacturer web platform.
Compare the actual annual production of the ST-PVG with the theoretical annual production.
Calculate the difference between the actual data and the theoretical estimate.
Calculate the loss of energy production according to (
1).
Energy production data from the same months but different years are compared to find the year-to-year trend in the difference in energy production. The average difference is then calculated according to the following equation:
where
is the energy produced for a specific month of a specific year,
is the energy produced for the same specific month, but
N years after, then
is the difference of the energy produced in the months previously indicated.
2.3. Results
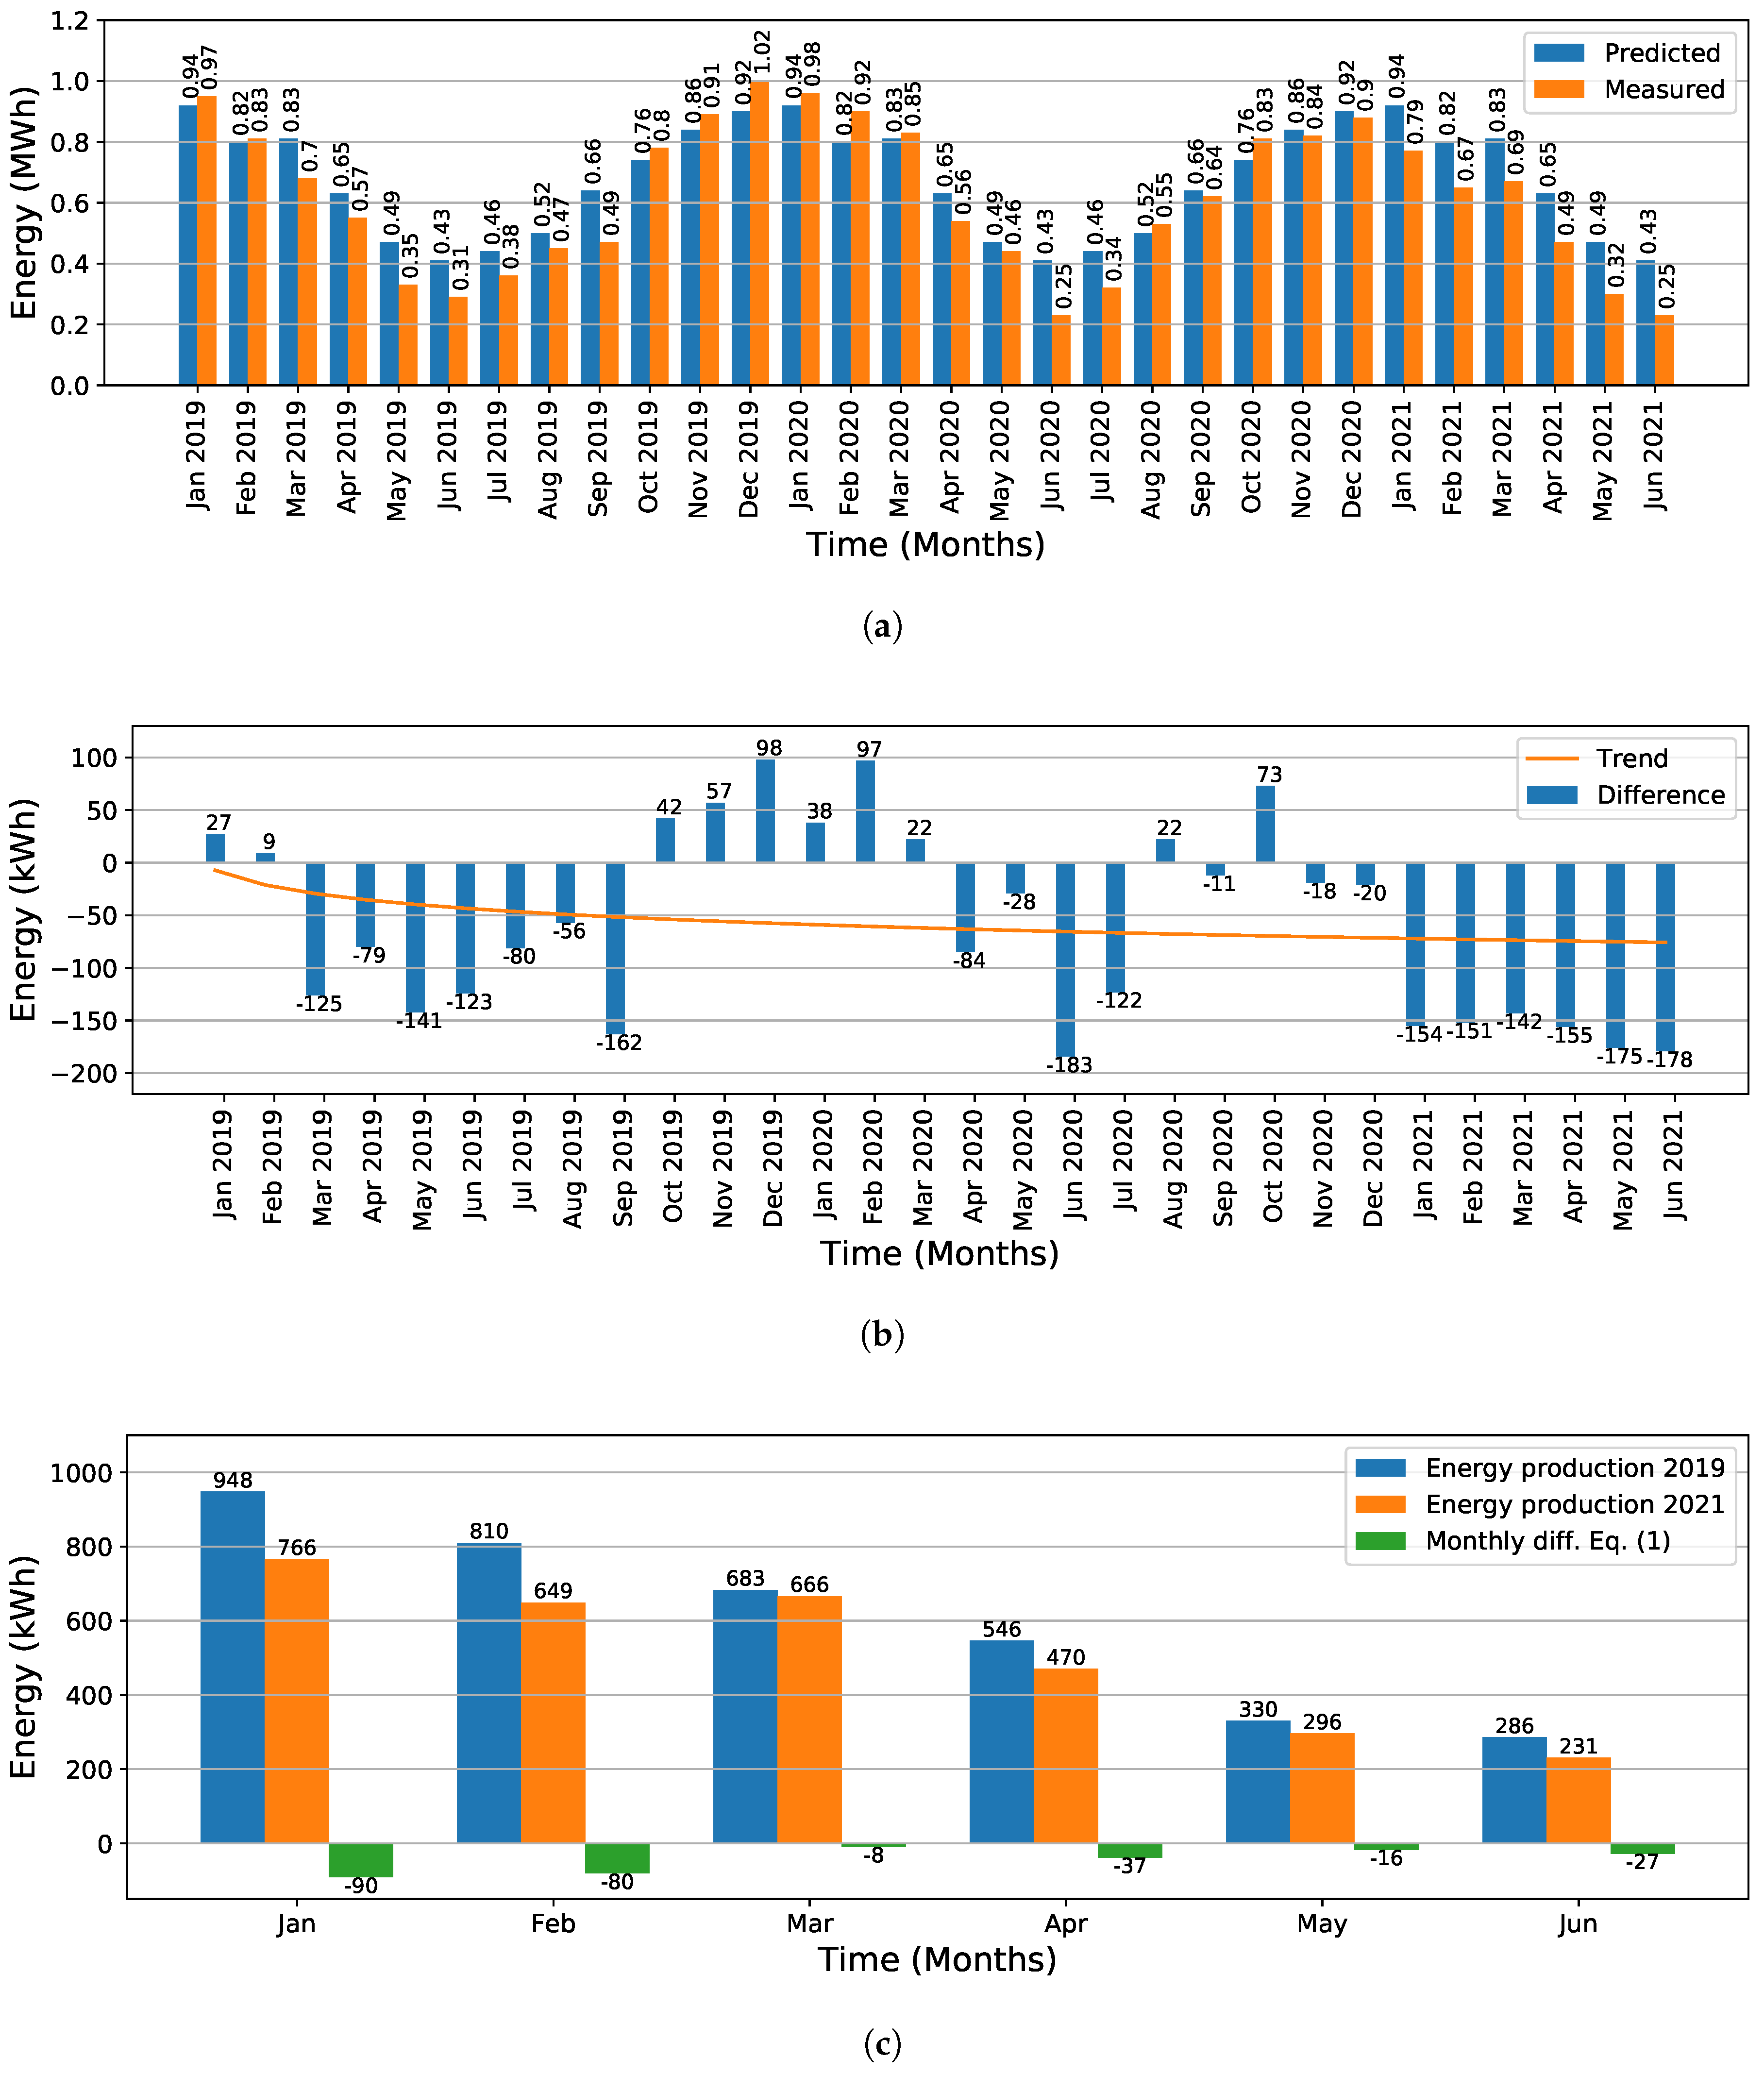
Figure 3 shows the overall results of the energy production analysis.
Figure 3a shows a summary of the predicted monthly energy production using historical data from 2004-2016 (blue bars) and measured data from 2019-2021 (orange bars).
Figure 3b shows the difference between the measured energy production and the predicted production, along with its trend. The average obtained from the differences was -57.4 kWh. This value indicates that, on average, the ST-PVG produces 57.4 kWh less energy than theoretically predicted for each month. Moreover, the trend curve indicates that the negative difference tends to increase over time, showing that the ST-PVG would tend to produce less energy each month than theoretically expected.
Figure 3c shows the data plot used to characterize the energy production loss. The green bars represent the difference calculated with (
1), with the average production loss being -43.8 kWh/month. This monthly average adds up to an estimated annual loss of -525.5 kWh, which represents 6.8% of the energy produced in 2019. A summary of the main results obtained in this section is presented in
Table 3.
3. The PV Greenhouse as Energy Hub
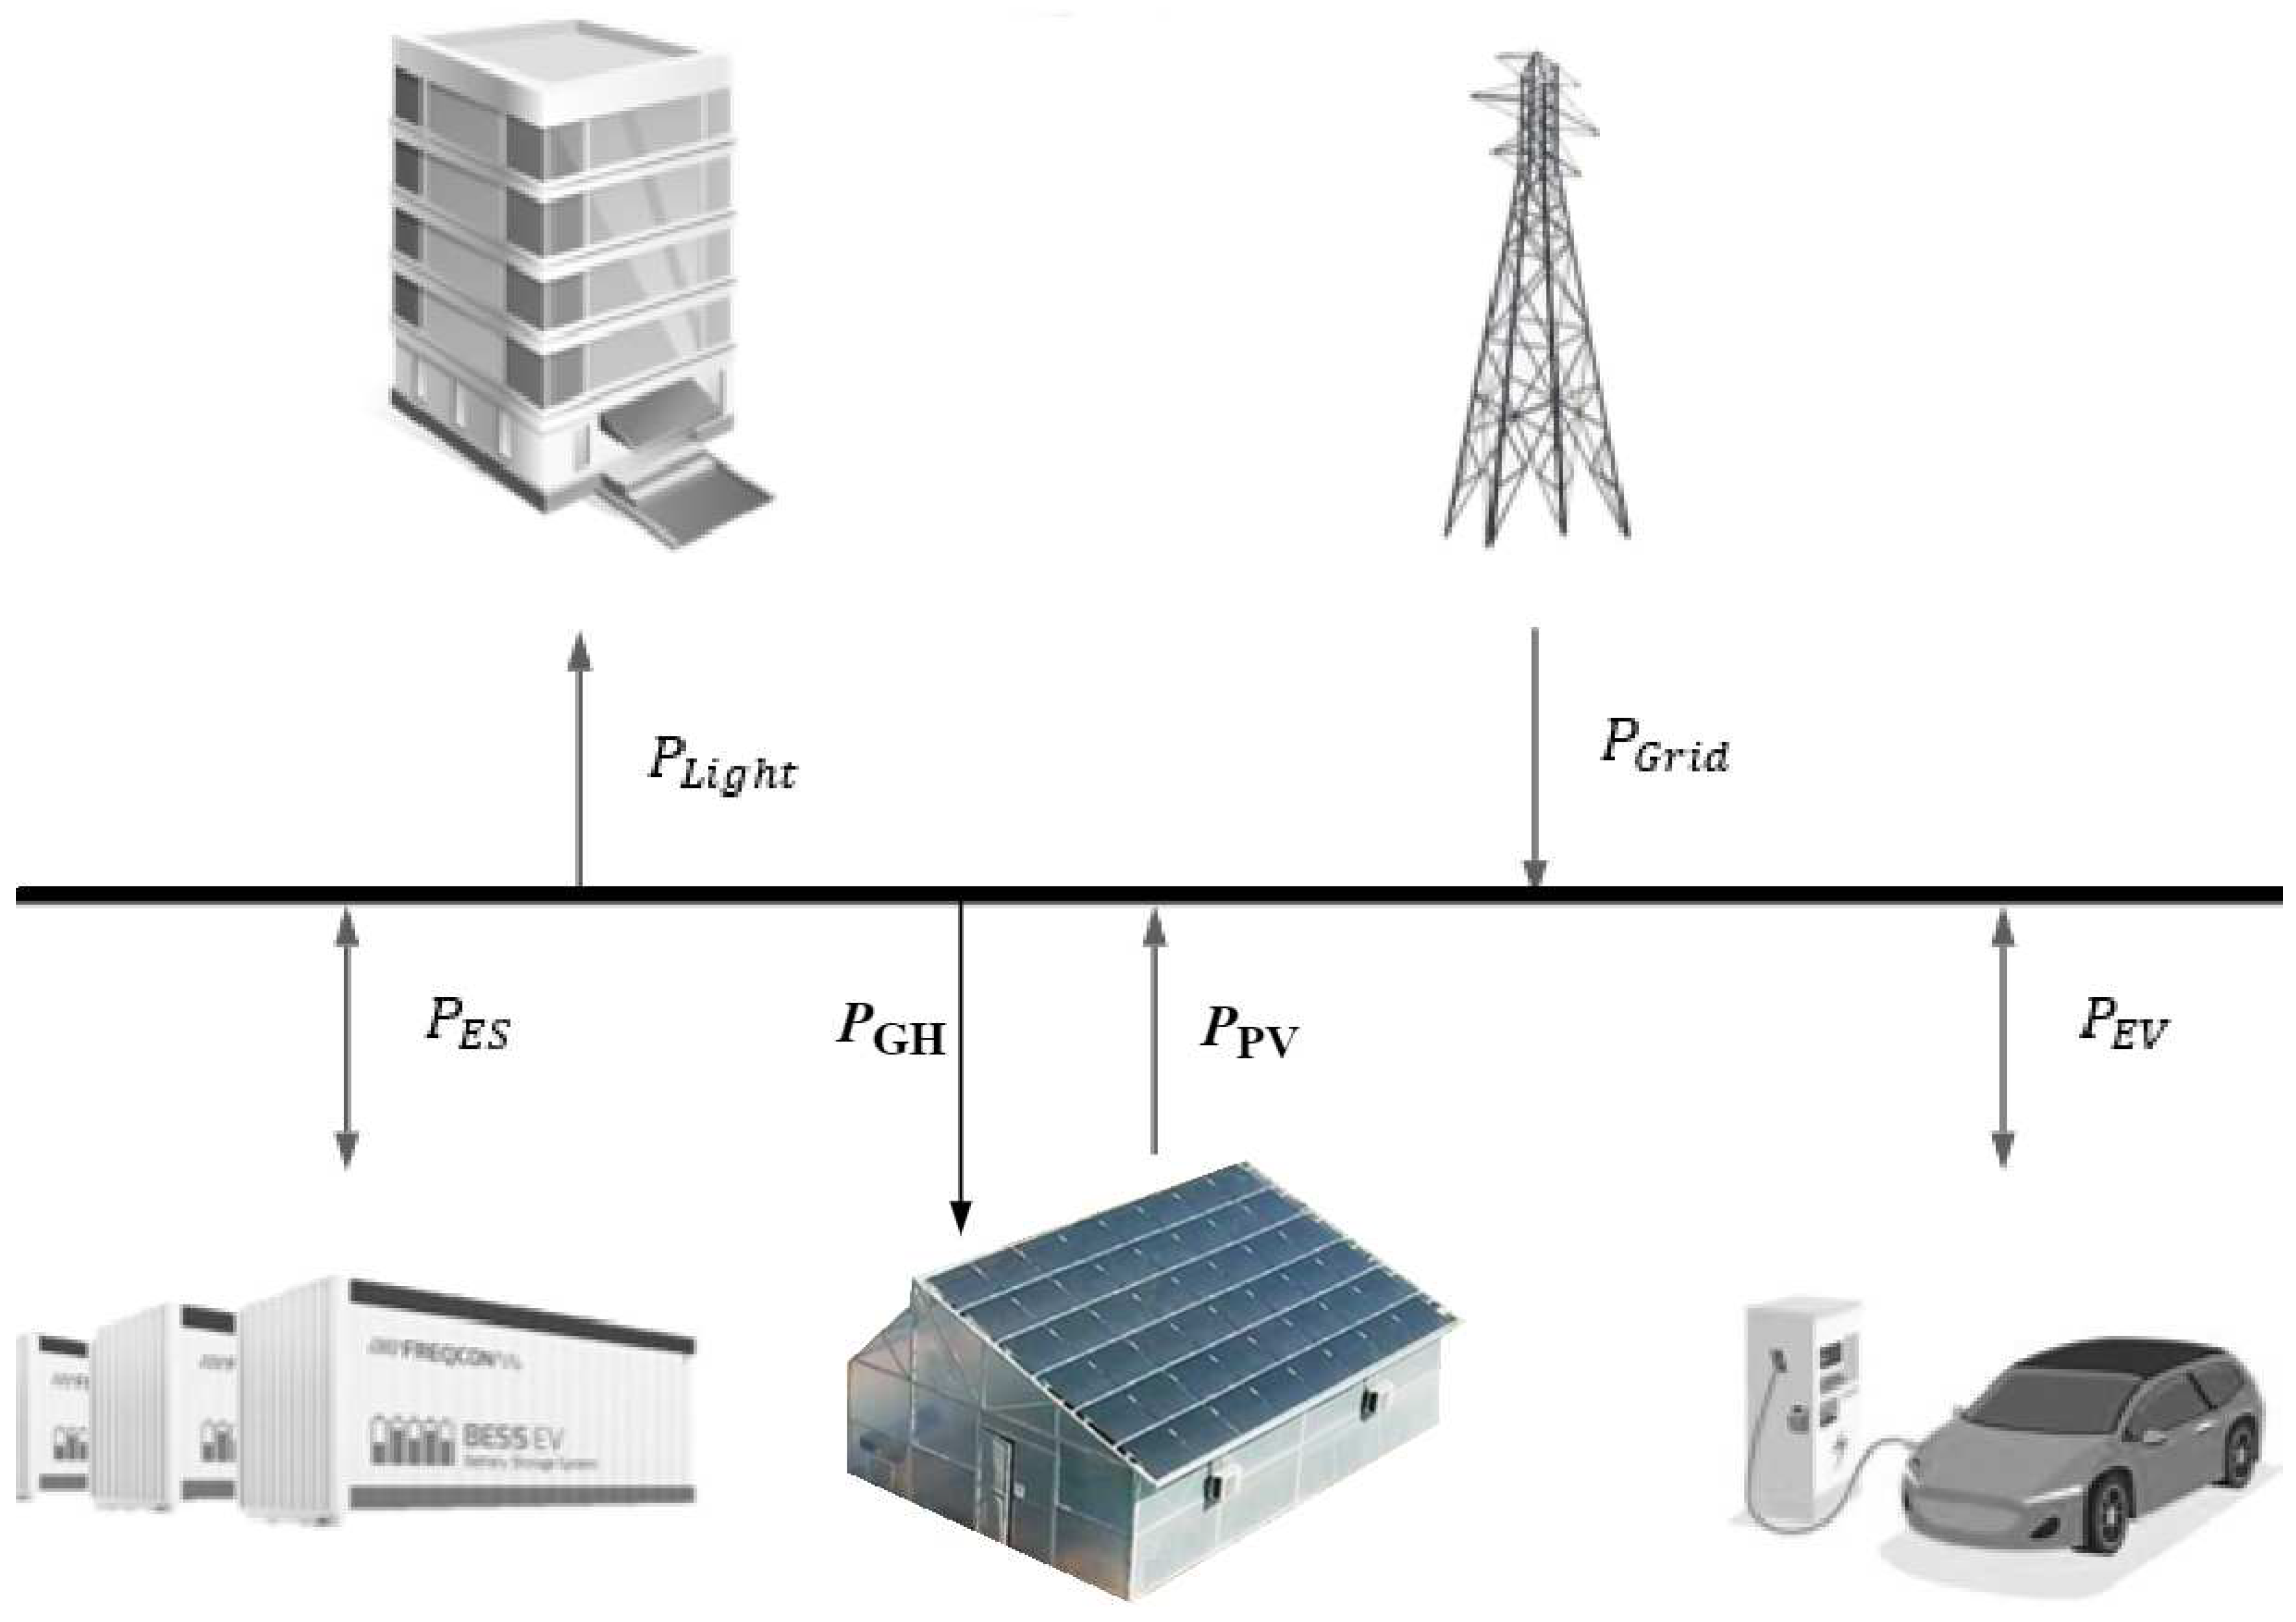
This section aims to model and analyze the performance of the ST-PVG as an energy hub using Model-Based Predictive Control [10]. Therefore, it was considered to study a microgrid [11] with the elements and configuration shown in
Figure 4: irrigation and air conditioning as non-controllable loads, an electric vehicle (EV) charging station as controllable load, and a battery energy storage system (BES).
The powers these receive or deliver to the greenhouse are denoted by and , respectively. Regarding the non-controllable loads, those referring to the lighting of part of the university campus and the greenhouse are distinguished, where their respective powers are denoted as and , respectively. Finally, there is PV generation and a connection to the main grid, where the powers that these deliver to the greenhouse are represented by and , respectively.
3.1. Problem Formulation
3.1.1. Mathematical Modeling
The discrete-time expressions determining the dynamics of the EV charging station and BESS are described by
Equations (
2) and (3) are based on the principle of energy conservation since, in both, the state of charge for the next instant is determined from the sum of the current state of charge and power. On the other hand, expression (4) models the availability of the EV through a binary variable, which is later used to define the operational limits of the EV.
With respect to (
2), it models the evolution of the energy state of the BES subsystem. Therefore, in said expression
symbolizes the state of charge of the batteries at instant
k,
the power that enters or leaves the subsystem at instant
k,
the nominal storage capacity and
the passage of time according to the discretization.
Regarding (3), it describes the dynamics of the energy state of the cars that use the charging station. For this reason, represents the state of charge of the EV at instant k, the power that enters or leaves the vehicle’s battery at instant k, and the nominal storage capacity of the EV.
With respect to (4), this models the availability to load/unload that the EV has at a certain instant k. For this reason, is denoted as the binary variable that represents said availability, which is equal to 1 if the instant k is between and or 0 otherwise. In other words, a value of 1 represents that the car is connected and, therefore, available.
3.1.2. Operational Restrictions
Previously, the dynamics present in the greenhouse were defined, however, these dynamics have physical and operational limitations which are represented as follows:
where (
5) and (6) model the maximum and minimum limits for the battery bank of the BES subsystem and electric cars. Whereas, (7) models the output condition that the EV must meet to ensure a desired energy state at the instant
when it is disconnected. It can be seen that (
5) and (6) limit the energy stored in the batteries of the BES and the EV respectively. On the other hand, (7) guarantees that when disconnecting the EV from the charging station it has to reached a desired energy state
.
On the other hand, the restrictions associated with the power that can be delivered by both subsystems are defined as follows:
where (
8) and (9) represent the maximum power that can be delivered and consumed by the battery energy storage and the EV charging station respectively.
3.1.3. Power Balance
After defining the dynamics and constraints of the subsystems that conform the greenhouse, the power balance inside the greenhouse is established. The sign that accompanies each power term in this balance is given by the directions of the energy arrows depicted in
Figure 4, where those that consume power have a negative sign, while those that produce power have a positive sign. The power balance is written as follows:
where
represents the power generated by the PV panels,
the power provided by the electrical grid,
the power received or consumed by the BES subsystem,
the power received or consumed by the charging station,
the power consumed by the campus lighting system, and
the power consumed by the greenhouse loads (air conditioning and irrigation).
3.1.4. Predictive Control Strategy
The control of the PV greenhouse as energy hub is approached as an optimization problem with the aim of minimizing the cost of the energy used. The problem is solved at each sampling instant for a horizon
K, where the first term of the control sequence is applied to the system. Subsequently, the process is repeated at the next sampling instant. Based on the above, the optimization problem is modeled as follows:
where the decision variables are the power from the battery bank and the power from the EV charging station. On the other hand, the cost function (
12) has three terms, with the first representing the cost of the energy obtained from the grid, while the other two quadratic terms penalize large excursions of
and
smoothing out their profile over time.
3.2. System Configuration
In this section, the parameters and inputs of the model are characterized.
3.2.1. Price of Electricity
A plain tariff was considered to deduce the final price of the electricity consumed from the grid. The tariff was obtained from information published in February 2023 by the local distribution company. The information is summarized in
Table 4.
3.2.2. Greenhouse Electricity Generation
The greenhouse generates electricity through its rooftop photovoltaic system. The data on electricity generation were then obtained from the inverter provider monitoring platform.
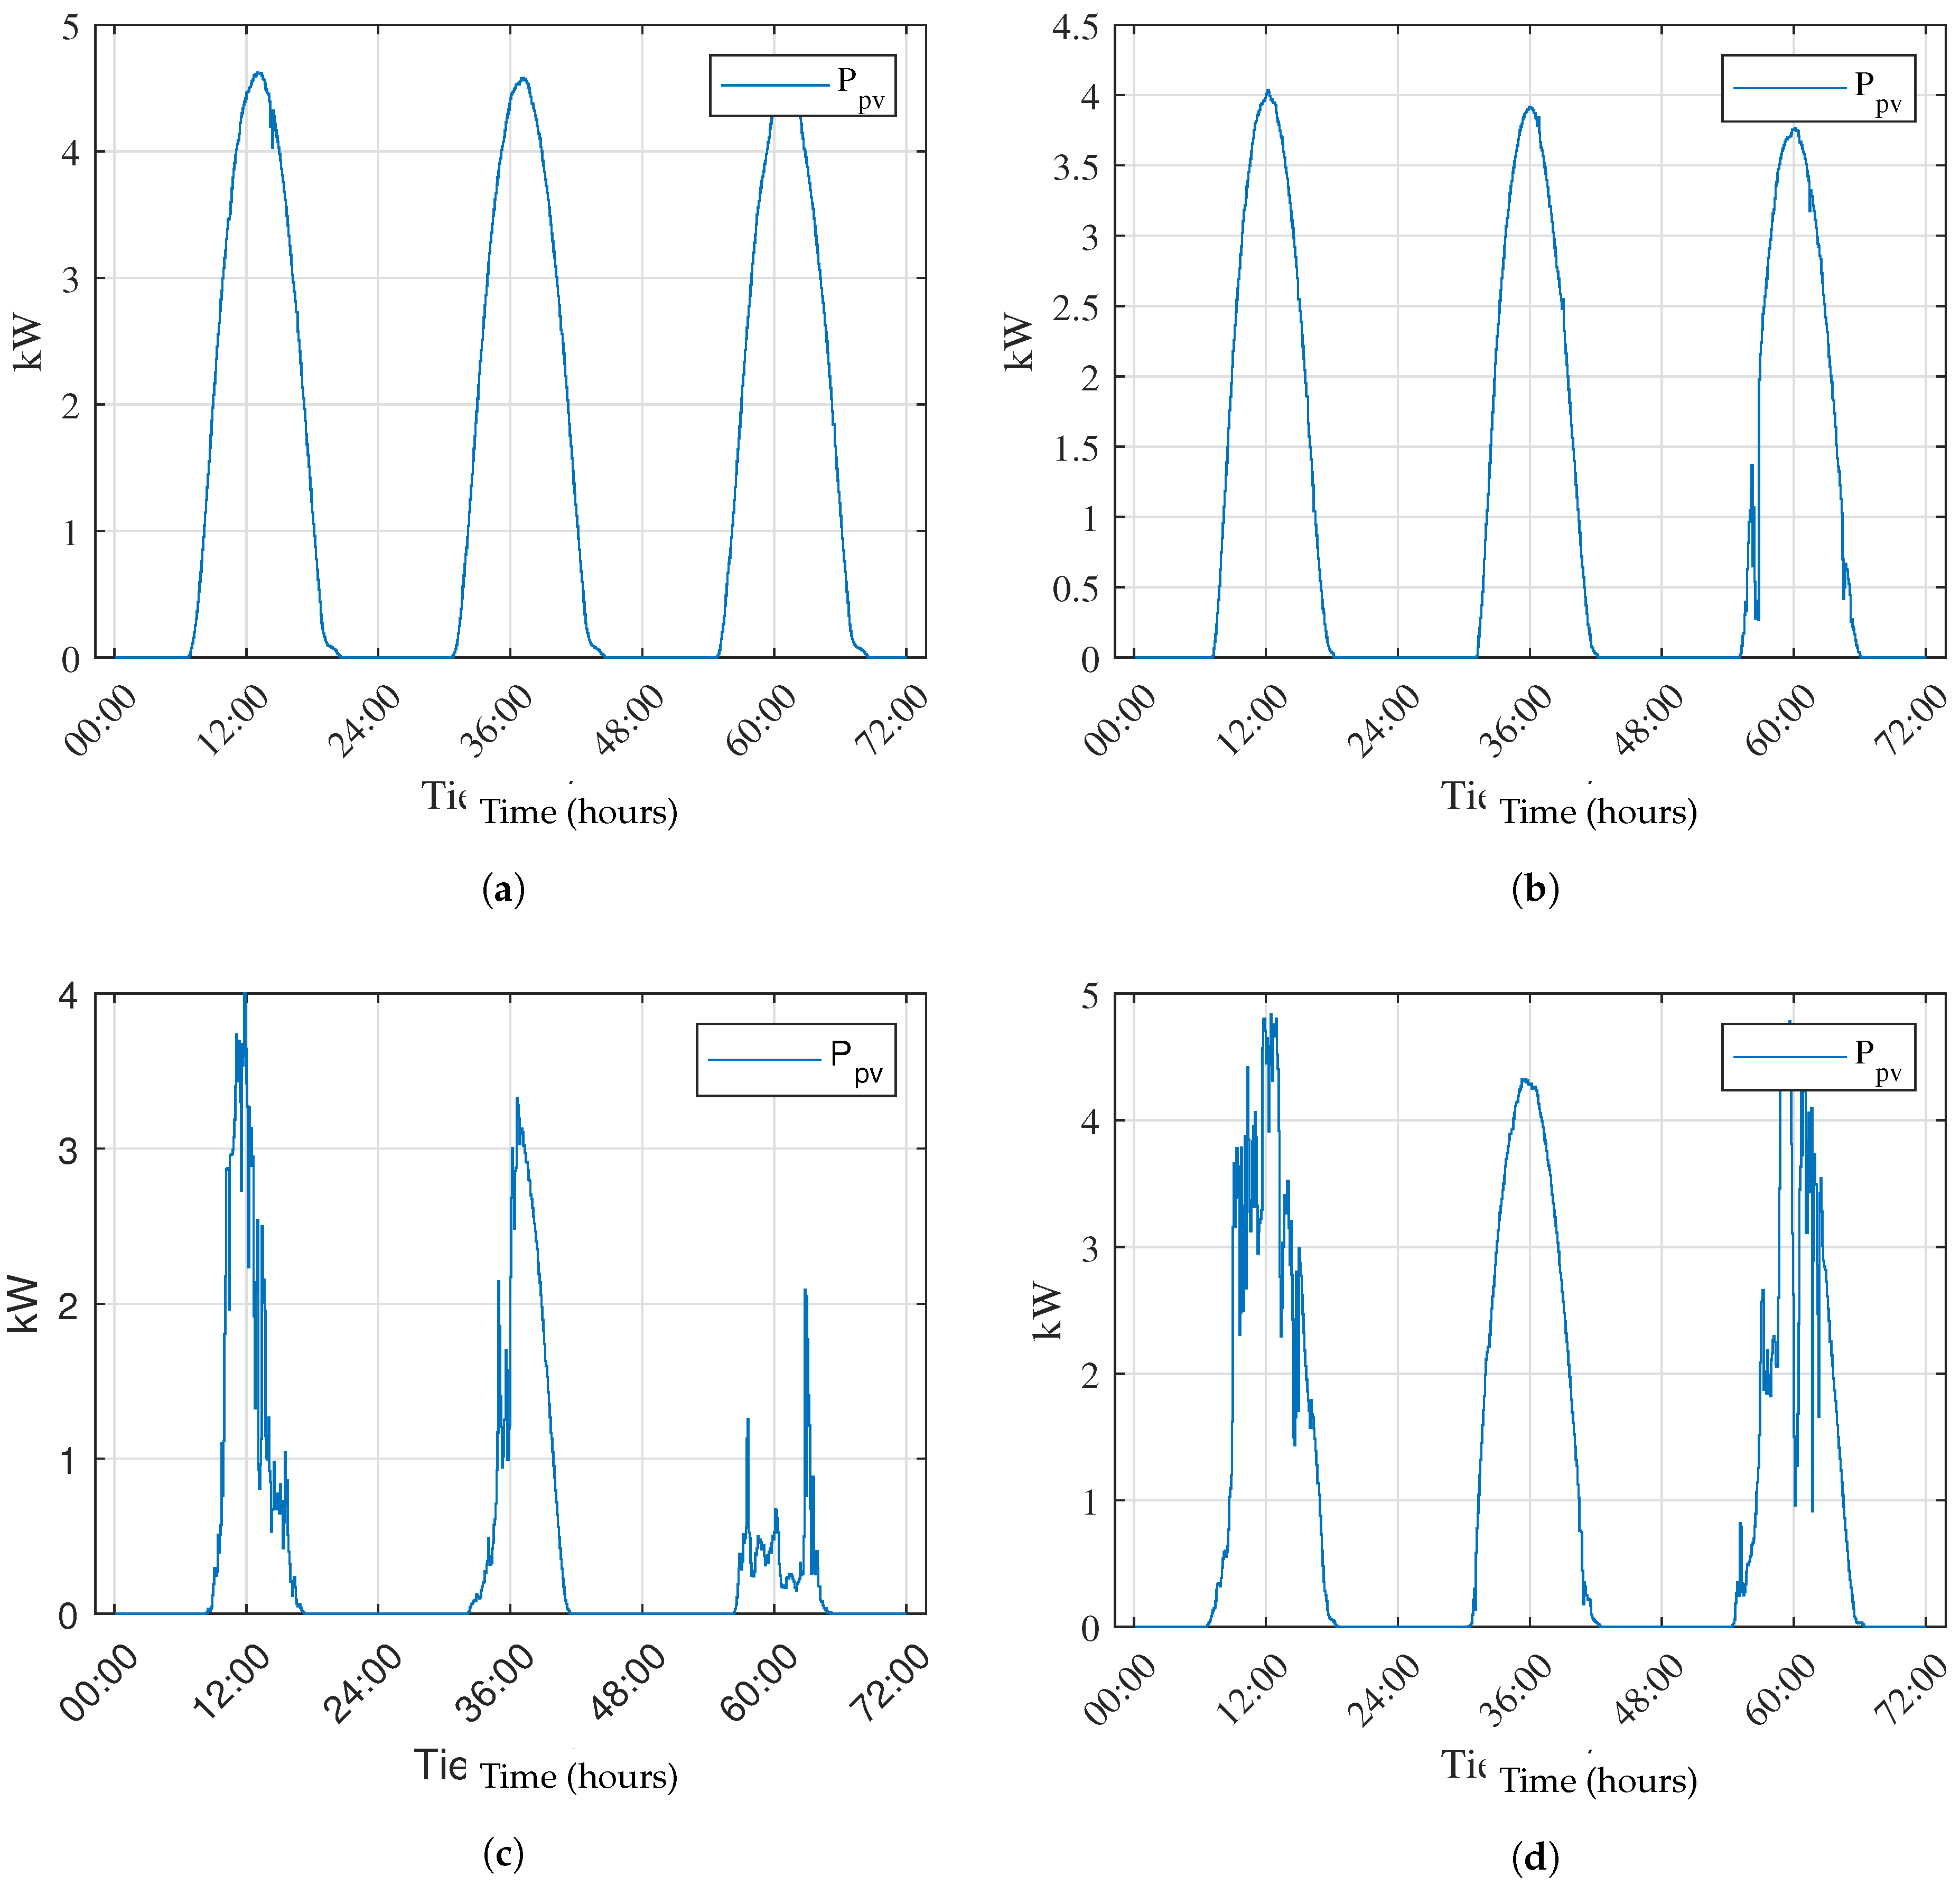
Figure 5 shows the curves corresponding to photovoltaic generation of each season of the year (southern hemisphere), where the data correspond to the first three days of January for summer (
Figure 5a), April for fall (
Figure 5b), July for winter (
Figure 5c), and October for spring (
Figure 5d).
3.2.3. Greenhouse Electricity Demand
The greenhouse uses electricity for air conditioning (temperature control), lighting and irrigation. In the following sections, the electricity consumption of these systems is estimated.
Temperature Control
The greenhouse has four air conditioning units (ac) of 18000 BTU thermal rating each to perform temperature control. Each unit has an electricity consumption of 1.696 kW for cooling mode, and 1.464 kW for heating mode. To determine the electricity consumption profile of the ac units together, it is necessary first to determine whether the ac units operate in heating and cooling mode. To do that, we first define the greenhouse comfort zone, where the temperature inside the greenhouse is allowed to vary in the range of
C and
C. Then we compare the comfort zone with historical data on the average ambient temperature at the greenhouse location, shown in
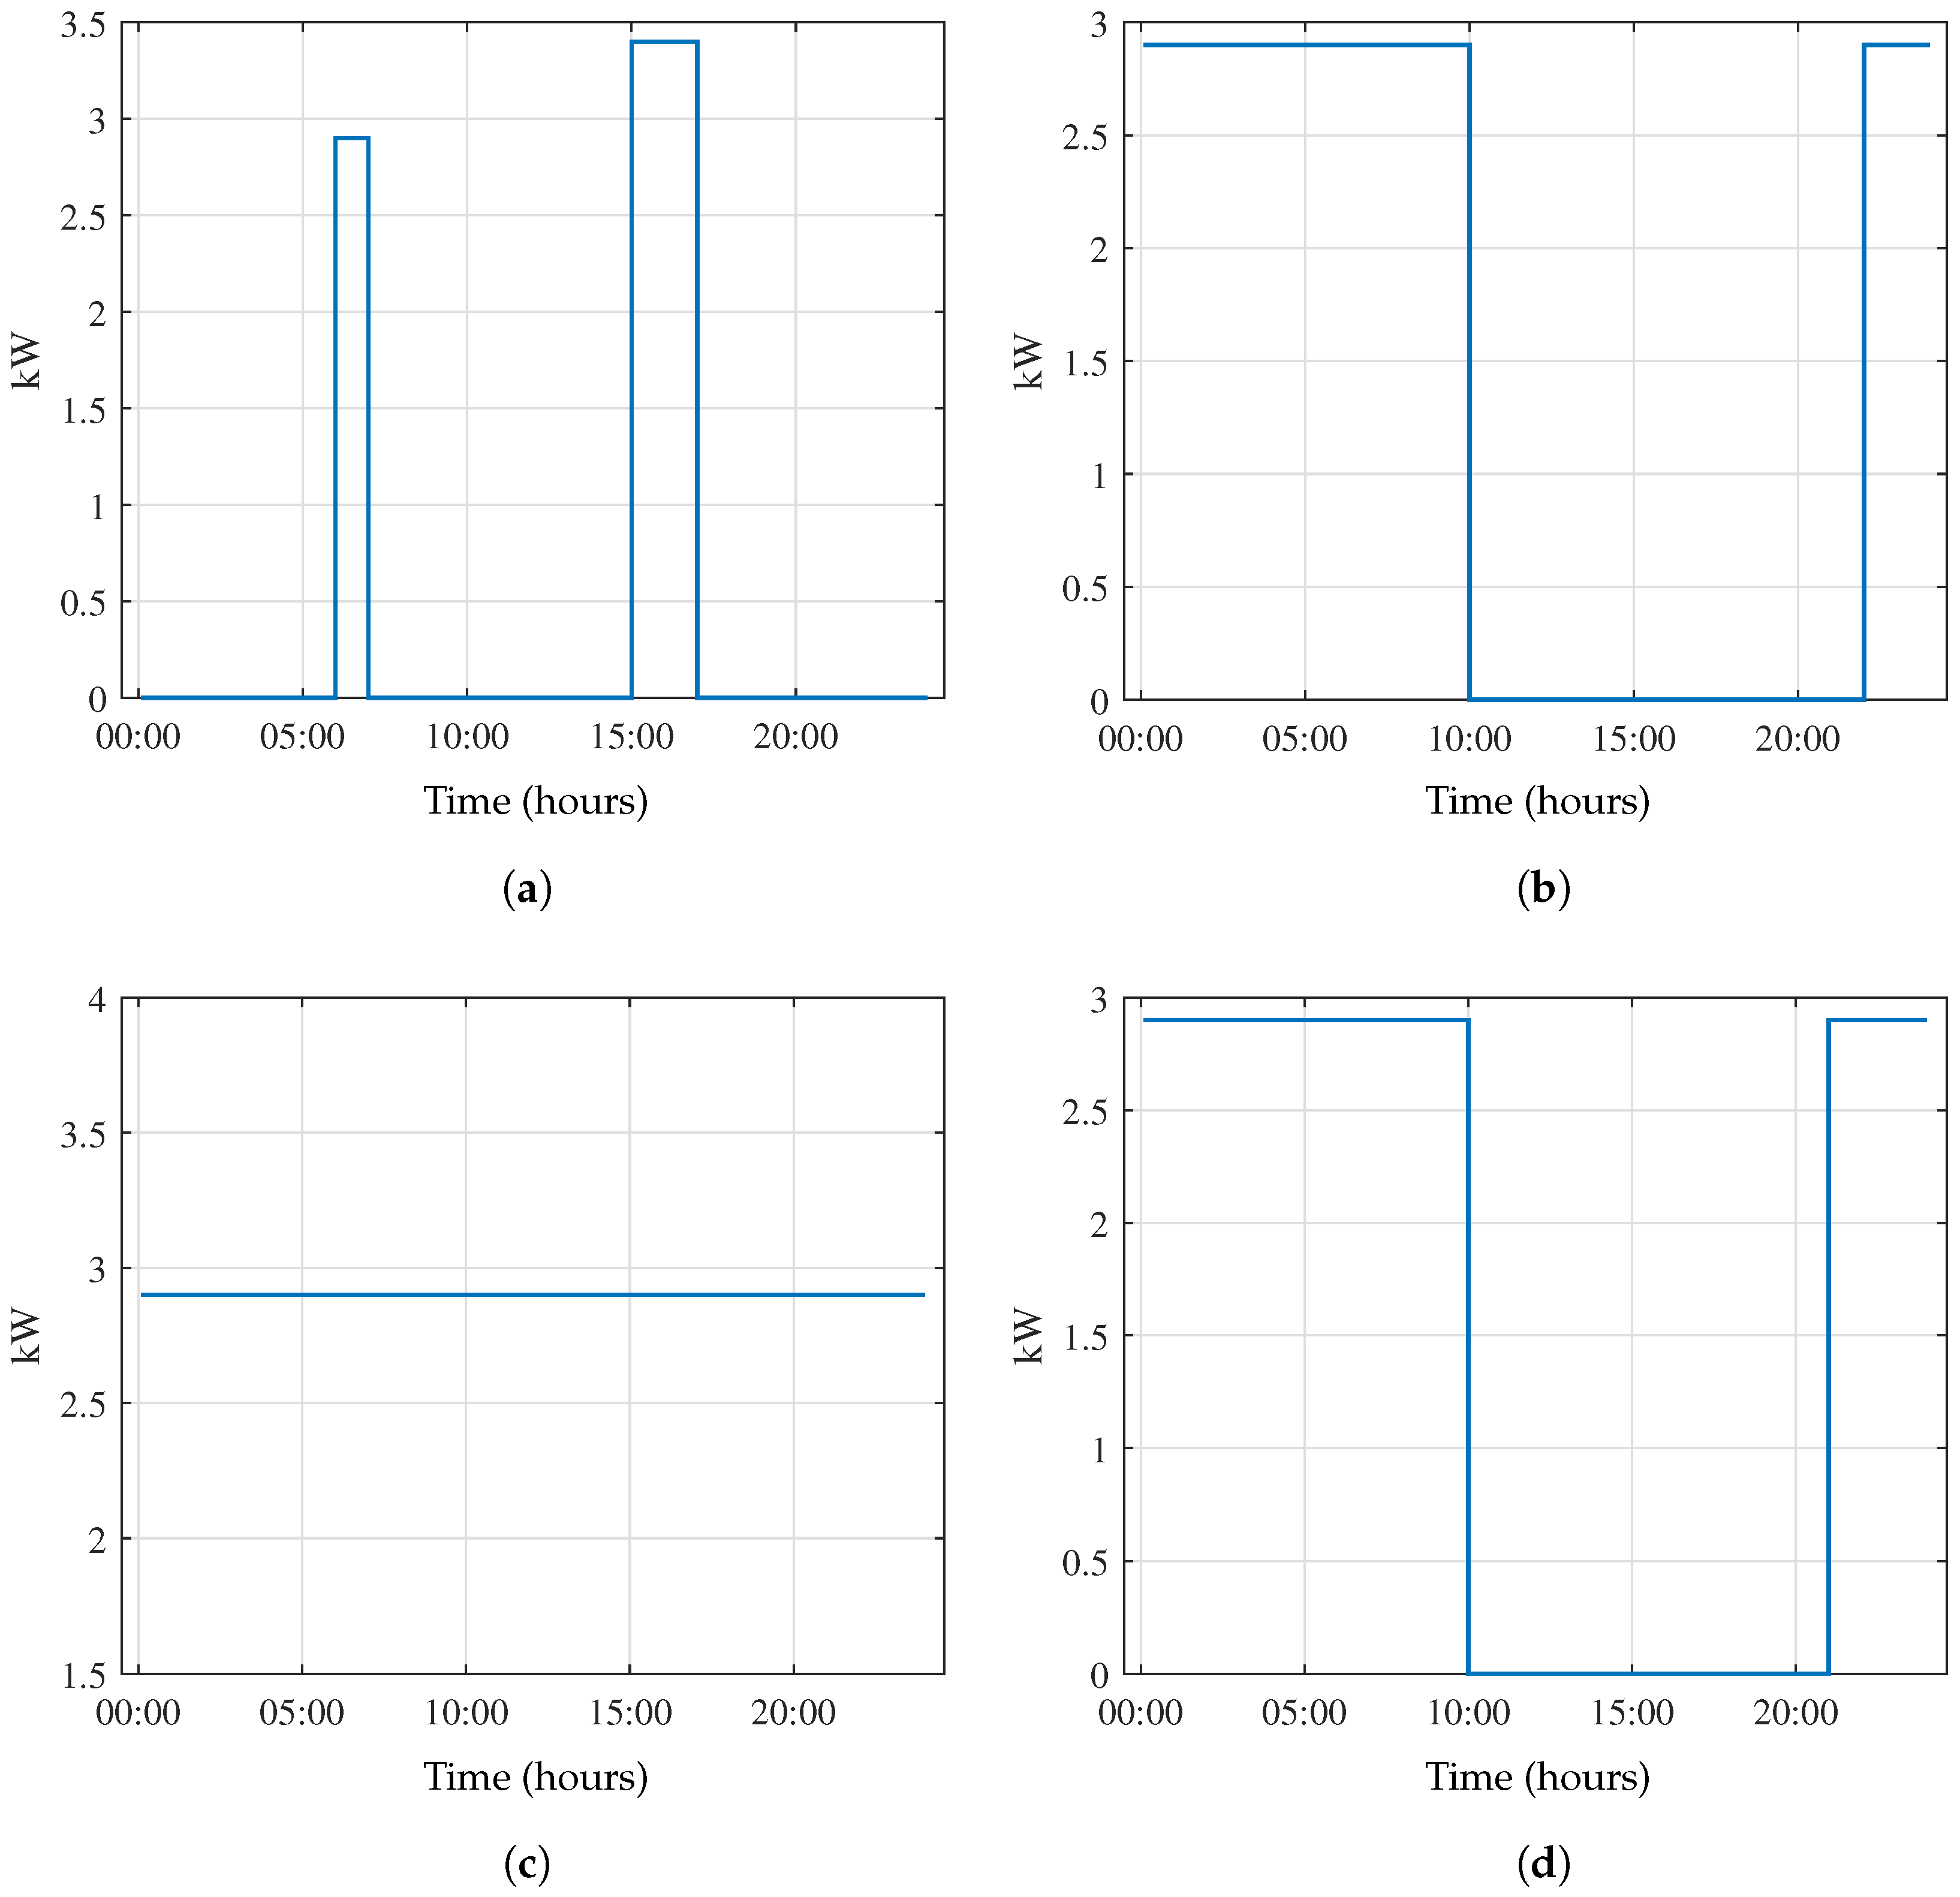
Table 5. Note that we have marked in blue the temperatures above the comfort zone and in red the temperatures below the comfort zone. When the average ambient temperature is above the upper limit, the ac units must operate in cooling mode, consuming 3.4 kW of electricity per hour. On the contrary, when the average ambient temperature is below the lower limit, the ac units must operate in heating mode, consuming 2.9 kW of electricity per hour. Finally, the electricity consumption of the ac equipment is plotted and presented in
Figure 6. Note that
Figure 6 shows the average consumption of electricity of the ac units for a typical day of each season of the year. Later, when the system is simulated, this daily behavior must be replicated for each day of the corresponding season.
Irrigation and Lighting
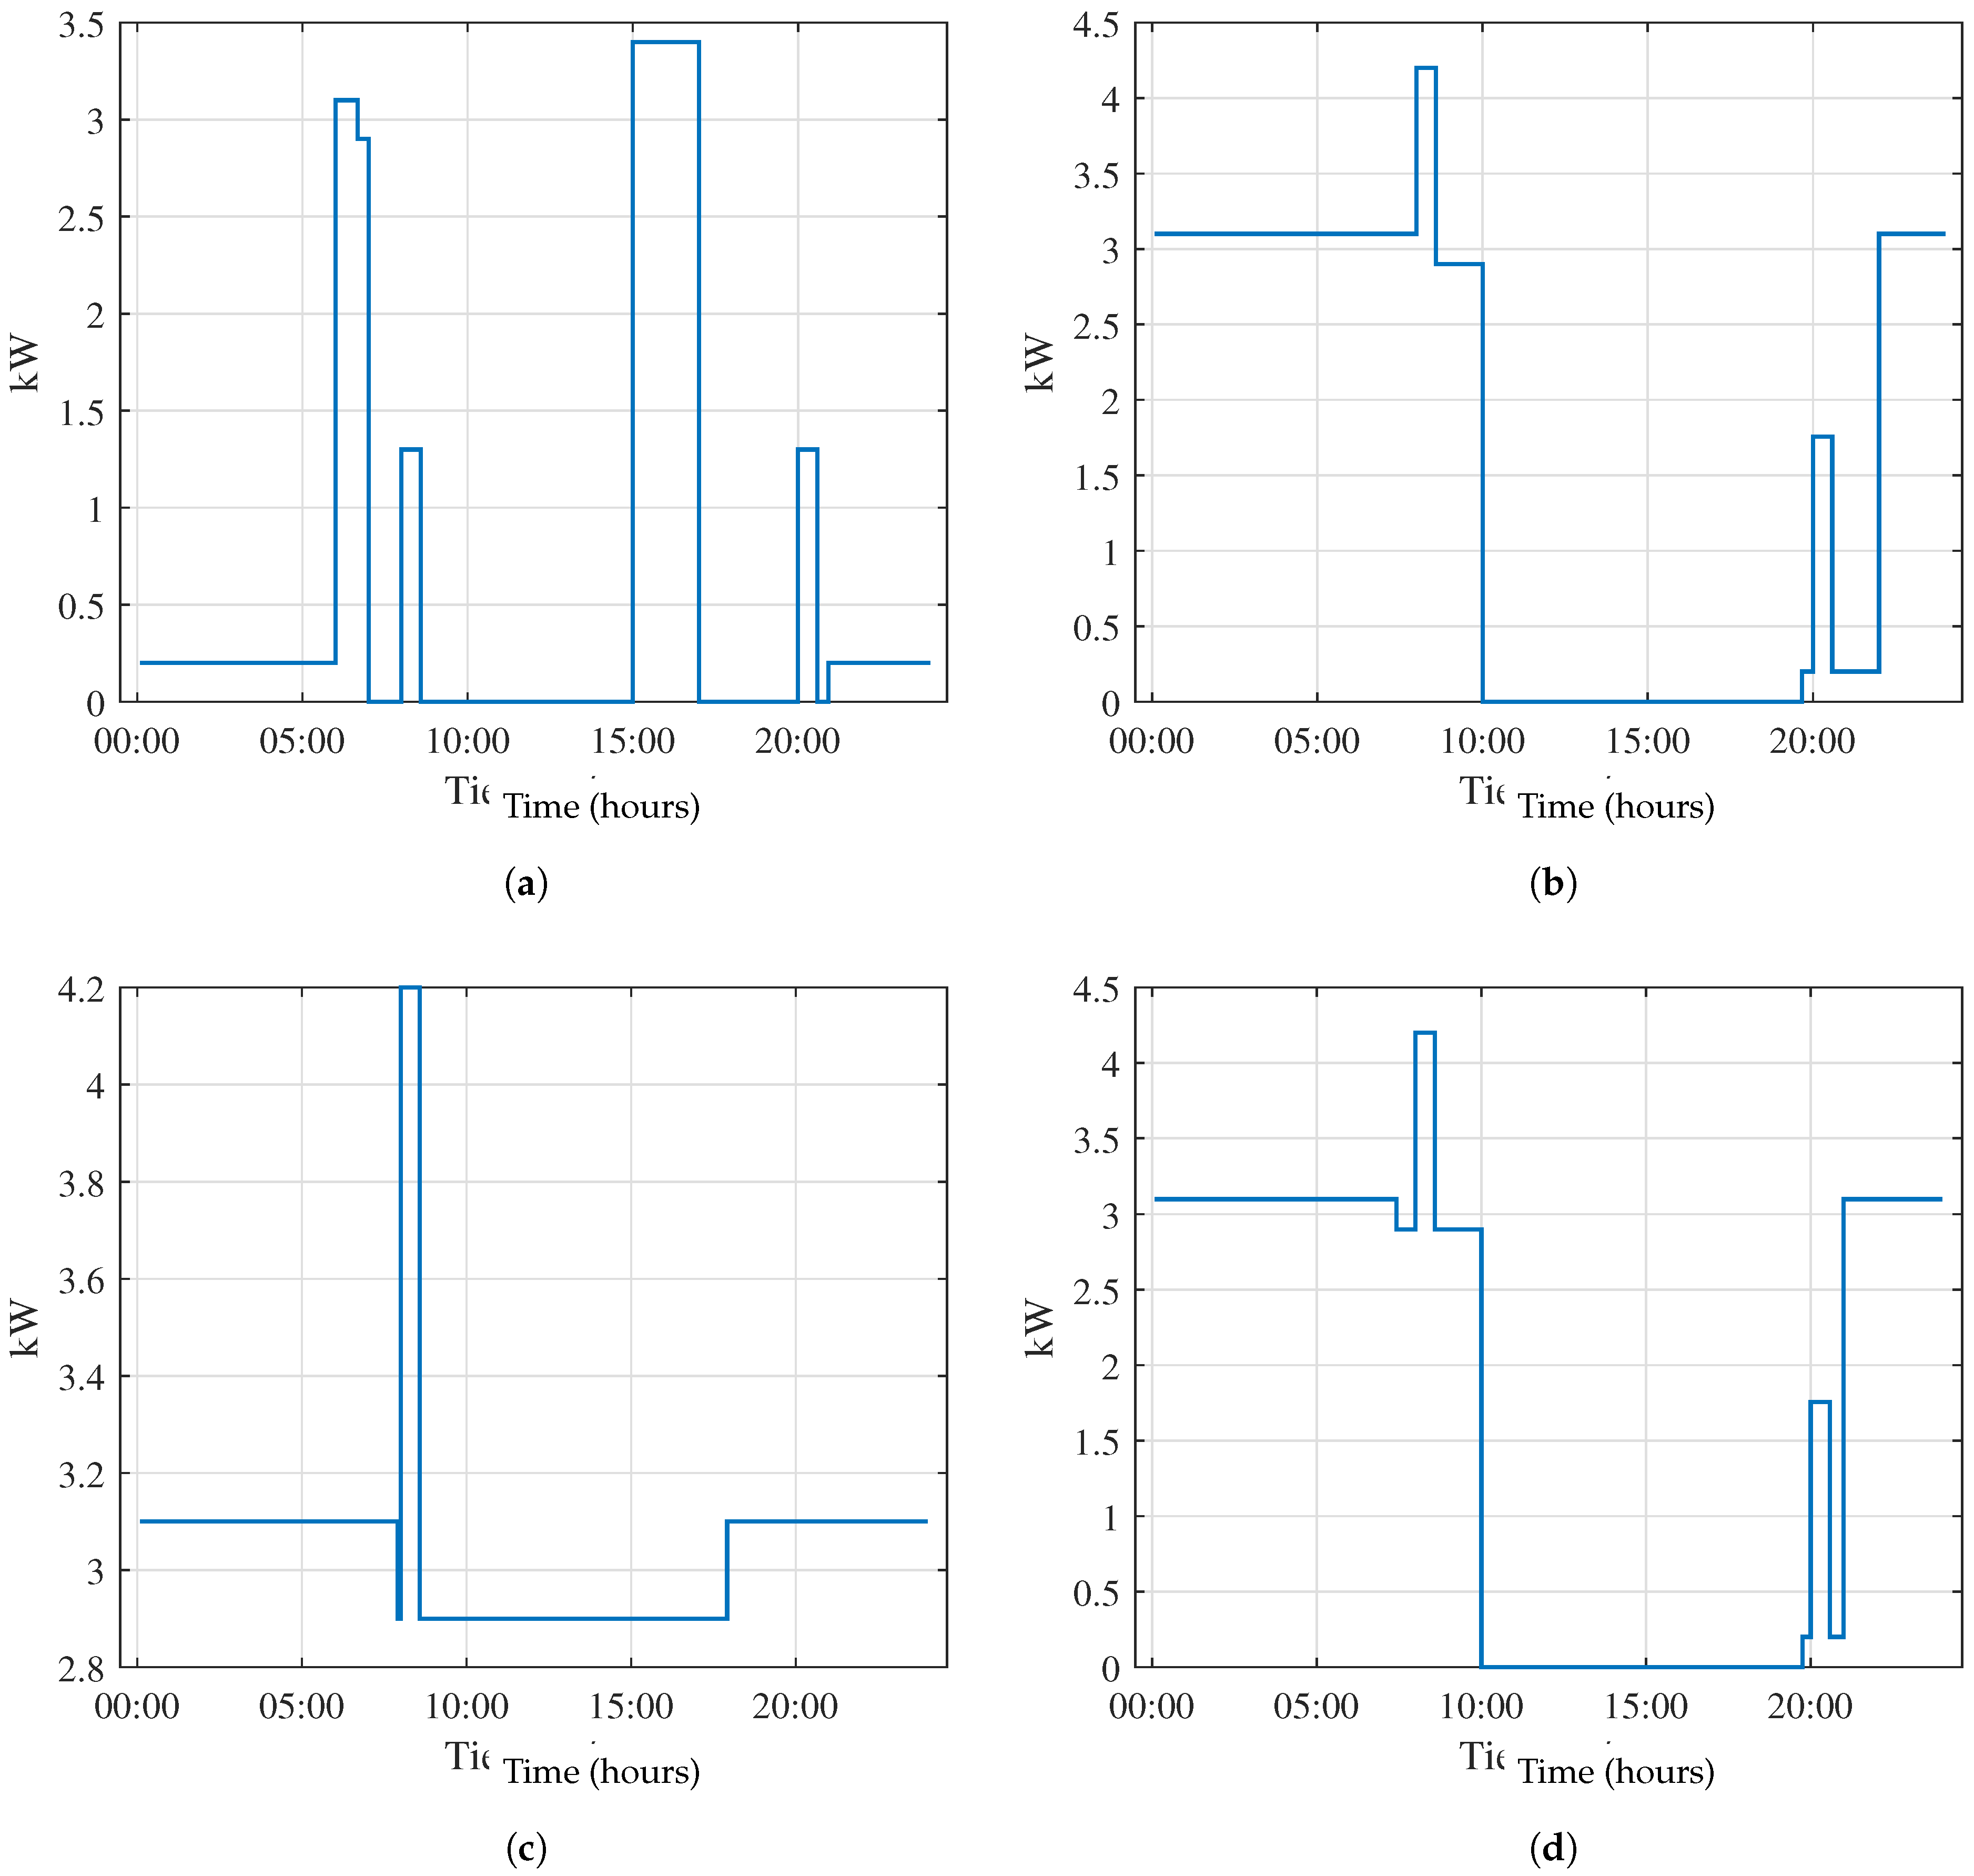
An irrigation system consisting of two water pumps with a power of 0.65 kW was considered. The lighting system consists of eight 32 W LED lamps for interior lighting and four 50 W LED lamps for exterior lighting. Based on sunrise and sunset times and irrigation requirements, the following is the scheduled daily operation:
-
Summer (Sunrise 06:35 and Sunset 20:55)
- –
Irrigation: Switched on from 08:00 to 08:30 and 20:00 to 20:30.
- –
Interior lighting: Not used.
- –
Exterior lighting: Switched on from 00:00 to 06:35 and 20:55 to 23:55.
-
Fall (Sunrise 07:55 and Sunset 19:40)
- –
Irrigation: Switched on from 08:00 to 08:30 and 20:00 to 20:30.
- –
Interior lighting: Switched on from 19:40 to 20:30.
- –
Exterior lighting: Switched on from 00:00 to 07:55 and 19:40 to 23:55.
-
Winter (Sunrise 07:50 and Sunset 17:55)
- –
Irrigation: Switched on from 08:00 to 08:30.
- –
Interior lighting: Not used.
- –
Exterior lighting: Switched on from 00:00 to 07:50 and 17:55 to 23:55.
-
Spring (Sunrise 07:20 and Sunset 19:45)
- –
Irrigation: Switched on from 08:00 to 08:30 and 20:00 to 20:30.
- –
Interior lighting: Switched on from 19:45 to 20:30.
- –
Exterior lighting: Switched on from 00:00 to 07:20 and 19:45 to 23:55.
The electricity consumption due to irrigation and greenhouse lighting is summarized and shown in
Figure 7.
3.2.4. Campus Lighting Electricity Demand
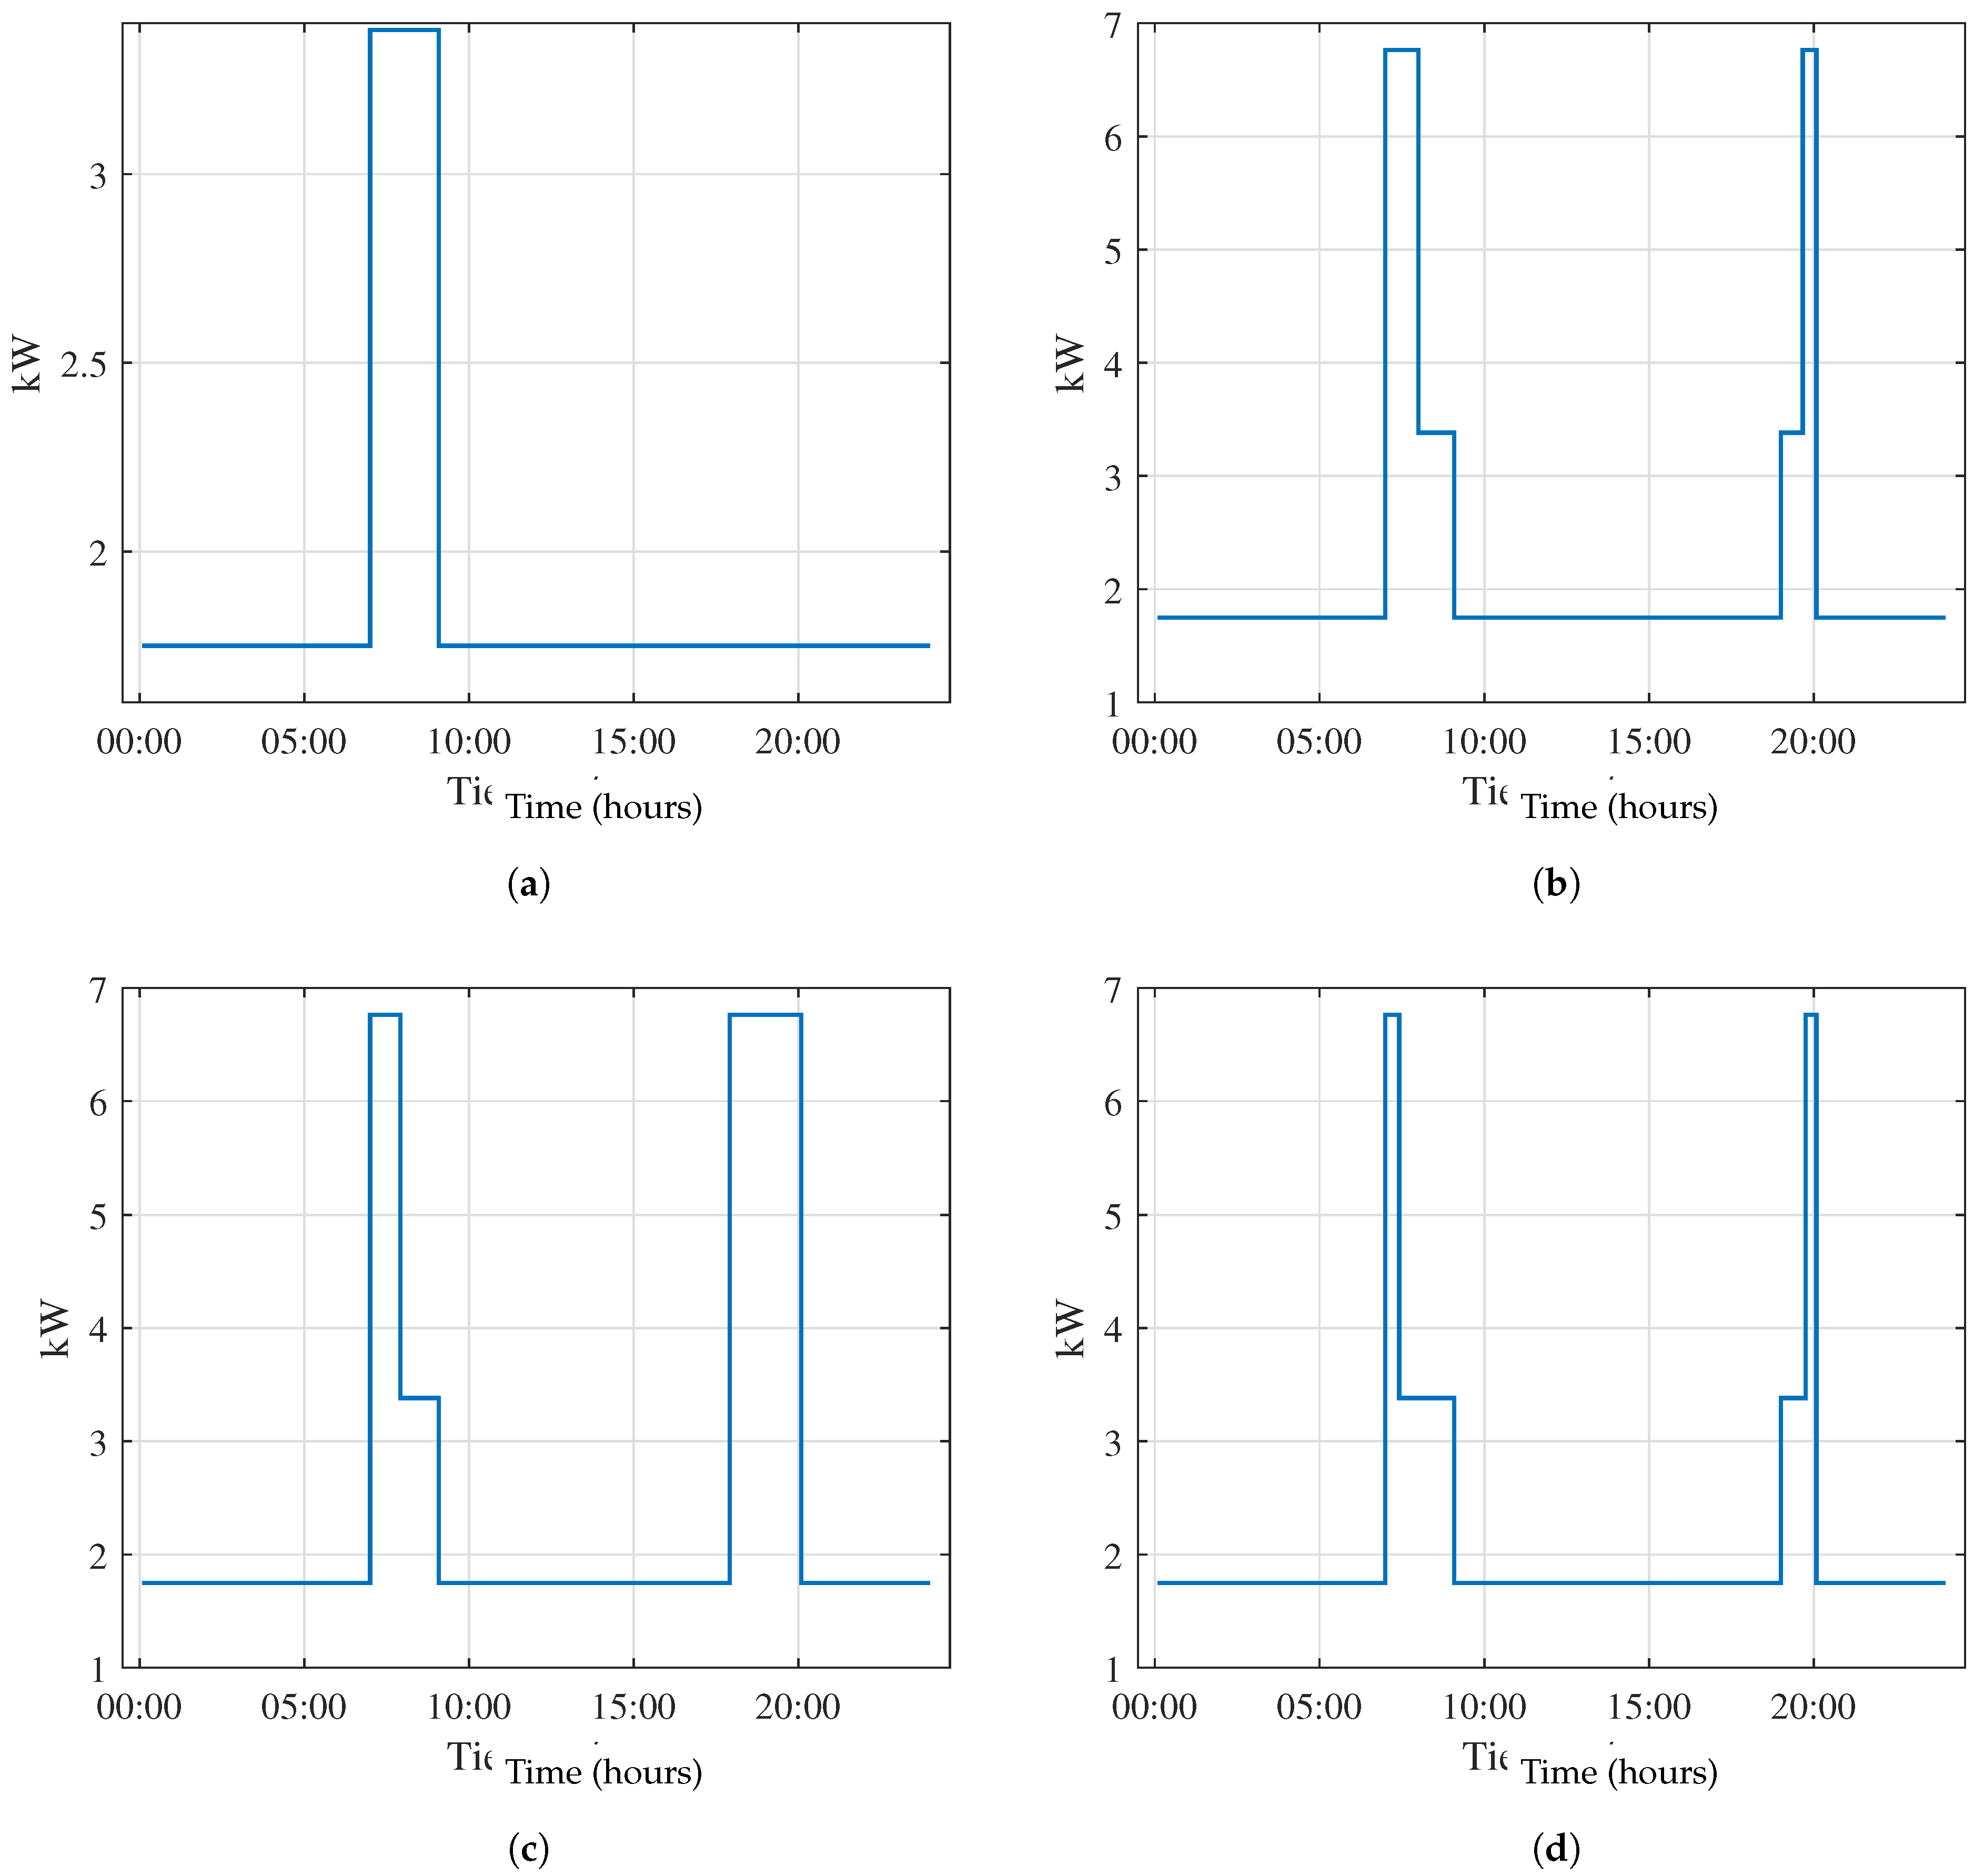
Another consumption that is considered to be part of the microgrid is the lighting of the Campus main building. The lighting equipment considered entails sixteen 34 W LED lamps for each classroom and forty four 80 W LED lamps for public spaces. Based on sunrise and sunset times and educational building requirements, a scheduled daily operation is designed to achieve proper illumination. The resulting electricity consumption of the main campus building lighting is summarized and shown in
Figure 8.
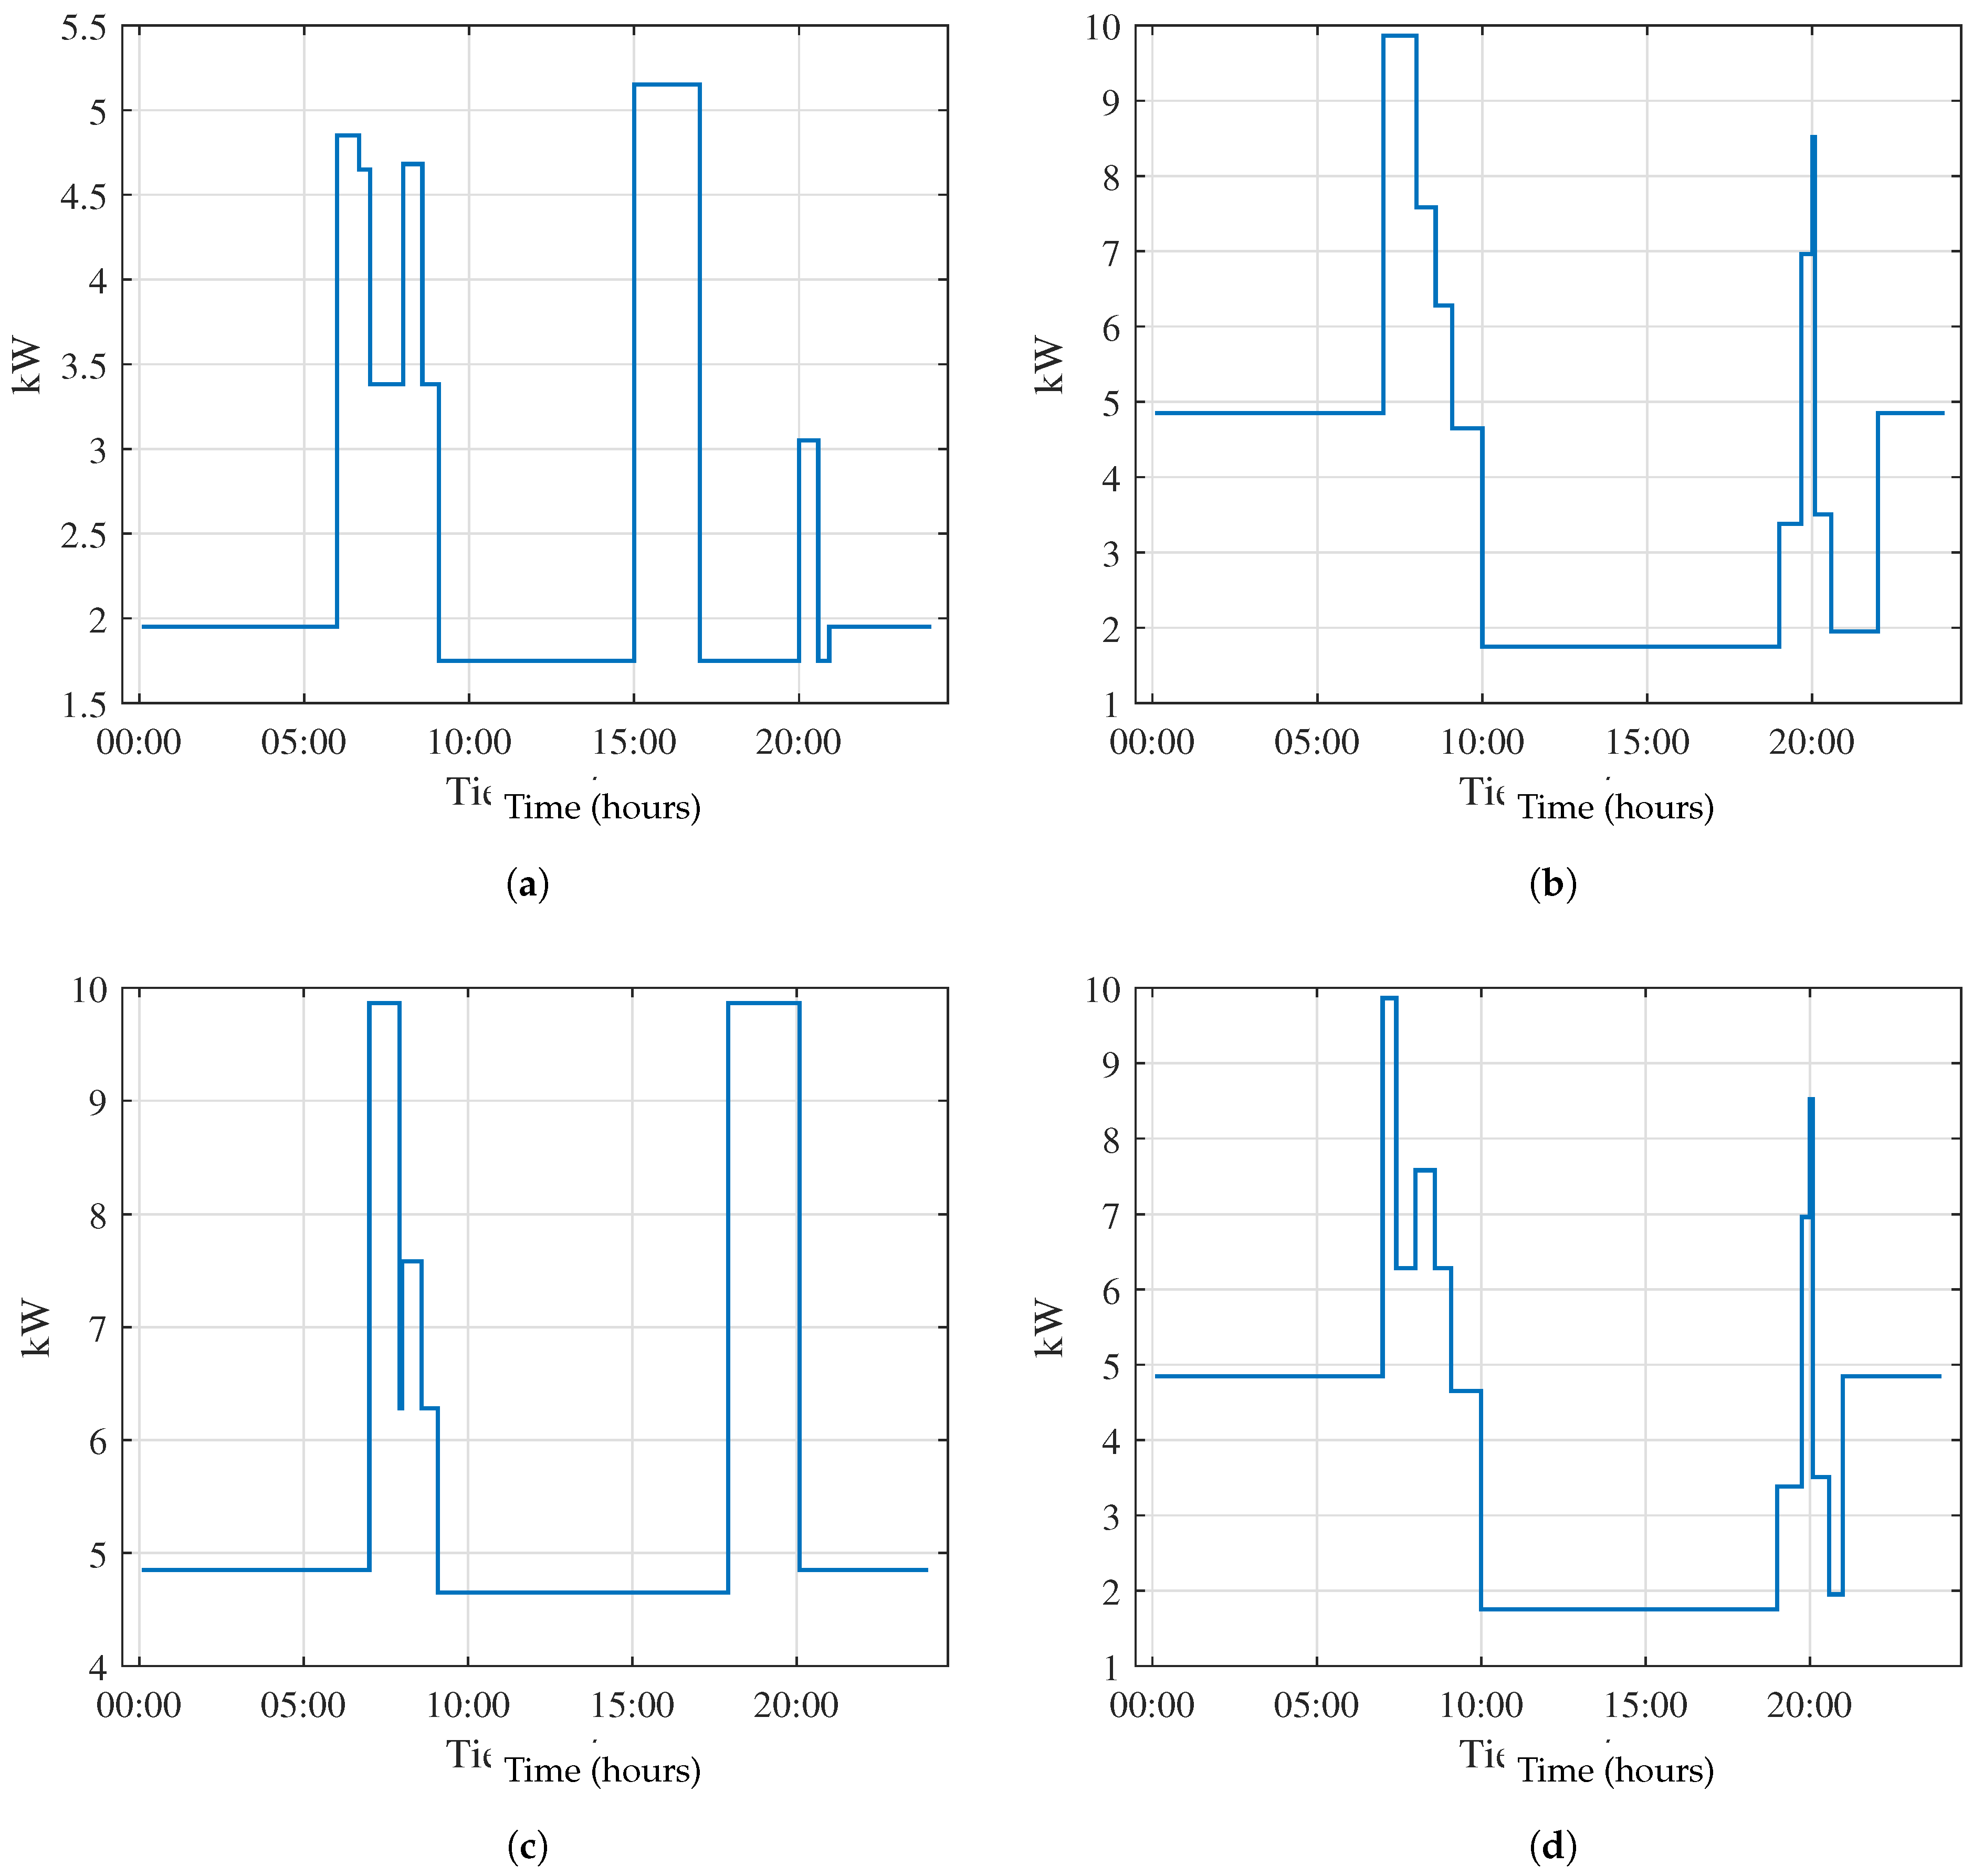
Finally, the total consumption corresponding to the main campus building and the greenhouse are added to generate the total electricity demand of the microgrid.
Figure 9 shows the resulting daily load profile.
3.2.5. EV Charging Station and Battery Bank
The electric vehicle charger considered allows for a maximum and minimum charging power of 11 kW and 3 kW respectively. The battery system considered has a storage capacity of up to 20 kWh and maximum charging and discharge power of 8.64 kW. For both devices, minimum and maximum SOC of 0.2 and 0.8 are considered, respectively. In the following sections, two scenarios for the use of the EV charging station are described.
3.3. Study Cases
3.3.1. Case 1
The EV charging station will be used by a personal vehicle during working hours. The vehicle has a storage capacity () of 40 kWh. The car arrives at the station at 08:30 with a close to 0.3 and leaves the station at 17:30 (9 hours of availability). This usage profile is repeated for every day of the simulation.
3.3.2. Case 2
For this scenario, an institutional vehicle of 54.9 kWh capacity will be considered to use the charging station, therefore, the charging regime will be different from Case 1. There would be two charging regimes: from 17:00 to 23:00, the car is allowed to charge and discharge freely, and from 23:00 to 08:00, the car is allowed to charge only at constant power. As in case 1, this charging behavior is repeated for every day simulated.
Table 6 summarizes the parameters for both study cases.
3.4. Results
This section reports the results obtained from simulations considering the consumption and generation curves during the summer. On the other hand, these simulations were carried out with a discretization time of 5 minutes, an optimization horizon of 1 day, and a prediction horizon of 3 days. The simulations were carried out in Matlab® and using the Gurobi solver for the optimization problem.
3.4.1. Case 1
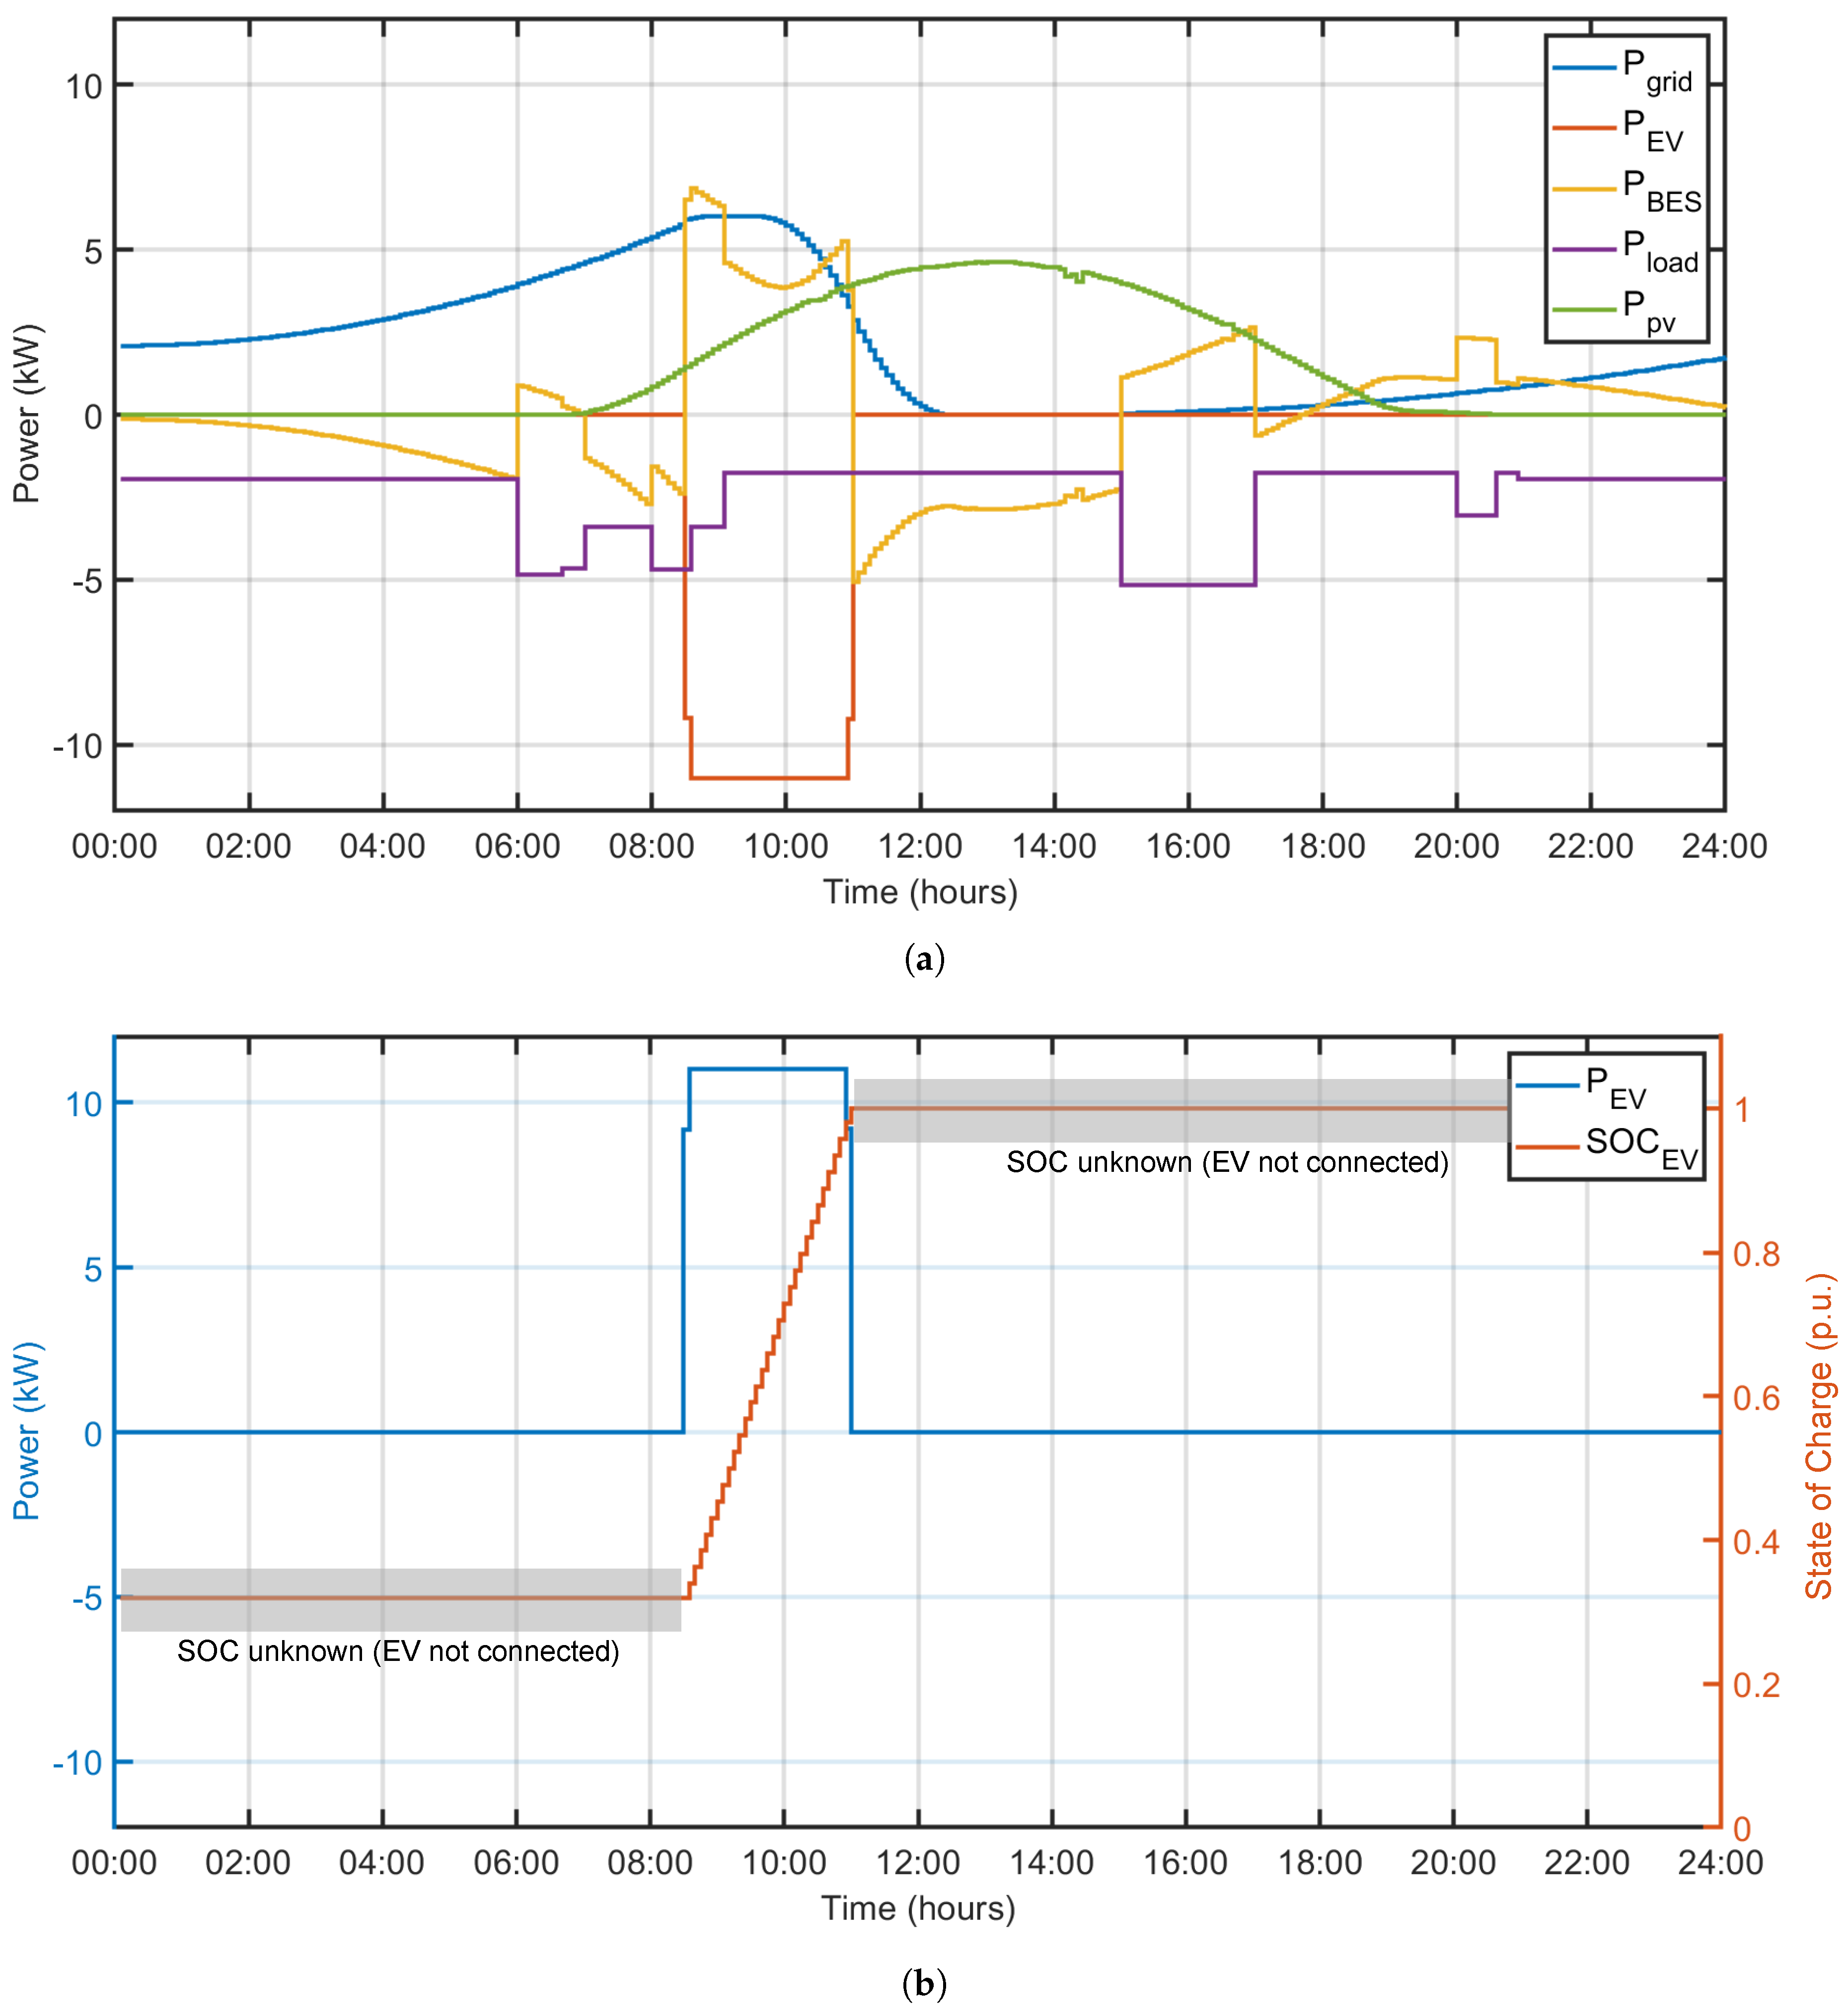
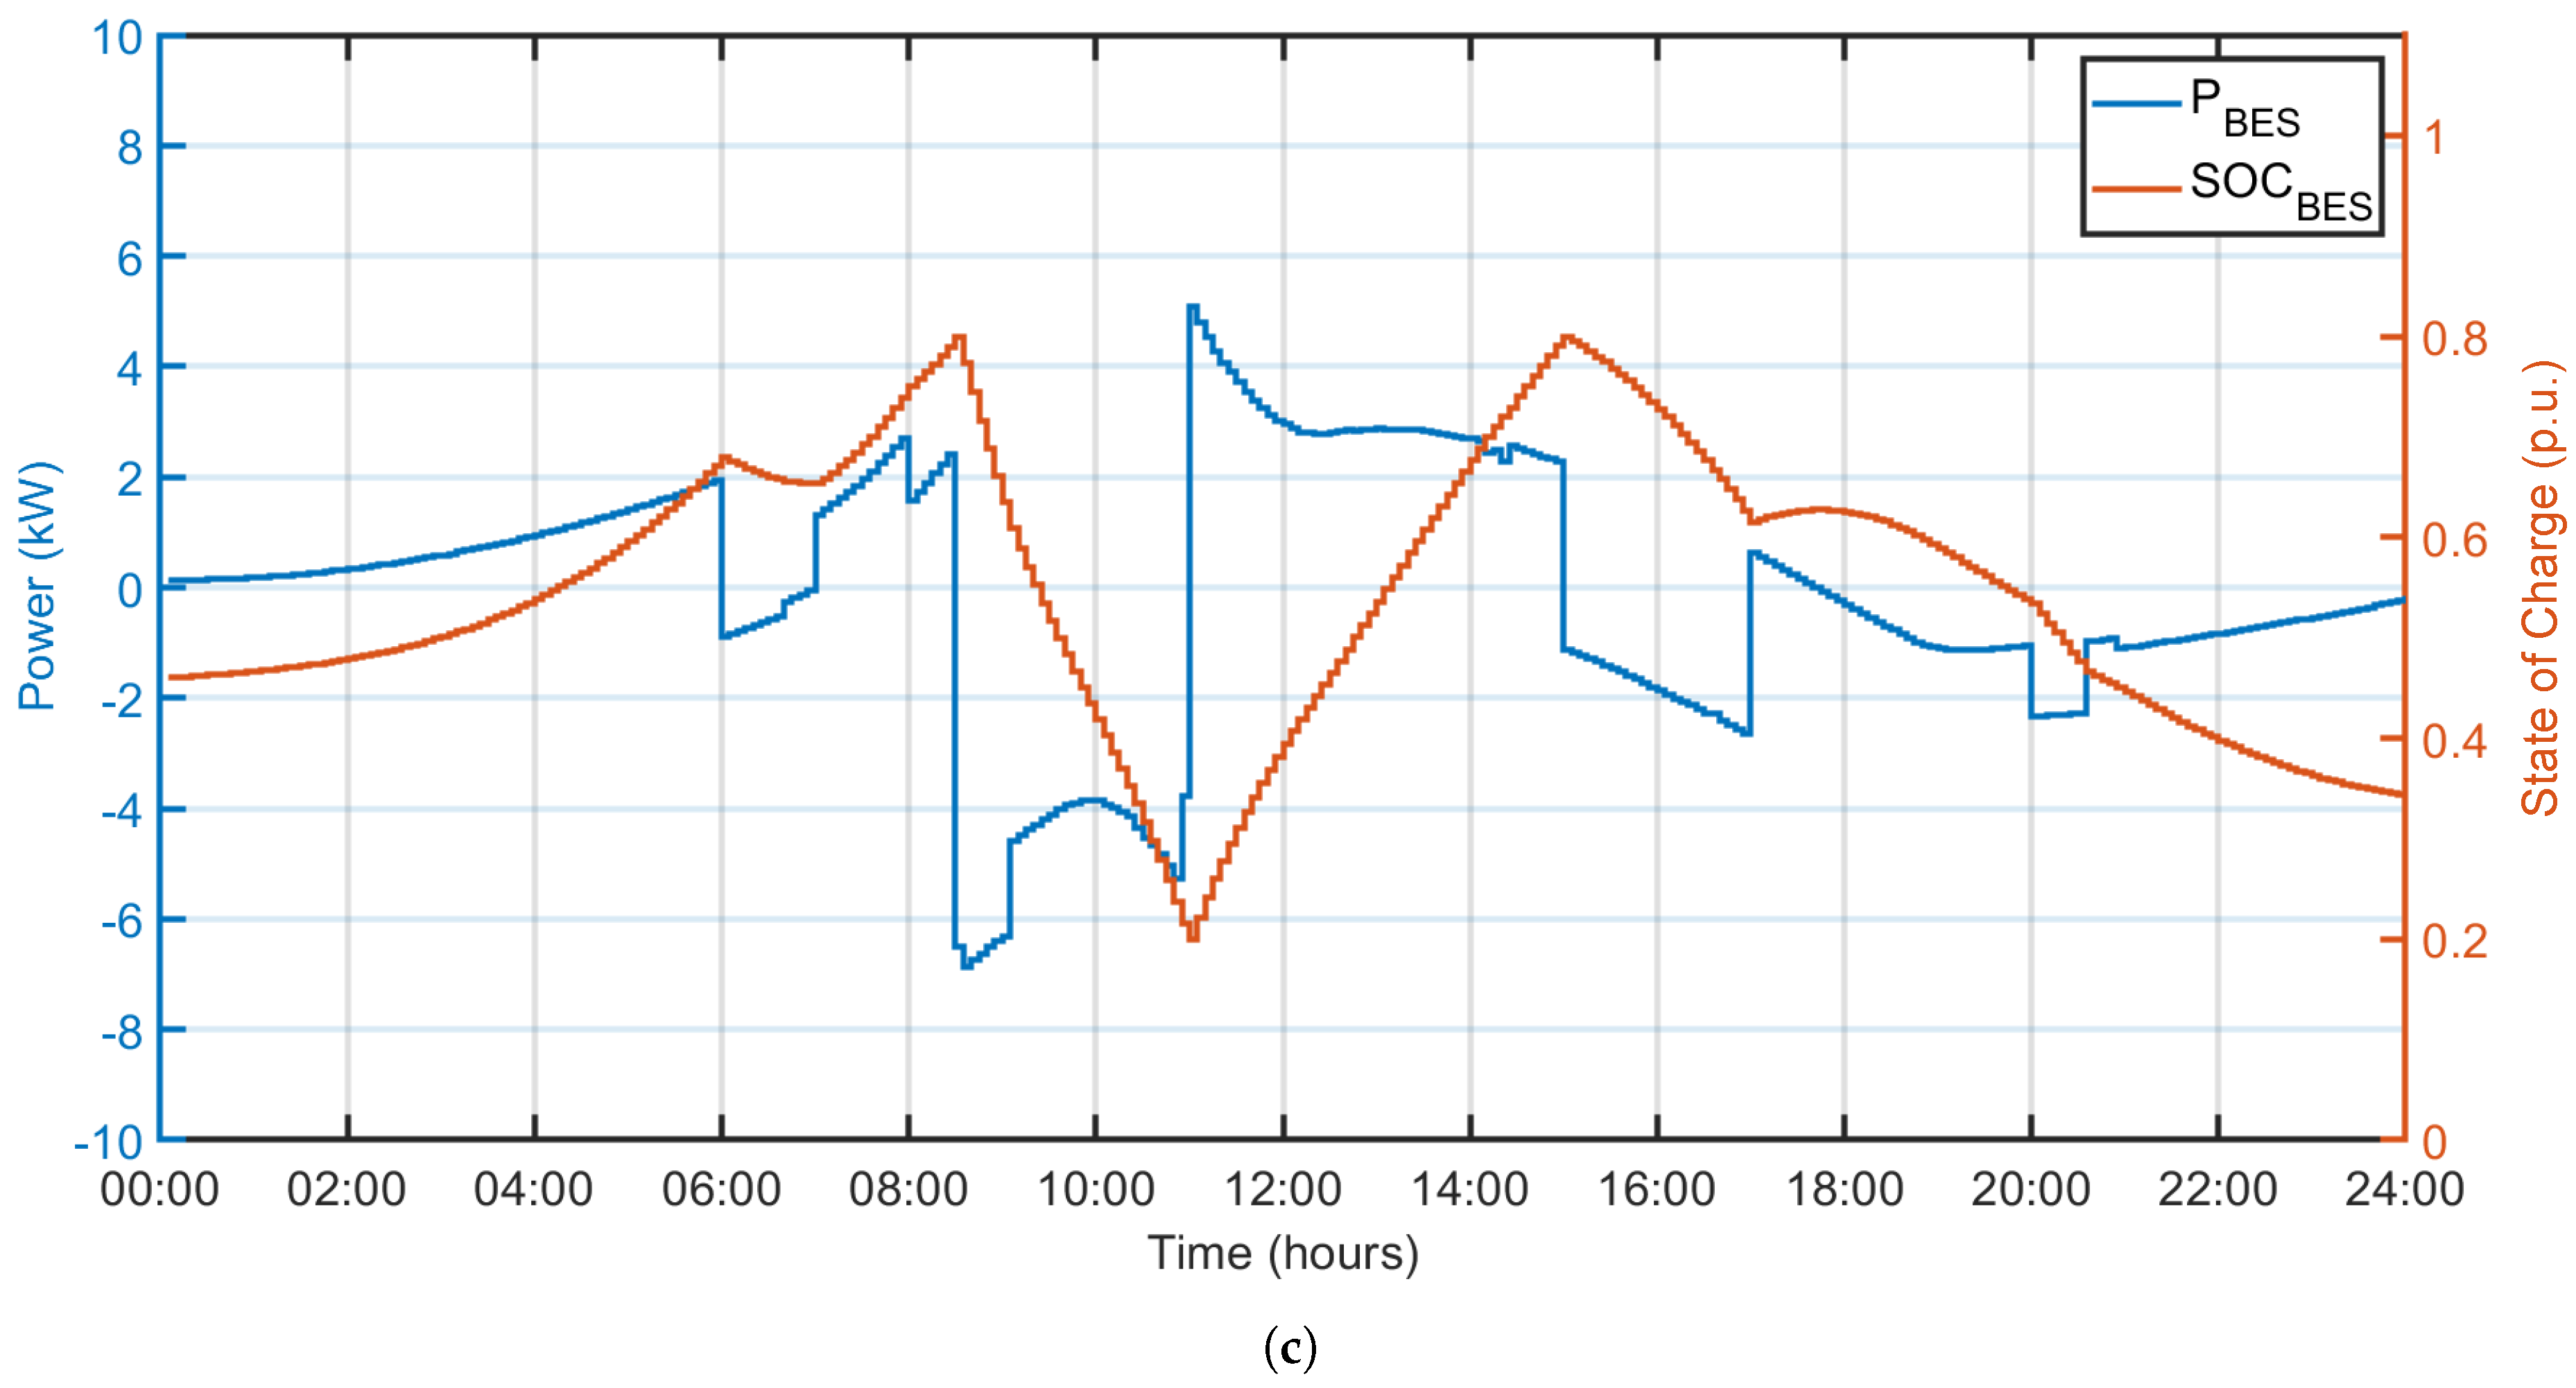
Figure 10 shows the results for the first 24 hours.
Figure 10a shows the power flows of the whole system. Here it can be seen that the EV is charged at maximum power as soon as it is plugged into the microgrid. With regard to power transactions with the grid, it is observed that the microgrid consumes power during the morning and at night. In addition, it can be observed that the BES absorbs all the extra power demands and surplus power.
Figure 10b shows the power demanded by the EV and the evolution of its SOC over time. As mentioned above, the EV is charged in around three hours at maximum power, as expected. It is important to mention that before and after EV charging there is no knowledge of the evolution of the SOC. This is marked as a gray zone in
Figure 10b where the SOC is kept constant only for simulation purposes.
Finally,
Figure 10c shows the power flow through the BES and the evolution of its SOC over time. It can be observed that the most demanding operations for the BES are the charging of the EV which empty the BES in nearly 2 hours and the storage of PV surplus power that recharges the BES in approximately 4 hours.
Figure 10.
Waveforms associated to case 1 for a 24 hours period. (a) Overall power balance. (b) EV power flow and SOC. (c) BES power flow and SOC.
Figure 10.
Waveforms associated to case 1 for a 24 hours period. (a) Overall power balance. (b) EV power flow and SOC. (c) BES power flow and SOC.
3.4.2. Case 2
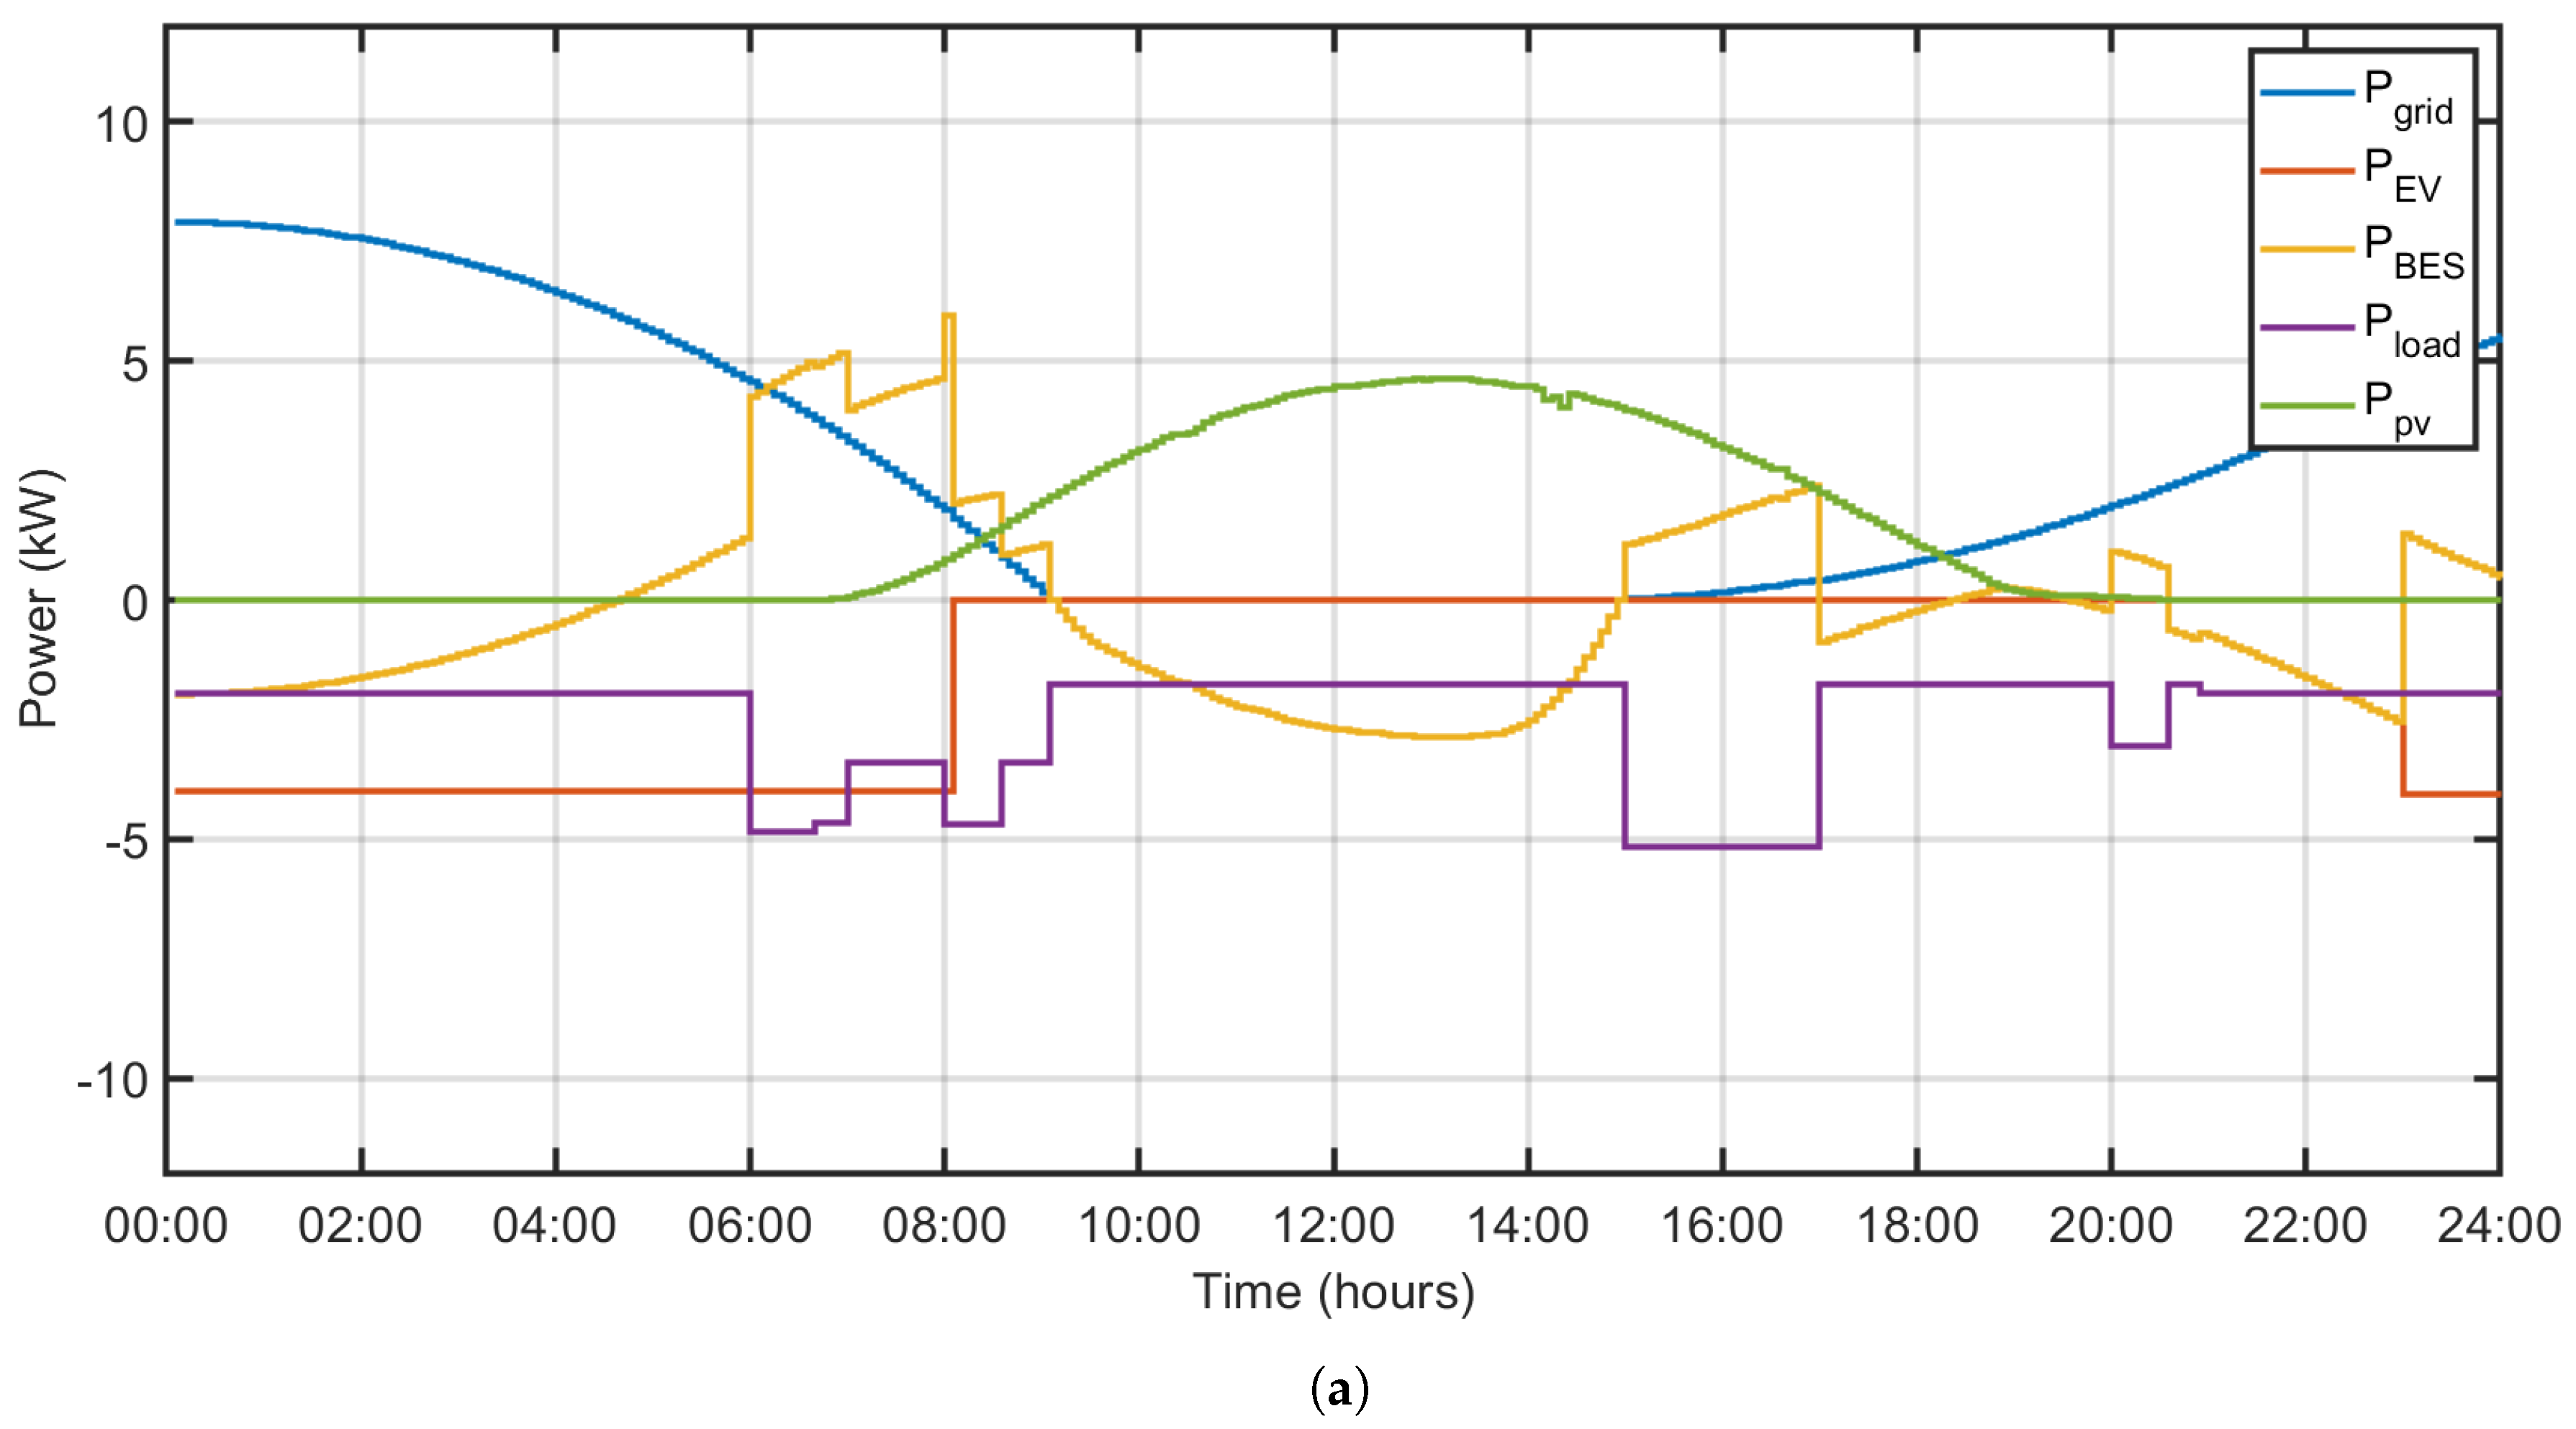
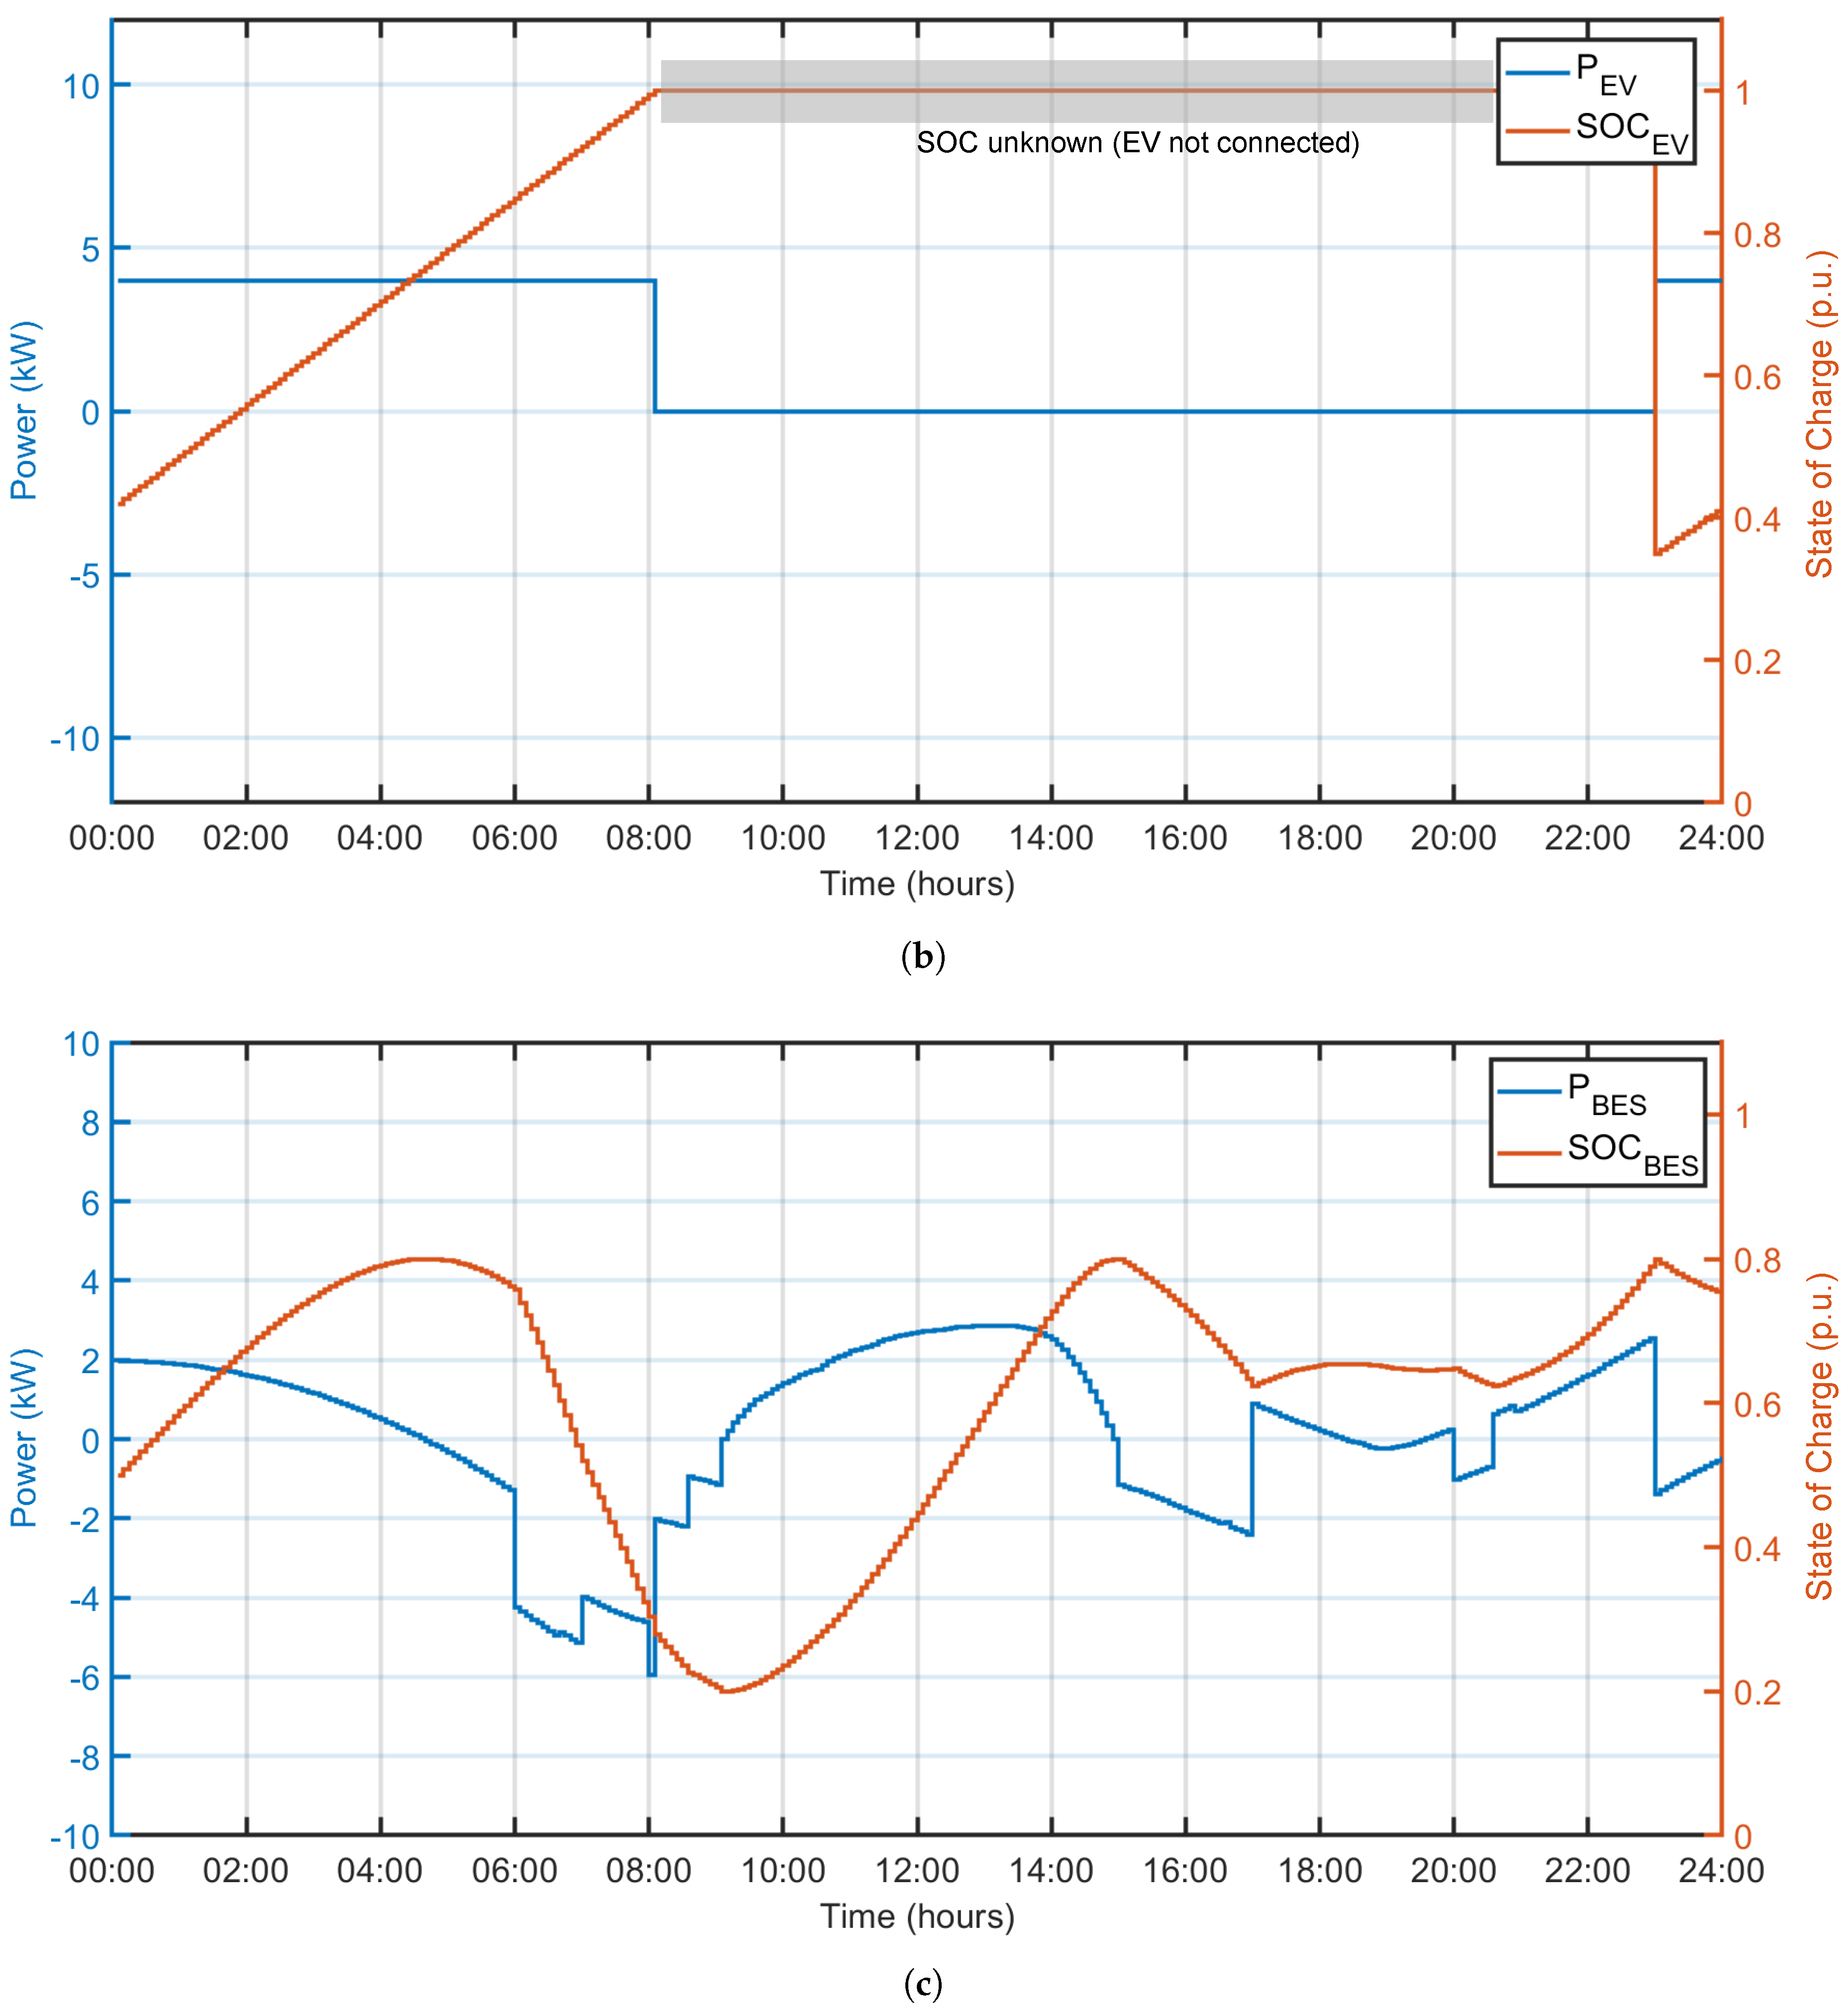
Figure 11 shows the results for the first 24 hours. The general behavior is very similar to case 1, as seen in
Figure 11a. The EV is also charged at the maximum power allowed when connected to the microgrid. However, in this case, the power limit is much lower and it charges at night. Regarding the power transactions with the grid, it is observed that the microgrid also consumes power during the morning and at night. However, in this case, the power consumed during the night is higher due to the continuous charging of the EV.
Figure 11.
Waveforms associated to case 2 for a 24 hours period. (a) Overall power balance. (b) EV power flow and SOC. (c) BES power flow and SOC.
Figure 11.
Waveforms associated to case 2 for a 24 hours period. (a) Overall power balance. (b) EV power flow and SOC. (c) BES power flow and SOC.
Figure 11b shows the power demanded by the EV and the evolution of its SOC over time. As in case 1, it is important to mention that between 08:00 and 23:00 hrs there is no knowledge of the evolution of the SOC. This is marked as a gray zone in
Figure 11b where the SOC is kept constant only for simulation purposes.
Finally,
Figure 11c shows the flow of power through the BES and the evolution of its SOC over time. Unlike in case 1, the usage of the BES is less harsh and its average SOC is higher (61% vs 53%). It can be observed that the most demanding operation is the storage of surplus PV power that recharges the BES in approximately 4 hours. In the last part of the EV charging (from 06:00 until 08:00), the BES is emptied in nearly 2 hours, but this is because this portion of the charging period overlaps with the power demanded by the campus building.
4. Conclusions
This work reported the results of a project consisting of designing and evaluating a photovoltaic greenhouse as an energy hub in modern agriculture. The system also integrates battery energy storage and an electric vehicle charging station. The greenhouse is composed of 48 semi-transparent PV panels with nominal transparency of 20% and 110 W capacity.
Regarding energy production, it was empirically verified that ST-PVG would tend each year to produce less energy than theoretically predicted. For the period analyzed, an average production loss from one period to another of 6.8% was calculated. This tendency to lose production is mainly governed by the inevitable progressive loss of efficiency of the PV system and by the dirt accumulated on the panels. This last factor works as a disturbance since the panels are partially cleaned after rain. This empirically determined production loss factor is essential because it represents a realistic figure to estimate the production of a PVG under actual operating conditions and without considering panel cleaning.
Another aspect evaluated in this work was the performance of the ST-PVG as an energy hub considering EV charging. Two cases were studied over a 24 hour period: a private car that charges during the day in a short period and a corporate car that charges at night over a longer period of time and at much lower power. To be able to operate as an energy hub without buying much energy from the grid, the greenhouse has to integrate a BES. Simulation results indicate that in both scenarios, the integrated BES is capable of balancing power transactions within the microgrid, however, the case of the corporate car is less demanding on the BES in terms of abrupt power transitions and the average depletion of its SOC.
Acknowledgments
This work has been partially funded by the O’Higgins Regional Government through project FIC/IDI/30487884-0. The authors appreciate the support of FONDAP SERC Chile No1522A0006, and Thematic Network RIBIERSE-CYTED 723RT0150.
Abbreviations
The following abbreviations are used in this manuscript:
| Agrivoltaic |
Integration of photovoltaic energy systems in agriculture. |
| BES |
Battery Energy Storage. |
| EH |
Energy Hub. |
| EV |
Electric Vehicle. |
| MPC |
Model-Based Predictive Control. |
| PV |
Photovoltaic. |
| PVG |
Greenhouse with conventional PV panels. |
| SOC |
State Of Charge. |
| ST-PVG |
Greenhouse with Semi-Transparent PV panels. |
References
- Mamun, M.A.A.; Dargusch, P.; Wadley, D.; Zulkarnain, N.A.; Aziz, A.A. A review of research on agrivoltaic systems. Renewable and Sustainable Energy Reviews 2022, 161, 112351. [Google Scholar] [CrossRef]
- Weselek, A.; Ehmann, A.; Zikeli, S.; Lewandowski, I.; Schindele, S.; Högy, P. Agrophotovoltaic systems: applications, challenges, and opportunities. A review. Agronomy for Sustainable Development 2019, 39, 35. [Google Scholar] [CrossRef]
- Torres, M.; Burgos, C.; Casagrande, D.; Muñoz, D.; Pinto, M.; Candia, G.; Reyes, H.; Acuña, B. The Photovoltaic Greenhouse as Energy Hub for a More Sustainable Agriculture. In Proceedings of the 2022 IEEE International Conference on Automation/XXV Congress of the Chilean Association of Automatic Control (ICA-ACCA); 2022; pp. 1–6. [Google Scholar] [CrossRef]
- Mohammadi, M.; Noorollahi, Y.; Mohammadi-ivatloo, B.; Yousefi, H. Energy hub: From a model to a concept – A review. Renewable and Sustainable Energy Reviews 2017, 80, 1512–1527. [Google Scholar] [CrossRef]
- Mohammadi, M.; Noorollahi, Y.; Mohammadi-ivatloo, B.; Hosseinzadeh, M.; Yousefi, H.; Khorasani, S.T. Optimal management of energy hubs and smart energy hubs – A review. Renewable and Sustainable Energy Reviews 2018, 89, 33–50. [Google Scholar] [CrossRef]
- Sekiyama, T.; Nagashima, A. Solar Sharing for Both Food and Clean Energy Production: Performance of Agrivoltaic Systems for Corn, A Typical Shade-Intolerant Crop. Environments 2019, 6. [Google Scholar] [CrossRef]
- Dupraz, C.; Marrou, H.; Talbot, G.; Dufour, L.; Nogier, A.; Ferard, Y. Combining solar photovoltaic panels and food crops for optimising land use: Towards new agrivoltaic schemes. Renewable Energy 2011, 36, 2725–2732. [Google Scholar] [CrossRef]
- Dinesh, H.; Pearce, J.M. The potential of agrivoltaic systems. Renewable and Sustainable Energy Reviews 2016, 54, 299–308. [Google Scholar] [CrossRef]
- Ravi, S.; Macknick, J.; Lobell, D.; Field, C.; Ganesan, K.; Jain, R.; Elchinger, M.; Stoltenberg, B. Colocation opportunities for large solar infrastructures and agriculture in drylands. Applied Energy 2016, 165, 383–392. [Google Scholar] [CrossRef]
- Marin, L.G.; et al. Hierarchical Energy Management System for Microgrid Operation Based on Robust Model Predictive Control. Energies 2019, 12, 4453. [Google Scholar] [CrossRef]
- Sharma, S.; Sood, Y.R. Microgrids: A Review of Status, Technologies, Software Tools, and Issues in Indian Power Market. IETE Technical Review 2022, 39, 411–432. [Google Scholar] [CrossRef]
- Wang, L.; Li, Y. Research on Niche Improvement Path of Photovoltaic Agriculture in China. International Journal of Environmental Research and Public Health 2022, Vol. 19. https://www.mdpi.com/1660-4601/19/20/13087.
|
Disclaimer/Publisher’s Note: The statements, opinions and data contained in all publications are solely those of the individual author(s) and contributor(s) and not of MDPI and/or the editor(s). MDPI and/or the editor(s) disclaim responsibility for any injury to people or property resulting from any ideas, methods, instructions or products referred to in the content. |
© 2023 by the authors. Licensee MDPI, Basel, Switzerland. This article is an open access article distributed under the terms and conditions of the Creative Commons Attribution (CC BY) license (http://creativecommons.org/licenses/by/4.0/).
