Preprint
Article

Relationship Between Water Quality and Phytoplankton in Reservoirs of the Ebro Basin (Spain) During the Period of 2010–2015

This version is not peer-reviewed.

Submitted:

19 December 2023

Posted:

20 December 2023

You are already at the latest version

Abstract
The phytoplankton community in 66 reservoirs ubicated at the hydrographic basin of the Ebro River (Spain) was analyzed. Samples were collected in the summer season during the period 2010-2015, with the main purpose of evaluate the Trophic State and Ecological Potential according to the Water Framework Directive of the European Union. In this work we presented a representative overview of several consecutive years of the state of the reservoirs and their associated trophic status; methodology was to obtain statistically significant relationships between the phytoplankton community and main physicochemical water quality variables (water transparency, pH, chlorophyll a, total and soluble phosphorus, anoxic zone depth, nitrite, nitrate and ammonium concentrations). We provide data for retrospective comparative of the state of the reservoirs with previous and current studies in order to improve the management of these reservoirs, and to serve as data reference for future works in a context of global change (climate and pollution).
Keywords: 
Subject: 
Biology and Life Sciences  -   Aquatic Science

1. Introduction

Phytoplankton can be defined as the set of primary producing microorganisms dispersed in the pelagic environment of aquatic systems [1]. This type of organisms presents a great variety of taxonomic genera, which means that their observation and identification is under continuous revision [2]. They constitute the primary source in the trophic network of aquatic ecosystems, and have great involvement in the biogeochemical cycles of the site [3], thus being a type of organism of ecological importance in the space and time of the area [4].
The factors that most influence their growth and development are light (photosynthetically active light, 400–700 nm), temperature, pH, inorganic nutrients (mainly phosphorus and nitrogen concentration), and the possible presence of other herbivorous and parasitic organisms [5]. The presence, volume and type of phytoplankton is related to water quality parameters, so its study gives us information indirectly on the trophic state of the water and more directly of the ecological state of the water body The study of phytoplankton therefore provides information on water pollution and eutrophication, making it a major biological indicator of ecological status and water quality [6].
Increasingly, and following the recommendations of the European Water Framework Directive (WFD) of the European Union, statistical techniques are used to obtain significant relationships between physicochemical variables of water quality status and existing phytoplankton populations, with the aim of having not only the physicochemical quality parameter but also the ecological quality of the aquatic mass, in order to be able to carry out greater conservation management to help mitigate such adverse ecological phenomena as eutrophication [7]. This is of current importance given that we find in a context of global change, both in terms of pollution and climate. Specifically in Spain, droughts that are more prolonged are expected, as well as higher temperatures, causing greater water evaporation, which together with less snow cover in the headwater areas will result in less recharge of the various rivers that comprise the basin. All this highlights the need to have a retrospective view of the quality (both ecological and physicochemical) of the various water bodies available for their better conservation management, given that their demand will be increasingly greater due to their scarcity [8].
In the present study, we have observed and identified the phytoplankton present in the samples collected in the summer season during the period 2010-2015, from the 66 different reservoirs located at the Spanish Ebro River Basin. Moreover, we have analyzed the main physicochemical parameters of water quality (water transparency, pH, total chlorophyll a, total and soluble phosphorus, anoxic zone depth, nitrite, nitrate and ammonium concentrations) of these samples, with the main objectives of: (1) To get a representative overview of several consecutive years of the Trophic State Index (TSI) as defined by Carlson [9] and OECD Reports [10] of the reservoirs and their associated ecological potential; (2) by means of a Principal Component Analysis (PCA) to obtain statistically significant relationships between the phytoplankton community and traditional physicochemical water quality variables, and (3) provide data for retrospective comparative of the state of the reservoirs with previous, current and future studies in order to improve the management of these reservoirs in in a context of global change (climate and pollution).
The present study provides a taxonomic study of the phytoplankton of this basin, the communities present and their relationship with each other and the related physicochemical variables. In this way, a relationship is established between the taxa and the trophic and ecological state of the environment and will allow subsequent studies in this basin as well as in other basins to verify whether certain taxa can be used as indicators of water quality.

2. Results

2.1. Physicochemical Variables

The mean, max and min values of each physicochemical variable studied in all samples are shown in Table 1. In general, the values corresponding to good quality indicators are found in the reservoirs of the Pyrenean zone (Cavallers or Sabiñanigo), while the values of bad quality correspond to small reservoirs (Lechago and La Tranquera) or located in poor quality rivers (El Val and Ribarroja). Most of the reservoirs have intermediate quality values for the indicator variables used.
Thus, it has been shown that those reservoirs with a higher eutrophic level estimated as TSI also present higher concentrations of chlorophyll a. This is shown graphically in Figure 1.
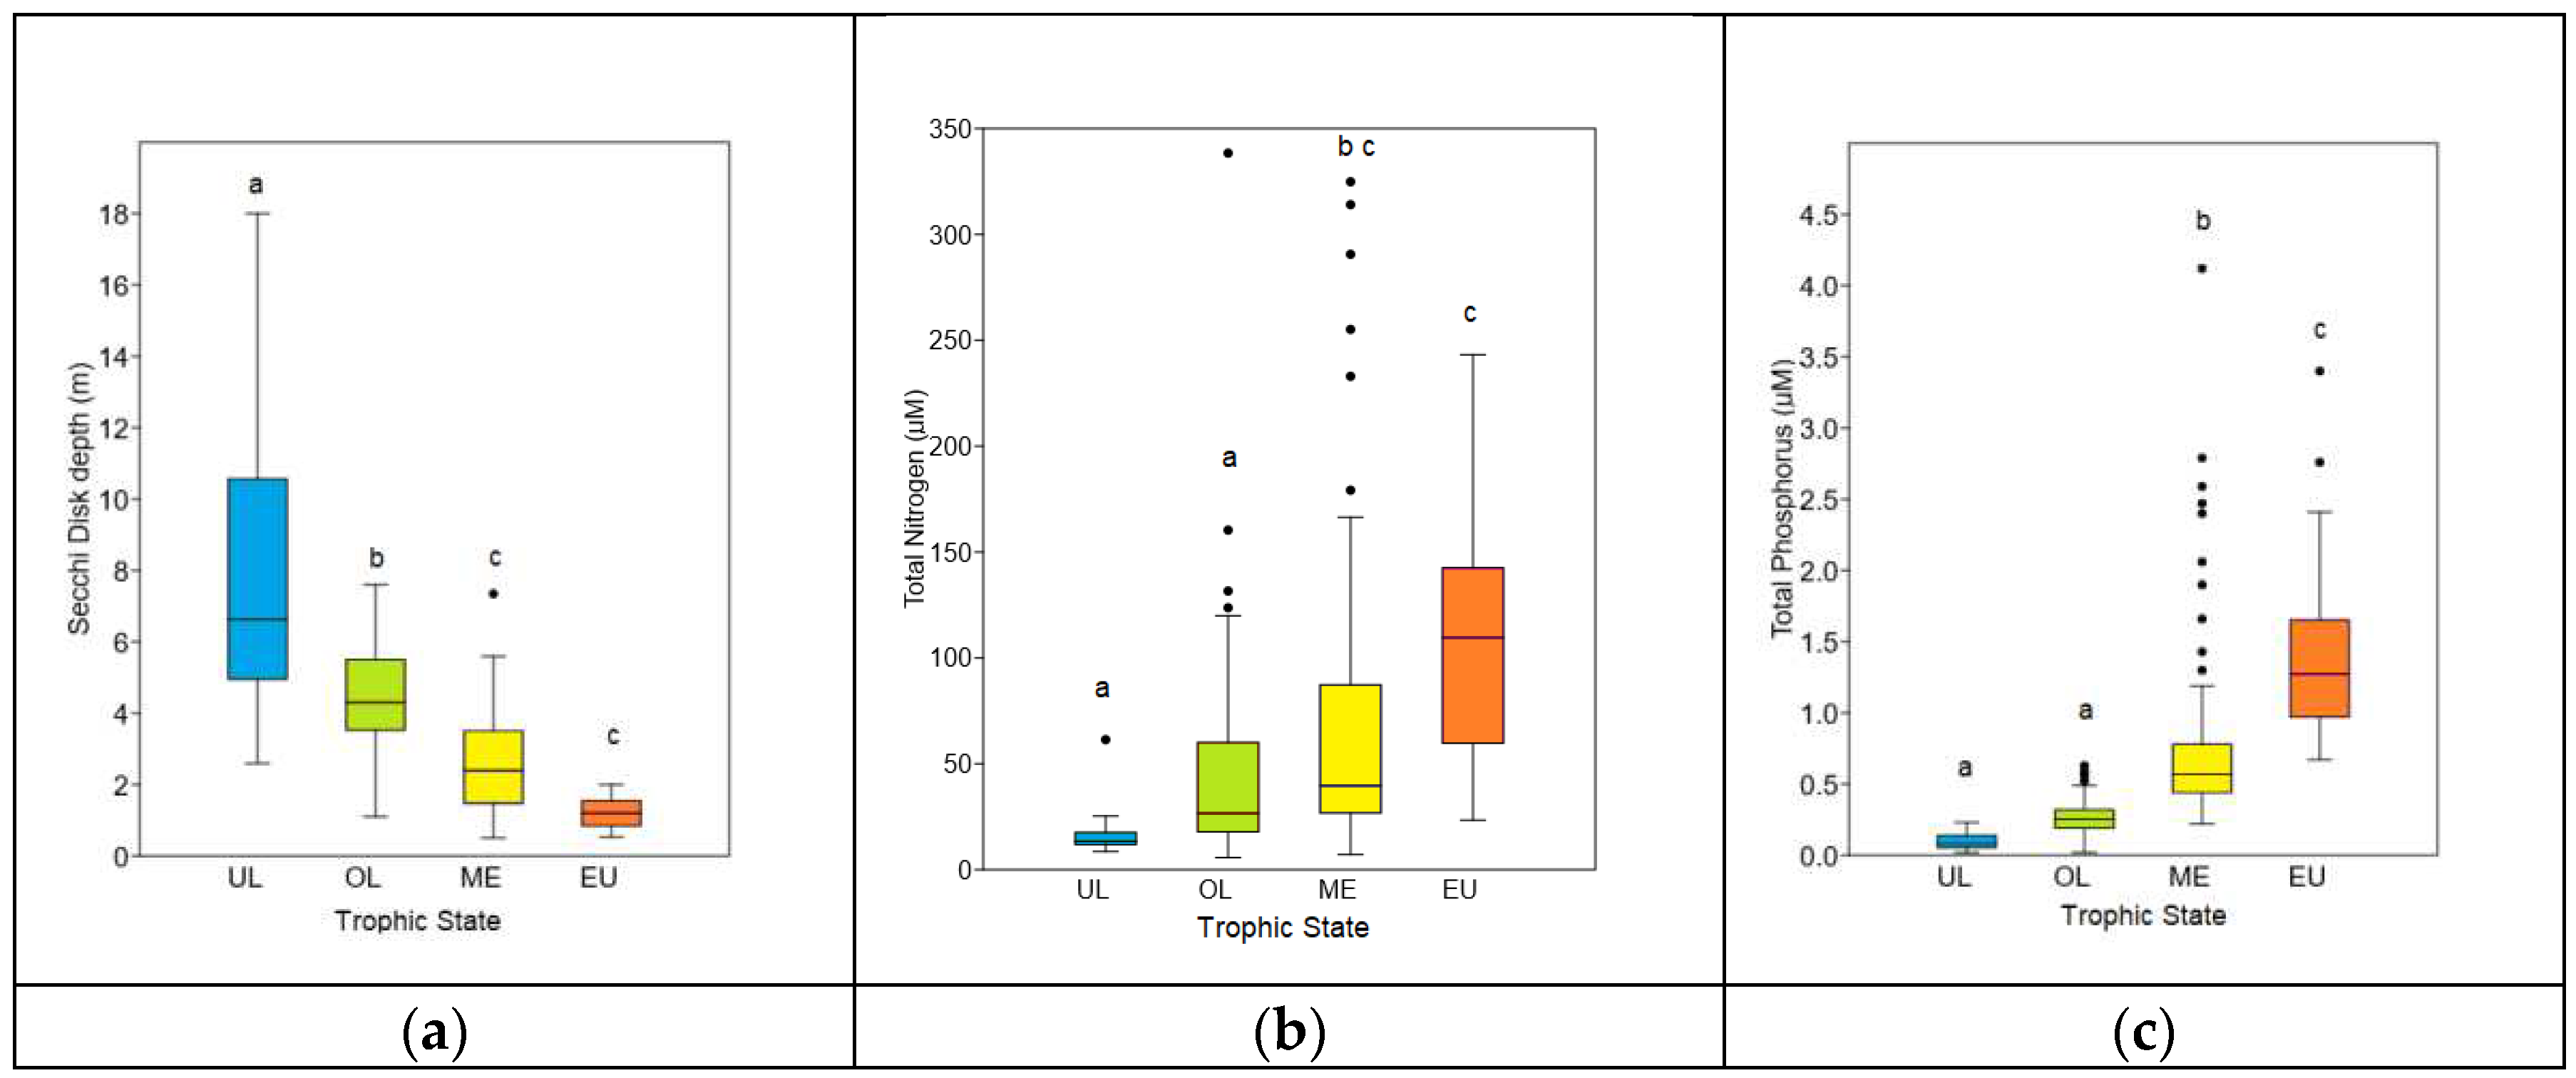
The OECD also designates nitrogen and total phosphorus as important and influential variables in the trophic state of the trophic masses, as well as transparency (Secchi disk depth). The relationship between the trophic state of the reservoirs and the value of these variables is shown in Figure 2. A strong positive relationship is observed in that the more phosphorus and total nitrogen higher trophic state, and in the case of transparency a strong relationship is also observed but negative, higher transparency is associate with lower trophic state.
It can also be observed that there are significant differences between the different trophic states with respect to the three variables considered (water transparency and nutrients represented by the concentration of total P and N). In the case of nitrogen, there are two groups: reservoirs in good condition on the one hand, and mesotrophic and eutrophic reservoirs on the other (Figure 2b).
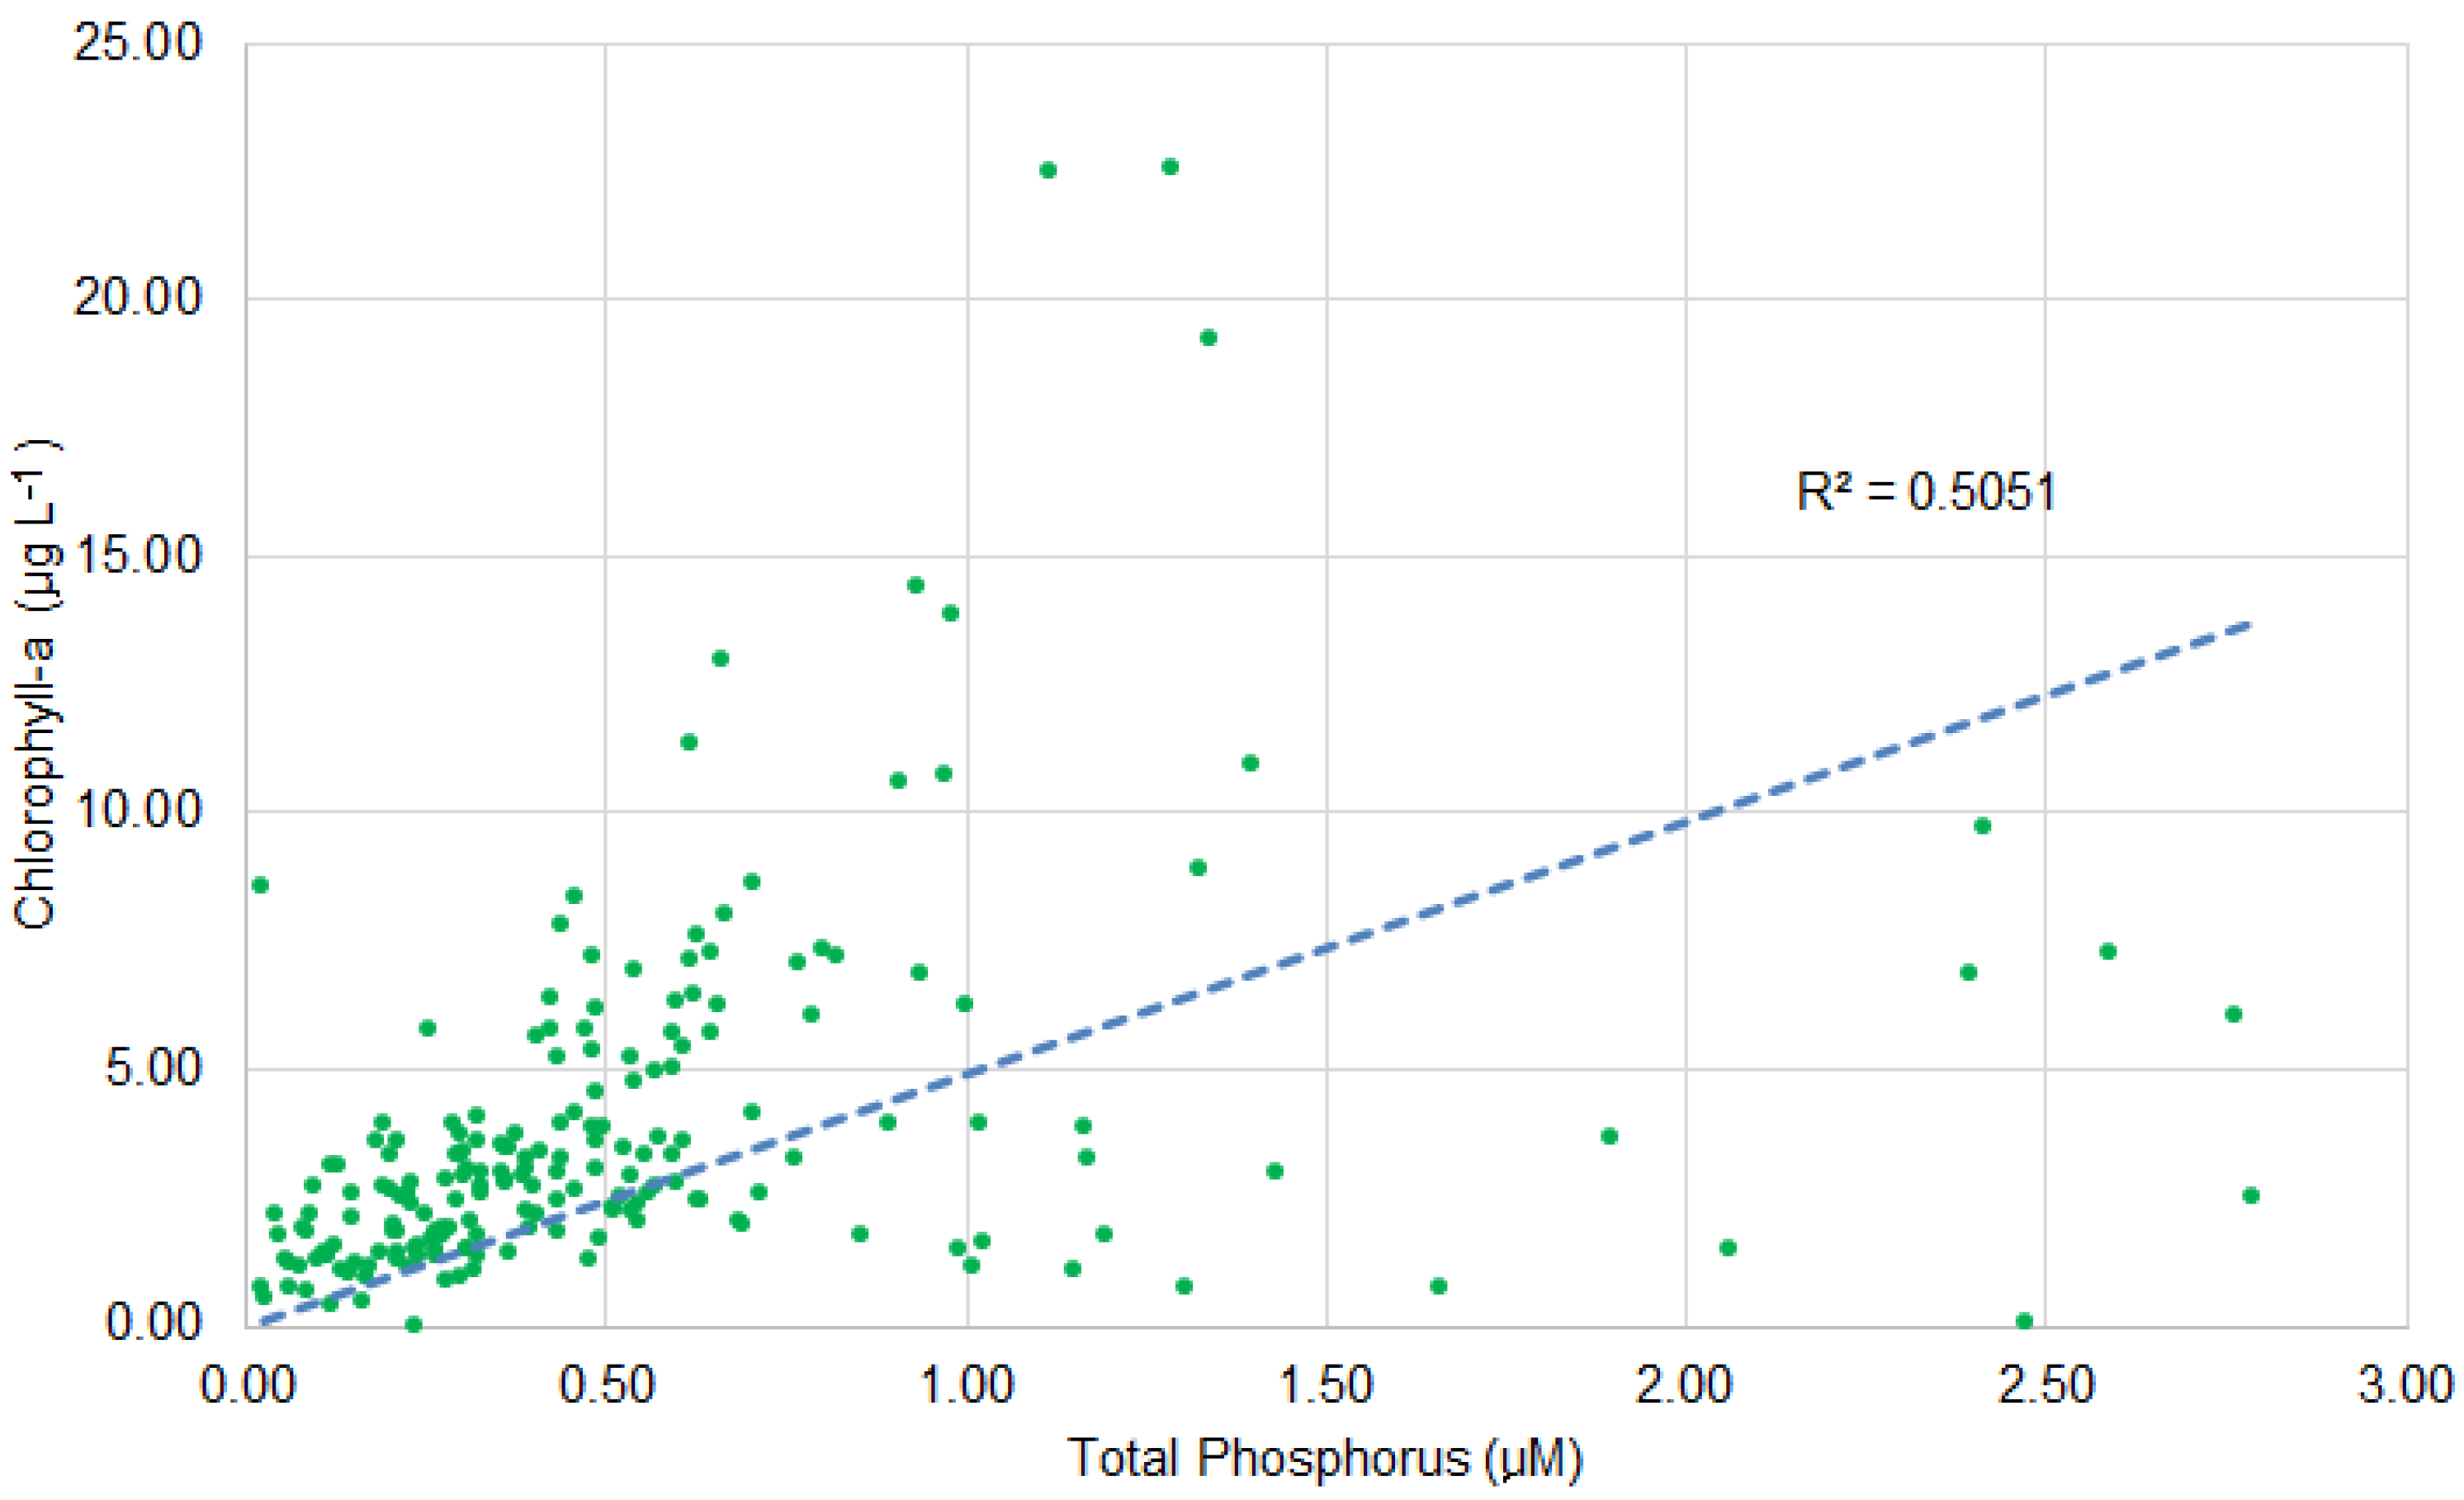
Likewise, it can be seen in Figure 3 a positive correlation in relation to the concentration of chlorophyll a and total phosphorus (r2 = 0.5051; n= 196; p <0.001).

2.2. Trophic State

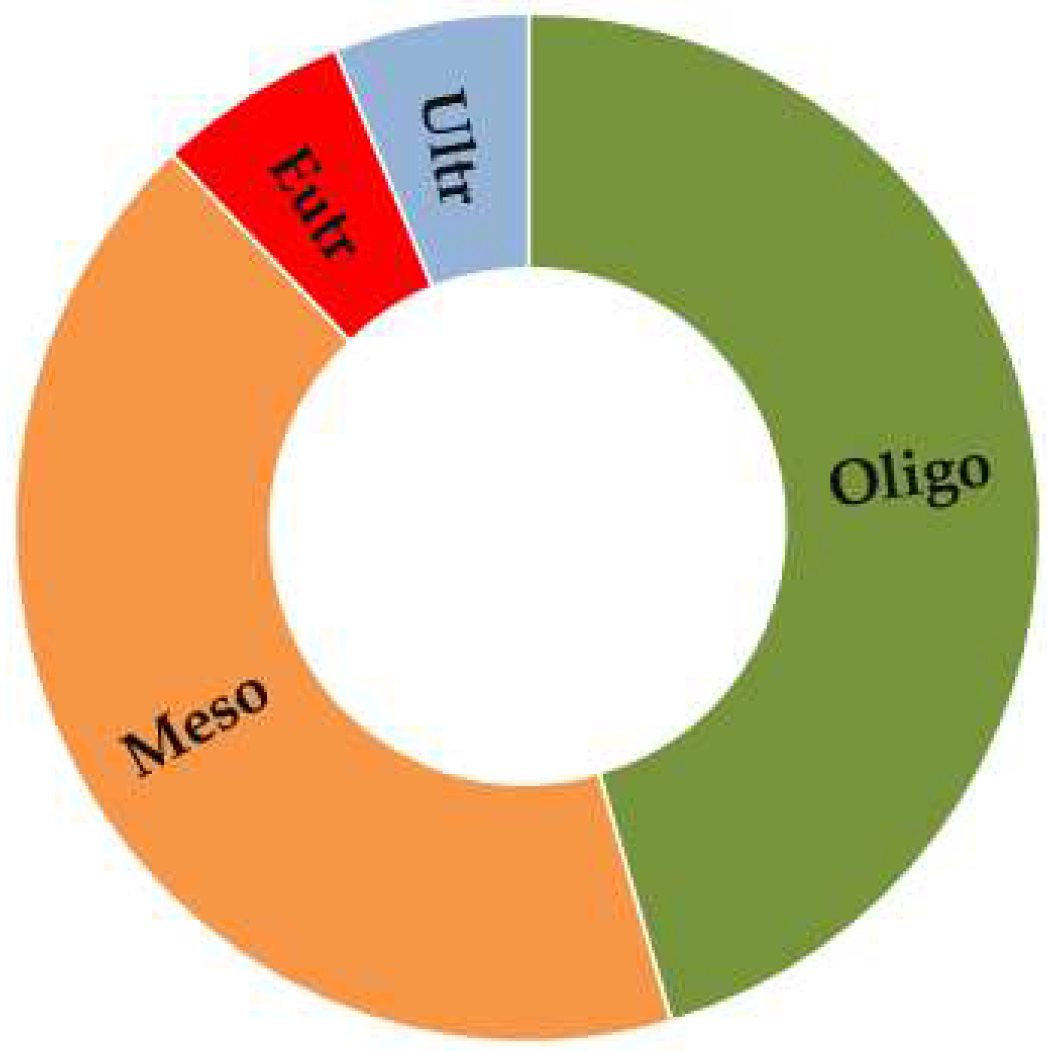
According to the OECD classification [10] of the chlorophyll a levels present in the 66 reservoirs of the Ebro Basin studied in this work, we found that 34 are ultraoligotrophic and oligotrophic reservoirs (51.5 % of the total), 28 are mesotrophic (42.42 % of the total), and only 4 are eutrophic (6.08 % of the total). This indicates, in general terms, that more than half of the reservoirs have chlorophyll a levels below 2.5 mg/L, which means that more than half of the reservoirs in the basin have good water quality, according to the monitoring reports on the quality of heavily modified water bodies carried out by the Ebro Hydrographic Basin Authority since 2006. This can be seen more graphically in Figure 4.

2.3. Biological Variables

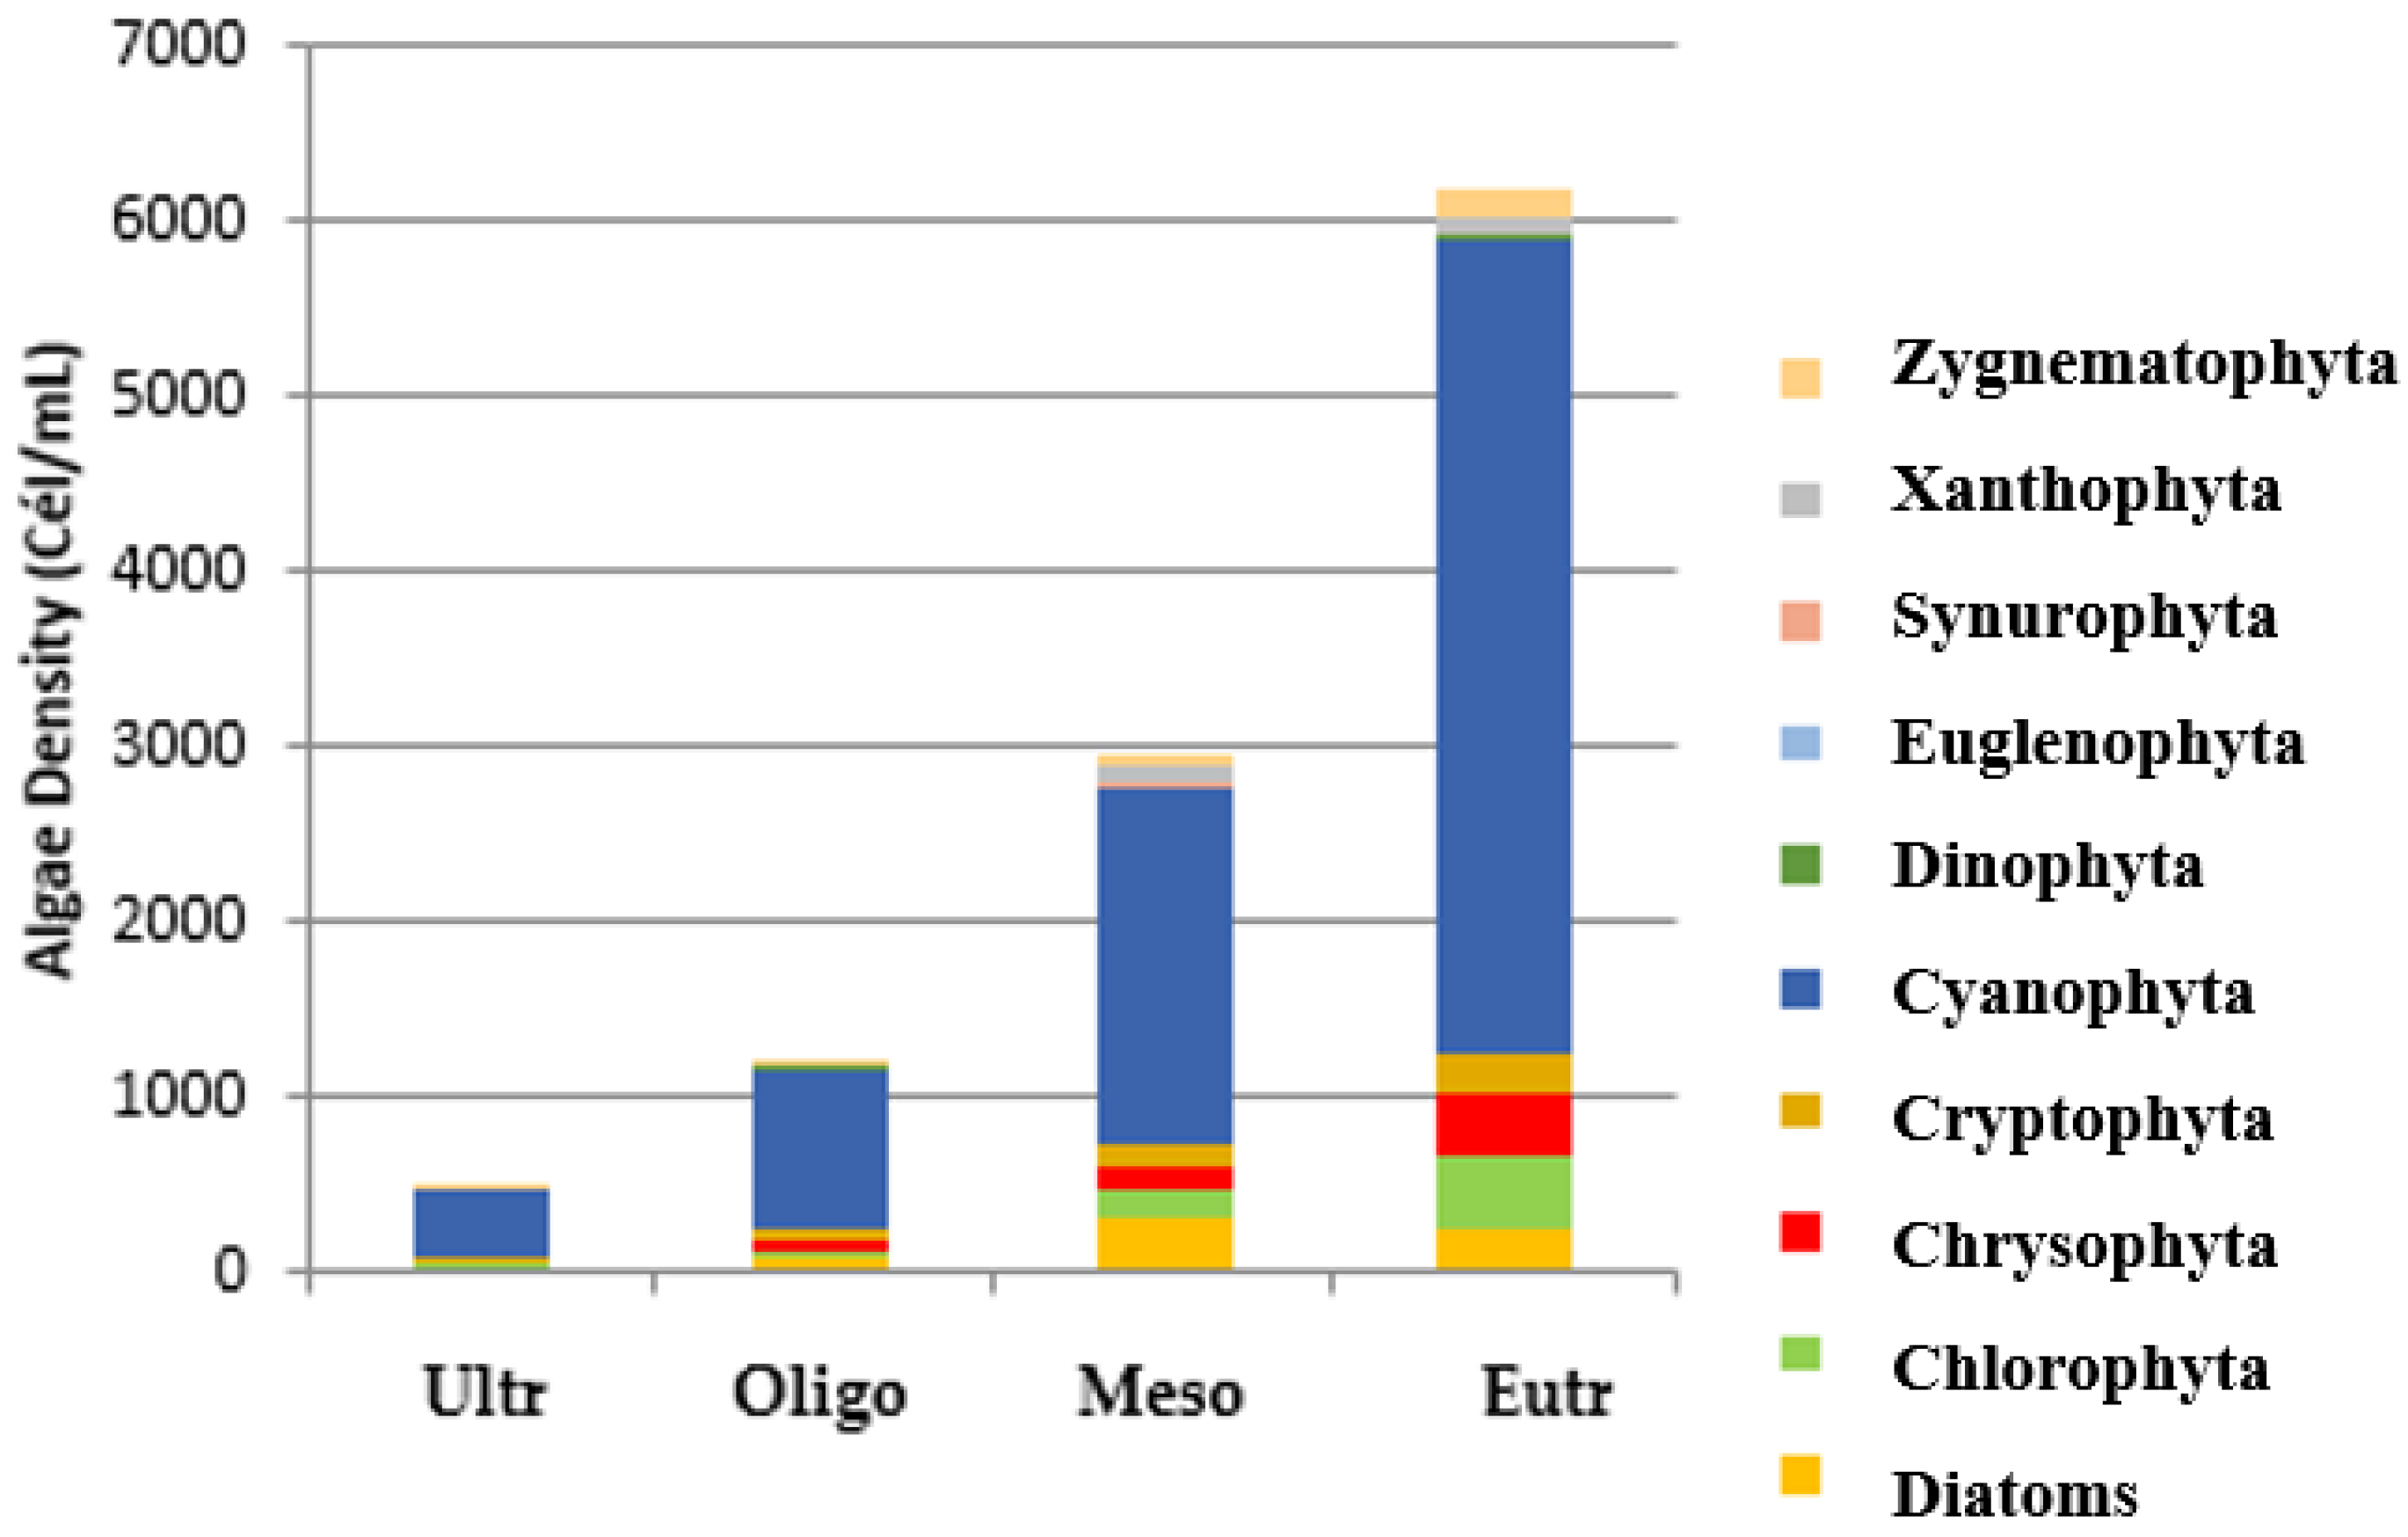
A total of 274 algal taxa belonging to 10 different taxonomic groups were found. The classification of phytoplanktonic taxa in the Classes present in the reservoirs studied, show that the most abundant taxonomic groups are the Cyanophyta, followed by the Diatoms, the Chlorophyta, and the Chrysophyta. Also to a lesser extent, the presence of Cryptophyta algae, Zygnematophyta algae, Xanthophyta algae, Synurophyta algae, Dinophyta algae and Euglenophyta algae has been observed. This can be seen in Figure 5.
About the total phytoplankton density, the reservoir with the greatest value is Caspe with 42897 individuals/mL, while the reservoir with the lowest phytoplankton density was Sabiñanigo reservoir with 78 individuals/mL.

2.4. Statistical Processing

For principal components analysis, we use only 227 taxa, eliminating those with only one presence and less than 2% of density. The explained variance for the fist component presented acumulative percentage with a value of around 24.44 %, a value that was considered low, so it was decided to group the different phytoplanktonic individuals by taxonomic functional groups following the classification proposed by Catalan in 2003 [11]. It was also decided to obtain the average values of the variables of each reservoir for each year, since if this were not the case, the graph that emerged from the analysis showed an overload of data that made it difficult to understand. Thus, a cumulative percentage of variance of 68.08 % was obtained in the analysis of the principal components.
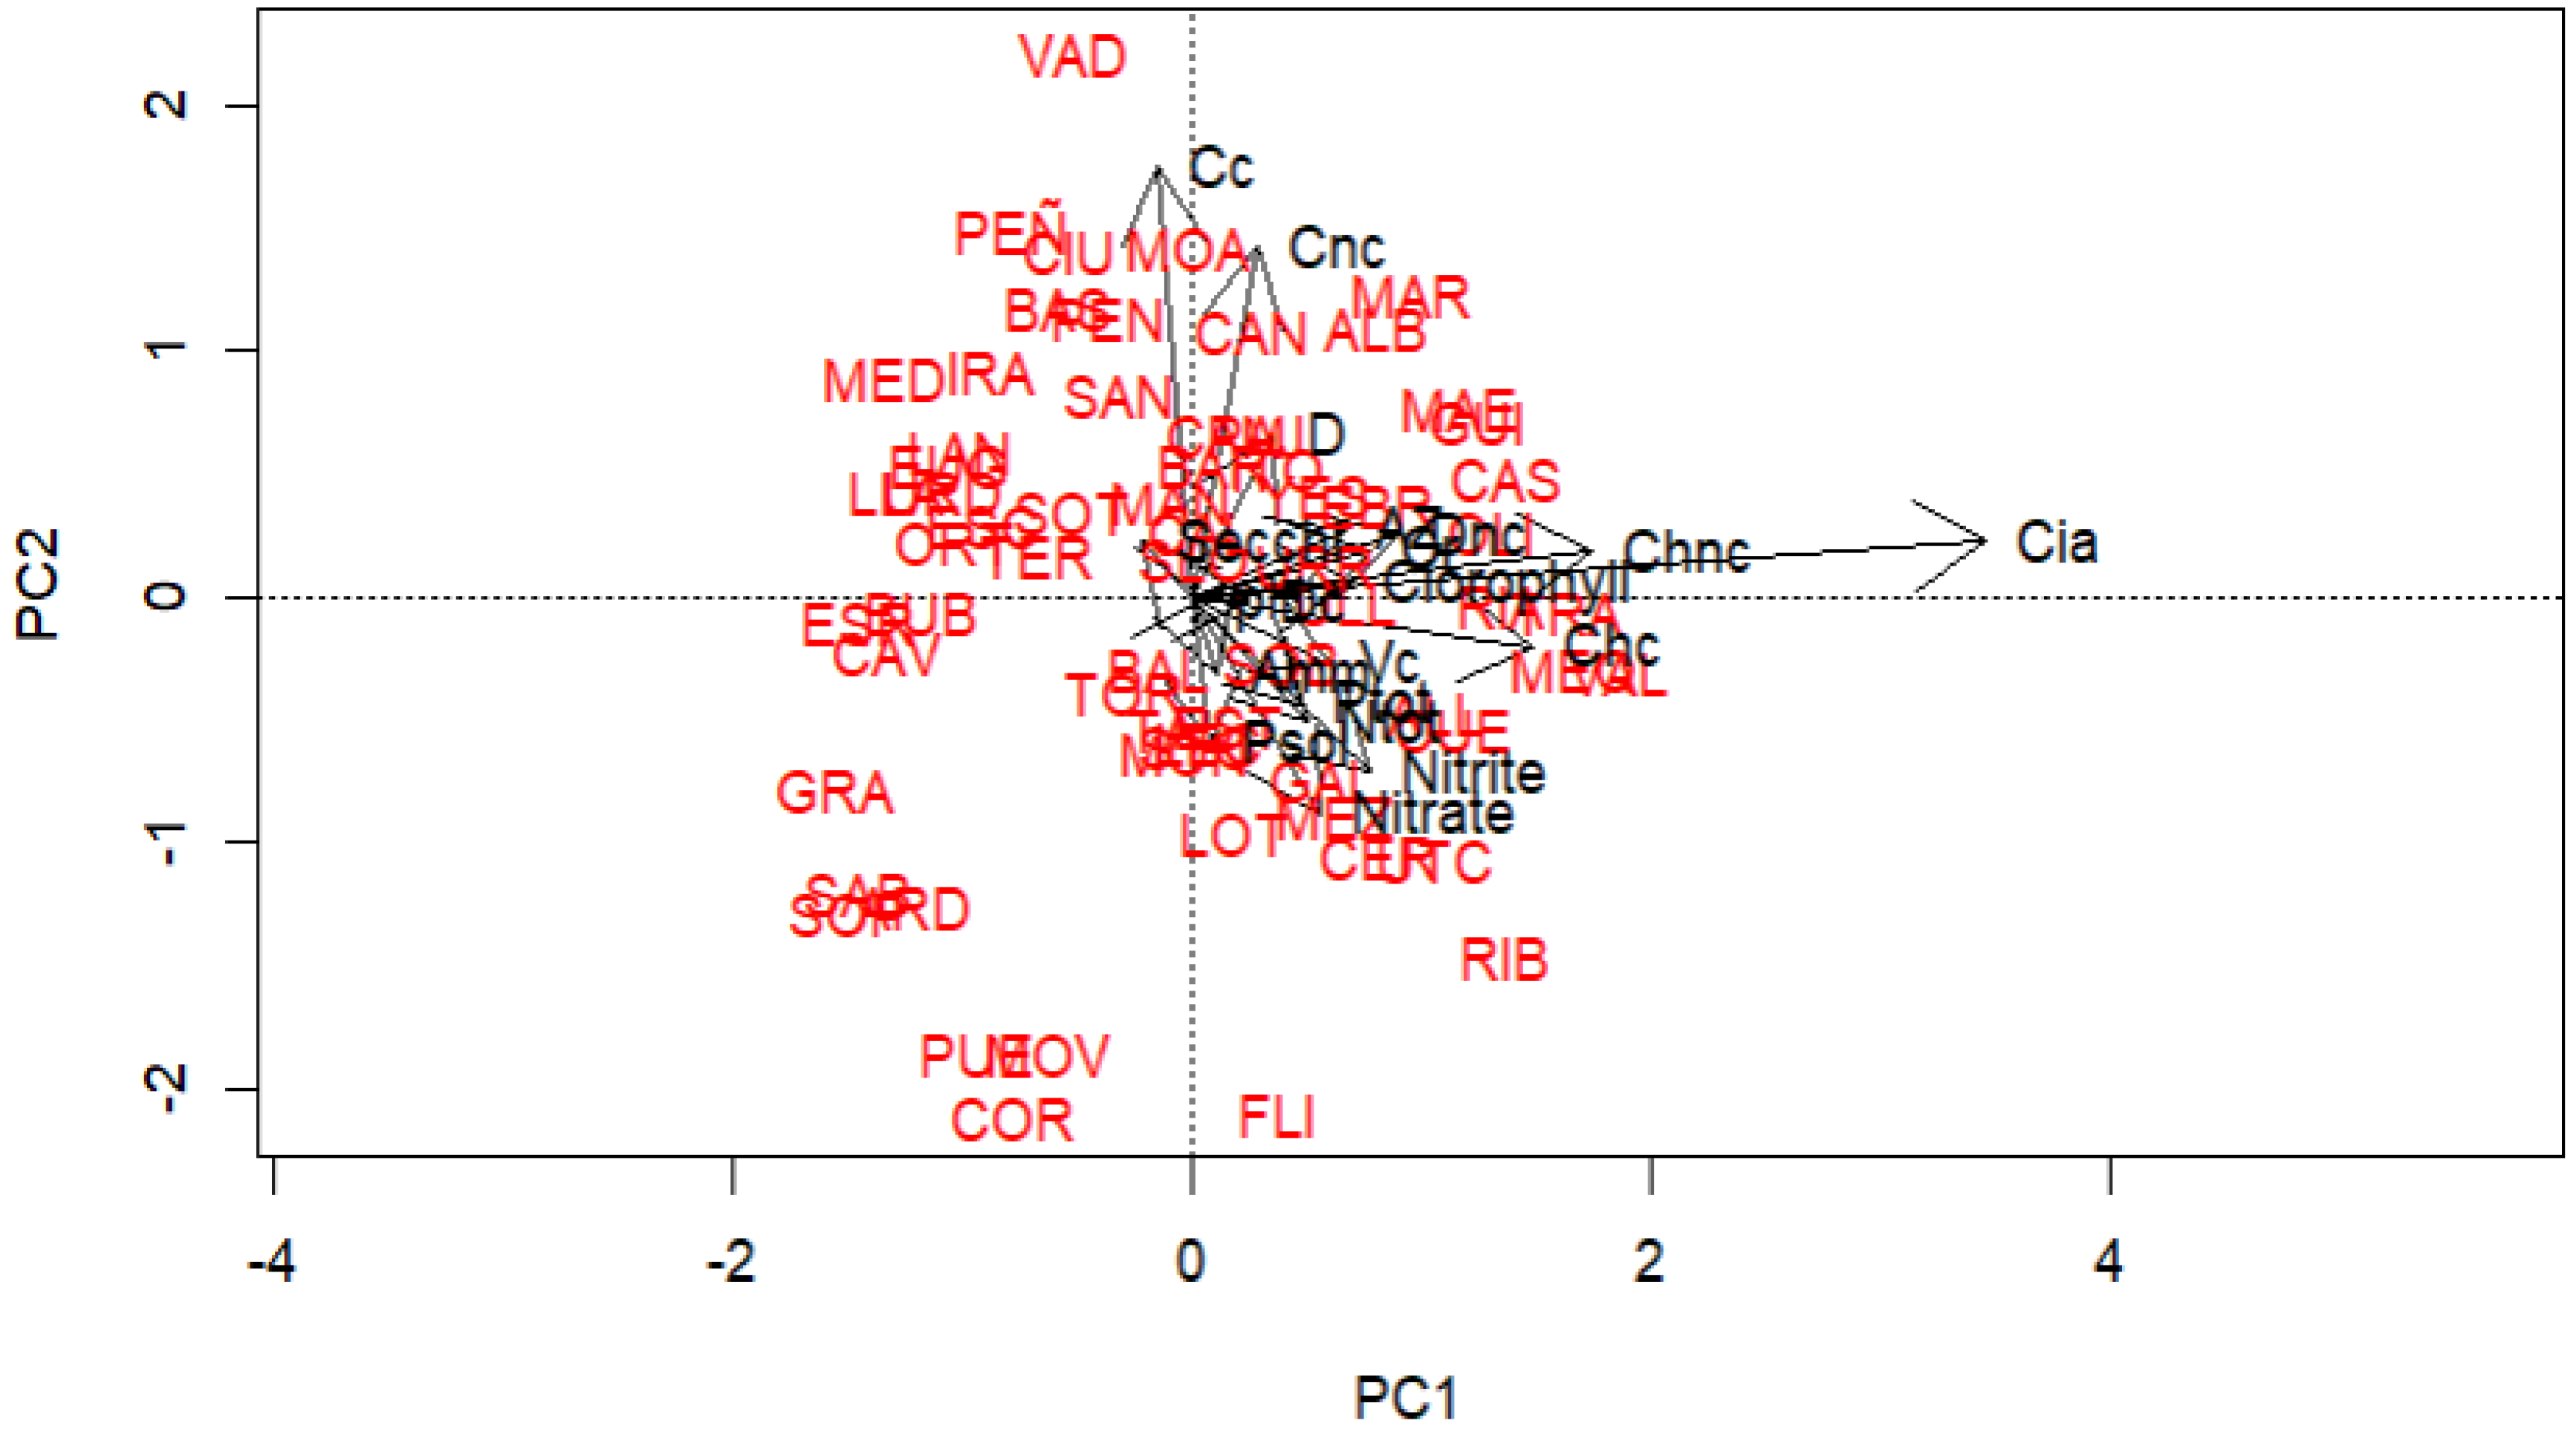
Figure 6 shows the graph obtained from the analysis of the main components, specifically axes 1 and 2, where in component 1 the variable with the greatest significant value is the Cyanobacteria (Cia), followed by the non-colonial Chlorococcal (Chnc) and the colonial Chlorococcal (Chc). In component 2 the variable with the greatest significance value is the colonial Chrysophyta (Cc). Those reservoirs (abbreviations of the reservoirs in appendix A) with more colonial Cyanobacteria and Chrysophyta are found on the positive side of axis 1 and 2, the reservoirs with Cyanobacteria but few colonial Chrysophyta are found on the positive side of axis 1 and negative side of axis 2, Reservoirs with few cyanobacteria but with enough colonial Chrysophyta are on the negative side of axis 1 and positive side of axis 2, and reservoirs with few colonial Chrysophyta and Cyanobacteria are on the negative side of axis 1 and 2. All physicochemcal variables are in positive value of the axis 1, except the Sechhi Disk.

3. Discussion

The nitrogen and phosphorus present in the medium constitute the main and limiting nutrients for the growth of some phytoplankton taxa, as well as for all aquatic plants in general [12]. Thus, the increase of total nitrogen and phosphorus in the medium causes eutrophy, leading to a situation of exponential growth of the phytoplankton mass present in the reservoirs and the consequent deterioration of water quality. The graph in Figure 2 shows that the higher the amount of nitrogen and total phosphorus, the higher the level of eutrophy and, therefore, the higher the density of phytoplankton and the lower the water quality. This statement coincides with the various studies carried out by Margalef, for example his studies at the lake of Banyoles [13], or more recently in the studies out in Czech reservoirs [14]. In this regard, the high total nitrogen observed in the Torcas reservoir is striking. This reservoir, however, is considered, and following the recommendations of the OECD, as mesotrophic. A more specific study would be needed, but this could be due to the fact that this reservoir is located in the Jalón river valley, which is characterized by a very extensive agricultural area, so the use of fertilizers in it may be the reason for this high value of nitrogen.
Likewise, Figure 3 shows a strong positive correlation between the values of the total phosphorus and chlorophyll a variables: the higher the amount of total phosphorus, the higher the amount of chlorophyll a present in the medium. This statement coincides with the studies carried out by Dasí in the reservoirs of the Jucar basin [15].
Regarding the trophic state of the reservoirs, and comparing them with the results of previous studies [9,16], specifically in the reservoirs studied by Hoyos [16] during 2004 (Ortigosa, Sobrón, Cereceda, Urrúnaga, Ullivarri, Talarn and Flix), during the period studied there are higher levels of chlorophyll a, with the exception of Flix, and highlighting the Cereceda reservoir, which goes from 1.41 mg/L in 1999 to 7.01 mg/L in 2015. Another interesting data is related to the Ribarroja reservoir, which according to the studies provided by Navarro, goes from 4.33 mg/L in 2002 to 10.24 mg/L in 2015. This gives us cause to affirm that a specific study would be necessary to know the reason for the increase in chlorophyll a in these reservoirs, and to specify more concisely that the Cereceda and Ribarroja reservoirs have increased their chlorophyll a level so disproportionately in 15 years.
In addition, Navarro [9] in their studies on the reservoirs of the Ebro basin during 2002, also analyzed the turbidity of their waters using the Secchi disk. Thus, comparatively, we observe that, in accordance with the above, the reservoirs that have increased the levels of chlorophyll a with respect to 2002 also have reduced the values of the Secchi disk (Canelles, Oliana, Talarn and Ribarroja) or have kept them the same (Escales, Santa Ana and Terradets), and those reservoirs that currently have less chlorophyll a with respect to 2002 have increased the values of the Secchi disk (Camarasa and Rialb). It should be noted that the San Lorenzo and Flix reservoirs do not coincide, because San Lorenzo has in 2015 higher Chlorophyll a level with respect to 2002 but also has higher Secchi disk values, and Flix has in 2015 lower chlorophyll a concentration but also lower Secchi disk values. This discordance, in the San Lorenzo reservoir may be due to the large number of macrophytes (which could release phytoplankton and therefore chlorophyll a values) and the fact that it is a reservoir that feeds a dam with electric generation (high water renewal rate, which could provide greater transparency [17]).
On the other hand, the present study has shown, by means of principal component analysis, that the physicochemical variables with the highest significance value, representing up to 83.5% of the total variance of the physicochemical values, and therefore the most influential from this point of view of water quality status, are in first place the presence of anoxic zone with a factor score of 0.97 on component 1, followed by nitrate with a score of 0.72 on component 2. This agrees with similar studies [18,19,20]. This statement may be of relevance for other studies looking for statistically significant associations between physicochemical variables and phytoplankton communities, with the aim of elaborating biological indices that show the ecological status of the considered aquatic bodies [21].
On the other hand, if we observe the distribution in the PCA of the taxonomic groups of the phytoplankton studied, we have obtained that the variables with the highest significance value were the algal functional group of Cyanobacteria for component 1 and the algal functional group of colonial Chrysophyta for component 2. Analyzing the graphs in Figure 5 and Figure 6 we observe that those reservoirs that we have qualified with a higher level of eutrophy show more content of Cyanobacteria and colonial Chrysophyta, and also that all physicochemical variables are associated with the algal groups, except for the Secchi disk values which gives us to affirm that the presence of these algal functional groups is negatively correlated with the state of water quality, making us see as a conclusion that these algal functional groups can serve as bioindicators of water quality in reservoirs [22]. This idea is in line with Hoyos study [11], which states that in reservoirs with a low level of eutrophy the dominant phytoplankton corresponds mainly to flagellate unicellular forms of various groups and that as the aquatic system becomes enriched with nutrients, and therefore increases its level of eutrophy, there is an increase in larger colonial forms and a transition towards more abundant chlorophytes and cyanobacteria.
It is also important to note that the Urrúnaga reservoir has medium-high values of cyanobacteria, but low level of eutrophy, specifically the reservoir is classified as oligotrophic. This may be due to the continuous inflows from another smaller and lower quality reservoir, the Ullivarri-Gamboa reservoir.

4. Study Site and Methods

4.1. Study Site

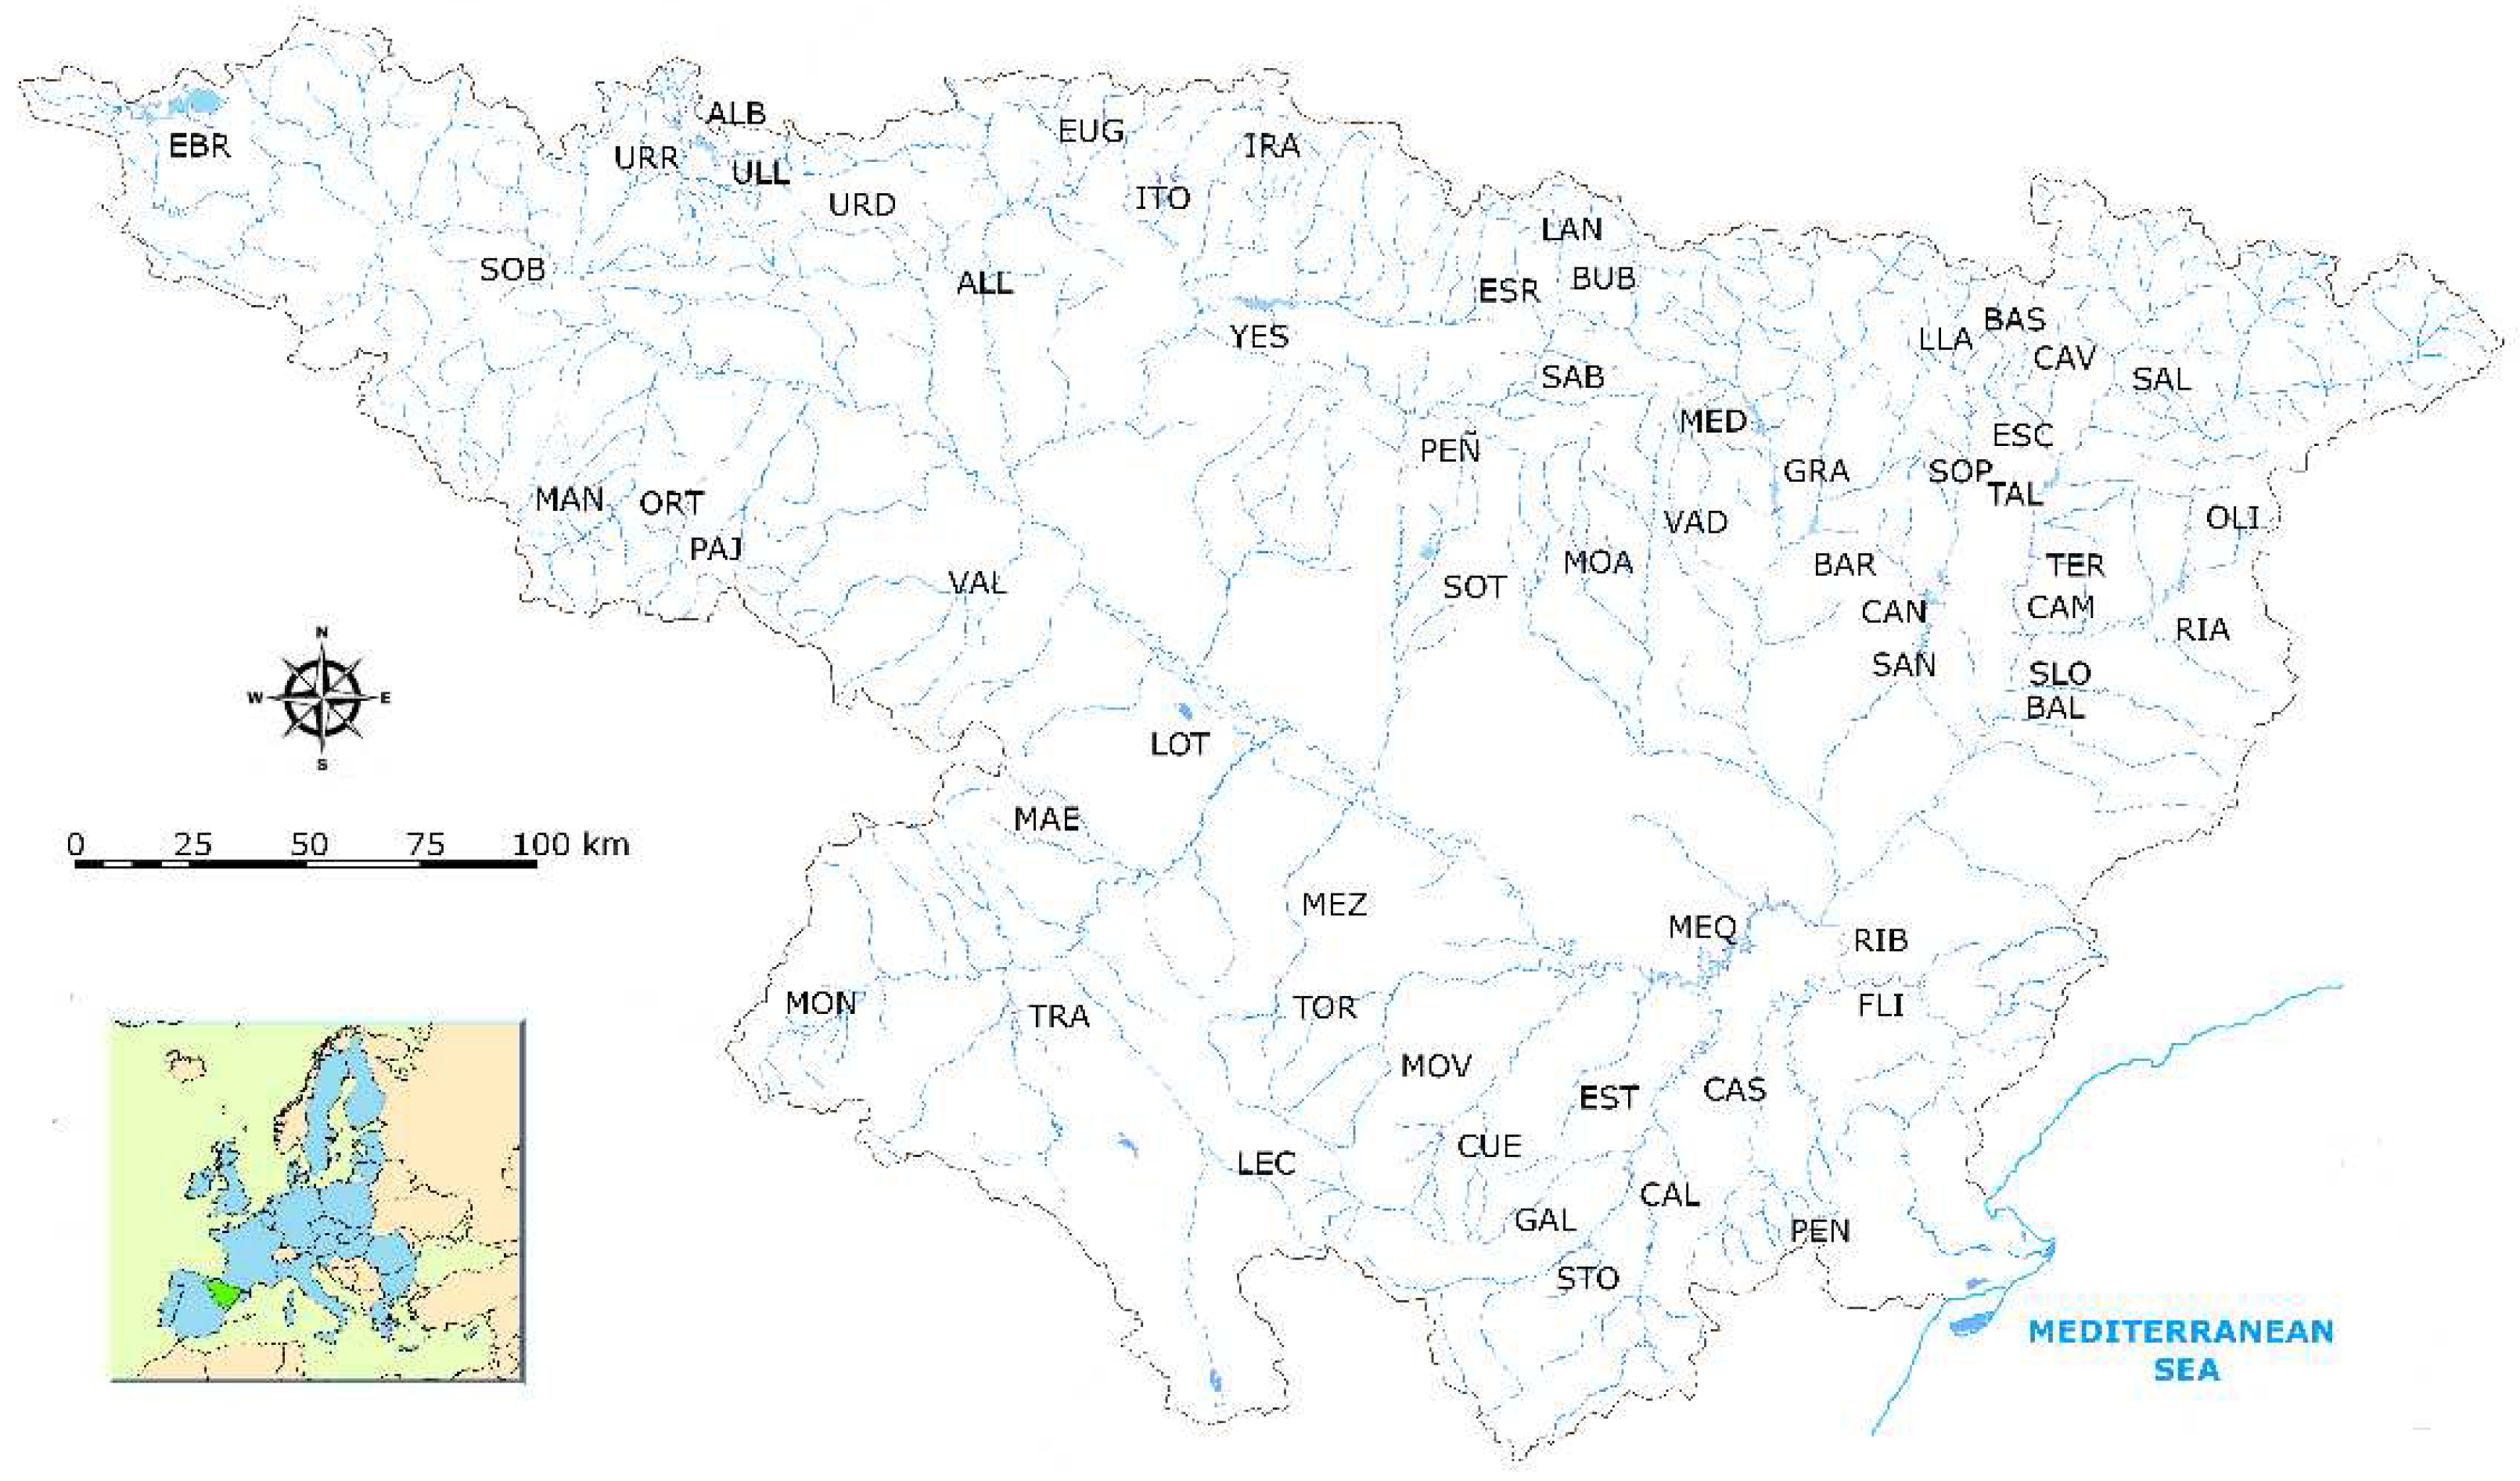
Data have been collected from samples of environmental variables and phytoplanktonic density in a total of 66 different reservoirs, all belonging to and distributed throughout the territorial demarcation of the Ebro River Basin Authority (the reservoirs, with their abbreviation, are geolocated in Figure 7. Given the size of this confederation, the second largest in Spain after the Douro, the different reservoirs studied are located in different lithological and climatic areas, attributing them heterogeneous characteristics. The abbreviations, as well as the year of sampling for each of the reservoirs, can be found in Appendix A.
Field sampling took place during the summer period from 2010 to 2015. According to the official methodology [23], a single sampling station was carried out at each of the reservoirs sampled, at the deepest part of the reservoir, at a distance of between 100 and 300 meters from the dam.

4.2. Physicochemical Variables

Ten environmental variables have been taken into account. Water transparency, pH, chlorophyll a, total phosphorus, soluble phosphorus, depth of anoxic zone, nitrite, nitrate and ammonium.
Two variables were determined in situ: water transparency, pH and depth of the anoxic zone. The transparency of the water was measured using the Secchi disc technique. The depth of the anoxic zone (determined from the dissolved oxygen) and the pH by means of a multiparametric probe, continuously along the vertical profile, approximately every 5 cm.
For the determination of total and soluble phosphorus, nitrate and nitrite the methodology described in the APHA 4500 was used [24]. For the total phosphorus was used 0.2 µg P/L as the limit of detection and quantification, for the soluble phosphorus was 0.1 µg P/L as the limit of detection and quantification, for nitrate and nitrite was used of 0,0003 mg N/L and a quantification limit of 0,01 mg. For determination of the ammonium, the method of indophenol was used [25], and for chlorophyll a, the analytical methodology described in the APHA 1200H method was used [24].
At the same time, the relationship between the total phosphorus and chlorophyll a variables was explored by means of a linear regression, as Dasí did in the reservoirs belonging to the Jucar basin [15].

4.3. Biological Variables

The biological variable considered in this study was phytoplankton density. The inverted microscope Utermöhl method was used for its determination, following the phytoplankton count standard EN 15204:2006 [26].

4.4. Statistical Processing

Trophic State Index was estimated as defined by Carlson [9], calculating the individual TSI value for Secchi Disk depth extinction vision, Total Phosphorus and Chlorophyll-a concentrations; after that, the final TSI was calculated as the average of the three individual values, and classified [10].
Significative differences between groups are explored with ANOVA analysis and Tukey’s pairwise post-hoc test according to Copenhaver & Holland [27] with PAST 4.11 software [28].
The PCA was conducted using the Rstudio software (version 1.1.463) with the command prcomp. The Excel Office (Microsoft, Redmond, USA) package (version 2016) it was used for standardizing data with neperian logarithm scale, except pH (as it is already standardized).

Acknowledgments

We are grateful to the Ebro Basin Authority (Ministry of Agriculture, Food and the Environment of the Government of Spain) for its support to the continuous sampling campaigns from 2009 to the present day, without which it would not have been possible to obtain the necessary data to carry out this study.

Data Availability Statement

The phytoplankton data are freely available at web page https://chebro.es in the individual reports of each year of each reservoir.

Conflicts of Interest

The authors declare no conflict of interest.

Appendix A

Table A1. Reservoirs studied with their abbreviature, years of sampling (two thousand and…), average value of samples for transparency as Secchi Disk depth and Chlorophyll-a concentration. Phytoplankton functional groups: Dc, colonial Diatoms; DNC, non-colonial Diatoms; Cc, colonial Chrysophyta; Cnc, non-colonial Chrysophyta; Chc, colonial Chlorococcal; Chnc, non-colonial Chlorococcal; Cia, Cyanophyta; Cr, Cryptophyta; D, Dinophyta; Vc, colonial Volvocales. Data values: - absent group; + present group to 10 cel/mL; 1, 10-99 cel/mL; 2, 102-103 cel/mL; 3, 103-104 cel/mL; 4, 104-105 cel/mL; 5, >105 cel/mL.
Reservoir Year Secchi Clorophyll Dc Dc Dnc Cc Cnc Chc Chnc Cia Cr D Vc
ALB 12,14,15 3,20 3,18 1 0 2 2 2 3 3 4 2 1 0
ALL 10,13,15 3,23 1,79 0 0 3 1 1 2 4 4 2 1 1
ARD 10,12 0,55 1,09 0 0 2 0 1 1 1 0 2 0 0
BAL 11,12,14,15 2,41 2,99 5 2 2 1 1 1 2 1 3 1 2
BAR 10,11,12,14 4,03 2,89 0 0 3 2 2 2 2 2 2 1 1
BAS 13,14 11,70 1,32 2 1 2 1 3 1 1 2 2 1 0
BUB 13,15 6,40 2,07 3 2 2 1 1 0 2 0 3 1 0
CAL 10,11,12,14 4,04 1,41 4 2 3 2 1 1 2 2 2 1 0
CAM 11,14 5,10 1,77 4 2 2 1 2 1 3 2 3 1 0
CAN 13 4,00 1,83 4 2 3 3 1 0 2 3 3 1 0
CAS 10,11,12,14,15 3,68 4,13 1 1 3 2 1 1 4 5 2 1 1
CAV 15 18,00 0,71 0 0 0 1 1 0 3 0 2 1 0
CER 11,12 1,23 7,01 4 2 2 0 0 1 3 4 3 0 0
CIU 11,12,14 6,17 1,08 2 1 2 2 2 1 3 1 2 1 1
COR 11,12 1,25 2,17 4 2 2 0 0 1 2 0 2 0 0
CUE 10,11,12,13,14,15 2,97 4,72 0 0 3 0 1 1 4 4 3 1 2
EBR 10,11,12,13,14,15 3,43 4,67 6 3 2 2 1 2 2 4 3 1 0
ESC 13 6,80 2,57 4 2 3 0 2 0 2 0 3 1 0
ESR 15 5,70 1,14 2 1 2 0 1 0 1 0 1 1 0
EST 15 1,30 3,31 0 0 2 2 0 1 4 2 2 0 0
EUG 11,13 5,55 2,26 3 1 2 2 1 0 2 0 2 0 0
FLI 10,11,12,14,15 4,57 1,30 4 2 2 0 0 1 2 3 2 0 0
GAL 10,11,12,13,14 2,85 3,34 0 0 3 0 1 2 3 2 2 0 2
GRA 13 7,30 1,22 1 1 2 0 1 0 1 0 1 0 0
GUI 10,11,12,13,14,15 2,63 4,66 3 1 3 2 1 3 3 4 3 1 1
IRA 12,14,15 5,17 2,29 2 1 3 3 1 1 2 0 2 1 0
ITO 11,13 5,30 0,95 2 1 2 2 2 2 2 3 2 1 0
LAN 13,15 5,98 1,26 3 1 2 1 2 0 3 0 3 1 0
LEC 10,11,12,13,15 3,99 5,42 0 0 2 0 1 2 4 1 3 2 0
LLA 15 17,00 0,54 5 2 2 1 2 0 2 0 2 1 0
LOT 11,12,13,14 1,53 4,94 0 0 3 0 0 2 3 2 3 1 0
MAE 14,15 1,55 6,70 1 1 4 2 2 1 3 3 3 1 1
MAN 10,13 4,80 2,66 6 2 2 2 0 0 3 2 3 0 2
MAR 12,13,14,15 2,57 3,39 1 0 2 2 2 3 4 3 3 1 1
MED 13 2,80 1,84 2 1 3 2 2 0 1 0 3 1 0
MEQ 10,11,12,13,14,15 4,25 3,99 4 2 3 0 2 2 3 4 3 1 2
MEZ 11,13,14,15 2,13 4,32 0 0 2 0 1 2 3 2 3 1 1
MOA 12,14 3,33 2,43 1 0 2 2 2 1 3 2 2 1 0
MON 11,12,14,15 1,45 2,12 1 1 3 0 2 1 3 1 2 0 1
MOV 12,13 2,10 1,73 0 0 1 0 0 1 1 1 2 0 1
OLI 10,11,12,14,15 2,57 7,92 6 2 2 0 3 2 3 4 3 1 2
ORT 10,13 6,88 2,70 2 1 1 1 2 1 2 0 3 1 0
PAJ 10,11,14 5,13 2,33 3 1 1 1 1 1 3 3 2 1 0
PEN 10,13 4,11 1,82 1 1 3 2 2 1 2 2 2 1 0
PEÑ 10,12,13,14,15 1,12 3,96 0 0 2 3 3 1 2 0 3 1 0
PUE 12 2,55 2,03 4 2 1 0 0 1 1 0 3 0 2
RIA 10,11,12,13,14,15 2,56 5,20 4 2 3 0 2 2 4 4 3 1 0
RIB 10,11,12,14,15 3,14 10,24 7 3 3 0 1 2 3 4 3 1 1
SAB 13 2,60 0,01 0 0 2 0 0 0 0 2 0 0 0
SAN 10,11,14 3,84 1,58 2 1 2 2 2 1 2 1 2 1 1
SLO 10,14,15 2,03 2,68 5 2 3 2 1 1 2 2 2 1 2
SOB 10,11,12,13,14,15 2,75 6,81 5 2 3 1 1 2 2 2 3 1 2
SOP 15 4,25 0,40 4 2 2 0 0 0 1 0 1 0 0
SOT 10,11,13,15 2,54 2,81 3 1 2 2 1 1 3 0 2 1 1
STO 10,13 5,93 1,21 3 1 2 0 1 1 2 2 2 1 1
TAL 13 3,22 4,07 5 2 3 0 0 1 3 2 3 1 1
TER 10,12,14,15 0,79 2,07 3 1 2 2 1 0 1 1 2 1 0
TOR 10,11,13 4,33 2,42 2 1 3 2 1 1 2 1 3 1 0
TRA 10,12,13,14,15 3,31 10,62 2 1 3 1 1 2 4 4 3 2 1
ULL 10,12,13 5,10 3,29 5 2 2 1 2 1 2 3 3 1 1
URD 15 5,80 1,59 0 0 2 1 2 0 2 0 2 1 0
URR 10,11,12,13 5,11 2,48 5 2 2 1 2 1 2 3 3 0 1
UTC 12 0,98 9,71 5 2 3 0 2 2 3 3 3 0 0
VAD 10,14 0,70 6,05 5 1 2 0 0 1 2 2 2 0 0
VAL 11,12,13,14,15 5,20 2,51 0 2 3 3 2 0 1 2 2 1 1
YES 10,14,15 1,38 19,81 2 0 3 0 2 3 4 4 3 1 0

References

  1. Reynolds, C.S.; Irish, A.E. Modelling Phytoplankton Dynamics in Lakes and Reservoirs: The Problem of in-Situ Growth Rates. Hydrobiologia 1997, 349, 5–17. [CrossRef]
  2. Jones, V.J. The Diversity, Distribution and Ecology of Diatoms from Antarctic Inland Waters. Biodiversity & Conservation 1996, 5, 1433–1449. [CrossRef]
  3. Salmaso, N.; Naselli-Flores, L.; Padisák, J. Functional Classifications and Their Application in Phytoplankton Ecology. Freshwater Biology 2015, 60, 603–619. [CrossRef]
  4. Descy, J.-P.; Gosselain, V. Development and Ecological Importance of Phytoplankton in a Large Lowland River (River Meuse, Belgium). Phytoplankton in Turbid Environments: Rivers and Shallow Lakes 1994, 139–155. [CrossRef]
  5. Soria, J.M.; Montagud, D.; Sòria-Perpinyà, X.; Dolores Sendra, M.; Vicente, E. Phytoplankton Reservoir Trophic Index (PRTI): A New Tool for Ecological Quality Studies. Inland Waters 2019, 9, 301–308. [CrossRef]
  6. de Jonge, V.N.; Elliott, M.; Orive, E. Causes, Historical Development, Effects and Future Challenges of a Common Environmental Problem: Eutrophication. Nutrients and Eutrophication in Estuaries and Coastal Waters 2002, 1–19. [CrossRef]
  7. Barbe, J.; Lafont, M.; Mallet, L.; Mouthon, J.; Philippe, M.; Vey, V. Actualisation de La Méthode de Diagnose Rapide Des Plans d’eau Analyse Critique Des Indices de Qualité Des Lacs et Propositions d’indices de Fonctionnement de l’écosystème Lacustre. CEMAGREF, France 2003.
  8. Viviroli, D.; Archer, D.R.; Buytaert, W.; Fowler, H.J.; Greenwood, G.B.; Hamlet, A.F.; Huang, Y.; Koboltschnig, G.; Litaor, M.I.; López-Moreno, J.I.; et al. Climate Change and Mountain Water Resources: Overview and Recommendations for Research, Management and Policy. Hydrology and Earth System Sciences 2011, 15, 471–504. [CrossRef]
  9. Navarro, E.; Caputo, L.; Marcé, R.; Carol, J.; Benejam, L.; García-Berthou, E.; Armengol, J. Ecological classification of a set of Mediterranean reservoirs applying the EU Water Framework Directive: A reasonable compromise between science and management. Lake and Reservoir Management 2009, 25(4), 364-376. [CrossRef]
  10. Predictive Capability of U.S. OECD Phosphorus Loading-Eutrophication Response Models on JSTOR Available online: https://www.jstor.org/stable/25042007#metadata_info_tab_contents (accessed on 27 July 2022).
  11. Hoyos, C.; Catalan, J.; Dörflinger, G.; Ferreira, J.; Kemitzoglou, D. et al.. Water Framework Directive Intercalibration Technical Report: Mediterranean Lake Phytoplankton ecological assessment methods. Publications Office of the European Union, Scientific and Technical Research series, 2014, 65pp.
  12. Romero, J.R.; Antenucci, J.P.; Imberger, J. One- and Three-Dimensional Biogeochemical Simulations of Two Differing Reservoirs. Ecological Modelling 2004, 174, 143–160. [CrossRef]
  13. García-Berthou, E. Ramon Margalef, l’estany de Banyoles i Els Peixos. 2020.
  14. Rychtecky, P.; Rychtecky, R.; Znachor, P. Spatial Heterogeneity and Seasonal Succession of Phytoplankton along the Longitudinal Gradient in a Eutrophic Reservoir. Hydrobiologia 2011, 663(1), 175-186. [CrossRef]
  15. Dasí, M.J.; Miracle, M.R.; Camacho, A.; Soria, J.M.; Vicente, E. Summer Phytoplankton Assemblages across Trophic Gradients in Hard-Water Reservoirs. Hydrobiologia 1998, 369–370, 27–43. [CrossRef]
  16. Hoyos, C.; Negro, A.I.; Aldasoro-Martin, J.J. Cyanobacteria Distribution and Abundance in the Spanish Water Reservoirs during Thermal Stratification. Limnetica 2004, 23(1-2), 119-132.
  17. Jorgensen, S.E. The application of models to find the relevance of residence time in lake and reservoir management. Journal of Limnology 2003, 62(1s), 16-20.
  18. Gemelgo, M.C.P.; Mucci, J.L.N.; Navas-Pereira, D. Population dynamics: seasonal variation of phytoplankton functional groups in Brazilian reservoirs (Billings and Guarapiranga, São Paulo). Brazilian Journal of Biology 2009, 69, 1001-1013..
  19. Antoniades, D.; Michelutti, N.; Quinlan, R.; Blais, J.M.; Bonilla, S.; Douglas, M.S.V.; Pienitz, R.; Smol, J.P.; Vincenta, W.F. Cultural Eutrophication, Anoxia, and Ecosystem Recovery in Meretta Lake, High Arctic Canada. Limnology and Oceanography 2011, 56, 639–650. [CrossRef]
  20. Menzel, P.; Gaye, B.; Wiesner, M.G.; Prasad, S.; Stebich, M.; Das, B.K.; Anoop, A.; Riedel, N.; Basavaiah, N. Influence of Bottom Water Anoxia on Nitrogen Isotopic Ratios and Amino Acid Contributions of Recent Sediments from Small Eutrophic Lonar Lake, Central India. Limnology and Oceanography 2013, 58, 1061–1074. [CrossRef]
  21. Marchetto, A.; Padedda, B.M.; Mariani, M.A.; Lugliè, A.; Sechi, N. A Numerical Index for Evaluating Phytoplankton Response to Changes in Nutrient Levels in Deep Mediterranean Reservoirs. J. Limnol. 2009, 68, 106–121.
  22. Soria, J.M.; Montagud, D.; Sòria-Perpinyà, X.; Dolores Sendra, M.; Vicente, E. Phytoplankton Reservoir Trophic Index (PRTI): A New Tool for Ecological Quality Studies. Inland Waters 2019, 9, 301–308. [CrossRef]
  23. Spanish Government. M-LE-FP-2013 Protocolo de muestreo de fitoplancton en lagos y embalses (in Spanish). 2013, 18 pp. Available online: https://www.miteco.gob.es/es/agua/temas/estado-y-calidad-de-las-aguas/M-LE-FP-2013_Muestreo_Fitoplancton_Lagos%20y%20embalses_05_06_2013_tcm30-175286.pdf (accessed on 28 July 2022).
  24. American Public Health Association. Standard Methods for the Examination of Water & Wastewater. 2005, 1200.
  25. Verdouw, H.; van Echteld, C.J.A.; Dekkers, E.M.J. Ammonia Determination Based on Indophenol Formation with Sodium Salicylate. Water Research 1978, 12, 399–402. [CrossRef]
  26. Brierley, B.; Carvalho, L.; Davies, S.; Krokowski, J. Guidance on the Quantitative Analysis of Phytoplankton in Freshwater Samples. Report to SNIFFER (Project WFD80), Edinburgh, December 2007.
  27. Copenhaver, M.D.; Holland, B. Computation of the distribution of the maximum studentized range statistic with application to multiple significance testing of simple effects. Journal of Statistical Computation and Simulation, 1988, 30(1), 1-15. [CrossRef]
  28. Hammer, Ø.; Harper, D.A.T.; Ryan, P.D. PAST: Paleontological Statistics Software Package for Education and Data Analysis. Palaeontologia Electronica 2001, 4(1): 9.
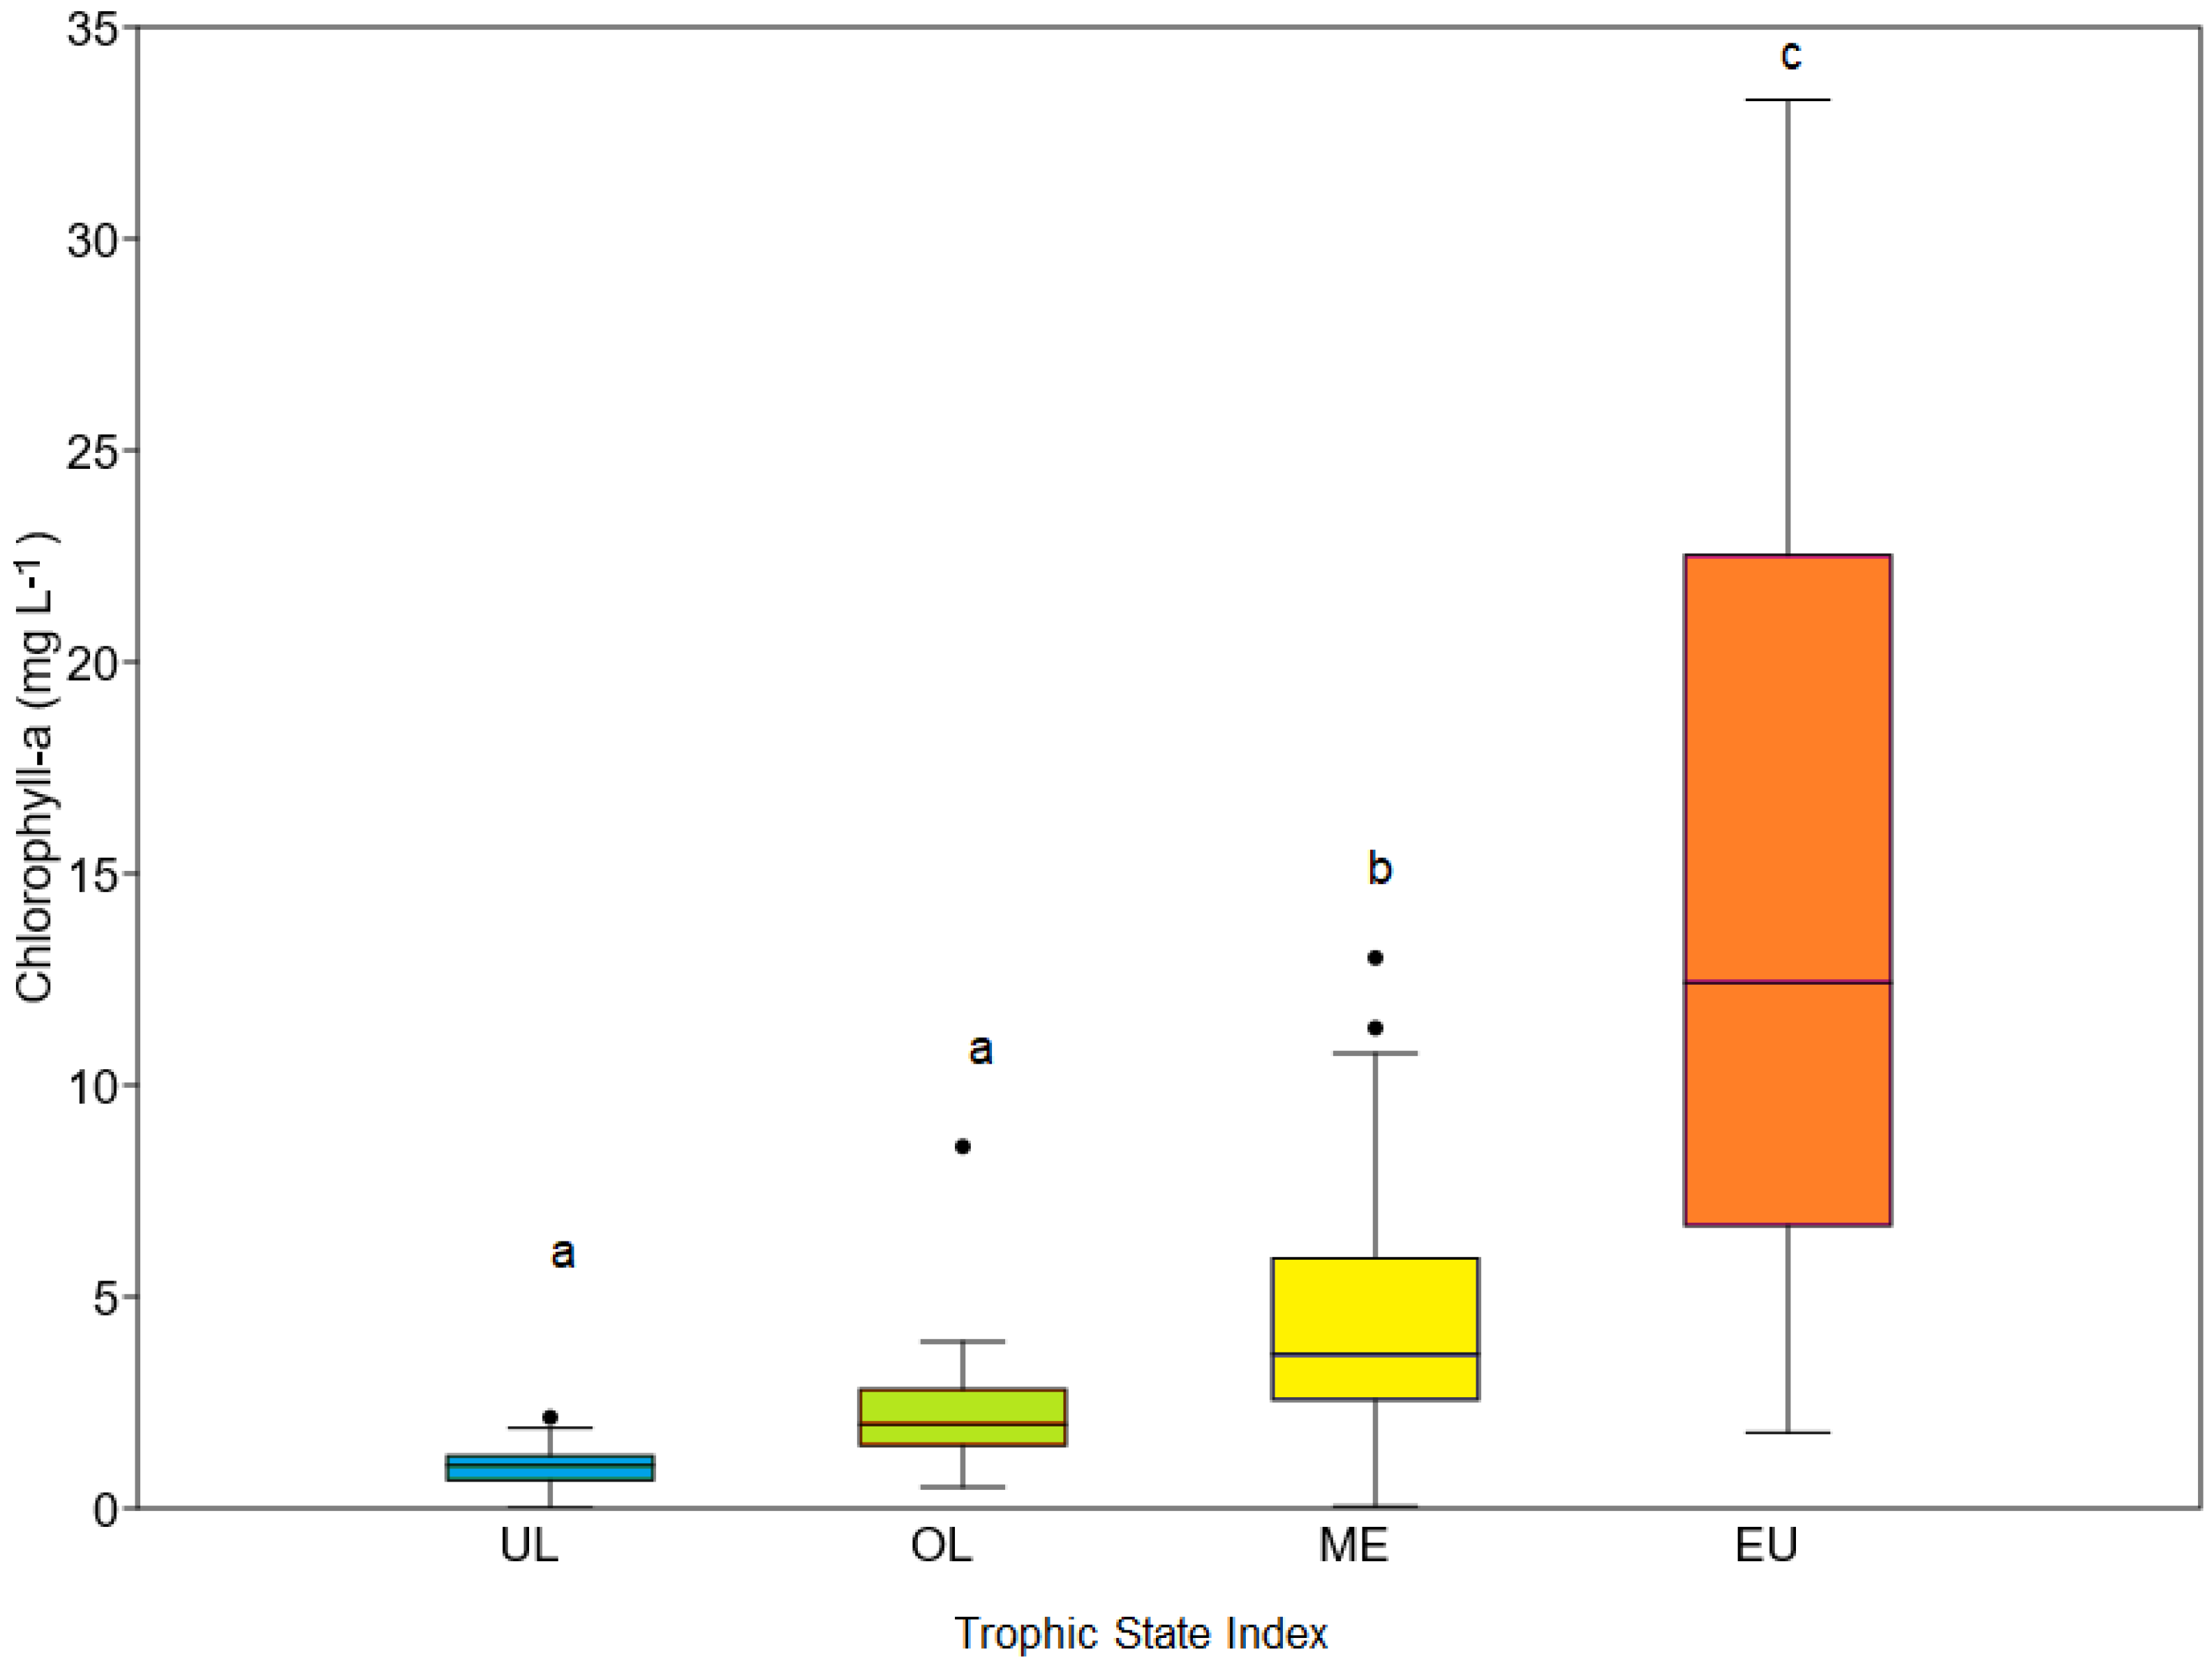
Figure 1. Chlorophyll a values for each group of reservoirs according to their trophic status. Trophic State: UL, ultraoligotrophic; OL, oligotrophic; ME, mesotrophic; EU, eutrophic. a, b, c indicates significative differences between groups.
Preprints 93842 g001
Figure 2. (a) Secchi Disk depth, (b) total nitrogen and (c) Total phosphorus values for each group of reservoirs according to their trophic status. Trophic State: UL, ultraoligotrophic; OL, oligotrophic; ME, mesotrophic; EU, eutrophic. a, b, c indicates significative differences between groups.
Preprints 93842 g002
Figure 3. Correlation of Total Phosphorus and Chlorophyll a values for the reservoirs considered, except outlier values.
Preprints 93842 g003
Figure 4. Trophic state of reservoirs according to OECD classification: Ultraoligotrophic, Oligotrophic, Mesotrophic and Eutrophic.
Preprints 93842 g004
Figure 5. Mean values of different taxonomic groups as a function of the trophic state.
Preprints 93842 g005
Figure 6. Principal Components Analysis of data. Reservoir names according to Table A1; vectors indicate score of each variable considered; names according to abbreviation in Table A1.
Preprints 93842 g006
Figure 7. Geographical location of the reservoirs studied in the Ebro Basin map. Abbreviatures according names in Table A1.
Preprints 93842 g007
Table 1. Mean, max and min values of the physicochemical variables. In parenthesis, the reservoir to which the value corresponds.
FQ Variables Mean Max Min
pH 8.14 8.79 (El Val) 6.90 (Cavallers)
Secchi Disc Values (m) 4.13 18.00 (Cavallers) 0.55 (Peña)
Anoxic Zone (m) 2.72 38.00 (Mequinenza) *
Nitrate (µM) 37.47 308.16 (Torcas) 0.04 (Ciurana)
Nitrite (µM) 0.68 5.95 (El Val) 0.01 (Pena)
Total Nitrogen (µM) 53.28 325.78 (Torcas) 8.58 (Escarra)
Ammonium (µM) 2.22 17.26 (Moneva) 0.09 (Pena)
Total phosphorus (µM) 0.51 4.50 (Utchesa-Seca) 0.02 (Baserca)
Soluble phosphorus (µM) 0.11 2.64 (Cortijo) 0.01 (Pena)
Chlorophyll a (µg/L) 4.42 90.97 (Utchesa-Seca) 0.01 (Sabiñanigo)
* Several reservoirs have no anoxic zone.
Disclaimer/Publisher’s Note: The statements, opinions and data contained in all publications are solely those of the individual author(s) and contributor(s) and not of MDPI and/or the editor(s). MDPI and/or the editor(s) disclaim responsibility for any injury to people or property resulting from any ideas, methods, instructions or products referred to in the content.
Copyright: This open access article is published under a Creative Commons CC BY 4.0 license, which permit the free download, distribution, and reuse, provided that the author and preprint are cited in any reuse.
Alerts
Prerpints.org logo

Preprints.org is a free preprint server supported by MDPI in Basel, Switzerland.

Subscribe

© 2025 MDPI (Basel, Switzerland) unless otherwise stated