1. Introduction
The accelerated growth in necessity for energy in the past few decades [
1,
2] has raised many concerns regarding the sustainability of the present global society [
3] for the future years. In order to compensate for the growth in energy needs, the most preferred solution is to exploit a higher quantity of low-cost, easy to obtain energy sources, such as fossil fuels [
4], gas and petroleum products, resulting in a growth in combustion gases, which can be observed in the past 2 decades [
5].This is the main cause of the intensifying greenhouse effect [
6] and of the raise in the average temperatures. The other solution to the stated problem is the renewable energy sources which allow for energy to be obtained from green sources, through processes which have almost null greenhouse gas emissions [
7]. Renewable energy sources, however, have yet to become as efficiently harvested as the environmentally unfriendly ones [
8]. Solar plants are known to have reduced power output during the summer [
9], hydro dams are even considered to negatively impact the fauna of the region where they are constructed [
10,
11], and wind power plants take up big areas of land, making them unusable [
10,
12], and will only be in use for about 85% of the time during a year [
13], as well as raising concerns regarding the impact on the local wildlife [
12]. Furthermore, wind turbines, which are of interest in the present paper, are prone to ice formations during the winter, much like the airfoil of an airplane wing, affecting the aerodynamic performance [
14], raising the inertia of the blade ensemble and drastically reducing the power output of the turbine. The vibrations of these devices, especially in the case of the Horizontal Axis Wind Turbines (HAWTs) will be transmitted to the ground where the turbines are installed, affecting local ground wildlife [
15]. It has been shown that birds and even bats are drawn away from the region [
16].
By addressing the mentioned concerns of the wind turbines, the solution of installing such power plants should become more appealing to compensate for the future needs of the growing population. Technologies have been developed to reduce the vibrations generated by the operation of wind turbines [
17,
18]. In order to remove the ice formations, drones can be used to spray the airfoil with a chemical substance which defrosts the ice [
19], drastically reducing the cost to remove ice formations on the blades in the case of large HAWTs [
20]. By using smaller scale Vertical Axis Wind Turbines VAWTs) though, this problem would not require such complex methods of defrosting since VAWTs can be installed on the top of buildings and can be made easily accessible to humans [
13], also providing a solution for the fauna destabilization – by integrating the turbines in an urban environment. If one could install smaller-scale wind turbines in large urban areas, the energy transmission losses would also be reduced by bringing the power plant directly to the consumer [
21].
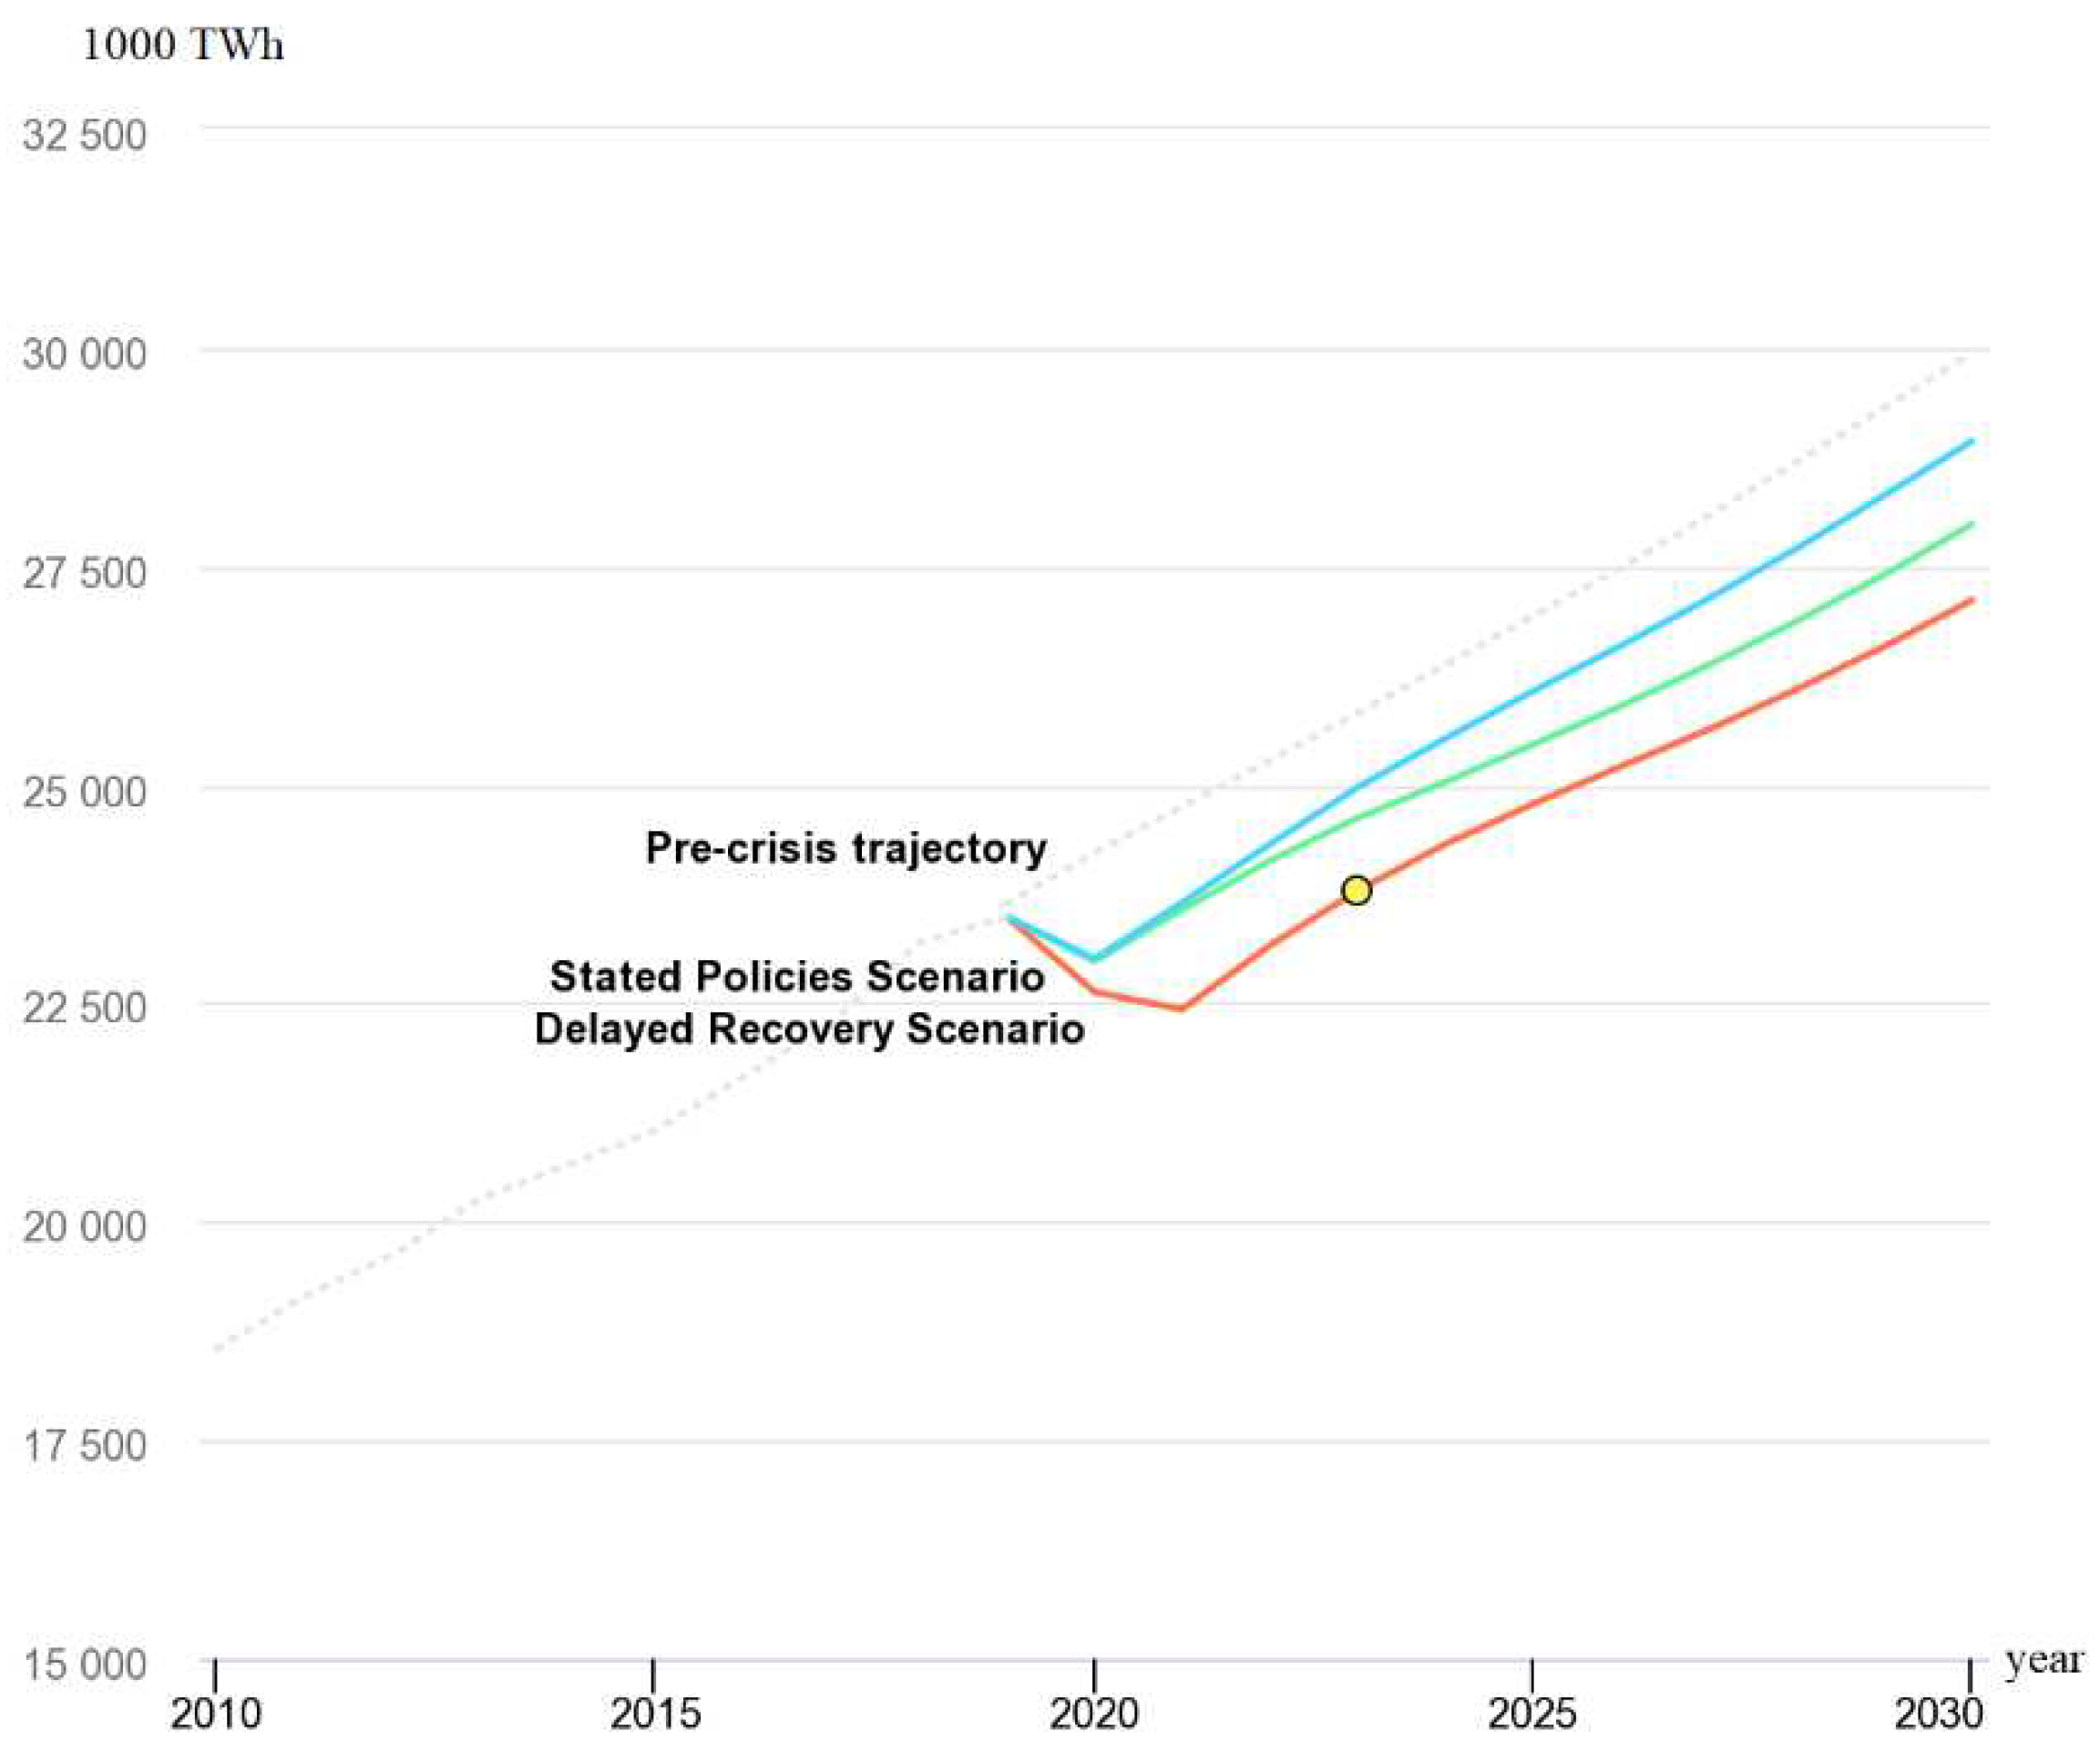
However, if one should consider the predictions regarding the energy demand growth (
Figure 1) for the next few decades of The European Union [
22] and countries such as Romania [
22,
23,
24], China [
25], The United Kingdom [
26], simply installing more power plants would essentially lead to having no space left for new plants to be mounted. In this case, a combined solution of installing plants and of developing more energy efficient harnessing [
27] and distribution systems should lower the growth rate of power requirements [
2].
Many studies have been done regarding improving the efficiency of wind turbines in which the performance of various blade shapes is analysed [
29,
30,
31], the impact on the power coefficient of the disposition of the blades [
32] and the number of rotors studied [
33] and even the power output of multiple cluster dispositions of identical turbines numerically simulated [
34,
35]. The authors in [
36] have reviewed the current studies in performance improvement with geometry variations regarding the Savonius VAWTs.
The wind turbines harness the kinetic energy from the wind using airfoils which generate aerodynamic forces and torques. The main reason for energy conversion loss is the formation of flow separation on the surface of the blade. This phenomenon can be diminished by the method of flow control, which can be either active – by injection of fluid at the surface of the blade, or passive – which results from varying the blade shape to take flow separation into account. Multiple solutions have been analysed regarding active [
37,
38]and passive flow control [
39], either by creating cavities inside the blades [
40], much like the novel VAWT geometry studied in this paper, or by mounting vortex generators on the extrados [
41].The trapped vortex cavity offers the advantage of flow separation occurring inside of the cavity and reattach towards the end of the cavity. This leads to significantly diminish the wake area and constraining the vorticity region to the cavity, resulting in higher lift-to-drag ratio [
42,
43]. To further analyse the effect of vortices and flow separation on the Cp, the authors in [
44] have introduced a new parameter, the Vorticity Index (VI), calculated by dividing the vorticity in the Leading Edge (LE) by the vorticity in the Trailing Edge (TE) which can help detect a possible vortex separation, either from the LE to the TE, when this index approaches a value of 1, or from the TE to the LE, when the index approaches a value around 0.2. This is known as the Imminent Vortex Separation Condition (IVSC).
The flow around the geometry of a wind turbine can be numerically studied using, in the case of this article, The Large Eddy Simulations (LES) method and the power coefficient (Cp) of the blade ensemble is mathematically calculated. LES method solves the Navier-Stokes continuity equations of the fluid flow for each of the element in the mesh, ignoring the smallest length scales which require the most computational effort in a simulation by low-pass filtering the Navier-Stokes equations [
45]. The Cp represents the fraction of the wind kinetic energy which is converted to power [
46], thus an improvement in the method of energy extraction results in the growth of the Cp value of the power output.
However, if the results should have the highest accuracy, the Direct Numerical Simulation (DNS) method (which has the best accuracy in terms of results) method can be chosen. Greater accuracy implies a much higher computational effort, as comparisons between DNS, LES and Unsteady Reynolds Averaged Navier-Stokes (URANS) methods have been done [
47]. The URANS method requires the least computational effort between the three methods. The time step size and the number of elements in the mesh have a great influence on the results obtained after a simulation. An analysis of this dependency was done by the authors in [
48], who have shown that the numerical result of the simulation, the aerodynamic coefficients of lift and drag in this case, will stabilize if the time step size is small enough and if the mesh is fine enough. The authors have also shown that the Transition Shear Stress Transport (SST) turbulence model is by far one of the most accurate turbulence models, when compared to experimental data.
In order to improve starting process efficiency, a thorough comparison between a traditional setup and an improved vertical axis wind turbine was conducted for this paper. It is crucial to make clear that the goal of this study was limited to the starting stages, during which tip speed ratios ranged from 0.5 to 1.25 and rotating speeds were extremely low. In order to accomplish this goal, a vertical axis turbine design was researched numerically using the LES technique, and the performance parameters' outcomes were compared across the configurations.
2. Materials and Methods
The research's foundation was a highly precise numerical investigation of the behavior of the vertical axis wind turbine starting procedure. This turbine was intended to be utilized in residential areas with low to medium wind speeds and significant turbulence. The turbine was supposed to produce about 5 kW of power at a wind speed of 12 m/s.
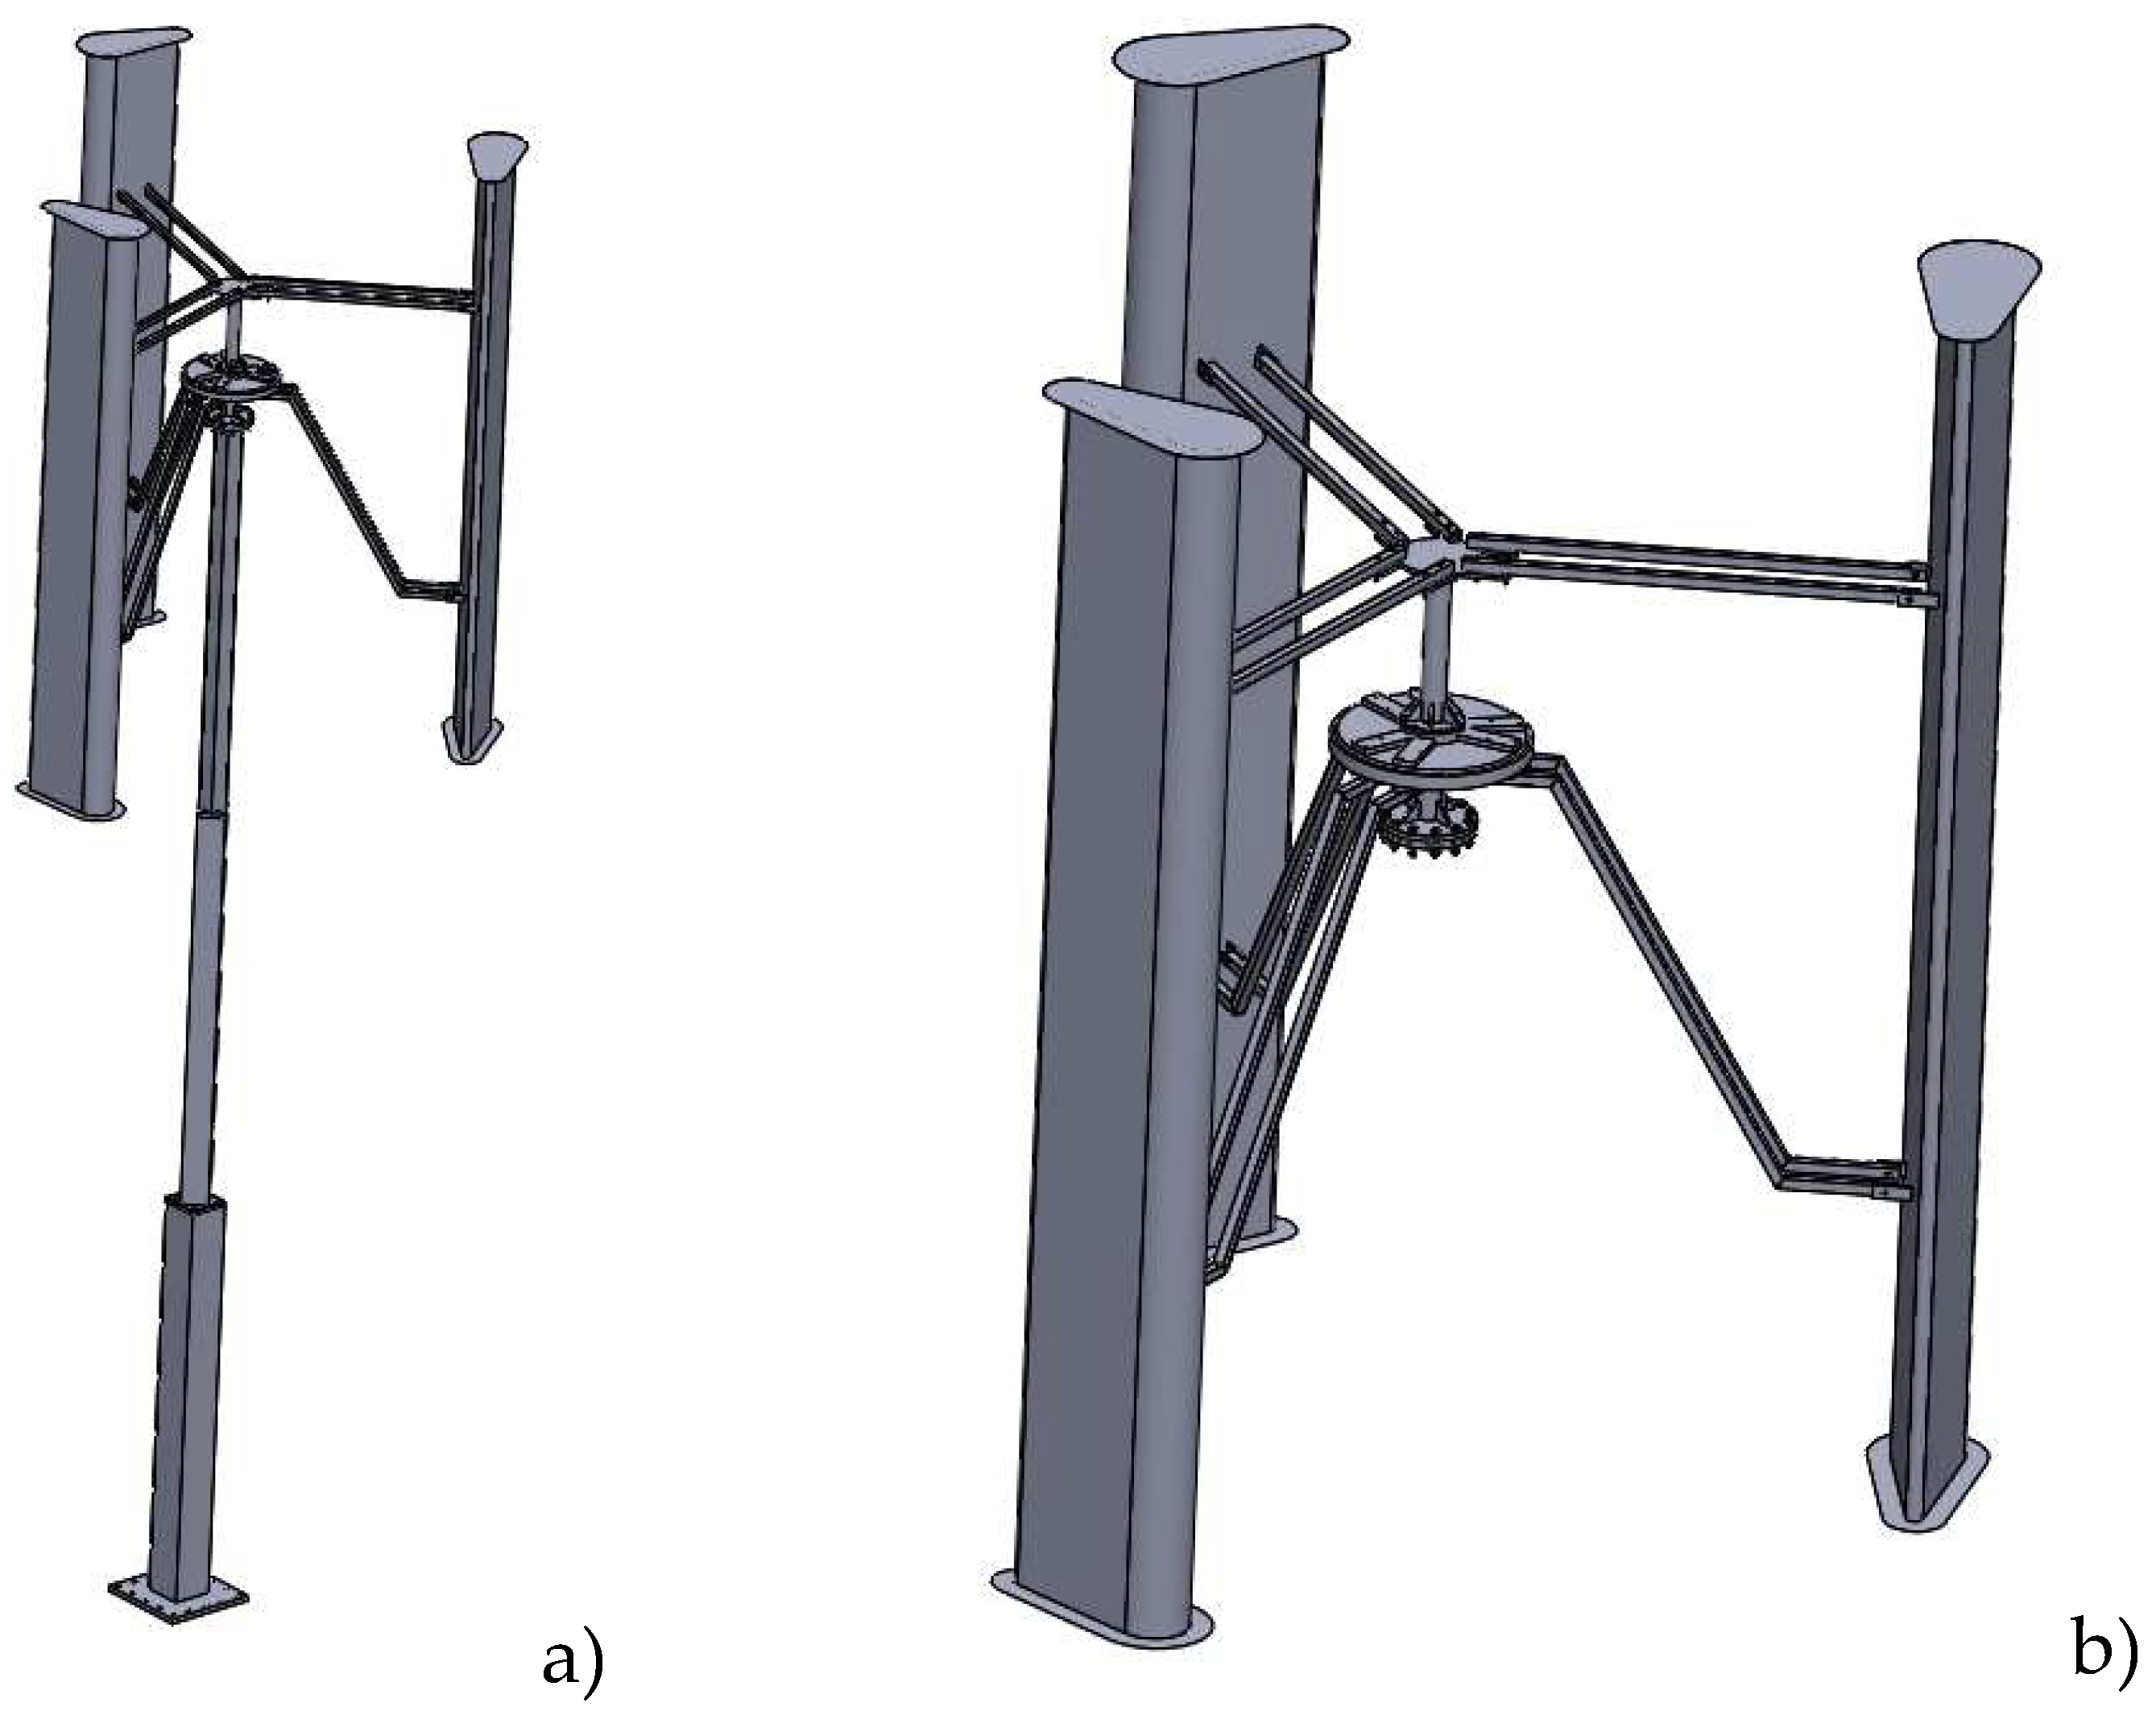
Peak performance is anticipated by the turbine design at a Tip Speed Ratio (TSR) of 1.9. The CAD model is displayed in
Figure 2, and the geometric properties of the turbine are listed in
Table 1.
Three nondimensional parameters—the power coefficient (Cp), torque coefficient (C
T), and tip speed ratio (TSR)—define the performance of a vertical axis turbine. The most significant one, Cp, which describes the efficiency of wind turbines (no more than 0.593 according to the Betz limit [
46,
49,
50]), is provided by Equation (1), where
is the wind turbine power,
is maximum wind power,
is the wind turbine torque,
is angular velocity of the turbine,
is air density,
is reference area,
is wind velocity,
is reference length,
is torque coefficient and
is TSR.
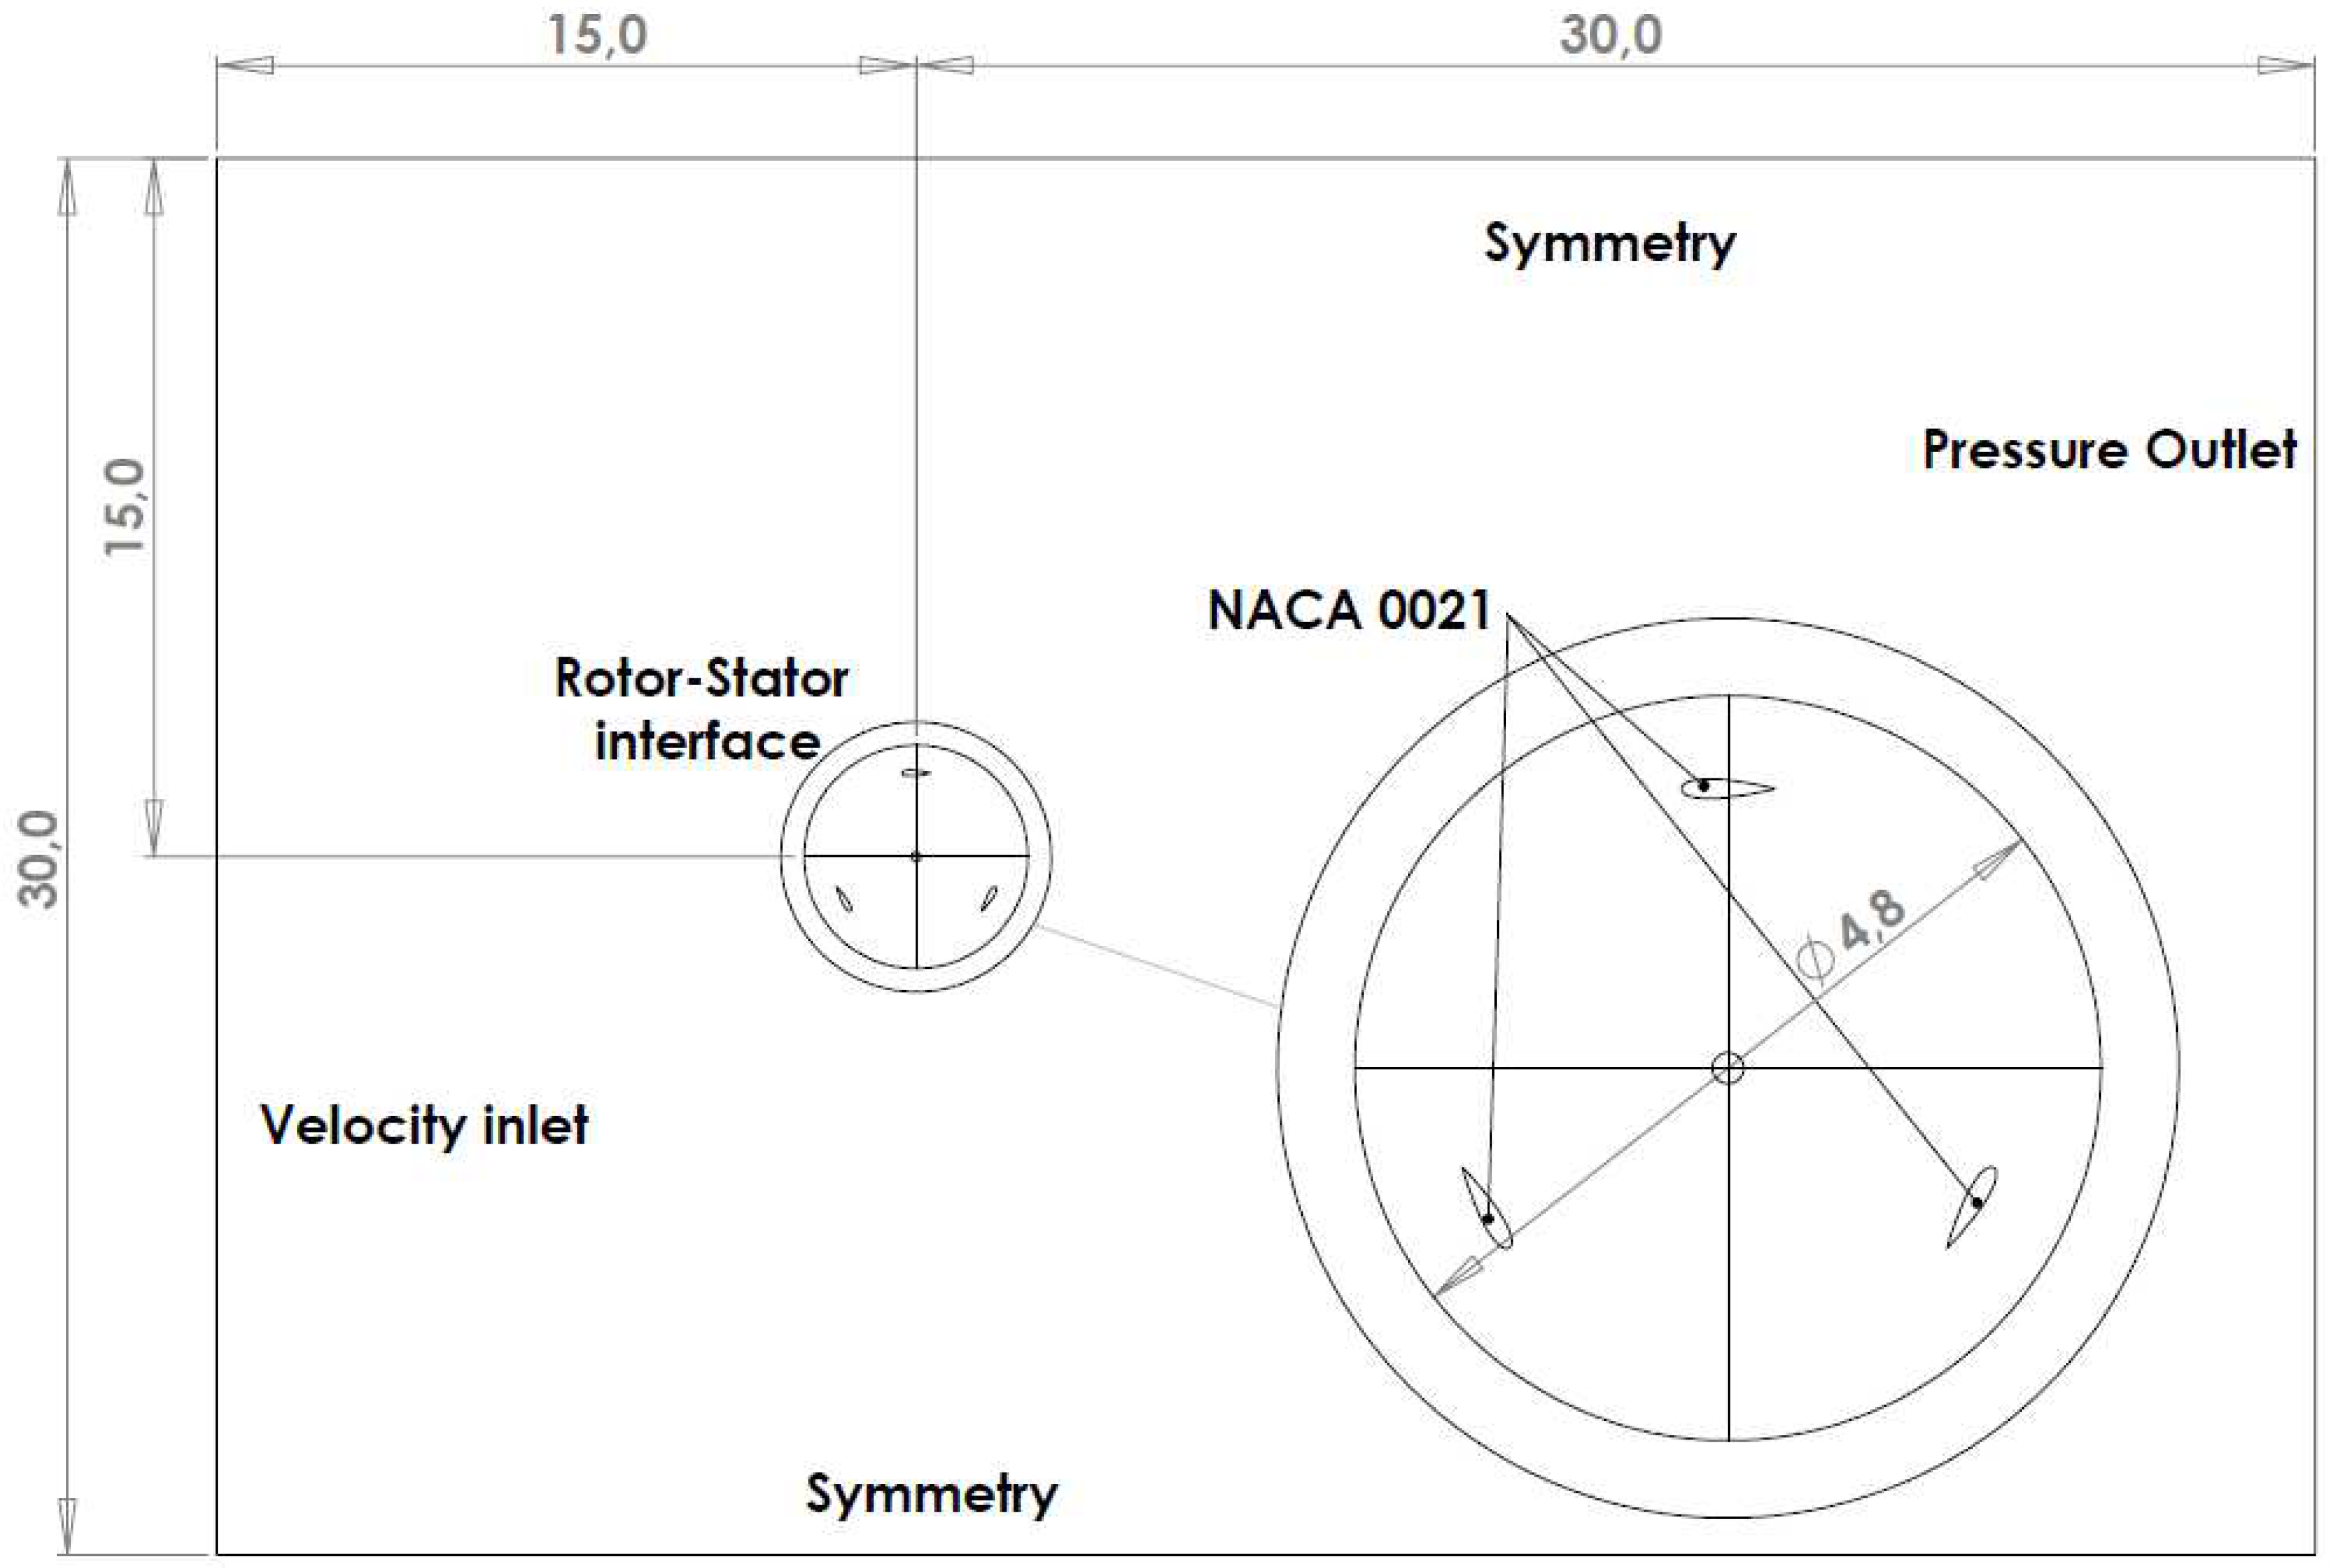
Figure 3 depicts a diagram of the computational domain employed in this investigation. These dimensions were chosen to minimize the influence of boundary conditions on the final outcome. The downstream domain is approximately ten times larger than the wind turbine rotor diameter, while the upstream domain is approximately five times larger. The domain is divided into two parts: one rotating, represented by the blades and shaft, and one stationary, representing the surrounding environment. An interface was defined between these two subdomains to express the relative motion of the rotor, taking into consideration elements such as angular velocity, slip factors, and blade angles. The computational domain size was the same for both analyzed cases, as was the mesh of the stationary subdomain.
To accurately resolve the turbulent boundary layer of the blades, the size of the first element of the mesh in the normal direction of the blade surface must fulfill the Y+<1 constraint. The total height, growth rate, and total number of layers utilized are also critical criteria in the formation of the mesh adjacent to the surface of the blades (Boundary layer mesh). The growth rate is determined by the same principles that are used in every Large Eddy Simulation (LES) simulation, with values around 1.05 considered appropriate.
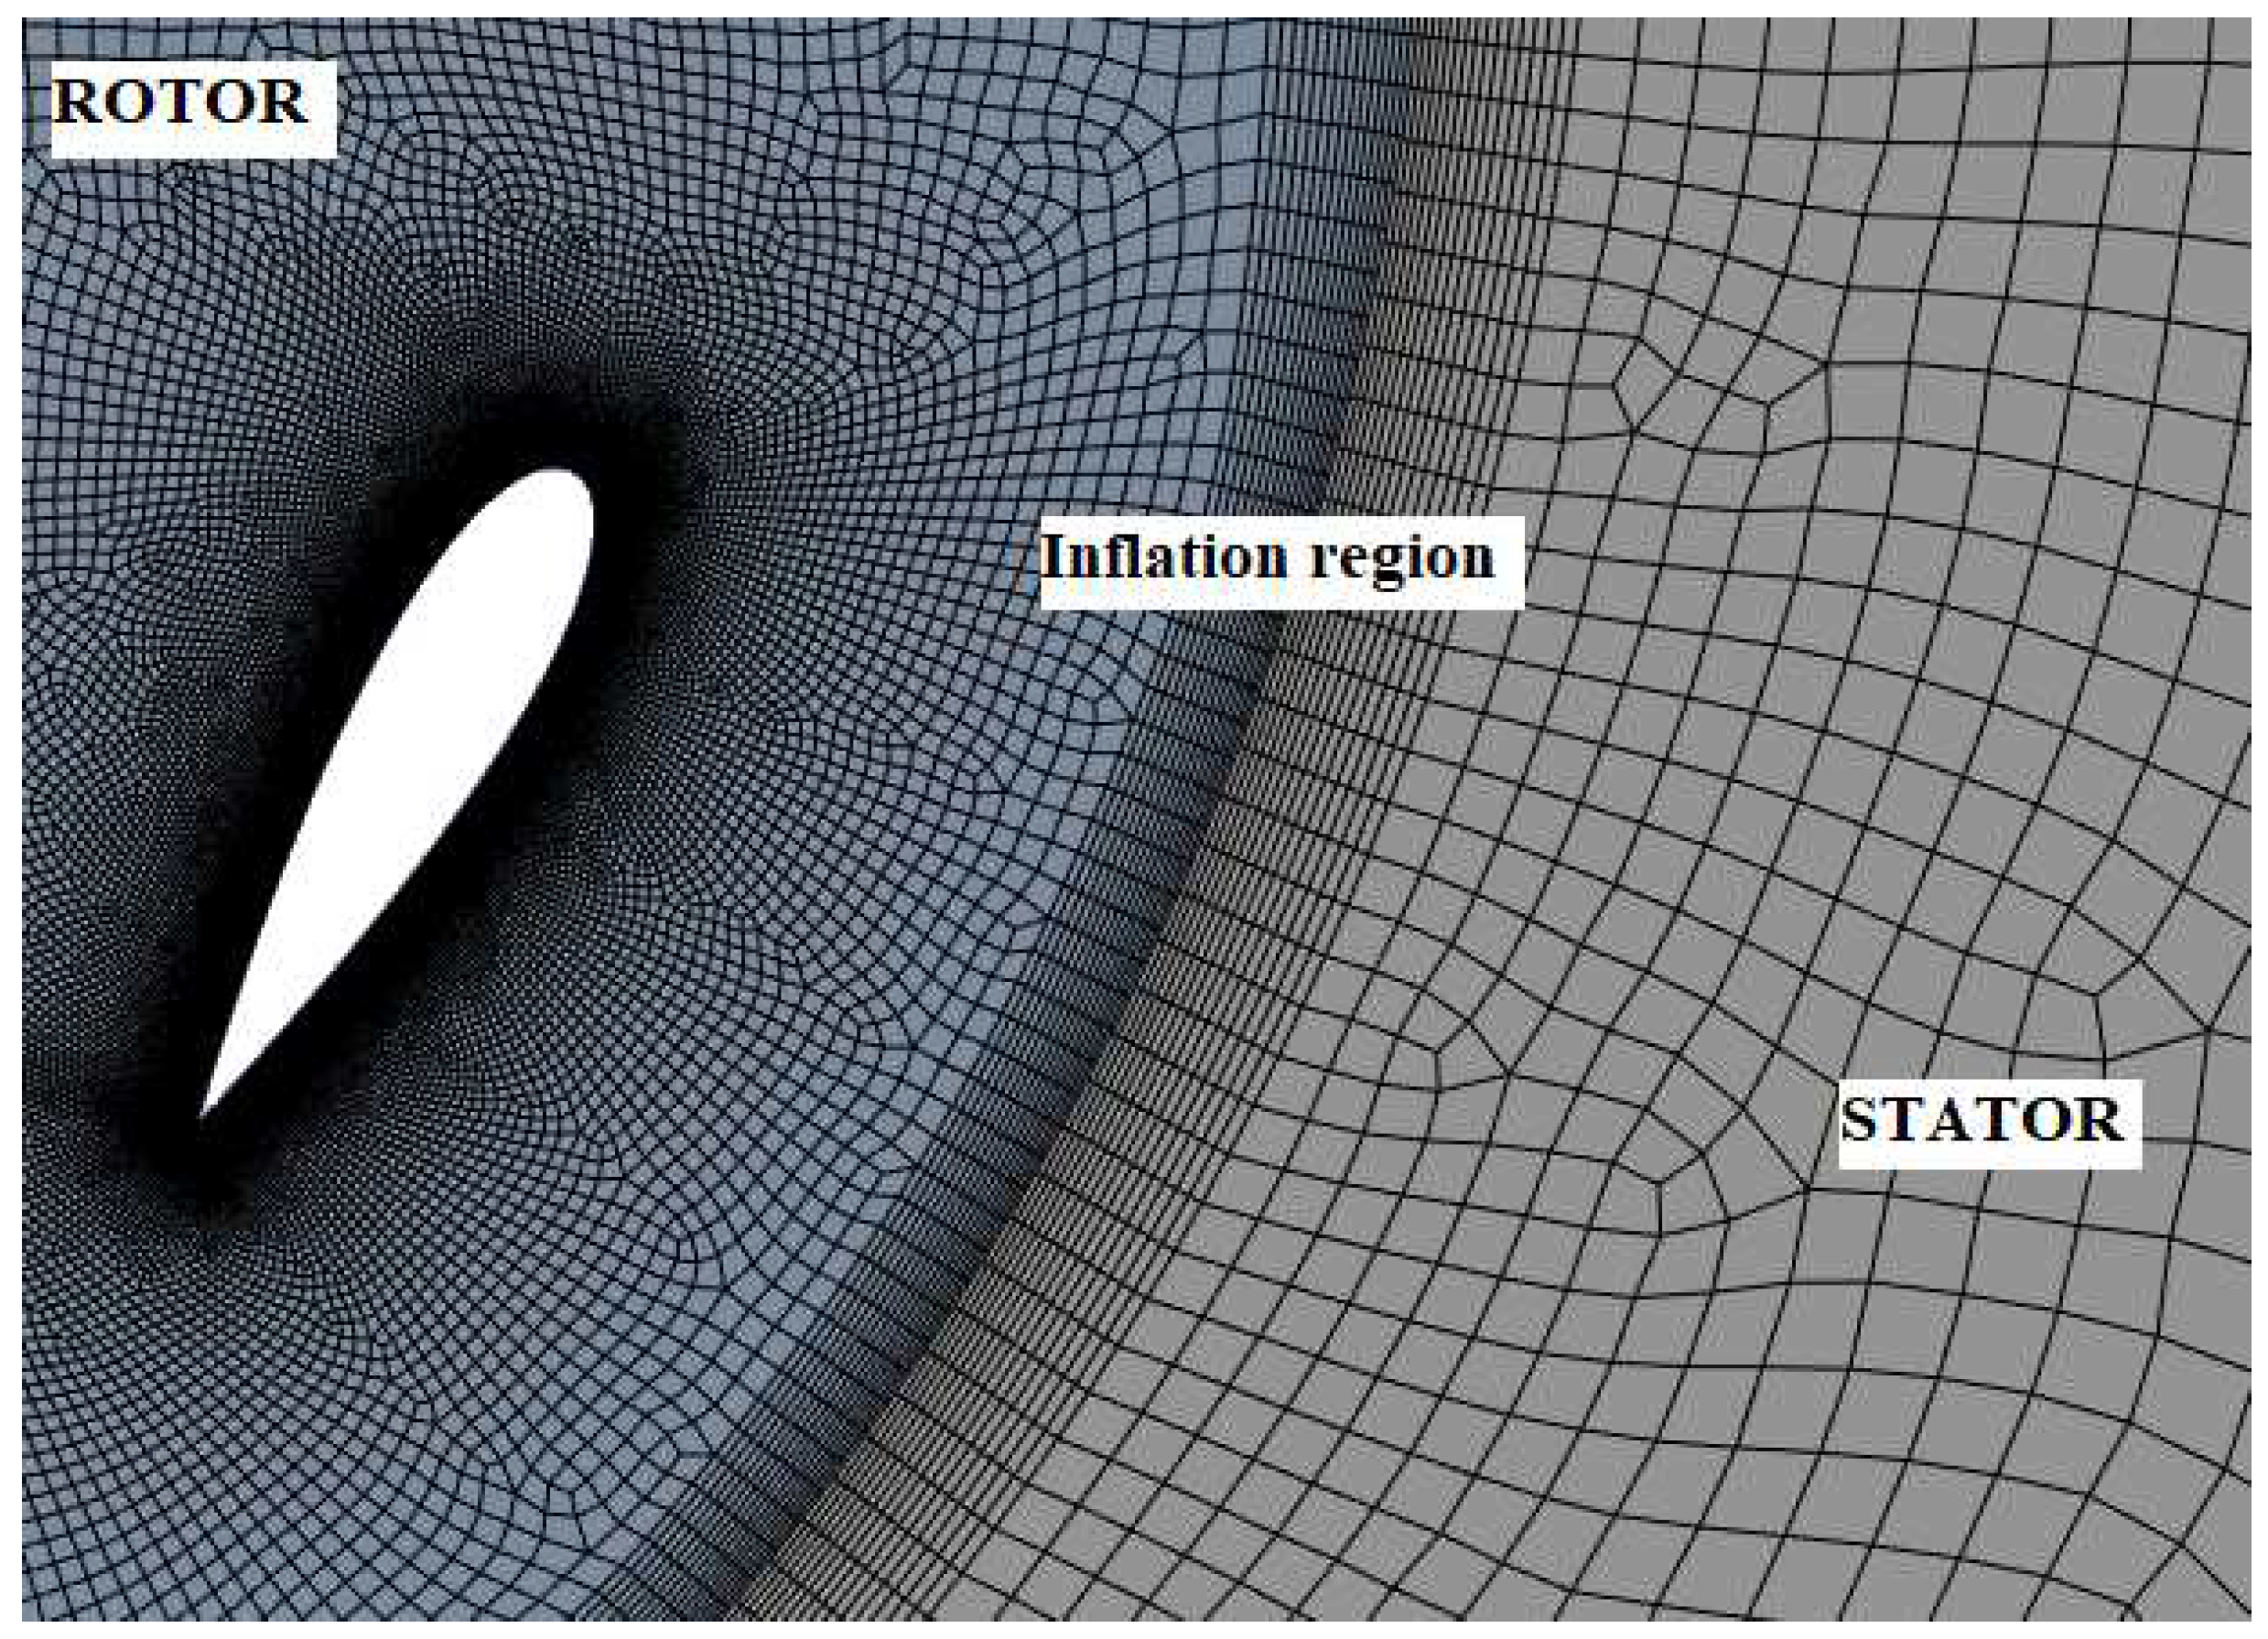
These two subdomains are linked by a numerical interface, and an inflation setting was employed throughout the meshing process. This inflation has a maximum of 15 layers on each subdomain, a smooth transition option, and a growth rate of 1.05.
Figure 4 depicts a close-up of the mesh from that location.
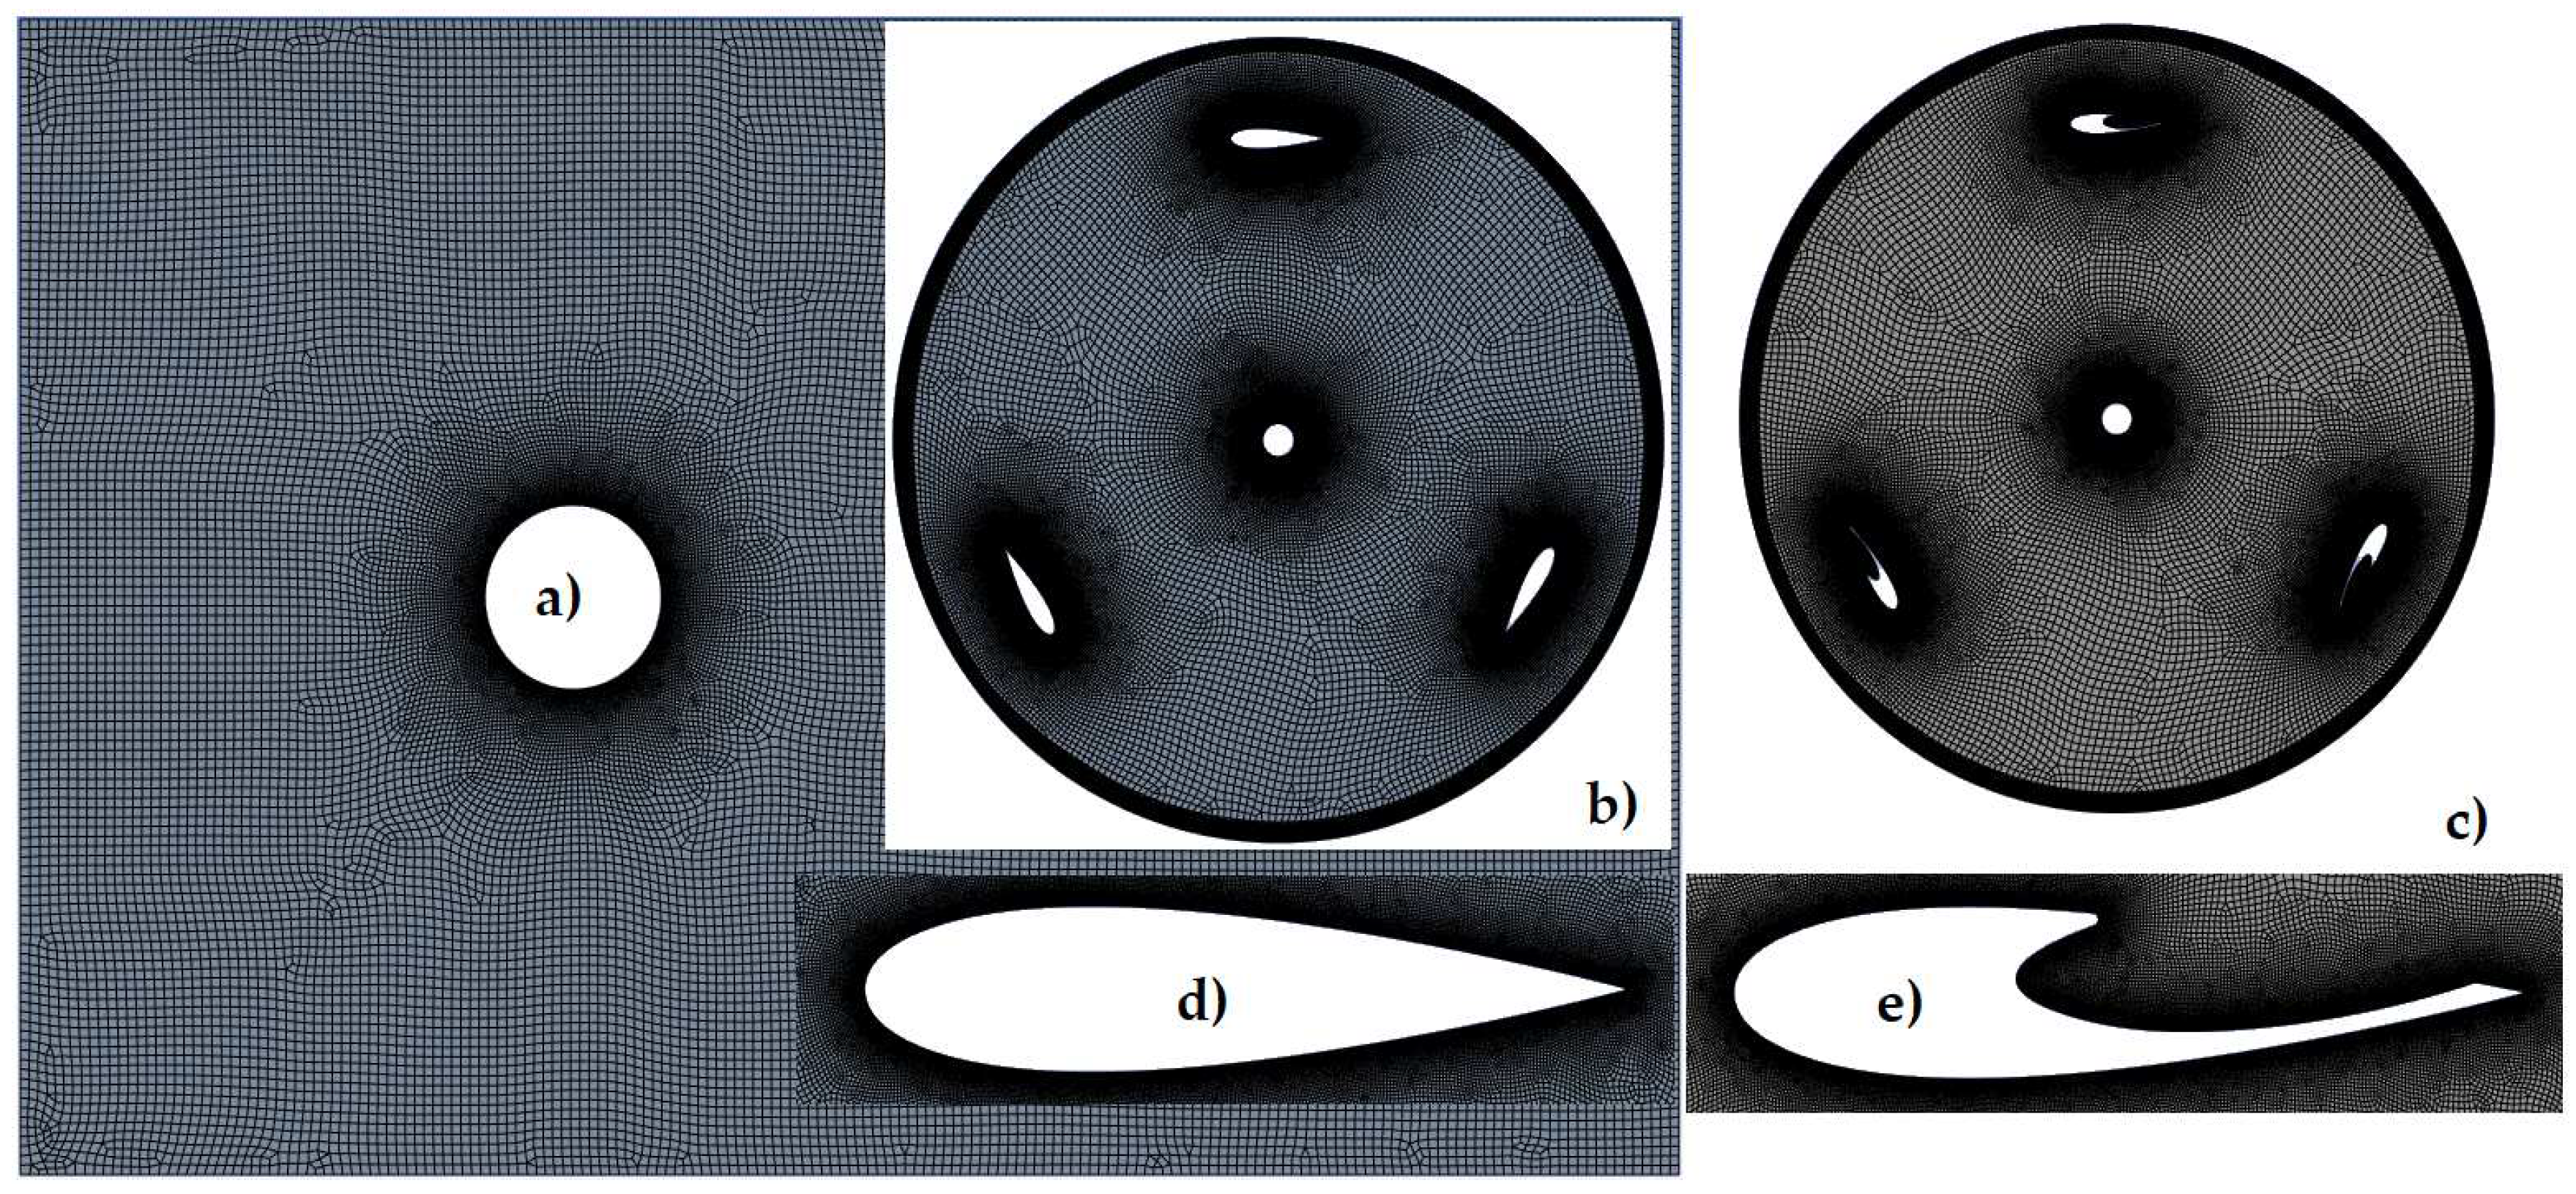
A cylinder containing the mesh surrounding the blades and shaft surfaces represents the rotating domain. An inflation option with 30 layers and a 1.05 growth rate was imposed to manage the mesh near each blade and the shaft. Also imposed on the blades and shaft was an edge sizing control with an element size of 1mm. Because rotation for one degree was demanding on each iteration, an edge size with 360 divisions was employed in the interface zone on each subdomain. The Ansys Meshing module was used to generate the mesh for each case using the same configuration.
Figure 5 displays the mesh for every scenario.
The total count of each individual element in the mesh and the overall number of mesh vertices or nodes are the basis for standard mesh statistics in computational fluid dynamics. The distribution of element types, or the division of the mesh elements into several types (triangles, quadrilaterals, tetrahedral, hexahedra, etc.), also provides significant information. For the investigated cases the mesh statistics is presented in
Table 2
Ansys Fluent 2022 R2, a commercial program, was used to do the simulations, which assumed turbulent, transient, and incompressible flow. In the simulations, air with a constant density of 1.225 kg/m3 was employed as the working fluid. The simulations' boundary conditions are displayed in
Table 3. A constant velocity was applied in the X direction at the inlet border. Using a fluctuating velocity method and the spectral synthesizer option, the intake turbulence was calculated with a turbulent intensity of 5% and a turbulent viscosity ratio of 10.
In the simulations, the pressure-velocity coupling was completely COUPLED with Courant number 2 and discretization 2nd order for pressure-velocity coupling, spatial discretization, and transient formulation. For comparison, the viscous model utilized in both investigated situations was the Large Eddy Simulation (LES) with Smagorinsky-Lilly subgrid-scale model due to its outstanding prediction of flow for this specific application, as previously documented in the literature. In terms of the stop criterion, 3600 time steps were chosen as equal to 10 fully completed rotations. Each time step has a maximum of 50 iterations with 5 reporting intervals and 5 profile updating intervals.
The scenarios that were simulated for various tip speed ratios (TSR) are displayed in Table 6. By raising the turbine's rotational speed from 2.77 to 6.94 rad/s while maintaining the inflow velocity fixed at 10 m/s, the TSR of the turbine was altered. This TSR interval was chosen in accordance with the VAWT's starting process step, which requires exceeding TSR 1 in order to enter an auto-acceleration mode that can enable the turbine to reach its nominal operating point.
3. Results
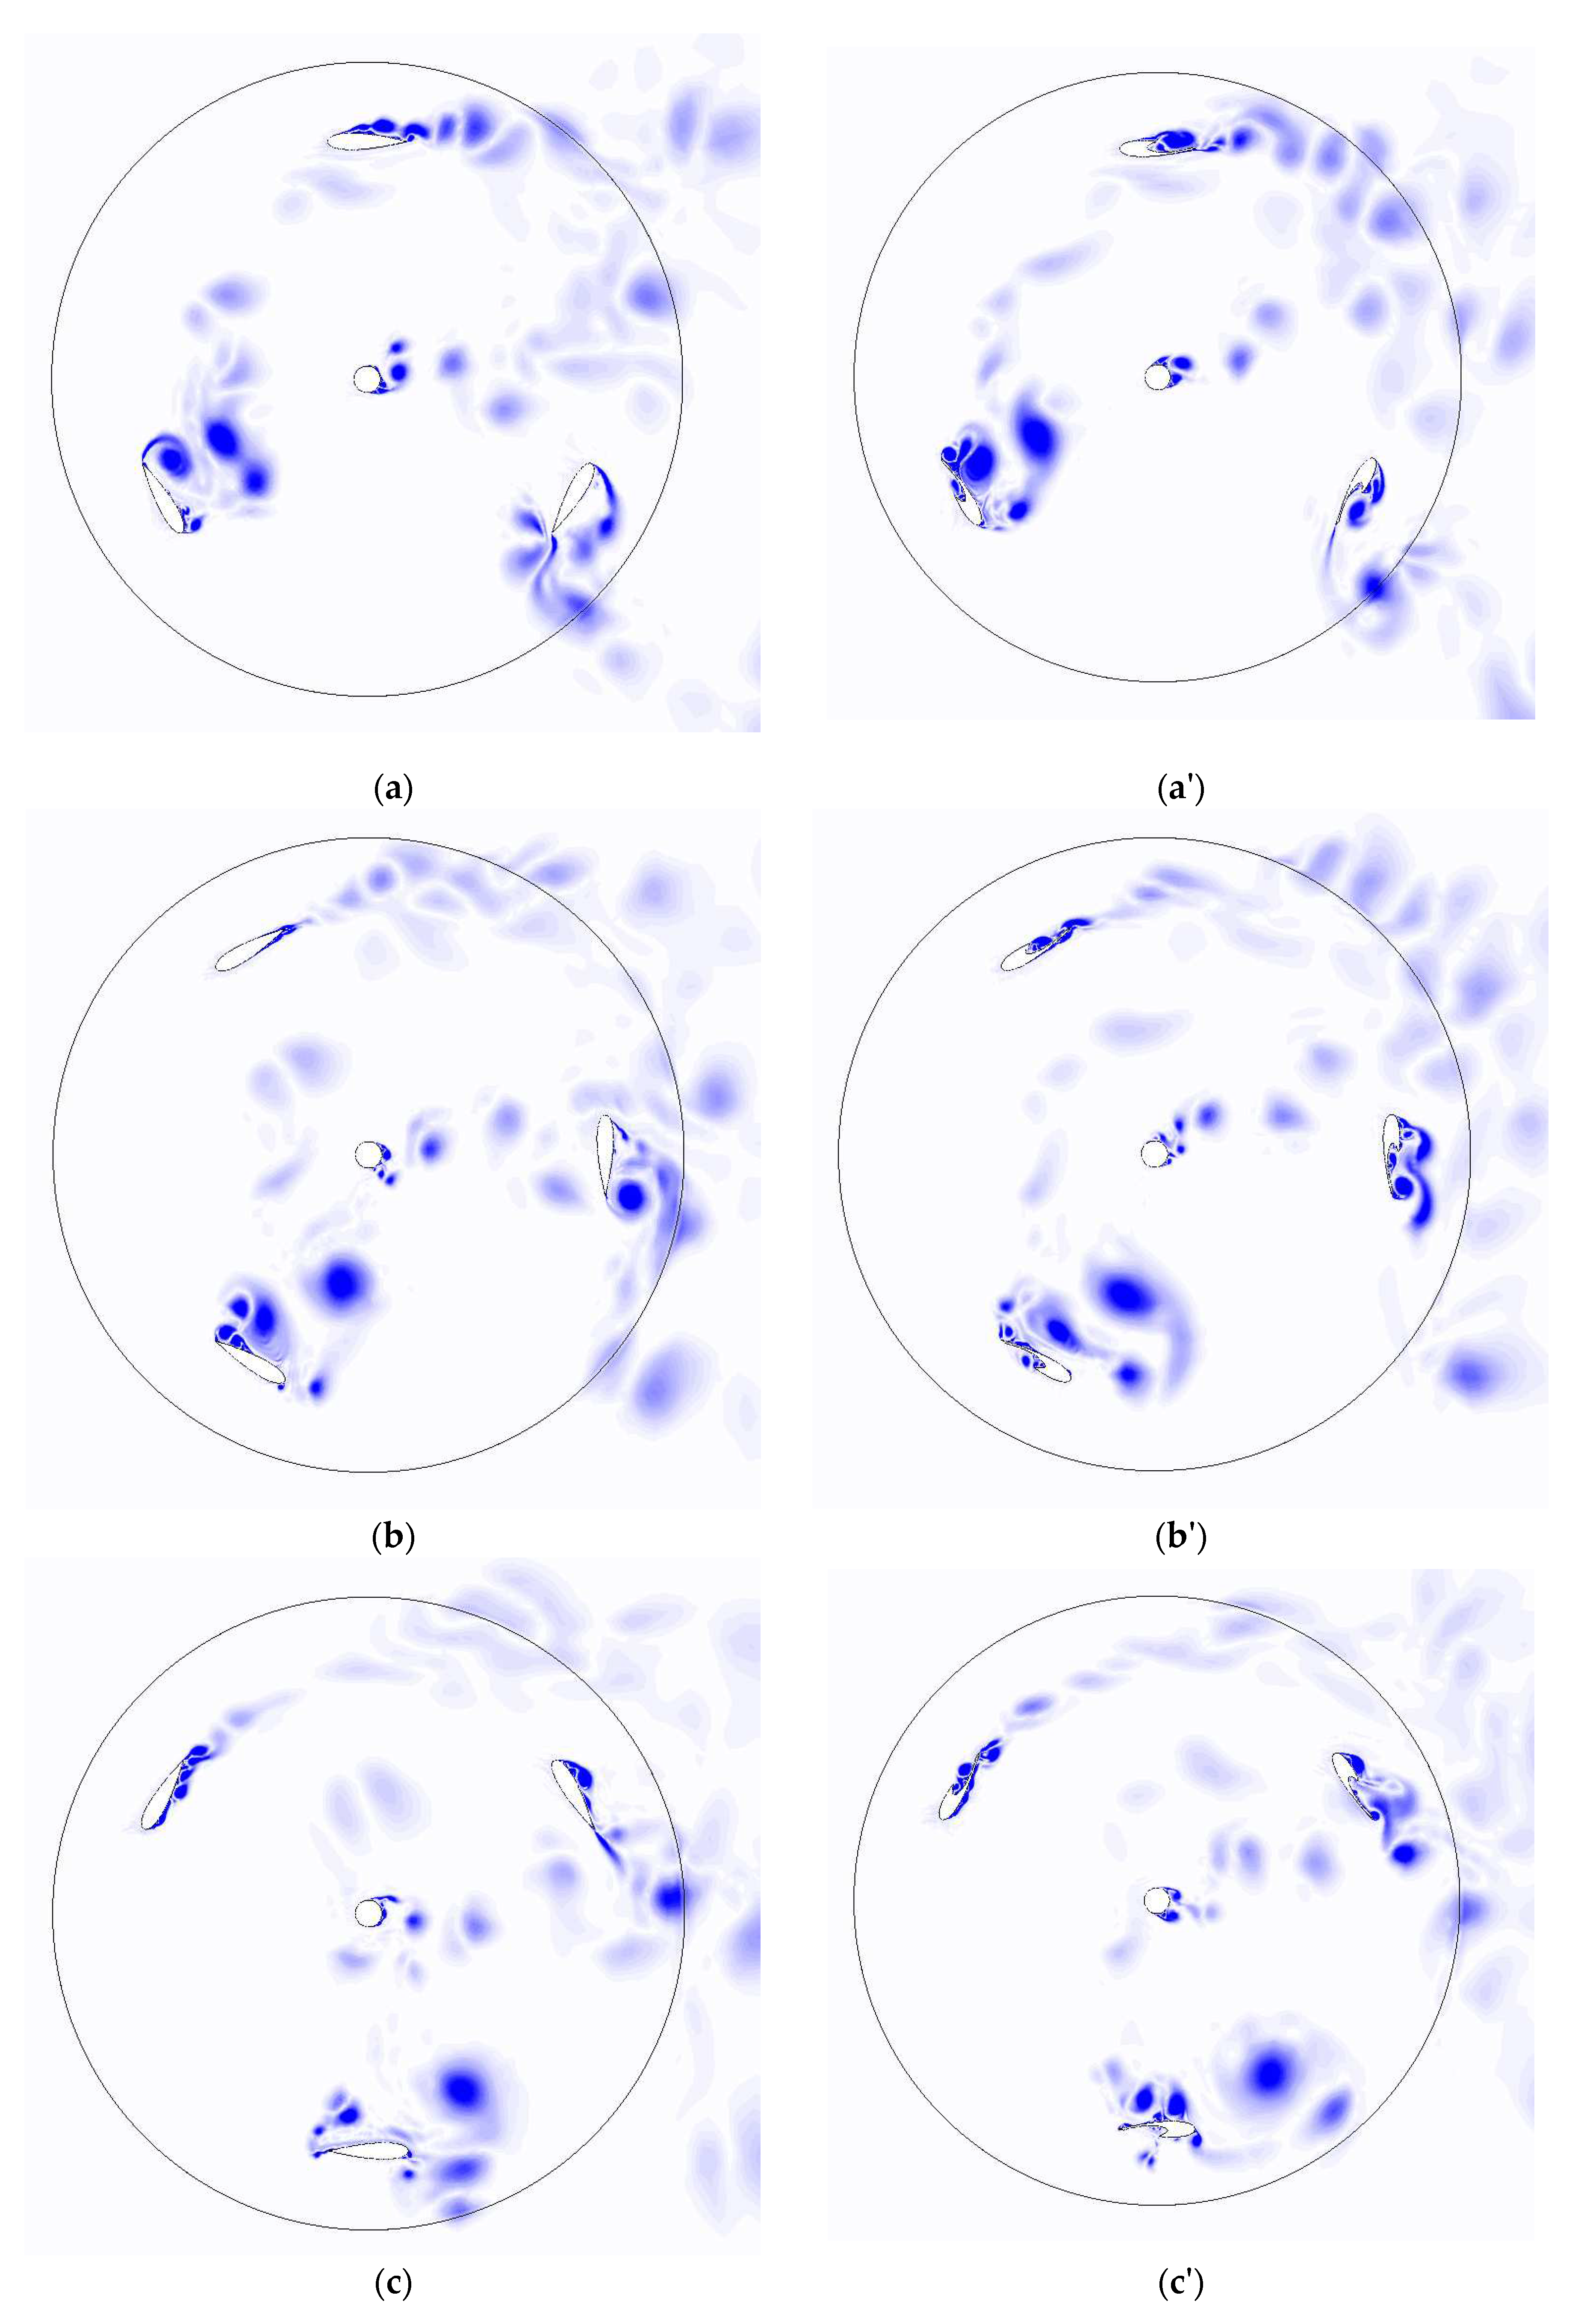
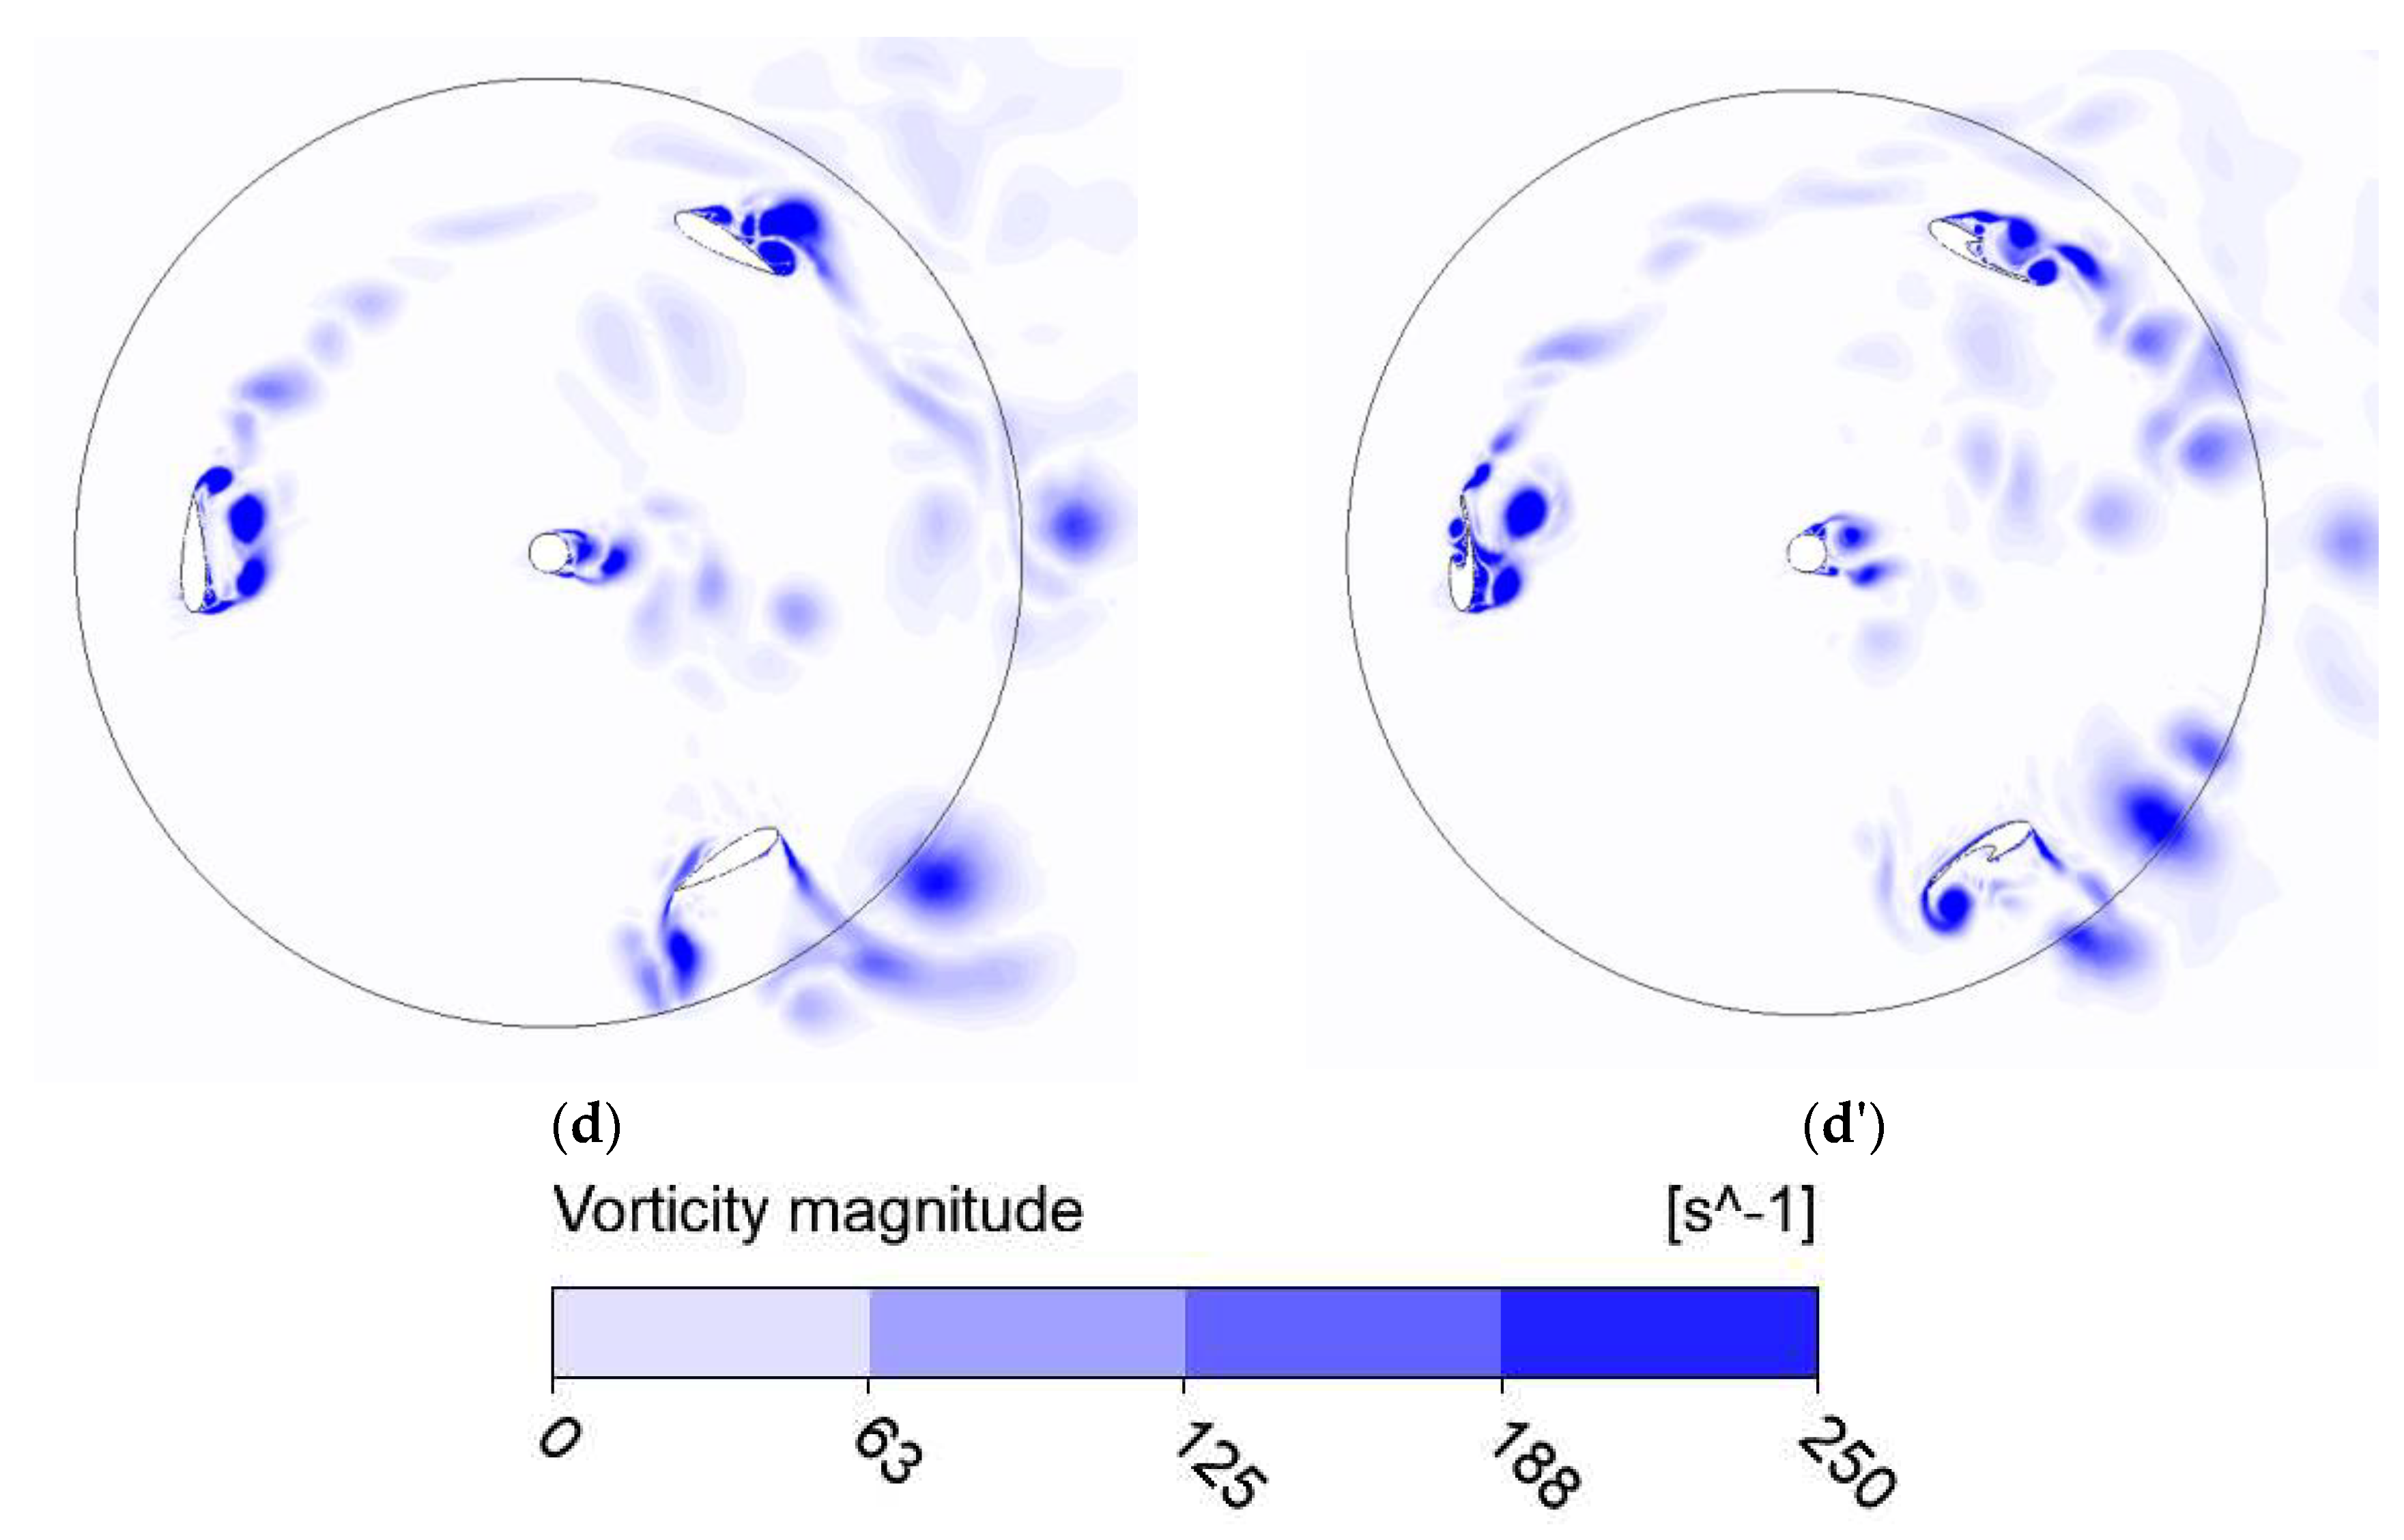
Using the 2.5D LES approach, the flow in the vertical axis wind turbine, at 10 m/s wind speed, was numerically examined during its early startup phase. A vortex trap was applied to the outside of the blades as part of a passive flow control method to boost the turbine’s efficiency. In order to compare the results, the flow behavior was examined at several points where vorticity magnitude was plotted.
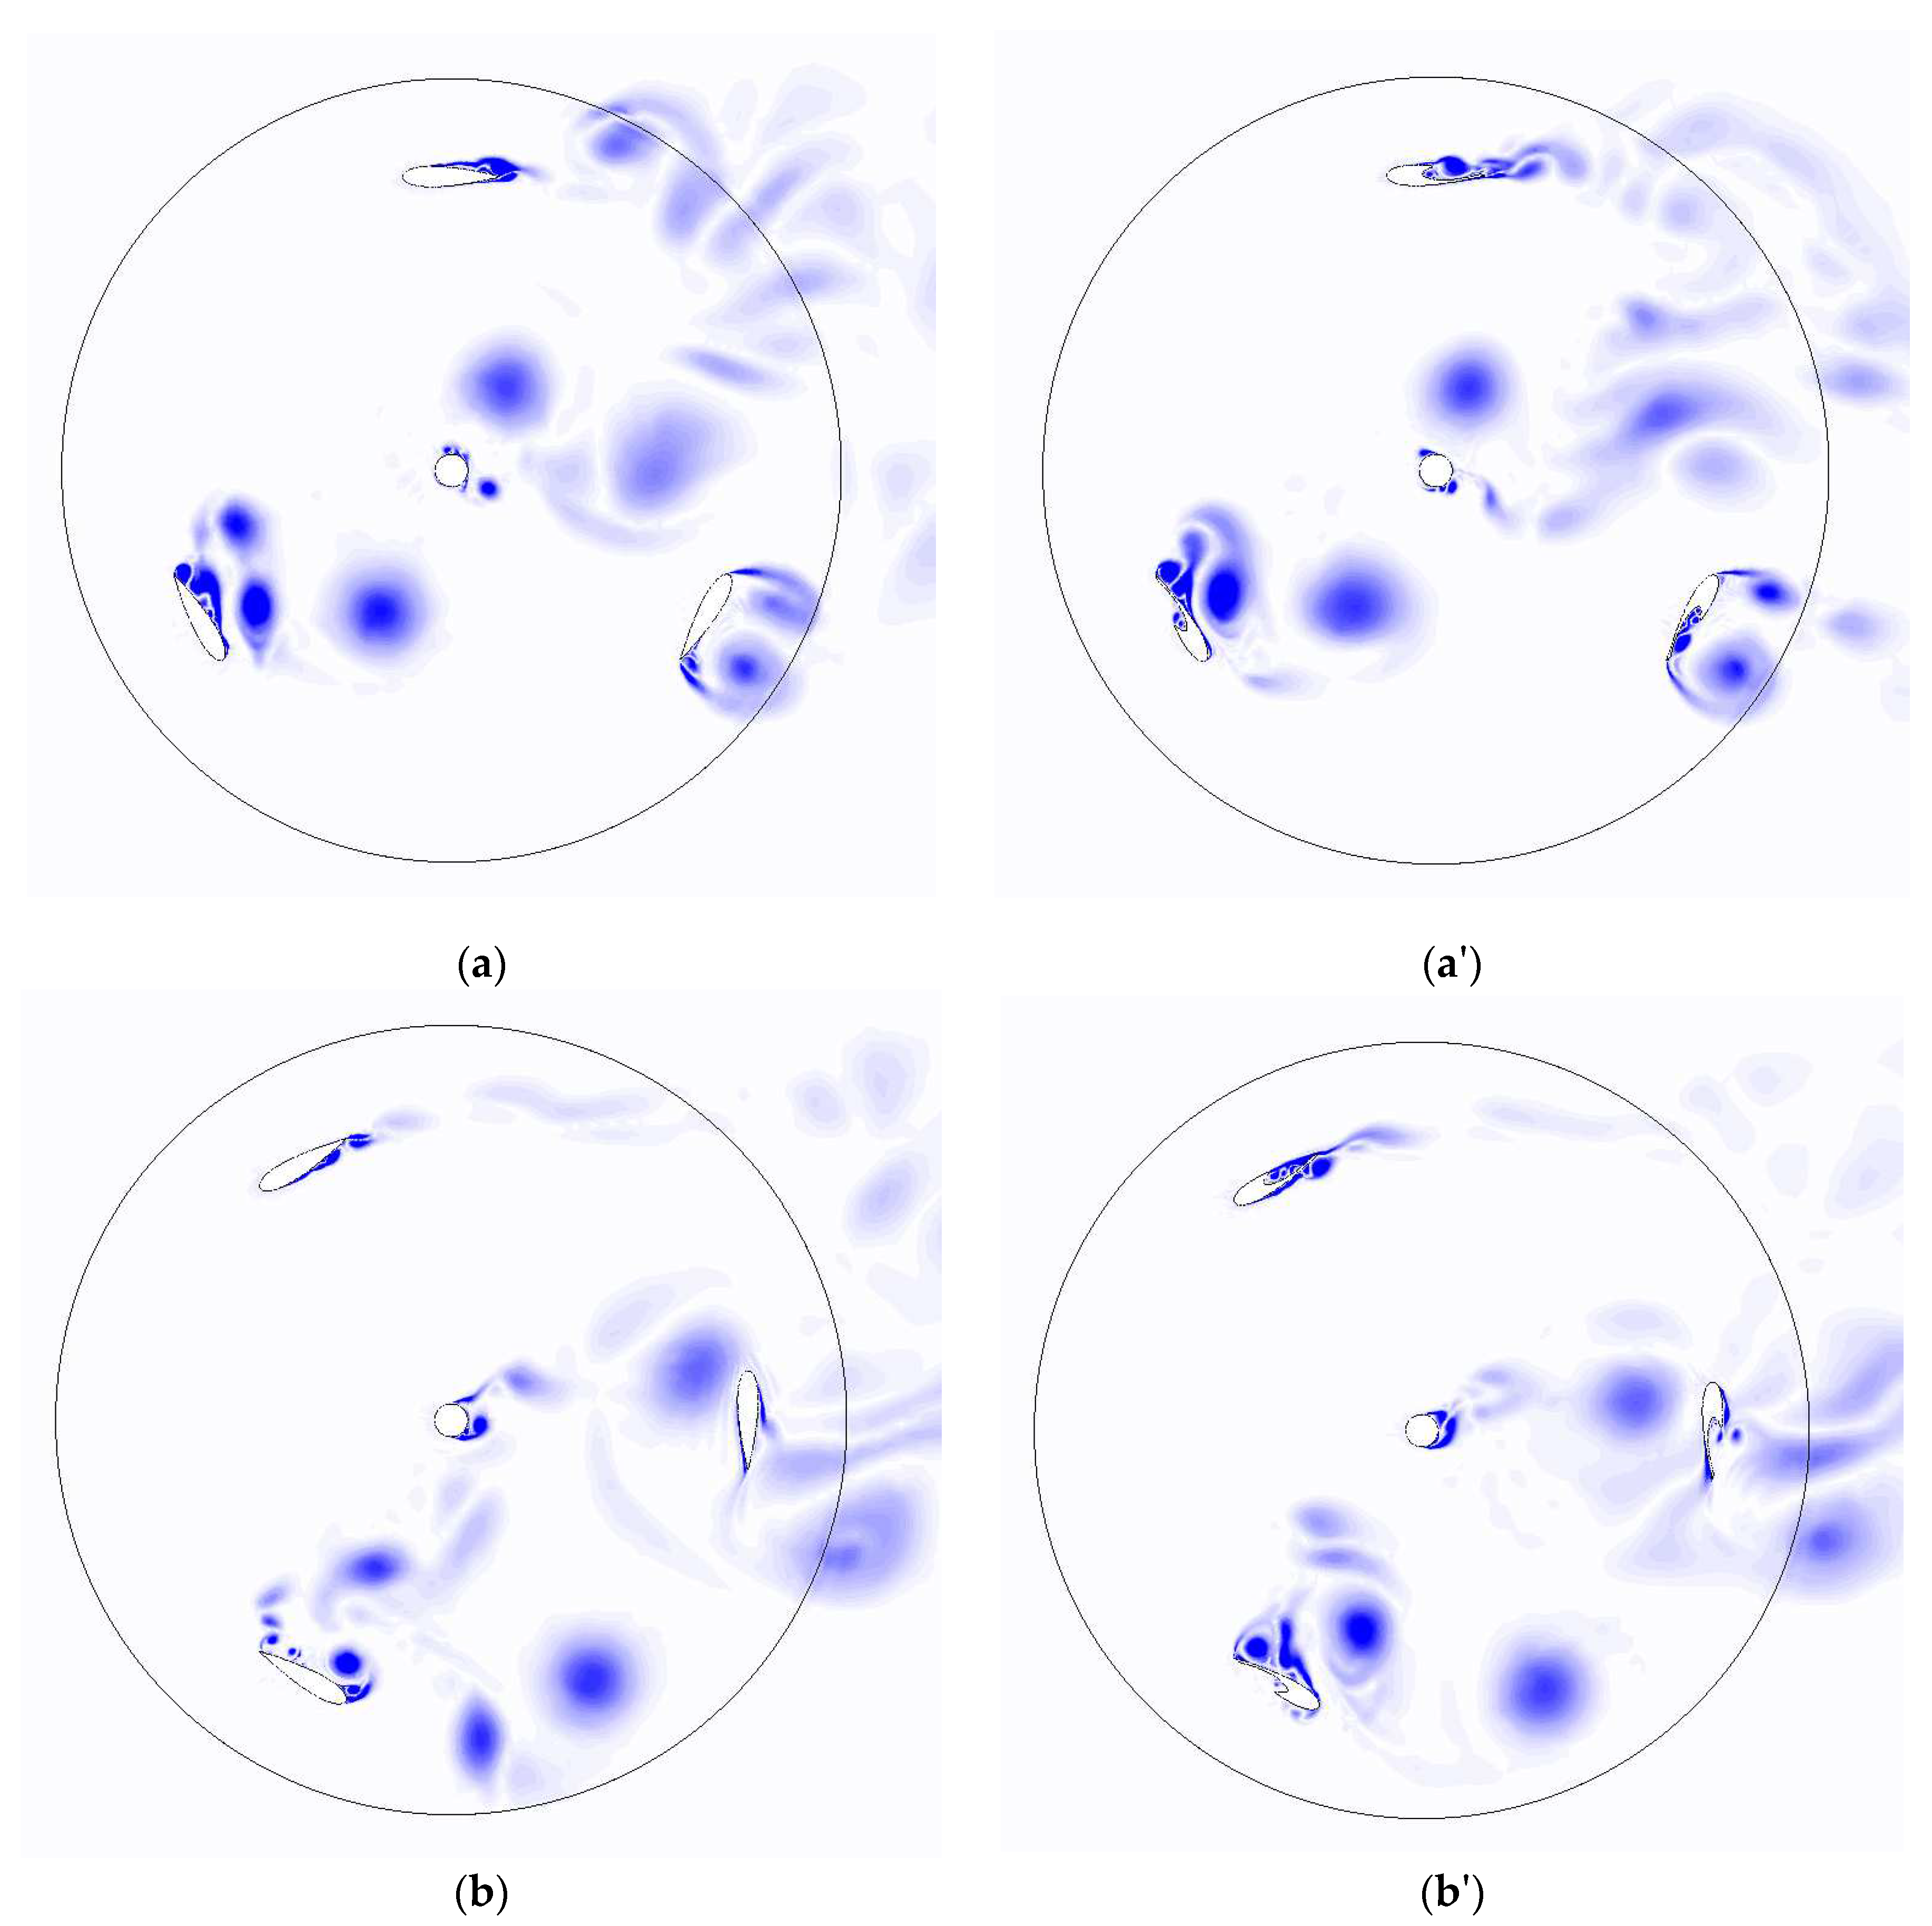
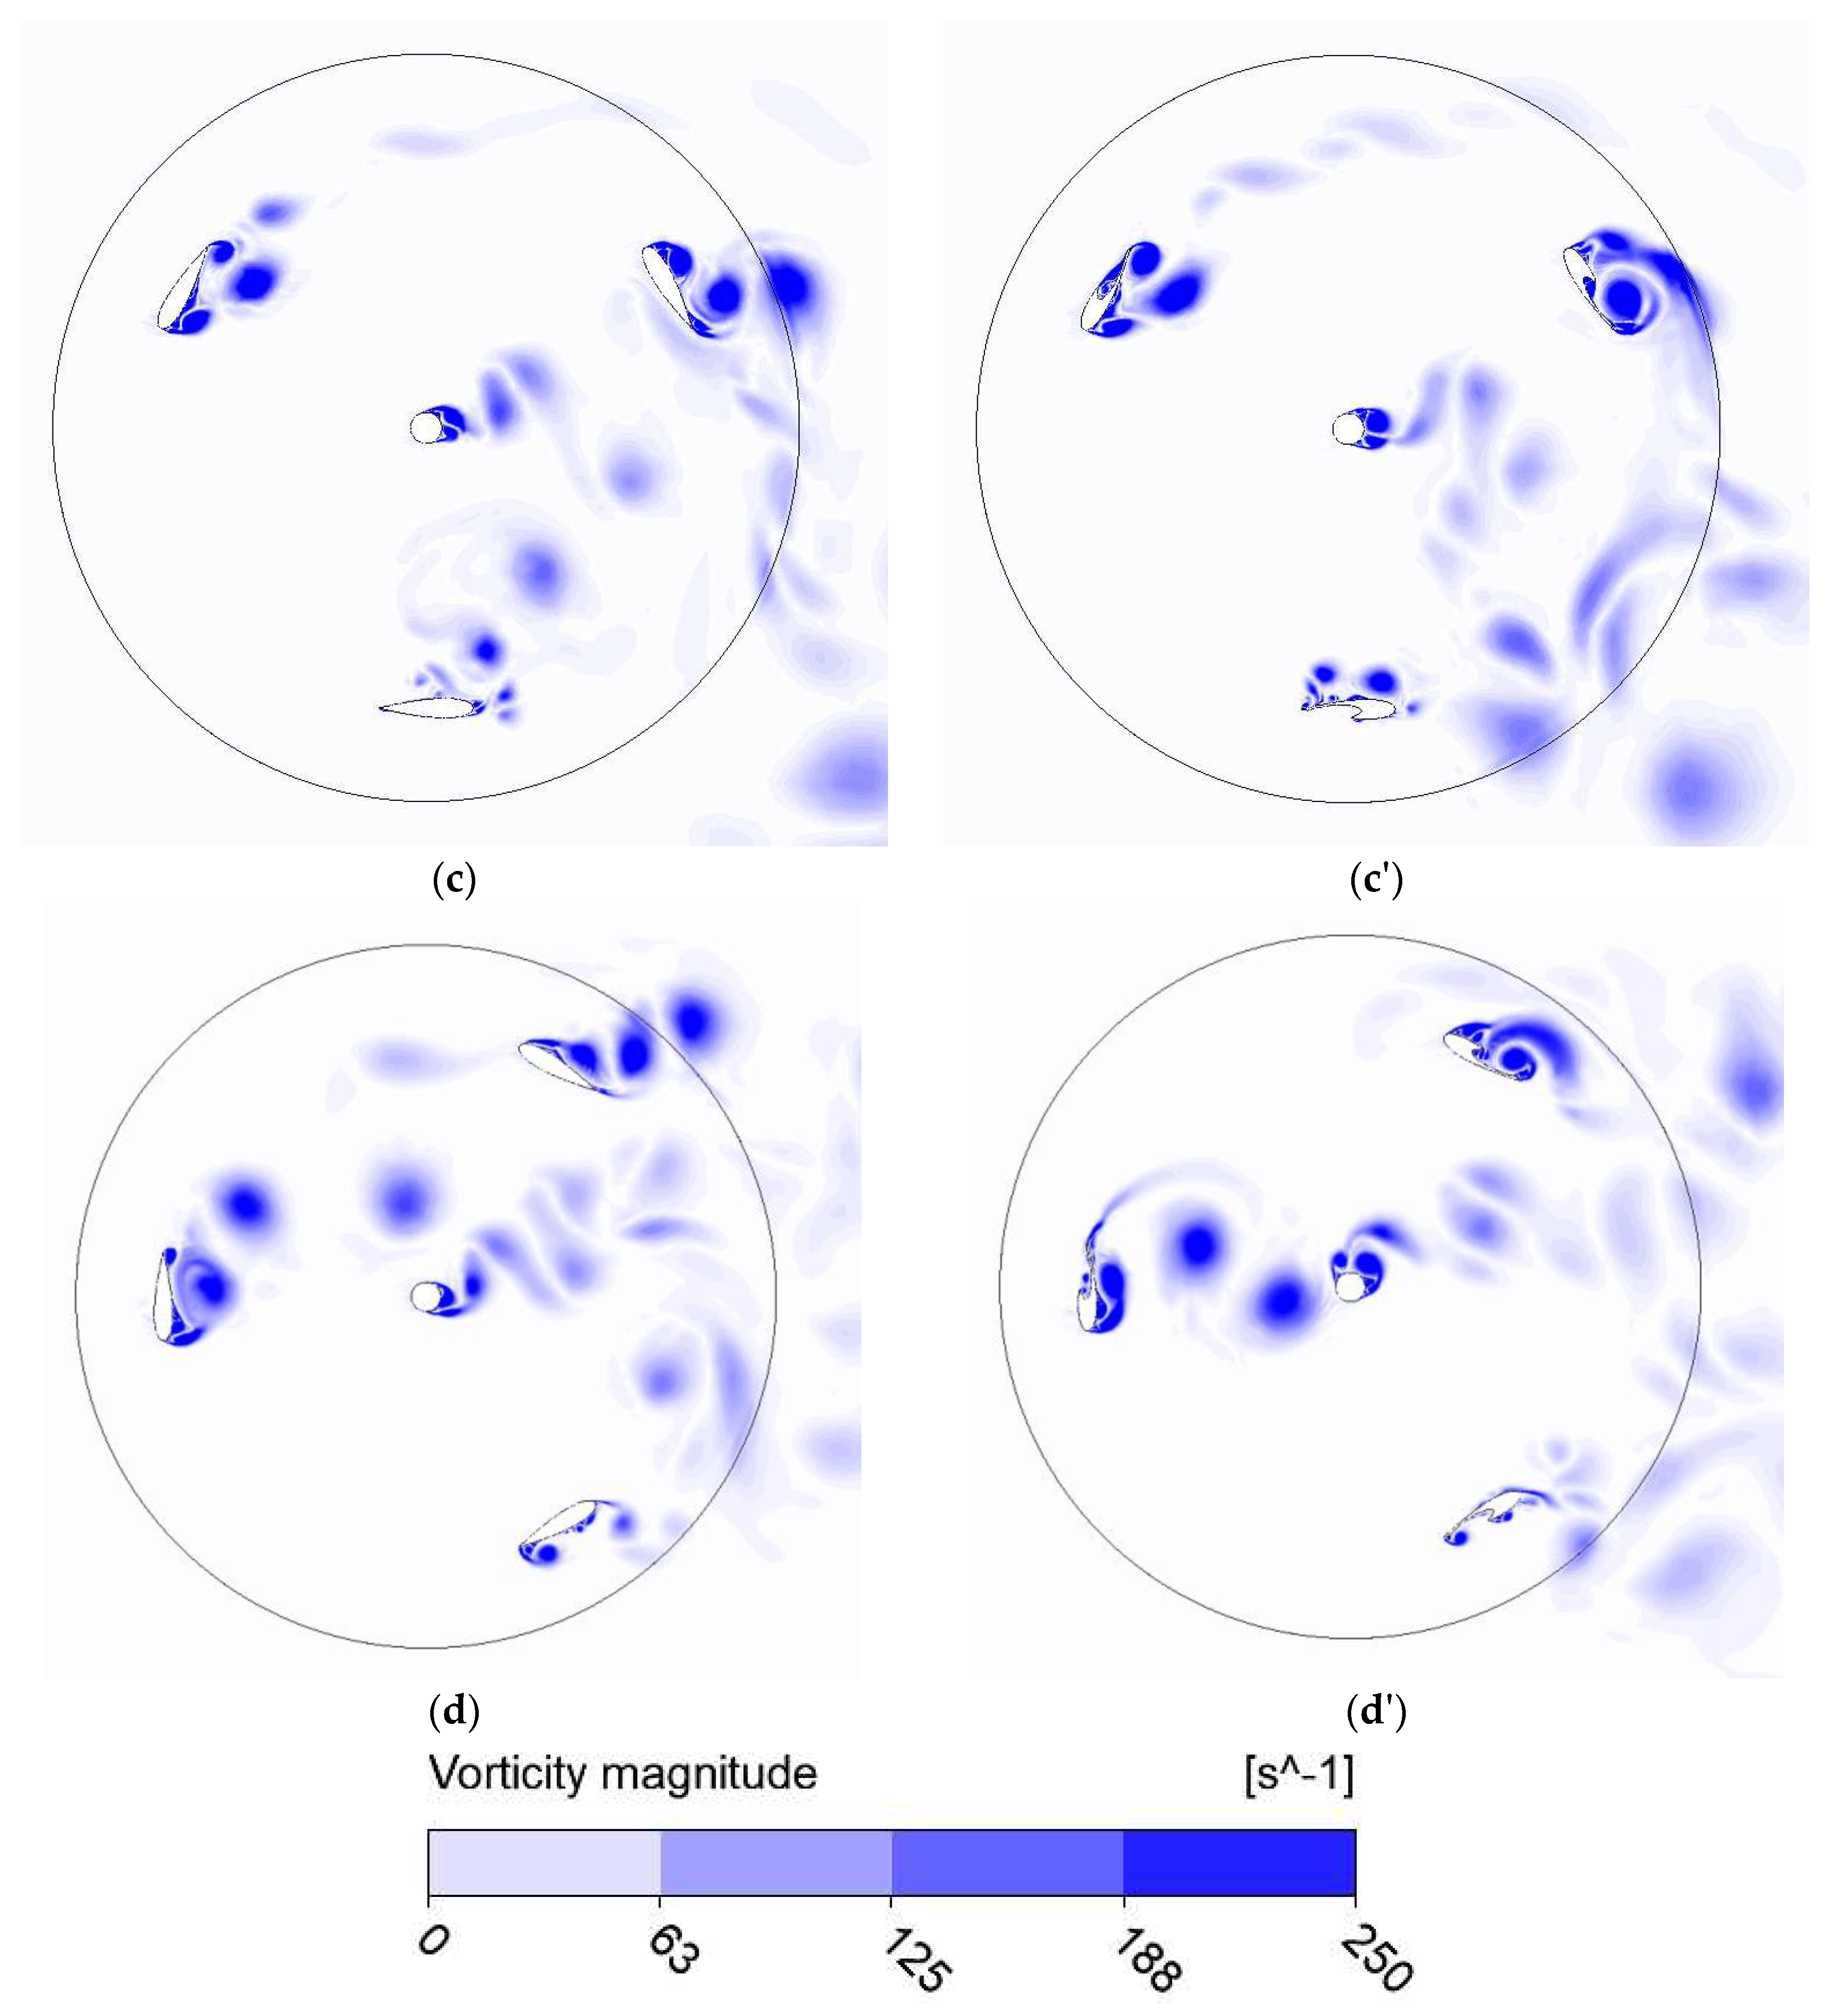
More information on the flow development of VAWT is provided in
Figure 6 and
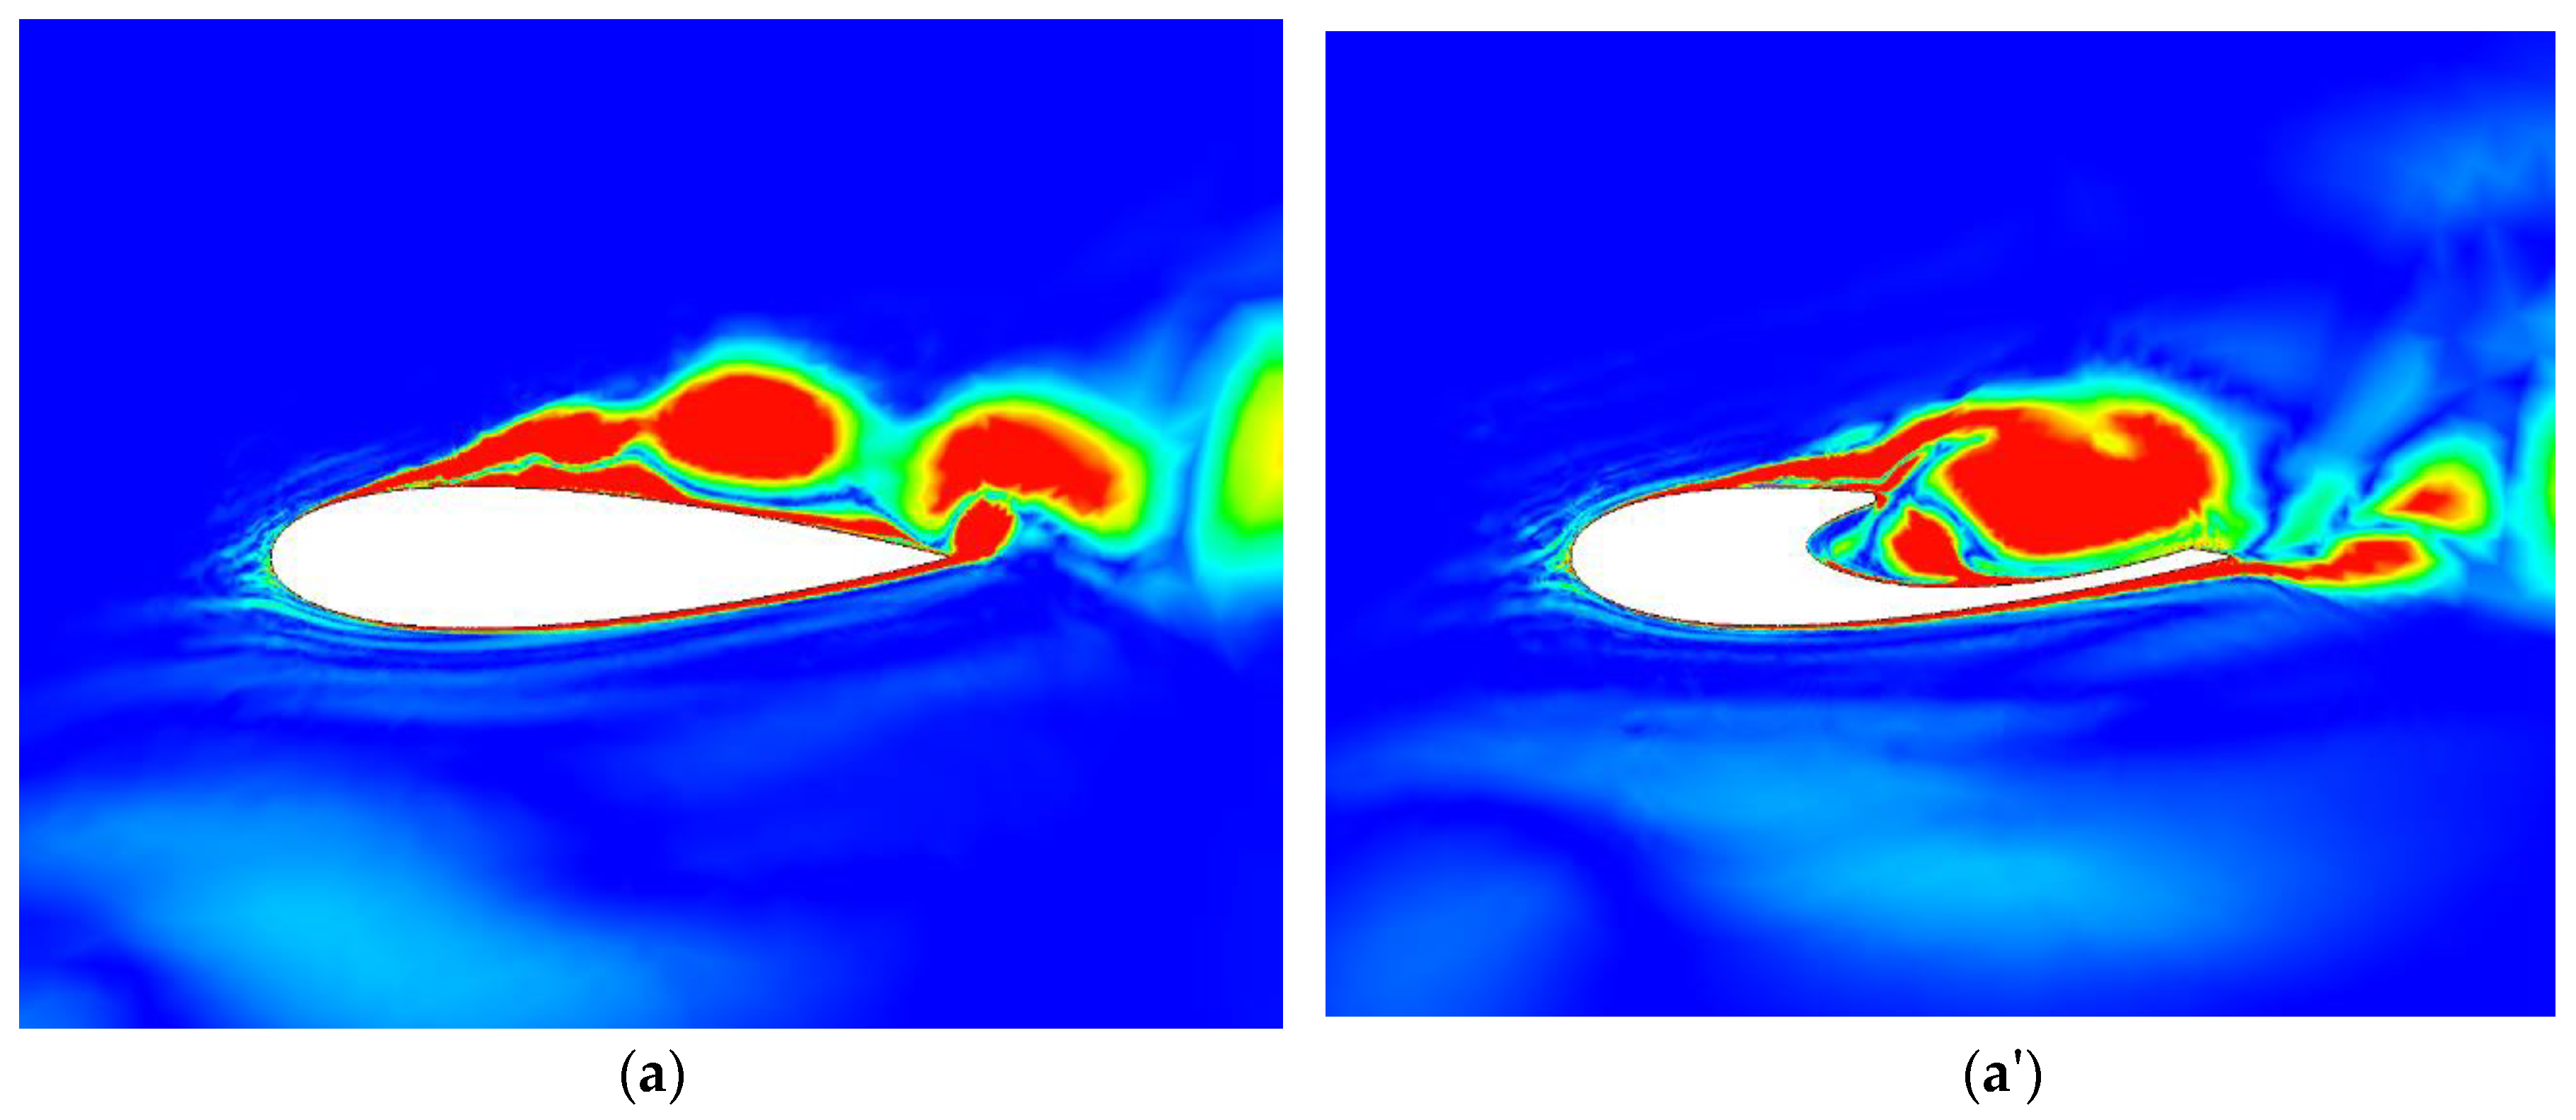
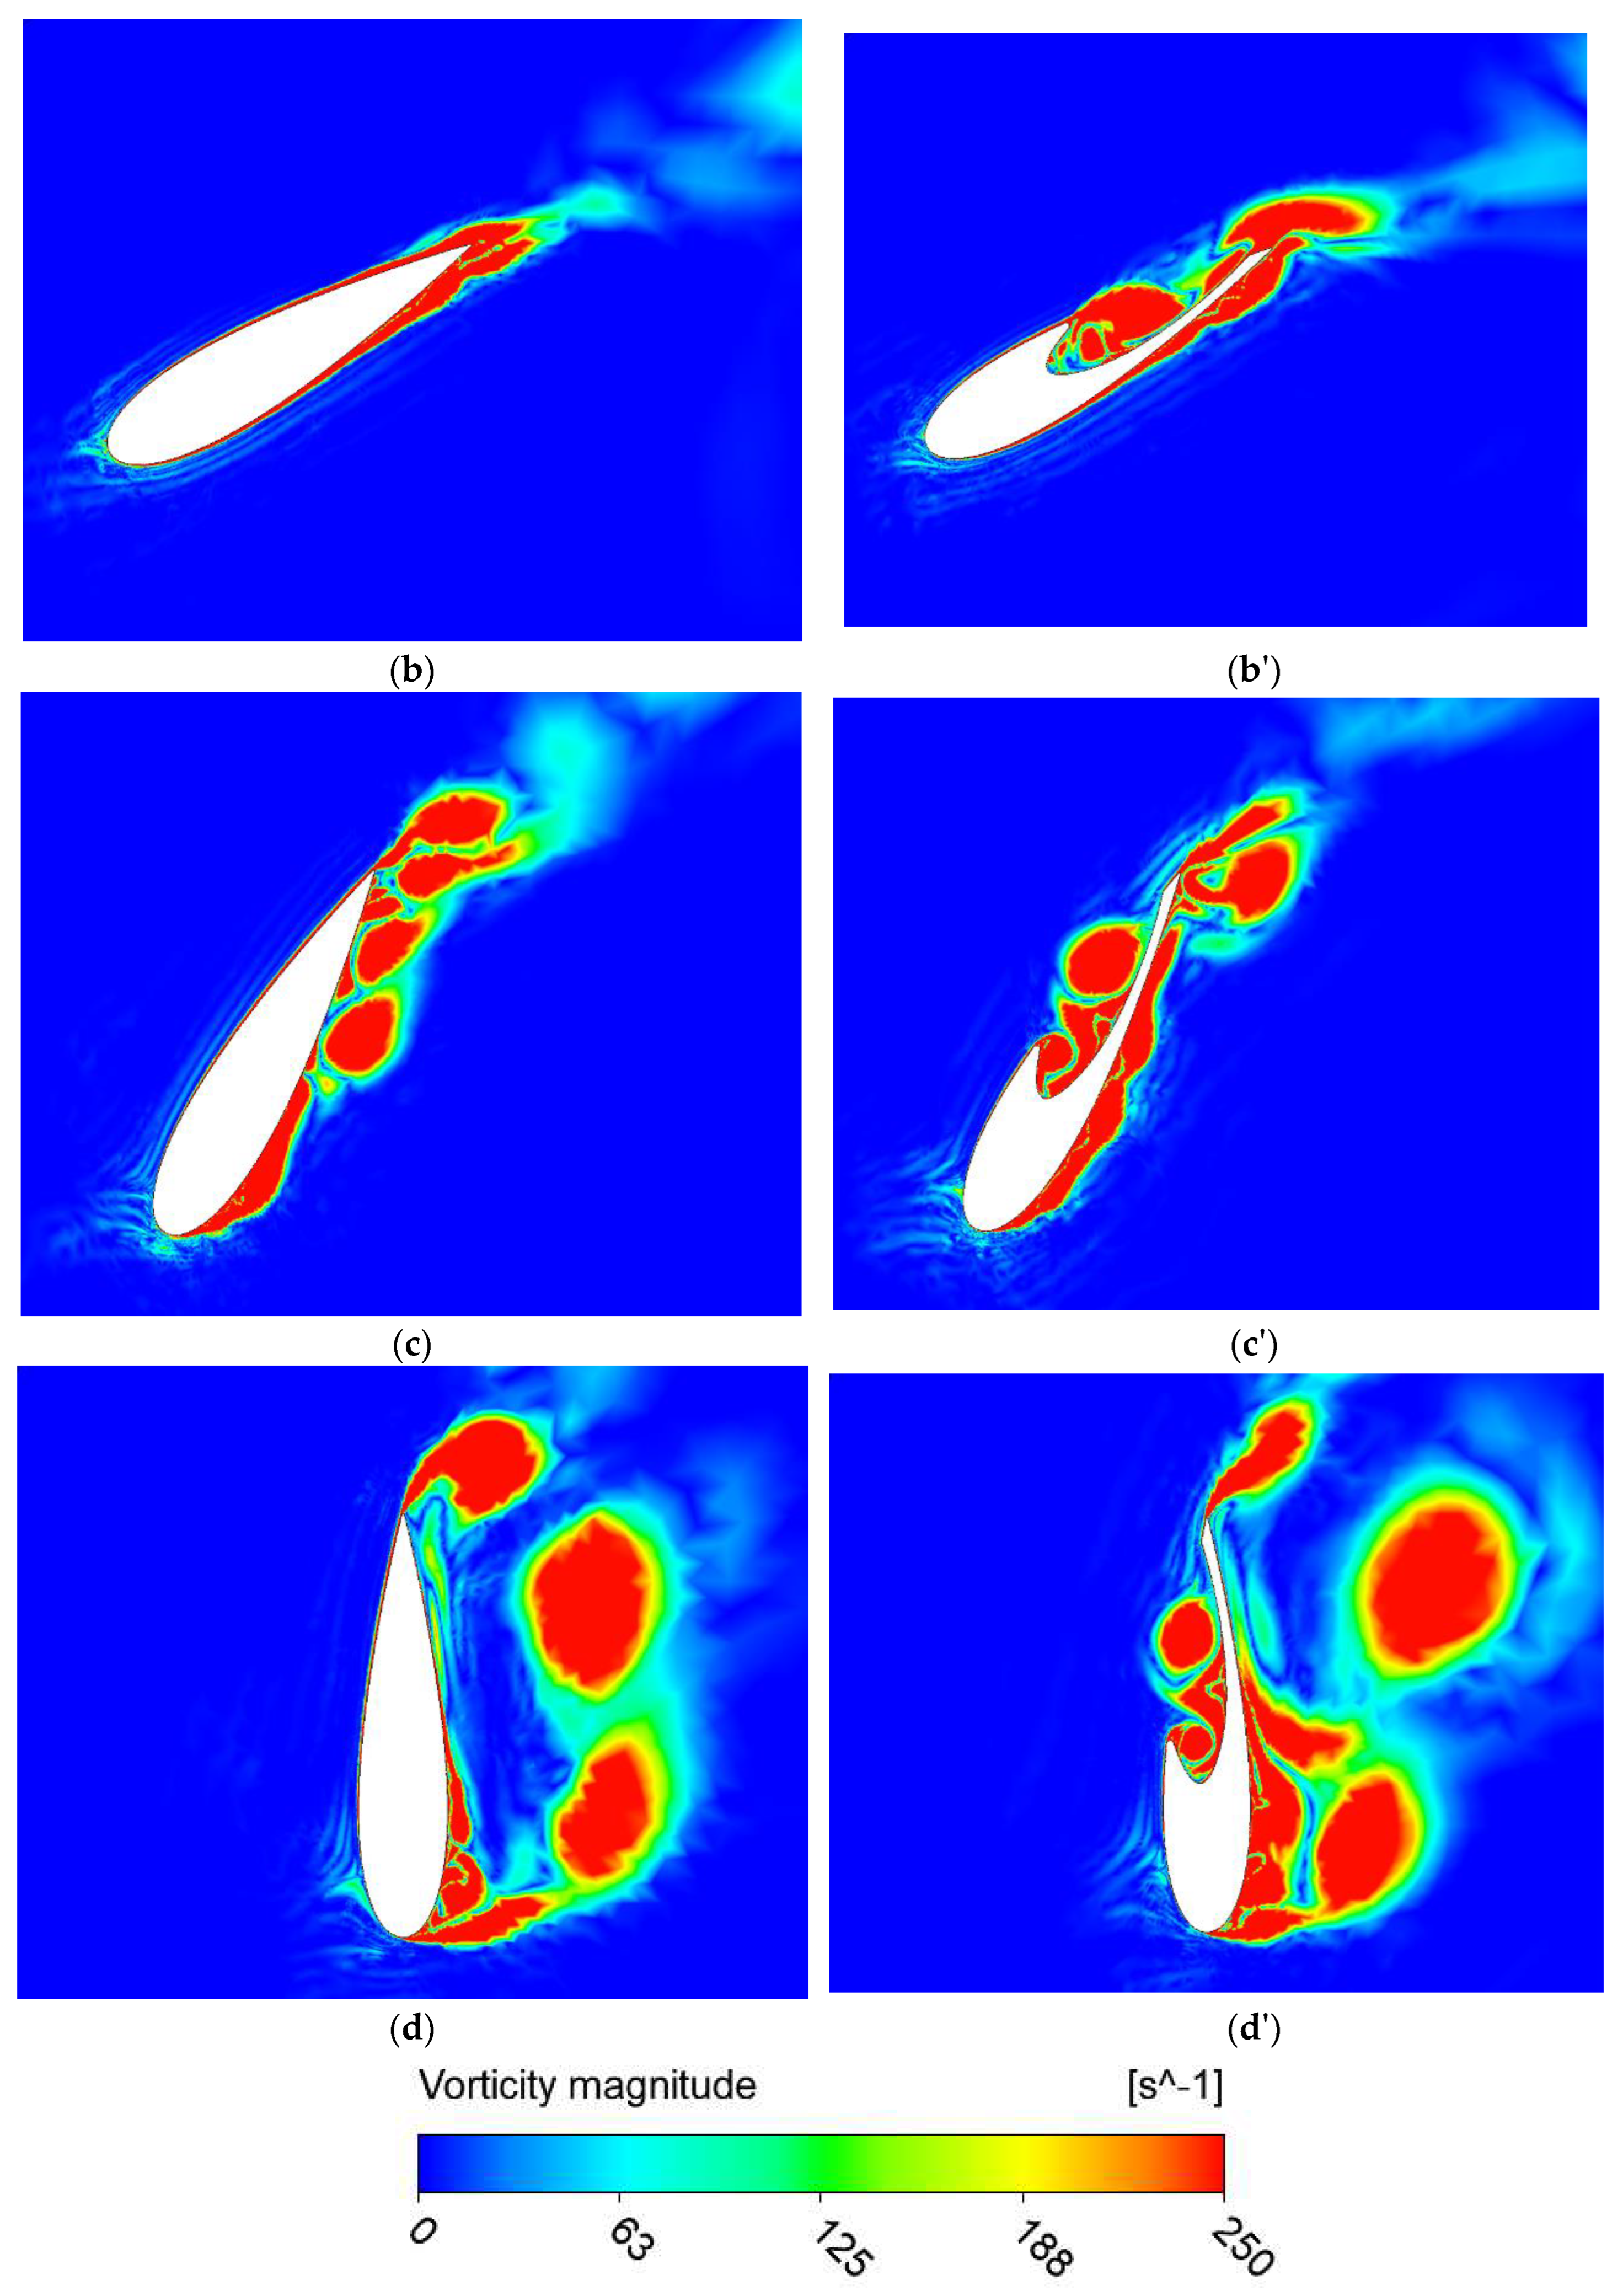
Figure 7, where 0.5 TSR represents the start of the process and 1 TSR represents the point at which the turbine is about to enter the auto-acceleration mode and reach the nominal point, or peak, of his performance. Because of the wake effects that manifest at this functional stage, it is anticipated that the unsteady flow field would be complex. The wake from the leading blade interacts with the blades behind it, as can be seen from both figures where the vorticity magnitude is displayed. However, in case 2, the separation is delayed due to the use of a vortex trap, resulting in increased efficiency.
During a full 360-degree rotation, the resulting aerodynamic forces acting on the blades were reduced to the overall torque coefficient. After 120 degrees, an arrangement with three blades exhibits almost periodic behavior. The torque coefficients of the numerical findings for four distinct TSRs — 0.5, 0.75, 1, and 1.25 for the investigated cases—are compared in
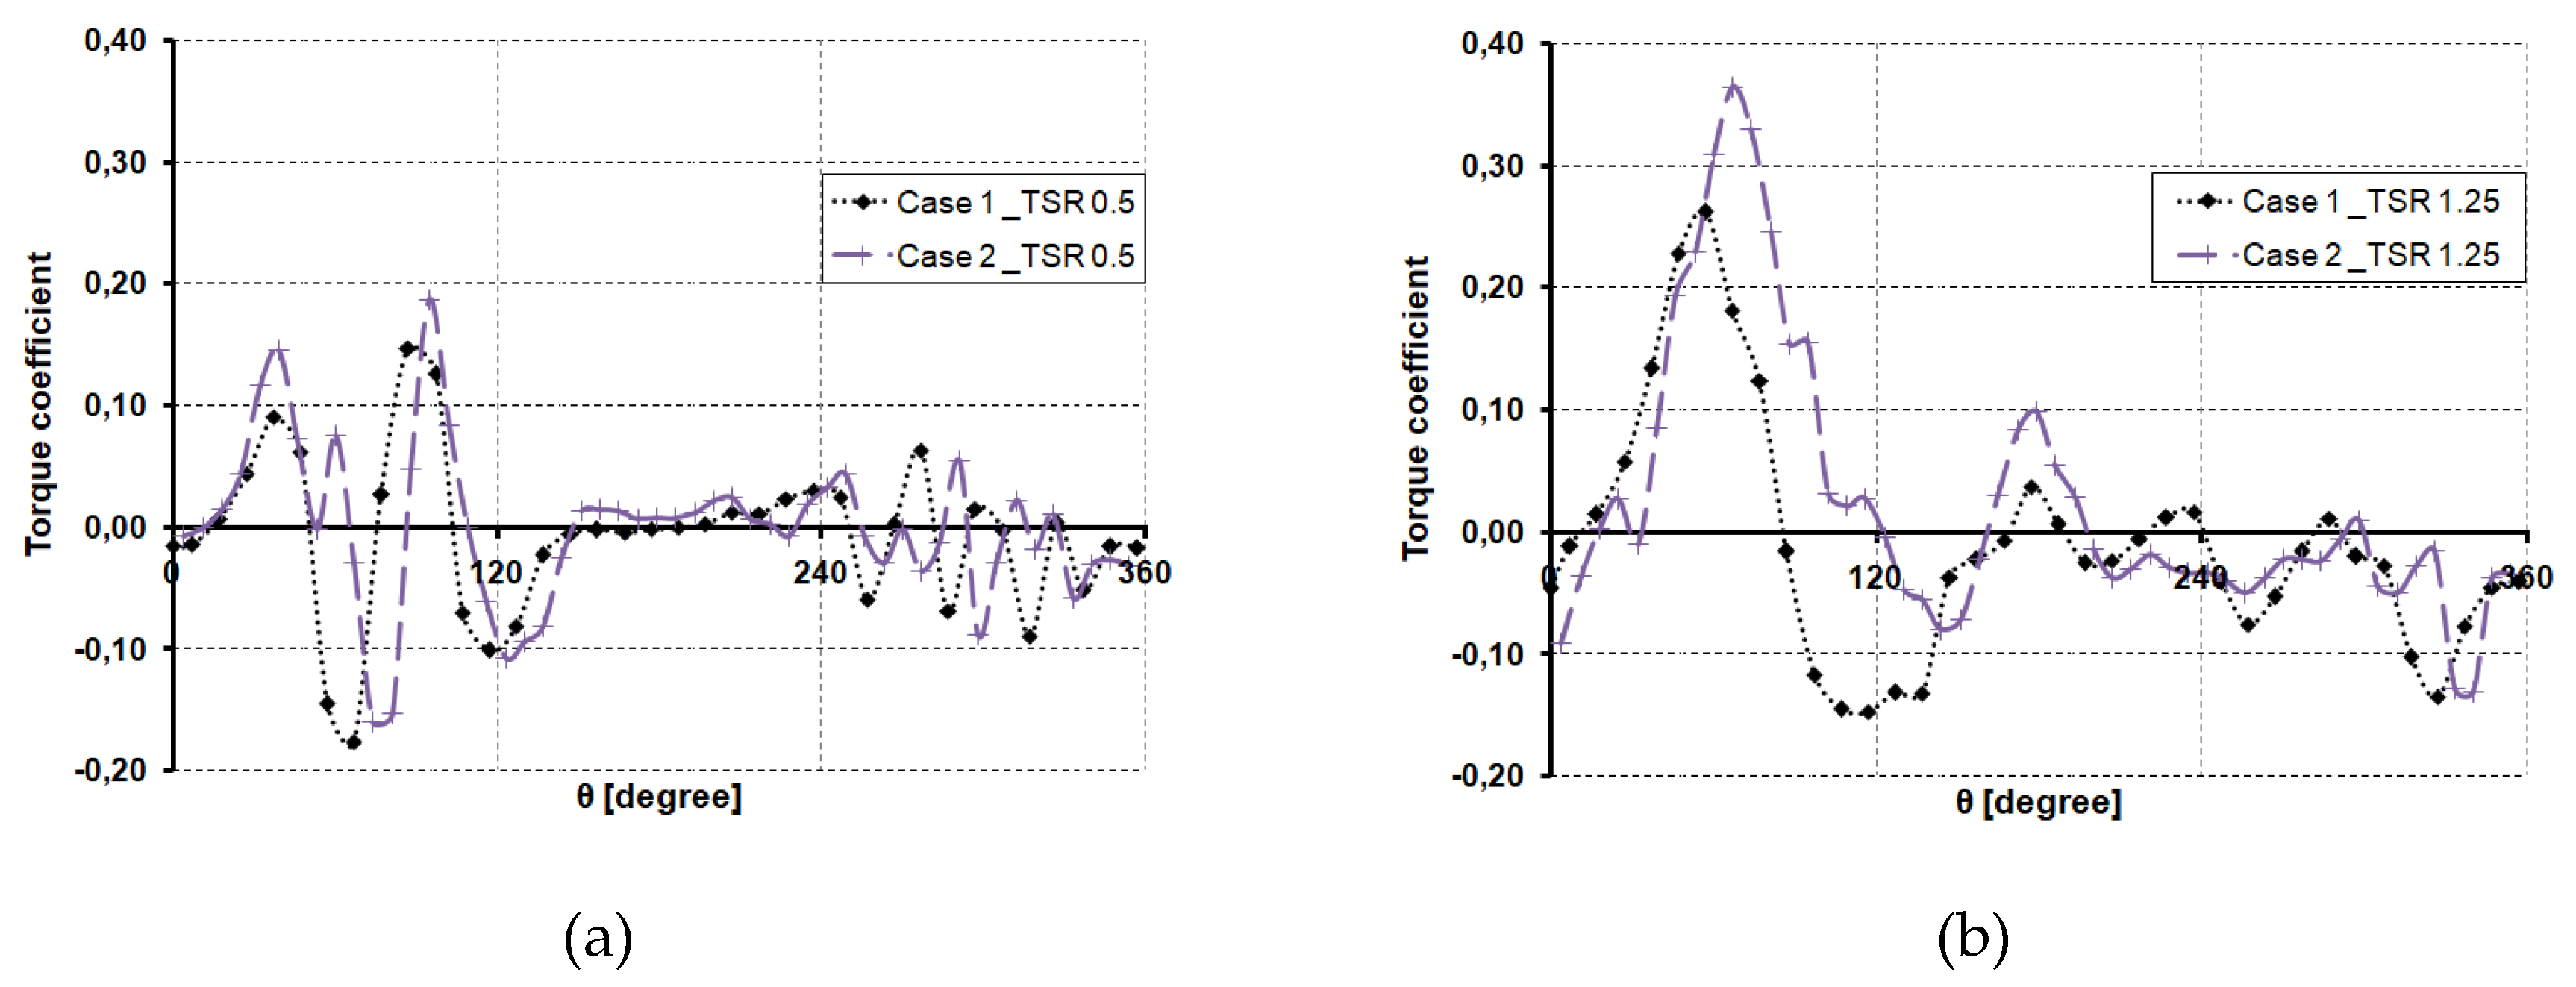
Figure 8. It is generally evident from this comparison that the second case, in which we employed the vortex trap to enhance the flow by postponing the detachments, has a greater torque coefficient.
In essence, the torque coefficient indicates how well the wind energy is being converted into mechanical torque by the VAWT. Better performance is indicated by a larger torque coefficient, which suggests that the wind turbine has the capacity to attain its nominal rotational speed. In
Figure 9, the torque coefficient for a single blade for each of the analyzed scenarios for TSR 0.5 and TSR 1.25 was presented in order to better illustrate the impact of the vortex trap on wind turbine efficiency.
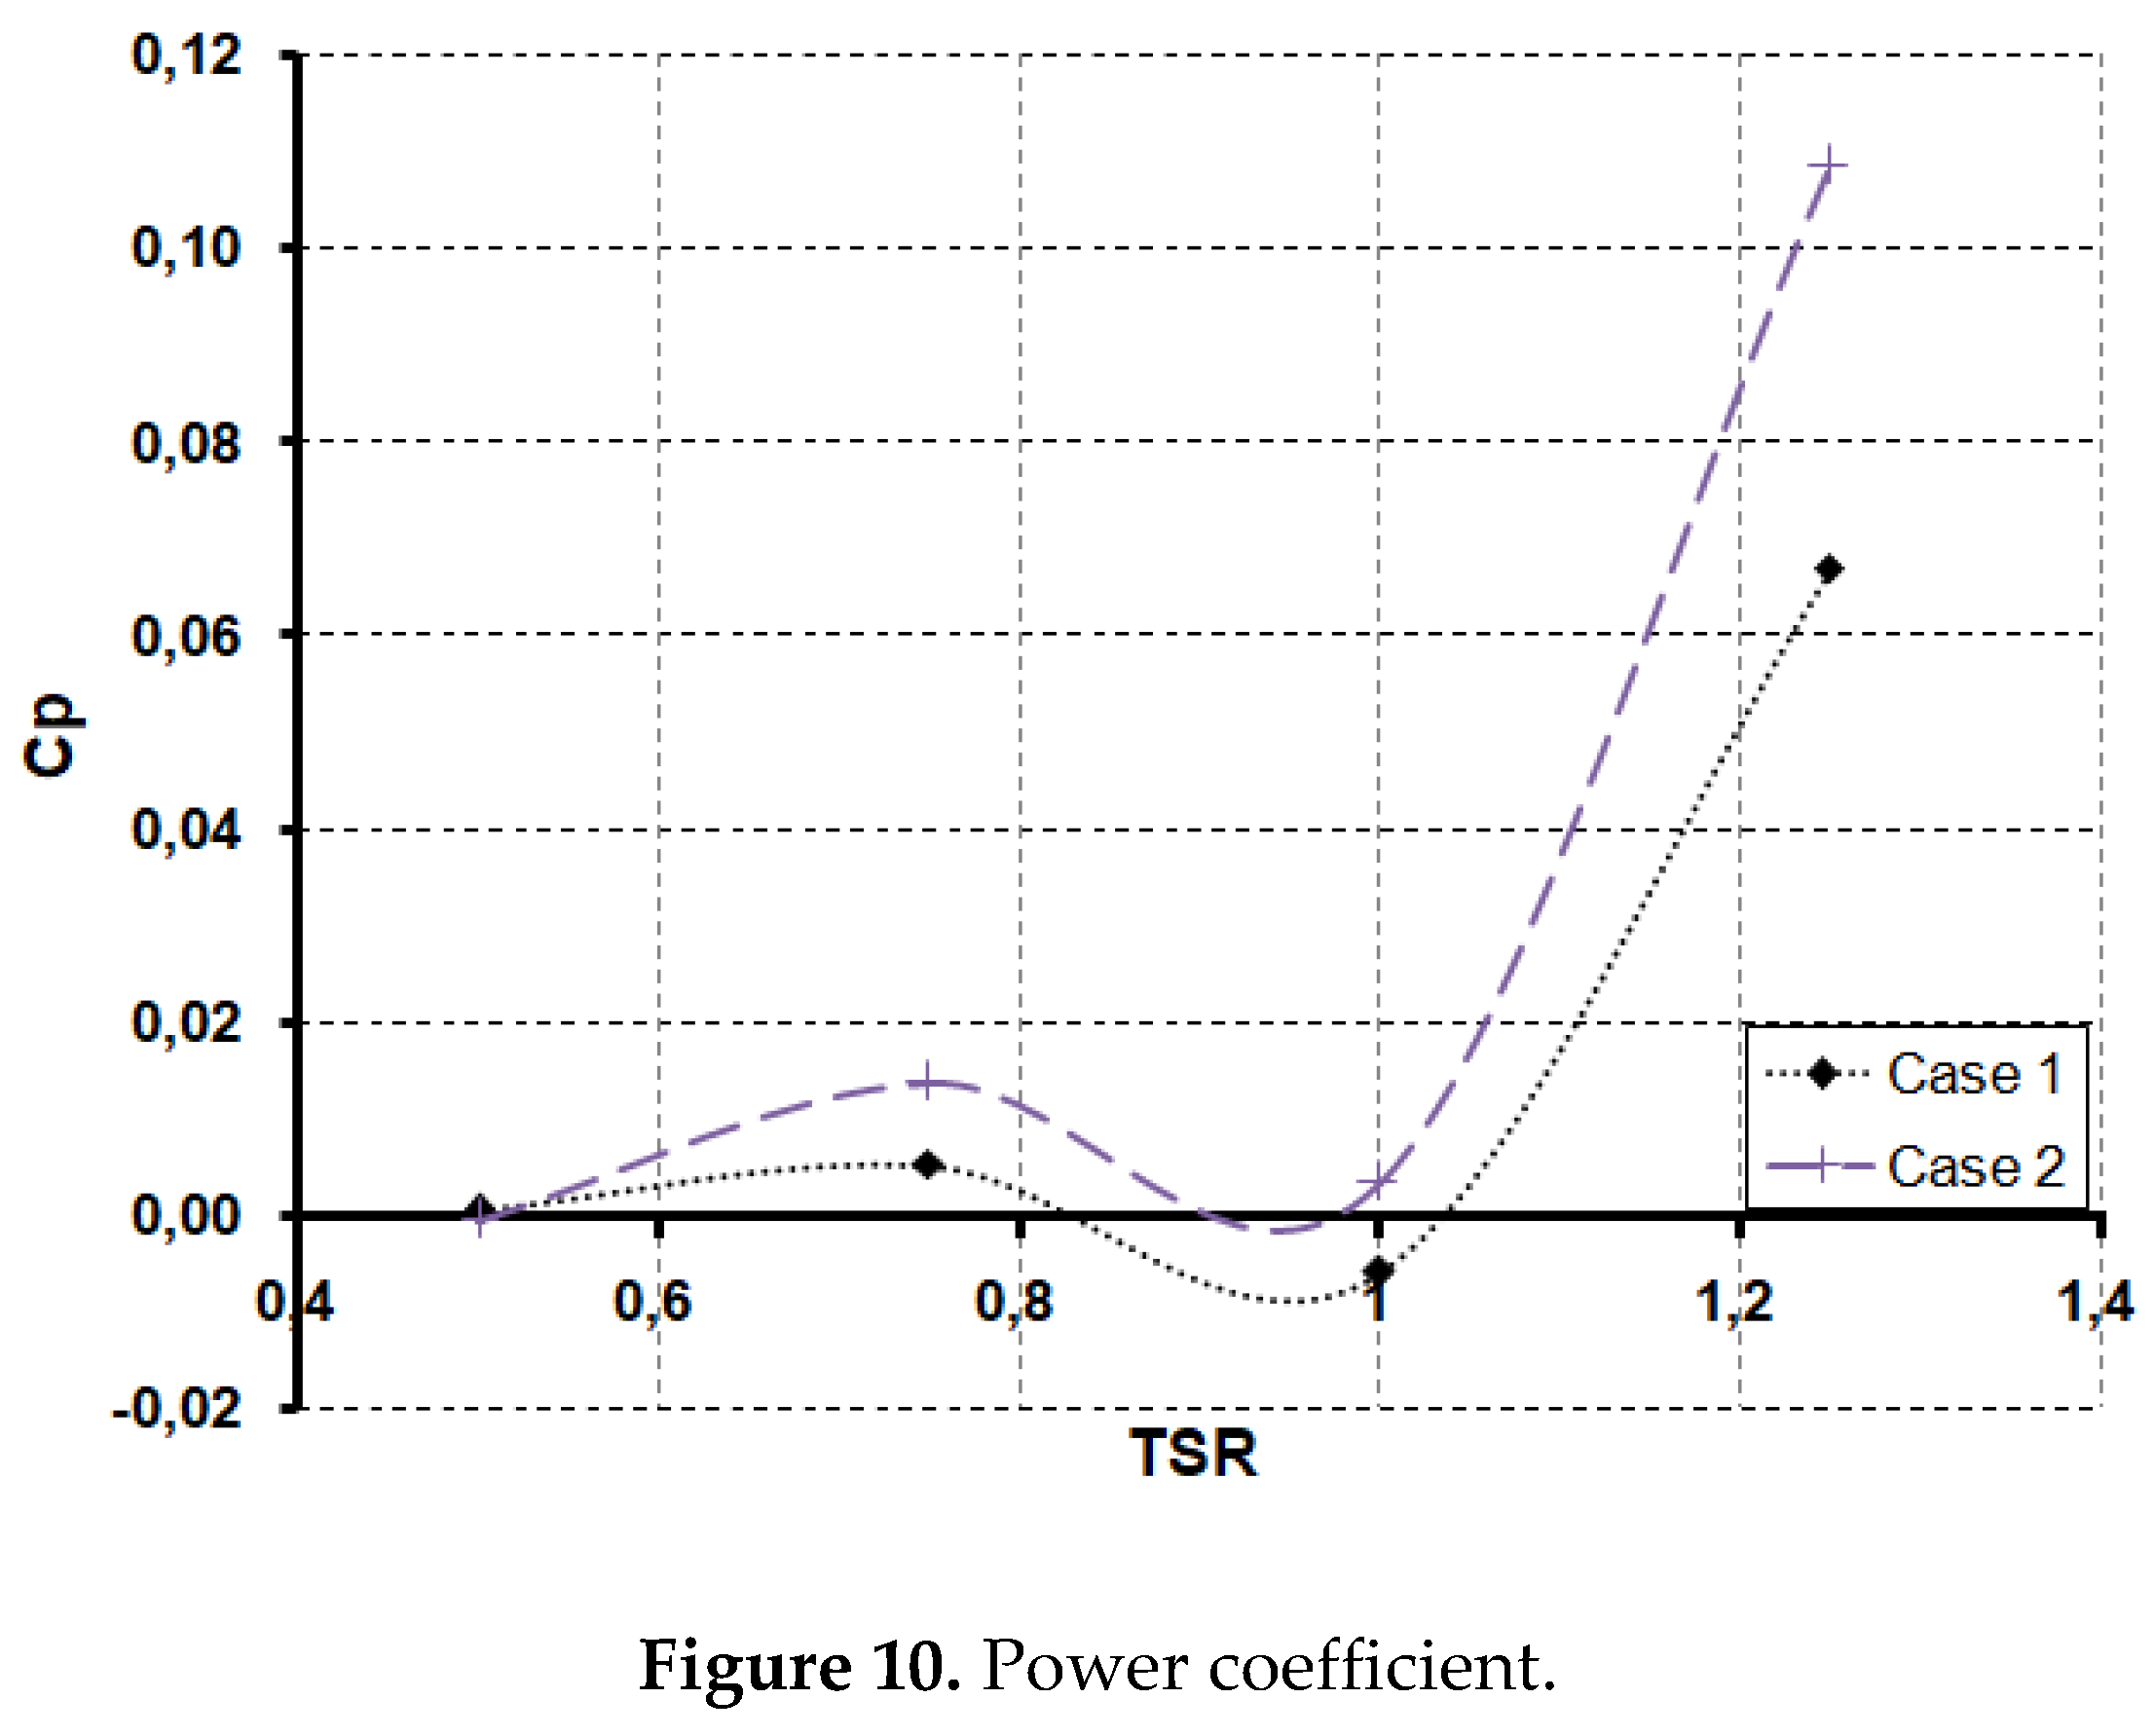
The LES technique predicts the value of Cp quite well, which is very close to the trend of the curve efficiency of a vertical axis wind turbine. The average power coefficients as a function of tip speed ratio are depicted in
Figure 10. The average coefficients for the latest 360 degree revolution from the 10 completed ones studied were determined. A cohesive pattern is detected right away, indicating that utilizing the flow control approach increases the wind turbine power coefficient significantly.
The Cps of the turbine in case 2 were much greater than those in case 1; at TSR 1.25, a maximum of 0.108 was observed, compared to just 0,06 in the conventional arrangement (case 1). This indicates that the initial wind turbine efficiency may be increased by 40% by implementing flow control. It is thought that employing a vortex trap increases performance by allowing the flow to remain attached for longer time.
4. Discussion
Regarding what constitutes the worst drawback of these particular turbines, the wind turbine world views the self-starting mechanism of VAWTs from many points of view. If a turbine can accelerate and reach a steady-state angular velocity in response to aerodynamic forces and moments without the need for external stimulation, it is often regarded as self-starting. The duration required to attain a steady-state rotational speed commensurate with its peak performance can be utilized to ascertain its self-starting capability.
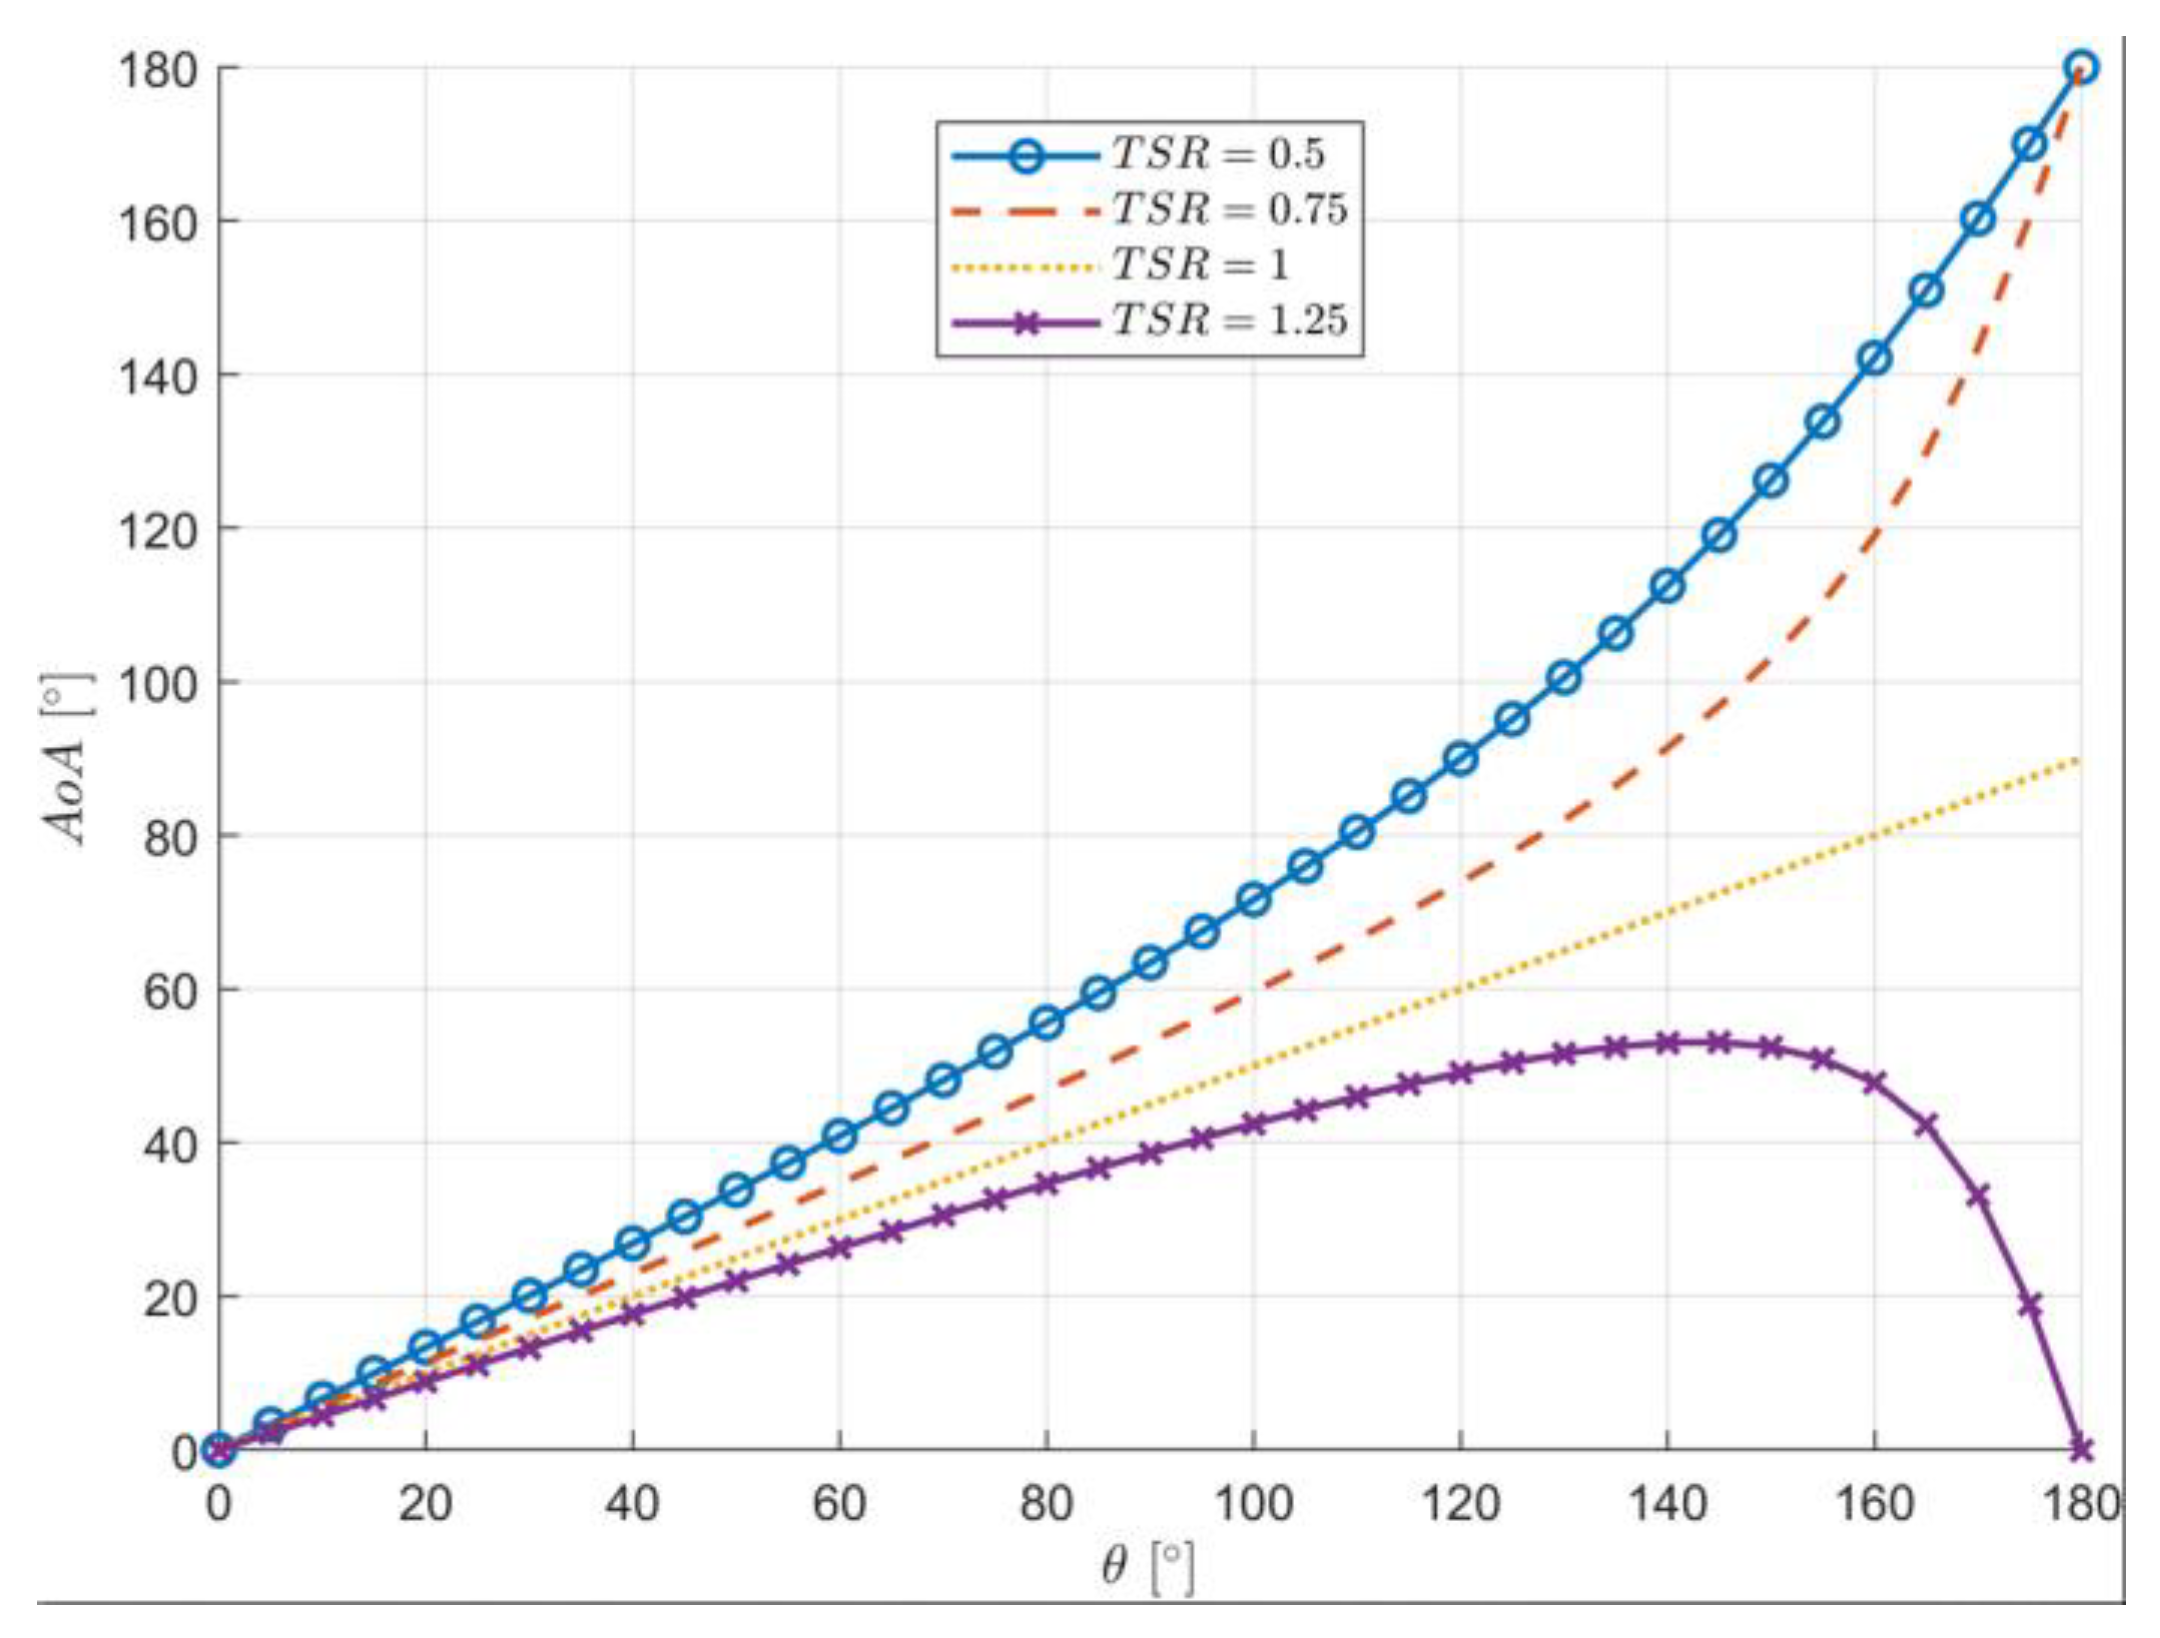
The measurable aerodynamic performance of turbines is determined by the flow physics surrounding them and its interaction between the blades. The effective angles-of-attack (AoA) of blades are determined by their instantaneous locations, which is defined as:
Figure 11 shows how AoA fluctuates as a function of blade position (θ), indicating that the configurations suffer unusually significant effective angles-of-attack during the beginning process.
When comparing this data to unstable aerodynamic forces, it can be seen that the excessive effective angles-of-attack are what create negative lift, which lead to reduced efficiency. However, the flow remains longer attached when the vortex trap is used, and even if the AoA is still quite high at low TSR, we gain an efficiency boost that is highly beneficial for the self-start behavior.
In order to facilitate comprehension, the outcomes for each cases are displayed in pairs for a single blade at various points. The vorticity contours for a single blade at a tip speed ratio of 1 are shown in Figure 14. It is possible to see from the figure how the flow control method helps the flow stay attached to the blades for longer periods of time, thereby lowering the interactions between the blades and increasing efficiency. Additionally, the vortex trap plays a crucial role in the wind turbine's starting by developing a high torque value that can, even momentarily, convert a lift-based vertical axis wind turbine into a drag-based vertical axis wind turbine, which is well-known for its quick start at a low tip speed ratio.
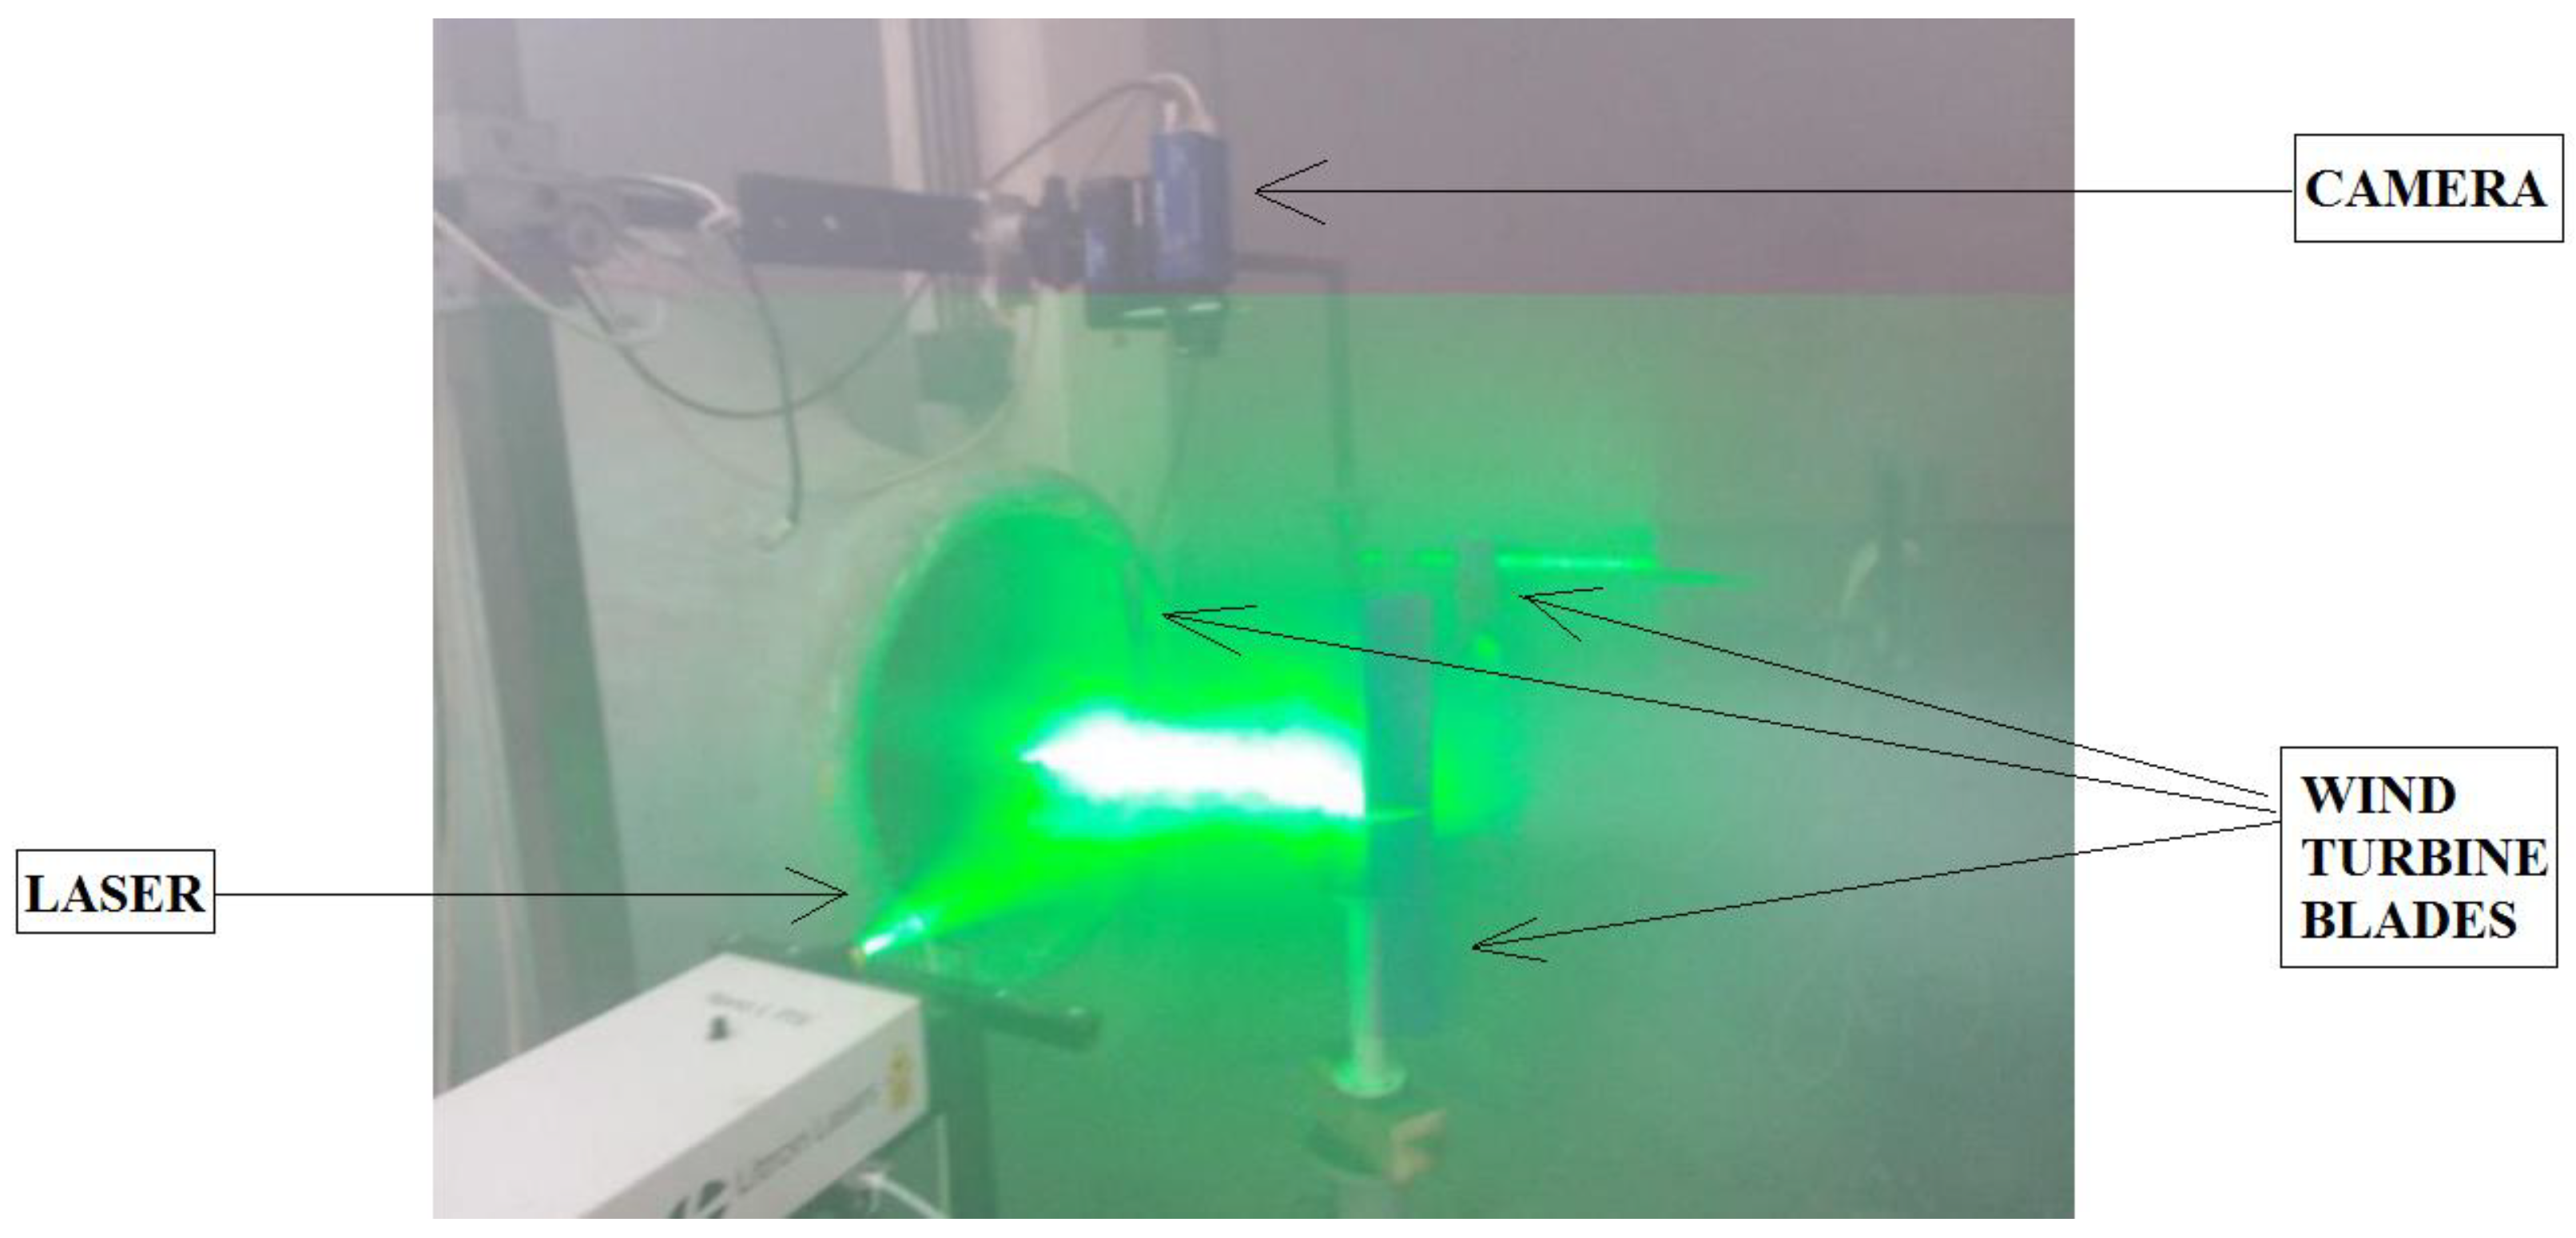
To capture the flow behavior in the future research, the starting procedure for various wind speed values will be done by utilizing the Particle Image Velocimetry (PIV) [
51,
52] technology to experimentally evaluate the configurations. The experimental testing campaign will be done in a subsonic wind tunnel on reduced scale models. The setup for the experimental campaign is presented in
Figure 13.
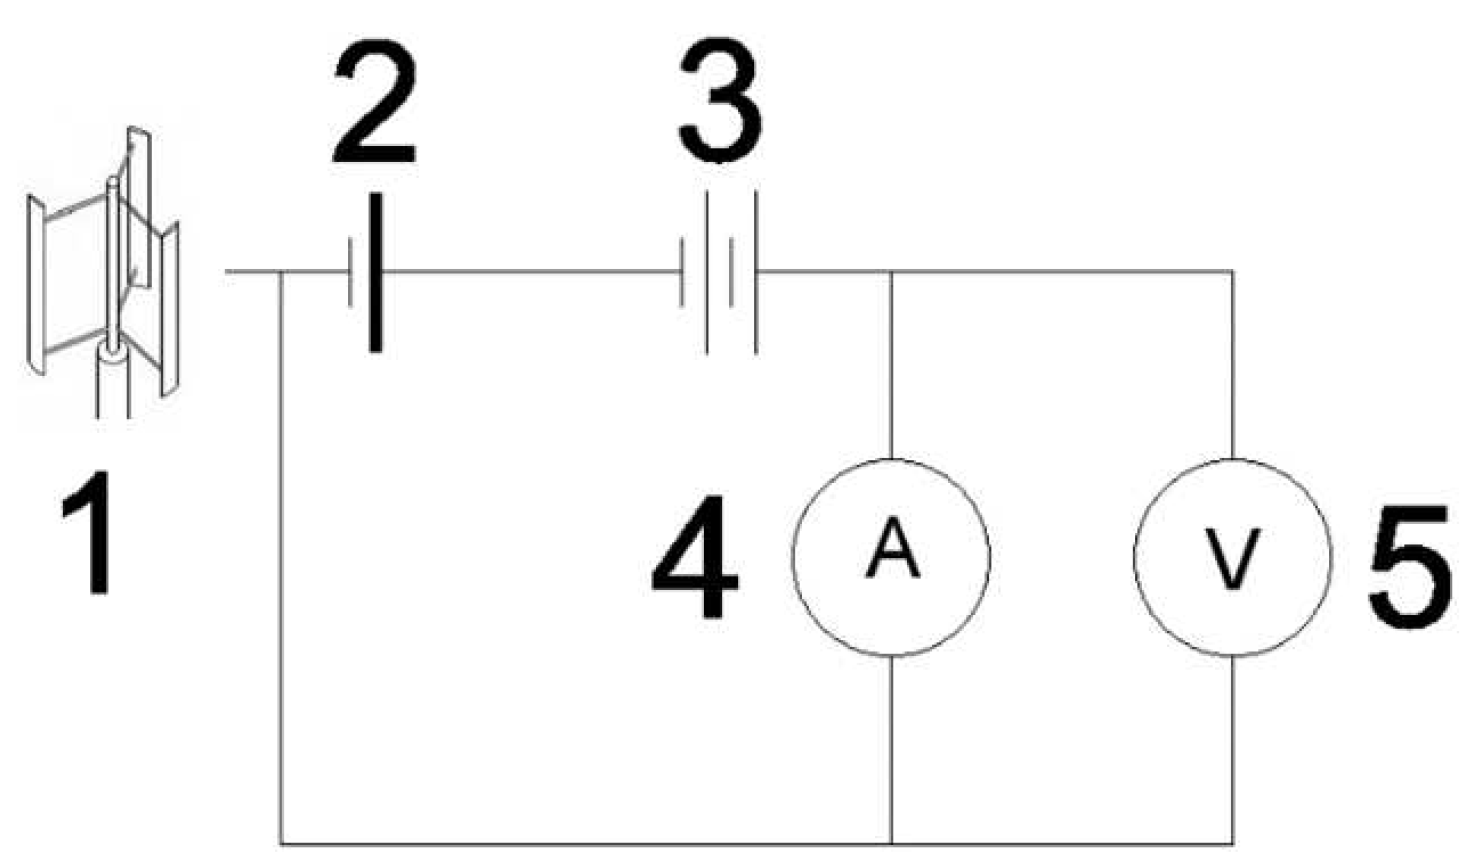
Performance measurements will be carried out using a 3-phase AC Permanent Magnet Generator (position 1 in
Figure 14) directly connected to the rotor axis. Electrical power will be measured after using a wind controller, model (position 2 in
Figure 14), connected to charge a 9AH/12VDC battery (position 3 in
Figure 14). A digital multimeter (position 5 in
Figure 14), placed in parallel in the electric circuit, will be used to measure the electrical voltage and a digital multimeter (position 4 in
Figure 14),placed in series in the electric circuit, used to measure the current intensity. A diagram of the electrical circuit is presented in
Figure 14.
Figure 14.
Electrical diagram of the circuit used for VAWT performance measurements.
Figure 14.
Electrical diagram of the circuit used for VAWT performance measurements.
5. Conclusions
In-depth research on the flow dynamics during a vertical-axis wind turbine's startup was conducted using a very accurate numerical approach. The Large Eddy Simulations is highly recommended in the case of studying fully unsteady flows like those that are happening in the vertical axis wind turbine working. Two computational fluid dynamics (CFD) models were developed for this work. The first model was a traditional vertical-axis wind turbine with three blades, and the second model had the same structure but was modified to include a vortex trap. Both models were numerically studied using the sliding mesh approach. In order to ensure a fair comparison, a number of factors, including the size of the computational domain, boundary conditions, LES technique, turbine characteristics, total number of elements for the stator section, and grid resolution near the blades, were maintained to be comparable in both models.
A vortex trap was mounted on the outside of the blades in order to thoroughly examine how well a flow control technique mitigated the flow separation issue in the VAWT starting process. The vortex trap, which is positioned on the outside of the blade, produces results that indicate that, even at lower TSR values, the device has little effect on turbine efficiency. However, as TSR increases, the flow begins to alter, leading to a higher efficiency for the configuration in which the flow method technique was applied. Results from the vortex trap mounted outside the blade demonstrate a notable improvement in wind turbine performance. This is because the power coefficient increases to 0.106, or 40%, larger than the conventional version without vortex trap due to the flow control managing the flow detachment, which is particularly noticeable at a high TSR of 1.25.
The flow surrounding VAWT is shown to be complex at low TSRs regardless of whether the configuration has a flow control device or not, and their performances directly affect the VAWT's capacity to achieve its nominal point of functioning.
Author Contributions
Conceptualization, M.I. and S.S.; methodology, M.I.; software, M.I.; validation, M.I. and S.S.; formal analysis, S.S.; investigation, M.I.; resources, M.I.; data curation, S.S.; writing—original draft preparation, S.S.; writing—review and editing, M.I.; visualization, S.S.; supervision, M.I.; project administration, M.I.; funding acquisition, M.I. All authors have read and agreed to the published version of the manuscript.
Funding
This research was funded by the Romanian Minister of Research, Innovation, and Digitization, UEFSCDI, grant number 92 PTE/2022.
References
- Real-Time Electricity Tracker Available online: https://www.iea.org/data-and-statistics/data-tools/real-time-electricity-tracker (accessed on 11 December 2023).
- Ahmad, T.; Zhang, D. A Critical Review of Comparative Global Historical Energy Consumption and Future Demand: The Story Told so Far. Energy Reports2020, 6, 1973–1991. [CrossRef]
- Acheampong, A.O. Economic Growth, CO2 Emissions and Energy Consumption: What Causes What and Where? Energy Economics2018, 74, 677–692. [CrossRef]
- Le Quéré, C.; Andrew, R.M.; Friedlingstein, P.; Sitch, S.; Hauck, J.; Pongratz, J.; Pickers, P.A.; Korsbakken, J.I.; Peters, G.P.; Canadell, J.G.; et al. Global Carbon Budget 2018. Earth Syst. Sci. Data2018, 10, 2141–2194. [CrossRef]
-
CO2 Emissions in 2022; IEA: Paris, 2023.
- IPCC, Ip. Summary for Policymakers” in Global Warming of 1.5° C. An IPCC Special Report on the Impacts of Global Warming of 1.5° C above Pre-Industrial Levels and Related Global Greenhouse Gas Emission Pathways, in the Context of Strengthening the Global Response to the Threat of Climate Change, Sustainable Development, and Efforts to Eradicate Poverty. Sustainable Development, and Efforts to Eradicate Poverty. Geneva, Switzerland: World Meteorological Organization2018, 32.
- Ntanos, S. Renewable Energy Consumption, Carbon Dioxide Emissions and Economic Growth: Evidence from Europe and Greece.; September 21 2015.
- Mikhaylov, A. Efficiency of Renewable Energy Plants in Russia. An. Acad. Bras. Ciênc.2022, 94, e20191226. [CrossRef]
- Martín-Martínez, S.; Cañas-Carretón, M.; Honrubia-Escribano, A.; Gómez-Lázaro, E. Performance Evaluation of Large Solar Photovoltaic Power Plants in Spain. Energy Conversion and Management2019, 183, 515–528. [CrossRef]
- Arutyunov, V.S.; Lisichkin, G.V. Energy Resources of the 21st Century: Problems and Forecasts. Can Renewable Energy Sources Replace Fossil Fuels†. Russian Chemical Reviews2017, 86, 777. [CrossRef]
- Ledec, G.; Quintero, J.D. Good Dams and Bad Dams: Environmental Criteria for Site Selection of Hydroelectric Projects. 2003.
- Hamed, T.A.; Alshare, A. Environmental Impact of Solar and Wind Energy-a Review. Journal of Sustainable Development of Energy, Water and Environment Systems2022, 10, 1–23.
- Abohela, I.; Hamza, N.; Dudek, S. Urban Wind Turbines Integration in the Built Form and Environment. 2011, 10, 23–39.
- Barber, S.; Wang, Y.; Jafari, S.; Chokani, N.; Abhari, R.S. The Impact of Ice Formation on Wind Turbine Performance and Aerodynamics. 2011.
- Teff-Seker, Y.; Berger-Tal, O.; Lehnardt, Y.; Teschner, N. Noise Pollution from Wind Turbines and Its Effects on Wildlife: A Cross-National Analysis of Current Policies and Planning Regulations. Renewable and Sustainable Energy Reviews2022, 168, 112801. [CrossRef]
- Krijgsveld, K.L.; Akershoek, K.; Schenk, F.; Dijk, F.; Dirksen, S. Collision Risk of Birds with Modern Large Wind Turbines. Ardea2009, 97, 357–366. [CrossRef]
- Awada, A.; Younes, R.; Ilinca, A. Review of Vibration Control Methods for Wind Turbines. Energies2021, 14. [CrossRef]
- Castellani, F.; Astolfi, D.; Peppoloni, M.; Natili, F.; Buttà, D.; Hirschl, A. Experimental Vibration Analysis of a Small Scale Vertical Wind Energy System for Residential Use. Machines2019, 7. [CrossRef]
- Drones Protect Wind Turbines from Ice Available online: https://www.fraunhofer.de/en/press/research-news/2023/december-2023/drones-protect-wind-turbines-from-ice.html (accessed on 3 December 2023).
- Contreras Montoya, L.T.; Lain, S.; Ilinca, A. A Review on the Estimation of Power Loss Due to Icing in Wind Turbines. Energies2022, 15, 1083. [CrossRef]
- Ishugah, T.F.; Li, Y.; Wang, R.Z.; Kiplagat, J.K. Advances in Wind Energy Resource Exploitation in Urban Environment: A Review. Renewable and Sustainable Energy Reviews2014, 37, 613–626. [CrossRef]
- Mehedintu, A.; Soava, G.; Sterpu, M.; Grecu, E. Evolution and Forecasting of the Renewable Energy Consumption in the Frame of Sustainable Development: EU vs. Romania. Sustainability2021, 13, 10327. [CrossRef]
- Colesca, S.E.; Ciocoiu, C.N. An Overview of the Romanian Renewable Energy Sector. Renewable and Sustainable Energy Reviews2013, 24, 149–158. [CrossRef]
- Bianco, V.; Manca, O.; Nardini, S.; Minea, A.A. Analysis and Forecasting of Nonresidential Electricity Consumption in Romania. Applied Energy2010, 87, 3584–3590. [CrossRef]
- Yuan, X.-C.; Sun, X.; Zhao, W.; Mi, Z.; Wang, B.; Wei, Y.-M. Forecasting China’s Regional Energy Demand by 2030: A Bayesian Approach. Resources, Conservation and Recycling2017, 127, 85–95. [CrossRef]
- Cuce, E. An Overview of Domestic Energy Consumption in the UK: Past, Present and Future. International Journal of Ambient Energy2016, 37, 428–435. [CrossRef]
- Boretti, A.; Castelletto, S. Trends in Performance Factors of Large Photovoltaic Solar Plants. Journal of Energy Storage2020, 30, 101506. [CrossRef]
- Global Electricity Demand by Scenario, 2010-2030 Available online: https://www.iea.org/data-and-statistics/charts/global-electricity-demand-by-scenario-2010-2030 (accessed on 6 December 2023).
- Karimian, S.M.H.; Abdolahifar, A. Performance Investigation of a New Darrieus Vertical Axis Wind Turbine. Energy2020, 191, 116551. [CrossRef]
- Wang, Q.; Liu, B.; Hu, C.; Wang, F.; Yang, S. Aerodynamic Shape Optimization of H-VAWT Blade Airfoils Considering a Wide Range of Angles of Attack. International Journal of Low-Carbon Technologies2022, 17, 147–159. [CrossRef]
- Strătilă, S.; Glasberg, D.; Malael, I. Performance Analysis of a New Vertical Axis Turbine Design for Household Usage. Eng. Technol. Appl. Sci. Res.2024, 14, 12536–12542. [CrossRef]
- Malael, I.; Bucur, I.O. Numerical Evaluation of the Flow around a New Vertical Axis Wind Turbine Concept. Sustainability2021, 13, 9012. [CrossRef]
- Malael, I.; Dragan, V. Numerical and Experimental Efficiency Evaluation of a Counter-Rotating Vertical Axis Wind Turbine. Eng. Technol. Appl. Sci. Res.2018, 8, 3282–3286. [CrossRef]
- Bai, H.; Chan, C. Positive Interactions of Two Savonius-Type Vertical-Axis Wind Turbines for Performance Improvement. Energy Procedia2019, 158, 625–630. [CrossRef]
- Shaheen, M.; El-Sayed, M.; Abdallah, S. Numerical Study of Two-Bucket Savonius Wind Turbine Cluster. Journal of Wind Engineering and Industrial Aerodynamics2015, 137, 78–89. [CrossRef]
- Deda Altan, B.; Gultekin, G.S. Investigation of Performance Enhancements of Savonius Wind Turbines through Additional Designs. Processes2023, 11, 1473. [CrossRef]
- Maldonado, V.; Farnsworth, J.; Gressick, W.; Amitay, M. Active Control of Flow Separation and Structural Vibrations of Wind Turbine Blades. Wind Energy2010, 13, 221–237. [CrossRef]
- Shun, S.; Ahmed, N.A. Wind Turbine Performance Improvements Using Active Flow Control Techniques. Procedia Engineering2012, 49, 83–91. [CrossRef]
- Aboelezz, A.; Ghali, H.; Elbayomi, G.; Madboli, M. A Novel VAWT Passive Flow Control Numerical and Experimental Investigations: Guided Vane Airfoil Wind Turbine. Ocean Engineering2022, 257, 111704. [CrossRef]
- Zhu, H.; Hao, W.; Li, C.; Ding, Q.; Wu, B. A Critical Study on Passive Flow Control Techniques for Straight-Bladed Vertical Axis Wind Turbine. Energy2018, 165, 12–25. [CrossRef]
- Fernandez-Gamiz, U.; Zulueta, E.; Boyano, A.; Ansoategui, I.; Uriarte, I. Five Megawatt Wind Turbine Power Output Improvements by Passive Flow Control Devices. Energies2017, 10, 742. [CrossRef]
- De Gregorio, F.; Fraioli, G. Flow Control on a High Thickness Airfoil by a Trapped Vortex Cavity. In Proceedings of the 14th International symposium on applications of laser techniques to fluid mechanics; 2008.
- Błoński, D.; Strzelecka, K.; Kudela, H. Vortex Trapping Cavity on Airfoil: High-Order Penalized Vortex Method Numerical Simulation and Water Tunnel Experimental Investigation. Energies2021, 14, 8402. [CrossRef]
- Acosta-López, J.G.; Blasetti, A.P.; Lopez-Zamora, S.; De Lasa, H. CFD Modeling of an H-Type Darrieus VAWT under High Winds: The Vorticity Index and the Imminent Vortex Separation Condition. Processes2023, 11, 644. [CrossRef]
- SMAGORINSKY, J. GENERAL CIRCULATION EXPERIMENTS WITH THE PRIMITIVE EQUATIONS: I. THE BASIC EXPERIMENT. Monthly Weather Review1963, 91, 99–164. [CrossRef]
- Manwell, J.F.; McGowan, J.G.; Rogers, A.L. Wind Energy Explained: Theory, Design and Application; 2nd ed.; Wiley: Chichester, U.K, 2009; ISBN 978-0-470-01500-1.
- Abdelsamie, A.; Voß, S.; Berg, P.; Chi, C.; Arens, C.; Thévenin, D.; Janiga, G. Comparing LES and URANS Results with a Reference DNS of the Transitional Airflow in a Patient-Specific Larynx Geometry during Exhalation. Computers & Fluids2023, 255, 105819. [CrossRef]
- Rogowski, K.; Królak, G.; Bangga, G. Numerical Study on the Aerodynamic Characteristics of the NACA 0018 Airfoil at Low Reynolds Number for Darrieus Wind Turbines Using the Transition SST Model. Processes2021, 9, 477. [CrossRef]
- Ranjbar, M.H.; Nasrazadani, S.A.; ZanganehKia, H.; Gharali, K. Reaching the Betz Limit Experimentally and Numerically. Energy Equip. Syst.2019, 7. [CrossRef]
- Betz, A. The Maximum of the Theoretically Possible Exploitation of Wind by Means of a Wind Motor. Wind Engineering2013, 37, 441–446. [CrossRef]
- Simão Ferreira, C., Van Kuik, G., Van Bussel, G., & Scarano, F. (2009). Visualization by PIV of dynamic stall on a vertical axis wind turbine. Experiments in fluids, 46, 97-108. [CrossRef]
- Arpino, F., Cortellessa, G., Scungio, M., Fresilli, G., Facci, A., & Frattolillo, A. (2021). PIV measurements over a double bladed Darrieus-type vertical axis wind turbine: A validation benchmark. Flow Measurement and Instrumentation, 82, 102064. [CrossRef]
|
Disclaimer/Publisher’s Note: The statements, opinions and data contained in all publications are solely those of the individual author(s) and contributor(s) and not of MDPI and/or the editor(s). MDPI and/or the editor(s) disclaim responsibility for any injury to people or property resulting from any ideas, methods, instructions or products referred to in the content. |
© 2023 by the authors. Licensee MDPI, Basel, Switzerland. This article is an open access article distributed under the terms and conditions of the Creative Commons Attribution (CC BY) license (http://creativecommons.org/licenses/by/4.0/).
