1. Introduction
The present era, which is characterized by IoT and by Industry 4.0 requires a lot of sensors to monitor the industrial, urban and natural environments. The use of wirings to feed the sensors is sometimes unfeasible, e.g. this is the case of remote sensors installed in buoys in deep sea or in tall buildings and antennas. Nowadays remote sensors nodes are fed by means of batteries, which are not eco-friendly and require complex and expensive replacement operations. Fortunately, the energy consumption of sensor nodes is constantly decreasing, and new technical solutions are possible. Vibration energy harvesting is a great opportunity, since remote sensors can be fed by using existing sources of energy. Vibration energy harvesting can be performed exploiting different physical phenomena to convert mechanical energy into electrical energy. There are piezoelectric [
1], electromagnetic [
2], electrostatic [
3] and triboelectric [
4] harvesters. Piezoelectric harvesters usually take the form of thin layers that either are bonded to a vibrating surface, or are bonded to a cantilever beam to make a cantilever harvester. Piezoelectric harvesters generate high voltage, can be integrated with the vibrating structure and have small mass and encumbrance. For these reasons they are adopted to feed sensors and other small electronic equipment in vehicles, industrial machinery, civil structures and biomedical devices.
The vibrating plate is one of the most common vibrating structures and it is a typical part of machines, domestic appliances, vehicles and aircrafts [
5,
6]. Vibrating plates can be found in buildings (panels of facades) and in other civil structures as well [
7,
8]. Hence, vibration energy harvesting from plates is a very present research topic. Plates are sometimes excited by concentrated loads, but there are many cases in which this structure is excited by the distributed loads caused by wind, traffic or by water flows. The simplest piezoelectric harvester for a vibrating plate is a piezoelectric layer directly bonded to the plate surface. It works in the bending mode (the 3-1 mode [
9]) and exploits the strain caused by plate bending. The strain of the plate reaches the maximum value at the natural frequencies of the modes of vibrations that are excited by concentrated or distributed loads. A possible alternative, in order to better exploit the resonance phenomenon, is a cantilever harvester with tip mass tuned to the natural frequency of the most exited mode of vibration of the plate. This cantilever harvester behaves as a dynamic vibration absorber (DVA) that is able to receive a large amount of energy from the plate. On the one hand plate vibrations are strongly reduced [
10], on the other hand the cantilever harvester experiences large amplitude vibrations.
DVA with piezoelectric layers have been studied in recent years both with the aim of suppressing the vibrations of the host structure and with the aim of scavenging energy. Ali and Adhikari in 2013 [
11] proposed an energy harvesting DVA and analytically studied the coupling of this device with a 1 degree of freedom (DOF) vibrating system. A lumped parameter 1 DOF model of the piezoelectric harvester was adopted. An analytical expression of the natural frequencies of the coupled system was given, the presence of two resonance peaks was demostrated and the influence of the piezoelectric layer on the damping of the DVA was highlighted. Abdelmoula ed alii in 2017 [
12] studied the coupling of a cantilever harvester with a 1 DOF vibrating system. The cantilever harvester was modeled according to the modal expansion approach like in [
13]. A strategy was proposed to minimize the vibrations of the host structure and to maximize the harvested power. Experimental results dealing with the effect of a cantilever piezoelectric dynamic absorber mounted on a vibrating rigid beam were presented by Sulaiman et alii in 2021 [
14]. Rezaei et alii in 2022 [
15] extended the previous analyses considering the coupling between a flexible beam and a cantilever harvester. Both the cantilever harvester and the flexible beam were modeled adopting the modal expansion approach. The number of modes of vibration of the host structure and of the cantilever harvester needed to accurately model the system’s dynamics was investigated. Results showed that considering only the first mode of the host structure and of the cantilever harvester is enough to capture the main features of the system. In 2012 Rajarathinam and Ali [
16] improved the analysis of a 2 DOF system composed of a host vibrating structure and an energy harvesting DVA considering both random excitation and system uncertainties. Results showed that uncertainties in the natural frequency lead to a decrease in the harvested power. Recently, Rezaei et alii [
17] presented experimental results dealing with a flexible beam equipped with a cantilever harvester and excited by a shaker. They developed a detailed integrated mode taking into account shaker dynamics. A good agreement between experimental and analytical results was obtained.
The effect of a piezoelectric DVA on a vibrating plate was not addressed in the above mentioned researches. Hence the first aim of this paper is to study vibration energy harvesting from a vibrating plate by means of cantilever piezoelectric dynamic vibration absorber (CPDVA). The second aim of this paper is to study the performance of a CPDVA installed on a plate exited by distributed loads that are very common in actual structures. The third aim of this paper is to make a comparison between the performances of a simple piezoelectric layer and a CPDVA mounted on the same plate.
The paper is organized as follows. In section 2 the mathematical model of a vibrating plate with a CPDVA is developed, plate dynamics are modeled with the modal expansion approach, whereas the harvester is modeled with a lumped parameter approach that takes into account the first mode of vibration. In section 3 some calculated results are presented showing the effect of harvester tuning and positioning on the generated voltage. The experimental setup is described in section 4. A prototype CPDVA was built using a commercial cantilever harvester M2814P2C-01 made by Smart Material GmbH. This device was installed in a clamped-clamped-free-free plate excited by concentrated and distributed loads.
Section 5 deals with experimental results and focuses on the comparison between the voltage generated by the CPDVA and the one generate by a simple piezoelectric layer directly bonded to the plate. Finally, conclusions are drawn in section 6.
3. Calculated results
The first mode of vibration of a plate has the largest probability of being stimulated by the environmental sources of excitation (wind, traffic, rain) for two reasons, the former related to frequency, the latter related to the modal shape.
Typically, environmental sources are characterized by power spectral densities (PSDs) showing the maximum amplitudes in the low frequency range. Turbulence of grazing flows used to collect energy form artificial piezoelectric grass [
20] shows relevant PSD amplitudes below
. Wind turbulence PSDs used for the design of civil structures show the maximum amplitude below
[
21,
22,
23]. The PSDs of traffic induced vibrations show their main peaks below
[
24].
The first mode of vibration of a plate clamped on two opposite sides has the simplest modal shape (
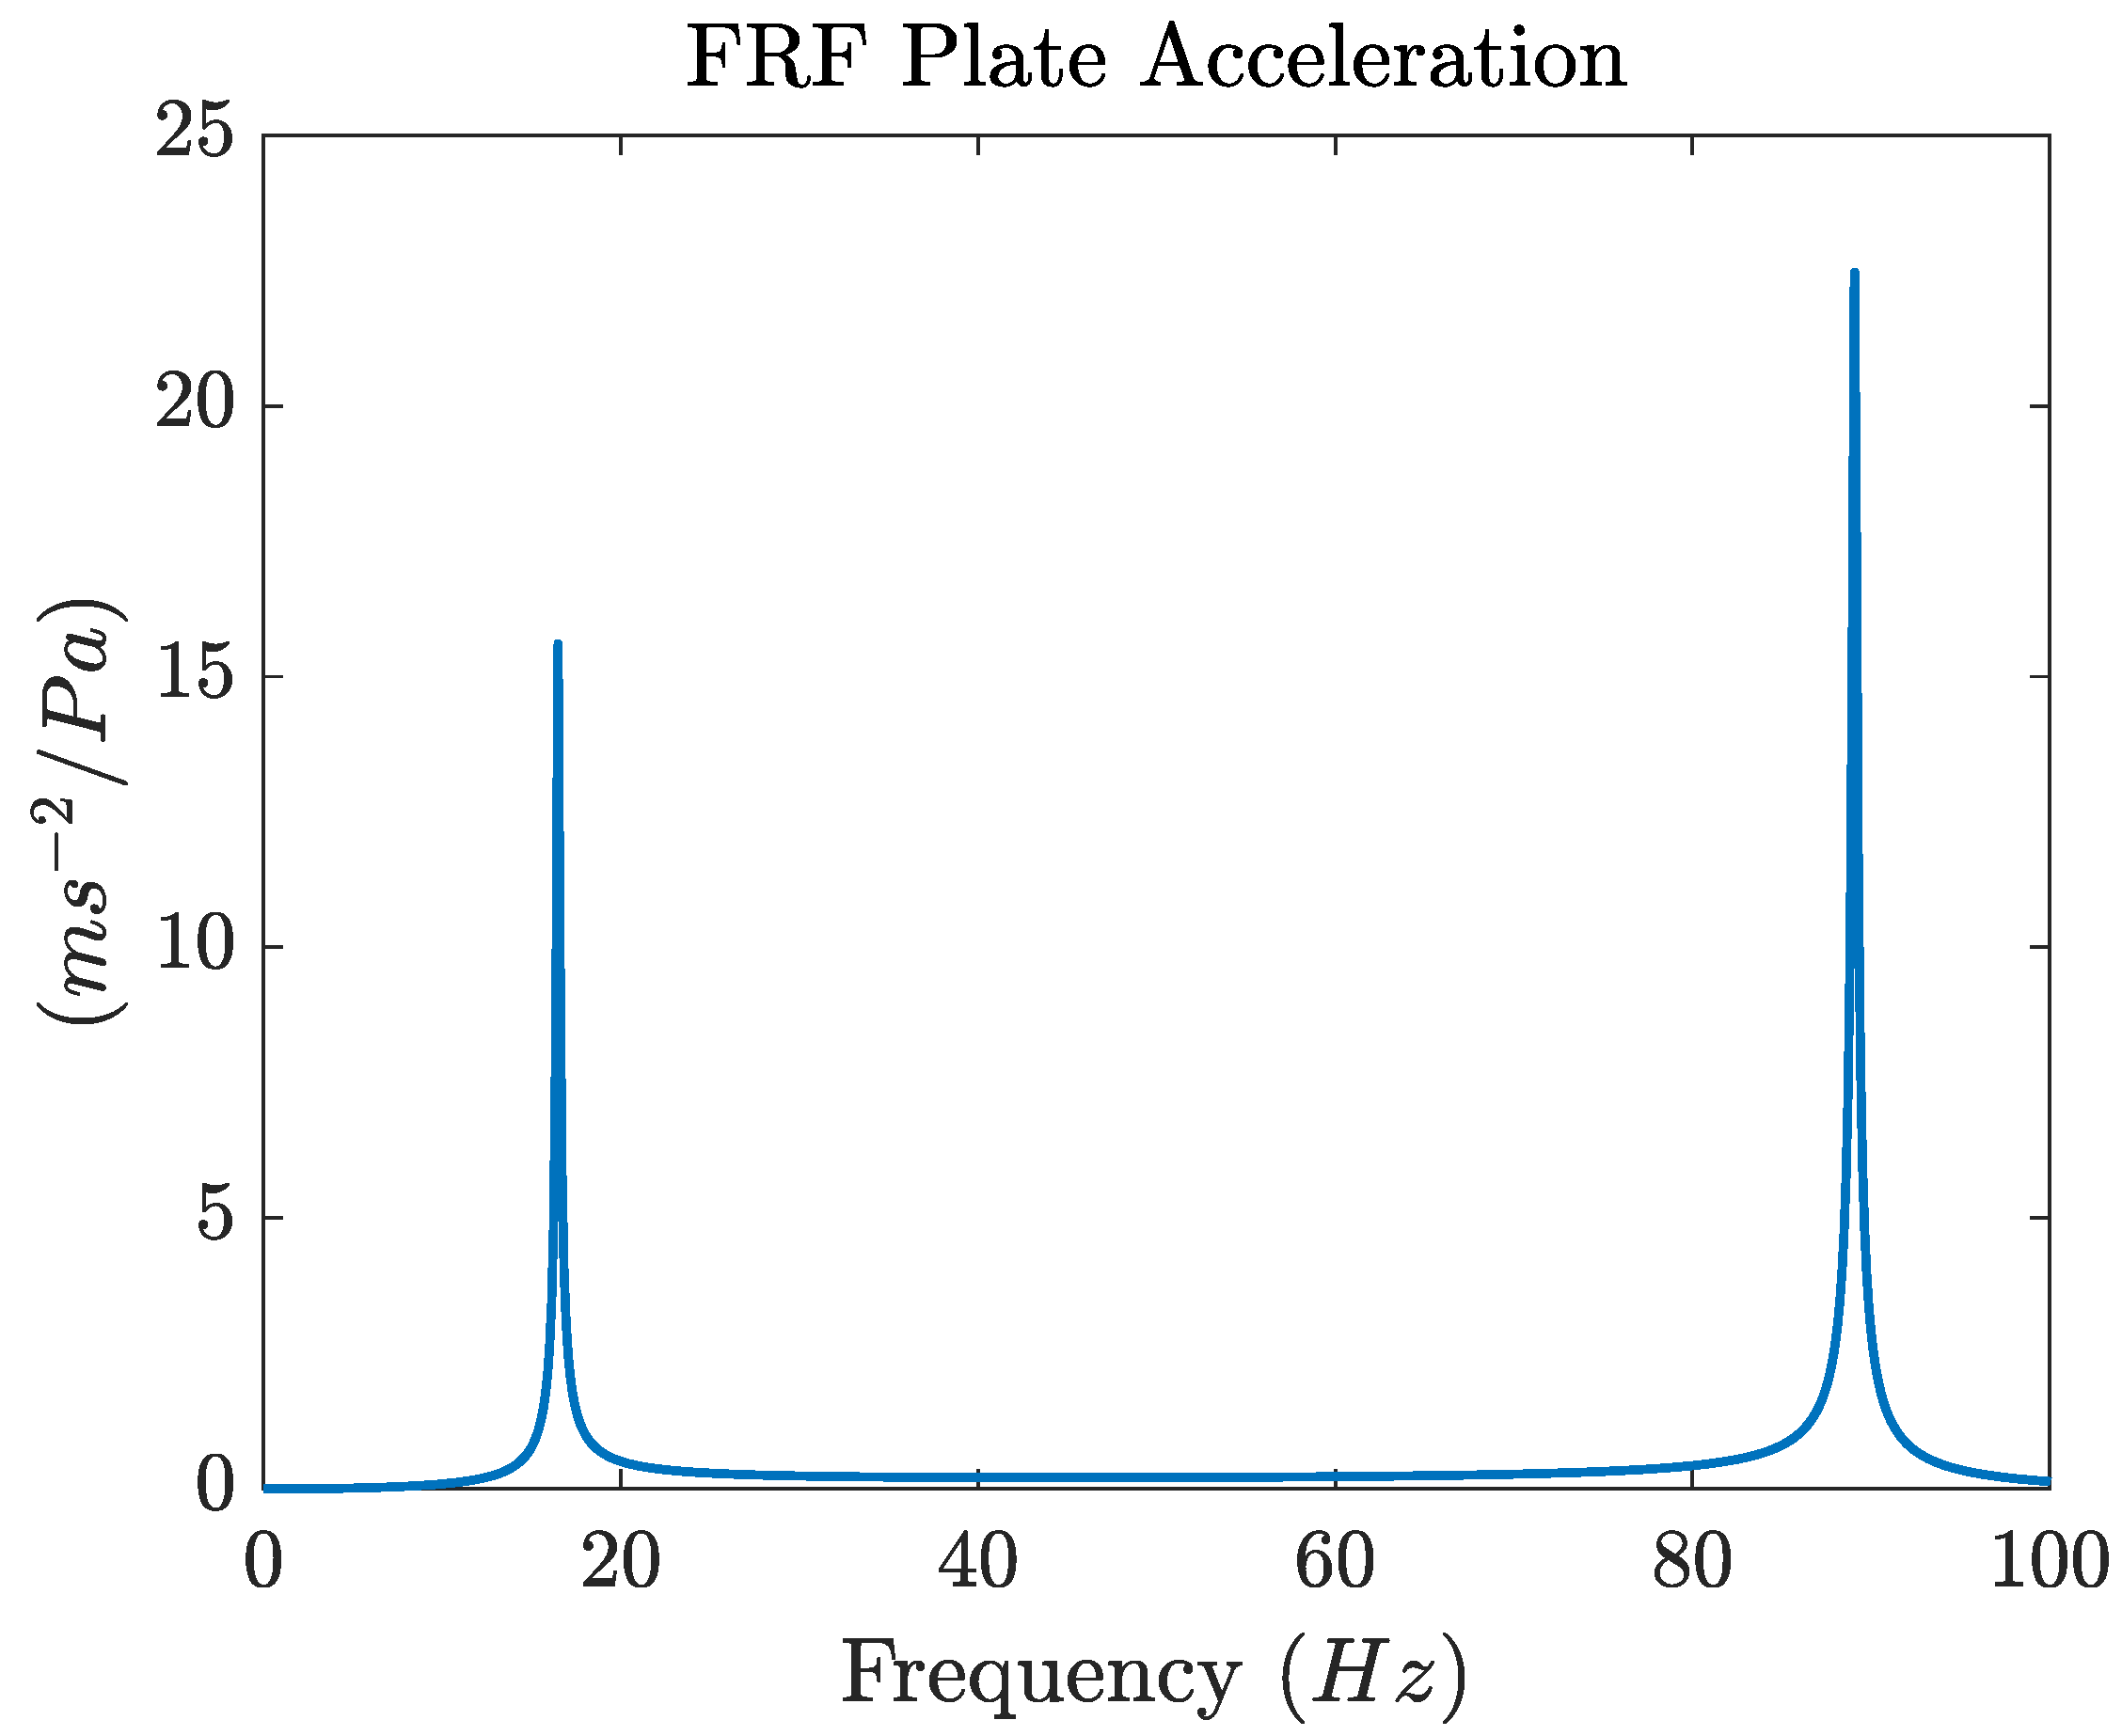
Figure 2). Higher order modes show an increasing number of nodal lines which define different zones of the plate that vibrate in phase opposition. A spatially uniform pressure fluctuation on the surface of the plate can excite the first mode of vibration but is not able to transfer much energy to higher order modes with different areas that vibrate in phase opposition. To highlight this concept the FRF between the acceleration of the point at the center of the plate and the distributed load
was calculated by means of the mathematical model of
Section 2. The FRF magnitude, which is plotted in
Figure 4, shows that only the 1st and the 6th mode of vibration are excited by the distributed load. The other modes are not excited at all, because there is a complete cancellation between the pressure loads applied in the areas of the plate the move in opposition. Owing to the dependence on frequency squared (Equation (
32)) the acceleration FRF shows the highest peak for the 6th mode. If the sizes of the plate have the order of magnitude of
, they are much smaller than the typical length scale of wind turbulence that excites buildings [
23], therefore pressure can be considered spatially uniform. For pressure fluctuations related to turbulence having smaller length scales the possible excitation of higher order modes has to be evaluated using more sophisticated methods like the acceptance integral [
25], nevertheless, also in this case the first mode is the most excited [
25]. In many practical conditions the panels can be excited by vibrations coming from the supports [
26], also in this case the lower order modes are the most excited.
For the above-mentioned reasons this research focuses on vibration energy harvesting from the first mode of vibration of the plate and the CPDVA is tuned to the natural frequency of this mode and is located at the center of the plate, which is an anti-node for the first mode of vibration. The mathematical model of the CPDVA is developed starting from the properties of a commercial cantilever harvester M2814P2C-01 built by Smart Material. This harvester has a piezoelectric layer made of Macro Fiber Composite [
27] and has a structural layer made of glass fiber composite (FR4). Its properties are summarized in
Table 2. The transfer function of the M2814P2C-01 was experimentally evaluated with the impulsive method [
28] and showed a resonance peak at
. Therefore, the addition of a large tip mass is needed to tune the harvester to the first natural frequency of the plate (
).
A small clamp is needed to fix the cantilever base to the plate. If the clamp is made of polymeric material, its mass is about
. Before tuning the harvester to the plate the effect of the mass of the clamp on the natural frequency of the first plate mode was evaluated by means of the mathematical model of
Section 2 setting
. The clamp mass has a very small effect on the natural frequency of the first mode that moves from
to
Harvester tuning is then carried out by means of Equation (
9) setting the term at the right hand side to zero (free vibrations analysis). The undamped natural frequency is given by:
In which
K and
M are given by equations (
14) and (
13) respectively. Since all the terms in the expressions of
K and
M are known except
, the undamped natural frequency (
) is set equal to the natural frequency of the first mode of the plate, and the tip mass that tunes the harvester is found: the calculated value is
.
The calculations reported in this section aim to show the validity of the CPDVA and the importance of tuning and location of the device. The focus is on voltage generation.
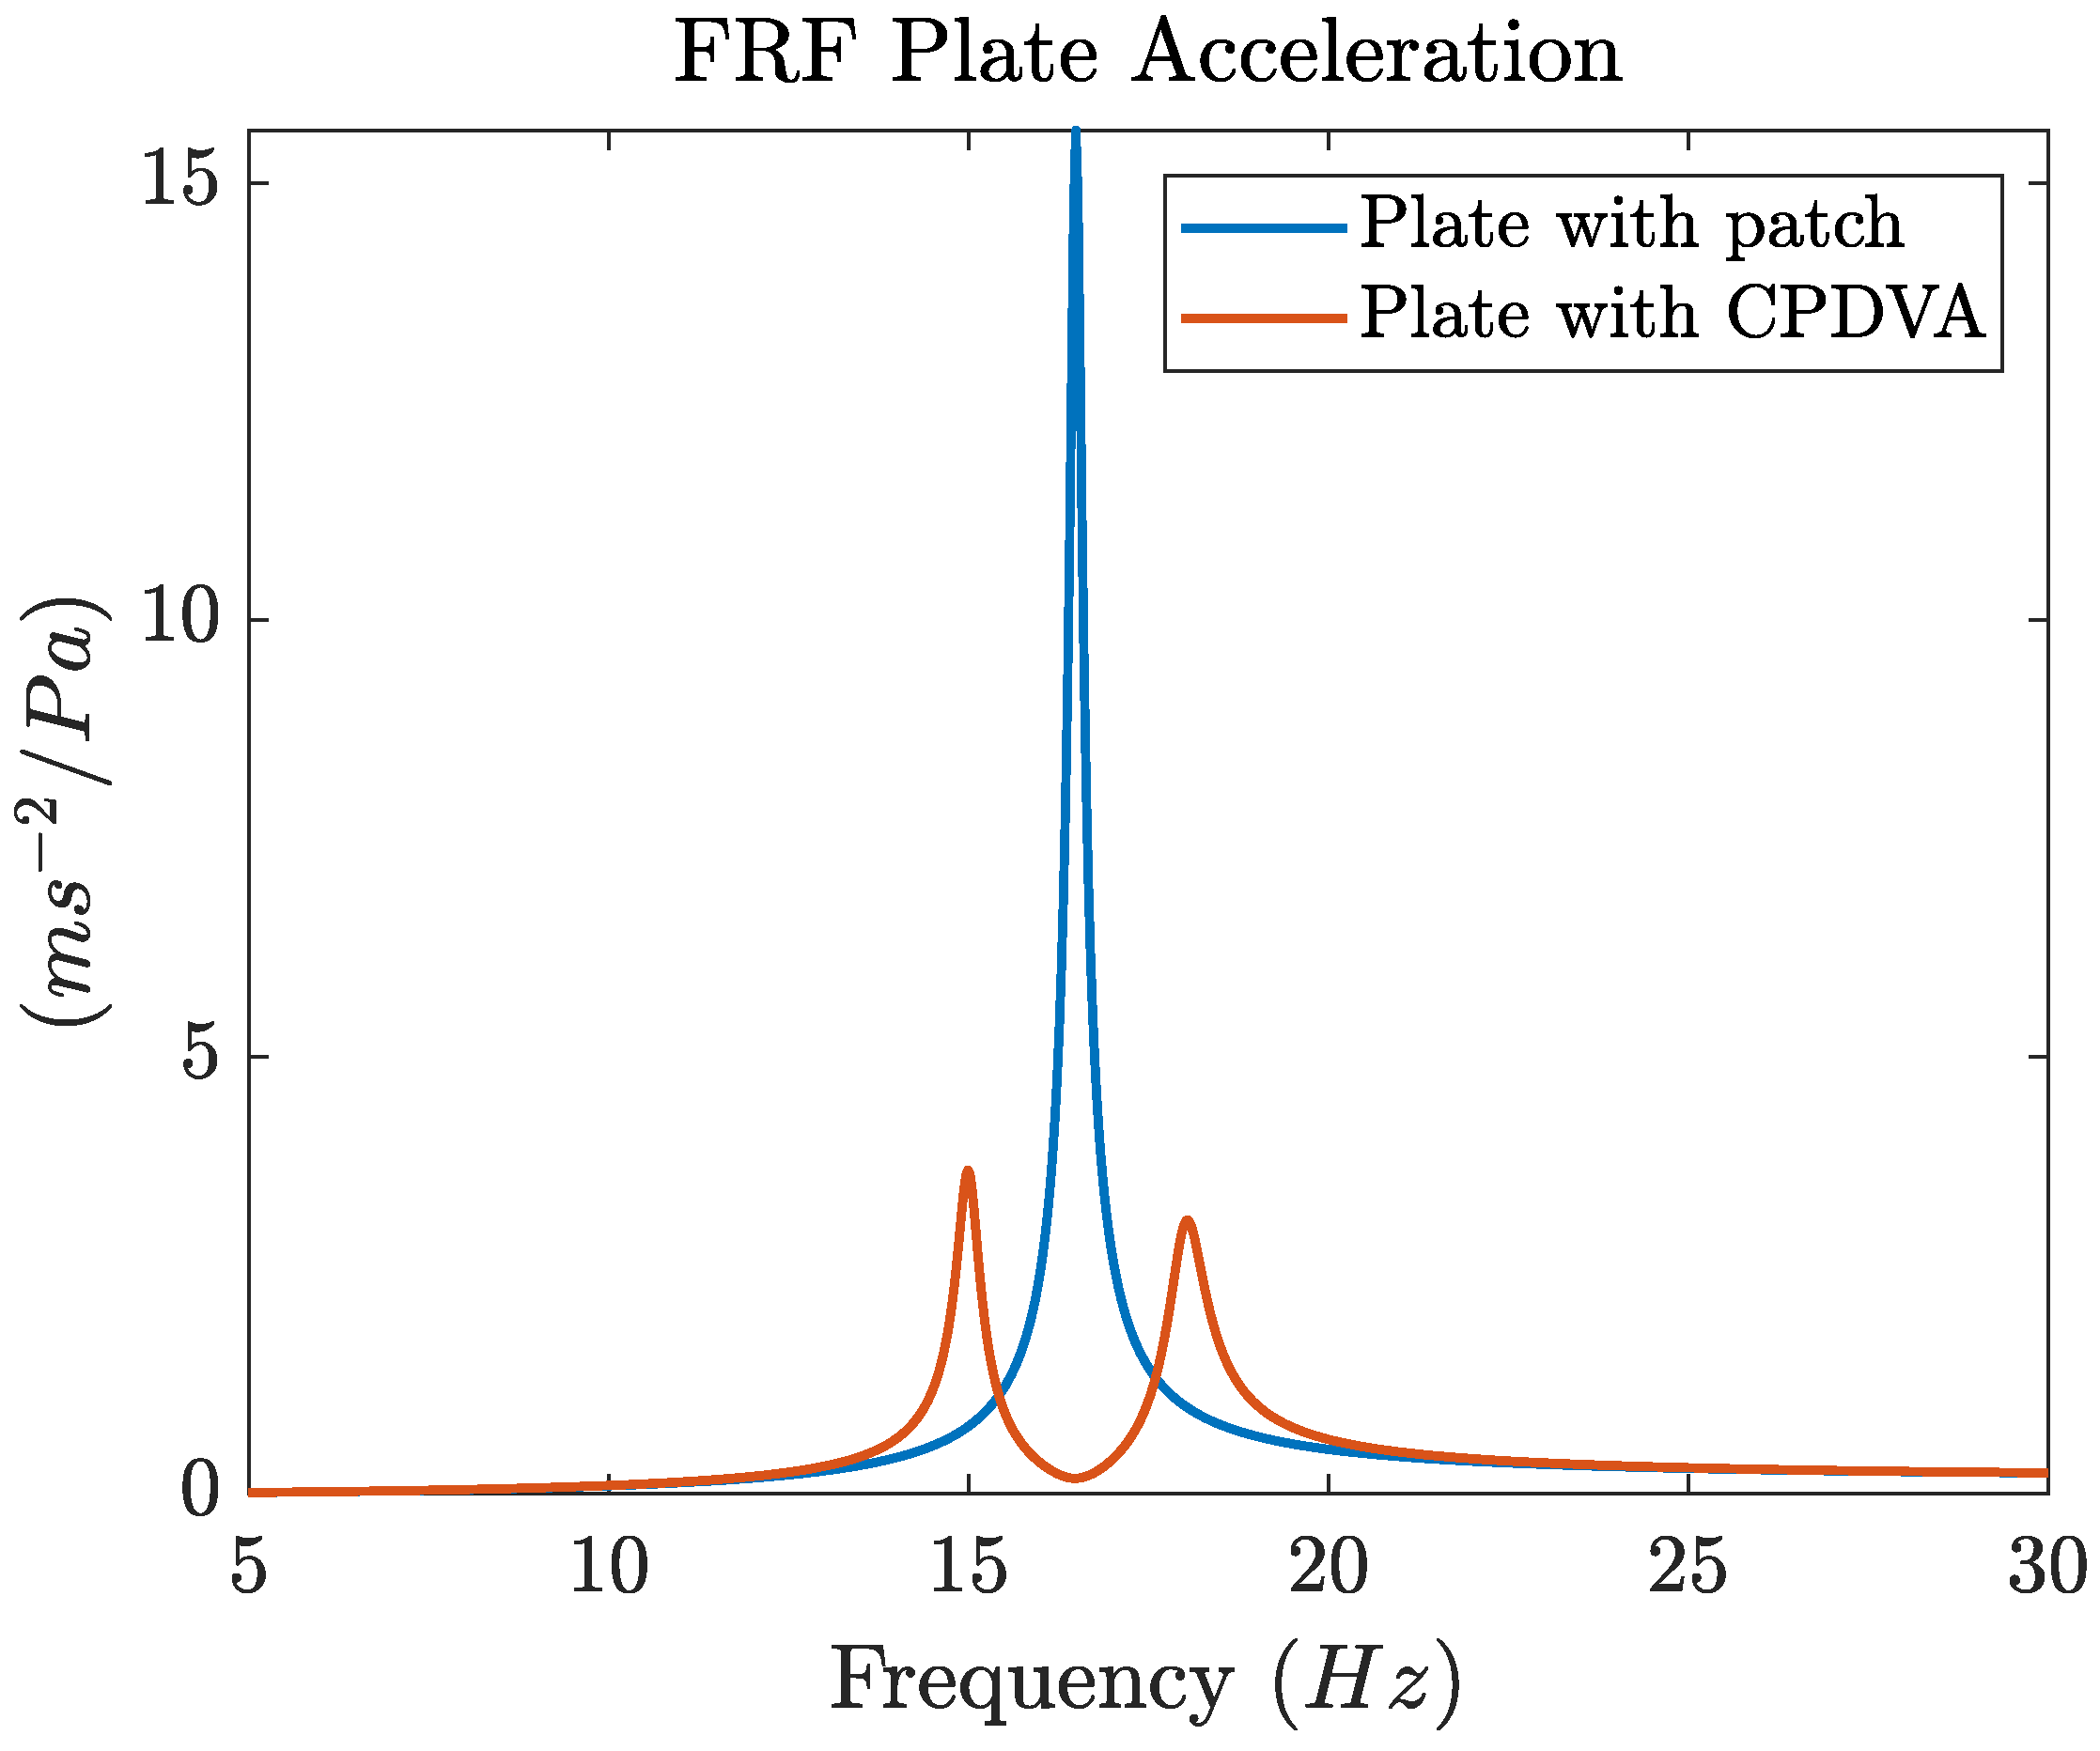
Figure 5 makes a comparison between the acceleration FRF at the center of the bare plate and the acceleration FRF of the same point when the CPDVA is tuned to the first mode of the plate and is mounted at the center of the plate. To calculate the FRFs a distributed load with constant amplitude and variable frequency (
) is assumed to excite the plate.
As in the other cases considered in the scientific literature (e.g. beams [
15]) the CPDVA eliminates the original resonance peak of the plate and generates a couple of new peaks: the first at lower frequency, the second at higher frequency. The amplitudes of the new acceleration peaks are significantly lower than the one of the original resonance peak of the bare plate.
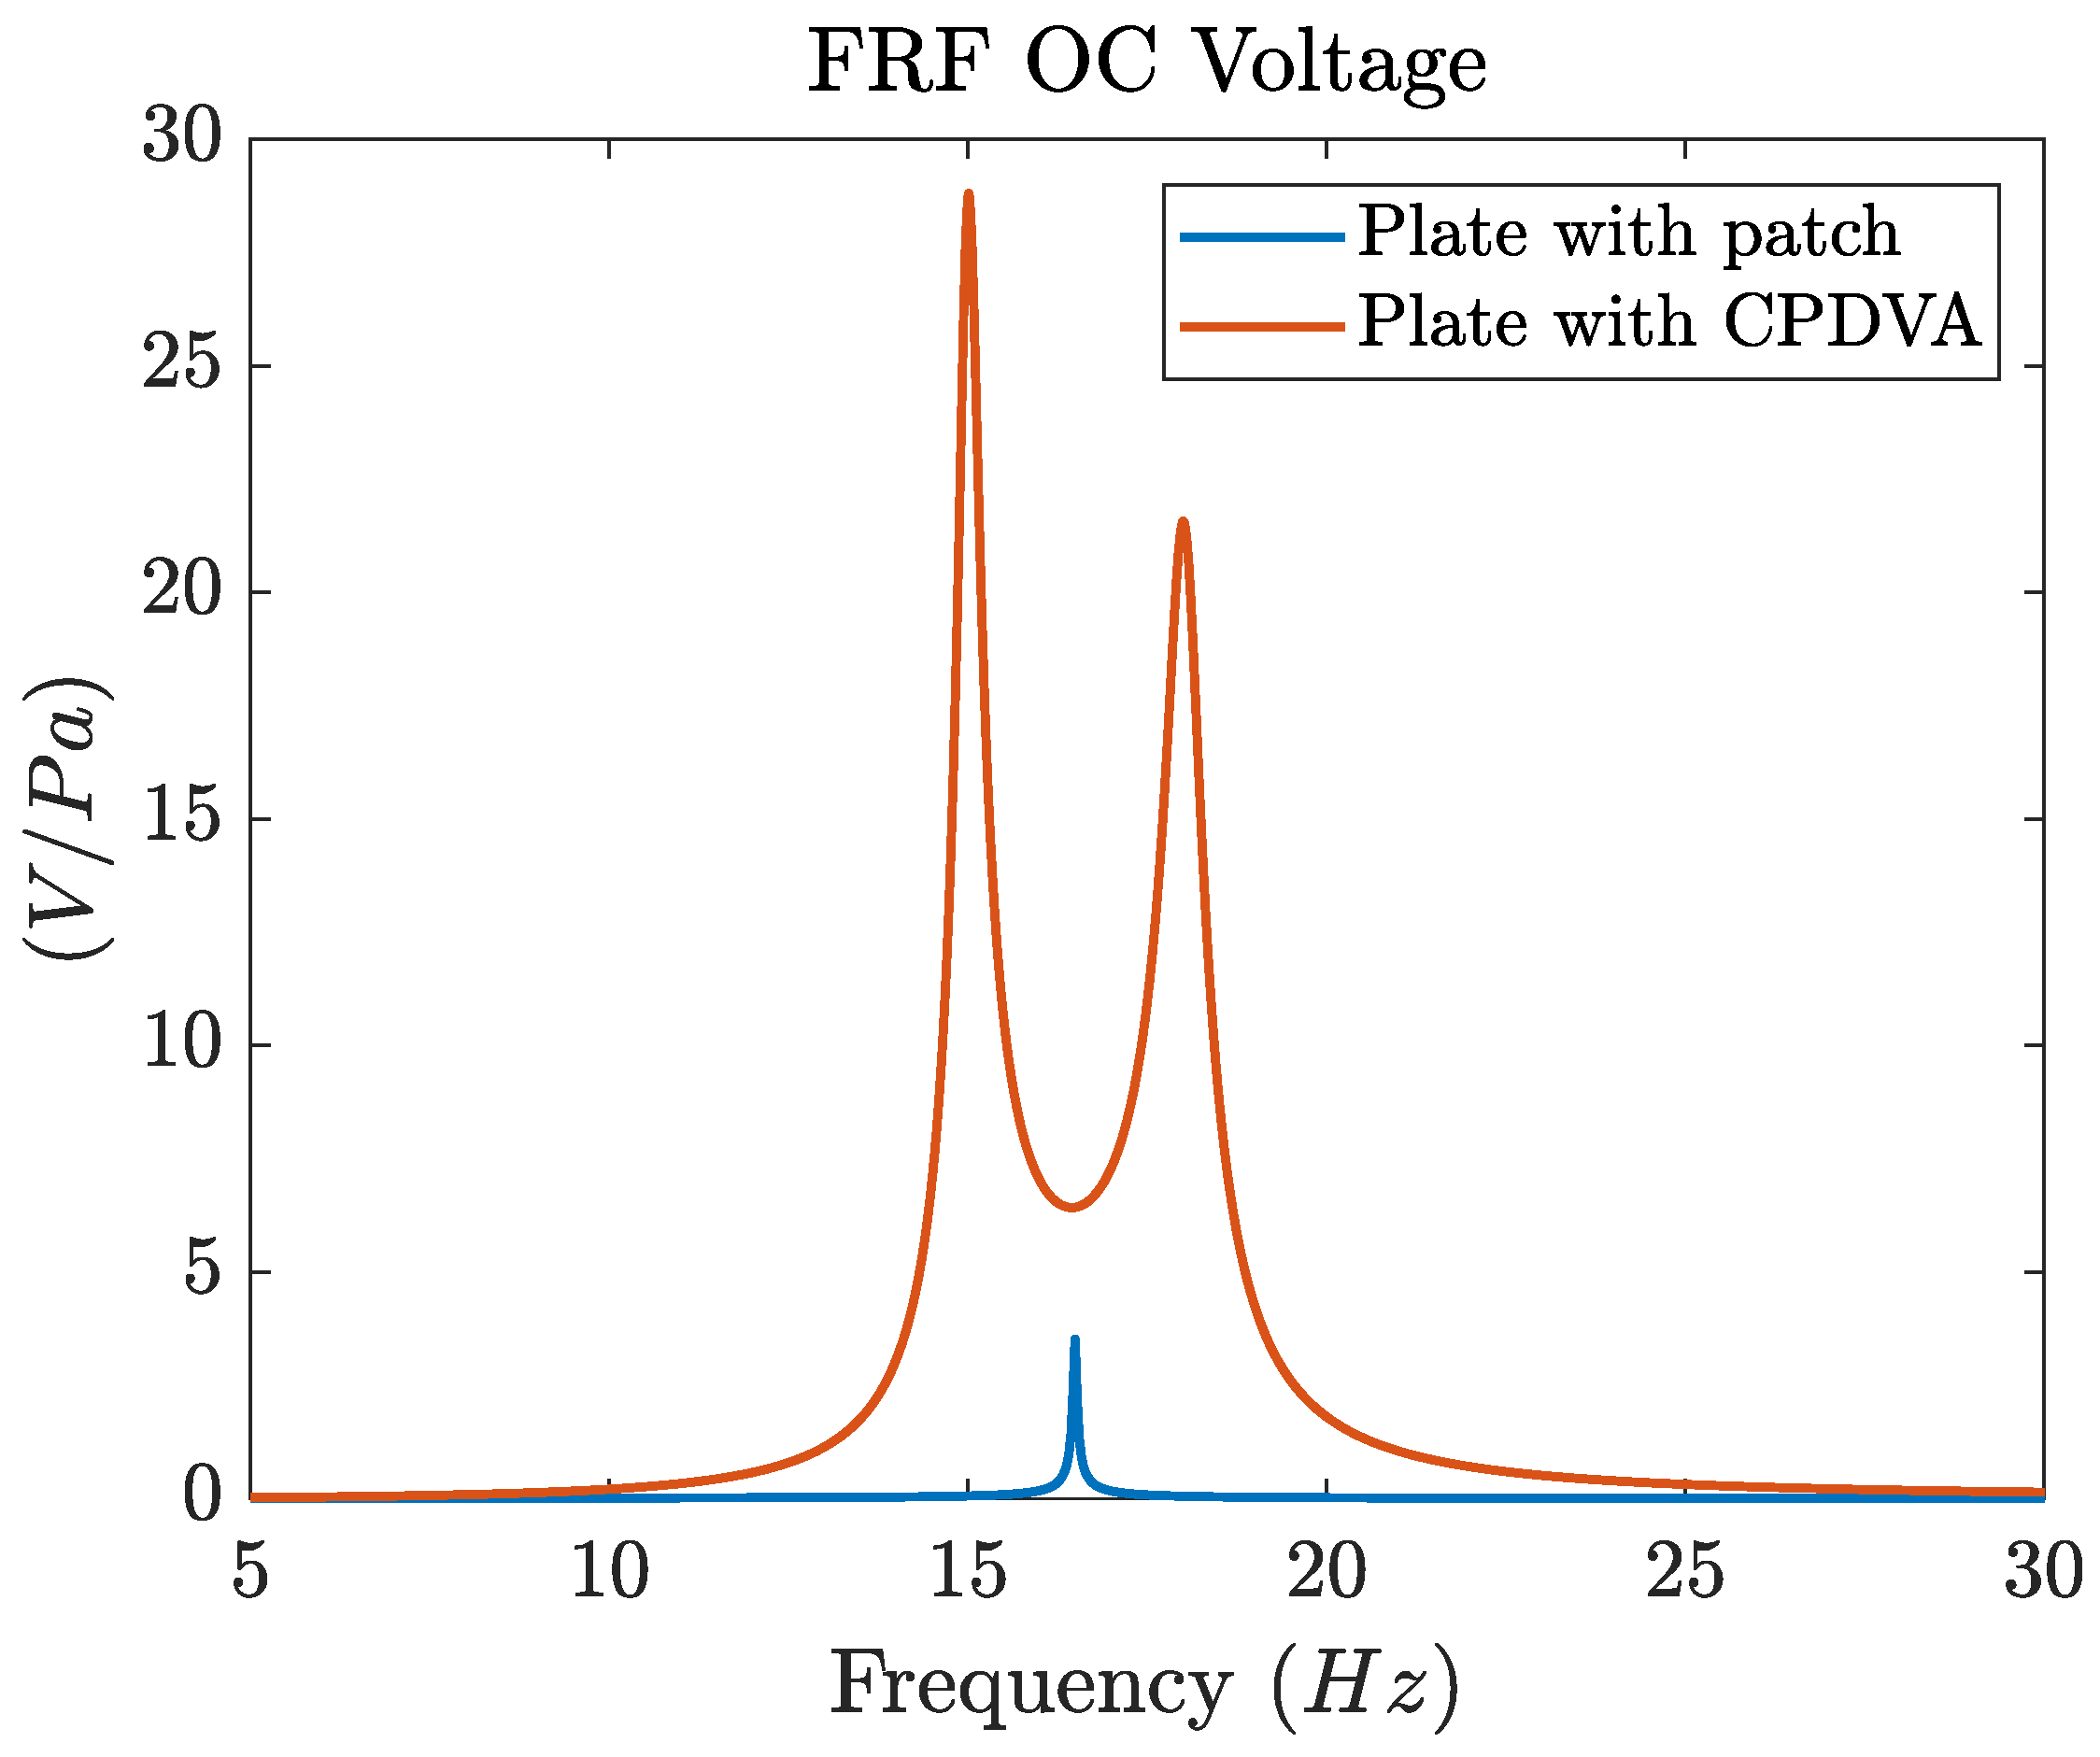
Figure 6 makes a comparison between the OC voltage FRF of the CPDVA tuned to the first mode of the plate and mounted at the center of the plate and the OC voltage FRF of a piezoelectric patch directly bonded under the center of the plate. The first mode of the plate corresponds to the bending of a beam in the x-z plane, hence, when the first mode is excited, the curvature at the center of the plate is large and the electro-mechanical coupling between the patch and the plate is large. Indeed, for the 1st mode, (
16) can be generalized for the patch bonded on the plate as:
where
is the distance between the center of the piezoelectric layer and the neutral axis of the plate, and
,
are the coordinates of the extremities of the patch. This piezoelectric patch has the same properties and sizes of the piezoelectric layer included in the M2814P2C-01 harvester.
Figure 6 highlights that the CPDVA generates much more voltage than the patch, because not only the two peaks of CPDVA are higher than the peak of the patch, but also the bandwidth around resonances are larger. The latter effect can be very useful in the presence of broad-band random excitation.
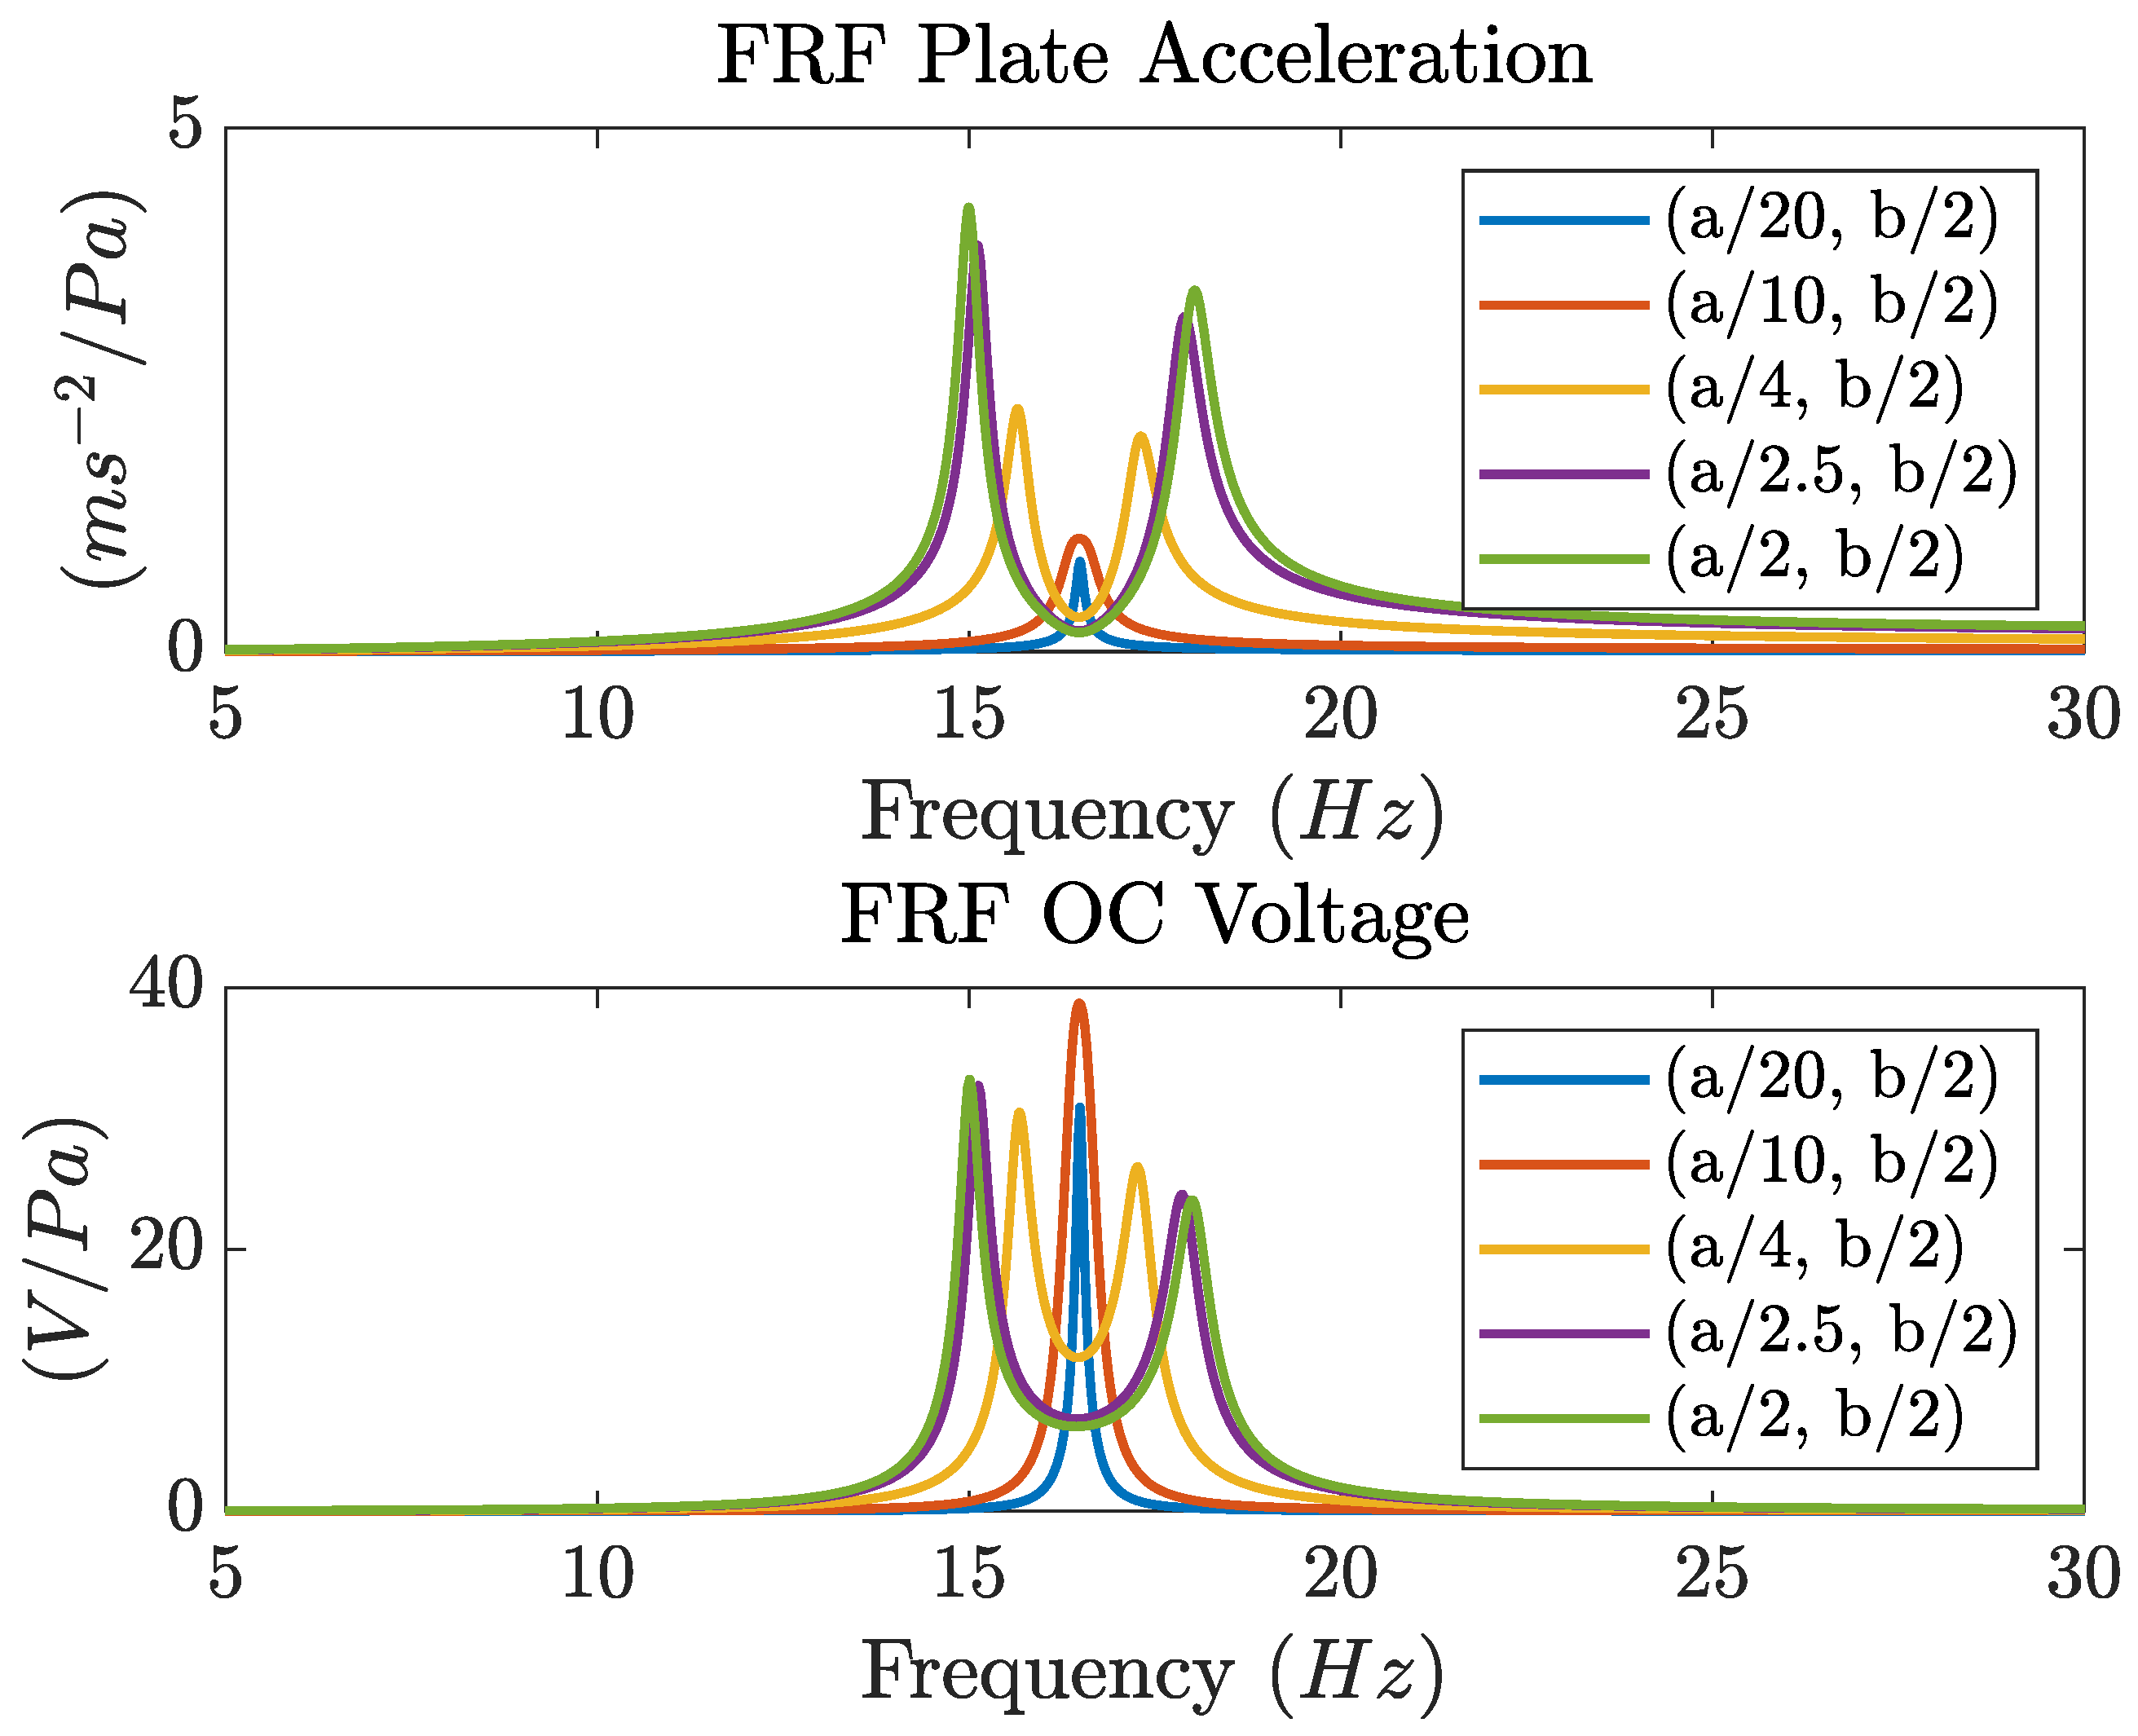
In the previous simulations the CPDVA was mounted at the center of the plate (
), where the first mode of vibration shows the largest amplitudes (see
Figure 2). In the simulations reported in
Figure 7 the CPDVA is moved from the best location along the longitudinal direction (
x). It is worth noting that, since the first mode of the plate is symmetric, leftwards and rightwards displacements have the same effect on the coupling between the CPDVA and this mode of the plate. An harmonic distributed load with constant amplitude and variable frequency (
) is assumed to excite the plate.
The FRF between acceleration of the point of the plate just above the the CPDVA and the distributed load shows that the coupling between the CPDVA and the plate decreases when the CPDVA is moved from the the center of the plate i.e. when . Indeed the peaks of the FRF become closer and their amplitudes decrease. Eventually, when the CPDVA is located near the nodal line the two peaks tend to merge into a unique peak.
The FRF between generated OC voltage and distributed load shows that the bandwidth including the two resonance peaks decreases when the CPDVA is moved from the central position. This is a negative effect when the plate is excited by broad-band random pressure fluctuations. The effect of CPDVA position on the peaks of the OC voltage FRF is more complex. If the lateral displacement is small (e.g. ) the amplitudes of the two peaks decrease. The maximum amplitude is reached when the two peaks merge into a unique peak (). Eventually, peak amplitude decreases when the CPDVA is close to the nodal line of the plate mode. This behavior can be exploited if the plate is excited by a harmonic load having a well defined frequency.
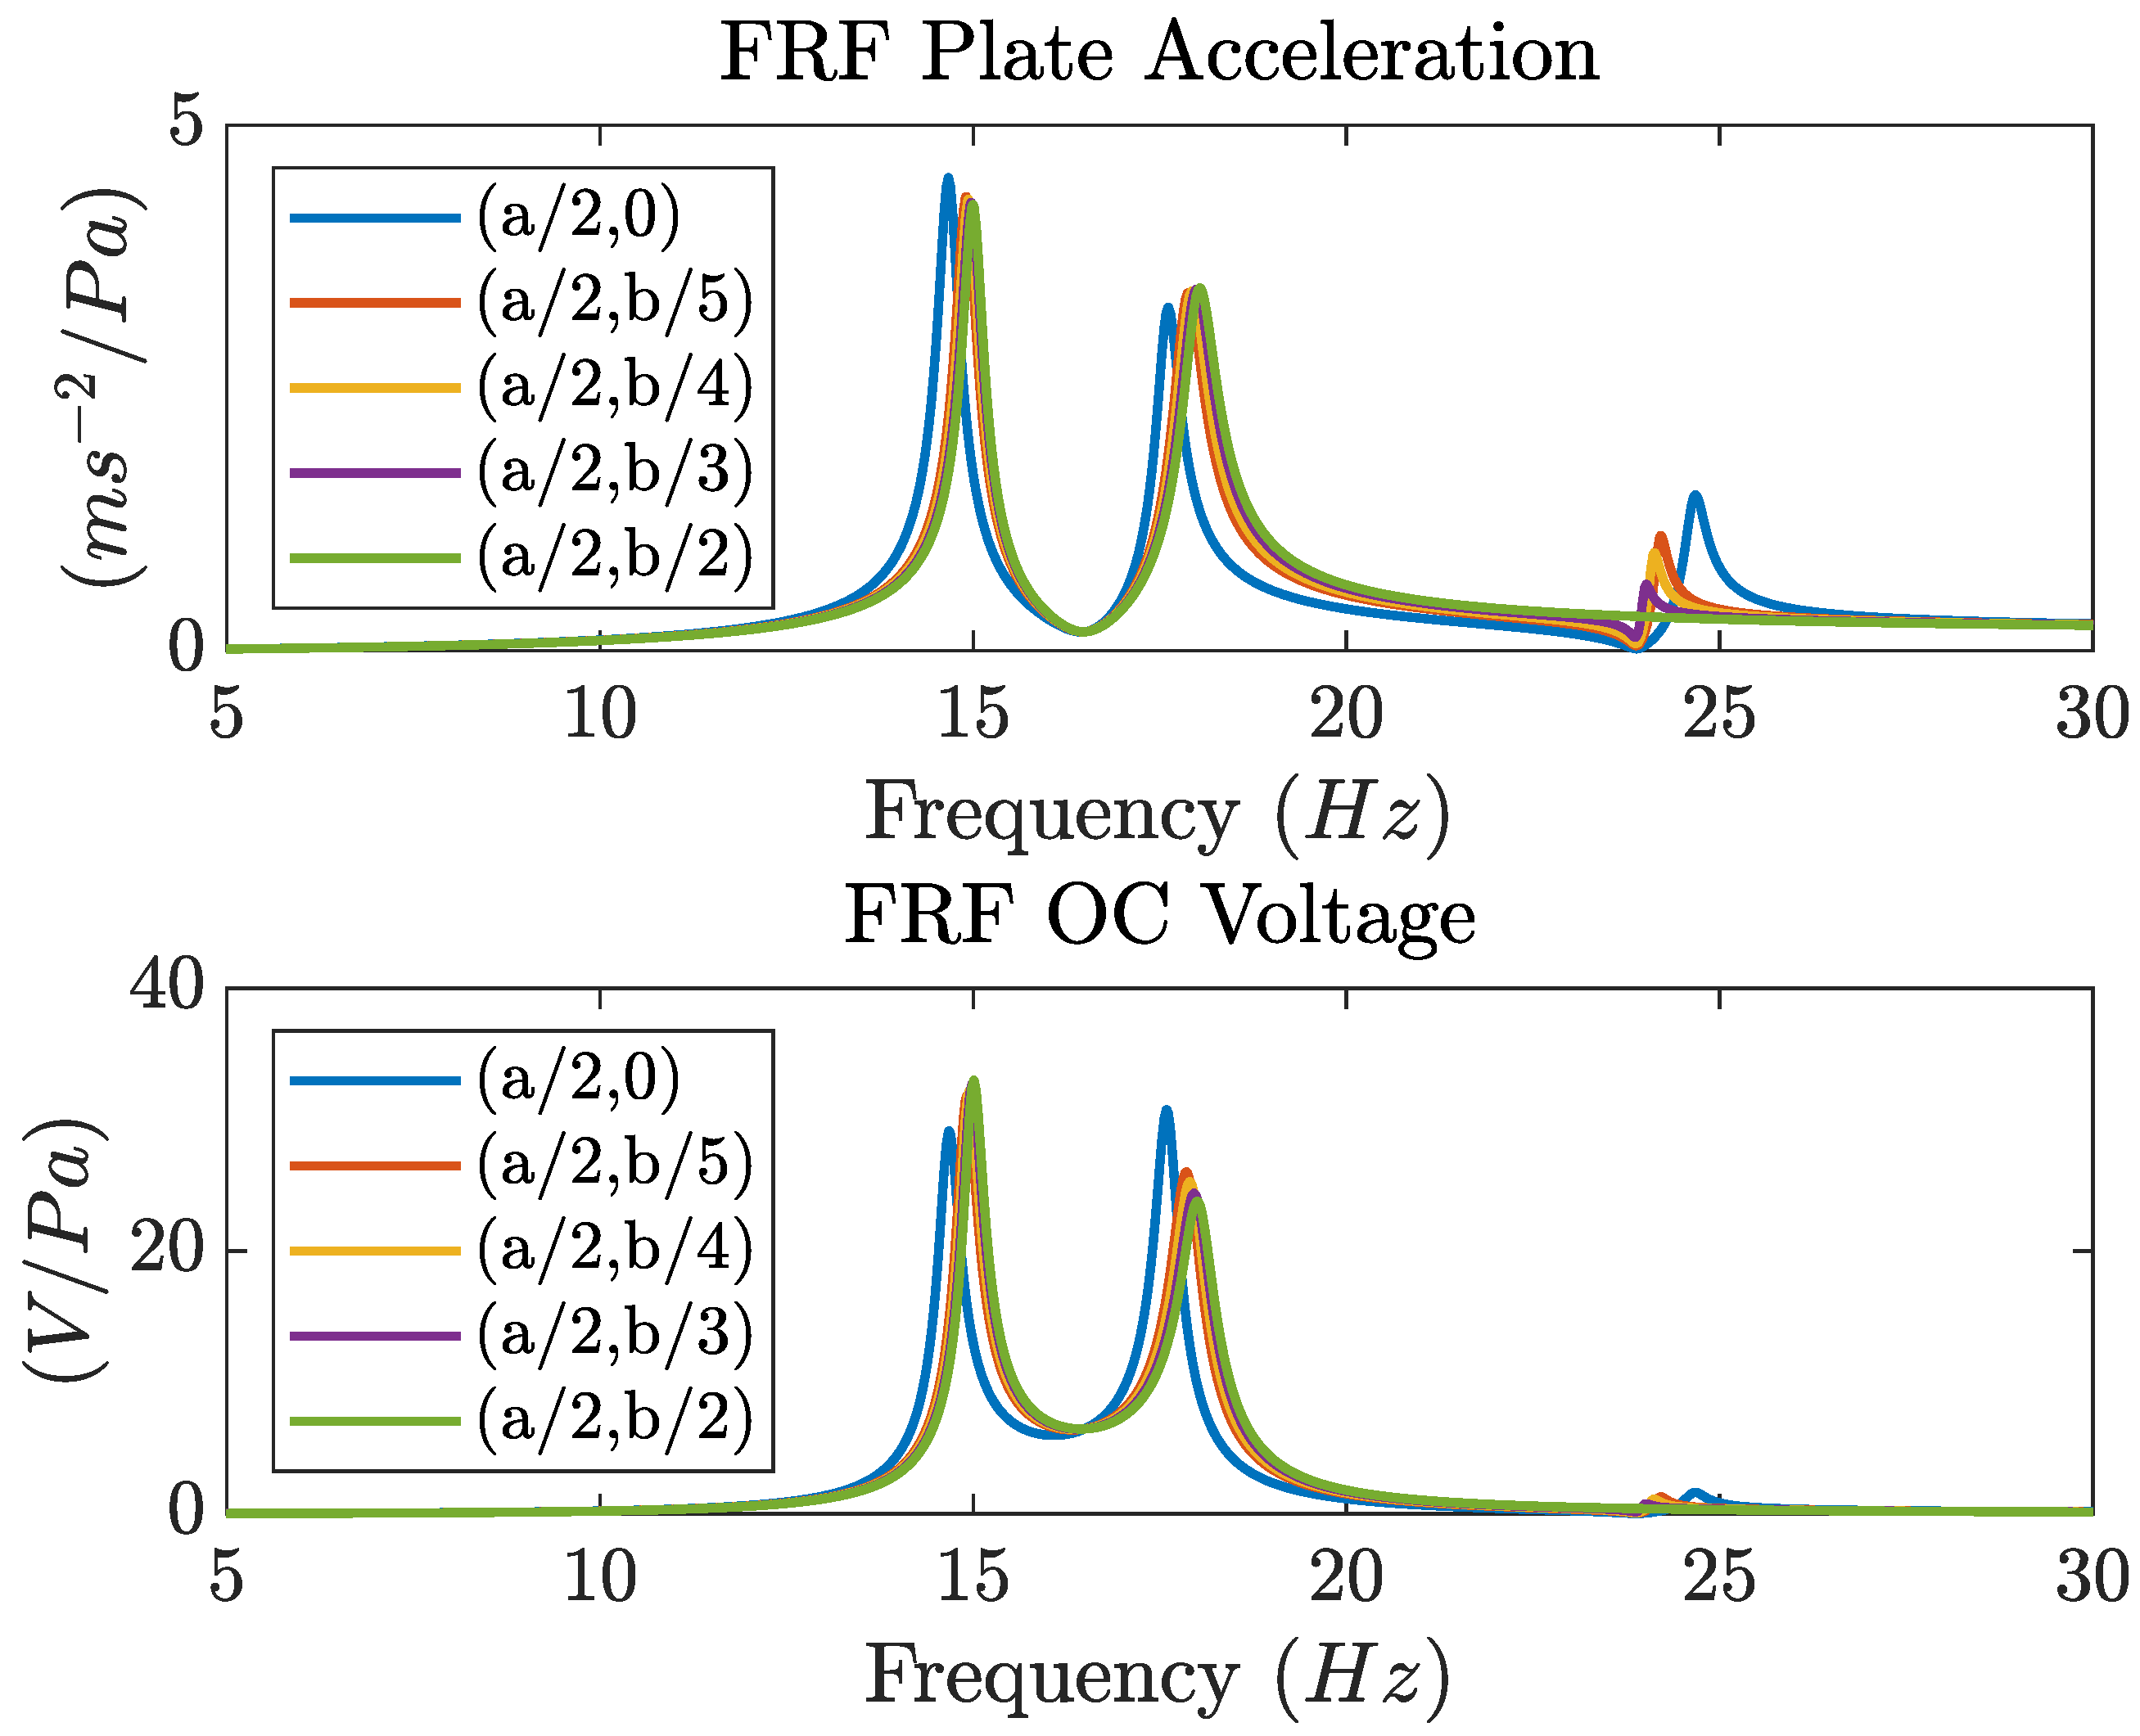
In
Figure 8 the CPDVA is moved from the center of the plate in the lateral direction (
y). This displacement does not affect the coupling with the first mode of vibration of the plate and with the other modes with
(see 1 and
Figure 2), but it alters the coupling with the modes with
, e.g. the second mode. Hence, this effect can be found only when the CPDVA is coupled with a plate. The FRF between the acceleration of the plate point above the CPDVA and the distributed load shows small modifications in the position and height of the two main resonance peaks, but, when the CPDVA is moved towards the anti-node of the second mode (
), a minor resonance peak at the frequency of the second peak appears. This phenomenon happens because when
decreases there is a coupling between the CPDVA and the second mode as well. Since this coupling alters the shape of the second mode, the uniform distributed load is able to cause a small excitation of the second mode. The excitation of the second mode slightly alters the effect of the CPDVA on the first mode and the OC voltage FRF shows small variations in the position and height of the main resonance peaks. For
the second peak becomes the higher.
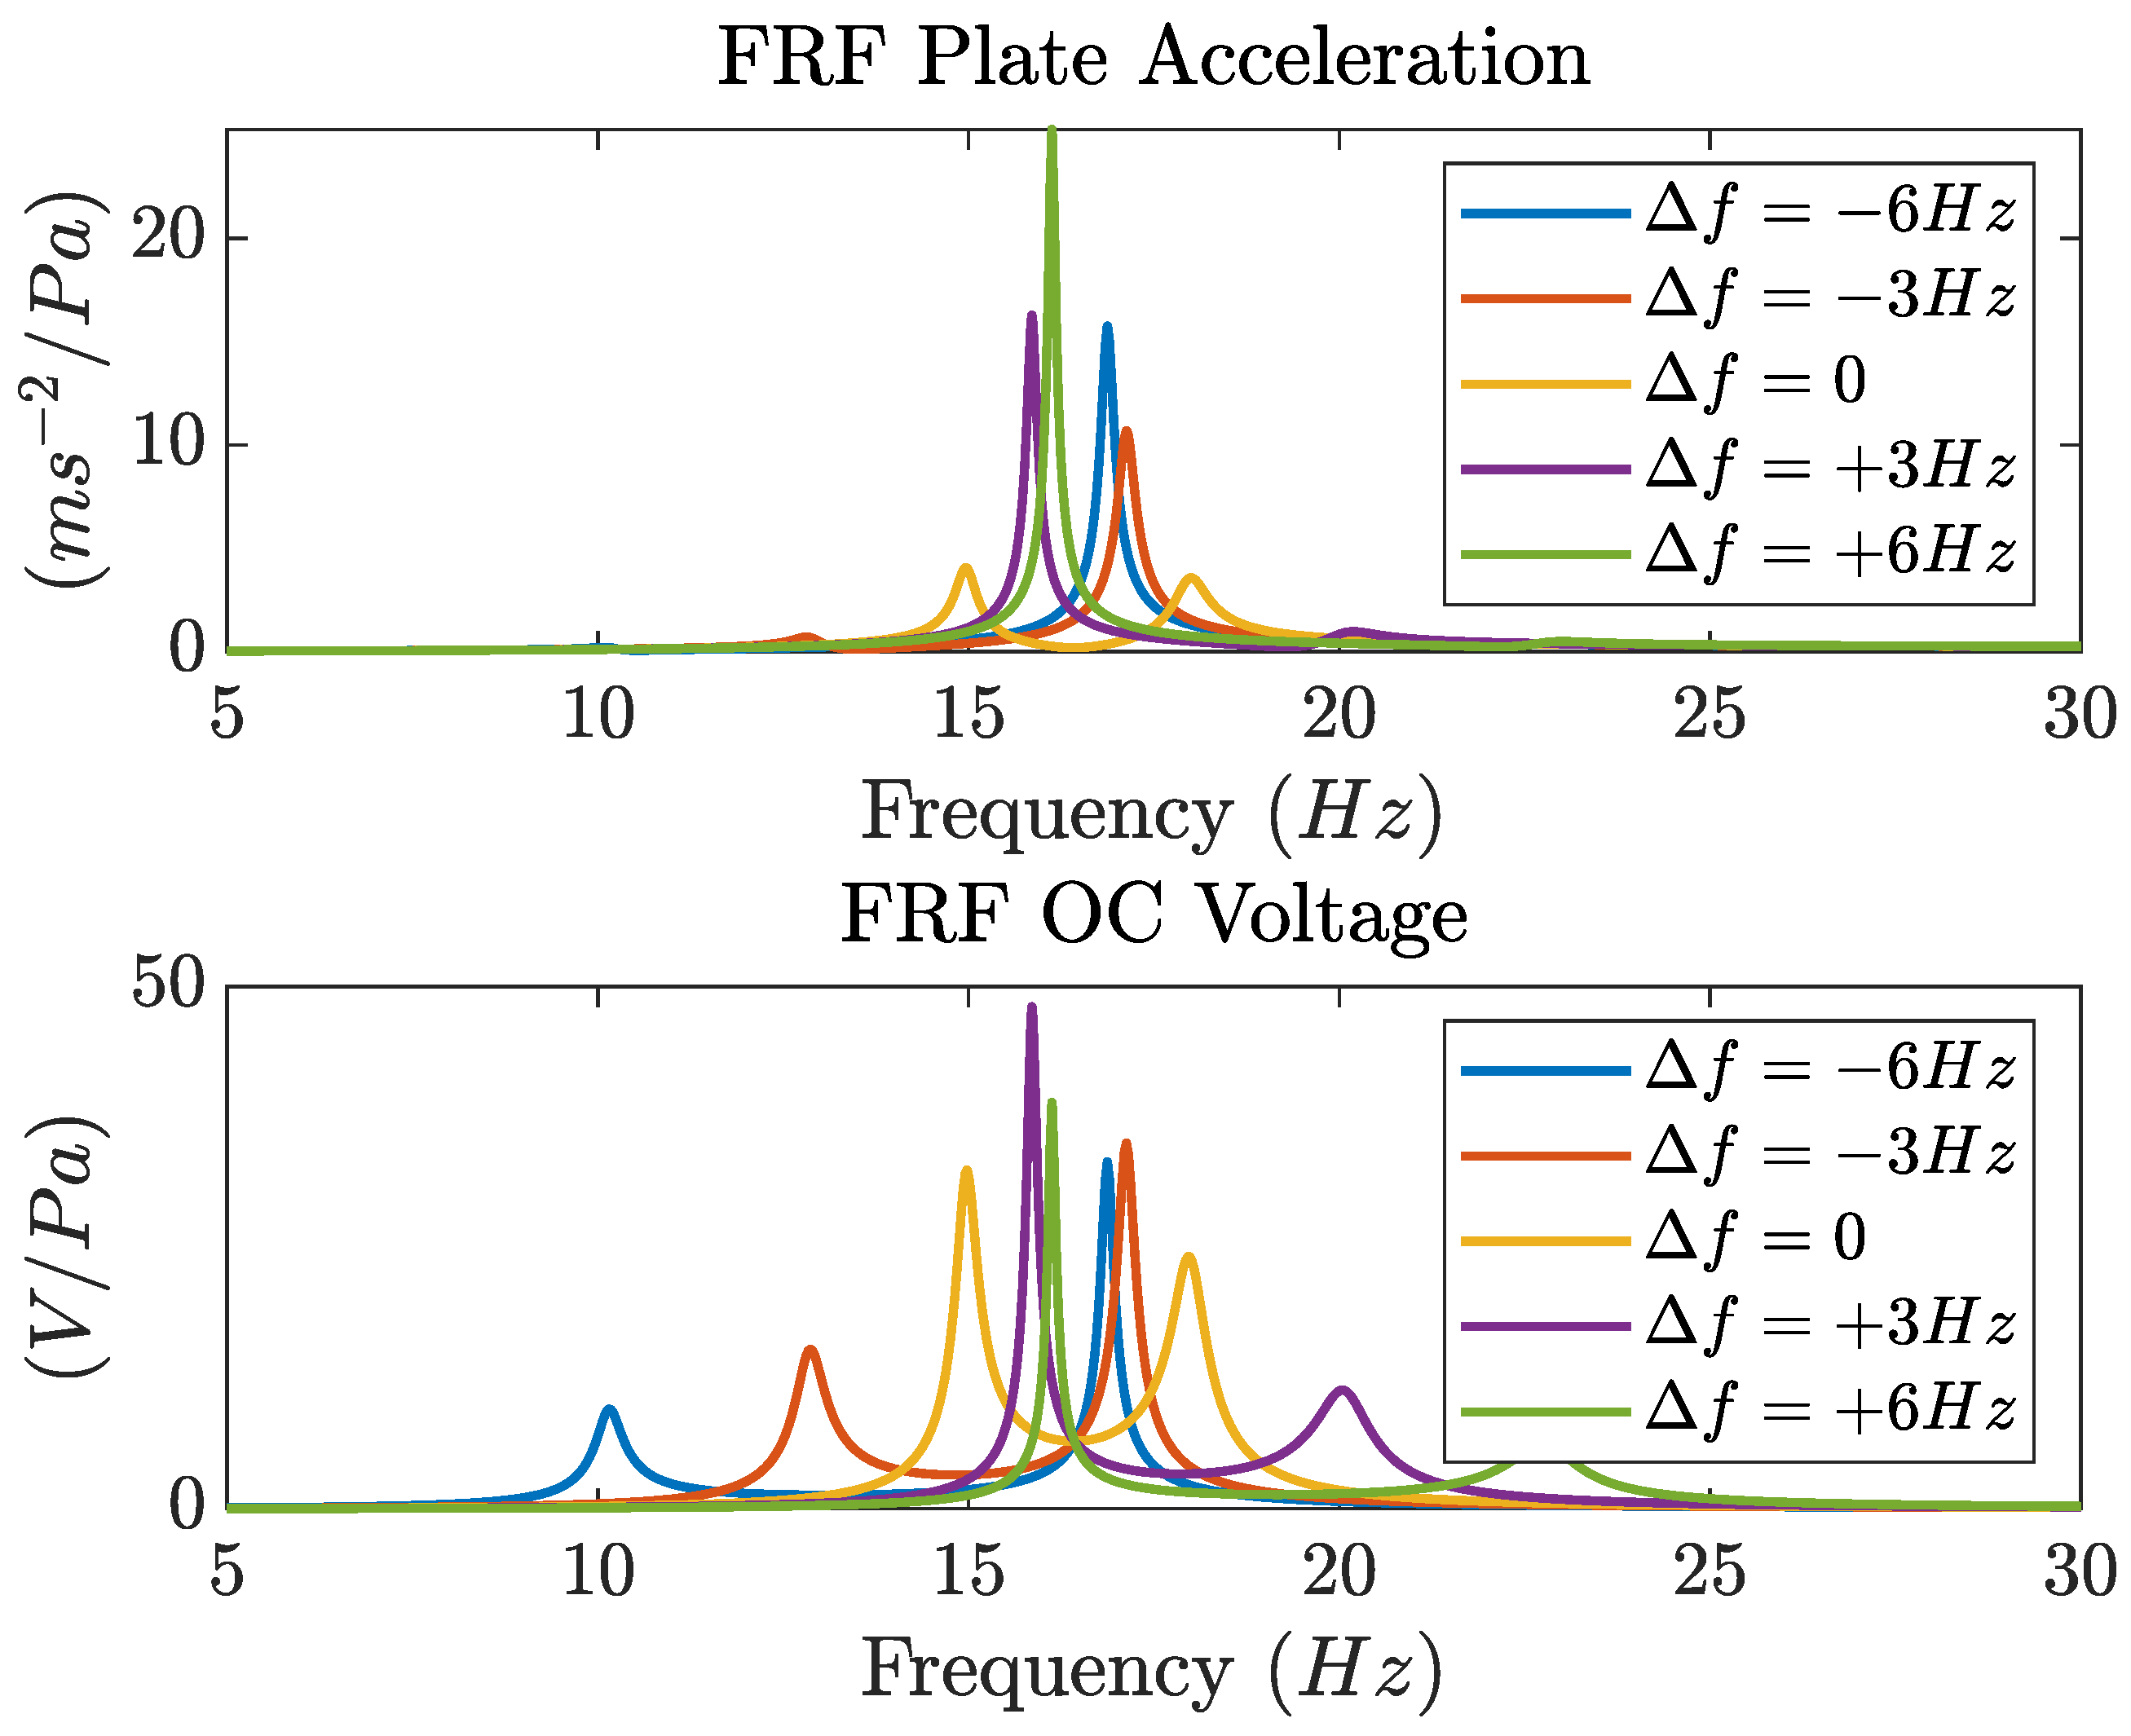
Figure 9 deals with the effect of CPDVA tuning, in this case the harvester is always at the center of the plate, which is excited by a harmonic distributed load (
).
The maximum effect on plate acceleration takes place when the CPDVA is tuned to the natural frequency of the first mode of the plate. This behavior is typical of many vibrating systems [
15]. A shift in the tuning frequency
(about 20%) is enough to make appear a large resonance peak again. The frequency of this resonance is close to the one of the original resonance of the plate and depends on CPDVA tuning.
Figure 9 shows that all the OC voltage FRFs intersect at the frequency of the original mode of the plate (
). The exact tuning leads to the most symmetric behavior with two peaks of the OC voltage having nearly the same amplitude and the minimum at the natural frequency of the original plate mode.
If the tuning frequency is shifted from the value corresponding to the natural frequency of the first mode, the maximum peak of voltage FRF always coincides with the maximum peak of the acceleration FRF. When the tuning frequency decreases the first peak moves to lower frequencies and decreases its amplitude, whereas the second peak moves towards the natural frequency of the plate, increases and eventually decreases when
. In a simply supported beam forced by a concentrated load and equipped with a cantilever DVA a similar behavior was found, when the value of the tuning mass was increased (decreased tuning frequency) [
15]. When the tuning frequency increases the second peak moves to higher frequencies, whereas the first moves towards the original natural frequency of the plate, increases and eventually decreases when
. The behavior is not symmetric, since positive and negative frequency shifts have different effects. The behavior depicted in
Figure 9 suggests that, when the distributed load has a broad-band spectrum, the best tuning coincides with the exact tuning to the natural frequency of the plate mode. When a narrow-band distributed load excites the plate, the largest amount of energy can be harvested when the harvester is tuned to a slightly higher frequency.
4. Experimental equipment
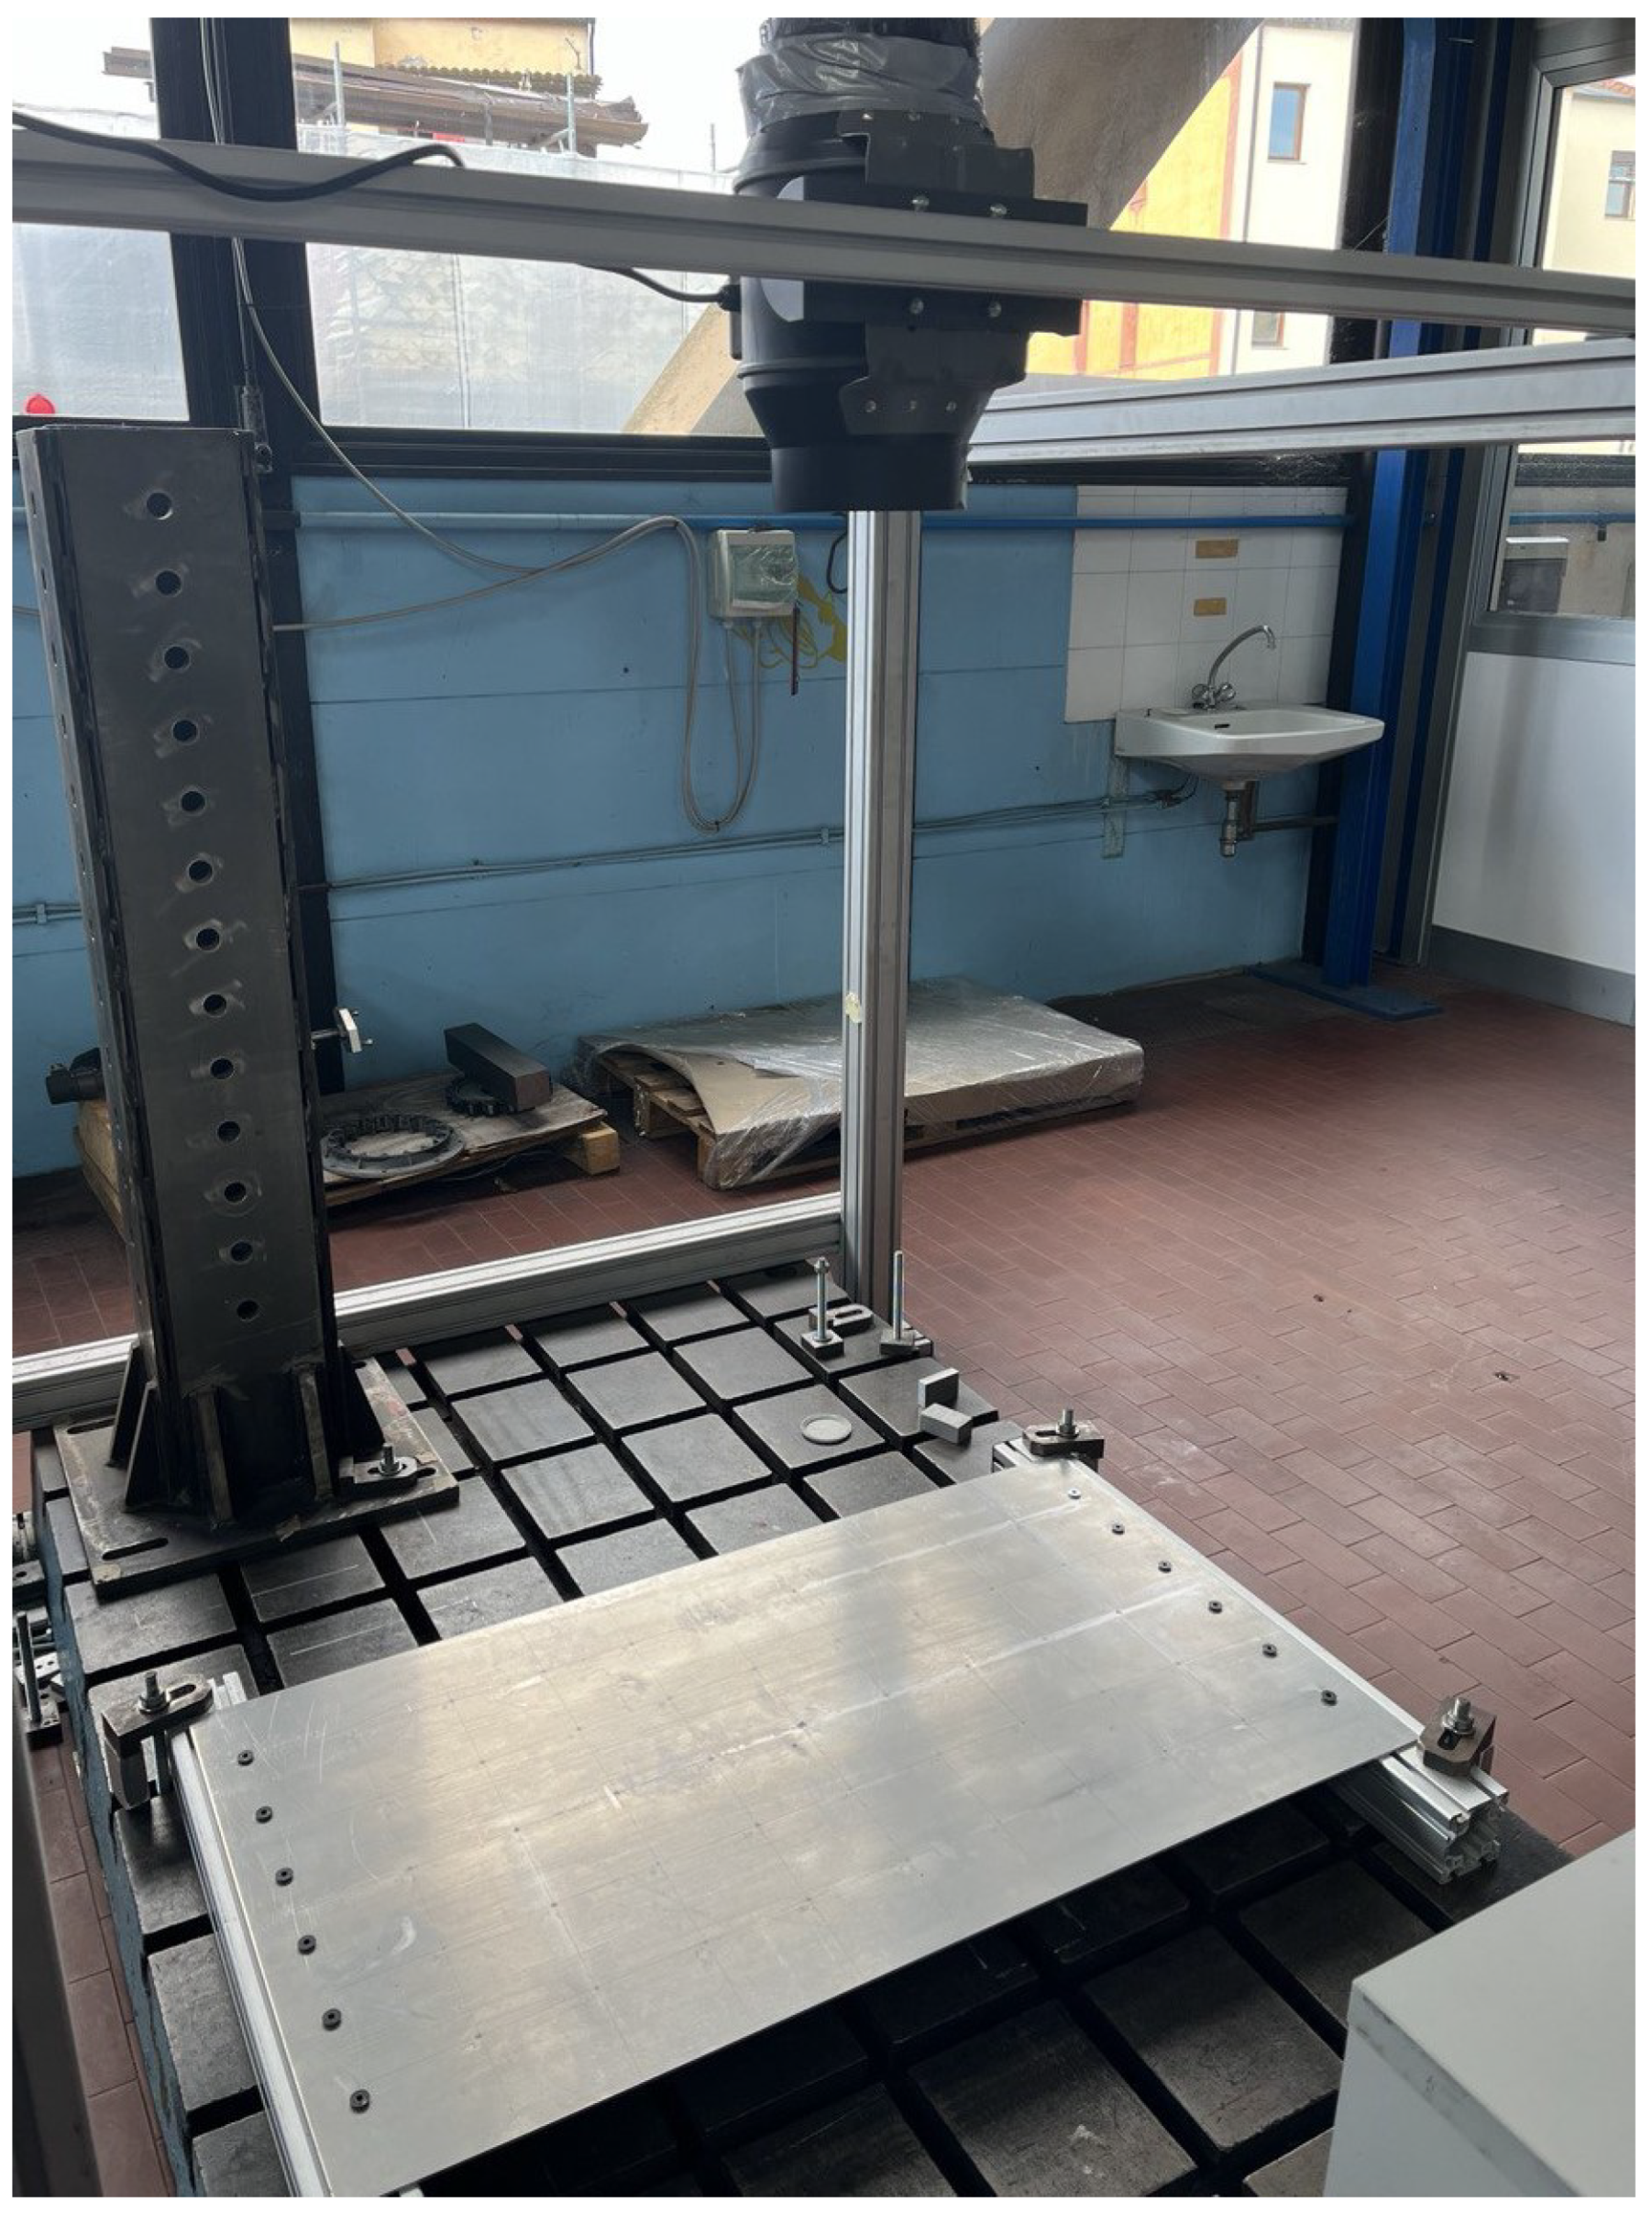
The experimental equipment was developed with the aim of evaluating the performance of the harvesting system in different load conditions. To make the clamps, the two shorter sides of the aluminium plate were fixed to a very stiff steel base by means of screws (
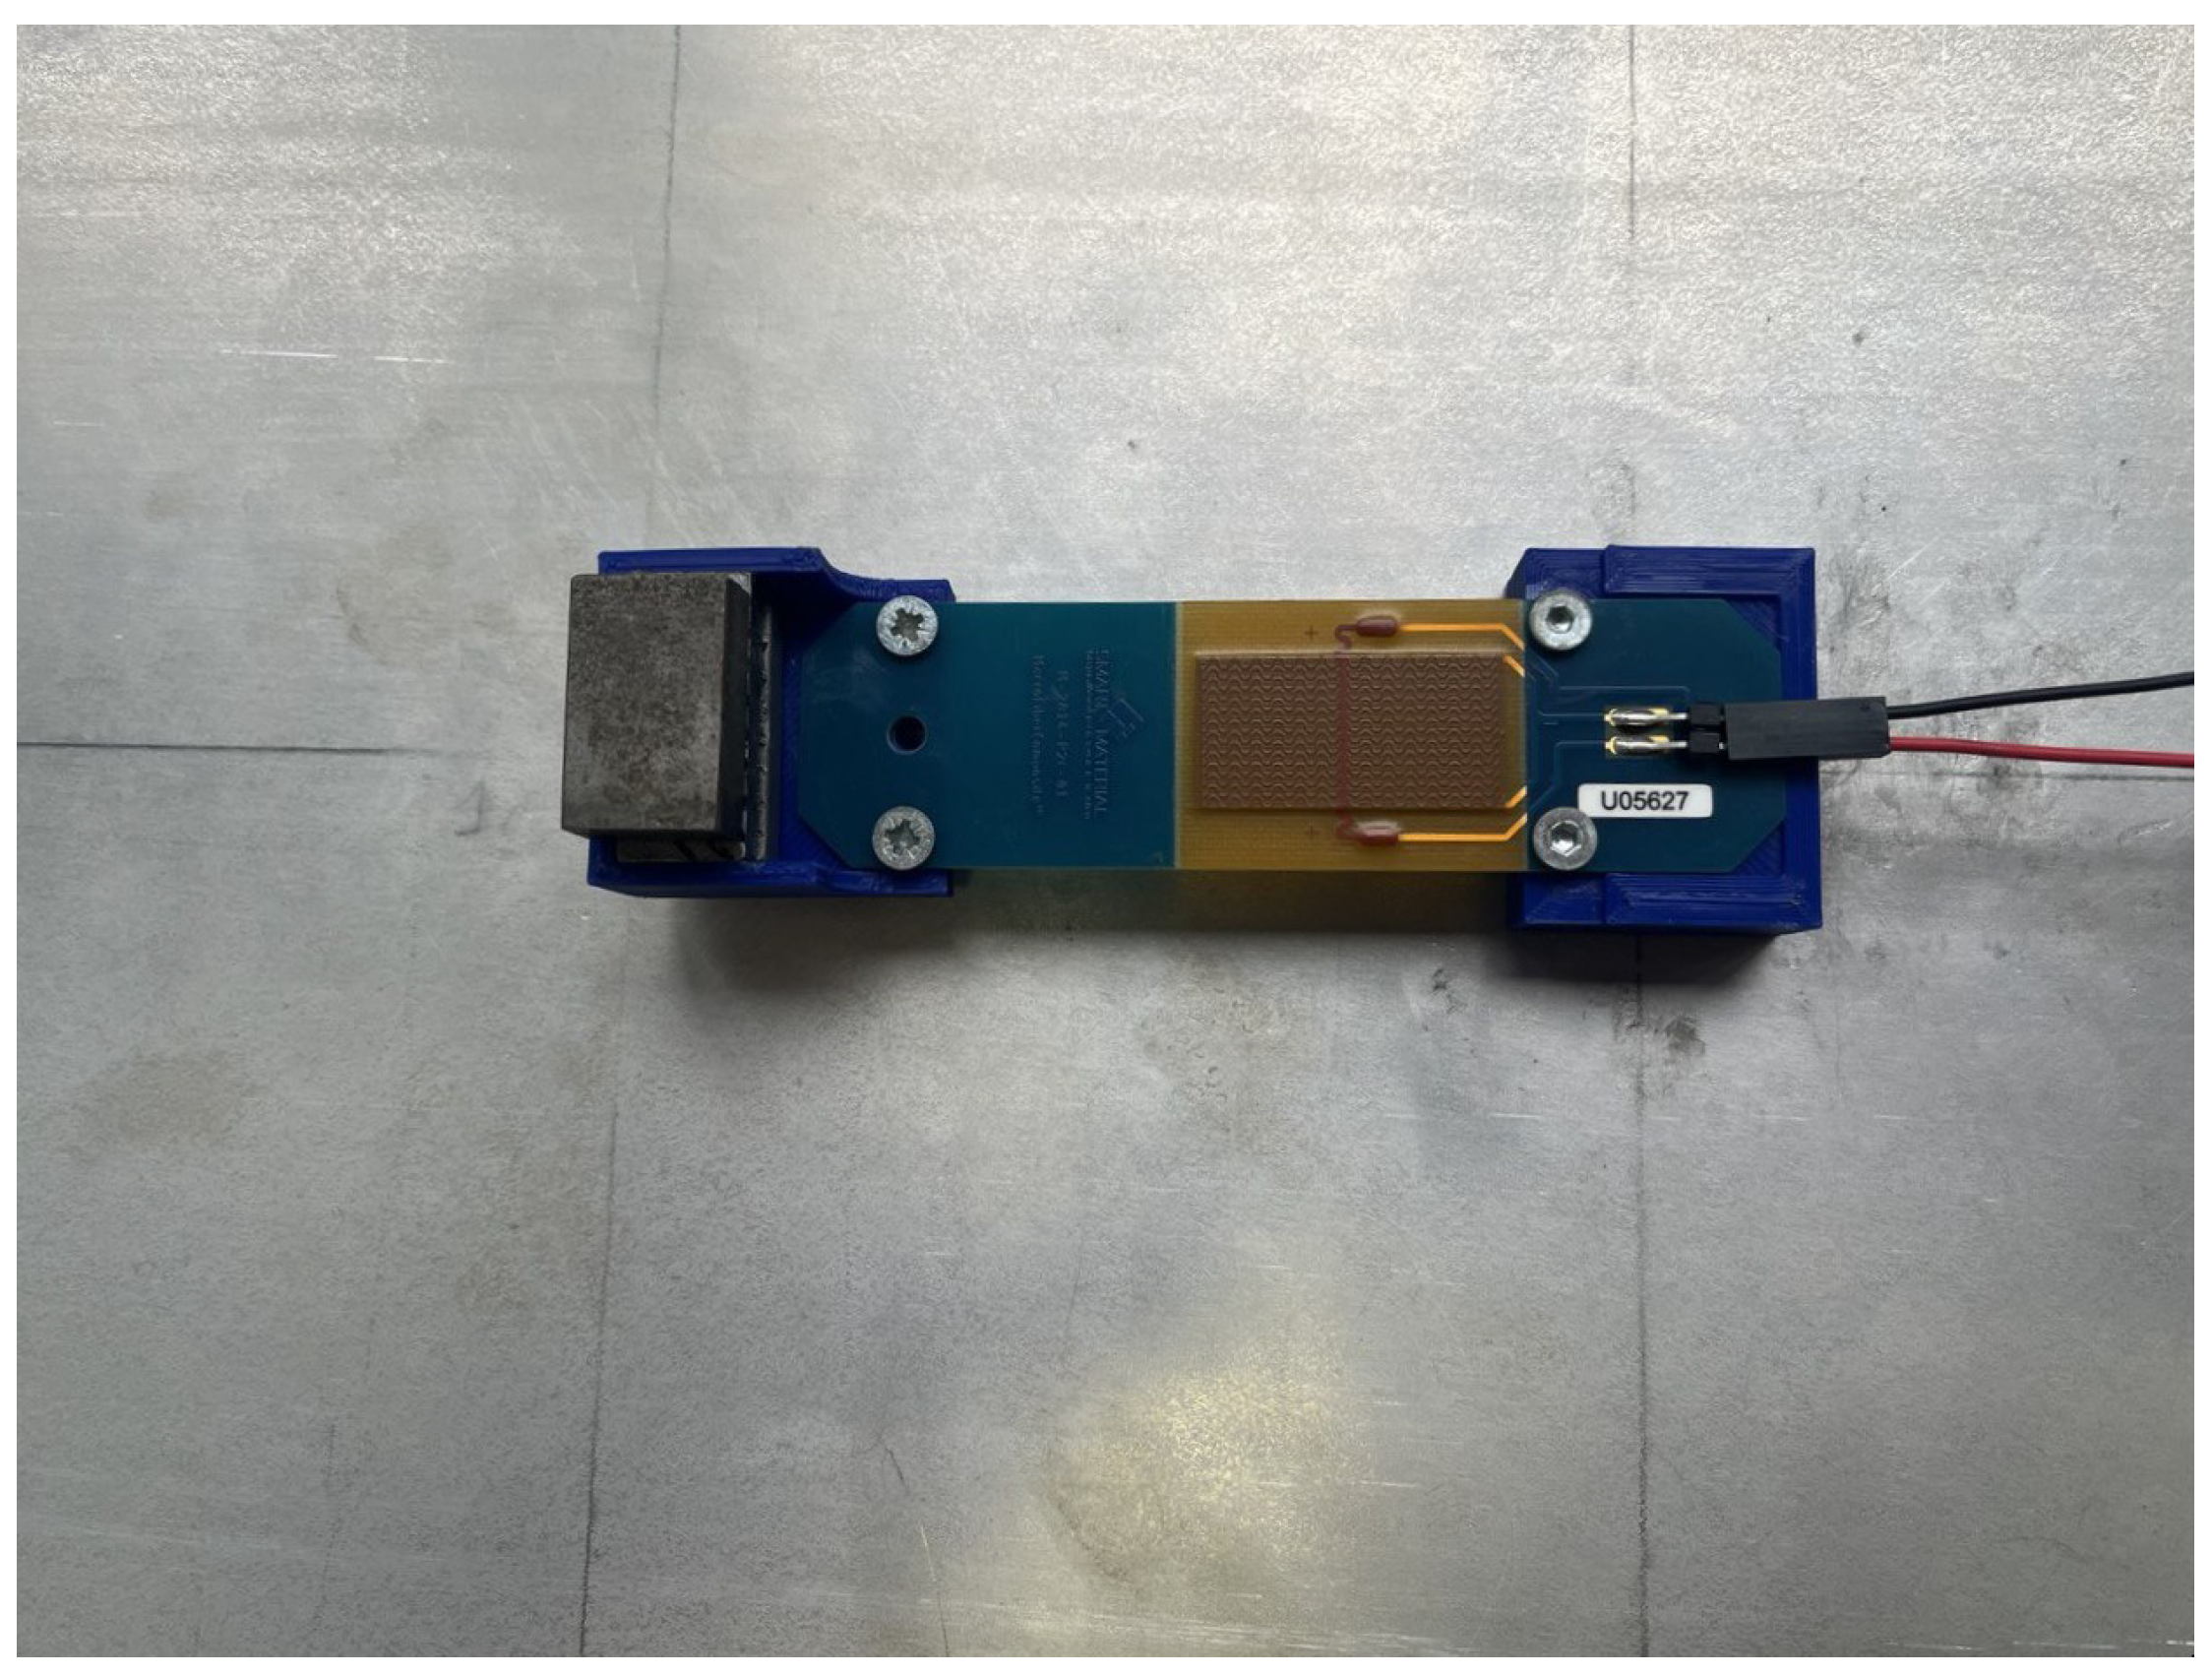
Figure 10). The CPDVA used in experiments was built using a commercial cantilever harvester (PEH M2814P2C-01) made by Smart Materials GmbH. The base to attach the harvester to the plate was 3D printed.
Table 2 reports the parameters of the harvester and
Figure 11 shows the CPDVA attached to the backside of the plate. The CPDVA base was bonded to the center of the plate (
,
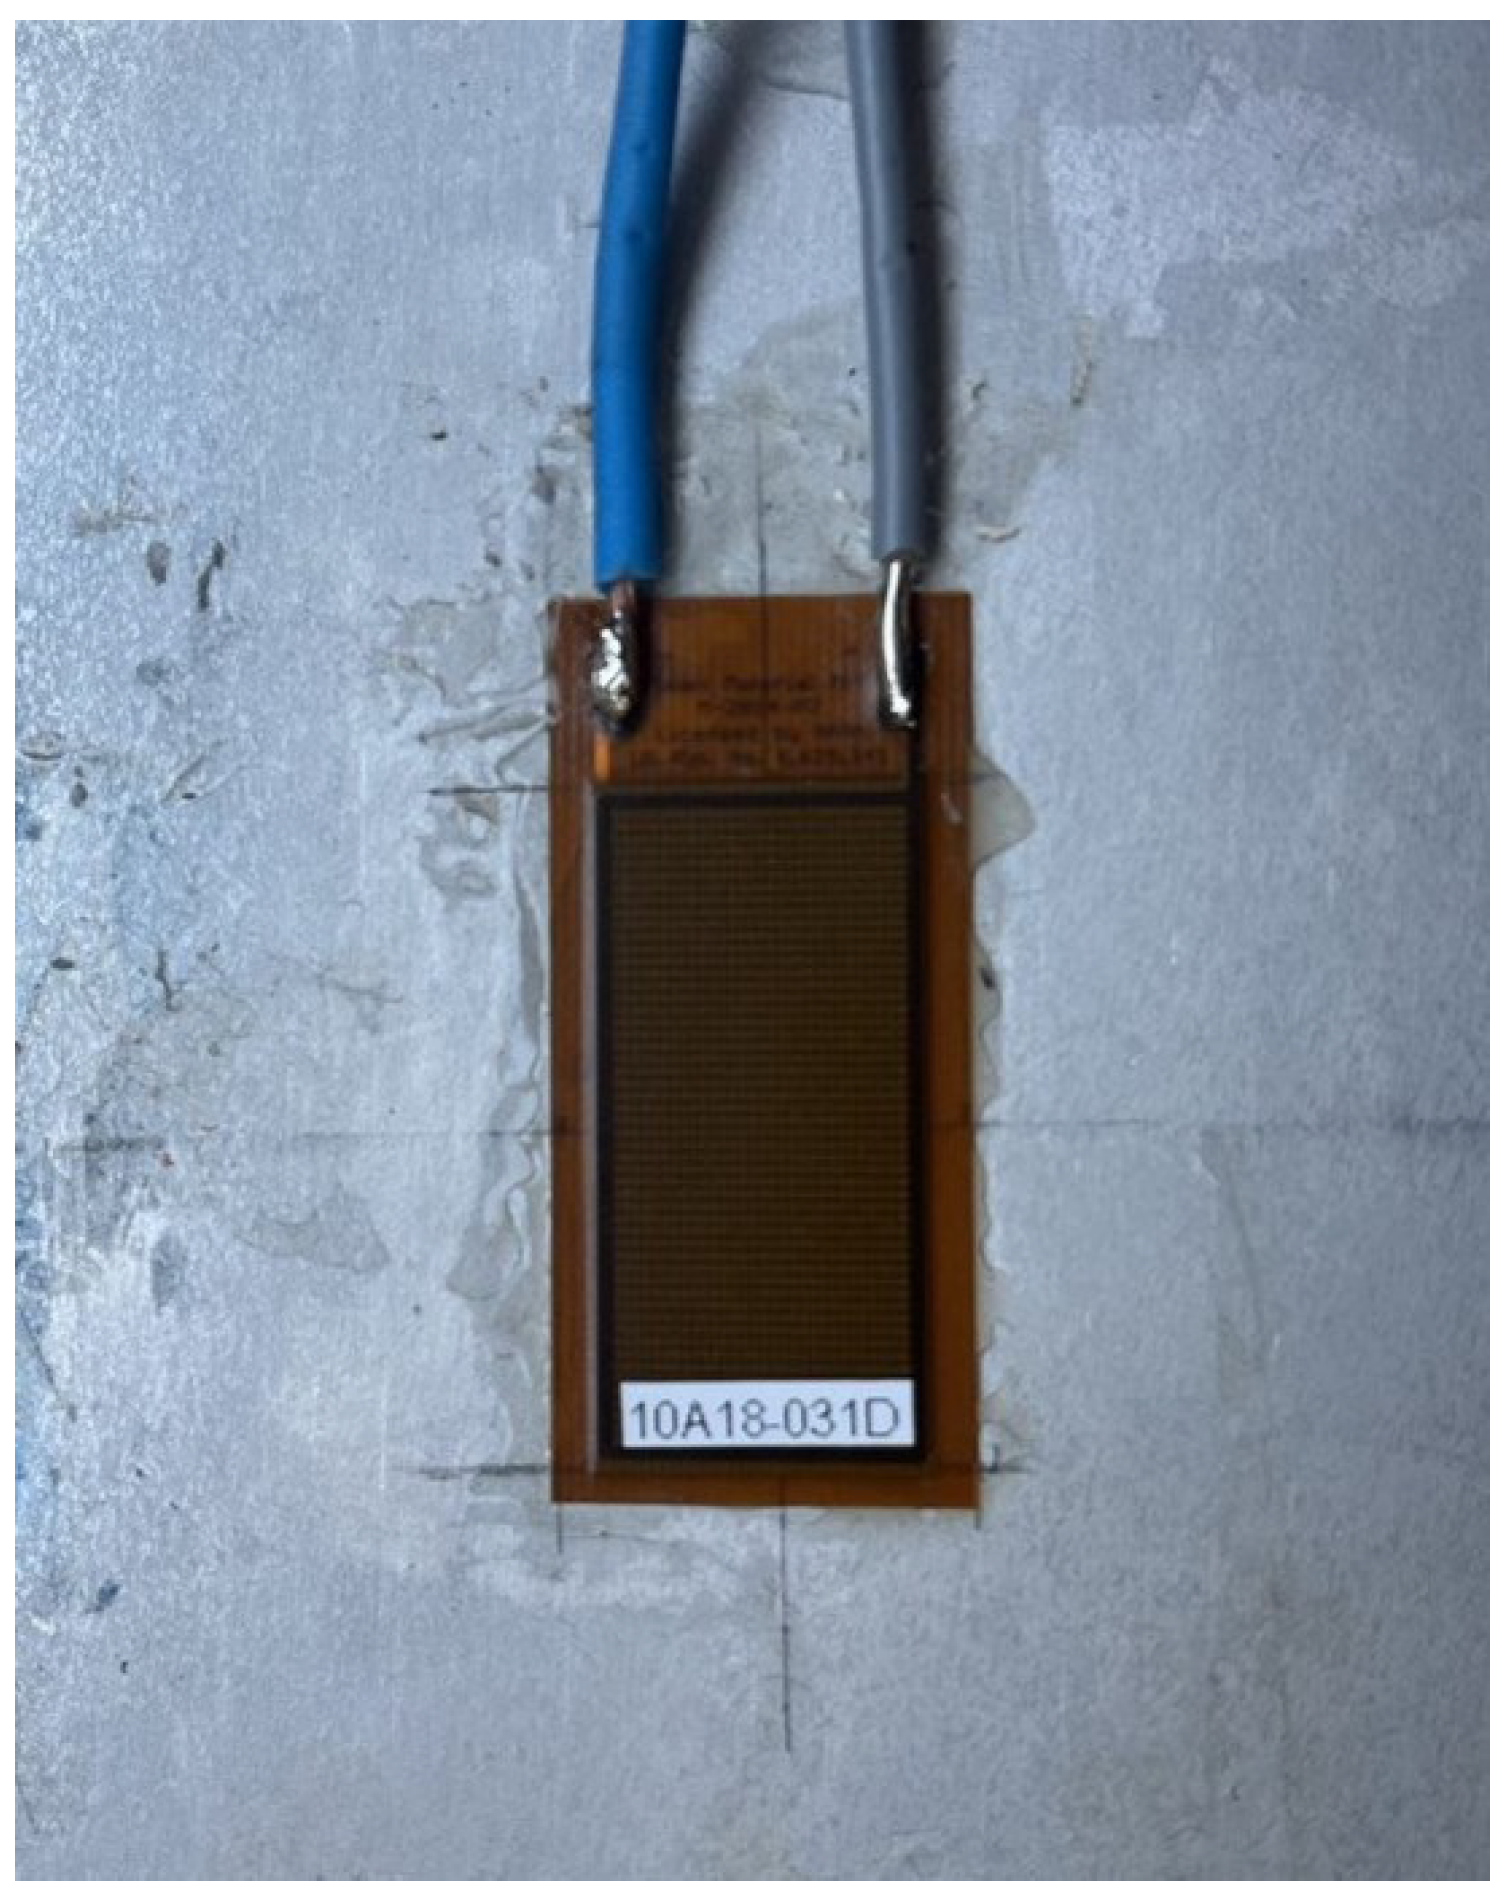
) by means of structural adhesive. In order to verify the advantages of the CPDVA, experiments were also performed with a piezoelectric patch in place of the CPDVA. In particular, the same piezoelectric patch used in the PEH M2814P2C-01 cantilever harvester was bonded under the center of the plate as shown in
Figure 12.
During tests the OC voltage generated by the piezoelectric layer and the acceleration of the center of the plate were measured. The latter measurement was carried out using a small size PCB 352C22 accelerometer (sensitivity ). Since the mass of this accelerometer is less than 1 gram, it does not affect the dynamics of the plate.
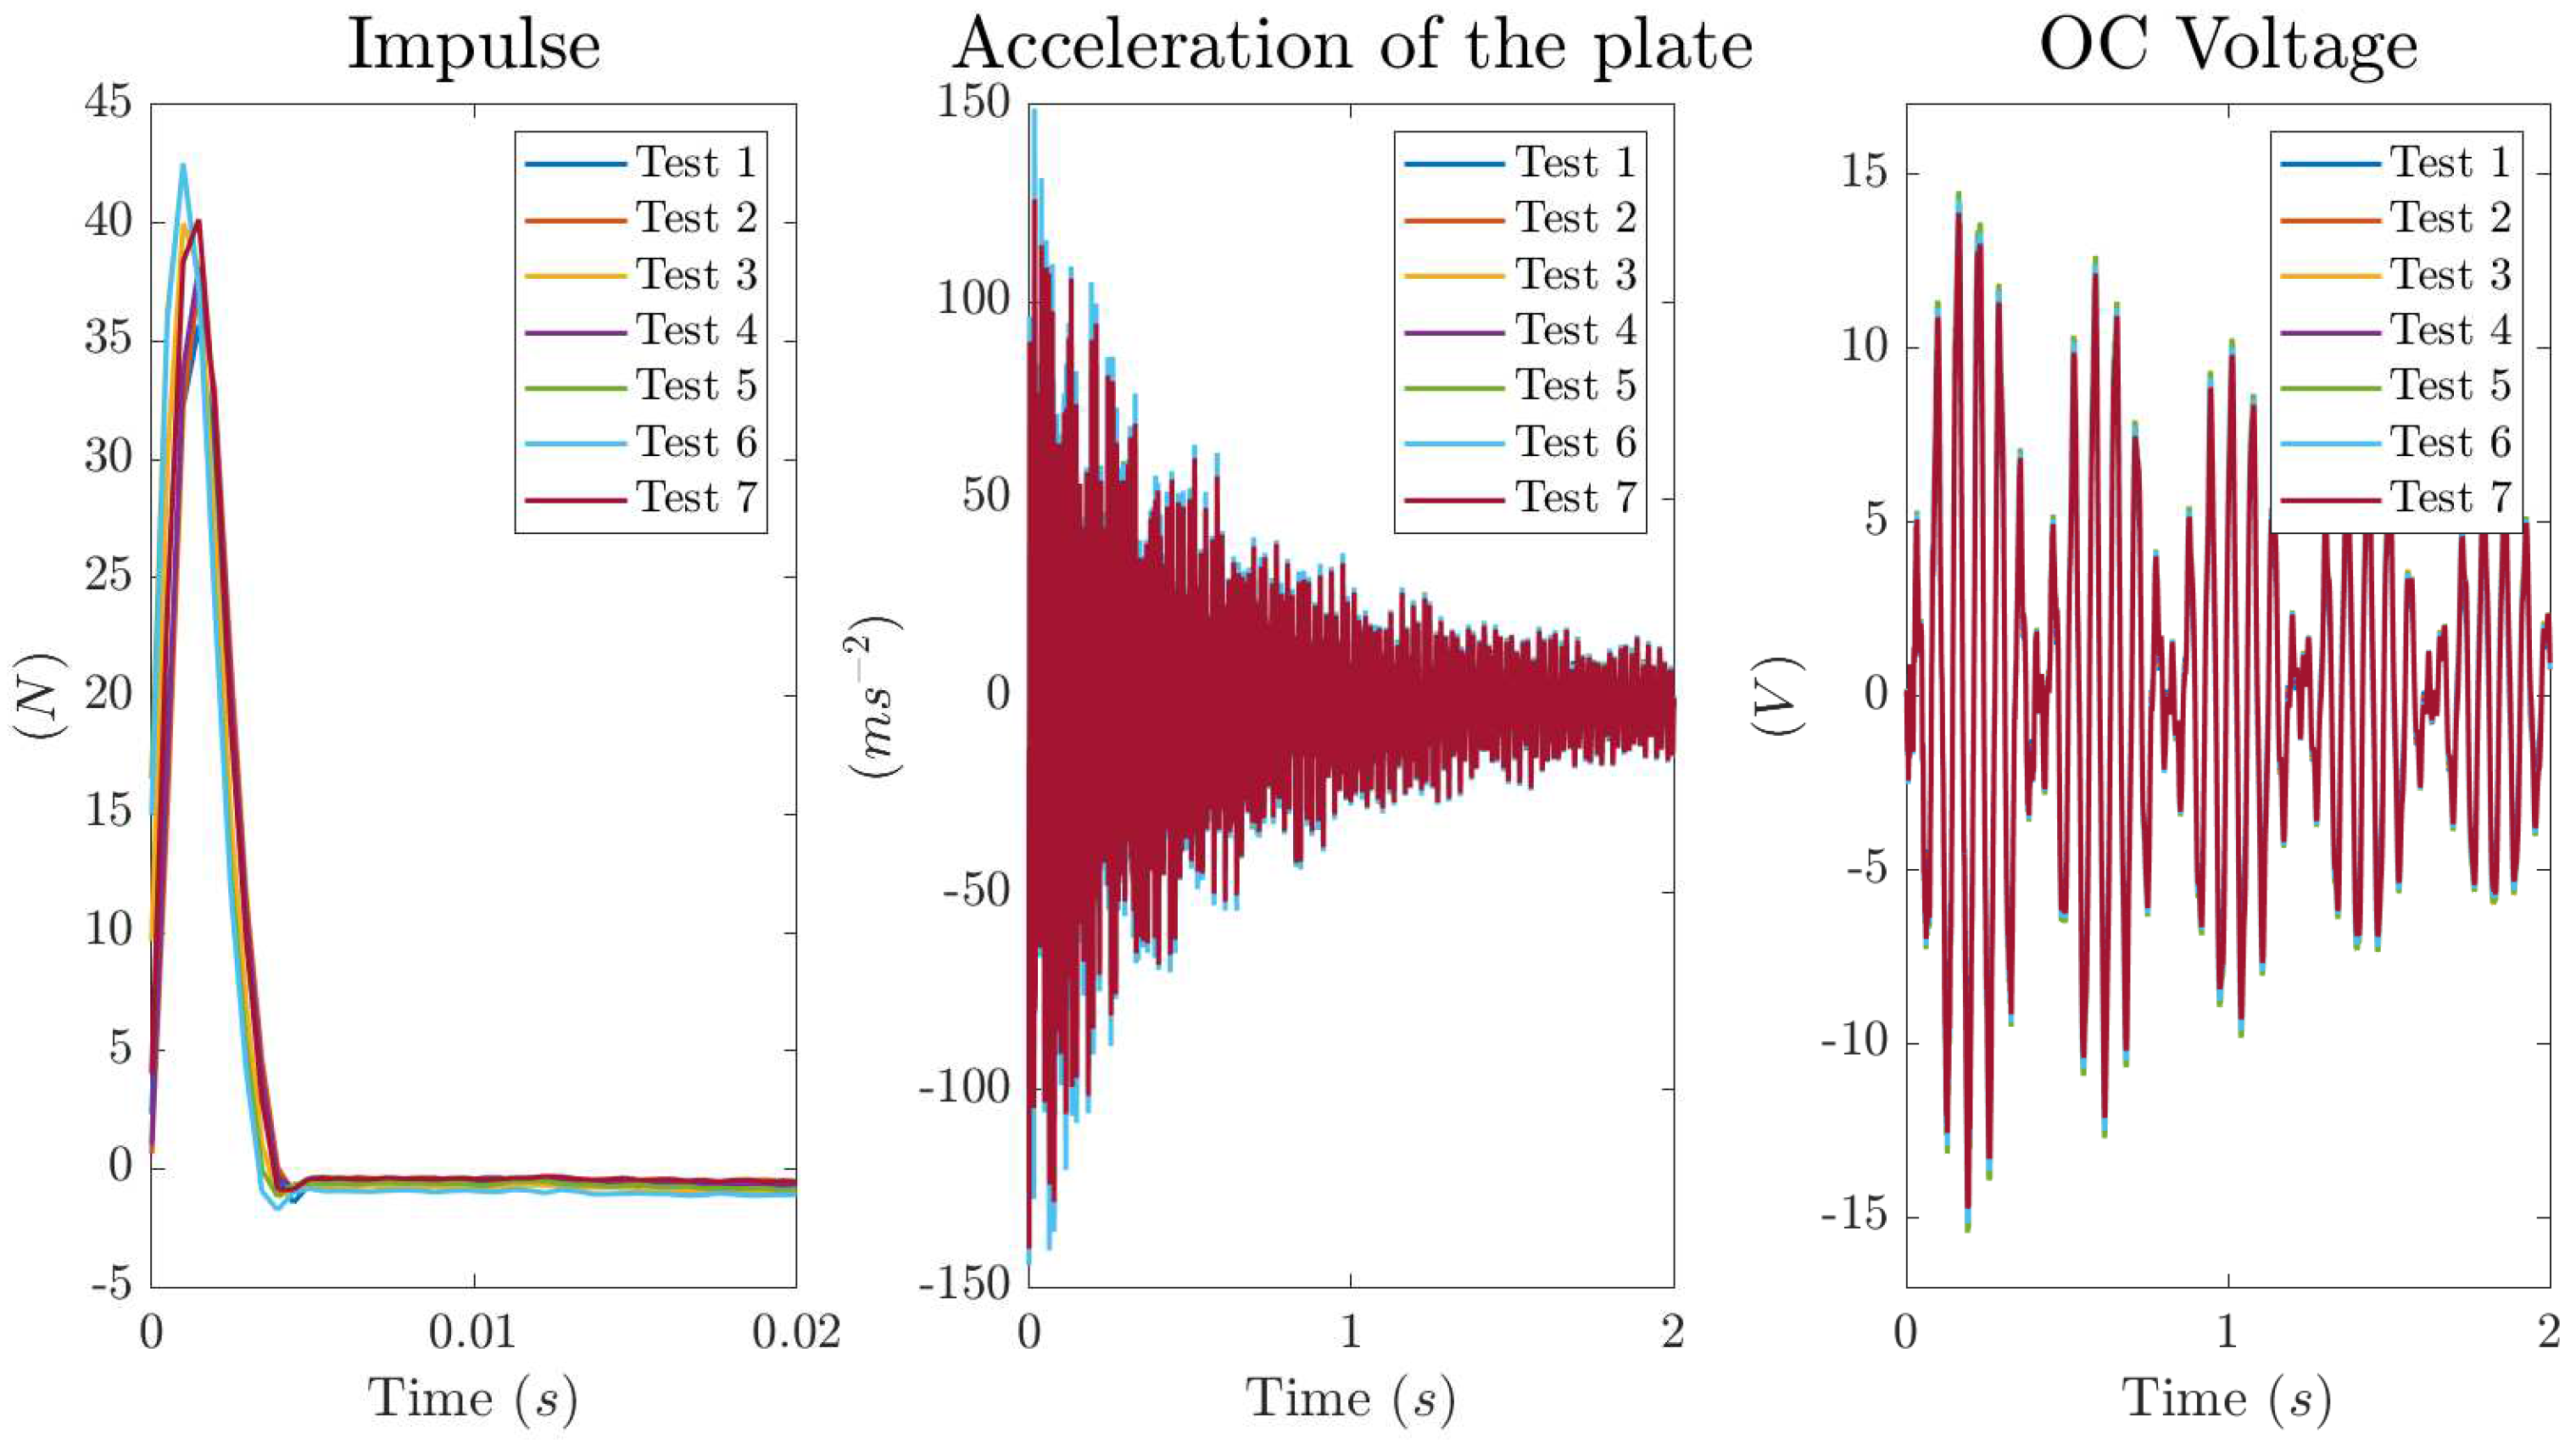
Two load cases were considered in the framework of this research. In the first the center of the plate was excited by means of an hammer for modal testing (PCB 086C03). Since in this case the measurement of the exciting force was possible and reliable, the FRFs of the system were calculated. It is worth noting that many simulations showed that there are small differences between the FRFs obtained with uniform pressure load and the FRFs obtained with concentrated force acting at the center of the plate.
In the second load case a fan was installed over the plate at a distance of
, see
Figure 10. The plate was excited by the pressure generated by the air jet impinging on the plate surface. The fan diameter is
and the maximum flow rate is
, which corresponds to a Reynolds number
. Experimental tests dealing with turbulent jets impinging on flat surfaces were presented in [
29,
30,
31]. Results show axial-symmetric distributions of both mean velocities and fluctuating components, which reach the maximum values at small distances from jet axis, that is at the center of the plate. The pressure fluctuations caused by the abovementioned pressure distributions can excite the first mode of the plate, but cannot excite the modes with odd number of nodal lines.
The voltage generated by the CPDVA and the signals of the sensors were acquired through a NI9230 board, typically, 4096 samples were collected with a sampling frequency of . Then, digital signals were analyzed with the software NI Signal Express to obtain the FRFs between voltage, acceleration, and force and PSDs of OC voltage.
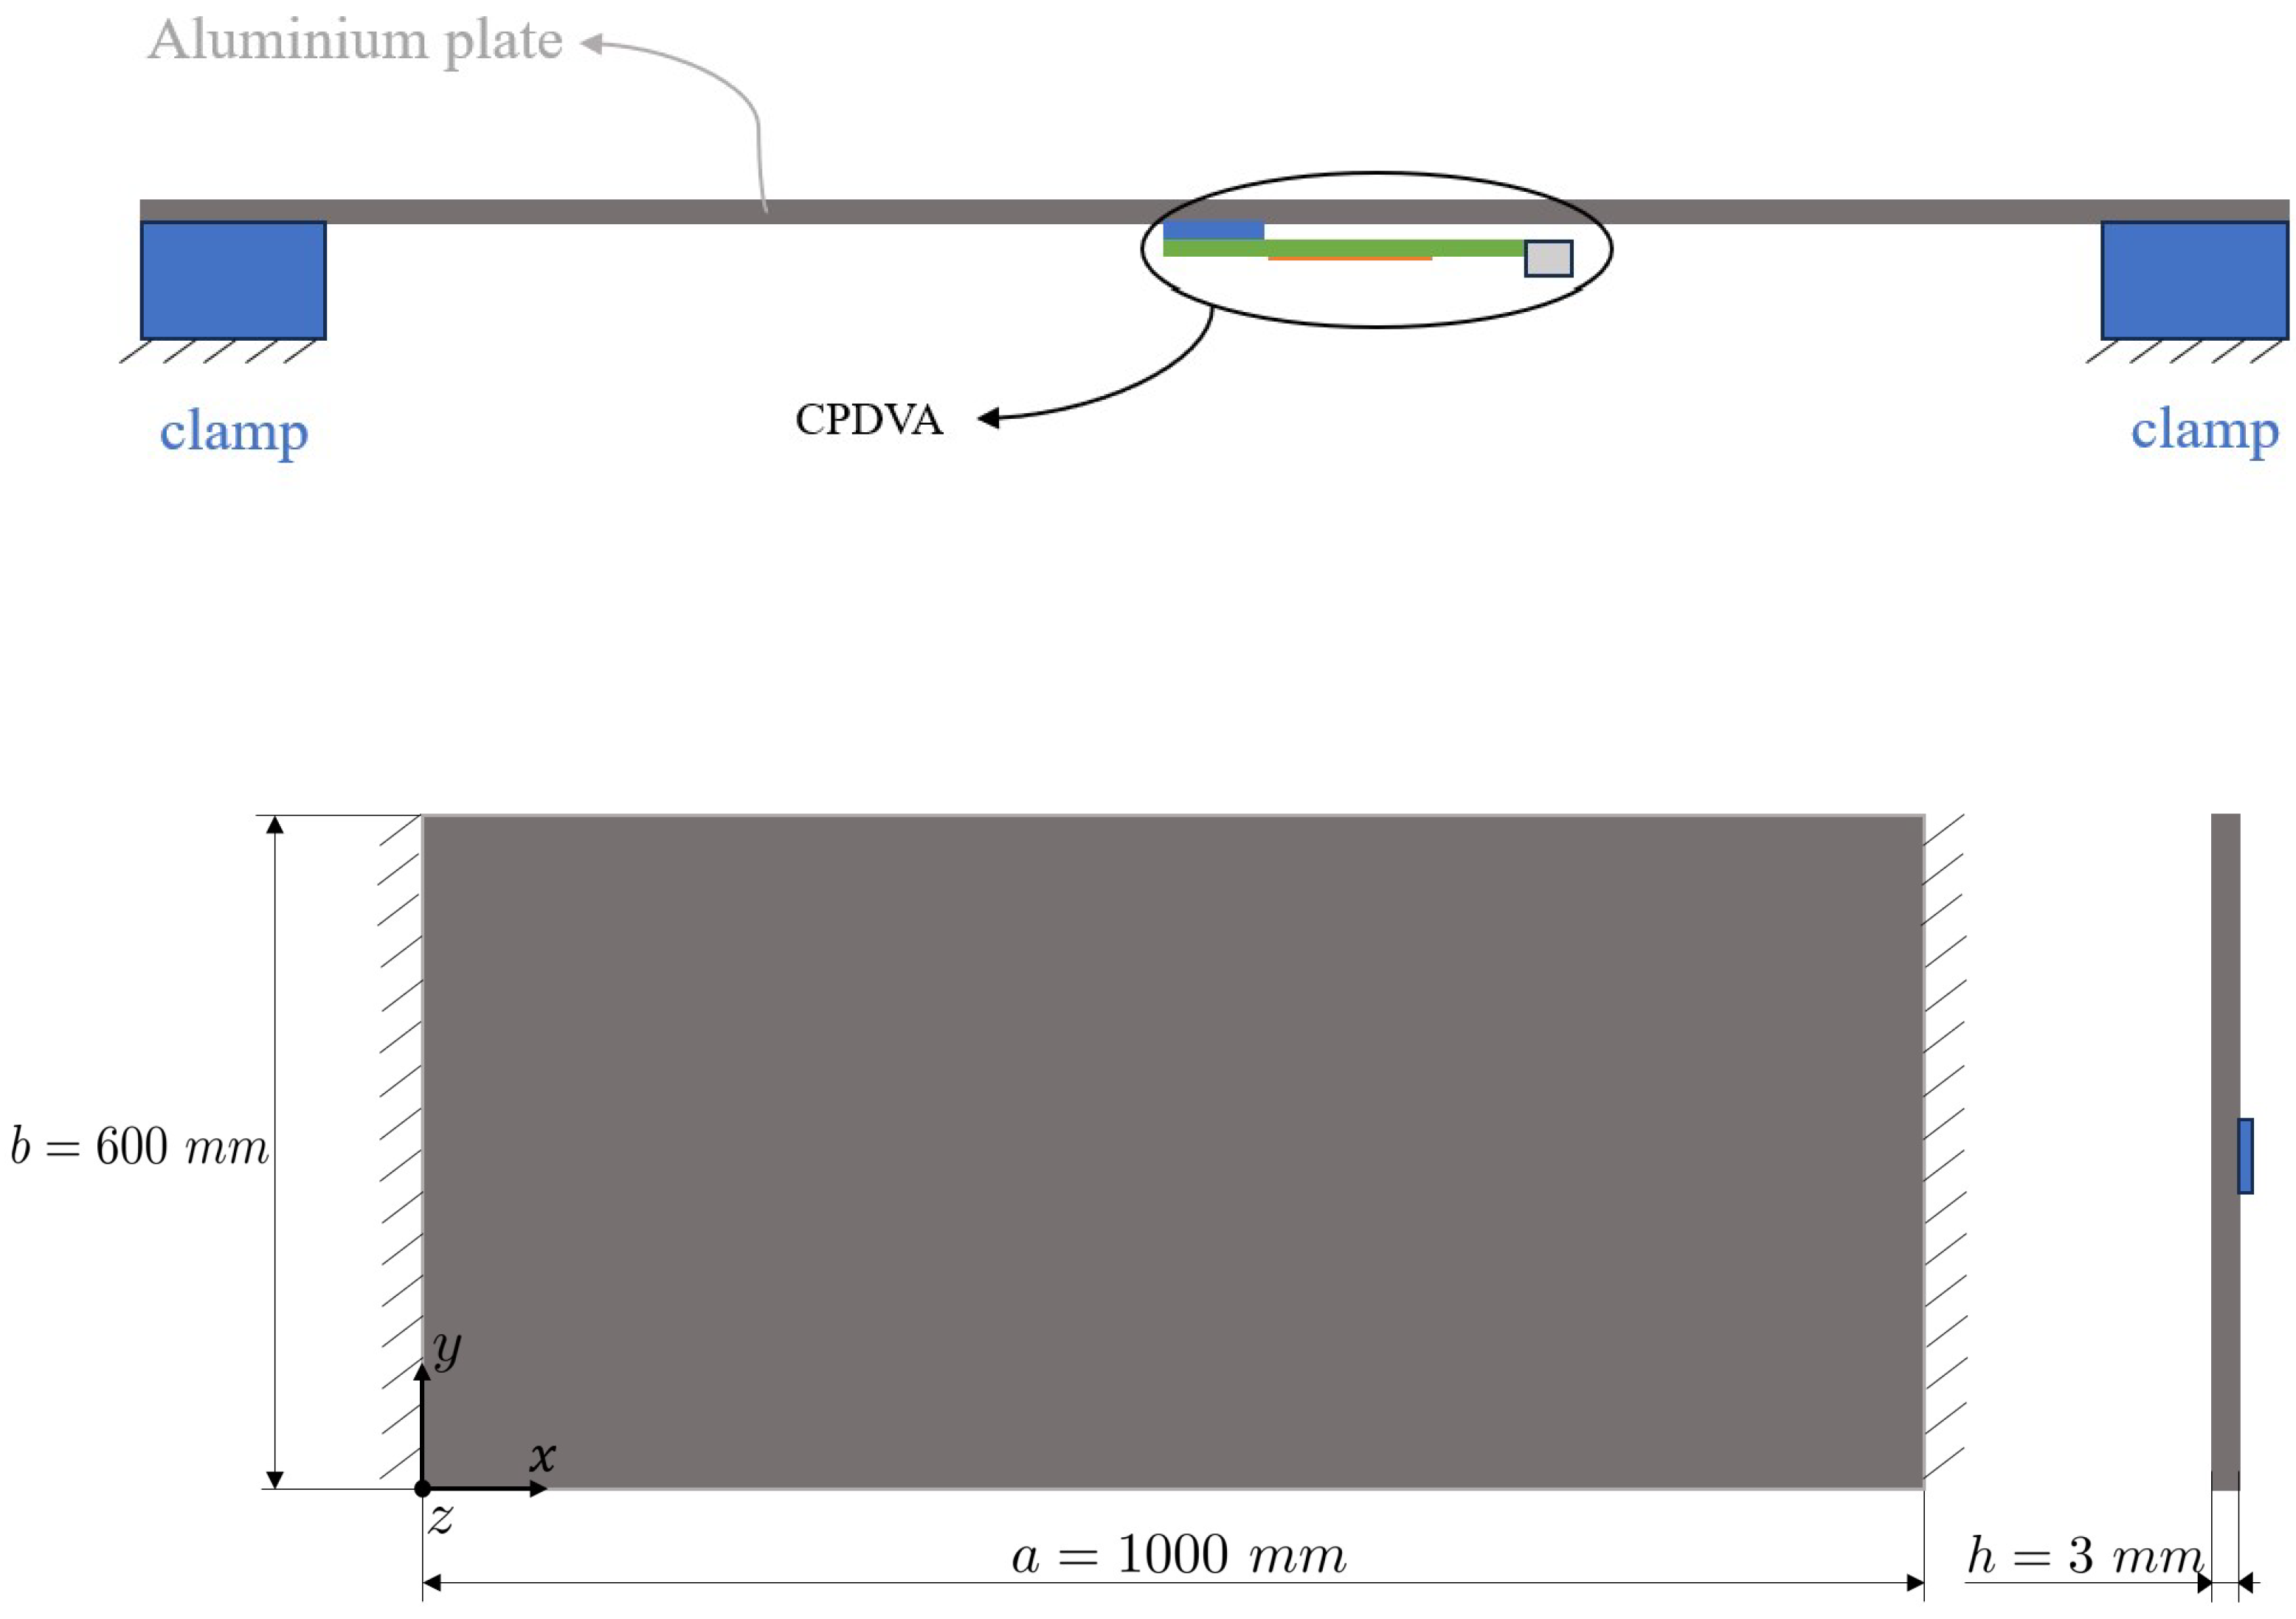
Figure 1.
Energy harvesting system (top). Front and lateral views of the plate (bottom).
Figure 1.
Energy harvesting system (top). Front and lateral views of the plate (bottom).
Figure 2.
Calculated modes of vibration of the plate.
Figure 2.
Calculated modes of vibration of the plate.
Figure 3.
Scheme of the CPDVA (left), and harvester cross section (right).
Figure 3.
Scheme of the CPDVA (left), and harvester cross section (right).
Figure 4.
The FRF (magnitude) between the acceleration at the center of the plate and the uniform distributed load.
Figure 4.
The FRF (magnitude) between the acceleration at the center of the plate and the uniform distributed load.
Figure 5.
Comparison between the magnitude of calculated FRF of the acceleration at the center of the plate and the uniform distributed load. Bare plate with patch and plate with CPDVA.
Figure 5.
Comparison between the magnitude of calculated FRF of the acceleration at the center of the plate and the uniform distributed load. Bare plate with patch and plate with CPDVA.
Figure 6.
Comparison between the magnitude of calculated FRF of the generated OC voltage and the uniform distributed load. Bare plate with patch and plate with CPDVA.
Figure 6.
Comparison between the magnitude of calculated FRF of the generated OC voltage and the uniform distributed load. Bare plate with patch and plate with CPDVA.
Figure 7.
FRF (magnitude) of the acceleration at the center of the plate (top) and FRF of the OC voltage generated by the CPDVA (bottom). Comparison considering different positions of the harvester along x-axis (and the same position along y-axis) and the uniform distributed load.
Figure 7.
FRF (magnitude) of the acceleration at the center of the plate (top) and FRF of the OC voltage generated by the CPDVA (bottom). Comparison considering different positions of the harvester along x-axis (and the same position along y-axis) and the uniform distributed load.
Figure 8.
FRF (magnitude) of the acceleration at the center of the plate (top) and FRF of the OC voltage generated by the CPDVA (bottom). Comparison considering different positions of the harvester along y-axis (and the same position along x-axis) and the uniform distributed load.
Figure 8.
FRF (magnitude) of the acceleration at the center of the plate (top) and FRF of the OC voltage generated by the CPDVA (bottom). Comparison considering different positions of the harvester along y-axis (and the same position along x-axis) and the uniform distributed load.
Figure 9.
FRF (magnitude) of the acceleration at the center of the plate (top) and FRF of the OC voltage generated by the CPDVA (bottom). Comparison considering different tuning frequencies of the harvester and the uniform distributed load.
Figure 9.
FRF (magnitude) of the acceleration at the center of the plate (top) and FRF of the OC voltage generated by the CPDVA (bottom). Comparison considering different tuning frequencies of the harvester and the uniform distributed load.
Figure 10.
Clamped plate and fan for the excitation of the plate through the air jet.
Figure 10.
Clamped plate and fan for the excitation of the plate through the air jet.
Figure 11.
Picture of the CPDVA. The tip mass is on the left hand side and the base glued to the plate is on the right hand side.
Figure 11.
Picture of the CPDVA. The tip mass is on the left hand side and the base glued to the plate is on the right hand side.
Figure 12.
Piezoelectric patch directly bonded to the plate.
Figure 12.
Piezoelectric patch directly bonded to the plate.
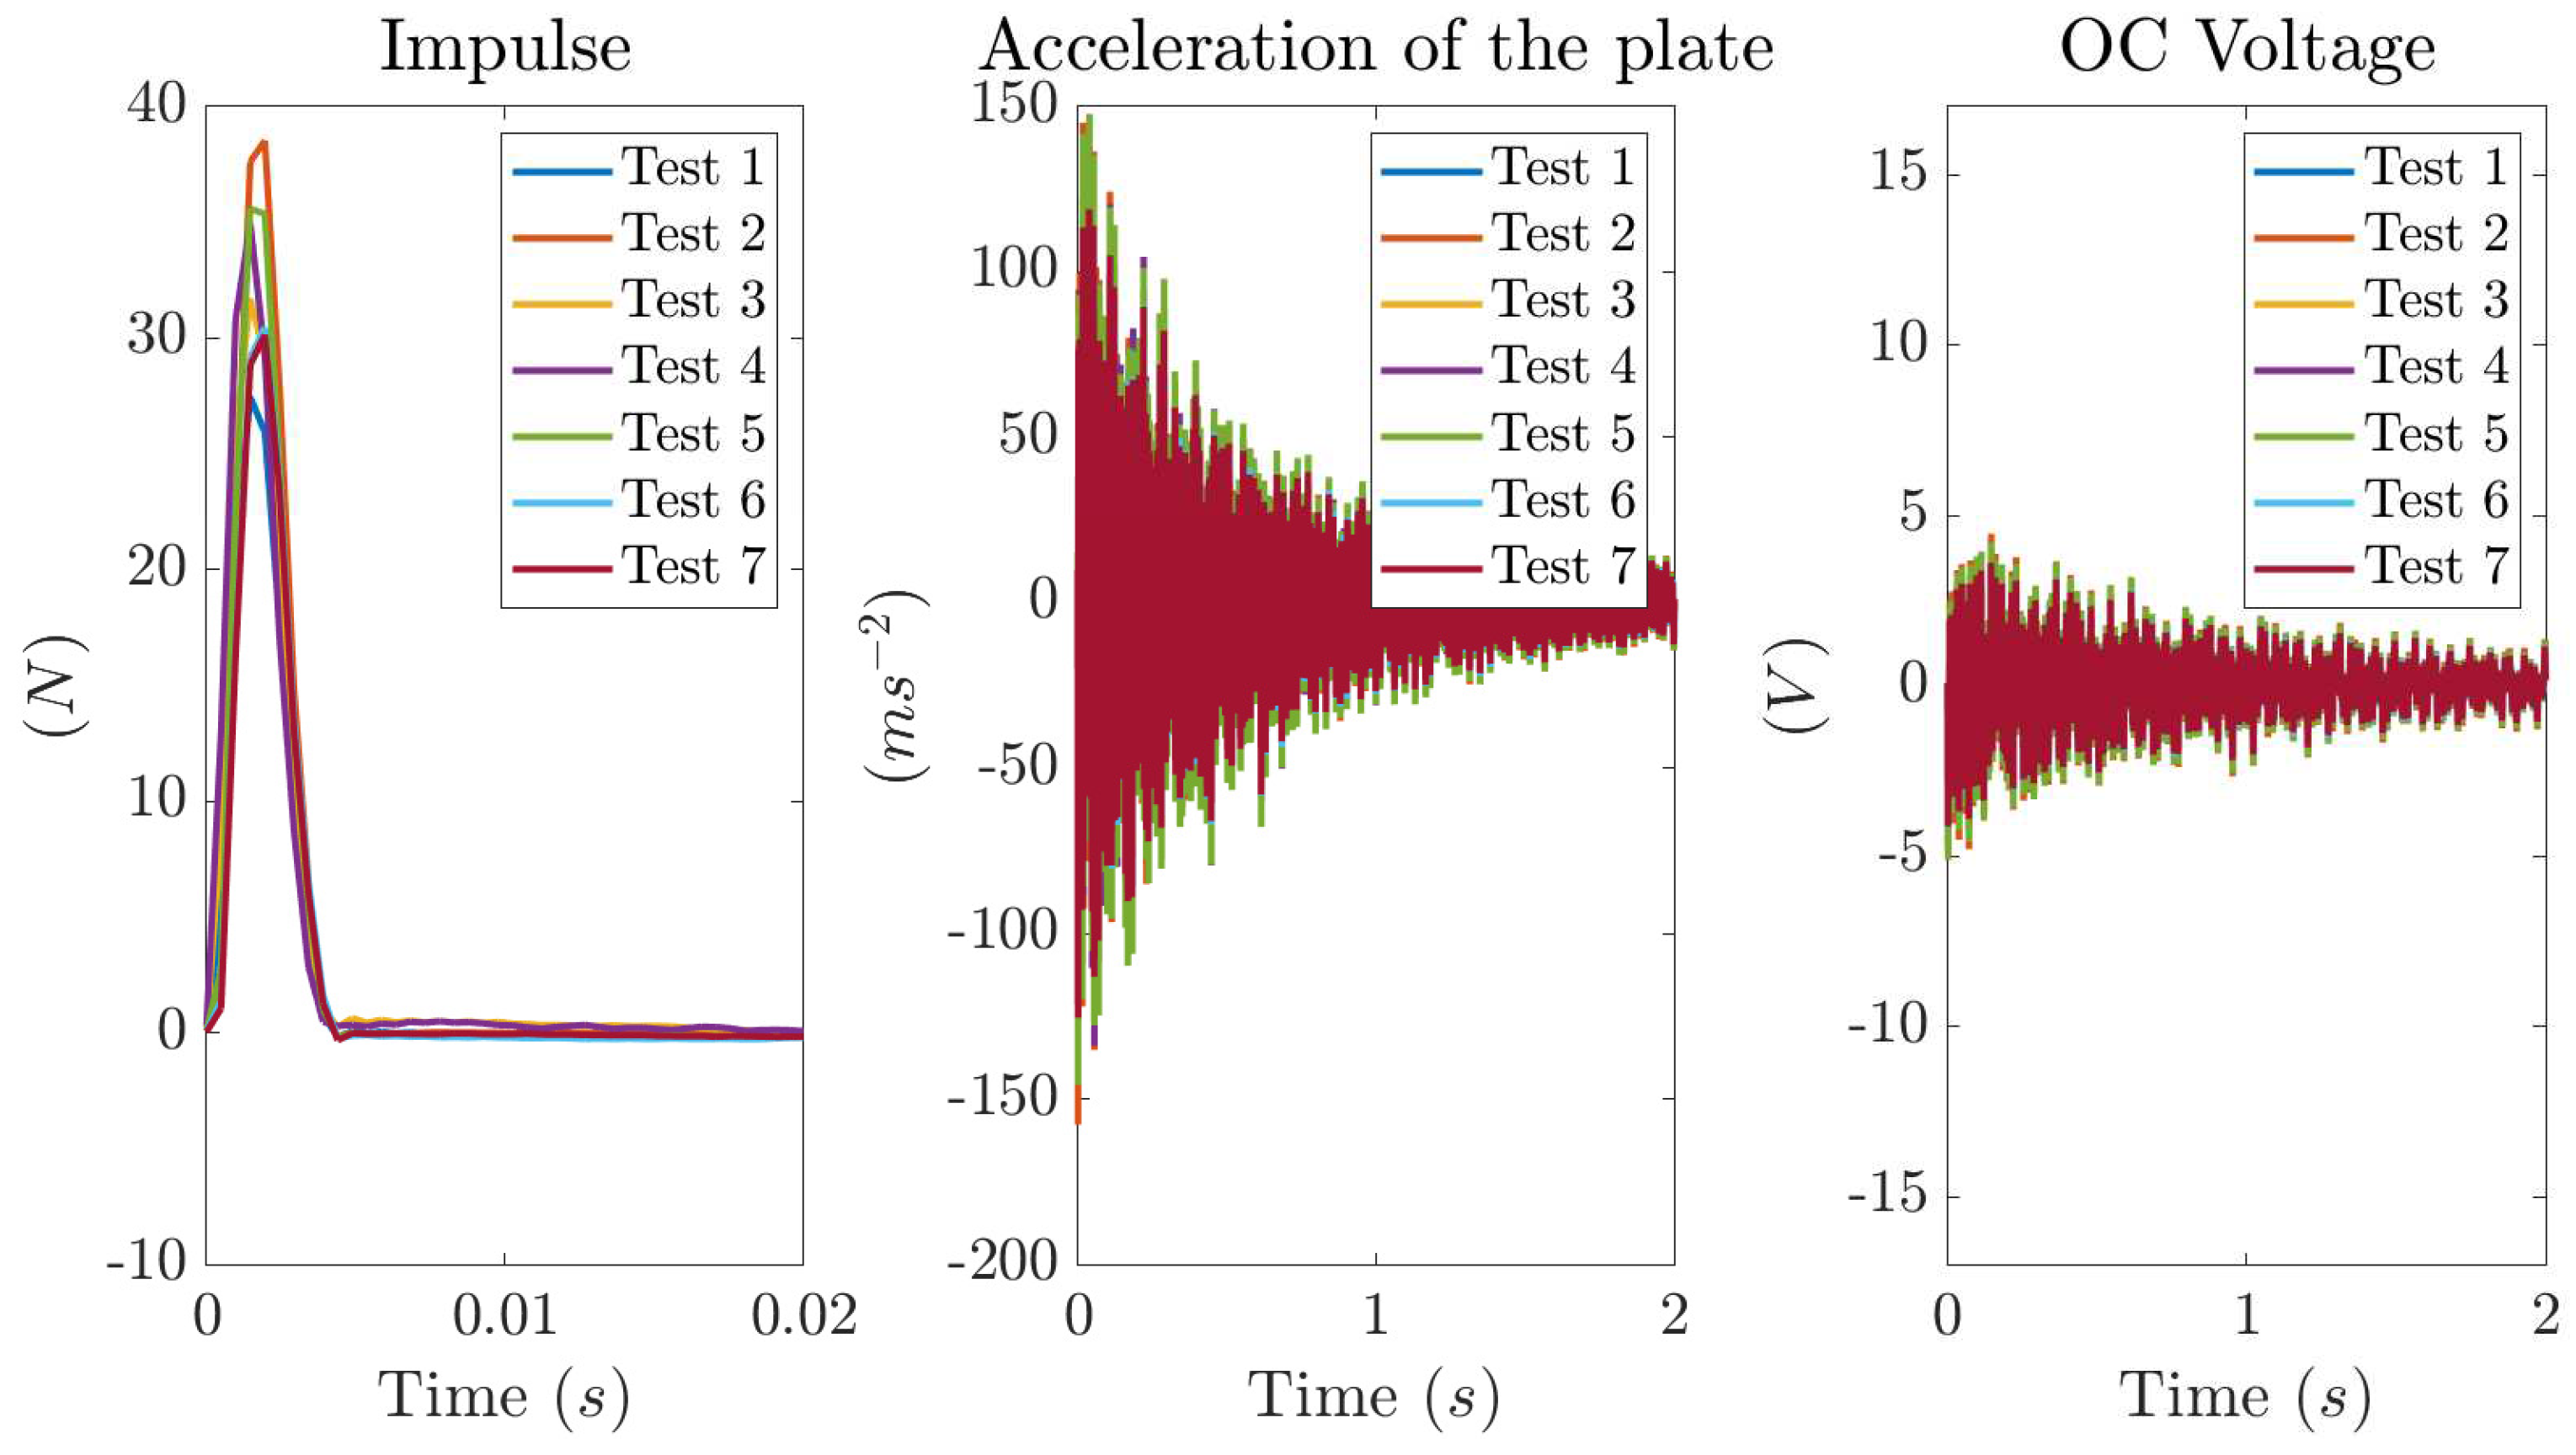
Figure 13.
Experimental results obtained by means of an impulse applied at the center of the plate witch CPDVA: impulse (left), acceleration at the center of the plate (center) and OC voltage generated by the CPDVA (right).
Figure 13.
Experimental results obtained by means of an impulse applied at the center of the plate witch CPDVA: impulse (left), acceleration at the center of the plate (center) and OC voltage generated by the CPDVA (right).
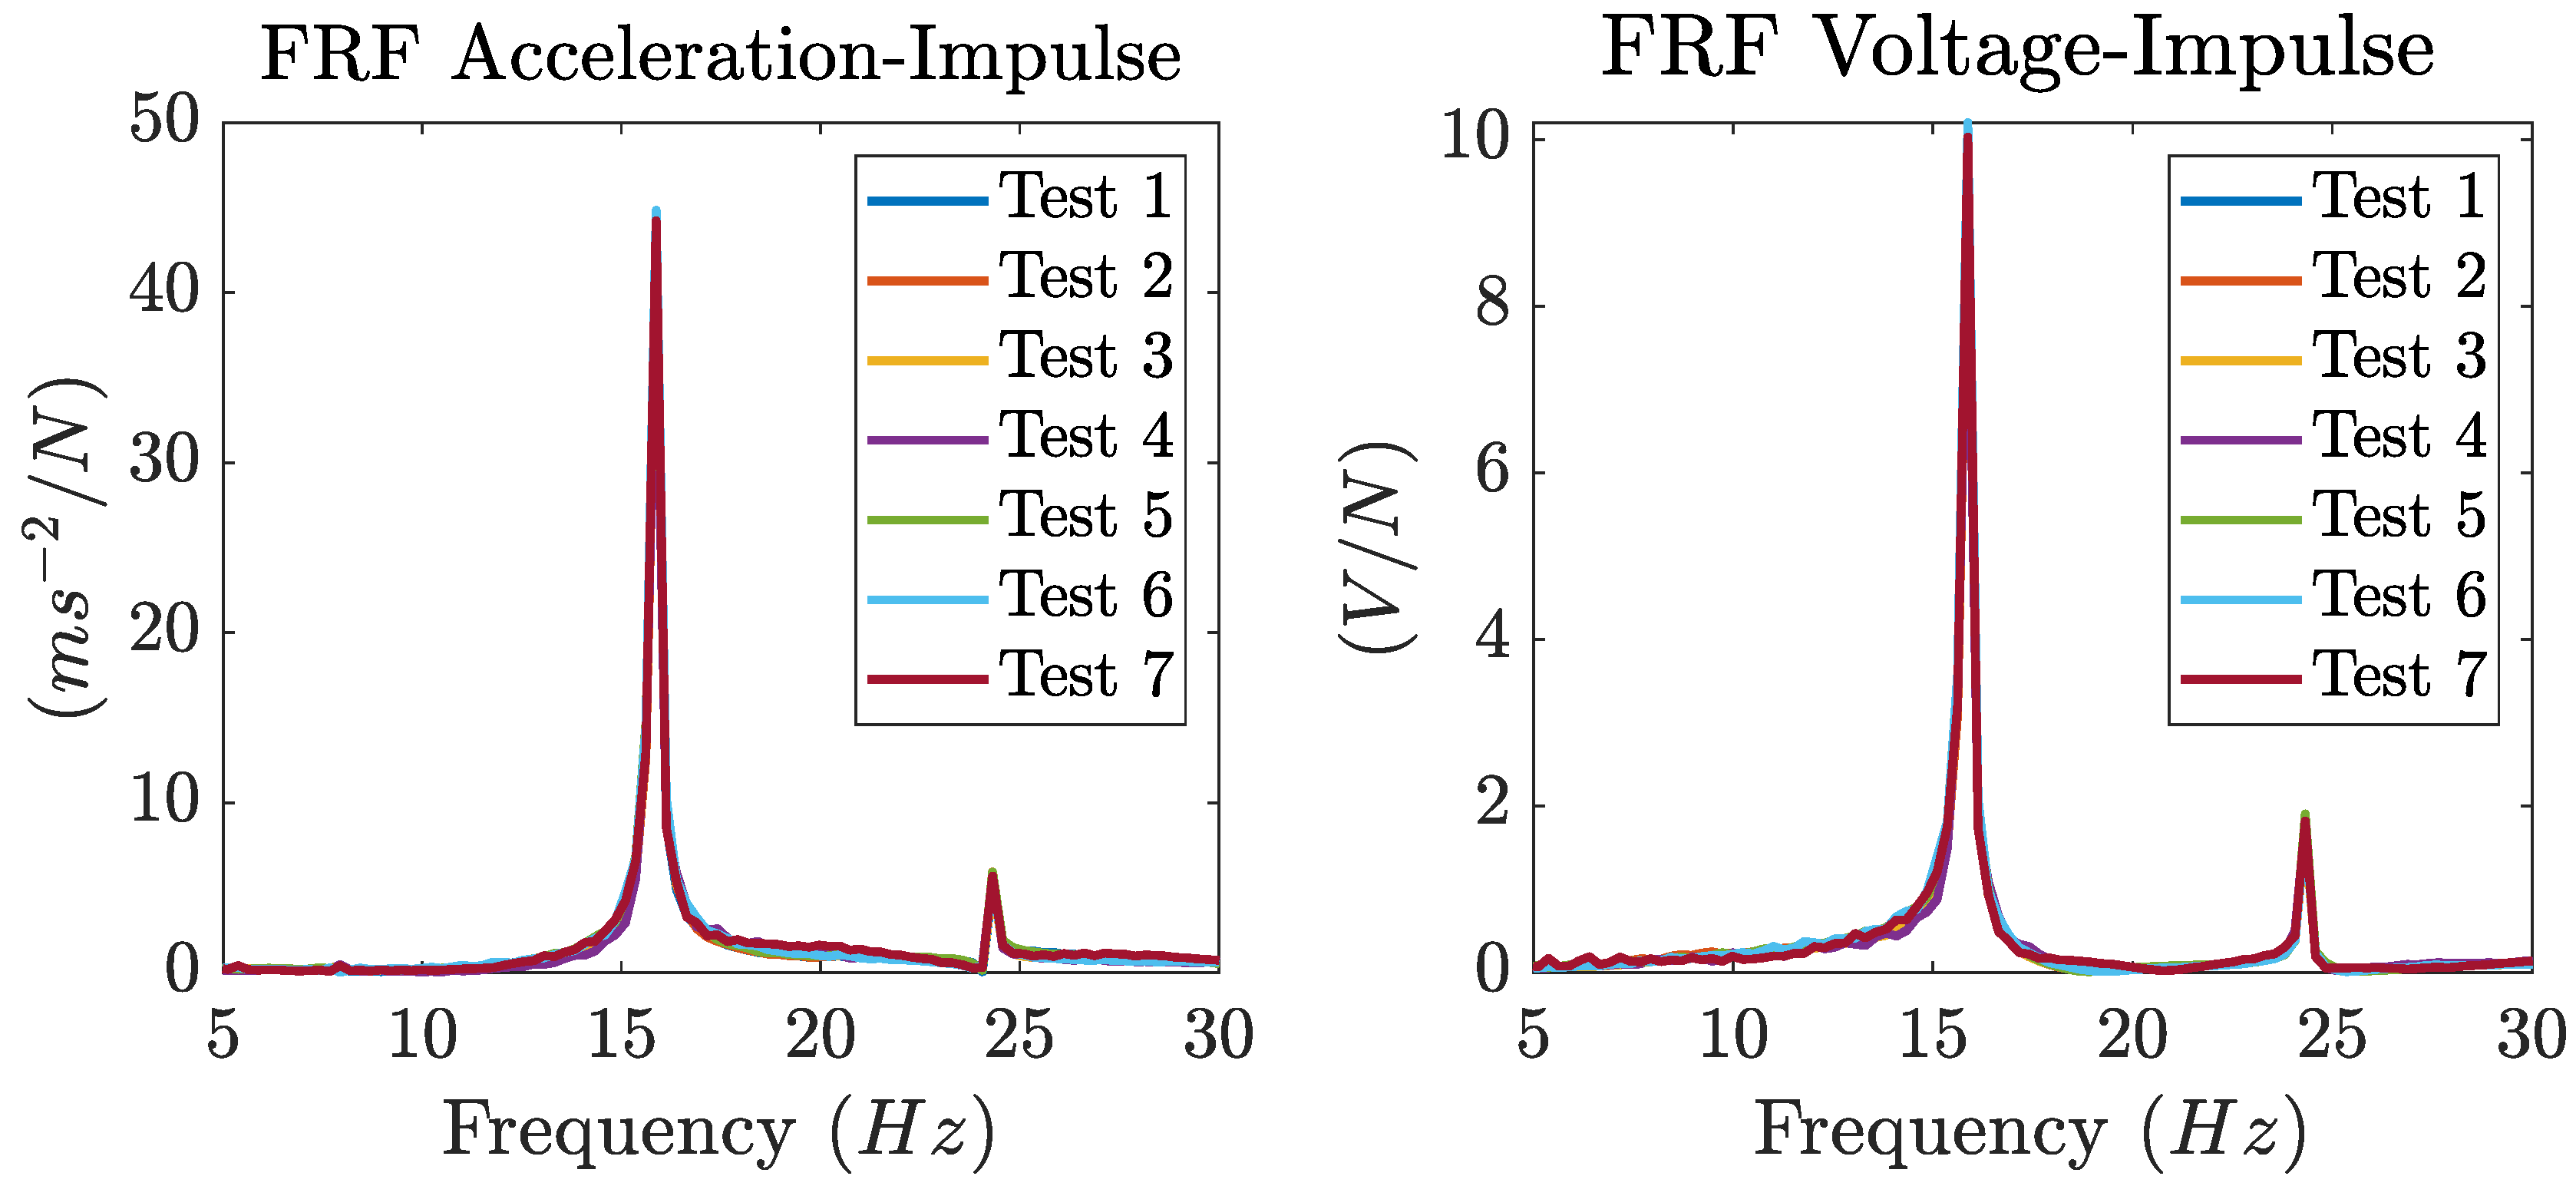
Figure 14.
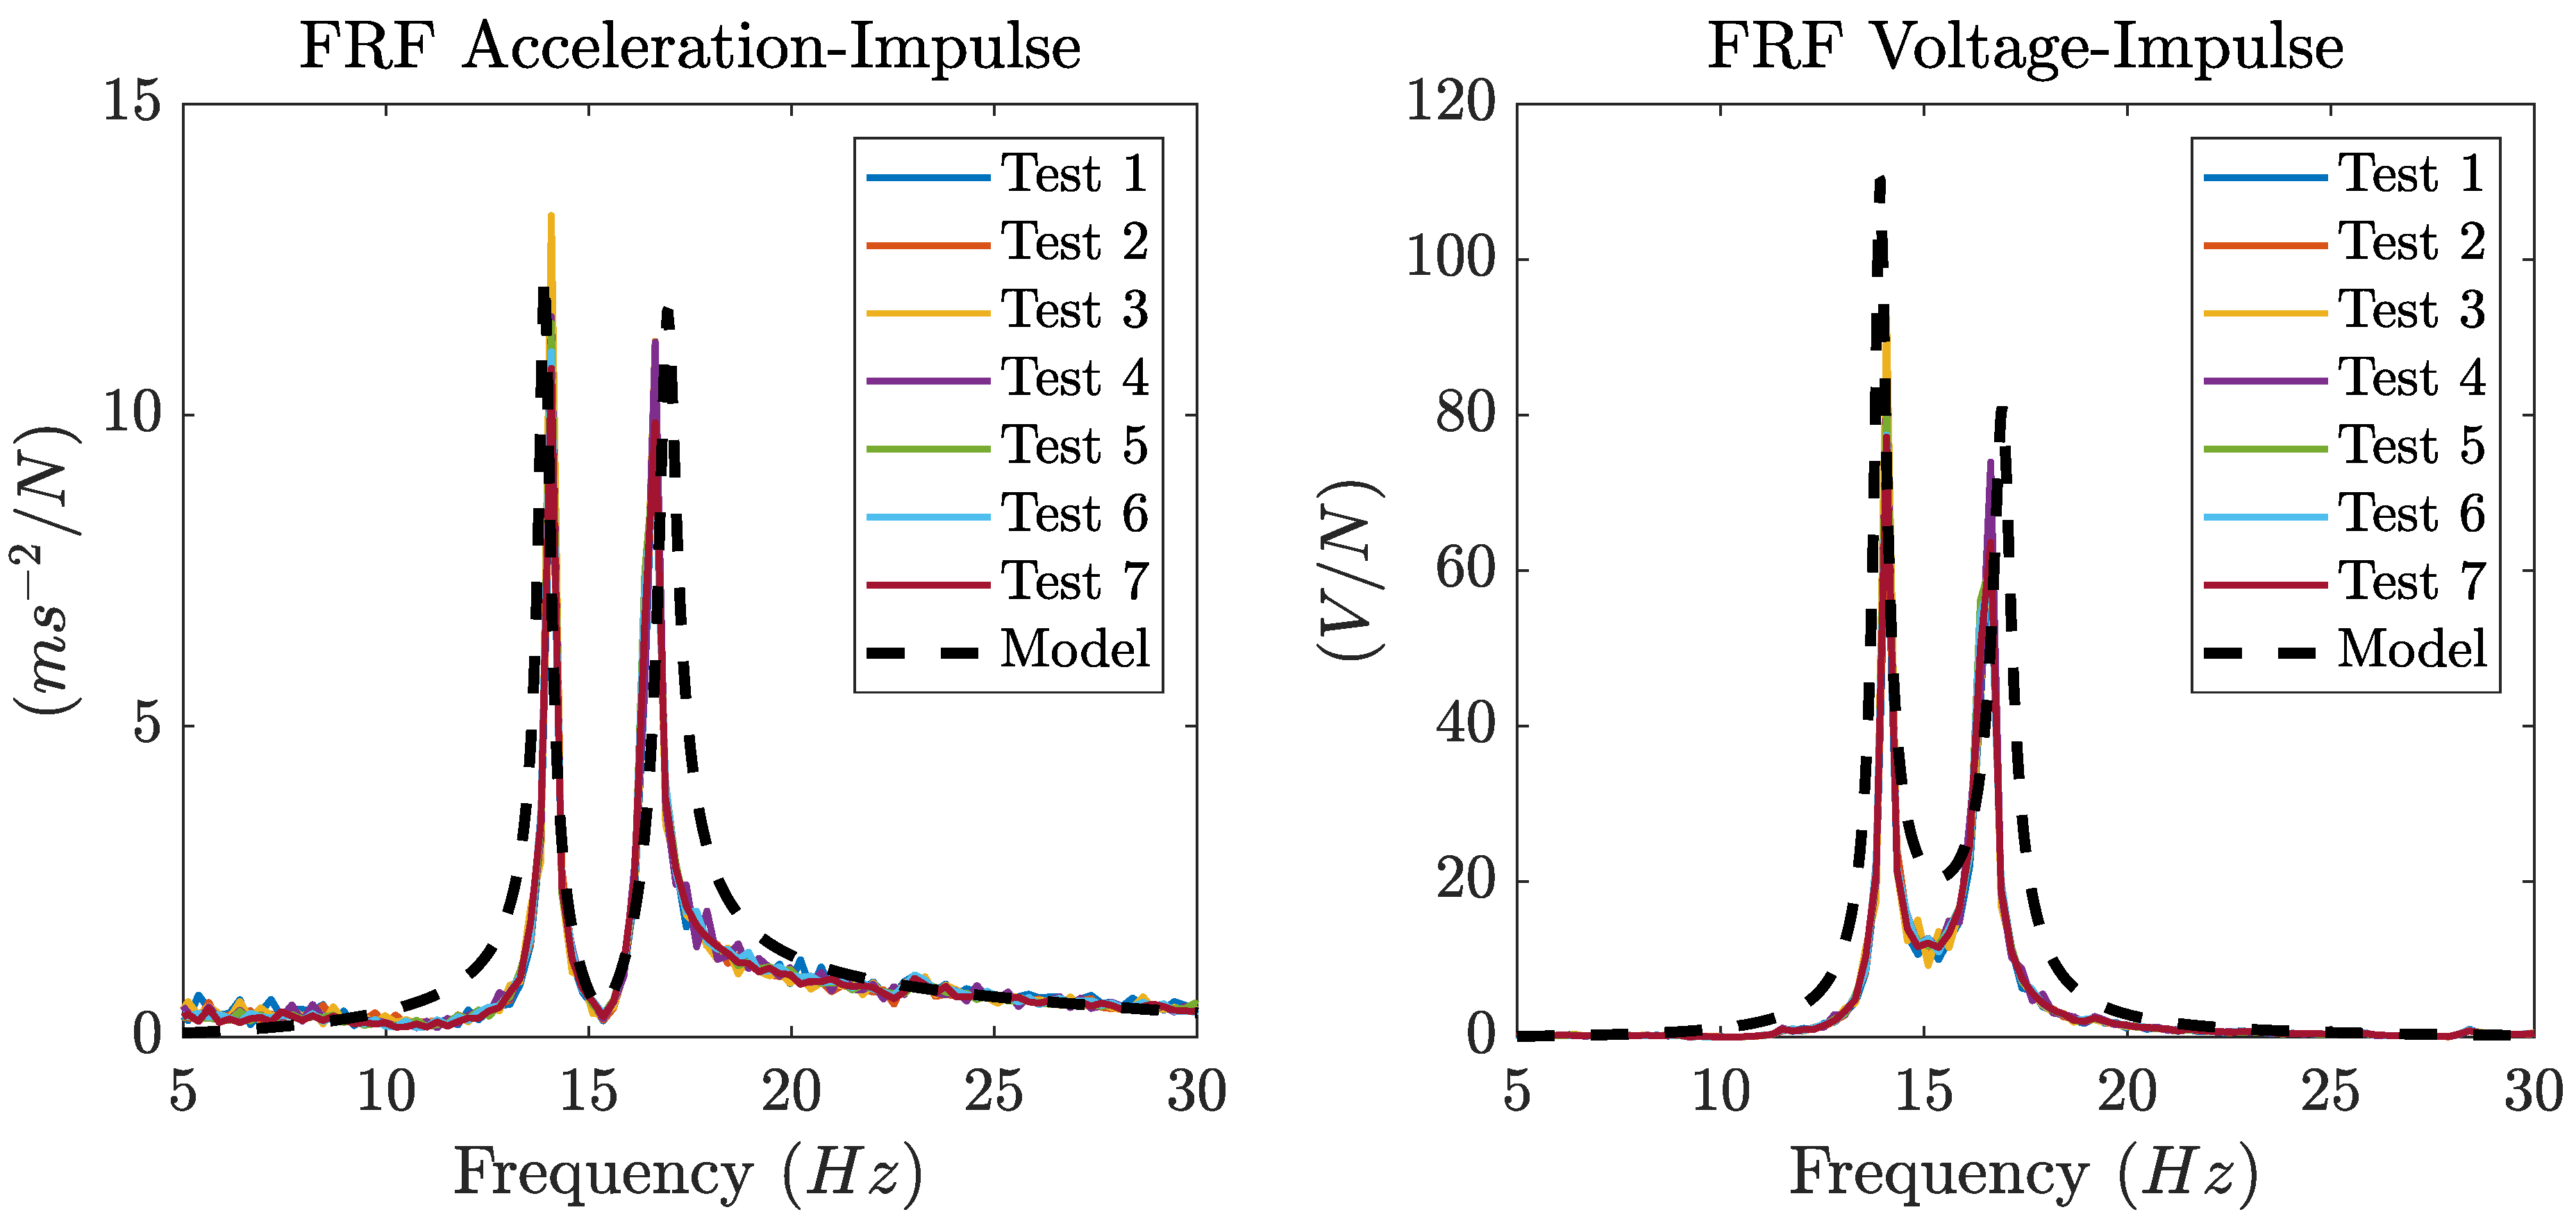
Magnitude of the FRF between the acceleration at the center of the plate and the impulse (left) and magnitude of the FRF between the the OC voltage generated by the CPDVA and the impulse (right). Experimental and predicted FRF for the impulse applied at the center of the plate.
Figure 14.
Magnitude of the FRF between the acceleration at the center of the plate and the impulse (left) and magnitude of the FRF between the the OC voltage generated by the CPDVA and the impulse (right). Experimental and predicted FRF for the impulse applied at the center of the plate.
Figure 15.
Experimental results obtained by means of an impulse applied at the center of the plate with the piezoelectric patch directly bonded to the plate: impulse (left), acceleration at the center of the plate (center) and OC voltage generated by the patch (right).
Figure 15.
Experimental results obtained by means of an impulse applied at the center of the plate with the piezoelectric patch directly bonded to the plate: impulse (left), acceleration at the center of the plate (center) and OC voltage generated by the patch (right).
Figure 16.
Magnitude of the FRF between the acceleration at the center of the plate and the impulse (left) and the magnitude of the FRF between the OC voltage generated by the piezoelectric patch bonded to the plate and the impulse (right). Experimental and predicted FRF for the impulse applied at the center of the plate.
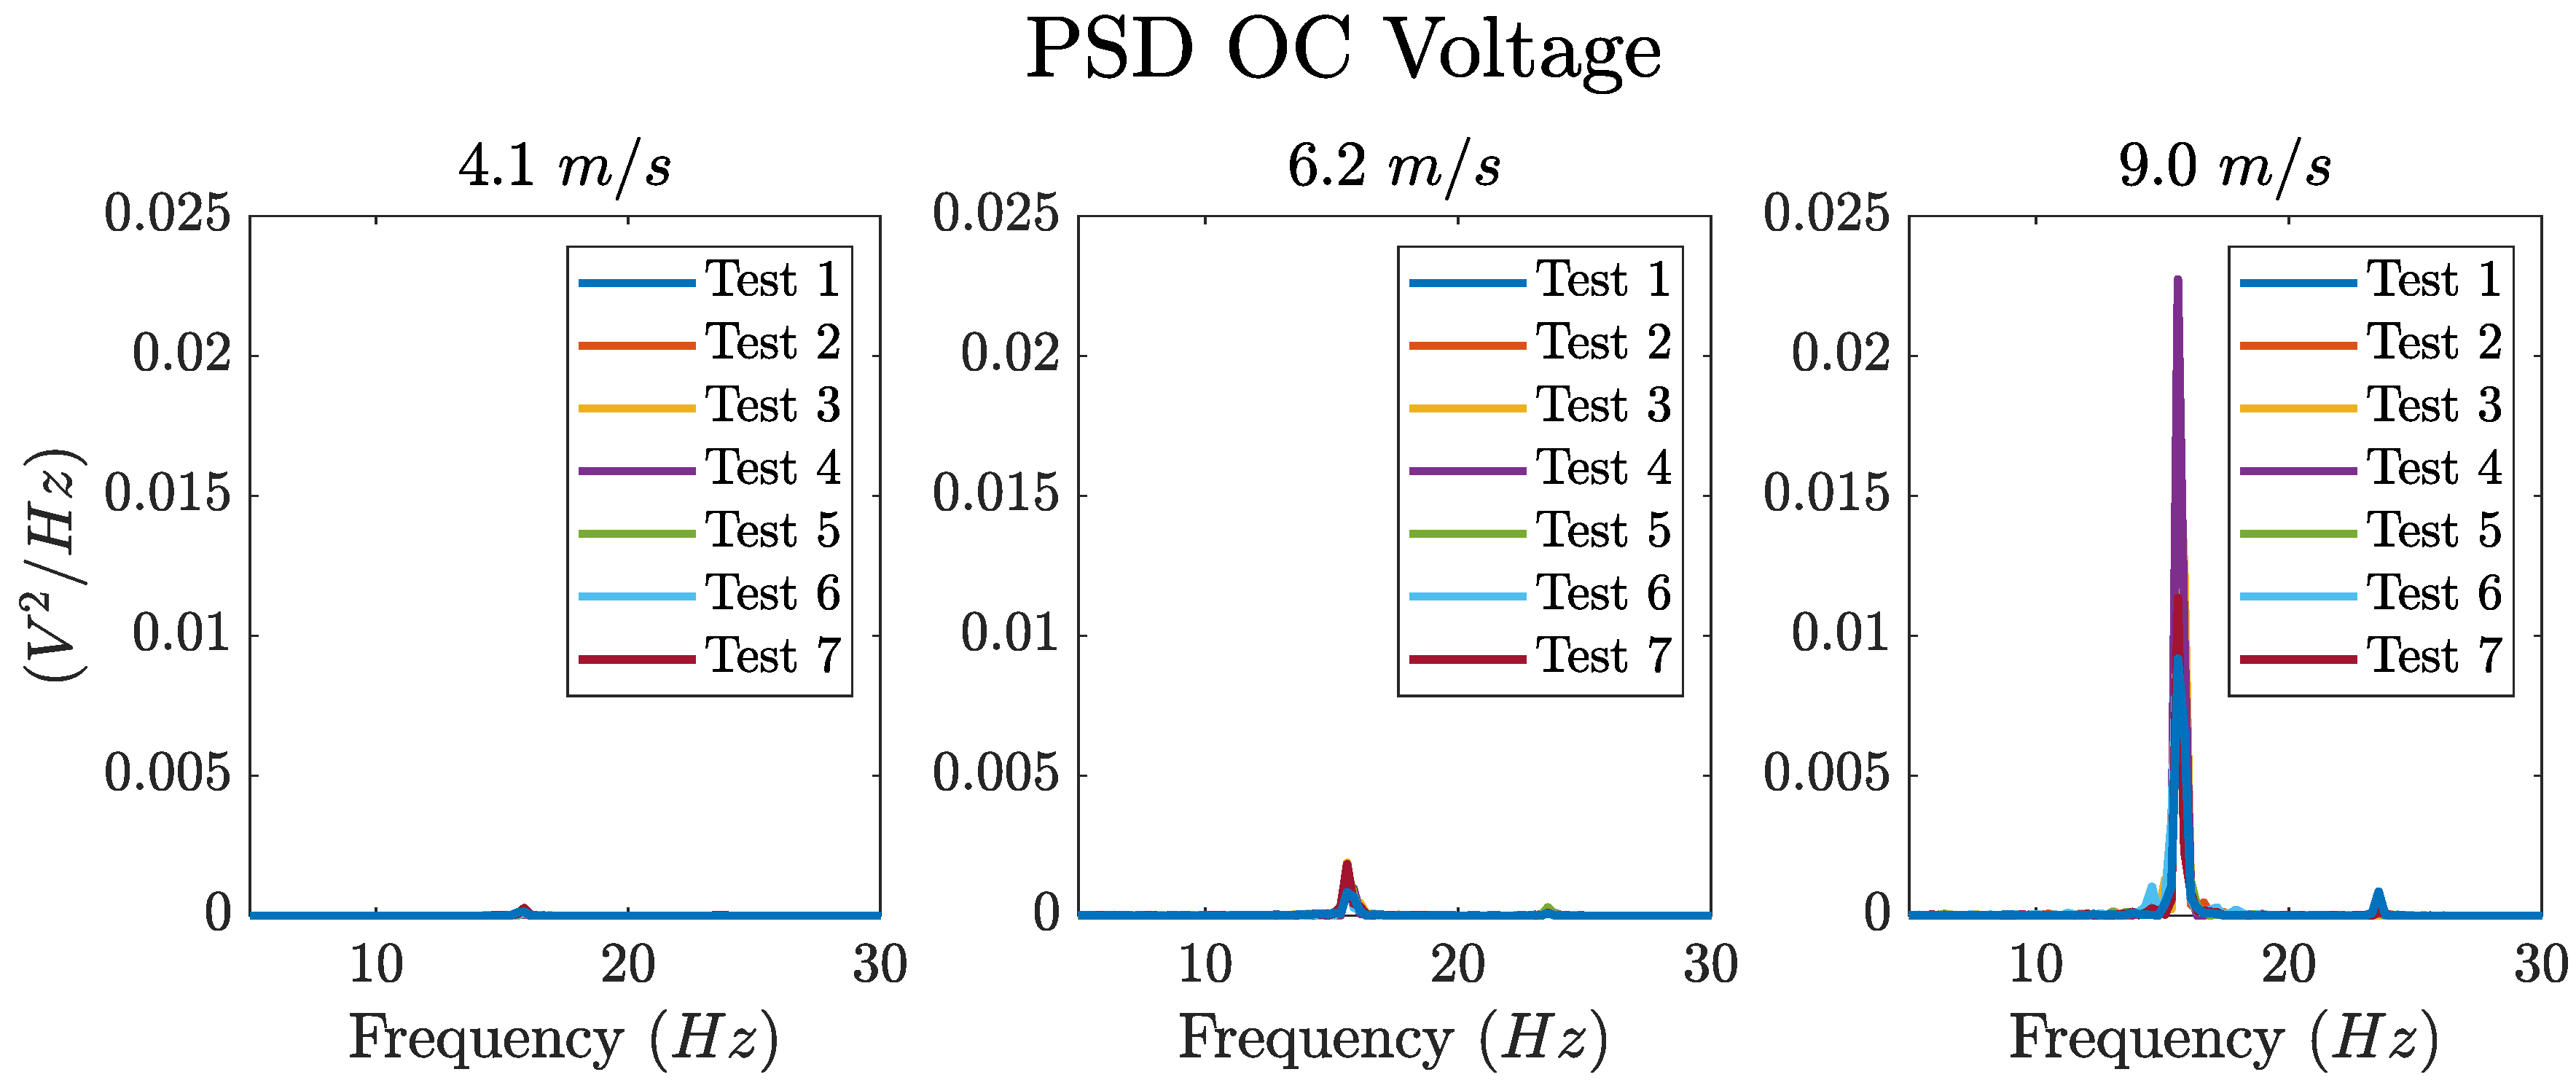
Figure 17.
PSD of the OC voltage generated by the patch directly bonded on the plate excited by the air jet. Experimental results are reported for three values of air velocity.
Figure 17.
PSD of the OC voltage generated by the patch directly bonded on the plate excited by the air jet. Experimental results are reported for three values of air velocity.
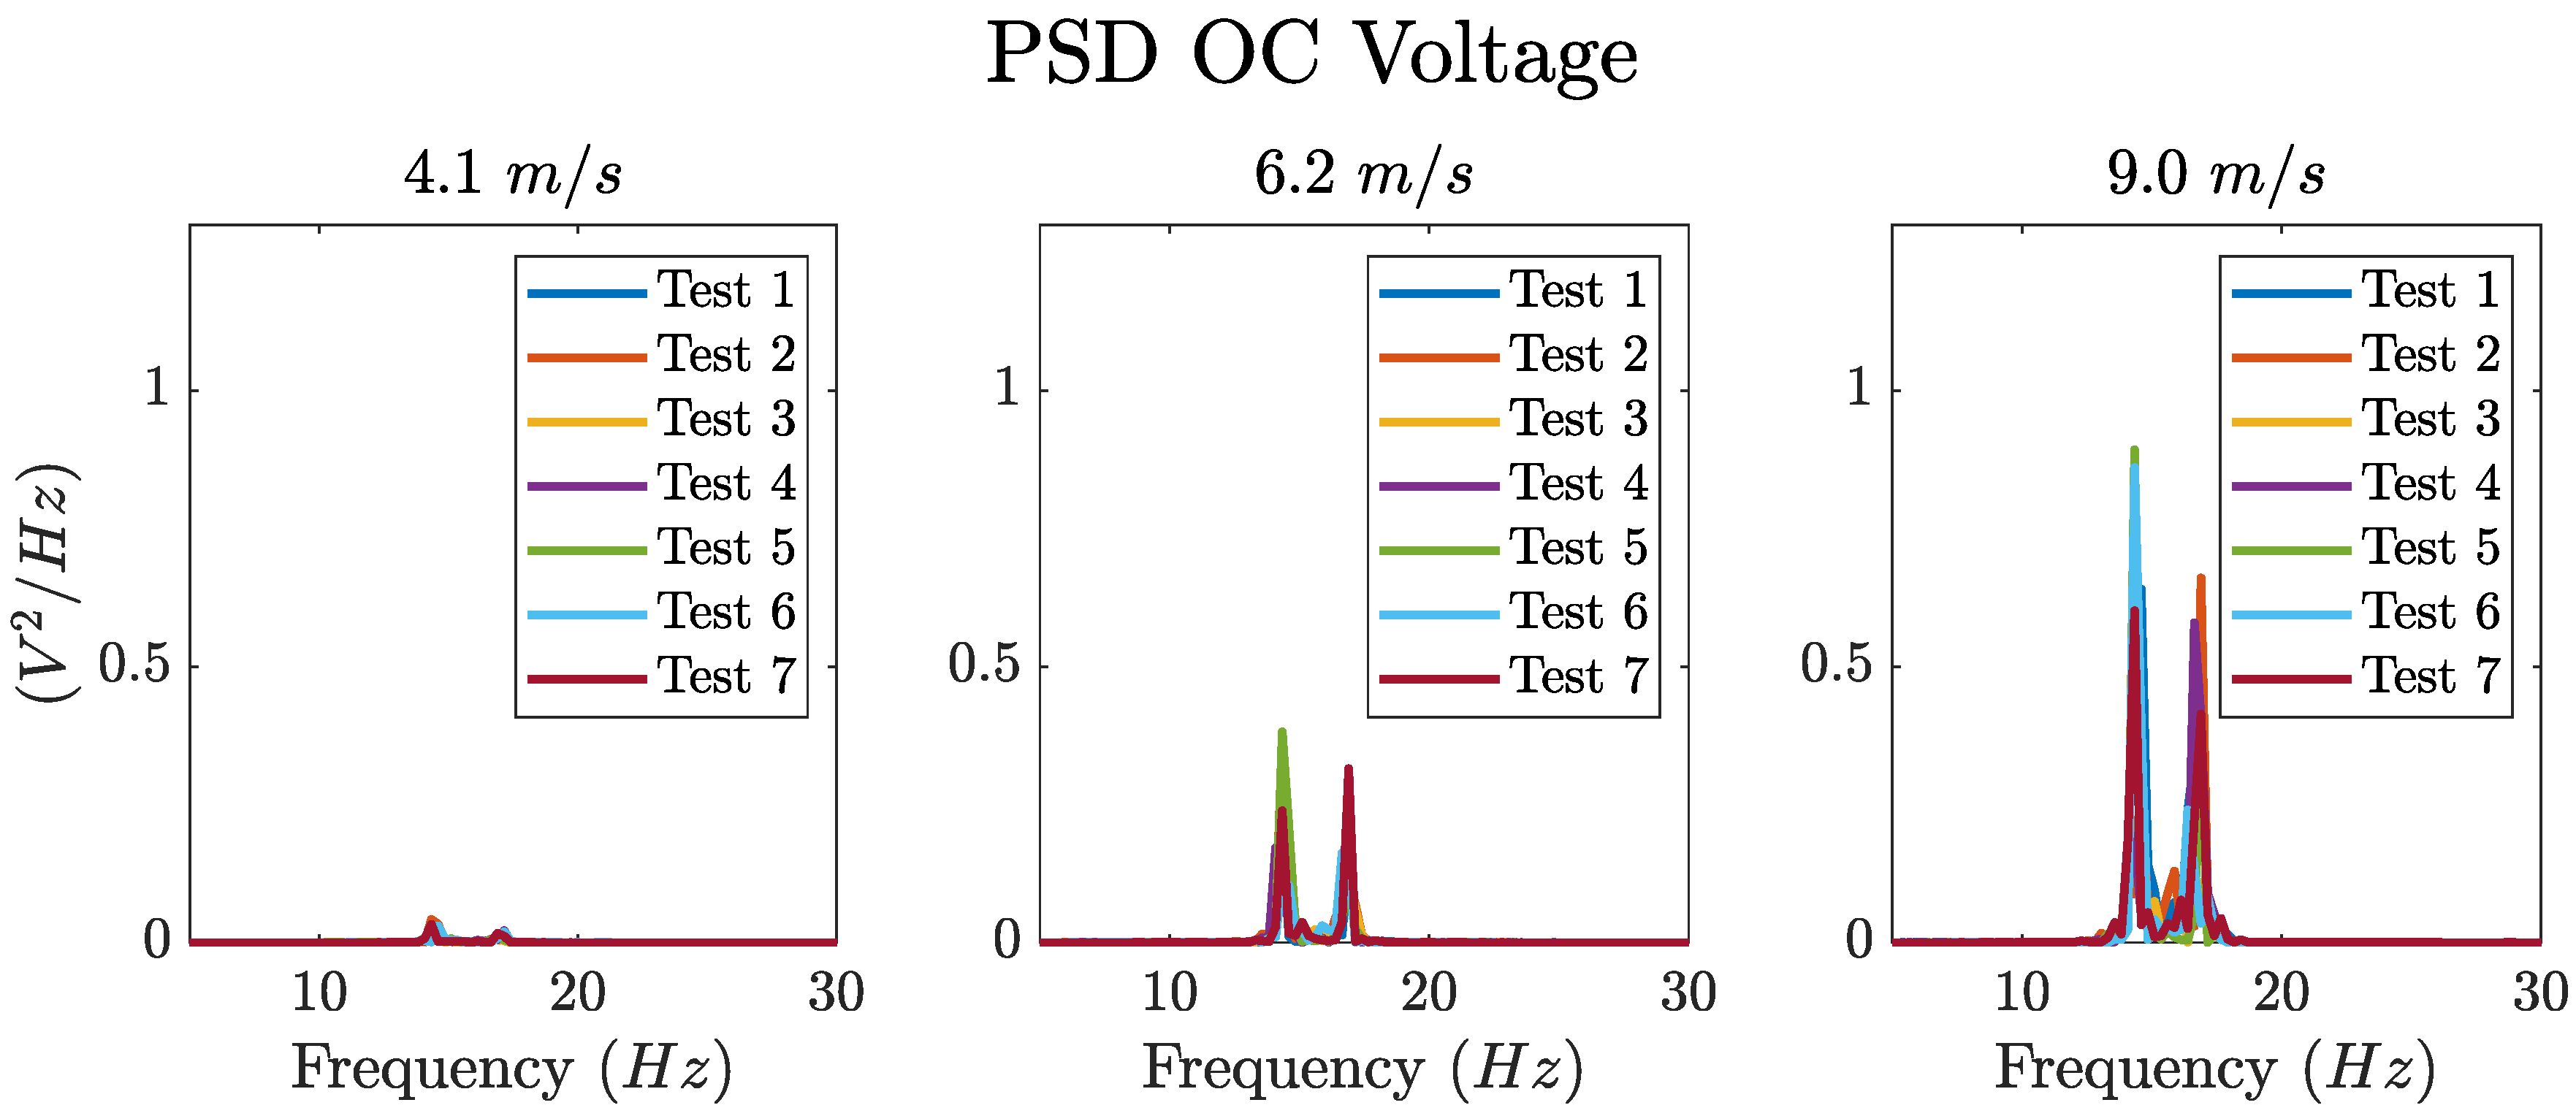
Figure 18.
PSD of the OC voltage generated by the CPDVA excited by the air jet. Experimental results are reported for three values of air velocity.
Figure 18.
PSD of the OC voltage generated by the CPDVA excited by the air jet. Experimental results are reported for three values of air velocity.
Table 1.
Calculated natural frequency and m-n combination for the first six plate modes.
Table 1.
Calculated natural frequency and m-n combination for the first six plate modes.
| mode number (i) |
m |
n |
frequency [Hz] |
| 1 |
2 |
0 |
16.49 |
| 2 |
2 |
1 |
23.89 |
| 3 |
3 |
0 |
45.45 |
| 4 |
3 |
1 |
56.40 |
| 5 |
2 |
2 |
61.27 |
| 6 |
4 |
0 |
89.08 |
Table 2.
Parameters of the M2814P2C-01 cantilever harvester.
Table 2.
Parameters of the M2814P2C-01 cantilever harvester.
| Structural layer length |
|
| Structural layer thickness |
|
| Structural layer width |
|
| Structural layer Elastic modulus |
|
| Structural layer density |
|
| Piezoelectric patch length |
|
| Piezoelectric patch thickness |
|
| Piezoelectric patch width |
|
| Piezoelectric patch Elastic modulus |
|
| Piezoelectric patch density |
|
| Piezoelectric patch capacitance |
|
| Piezoelectric constant
|
|
