1. Scientific Quality; Knowledge; Democratization; Citations; Scientific CommunicationIntroduction
The COVID-19 pandemic has represented a turning point in contemporary history, profoundly impacting all sectors, including academia. In this context, scholarly communication has undergone a significant transformation, particularly in the field of open access (OA). This study focuses on Ecuador's presence in the Web of Science (WoS) from open access in the post-pandemic period 2019-2021, exploring how the global crisis has accelerated the adoption of open access practices and influenced the country's scientific production [
1,
2].
With the choice of WoS as the main source of data, given its recognized integrity and coverage in the global scientific literature [
3,
4], the study embarked on a comprehensive analysis. Through a meticulous search strategy, 24,502 articles were initially identified, which were then reduced to 18,332 after a filtering process, finally focusing on 9,085 publications from the post-pandemic period.
The R programming language was used, supplemented with specialized tools for various functions, from data manipulation to advanced visualization [
5]. This approach allowed a careful evaluation of the variables by means of the Bonferroni test (D'Isanto et al., 2023), with a confidence level of 95%, in addition the use of the representation of the dataset by means of an HJ-Biplot allows a visualization and an understanding of the migratory dynamics of the variables.
This change or migration towards more open models of higher quality research allows universities to have greater representation in the best databases in the world and in turn a higher level of citation and accessibility, despite the absence of specific regulations that promote open access in Ecuador. The study offers a clear vision of the evolution and impact of Ecuadorian scientific production in the global scenario, underlining the influence of open access on scientific collaboration and the equitable distribution of knowledge [
6].
State of the Art
The COVID-19 pandemic has catalyzed significant changes in scholarly communication, driving the open access (OA) movement. This change has been reflected in the growing adoption of OA policies by academic institutions and publishers worldwide, with a focus on the democratization of knowledge [
7].
In Ecuador, the transition to OA has been remarkable, especially in the context of the global health crisis. Universities and research centers have begun to adopt OA practices, which has resulted in an increase in publications on accessible platforms [
8].
The Web of Science, as the main repository of scientific literature, has registered an increase in contributions from Ecuadorian authors during and after the pandemic. This increase is indicative of the growing visibility and international impact of Ecuadorian research [
9].
Despite progress, there are challenges to comprehensive OA adoption in Ecuador, including a lack of standardized policies and funding to cover item processing fees (APCs). However, these barriers also present opportunities to develop sustainable OA models that align with local needs and capacities [
10], the future of OA in Ecuador, especially in the post-COVID-19 landscape, looks promising.
Current trends are expected to lead to increased international scientific collaboration and greater inclusion of Ecuadorian research in global discussions [
11].
This study aims to analyze the presence of Ecuador in WoS from an open access perspective, using statistical tests, data visualization and a PCA Biplot representation to show university trends.
2. Methodology
We collected data from the source: Web Of Science with all its collections such as: SCIE, SSCI, AHCI, ESCI, CPCI, BKCI. The data were retrieved until August 17, 2023, the search was performed through the following equation: 'CU=(ECUADOR) AND PY=(2011-2021) AND DT=(Article)'.
The analysis was conducted from 2019-2021; multivariate statistical, bibliometric and data visualization techniques were used with the objective of analyzing the presence of Ecuador in the Web of Science (WoS) database. With an exclusive focus on the context of open access.
First, the Web of Science (WoS) scientific information database was chosen because of its recognized integrity and coverage of the global scientific literature and rigorous indexing criteria in the academic and research sphere [
12].
Keywords and descriptors related to Ecuador and open access were used, resulting in 24,502 articles. To consolidate the articles into a single data set, 25 batches of 1000 articles were downloaded and then, using a Linux virtual machine (Kali Linux), the batches were combined using the cat command.
Data wrangling techniques were used to read and clean the data. Once consolidated, any variable with repeated identifiers was eliminated, ensuring the accuracy and integrity of the data set. As a result of this process, the total number of articles was reduced from 24502 to 18332 (we will use the term observations in order to apply statistical analysis techniques to our data). For the study, we statified the data taking from the year 2019 to the year 2021. This leaves a total of 9085 data to be analyzed.
2.1. Analysis
For data analysis, the R programming language was used, complemented with various specialized tools:
dplyr: Facilitates data manipulation and transformation.
stringr: Helps in the management and manipulation of text strings.
openxlsx: Allows reading and writing Excel files.
ggplot2: Visualization tool for creating complex graphs.
reshape2: Used to restructure and aggregate data.
corrplot: Generates correlation graphs.
factoextra: Assists in extracting and visualizing results from various data analyses.
gridExtra: Provides functions to combine multiple 'ggplot' plots.
nbclust, cluster: Tools to determine the optimal number of clusters and perform cluster analysis.
cowplot: Improve and customize graphics.
pandas (Python): Data analysis library that provides flexible data structures.
These tools were used to segment and categorize Ecuador's universities according to their nature (public and private) and the type of access to their publications (open or subscription).
Through this approach, it was possible to evaluate the distribution of citations and their annual average, and to highlight publications under open access models [
13].
For an effective graphical representation of the results, advanced data visualization techniques were used. On the statistical side, a detailed analysis of qualitative and quantitative variables divided into factors or groups was carried out, implementing a Bonferroni test to identify significant differences in the number of citations between groups [
14].
To obtain a better representation of Universities and publication sources (Open Access and Subscription) this dataset was represented in a dynamic HJ-Biplot over the period 2019- 2021 [
15], the objective is to obtain the quality of the data representations with the following information:
1. Acute angles represent a strong direct correlation.
2. Obtuse angles represent an inverse correlation.
3. Right angles represent independence.
4. Distance between observations (universities) indicates similarity.
5. The length of the vectors approximate the standard deviation of the vectors.
3. Results
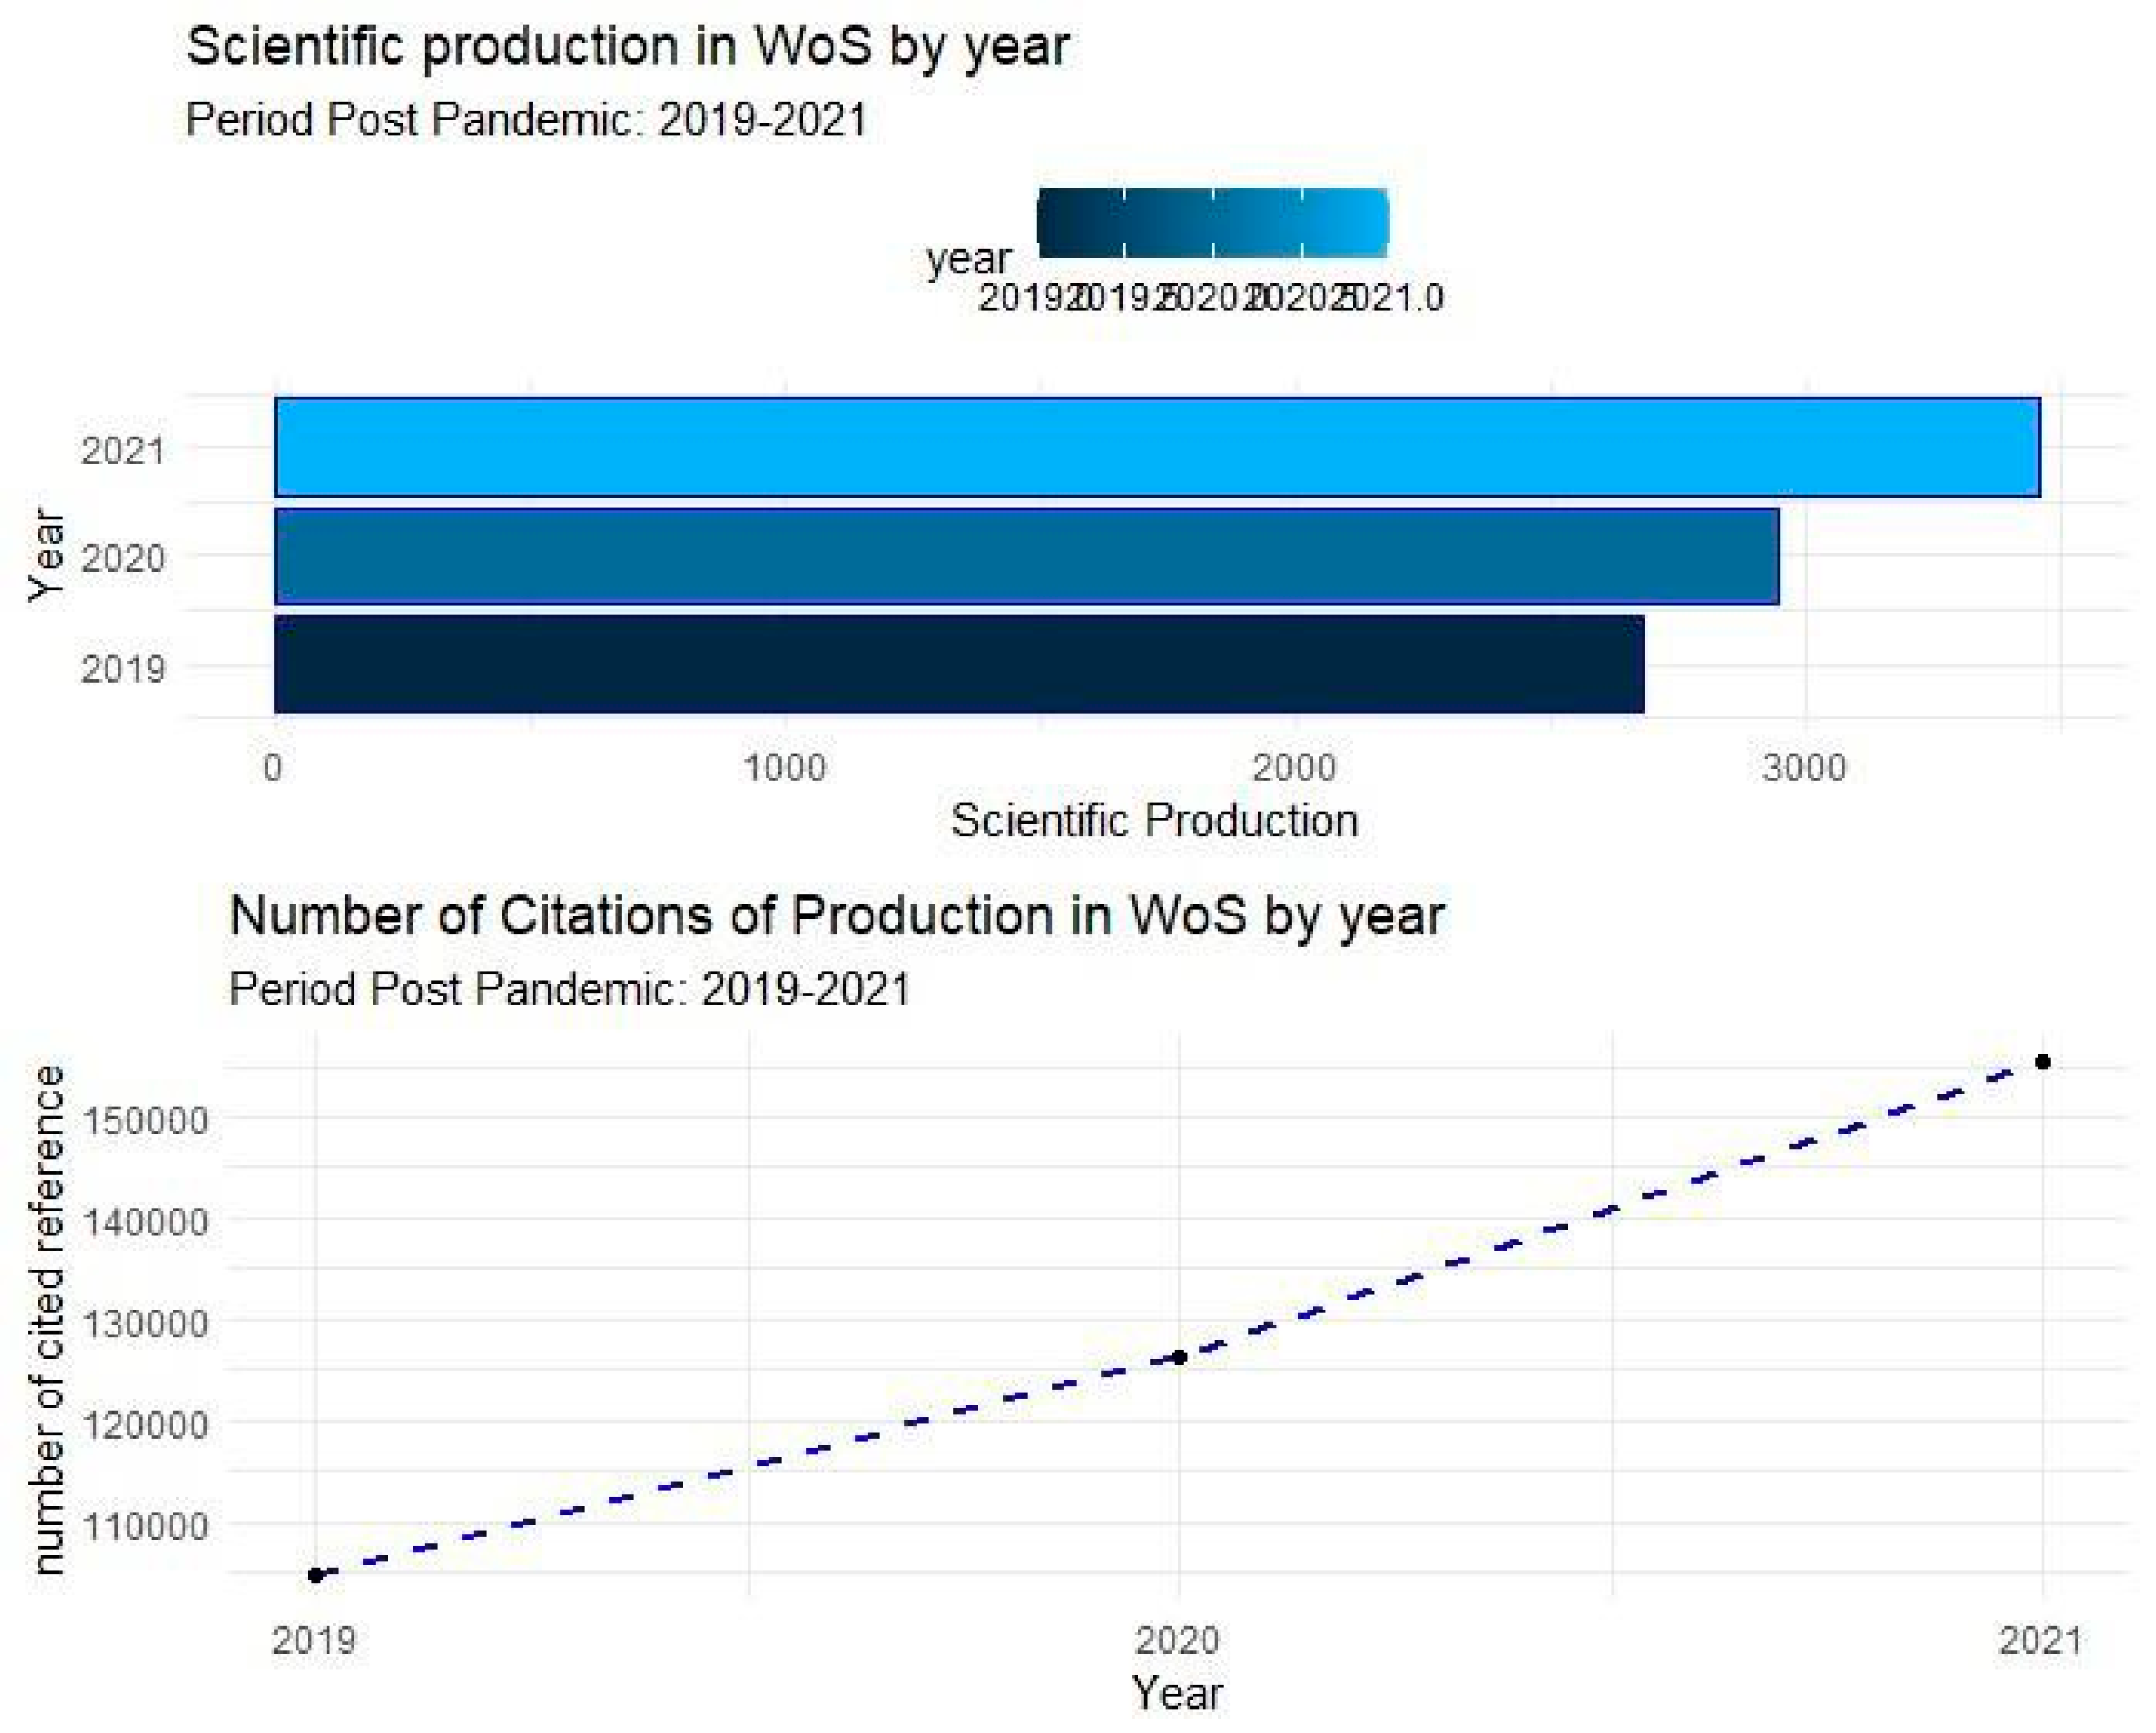
The scientific production and the number of citations of the publications of Ecuadorian universities in WoS has increased steadily in the post-pandemic period, as shown in
Figure 1.
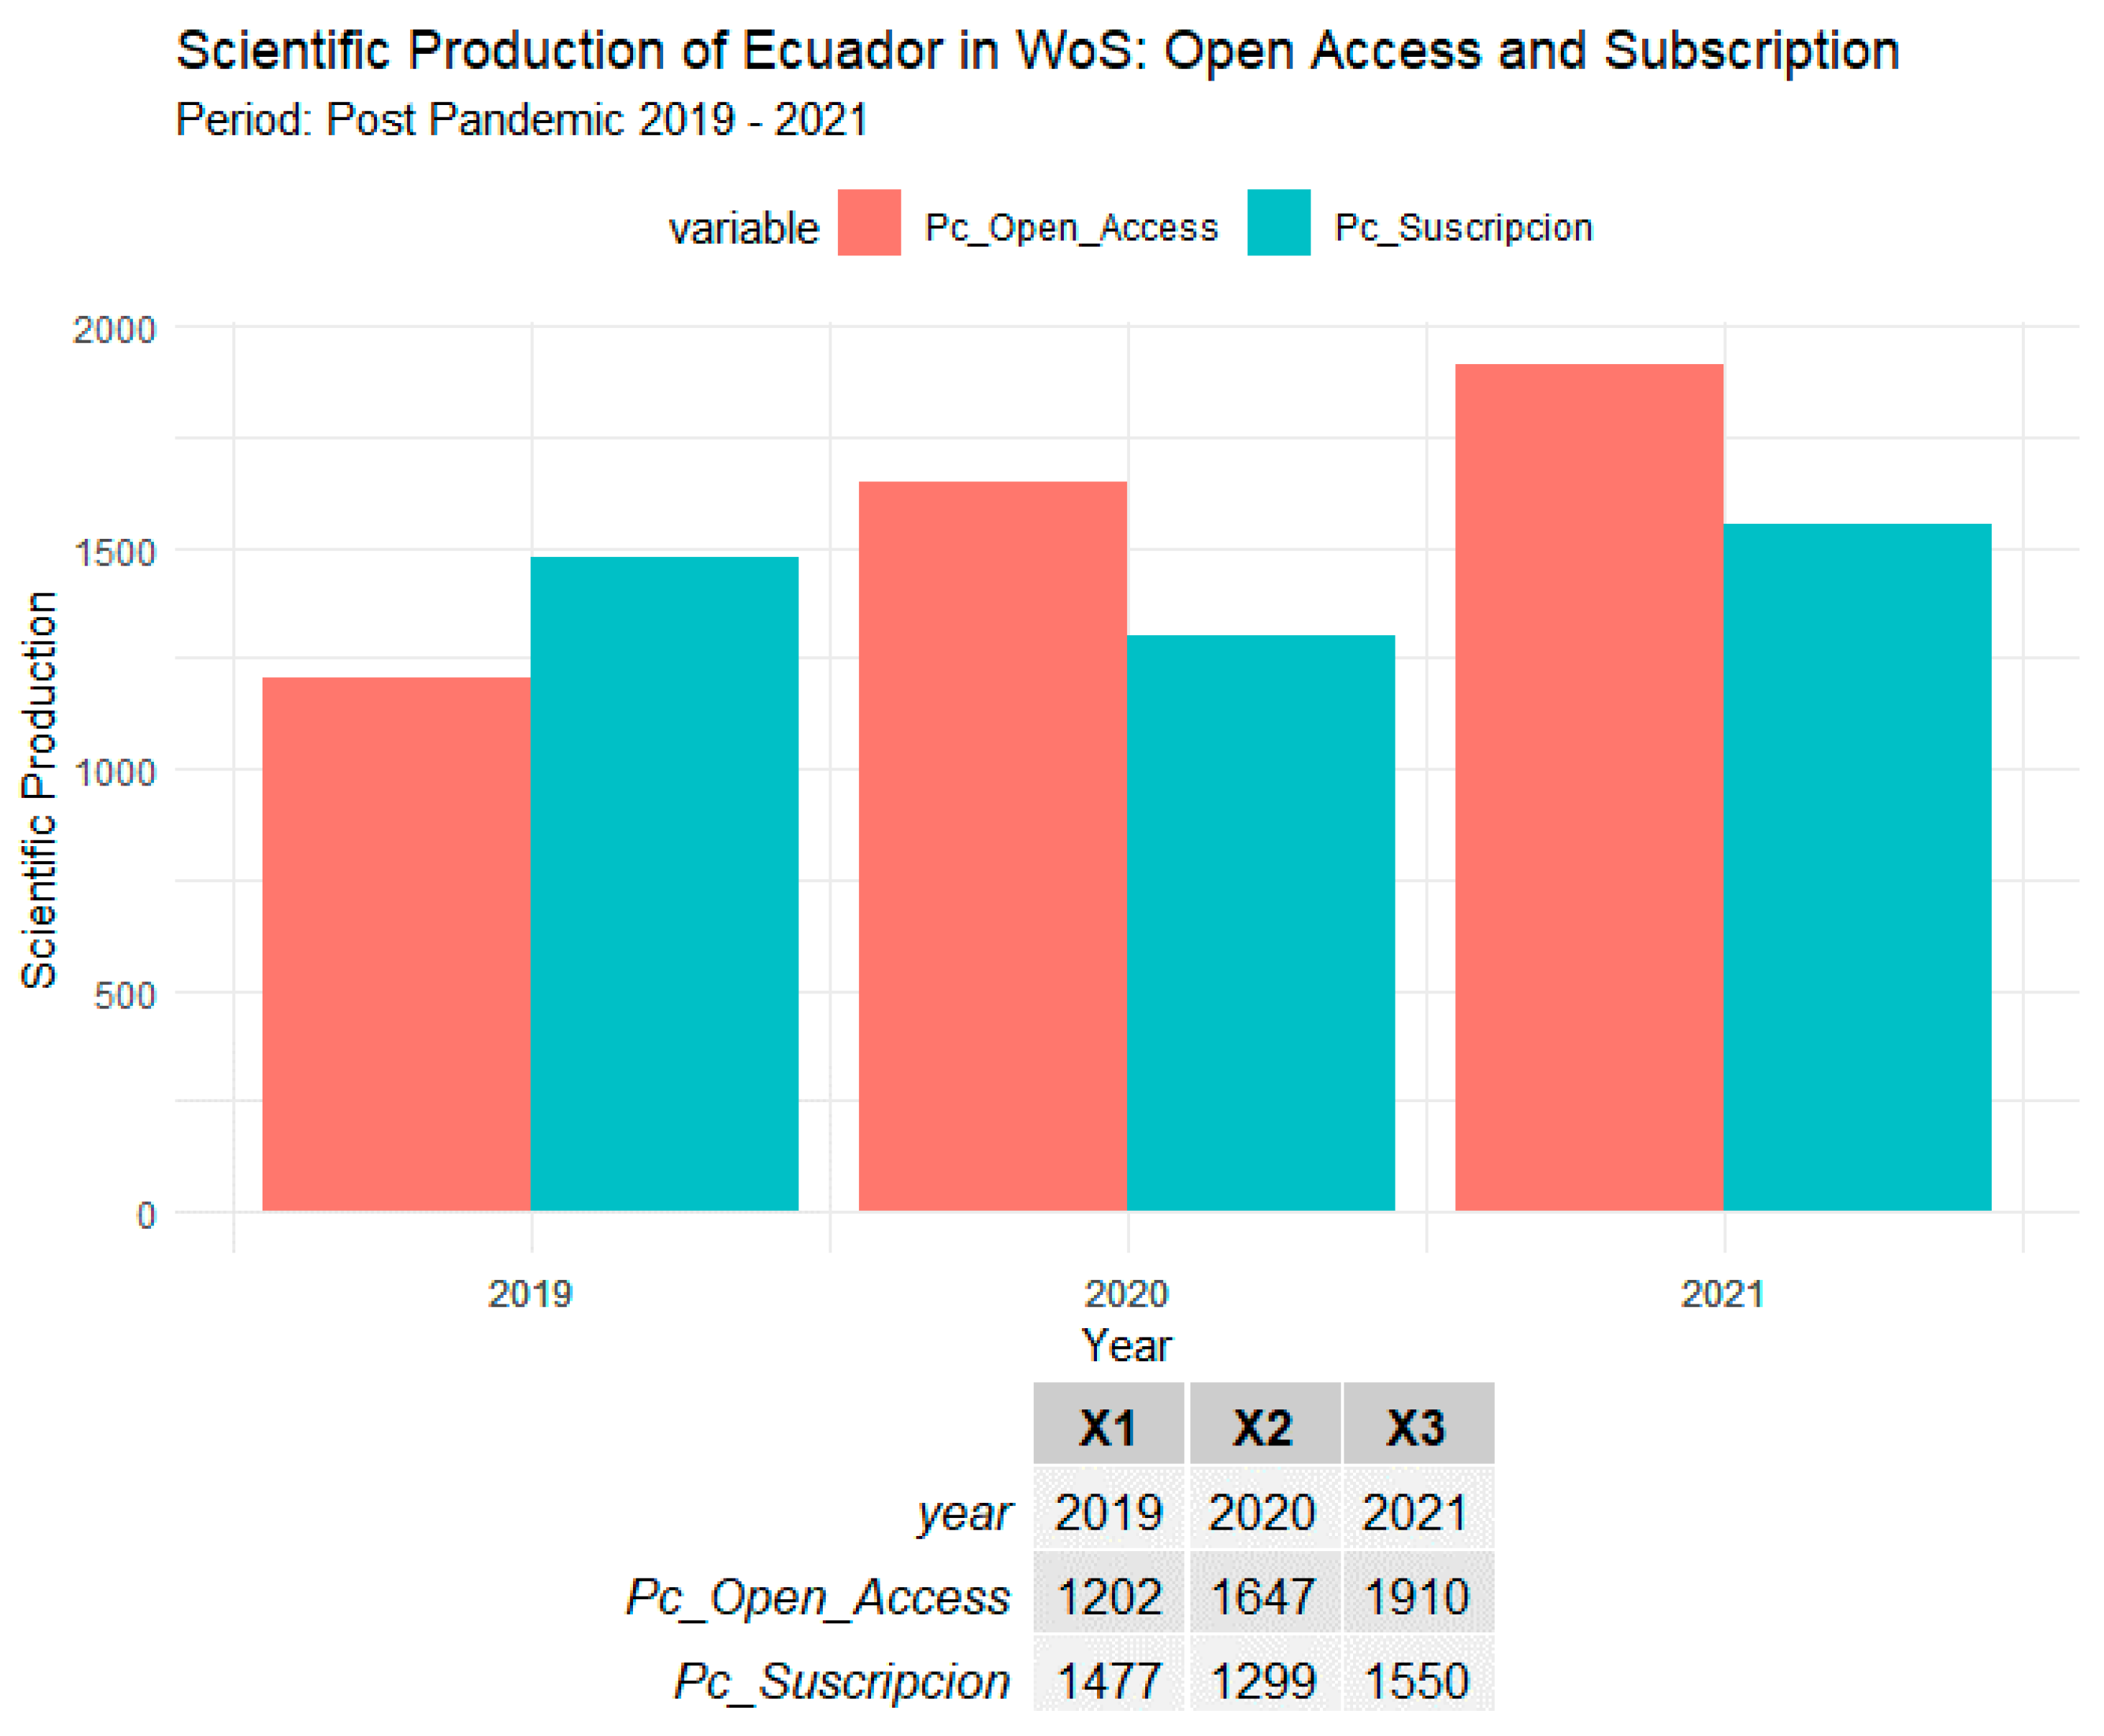
Regarding Ecuador's trend in open access, 4759 publications belong to Open Access journals out of a total of 9085 scientific articles. This implies that 52% of Ecuadorian publications in WoS in the period studied are under this modality, as shown in
Figure 2.
Until 2019 publications in subscription journals outnumbered those in open access journals, this has changed as of 2020. Regarding the number of citations of scientific publications, it can be seen in
Figure 3 that publications in open access journals receive more citations than those published in subscription journals.
These differences in citations were tested using a Bonferroni test at 95% confidence level. The results were found to be significant (𝑝 = 0)Thus, we confirmed that an article published in open access journals receives on average more citations than articles published in subscription journals.
Private institutions registered 3905 scientific publications in WoS, while public universities registered 3846 publications in the same database. 1,334 scientific publications are the result of collaboration between public and private universities. As shown in
Table 1, these figures represent 43%, 42% and 15% of the total, respectively.
Analyzing the trend of publications in open access,
Table 2 shows that, of the 3846 articles from Ecuadorian public universities, 2018 were published in open access journals and 1828 in subscription journals. Of the 3905 research papers from private universities, 1943 appeared in open access journals and 1962 in subscription journals. Finally, of the 1334 collaborative researches, 798 were published in open access journals and 536 in subscription journals.
Research published in open access journals constitutes 52.4%, 49.7% and 59.8% of the total number of publications in public, private and collaborative universities, respectively. This behavior demonstrates that open access is increasingly present in Ecuador's collaborative research ecosystems.
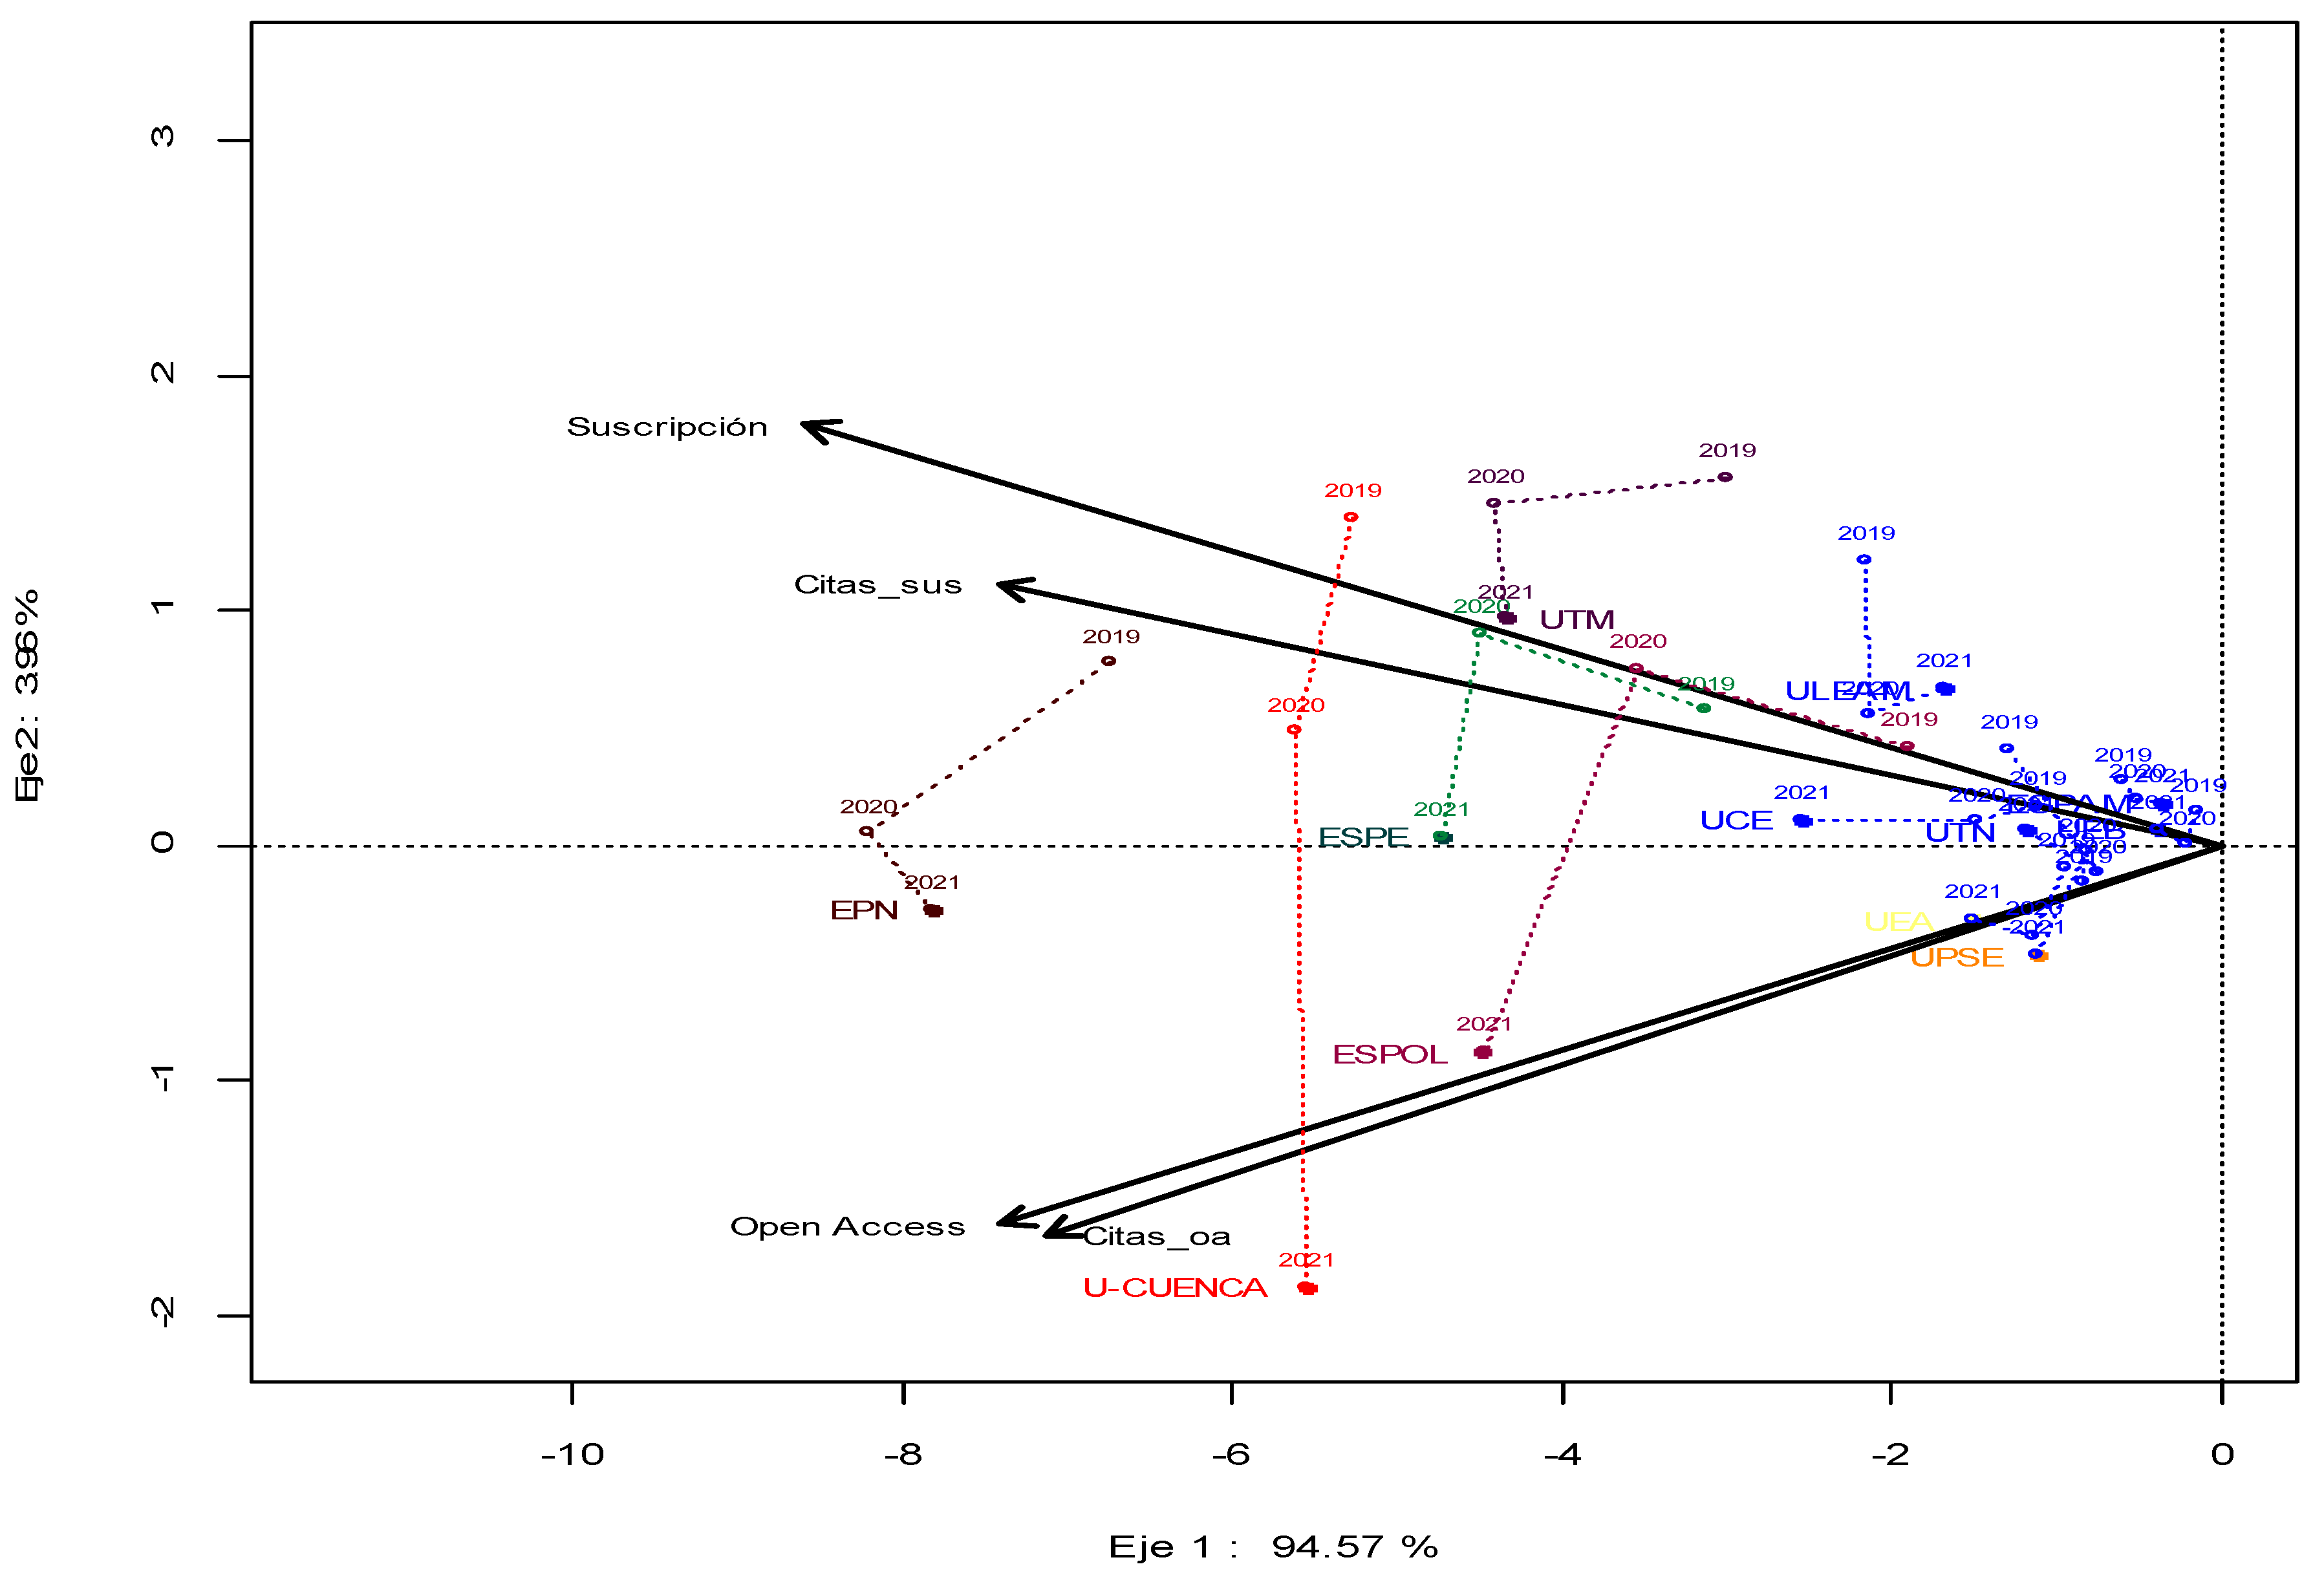
Figure 3 shows an HJ-biplot generated from a multivariate statistical analysis with a representation quality of 950 for the observations (Universities). It visualizes the relationship between different universities and the quantity of their publications in two categories, Open Access and Subscription, over several years (2019, 2020 and 2021). The orientation and length of the vectors indicate how each variable contributes to the variation in the data and the relationship between them. The proximity of the points to each vector suggests the magnitude of each variable for that observation.
The first dimension, Axis 1, explains 94.57% of the variance, which indicates that most of the information on the differences between universities is found along this axis, so the main variability is in the number of publications and citations, whether Open Access or Subscription.
As expected, there is a high direct correlation between the number of citations and articles in open access and subscription journals. Universities that are located at the top of Axis 1 have a better representation for concentrating their scientific publications in open access journals and those that are drawn at the bottom of Axis 1 have a better representation for publishing their research in subscription journals.
Publications in subscription journals have a positive correlation with most universities over the years, while publications in open access journals have a less significant relationship with public universities. The oldest universities in Ecuador such as the Escuela Superior Politécnica del Litoral (ESPOL), the Escuela Politécnica Nacional (EPN) and the Universidad Estatal de Cuenca (U-CUENCA) show a remarkable change in publication sources in the post pandemic period, initially in 2019 these universities were best represented by concentrating their publications in subscription journals and by the end of 2021 a latent migratory trend to open access is observed.
Universities located near the origin of coordinates such as Universidad Técnica del Norte (UTN) and Universidad Central del Ecuador (UCE) suggest a lower number of publications and citations in both categories compared to other public universities in Ecuador. The Polytechnic University of Santa Elena (UPSE) and the Agrarian University of Ecuador are located in an atypical case, since they are the ones that have all their publications tending to open Access.
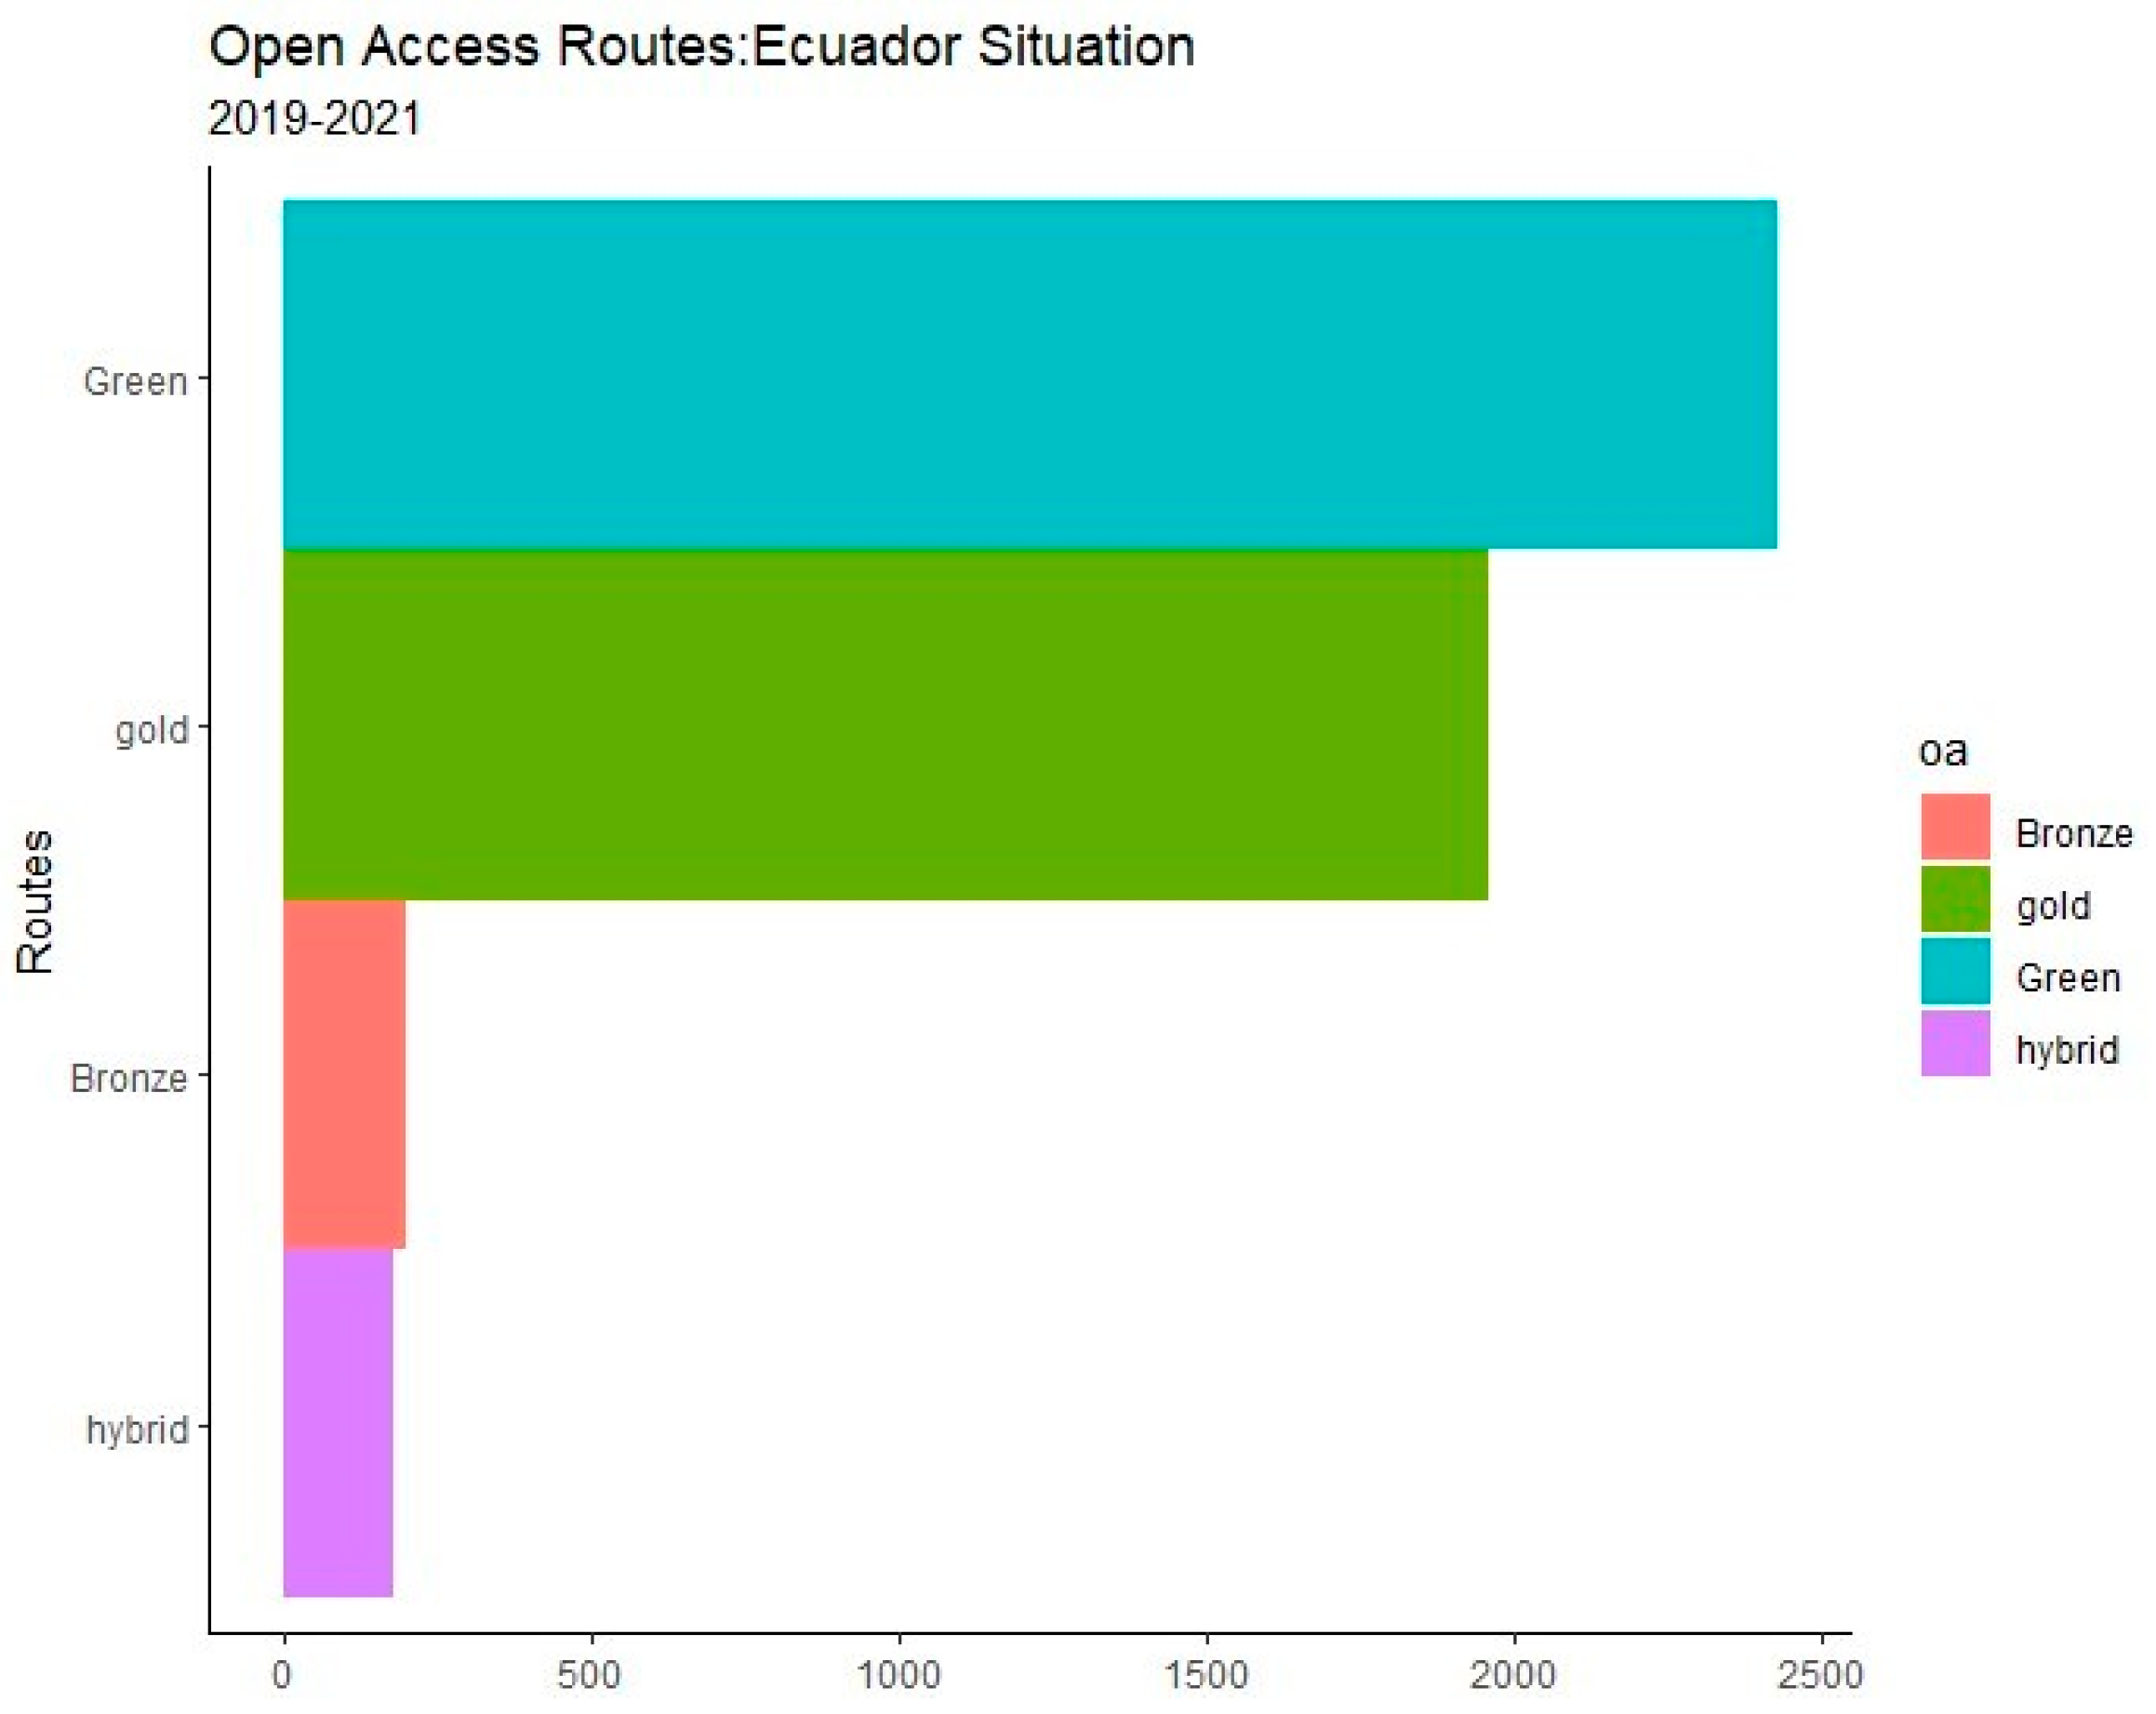
The study highlights the preferences that Ecuadorian researchers have when publishing their articles under the open access model. Figure 7 illustrates a clear trend among academics from Ecuadorian universities, both in the public and private sector, to choose which open access routes they choose for the publication of their research in WoS. The evidence according to the data reflects that the Green option (which allows authors to archive versions of their work in specific repositories), leads with 2425 publications. This figure exceeds the 1955 publications that chose the Gold route (which involves direct publication in open access journals), the 200 that chose the Bronze route, and the 179 that chose the Hybrid route (where certain articles in traditional journals are made accessible to the public), demonstrating that these routes are not desired by Ecuadorian researchers to disseminate their findings.
4. Discussion
This study reveals a significant change in Ecuador's scientific publication strategy in the context of open access, especially during and after the COVID-19 pandemic. The adoption of open access in Ecuador, with 52% of publications in this format during the period studied, reflects a global trend towards greater transparency and accessibility in scholarly communication [
16]. However, in contrast to countries with more consolidated OS policies, as observed in the study by [
17], Ecuador shows an emerging and developing approach, which underscores the importance of establishing more robust national OA policies.
When comparing the scientific production and citations of Ecuadorian universities in WoS in the period studied 2019-2021, it is observed that open access publications receive on average more citations than subscription publications, which is consistent with the findings of [
18]. This pattern suggests that OA not only improves the visibility of research but also its impact, an aspect highlighted in the literature on science communication [
19].
Collaboration between public and private universities in Ecuador, representing 15% of total publications, is remarkable but still lower than that observed in more collaborative contexts such as Europe, according to the report by [
20]. This indicates a potential for growth in inter-institutional collaboration in the country, with much more strength in the post-covid period.
In terms of the distribution of publications by type of access, there is evidence of a growing preference for open access journals in Ecuador, which is in line with the post-pandemic global trends observed by [
21]. However, Ecuador still faces challenges in terms of comprehensive adoption of these practices, compared to more advanced countries in this regard, as described in the research of [
22].
Finally, while Ecuador has more publications in open access model, only the oldest universities push this presence as evidenced in the HJ-Biplot representation, the respect of public universities maintain the dynamic of concentrating their publications in subscription journals, there is still room for improvement, especially in terms of national policies and inter-institutional collaboration, since the institutions lack clear regulations that stimulate open access production.
The study is consistent with the current literature and highlights the need for a more proactive and systematic approach to OA in the field of scientific research in Ecuador.
5. Conclusions
The analysis carried out has shown a significant transformation in scientific communication in Ecuador, especially marked by the adoption of open access (OA). This trend, which advocates the free availability of scientific literature, has profoundly altered the paradigm of publication and distribution of knowledge.
The data reflect a strategic adaptation to the post-pandemic global environment and a response to the growing demand for accessible and transparent scientific information. Despite financial challenges, reduced government spending on higher education and changing perceptions about the quality of publications, not all educational institutions in Ecuador have demonstrated an ability to maintain a robust and consistent scientific output, adapting to changes in the scientific publishing landscape.
The oldest universities are the ones that tend more to have their scientific production under the open access model. The rest of the universities, in addition to not having the regulations to support open access, their dynamics in the period analyzed do not evidence a future change towards open access. According to the data, a break in the trend in the way of publishing is detected, i.e., the universities that tend more to open access are the ones that have more scientific production and therefore have more citations.
In conclusion, the study shows that Ecuador has a relevant presence in WoS, since the growth in scientific production is positive and the adoption of the open access model is on the rise due to the push given by the oldest universities in Ecuador.
References
- Castillo, J.A.; Powell, M.A. Analysis scientific production from Ecuador and the impacto of international collaboration in the period 2006-2015. Rev. Esp. De Doc. Cient. 2019, 42. [Google Scholar] [CrossRef]
- Minniti, S.; Santoro, V.; Belli, S. Mapping the Development of Open Access in Latin America and Caribbean Countries. An Analysis of Web of Science Core Collection and SciELO Citation Index (2005–2017). Scientometrics 2018, 117, 1905–1930. [Google Scholar] [CrossRef]
- Macchi Silva, V.V.; Duarte Ribeiro, J.L.; Alvarez, G.R.; Caregnato, S.E. Competence-Based Management Research in the Web of Science and Scopus Databases: Scientific Production, Collaboration, and Impact. Publications 2019, 7, 60. [Google Scholar] [CrossRef]
- Sawalha, A.H.; Solomon, D.H.; Allen, K.D.; Katz, P.; Yelin, E. Immediate Open Access: The Good, the Bad, and the Impact on Academic Society Publishing. ACR Open Rheumatol. 2023, 5, 308–309. [Google Scholar] [CrossRef] [PubMed]
- Julkowska, M.M.; Saade, S.; Agarwal, G.; Gao, G.; Pailles, Y.; Morton, M.; Awlia, M.; Tester, M. MV App-Multivariate Analysis Application for Streamlined Data Analysis and Curation. Plant Physiol. 2019, 180, 1261–1276. [Google Scholar] [CrossRef] [PubMed]
- Claudio-González, M.G.; Villarroya, A. Challenges of publishing open access journals. Prof. De La Inf. 2015, 24, 517–525. [Google Scholar] [CrossRef]
- Torres-Salinas, D. Daily growth rate of scientific production on covid-19. Analysis in databases and open access repositories. Prof. De La Inf. 2020, 29. [Google Scholar] [CrossRef]
- Beitl, C.M. Navigating Over Space and Time: Fishing Effort Allocation and the Development of Customary Norms in an Open-Access Mangrove Estuary in Ecuador. Hum. Ecol. 2014, 42, 395–411. [Google Scholar] [CrossRef]
- Probst, B.; Lohmann, P.M.; Kontoleon, A.; Anadón, L.D. The Impact of Open Access Mandates on Scientific Research and Technological Development in the U.S. iScience 2023, 26. [Google Scholar] [CrossRef] [PubMed]
- Belli, S.; Cardenas, R.; Velez, M.; Rivera, A.; Santoro, V. Open Science and Open Access, a Scientific Practice for Sharing Knowledge; 2019; Vol. 2486, pp 156–167.
- Eneida María, Q.T.; Felipe, R.L.; Exio Isaac, C.M.; Juan Carlos, M.I. Scientific production on social responsibility in the social economy according to Scopus, period 2016-2020. Rev. De Cienc. Soc. 2022, 28, 258–275. [Google Scholar] [CrossRef]
- Birkle, C.; Pendlebury, D.A.; Schnell, J.; Adams, J. Web of Science as a Data Source for Research on Scientific and Scholarly Activity. Quant. Sci. Stud. 2020, 1, 363–376. [Google Scholar] [CrossRef]
- Bosch, X. A Reflection on Open-Access, Citation Counts, and the Future of Scientific Publishing. Arch. Immunol. Et Ther. Exp. 2009, 57, 91–93. [Google Scholar] [CrossRef]
- Ljesević, B.; Martinović, Z.; Popović, M.; Jović, S. [Visual vs. quantitative electroencephalographic analysis in patients with and without posttraumatic epilepsy]. Med. Pregl. 2010, 63, 40–46. [Google Scholar] [CrossRef]
- Yamashita, N.; Mayekawa, S.-I. A New Biplot Procedure with Joint Classification of Objects and Variables by Fuzzy C-Means Clustering. Adv. Data Anal. Classif. 2015, 9, 243–266. [Google Scholar] [CrossRef]
- Rivero-Guerra, A.O. The scientific production of nature-based tourism: bibliometric analysis of the Clarivate Analytics databases. Rev. Gen. Inf. Doc. 2021, 31, 461–493. [Google Scholar] [CrossRef]
- Moradi, S.; Abdi, S. Open Science-Related Policies in Europe. Sci. Public Policy 2023, 50, 521–530. [Google Scholar] [CrossRef]
- Akterian, S.G. Towards Open Access Scientific Publishing. Biomed. Rev. 2017, 28, 125–133. [Google Scholar] [CrossRef]
- de Filippo, D.; Mañana-Rodriguez, J. Open Access Policies and Mandates and Their Practical Implementation in Spanish Public Universities; 2021; pp 317–328.
- Piazzini, T. Open Access as a New Paradigm. An Inevitable Evolution? JLIS.It 2020, 11, 99–109. [Google Scholar] [CrossRef]
- Nane, G.F.; Robinson-Garcia, N.; van Schalkwyk, F.; Torres-Salinas, D. COVID-19 and the Scientific Publishing System: Growth, Open Access and Scientific Fields. Scientometrics 2023, 128, 345–362. [Google Scholar] [CrossRef] [PubMed]
- Chakravorty, N.; Sharma, C.S.; Molla, K.A.; Pattanaik, J.K. Open Science: Challenges, Possible Solutions and the Way Forward. Proc. Indian Natl. Sci. Acad. 2022, 88, 456–471. [Google Scholar] [CrossRef]
|
Disclaimer/Publisher’s Note: The statements, opinions and data contained in all publications are solely those of the individual author(s) and contributor(s) and not of MDPI and/or the editor(s). MDPI and/or the editor(s) disclaim responsibility for any injury to people or property resulting from any ideas, methods, instructions or products referred to in the content. |
© 2023 by the authors. Licensee MDPI, Basel, Switzerland. This article is an open access article distributed under the terms and conditions of the Creative Commons Attribution (CC BY) license (http://creativecommons.org/licenses/by/4.0/).


