Submitted:
22 December 2023
Posted:
25 December 2023
You are already at the latest version
Abstract
Keywords:
1. Introduction
2. Materials and Methods
3. Results
3.1. Two Decades of Wildfire Emissions
3.2. Mega-Fire in Central Siberia in 2021 as Seen Remotely by TROPOMI and AIRS.
3.3. Mega-Fire in Australia in 2019/2020.
3.4. Abbreviations
4. Discussion
4.1. Evaluation of TROPOMI Database for Fire Investigation
4.2. Role of Coal Burning in Siberian and Australian Fires
Funding
Data Availability Statement
Acknowledgments
Conflicts of Interest
Appendix A

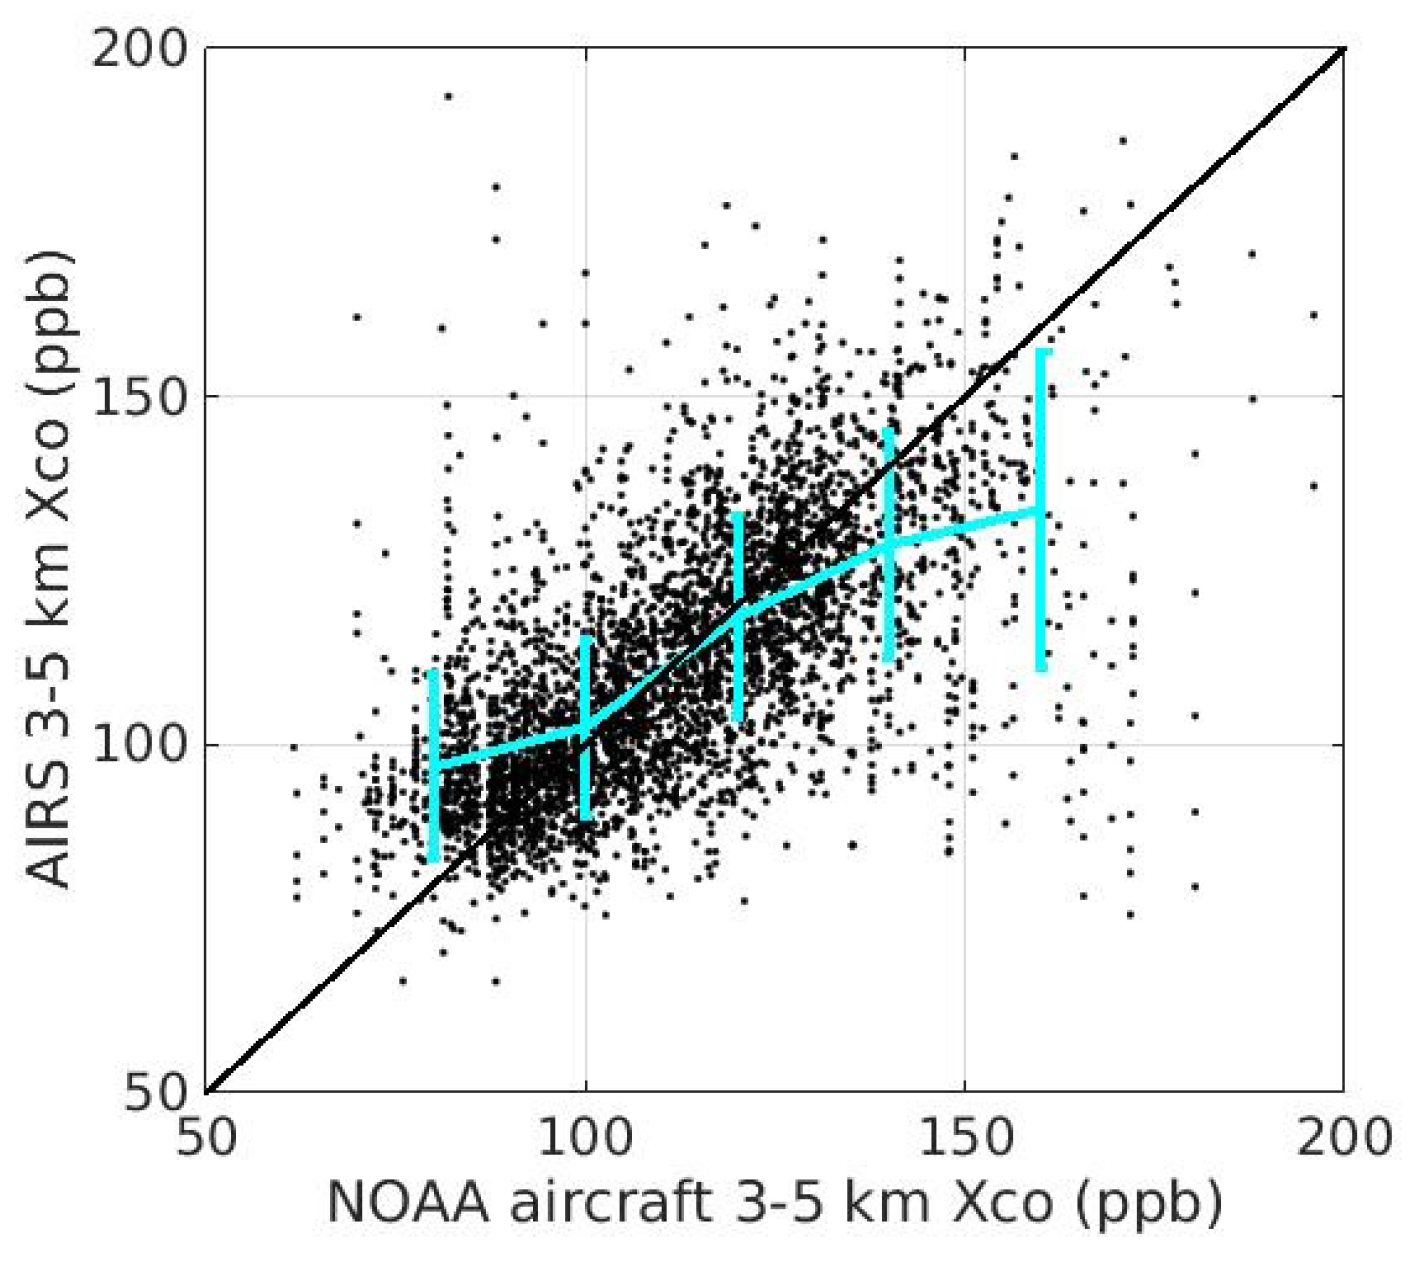
Appendix B
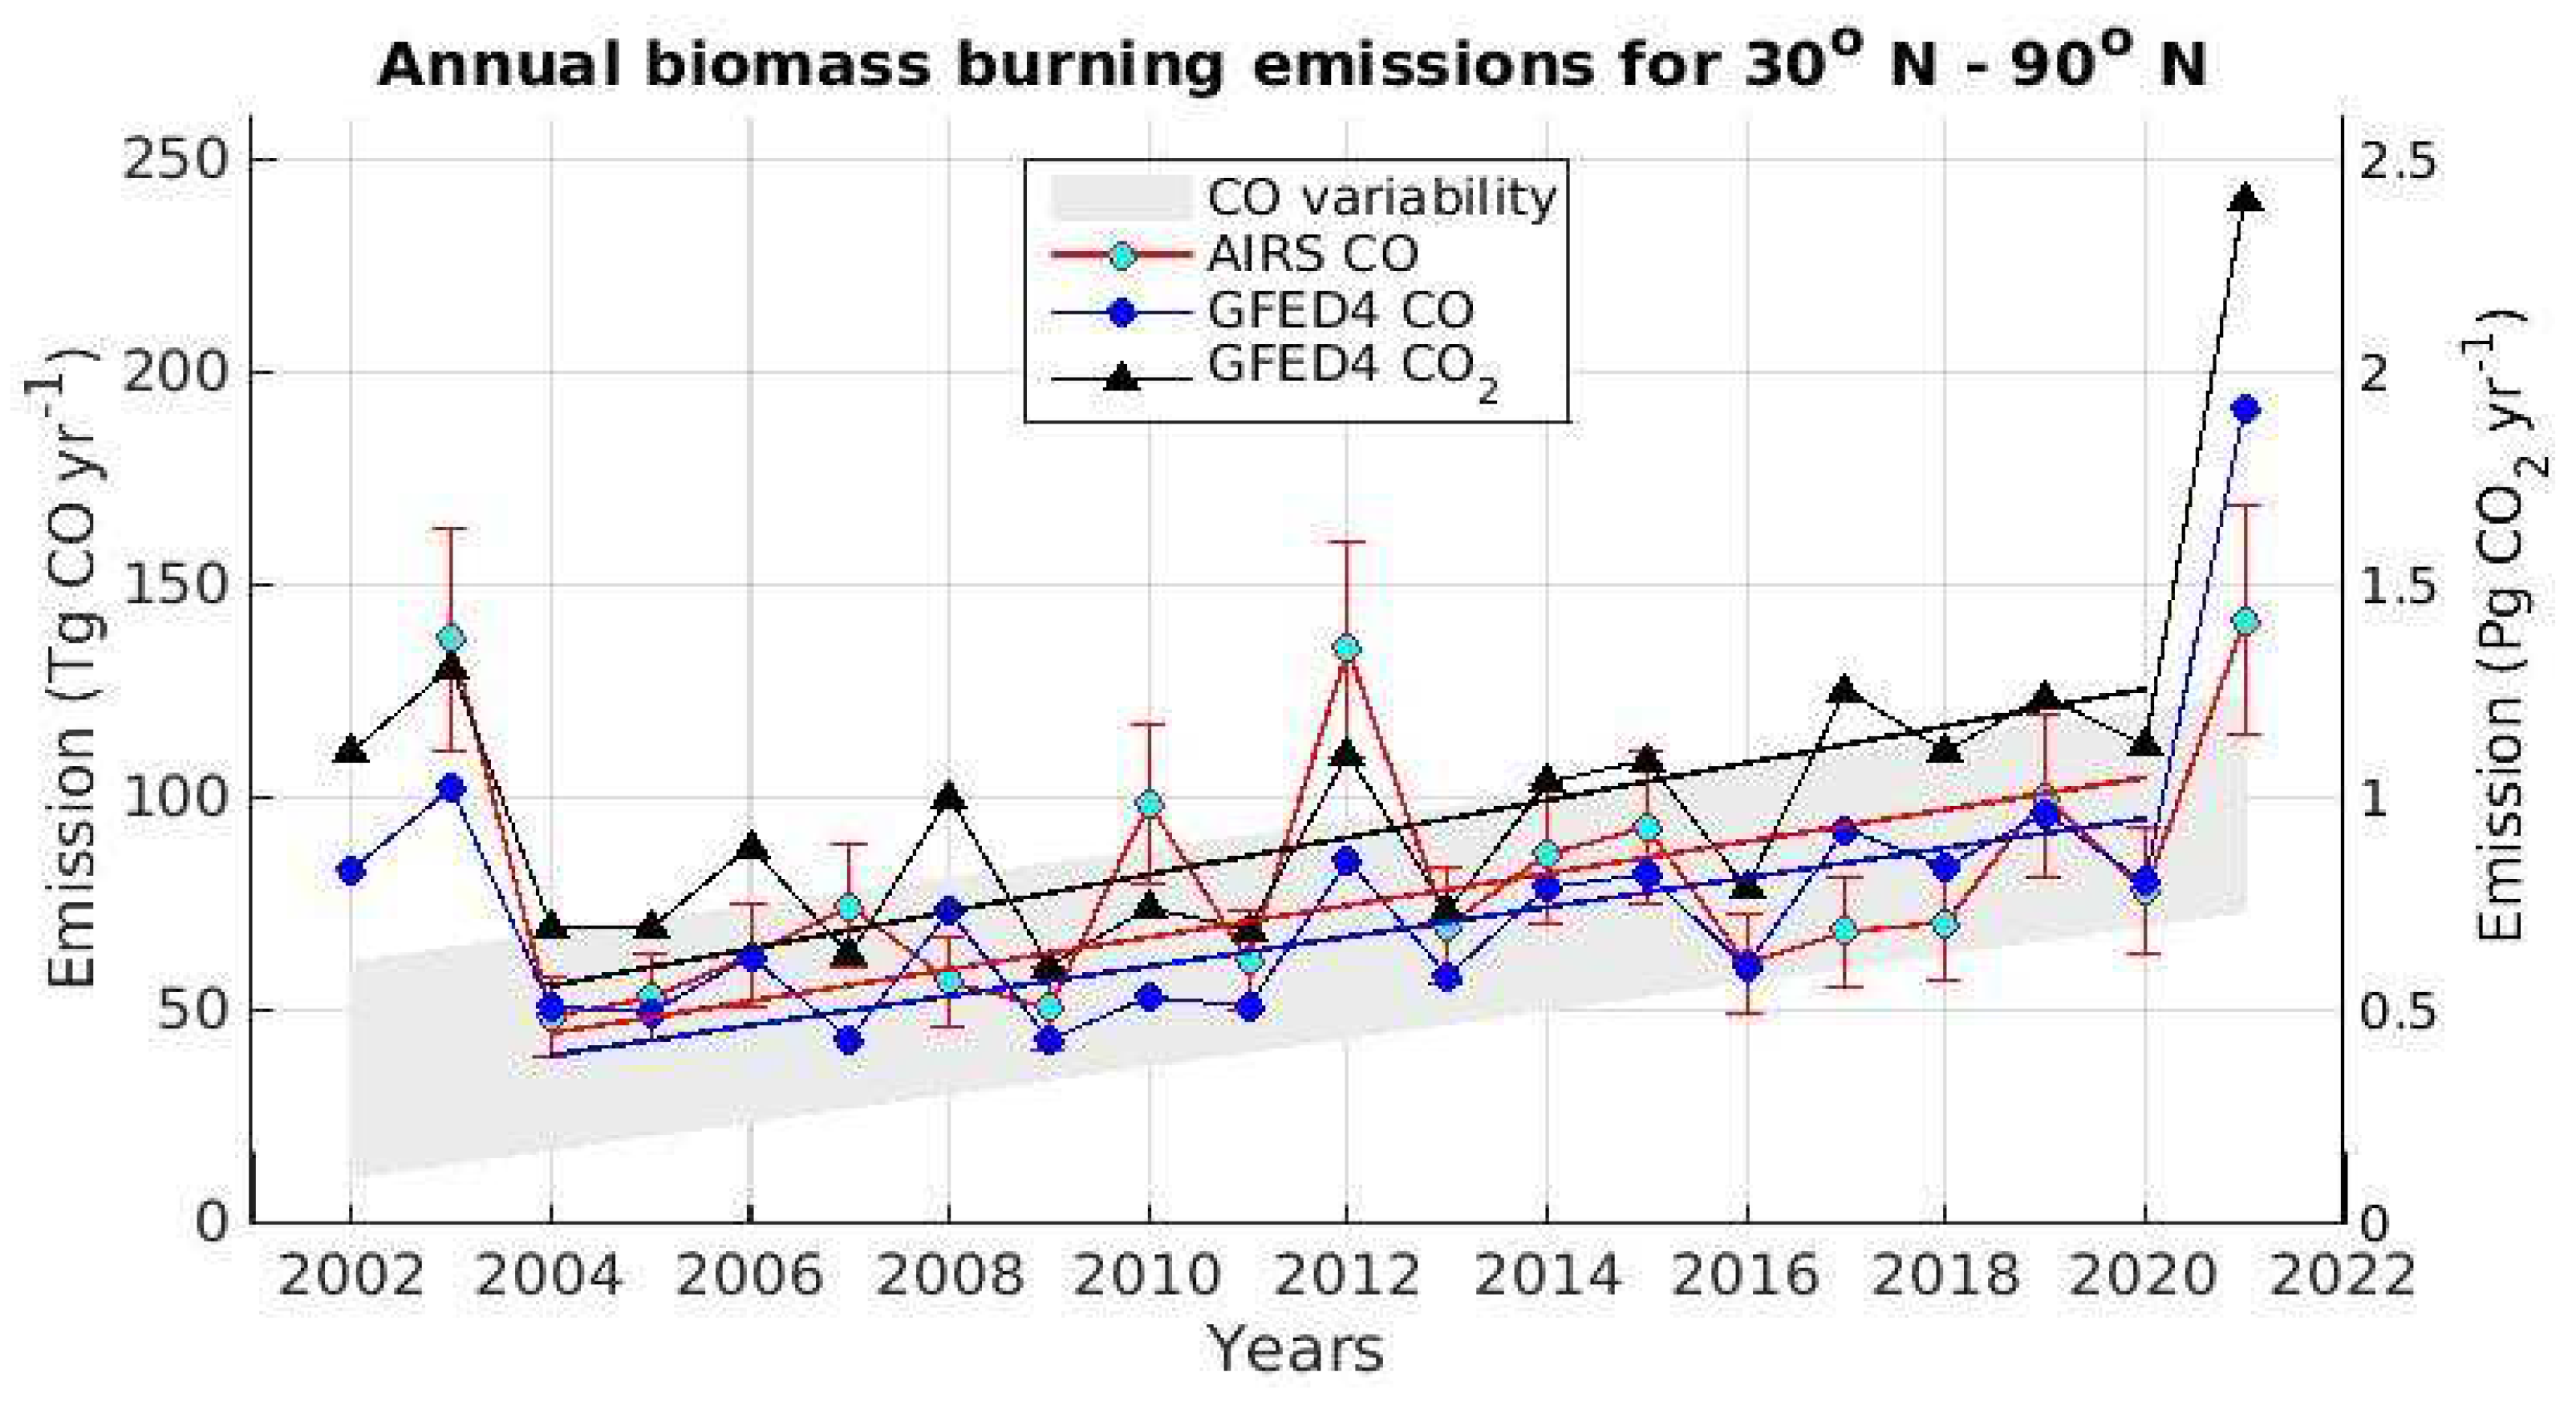
Appendix C
References
- Stocks, B.J.; Fosberg, M.A.; Lynham, T.J.; Mearns, L.; Wotton, B.M.; Yang, Q.; Jin, J.-Z.; Lawrence, K.; Hartley, G.R.; Mason, J.A.; McKenney, D.W. Climate change and forest fire potential in Russian and Canadian boreal forests. Clim. Change 1998, 38, 1–13. [Google Scholar] [CrossRef]
- Kasischke, E.; Stocks, B. Fire, climate change, and carbon cycling in the boreal forest; Springer-Verlag: New York, NY, USA, 2000; 461 p. [Google Scholar]
- Seiler, W.; Crutzen, P.J. Estimates of gross and net fluxes of carbon between the biosphere and the atmosphere from biomass burning. Clim. Change 1980, 2, 207–247. [Google Scholar] [CrossRef]
- Cochrane, M. A.; Alencar, A.; Schulze, M. D.; Souza C., M.; Nepstad, D. C.; Lefebvre, P.; Davidson, E. A. Positive Feedbacks in the Fire Dynamic of Closed Canopy Tropical Forests. Science. 1999; 284, 1832–1835. [Google Scholar]
- Romanov, A.A.; Tamarovskaya, A.N.; Gusev, B.A.; Leonenko, E. V.; Vasiliev, A.S., Krikunov, E.E. Catastrophic PM2.5 emissions from Siberian forest fires: Impacting factors analysis. Environ. Pollut. 2022, 119324. [CrossRef]
- Romanov, A.A.; Tamarovskaya, A.N.; Gloor, E.; Brienen, R.; Gusev, B.A.; Leonenko, E. V.; Vasiliev, A.S.; Krikunov, E.E. Reassessment of carbon emissions from fires and a new estimate of net carbon uptake in Russian forests in 2001–2021. Sci. Total Environ. 2022, 157322. [CrossRef]
- Yurganov, L.; Rakitin, V. Two Decades of Satellite Observations of Carbon Monoxide Confirm the Increase in Northern Hemispheric Wildfires. Atmosphere (Basel). 2022.13(9): 1–12. [CrossRef]
- Ponomarev, E.; Zabrodin, A.; Ponomareva, T. Classification of Fire Damage to Boreal Forests of Siberia in 2021based on the dNBR Index. Fire. 2022, 5, 19. [Google Scholar] [CrossRef]
- Bondur, V.G.; Gordo, K.A.; Voronova, O.S.; Zima, A.L.; Feoktistova, N.V. Intense Wildfires in Russia over a 22-Year Period According to Satellite Data. Fire. 2023, 6, 99. [Google Scholar] [CrossRef]
- Dijk, P.; Zhang, J.; Jun, W.; Kuenzer, C.; Wolf, K. H. A. A. Assessment of the contribution of in-situ combustion of coal to greenhouse gas emission; based on a comparison of Chinese mining information to previous remote sensing estimates. International Journal of Coal Geology. 2011, 86(1), 108–119. [Google Scholar] [CrossRef]
- Elick, J. M. Mapping the coal fire at Centralia, Pa using thermal infrared imagery: International Journal of Coal Geology. 2011, 87, p. 197-203. [CrossRef]
- Ellyett, C. D.; Fleming, A. W. Thermal infrared imagery of The Burning Mountain coal fire Remote Sensing of Environment, 1974, 3(1), 79-86. [CrossRef]
- Zhang, X.M.; Kroonenberg, S.B.; de Boer, C.B. Dating of coal fires in Xinjiang, north-west China. Terra Nova, 2004, 16(2), 68 - 74.
- Zhang, X.; Zhang, J.; Kuenzer C.; Voigt, S.; Wagner, W. Capability evaluation of 3–5 µm and 8–12.5 µm airborne thermal data for underground coal fire detection, Int. J. Rem. Sensing, 2004, 25(12), 2245-2258. [CrossRef]
- Crisp, D.; Johnson, The orbiting carbon observatory mission. Acta Astronautica, 2005, 56(1–2), 193-197.
- Yurganov, L. N.; Duchatelet, P.; Dzhola, A. V.; Edwards, D. P.;Hase, F.; Kramer, I.; Mahieu, E.; Mellqvist, J.; Notholt, J.; Novelli, P. C.; Rockmann, et al. Increased Northern Hemispheric carbon monoxide burden in the troposphere in 2002 and 2003 detected from the ground and from space. Atmos. Chem.Phys. 2005, 5, 563–573. [CrossRef]
- Yurganov, L. N.; Blumenstock, T.; Grechko, E. I.; Hase, F.; Hyer, E. J.; Kasischke, E. S.; Koike, M.; Kondo, Y.; Kramer, I.; Le-ung, F.-Y., et al. A quantitative assessment of the 1998 carbon monoxide emission anomaly in the northern Hemisphere based on total column and surface concentration measurements. J. Geophys. Res., 2004. 109, D15305. [CrossRef]
- Magro, C.; Nunes, L.; Gonçalves, O. C.; Neng, N. R.; Nogueira, J. M. F.; Rego, F. C.; Vieira, P. Atmospheric trends of CO and CH4 from extreme wildfires in Portugal using sentinel-5P TROPOMI level-2 data. Fire, 2021, 4(2), 25. [CrossRef]
- Wan, N.; Xiong, X.; Kluitenberg, G. J.; Hutchinson, J. M. S.; Aiken, R.; Zhao, H.; Lin, X. Estimation of biomass burning emission of NO2 and CO from 2019–2020 Australia fires based on satellite observations. Atmos. Chem. Phys. 2023, 23, 711–724. [Google Scholar] [CrossRef]
- van der Velde, I. R.; van der Werf, G. R.; Houweling, S.; Eskes, H. J.; Veefkind, J. P.; Borsdorff, T.; Aben, I. Biomass burning combustion efficiency observed from space using measurements of CO and NO2 by the TROPOspheric Monitoring Instrument (TROPOMI), Atmos. Chem. Phys. 2021, 21, 597–616. [Google Scholar] [CrossRef]
- Wang, Y.; Zhang, Y.; Zhao, C.; Dong, D.; Wang, K. CO and CH4 atmospheric trends from dense multi-point forest fires around the city of Chongqing using spaceborne spectrometer data. Atmospheric Pollution Research 2023, 14, 101807. [Google Scholar] [CrossRef]
- Martínez-Alonso, S.; Deeter, M.; Worden, H.; Borsdorff, T.; Aben, I.; Commane, R.; Daube, B.; Francis, G.; George, M.; Landgraf, J.; Mao, D.; McKain, K.; Wofsy, S. 1.5 years of TROPOMI CO measurements: comparisons to MOPITT and ATom, Atmos. Meas. Tech. 2020 ,13, 4841–4864. https://doi.org/10.5194/amt-13-4841-2020. [CrossRef]
- Griffin, D.; Chen, J.; Anderson, K.; Makar, P.; McLinden, C. A.; Dammers, E.; Fogal, A. Towards an improved understanding of wildfire CO emissions: a satellite remote-sensing perspective, EGUsphere [preprint],2023. [CrossRef]
- Veefkind, J.P.; Aben, I.; McMullan, K.; Förster, H.; de Vries, J.; Otter, G.; Claas, J.; Eskes, H.J.; de Haan, J.F.; Kleipool, Q.; et al. TROPOMI on the ESA Sentinel-5 precursor: a GMES mission for global observations of the atmospheric composition for climate, air quality and ozone layer applications. Remote Sens. Environ. 2012, 120, 70–83. [Google Scholar] [CrossRef]
- Landgraf, J.; van de Brugh, J.; Scheepmaker, R.; Borsdorff, T.; Hu, H.; Houweling, S.; Butz, A.; Aben, I.; and Hasekamp, O. Carbon monoxide total column retrievals from TROPOMI shortwave infrared measurements, Atmos. Meas. Tech. 2016, 9, 4955–4975. [Google Scholar] [CrossRef]
- Krol, M.; Houweling, S.; Bregman, B.; van den Broek, M., Segers, A.; van Velthoven, P.; Peters, W.; Dentener, F.; Bergamaschi, P. The two-way nested global chemistry-transport zoom model TM5: algorithm and applications, Atmos. Chem. Phys., 2005, 5, 417– 432. [CrossRef]
- Aumann, H. H.; Chahine, M. T.; Gautier, C.; Goldberg M., D.; Kalnay, E.; McMillin, L. M.; Revercomb, H.P.; Rosenkranz, P.W.; Smith, W. L.; Staelin, D.H.; et al. AIRS/AMSU/HSB on the Aqua mission: design, science objectives, data products and processing systems. IEEE Trans. Geosci. Rem. Sens. 2003, 41, 253–264. [Google Scholar] [CrossRef]
- AIRS project. Aqua/AIRS L3 Daily Standard Physical Retrieval (AIRS-only) 1 degree x 1 degree V7.0, Greenbelt, MD, USA, Goddard Earth Sciences Data and Information Services Center (GES DISC). [CrossRef]
- Sha, M. K.; Langerock, B.; Blavier, J.-F. L.; Blumenstock, T.; Borsdorff, T.; Buschmann, M.; Dehn, A., De Mazière, M.; Deutscher, N. M.; Feist, D. G. et al. Validation of methane and carbon monoxide from Sentinel-5 Precursor using TCCON and NDACC-IRWG stations, Atmos. Meas. Tech.,2021, 14, 6249–6304. [CrossRef]
- McKain, K.; Sweeney, C.; Baier, B.; Crotwell, A.; Crotwell, M.; Handley, P.; Higgs, J.; Legard, T.; Madronich, M.; Miller, J. B.; et al. NOAA Global Greenhouse Gas Reference Network Flask-Air PFP Sample Measurements of CO2, CH4, CO, N2O, H2, SF6 and isotopic ratios collected from aircraft vertical profiles [Data set]. Version: 2023-08-23. 2023. [CrossRef]
- van der Werf, G. R.; Randerson, J. T.; Giglio, L.; van Leeuwen, T. T.; Chen, Y.; Rogers, B. M.; Mu, M.; van Marle, M. J. E.; Morton, D. C.; et al. Global fire emissions estimates during 1997–2016. Earth Syst. Sci. Data 2017, 9, 697–720. [Google Scholar] [CrossRef]
- Crippa, M.; Guizzardi, D.; Butler, T.; Keating, T.; Wu, R.; Kaminski, J.; Kuenen, J.; Kurokawa, J.; Chatani, S.; Morikawa, T.; et al. The HTAP_v3 emission mosaic: merging regional and global monthly emissions (2000–2018) to support air quality modeling and policies, Earth Syst. Sci. Data 2023, 15, 2667–2694. [Google Scholar] [CrossRef]
- Chemezov E. N. Localization of an underground fire at the sangarskaya mine (Лoкализация пoдземнoгo пoжара на шахте «Cангарская») Mining informational and analytical bulletin. 2011. №12, 196-197, ISSN 0236-1493. Available online: https://giab-online.ru/en/catalog/archives/10582/view.
- Ivanova, N. Eternal flames of Sangar: 20 years of life on a powder keg. 2021. (in Russian). Available online: https://dobro.press/blogi/vechnye-ogni-sangara-20-let-zhizni-na-porohovoi-bochke.
- Clarke, H.; Cirulis, B.; Penman, T.; et al. The 2019–2020 Australian forest fires are a harbinger of decreased prescribed burning effectiveness under rising extreme conditions. Sci Rep. 2022. 12, 11871. [CrossRef]
- Davydov, V.I. Tunguska Сoals, Siberian Sills and the Permian-Triassic Extinction. Earth-Science Reviews 2021, 212, 103438. [Google Scholar] [CrossRef]
- Ignatchenko, N. A. Geologicheskoe stroenie i ugol’nye mestorozhdeniia zapadnoi chasti Lenskogo ugol’nogo basseina. 1960. Moscow, (In Russian). Available online: https://encyclopedia2.thefreedictionary.com/Lena+Coal+Basin.
- Payne, J. L.; Clapham, M. E. End-Permian Mass Extinction in the Oceans: An Ancient Analog for the Twenty-First Century? Annual Review of Earth and Planetary Sciences 2012, 40, 89–111. [Google Scholar] [CrossRef]
- Elkins-Tanton, L. T.; Grasby, S. E.; Black, B. A.; Veselovskiy, R. V.; Ardakani, O. H.; Goodarzi, F. Field evidence for coal combustion links the 252 Ma Siberian Traps with global carbon disruption. Geology. 2020. 48, 986–991. [CrossRef]
- Burgess, S.D.; Bowring, S.; Shen, S.Z. High-precision timeline for Earth’s most severe extinction. Proc Natl Acad Sci USA. 2014, 111, 3316–3321, Erratum in Proc Natl Acad Sci USA 2014, 111, 5060. [Google Scholar] [CrossRef] [PubMed]
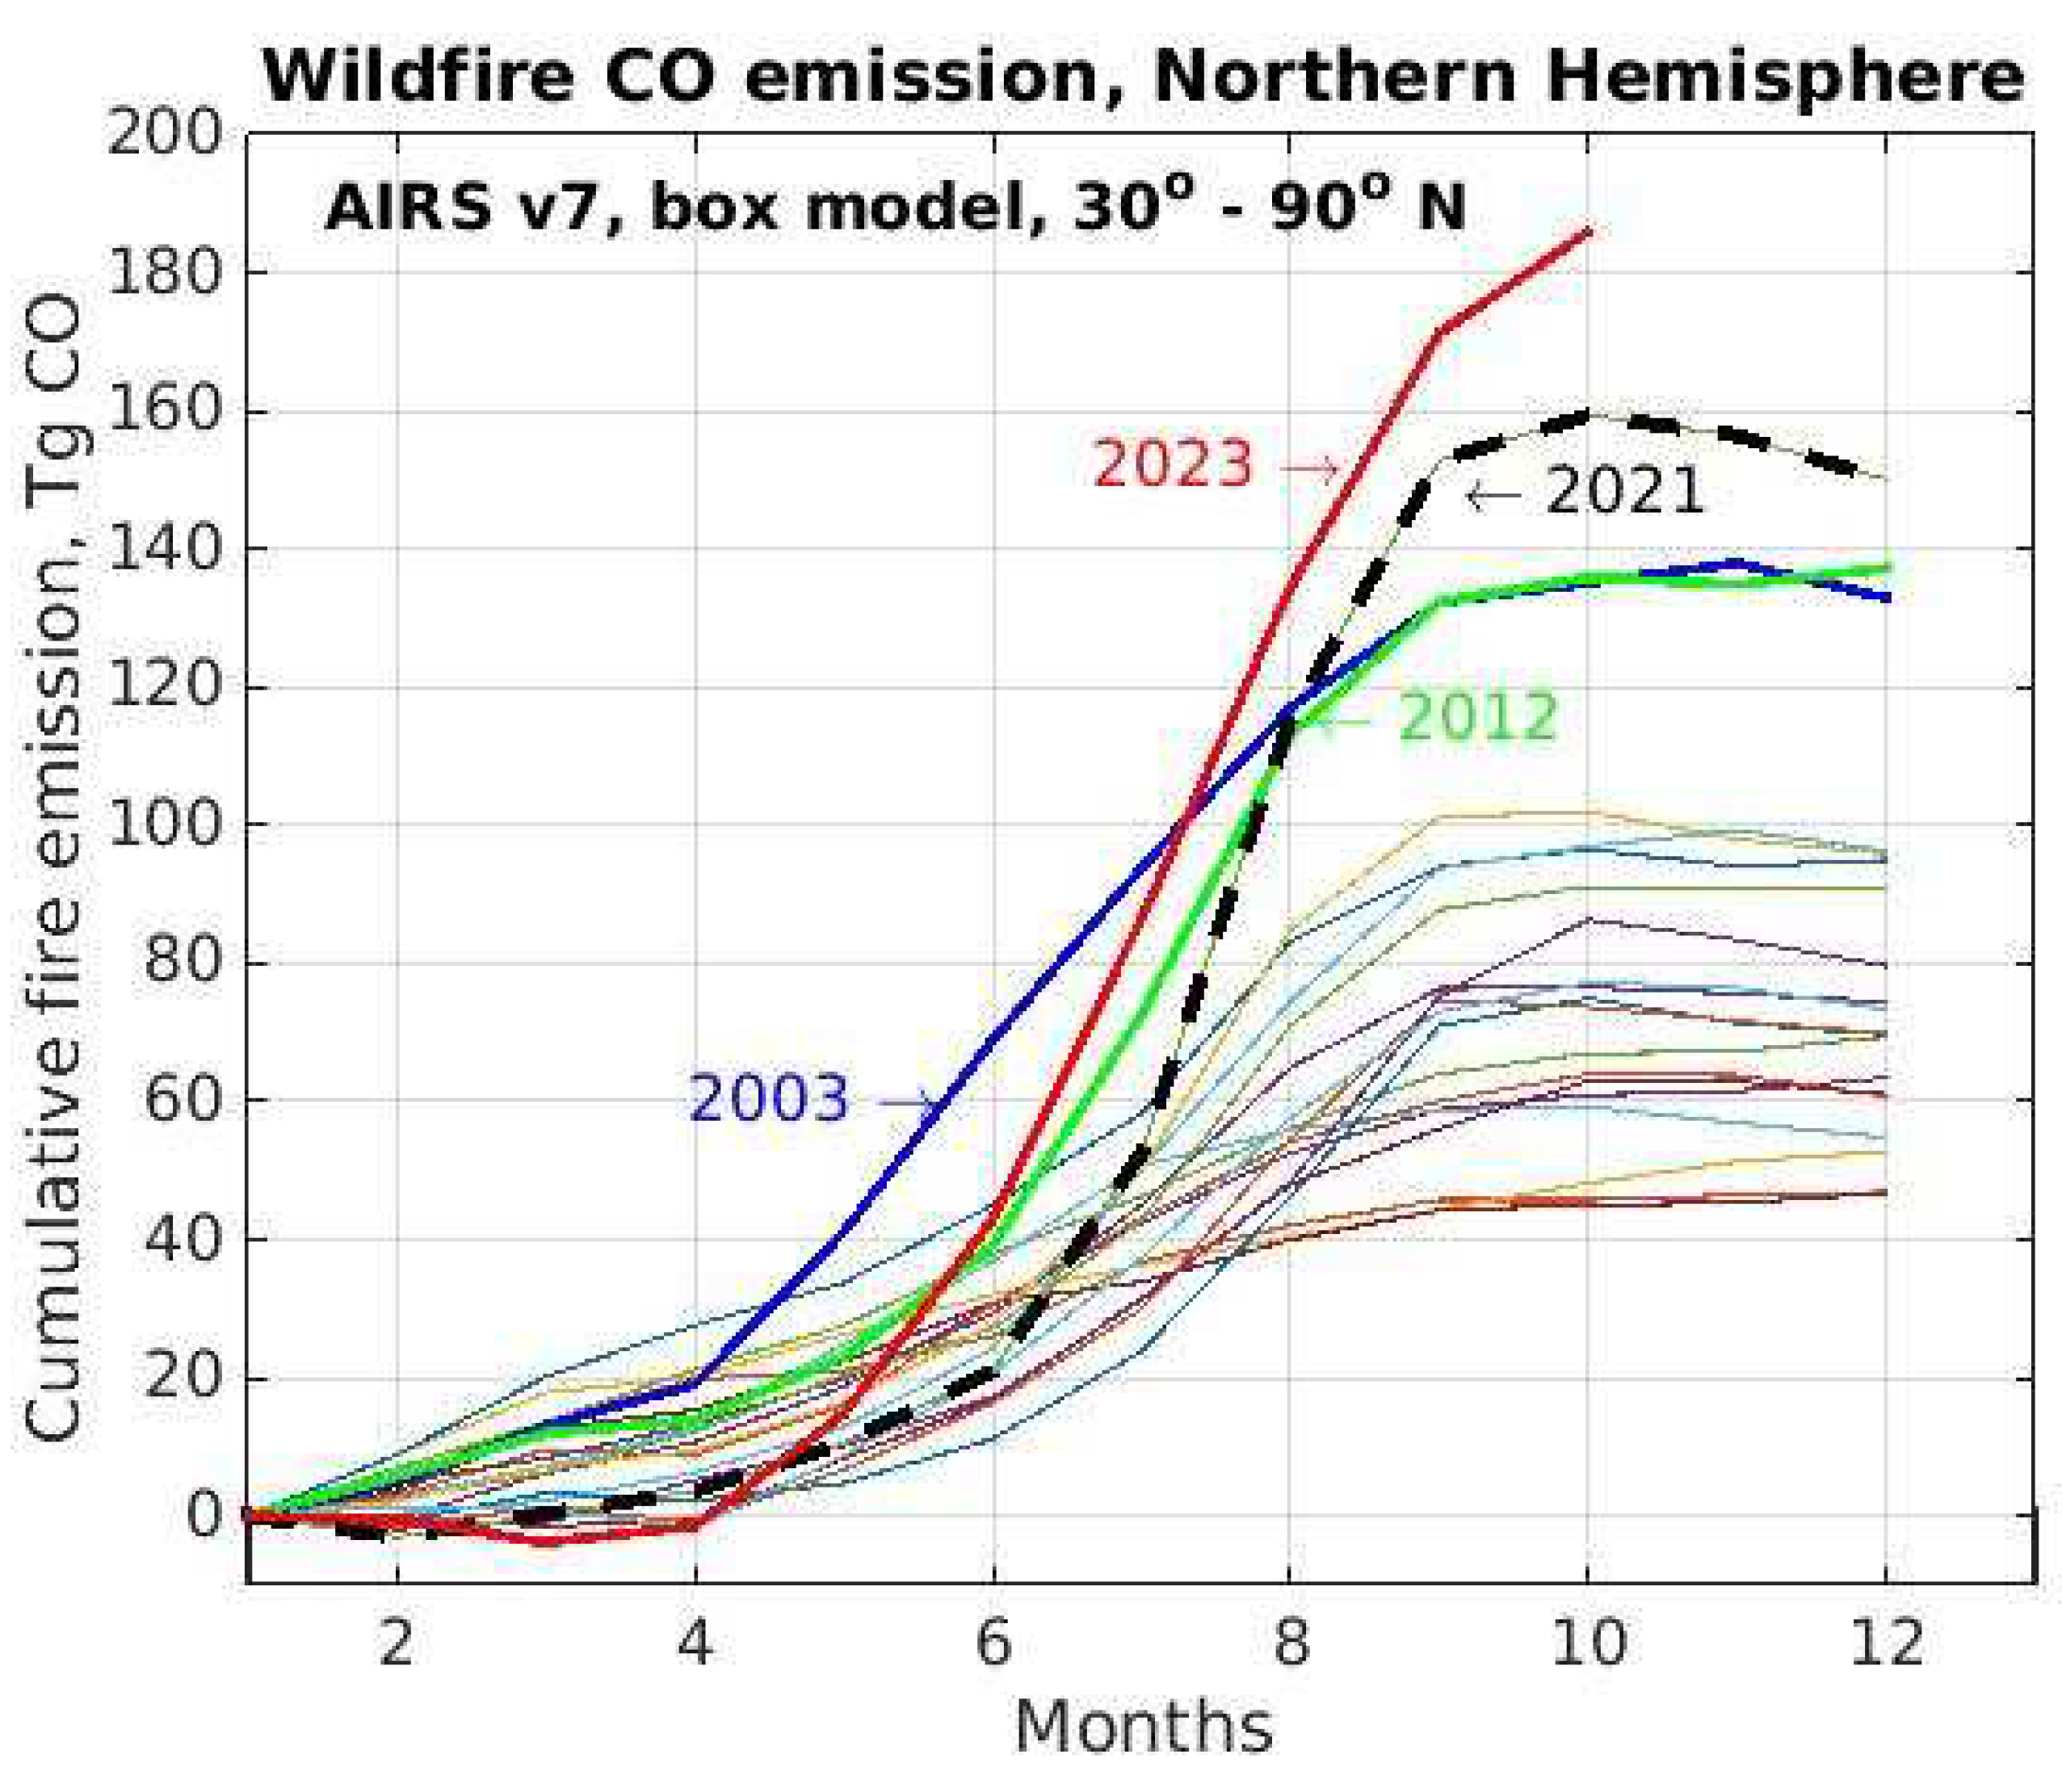
Disclaimer/Publisher’s Note: The statements, opinions and data contained in all publications are solely those of the individual author(s) and contributor(s) and not of MDPI and/or the editor(s). MDPI and/or the editor(s) disclaim responsibility for any injury to people or property resulting from any ideas, methods, instructions or products referred to in the content. |
© 2023 by the authors. Licensee MDPI, Basel, Switzerland. This article is an open access article distributed under the terms and conditions of the Creative Commons Attribution (CC BY) license (http://creativecommons.org/licenses/by/4.0/).


