Preprint
Article

Distinct Alterations of Dendritic Spine Morphology in the Absence of β-Neurexins

Altmetrics

Downloads

102

Views

34

Comments

0

A peer-reviewed article of this preprint also exists.

Submitted:

22 December 2023

Posted:

25 December 2023

You are already at the latest version

Alerts
Abstract
Dendritic spines are essential for synaptic function because they constitute the neurons' postsynaptic compartment that receives the most excitatory input. The extracellularly shorter variant of the presynaptic cell adhesion molecules neurexins, β-neurexins, has been implicated in various aspects of synapse function including neurotransmitter release. However, its role in developing or stabilizing dendritic spines as fundamental computational units of excitatory synapses remained unclear. Here, we show by morphological analysis that the deletion of β-neurexins in hippocampal neurons in vitro and in hippocampal tissue in vivo affects presynaptic dense-core vesicles and, unexpectedly, postsynaptic spine structure. Specifically, we observed that the absence of β-neurexins led to an increase in longer spinous protrusions in vitro and more mature mushroom-type spines in the CA1 region of adult knockout mice. In addition, deletion of β-neurexins caused alterations in spine head dimension and more spines with perforations of their postsynaptic density but no change in the overall number of spines or synapses. Our results indicate that presynaptic β-neurexins play a role across the synaptic cleft, possibly by aligning with postsynaptic binding partners and glutamate receptors via transsynaptic columns.
Keywords: 
Subject: Biology and Life Sciences  -   Neuroscience and Neurology

1. Introduction

Dendritic spines (DS) are minute protrusions that extend laterally from neuronal dendrites and receive most of the excitatory input in brain circuitries [1,2,3]. DS play a pivotal role in neurotransmission because they constitute an independently operating compartment of the postsynaptic neuron that integrates presynaptic inputs and mediates learning algorithms [2,4,5]. Mature, stable DS typically display a mushroom-shaped morphology and increase in abundance with age [6,7,8]. The relatively large, bulbous head of mushroom spines is linked to its dendrite by a thinner neck and contains a postsynaptic density, signaling molecules, actin-based scaffolds and organelles such as endosomes or the spine apparatus [3,9,10,11]. Since spines undergo adaptive changes in response to stimuli, it was concluded that spine morphology and their function are mutually dependent [12,13,14]. For example, the normally round and flat surface of spines that faces the presynaptic terminal can assume a concave morphology following plasticity-inducing signals [15]. Conversely, dysfunction can also manifest in structural changes because numerous neuropsychiatric disorders and behavioral deficits have been linked to the impairment of different spine types and their morphology [10,16,17,18].
Neurexins (Nrxn) are a large family of essential presynaptic cell adhesion molecules that regulate various aspects of synapse function [19,20,21]. All three Nrxn genes in vertebrates contain independent promoters that drive the transcription of structurally larger α-neurexins (αNrxn) and smaller β-neurexins (βNrxn), the latter differing by expression of a β-specific, 37 residue-long domain before splicing into the last (sixth) LNS domain of the respective gene [20,21], with more variants arising from up to six conserved alternative splice sites [22,23]. Since Nrxn engages in binding activities with several postsynaptic partners and is part of transsynaptic nanocolumns [24,25], we expected that they may affect the stabilization of DS structure [26]. However, previous work in constitutive or conditional knockout mice of multiple Nrxn variants reported normal overall spine density [27,28,29,30,31].
It has remained a conundrum if and how the major α- and βNrxn variants differ in their function at synapses. Although they share numerous binding partners such as neuroligins (Nlgn) [32,33,34], leucine-rich repeat transmembrane neuronal (LRRTM) proteins [35,36,37], α-dystroglycan [38,39], latrophilins [40], and cerebellins (Cbln) [41,42,43], α- and βNrxn differ in the degree of phenotypic alterations when their function is probed in deletion mouse models: The combined knockout of all three αNrxn genes is perinatally lethal and was mechanistically traced back to a strong impairment of Ca2+-dependent release of synaptic vesicles from excitatory and inhibitory synapses [29,44,45,46]. Selective deletion of all βNrxn, in turn, does not significantly impair survival and displays only moderately reduced excitatory release as well as diminished presynaptic Ca2+ transients and dense-core vesicles (DCVs) [27,31,47]. We did, however, notice putative changes of dendritic protrusions in the absence of βNrxn during our recent investigation of neuromodulator-containing DCVs [47], prompting this current study to re-analyze two βNrxn deletion models for an altered spine morphology.
Here, we have combined neuronal cell culture analysis and transmission electron microscopy of brain tissue of conditional and constitutive knockout mice of βNrxn to explore in detail the structure of dendritic spines. Our findings indicate that βNrxn not only regulates Ca2+-dependent synaptic transmission but may serve a role in the differentiation or stabilization of normal dendritic spine structure.

2. Results

2.1. DCV distribution is altered in cultured neurons of two βNrxn deletion mouse models

Endogenous βNrxn are highly mobile molecules mostly on axons and within synaptic terminals [31] where they affect not only the release of classical synaptic vesicles [27,31] but also the amount of DCVs [47]. Strikingly, neuromodulators such as brain-derived neurotrophic factor (BDNF) are secreted from presynaptic DCVs [48,49,50] and play a major role in spine development and plasticity [51,52]. At a time when replicability of exactly comparable experimental conditions is a topic of great concern in science, we decided to study dendritic spine structure in two different βNrxn deletion models and compared their phenotype in neuronal cell culture as well as brain tissue. To ensure that results from conditional and constitutive knockout of βNrxn variants are comparable, we first tested our previous conclusion of reduced amounts of DCVs [47] in both βNrxn knockouts.
We conditionally deleted floxed βNrxn-specific exons by Cre recombinase-expressing lentivirus to remove all βNrxn variants in primary hippocampal neurons from KI mice as described before [31,47]. Inactive Cre recombinase (Cremut)-expressing KI neurons served as controls and efficient reduction of βNrxn was validated by immunoblots as shown [31]. Similarly, we cultured hippocampal neurons from a constitutive βNrxn TKO mouse line generated by germline deletion and controls [31,47]. To probe the distribution of DCVs in both types of deletion models, we immunolabeled the neuronal cultures at DIV19 with antibodies against chromogranin A (ChrgA), a common matrix protein of DCVs present in a subset of axons [53,54,55]. We observed ChrgA-positive clusters in axons of control neurons, for example, traveling along a neighbored neuronal soma (Figure 1A) and less abundantly on axons of βNrxn TKO neurons (Figure 1B), thereby closely resembling the images of Cremut and Cre-expressing βNrxn KI neurons from our earlier study of DCVs [47]. Measurements of the intensity of ChrgA fluorescence within a defined axonal window revealed a 35% reduction of ChrgA fluorescence intensity in axons of βNrxn cKO neurons compared to control neurons in our current set of experiments (Figure 1C; Cremut control: 7,846 ± 442 arbitrary units [A.U.], Cre cKO: 5,133 ± 531, p = 0.0003), an even stronger effect than reported before [47], presumably due to a higher number of experiments in this study. In cultures of the constitutive βNrxn KO model, the ChrgA fluorescence intensity was less strongly but also significantly diminished by 17% (Figure 1D; WT control: 7,132 ± 340 arbitrary units [A.U.], TKO: 5,949 ± 320, p = 0.023). Together, these results confirm our previous conclusion that βNrxn is required for normal levels of ChrgA-containing DCVs in hippocampal neurons [47]. Importantly, they also indicate that phenotypic observations made upon conditional deletion can be reproduced in constitutive βNrxn TKO mutants, despite the caveats associated with potential compensatory effects in germline deletions [21].

2.2. Dendritic spine alterations in cultured βNrxn-deficient neurons

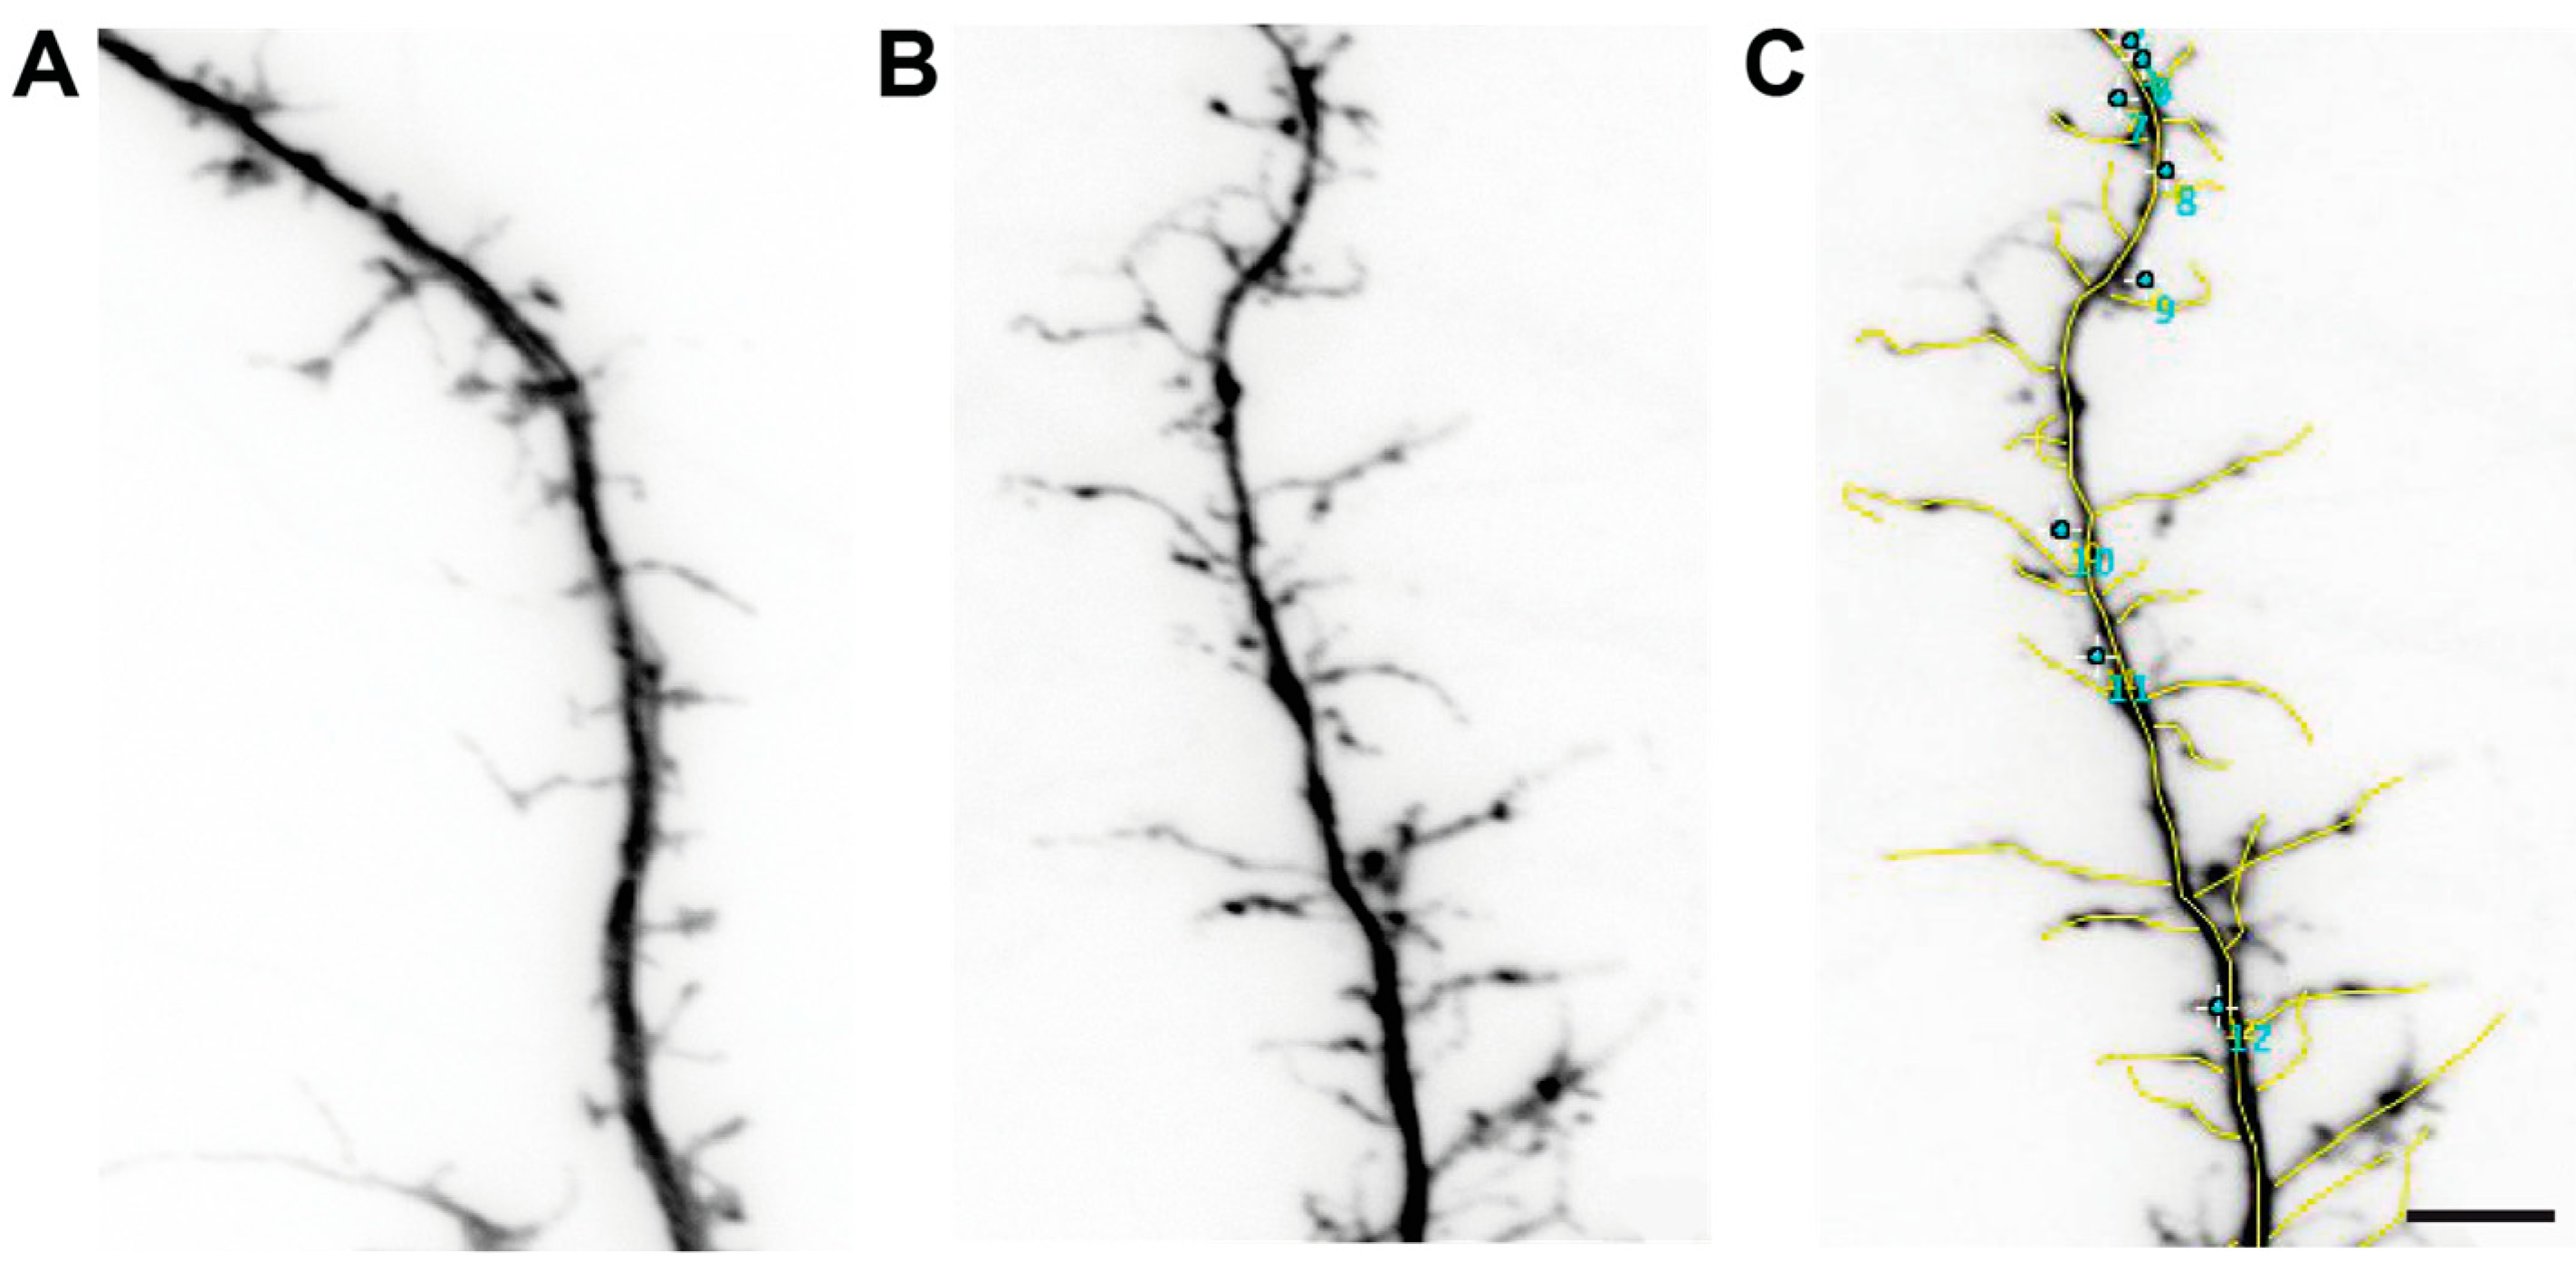
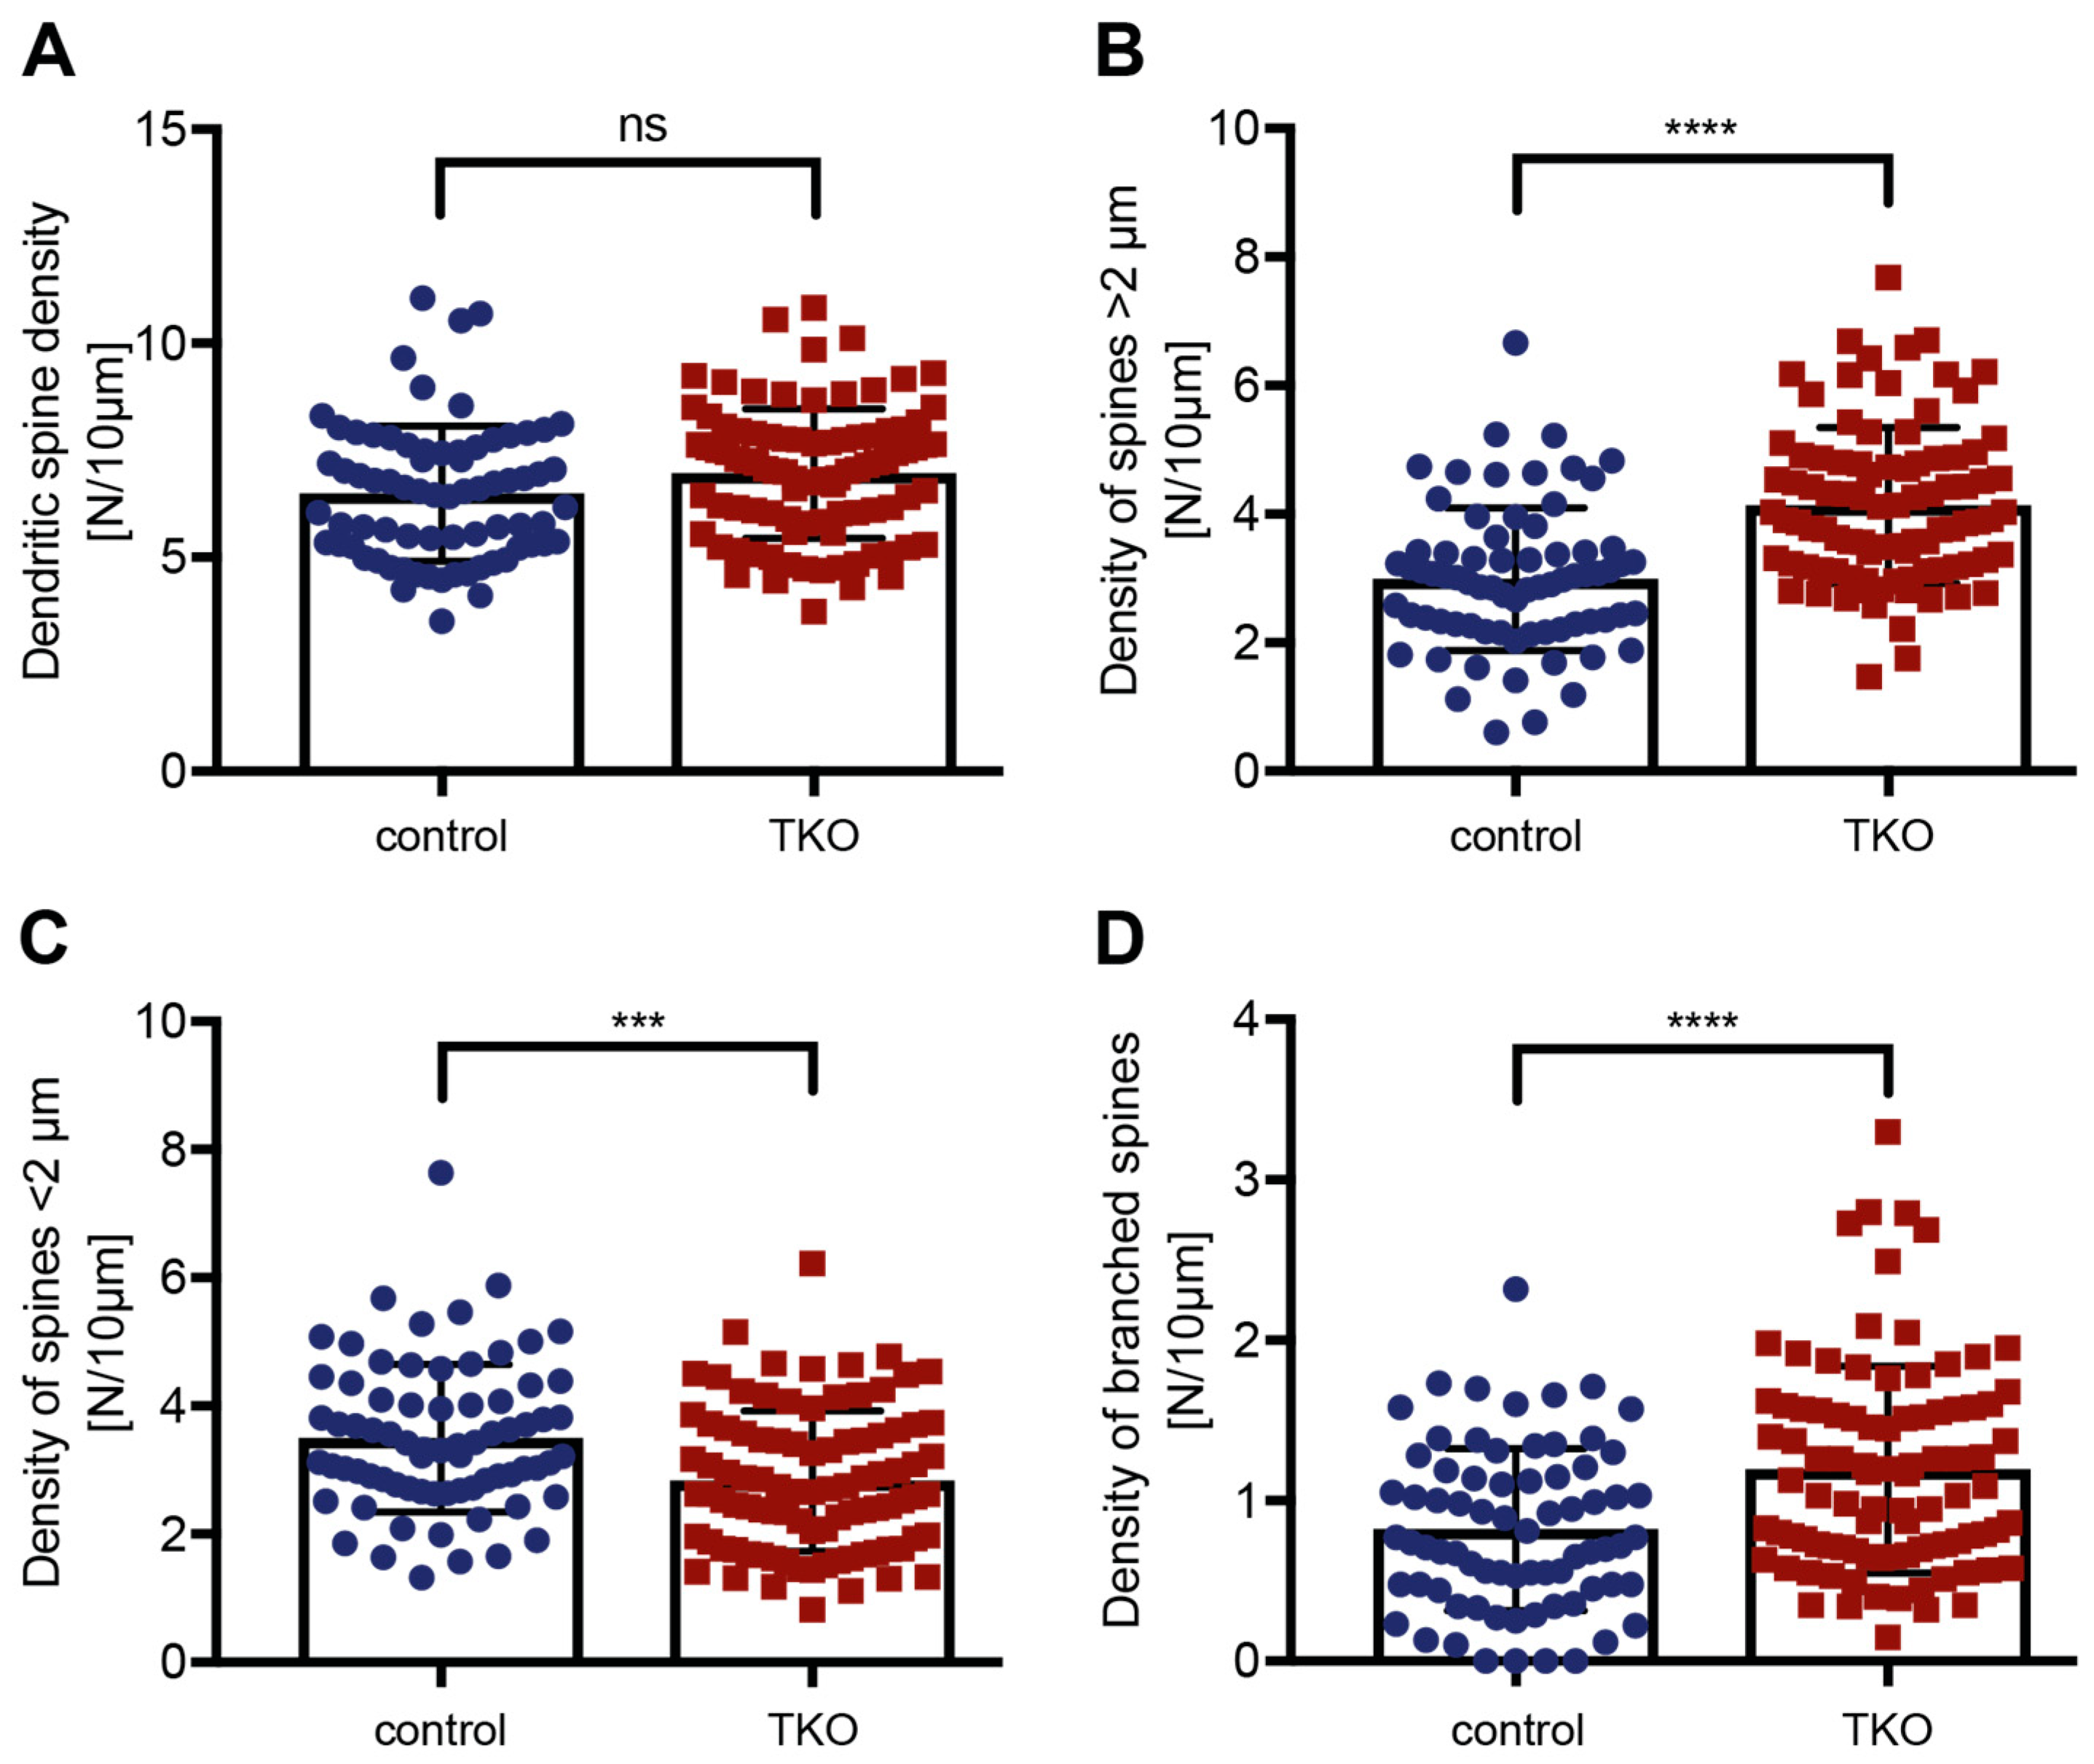
During our analysis of neuromodulator-containing DCVs, we noticed a large number of longer dendritic protrusions in the absence of βNrxn in hippocampal neurons, despite a previous study using cultured neurons derived from the cerebral cortex that did not observe such defects [27]. We therefore first tested if the overall spine density was changed in our primary neurons cultured from the hippocampi of constitutive and conditional βNrxn mutants. To visualize dendrites and spines, we expressed cytosolic t-dimer-RFP in control (Figure 2A) and knockout (Figure 2B,C) neurons and determined their spine density by normalizing absolute numbers of protrusions along randomly chosen dendritic segments to the length of these segments. In cultures of the constitutive βNrxn TKO model, the spine density was undistinguishable from WT control (Figure 3A; WT control: 6.49 ± 0.19 protrusions/10 µm dendrite length, TKO: 6.96 ± 0.16, p = 0.053), consistent with the earlier results in cortical neurons [27]. Attesting to the reliability of our approach, we observed very similar values in measurements from cultures of βNrxn KI neurons expressing Cre recombinase (cKO) or inactive Cremut for control (Cremut control: 6.62 ± 0.20 protrusions/10 µm, Cre cKO: 6.82 ± 0.21, p = 0.48). Thus, deletion of βNrxn in cultures from the hippocampus has no impact on overall spine density.
In our analysis of spine numbers in RFP-transfected neurons from hippocampal cultures, however, we realized that many spinous protrusions from βNrxn-deficient cells extended farther from their dendrite than in comparable controls (Figure 2A,B). To quantify such an effect, we measured the length of all protrusions and classified them in spines either longer or shorter than 2 µm (Figure 2C). Confirming the initial observation, we found that the number of spines >2 µm was increased by almost 40% at dendrites of constitutive βNrxn TKO neurons compared to controls (Figure 3B; WT control: 2.99 ± 0.13 protrusions/10 µm, TKO: 4.13 ± 0.13, p < 0.0001), whereas in contrast, spines below 2 µm length were reduced by almost 20% (Figure 3C; WT control: 3.50 ± 0.13 protrusions/10 µm, TKO: 2.83 ± 0.11, p = 0.0002). In addition, the βNrxn-deficient neurons not only had a higher number of longer spines but also revealed a higher number of branched protrusions which was increased by 45% in comparison to controls (Figure 3D; WT control: 0.82 ± 0.06 protrusions/10 µm, TKO: 1.19 ± 0.07, p < 0.0001). While this difference appears considerable, the absolute number of branched spines amounts only to 13% in controls and 17% in TKO neurons. Together, these data show that dendritic spines in culture extend farther and branch more frequently in the absence of all βNrxn isoforms, while their overall number remains normal.

2.3. Dendritic spine alterations in hippocampal tissue of βNrxn-deficient mice

Our observation of shifts between subpopulations of spines, i.e., shorter vs. longer and branched vs. unbranched, indicate that ßNrxn may exert subtle but significant influence on spine morphology. It is important to note that even small changes, for example, in spine neck length or head width, may represent major functional differences [56,57]. To investigate such morphological alterations in more detail, we decided to focus our further analysis on hippocampal brain tissue from constitutive ßNrxn TKO mice. The rationale for this restriction was fourfold: First, analyses in culture by conventional fluorescence microscopy tend to underestimate distinct subtypes of spines [56]; second, the geometry of the extracellular space in intact tissue affects spinous synapses [58]; third, the physical contact with perisynaptic astrocytic processes of glia cells, absent in our sandwich cell culture [59], is known to affect dendritic spine structure [60,61,62]; and fourth, transmission electron microscopy of fixed tissue samples still represents the benchmark for exquisitely detailed and quantitative analyses of spine morphology [11].
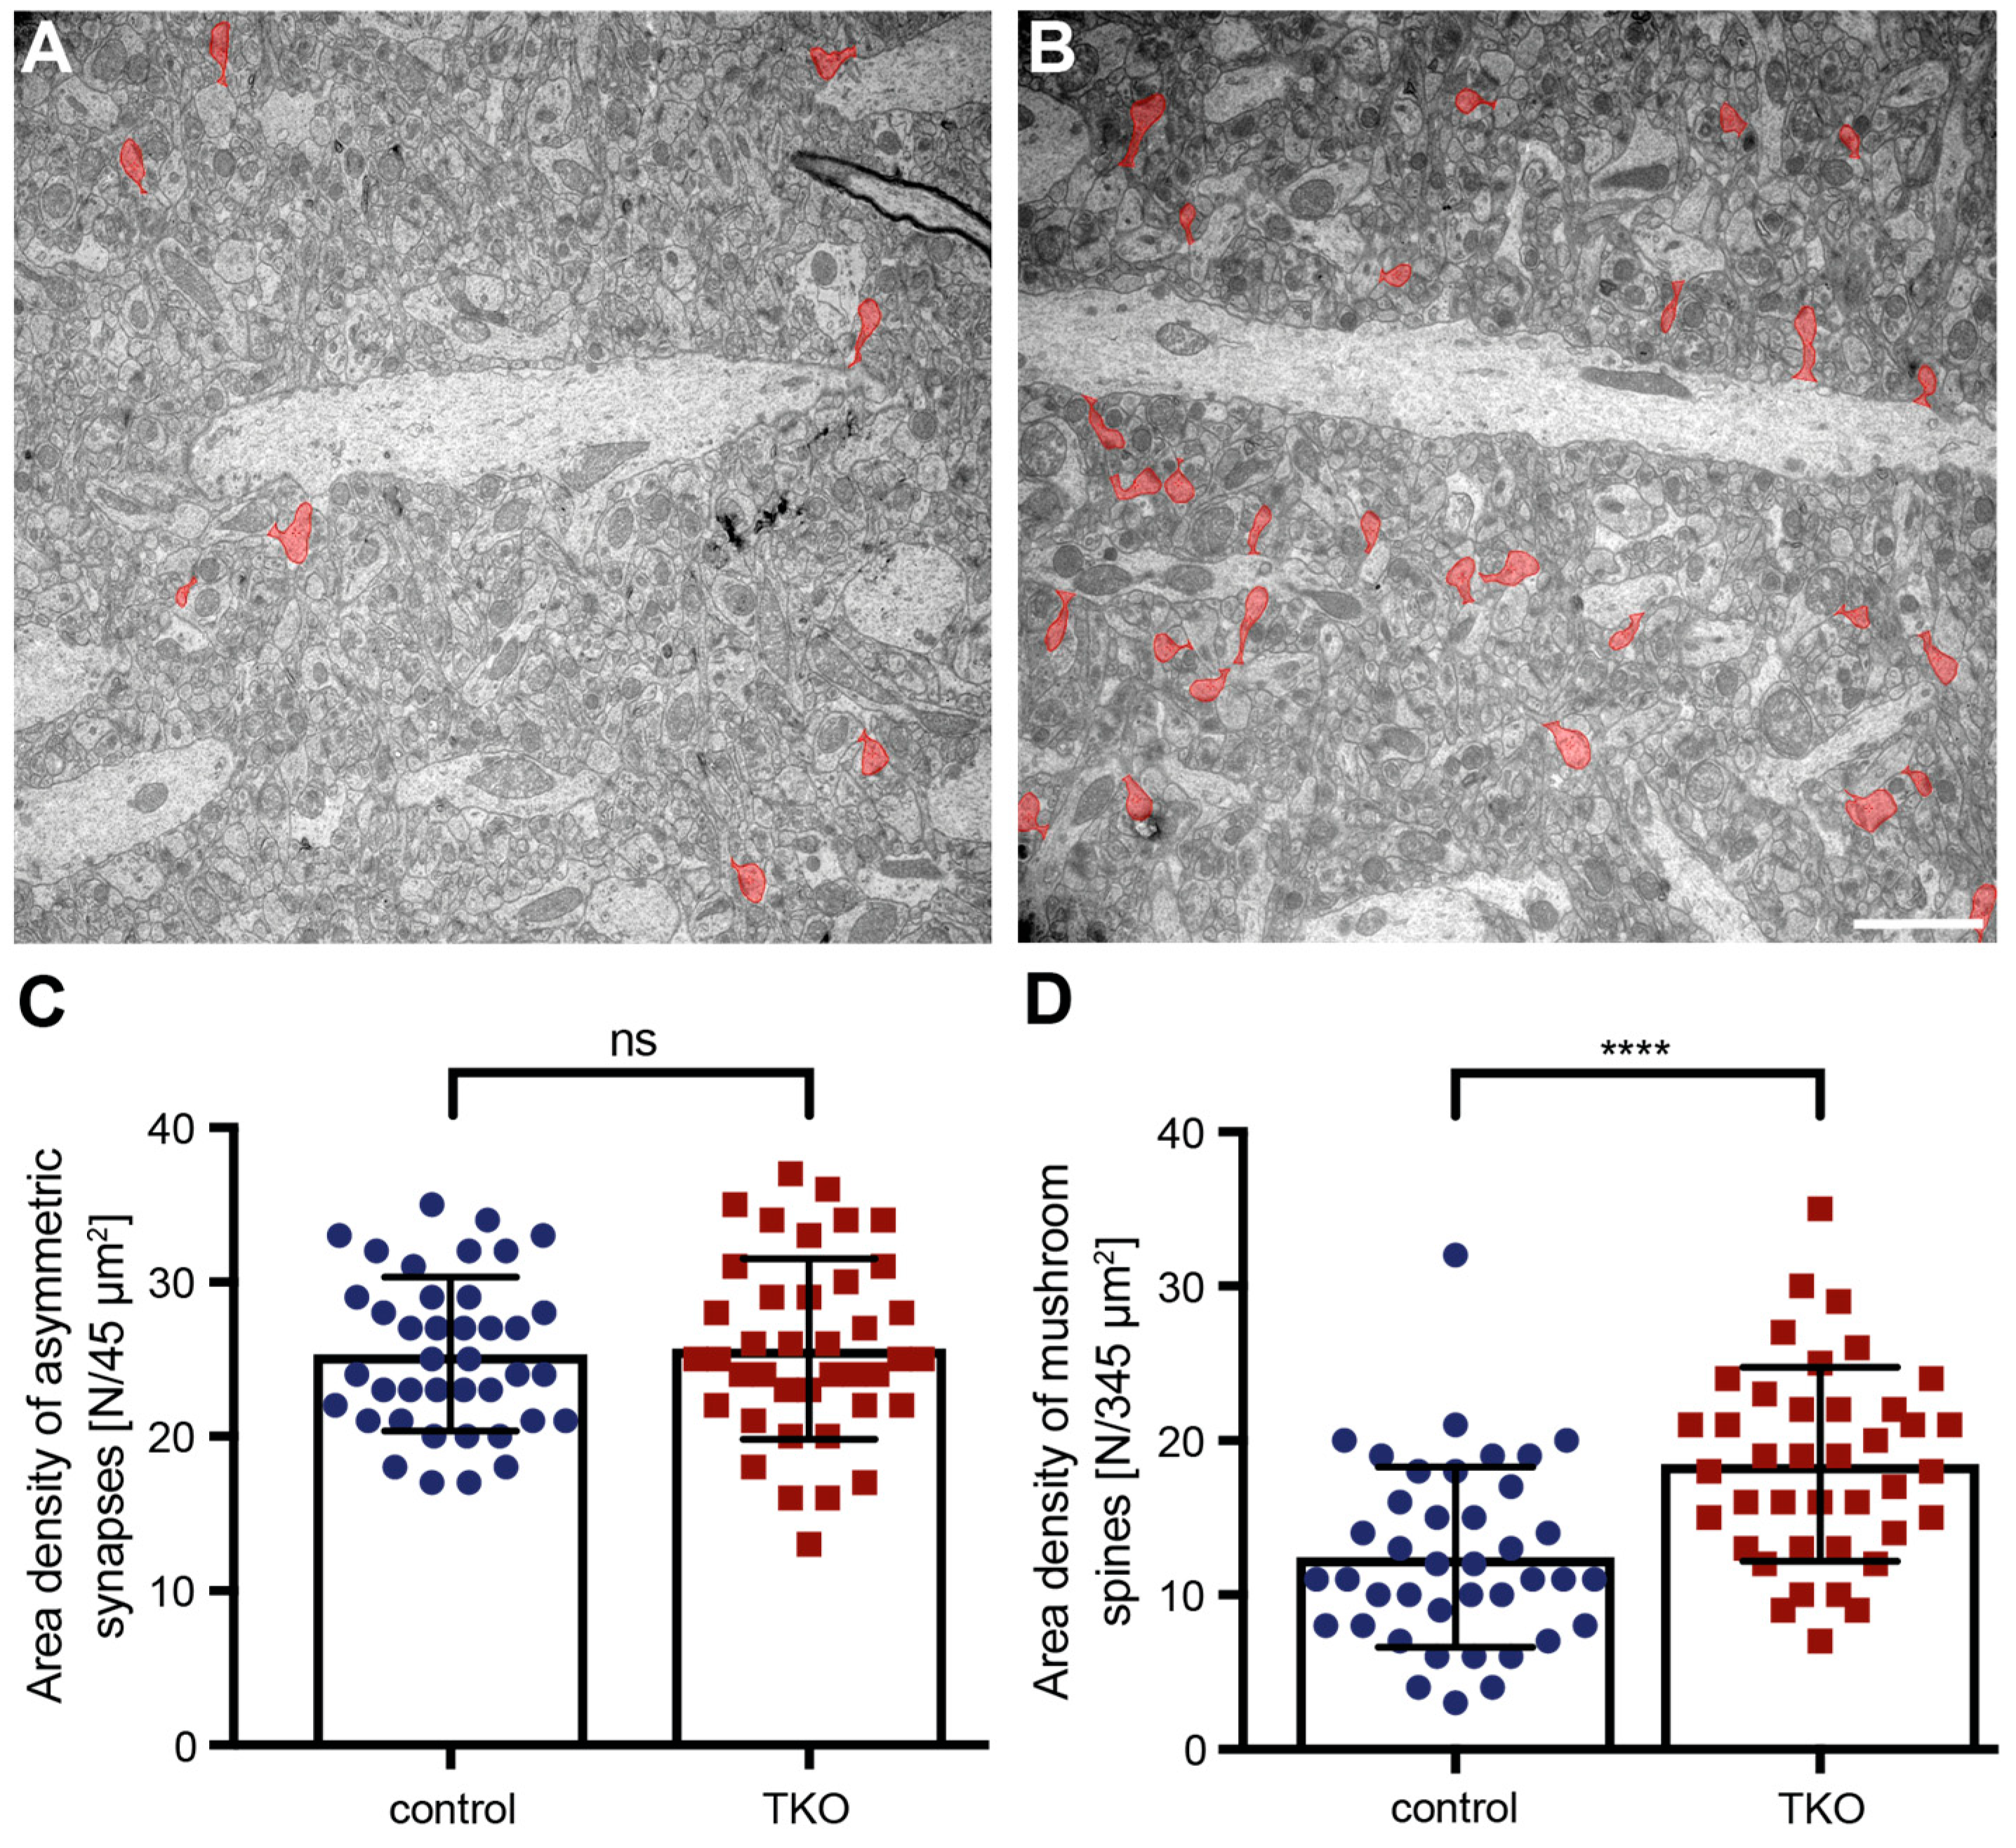
To compare putative changes in spine morphology in intact brain tissue with our results from cultured primary hippocampal neurons (Figure 2 and Figure 3), we prepared samples of the hippocampal CA1 region for electron microscopy and analyzed images from the stratum radiatum (Figure 4A,B) because most excitatory inputs terminate on spines in this layer [11].
We first quantified the overall number of presumptive excitatory synapses by determining the area density of asymmetric terminals based on the classical criteria for ultrastructurally defined type 1 synapses [63], as also described in the Materials & Methods section. Consistent with the unchanged glutamatergic synapse density in cortical cultures [27] and unchanged overall number of spinous protrusions shown above (Figure 3A), we found that the area density of type 1 terminals was very similar in WT control and ßNrxn TKO mice (Figure 4C; WT control: 25.3 ± 0.79 type 1 contacts/45 µm2, TKO: 25.7 ± 0.93, p = 0.7741). To analyze the most mature and stable subtype of dendritic spines in the stratum radiatum of adult CA1 hippocampus [6,7,8], we outlined mushroom spines on the electron microscopic images as defined in the Materials & Methods section (Figure 4A,B; mushroom spines colored in red). Visual appearance, as well as quantification of the area density of mushroom spines, confirmed an increase of almost 50% in the absence of ßNrxn (Figure 4D; WT control: 12.5 ± 0.92 type 1 contacts/345 µm2, TKO: 18.5 ± 0.99, p < 0.0001), indicating that deletion of the synaptic cell adhesion molecules ßNrxn affects the number of a major subpopulation of spines.
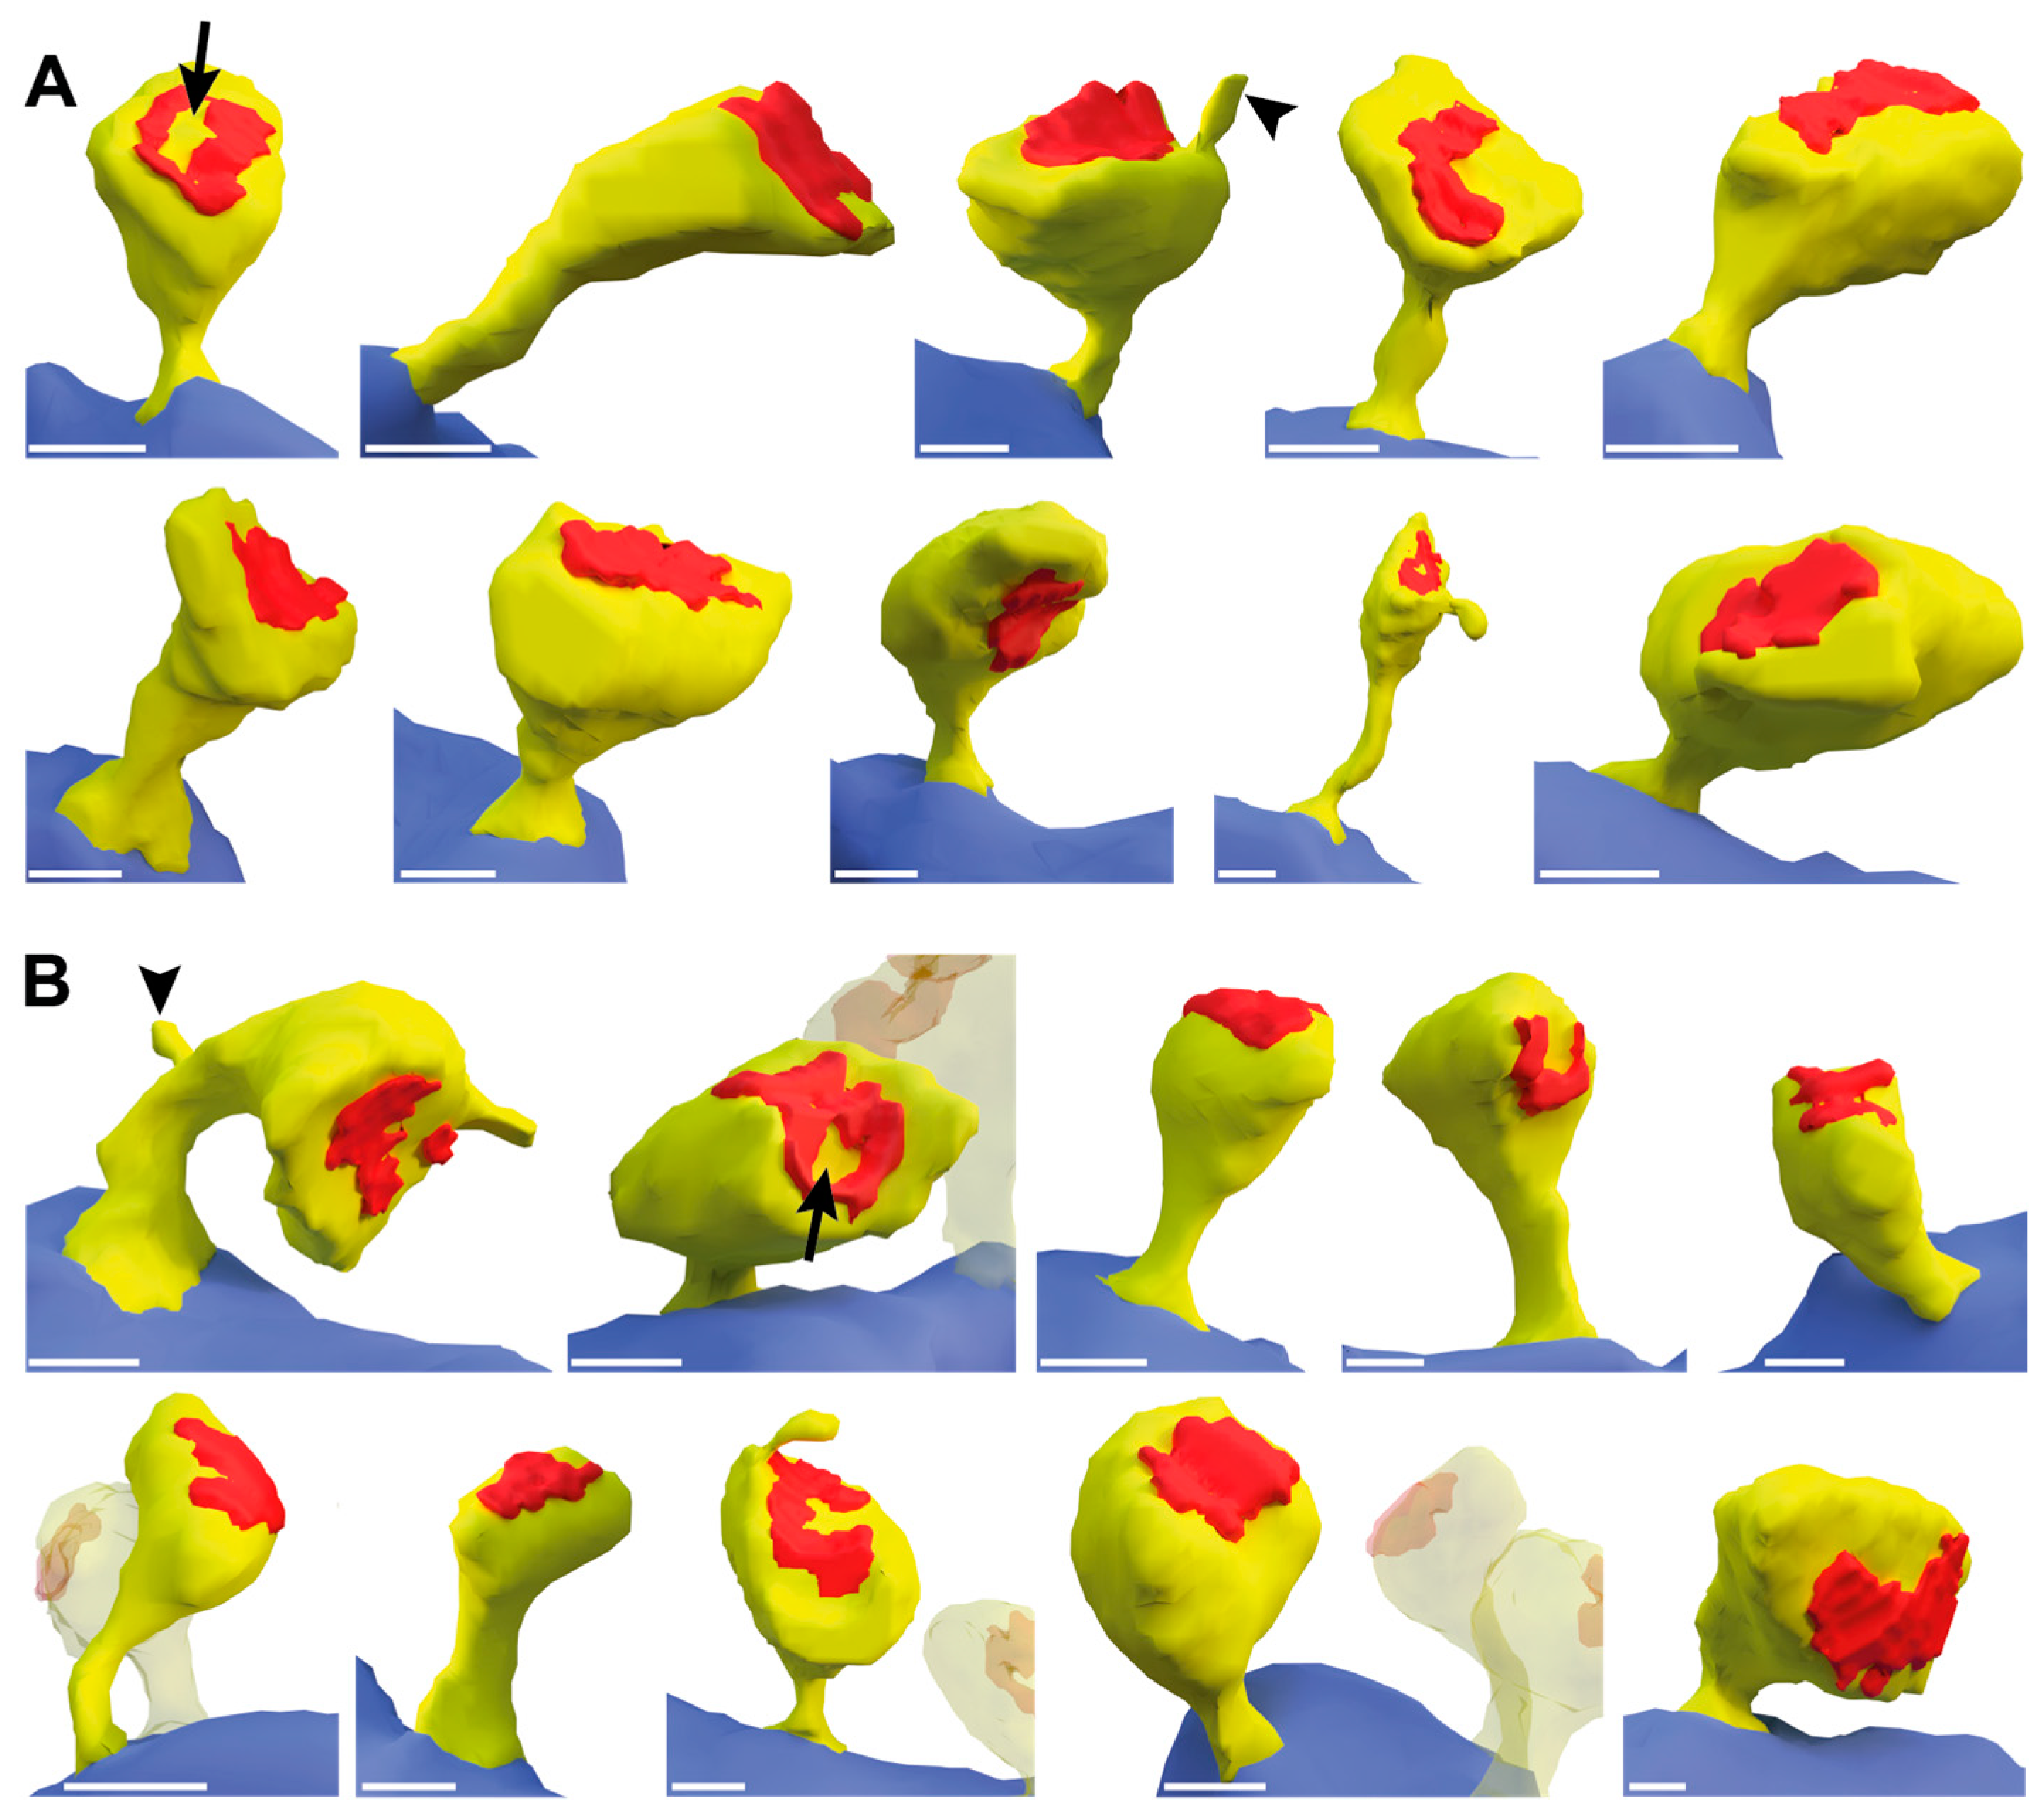
To investigate whether ßNrxn also affects the ultrastructural morphology of mushroom spines, we next reconstructed in 3D about 60 samples from serial sections of control and TKO hippocampi. Suitable viewing angles were selected and 10 representative images of 2D renderings from each genotype are shown in Figure 5. Although the spines displayed are from the same brain region and belong to the same subpopulation, all samples were variable in shape and revealed a unique morphology (Figure 5A,B) as noted before in comparable studies using 3D reconstructions, in particular of hippocampal neurons [11,64,65].
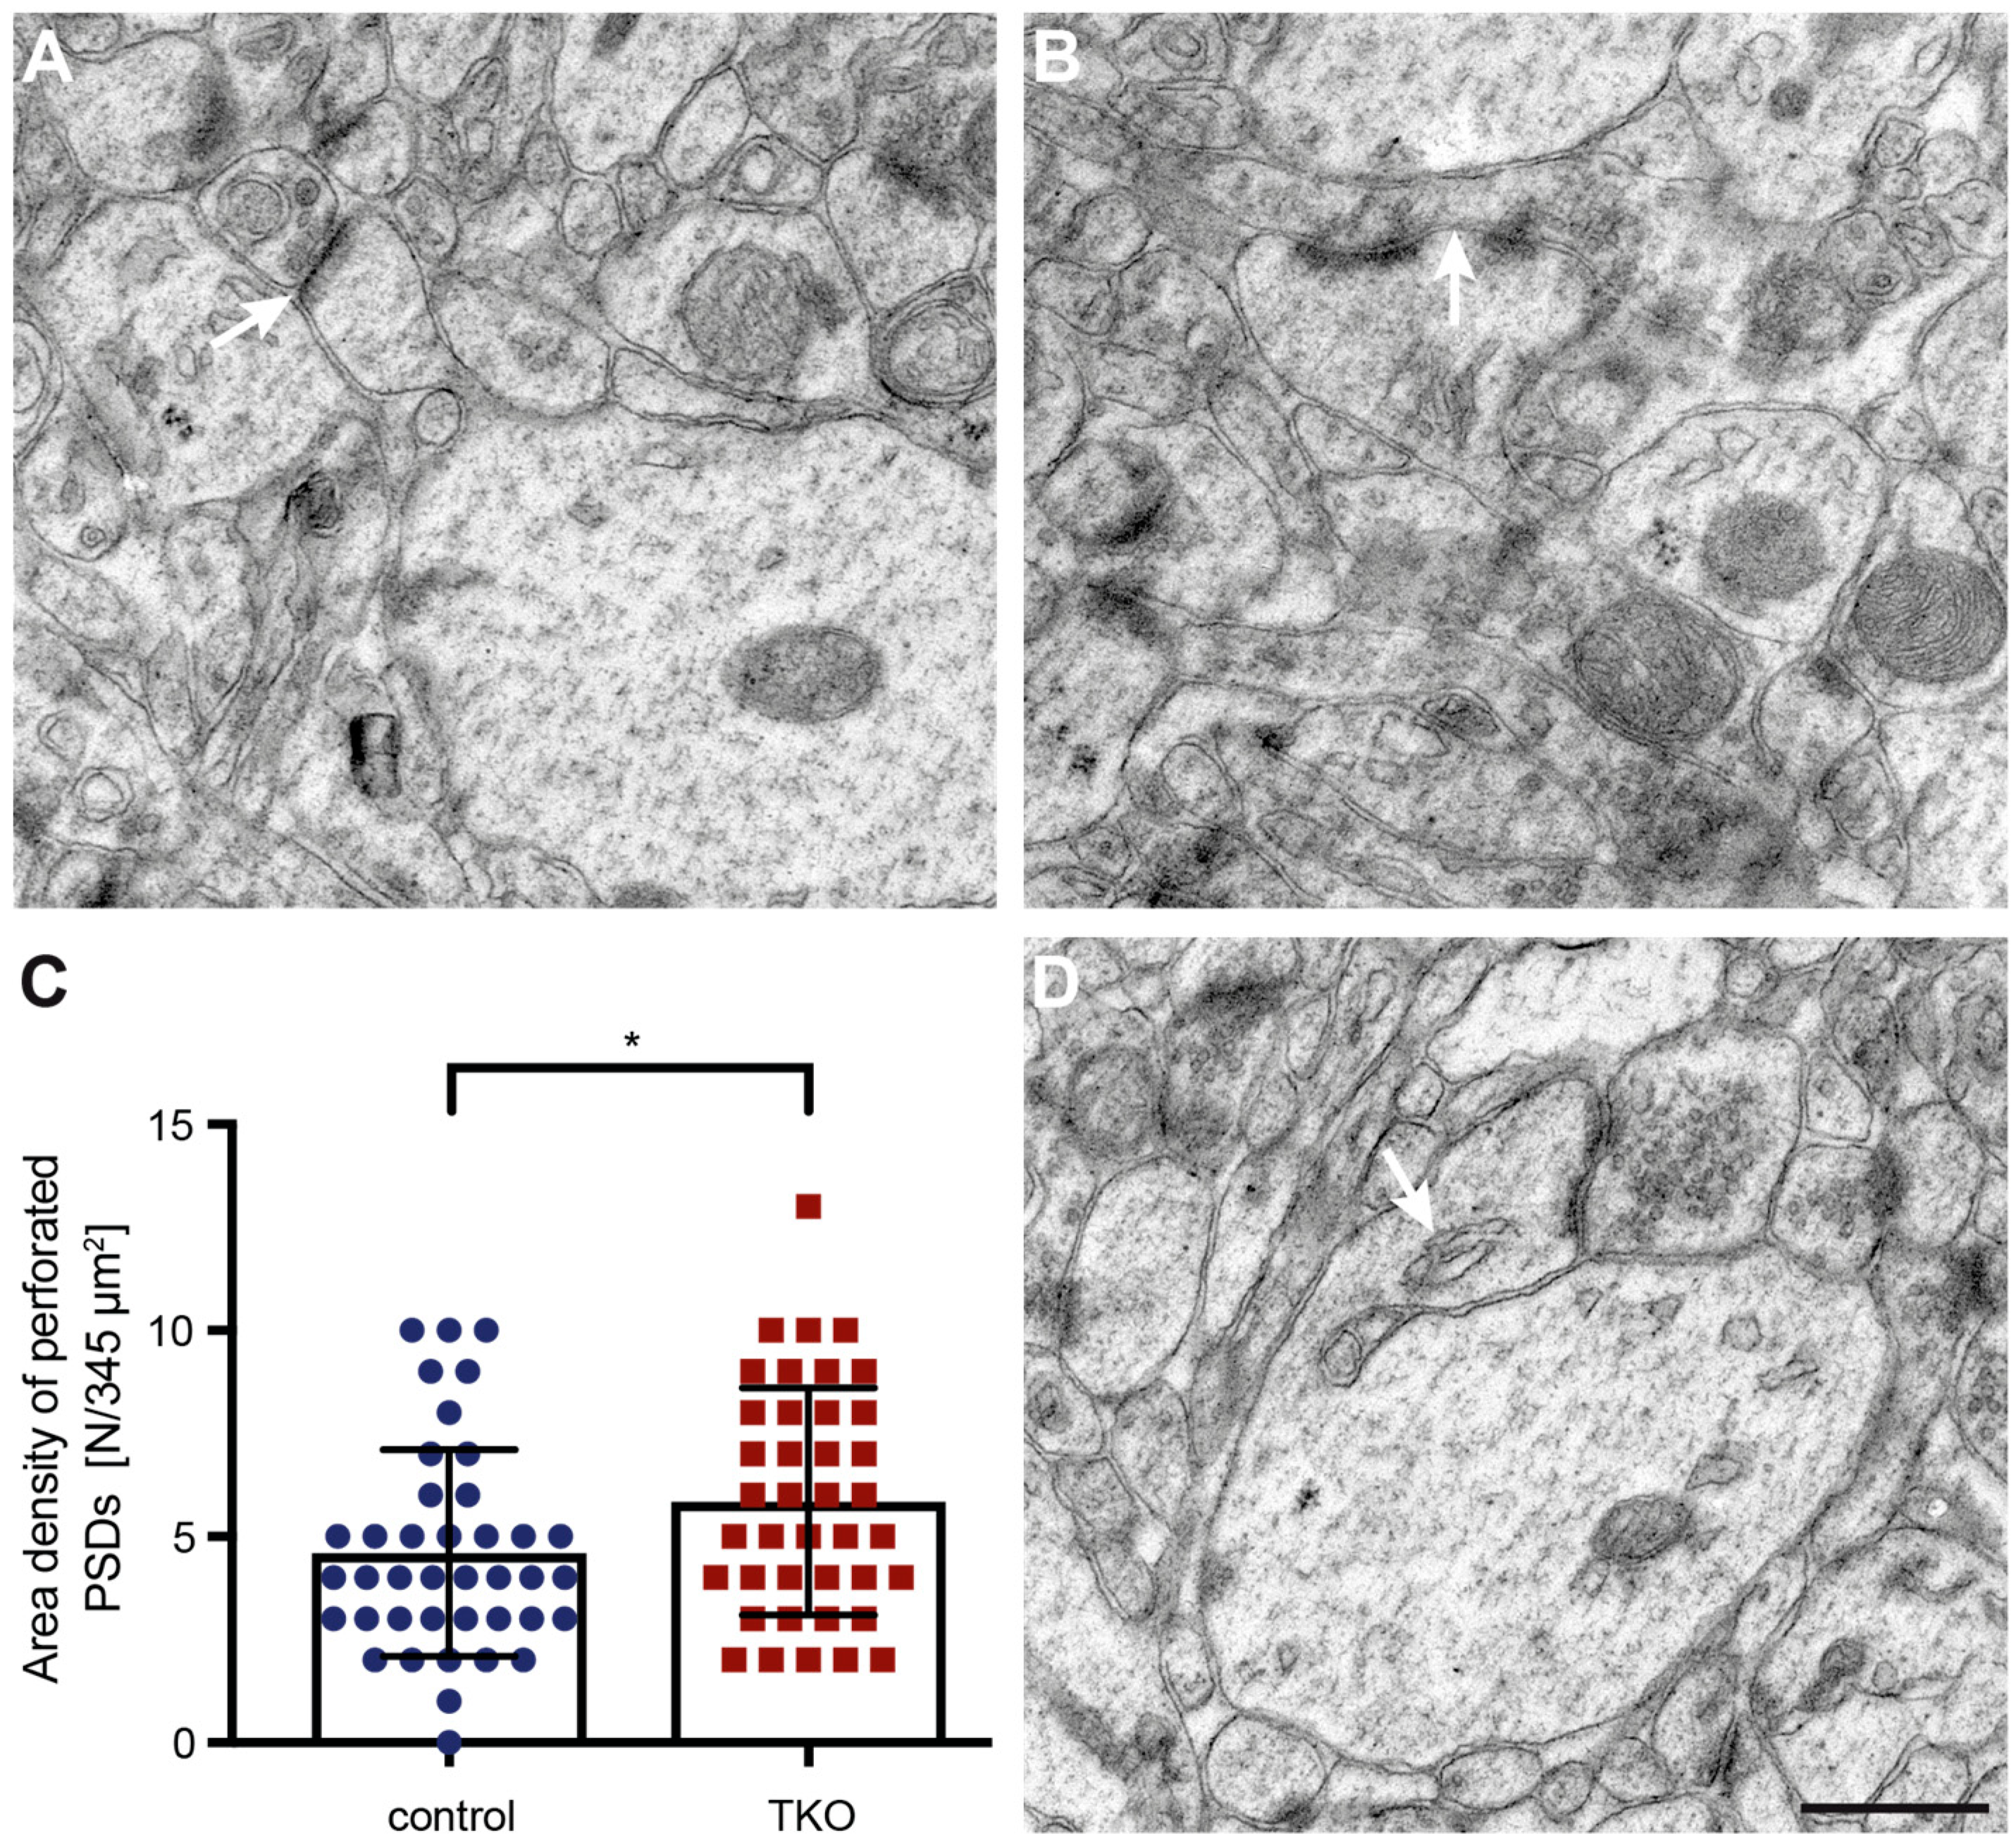
While most morphological features such as curved and straight necks or round and oval heads were detectable in both control and ßNrxn TKO samples, we noticed in ßNrxn-deficient reconstructions a possibly higher number of spines with a prominent perforated PSD. To test this hypothesis, we identified dendritic spine profiles with a perforated PSD (Figure 6A,B) in higher resolution electron microscopic and quantified their area density in ßNrxn TKO samples which was slightly but significantly elevated by about 28% compared to controls (Figure 6C; WT control: 4.6 ± 0.4 perforated PSDs/345 µm2, TKO: 5.85 ± 0.44, p = 0.037). This increase in dendritic spines containing a perforated PSD (Figure 6B) is consistent with the elevated number of mushroom-type protrusions in ßNrxn-deficient samples (Figure 4D) because mushroom spines are generally more likely to contain perforated PSDs [66]. In addition, we noticed dendritic spines with other characteristic ultrastructural features such as spine apparatus (Figure 6D) or spinules (Figure 5) but preliminary estimations did not suggest quantitative differences between the genotypes analyzed here (data not shown).
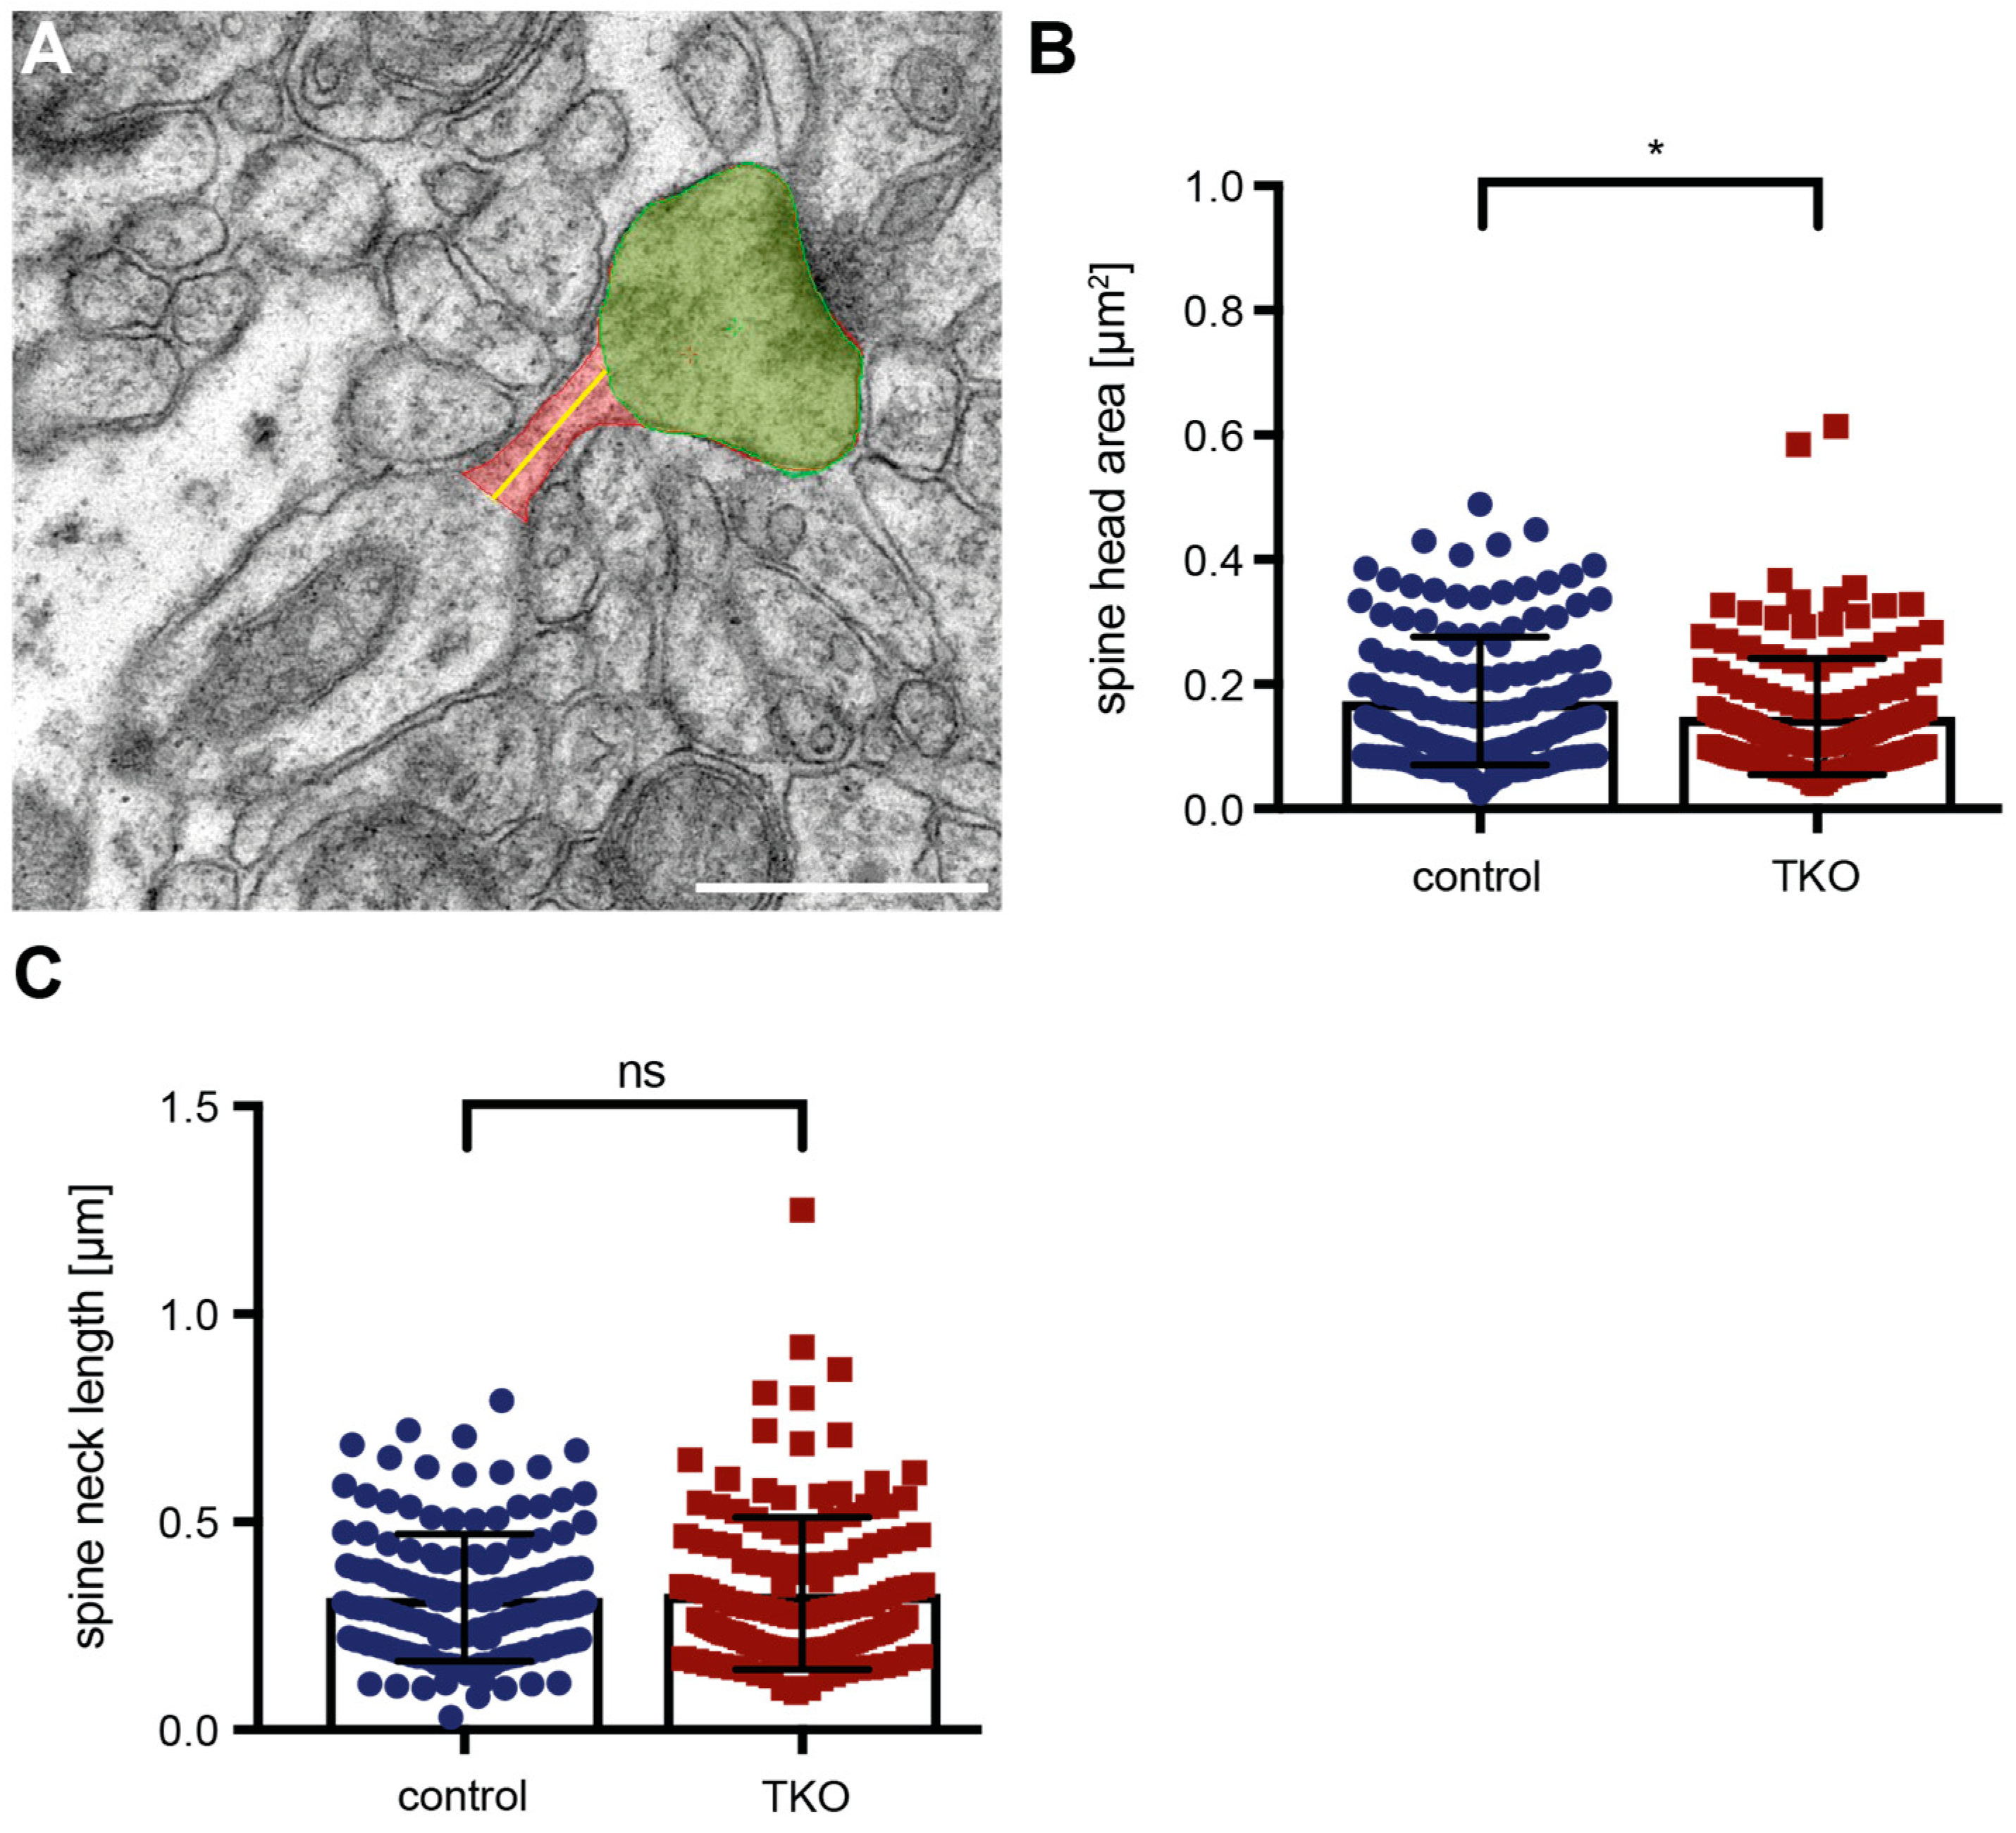
Alterations in the functional strength or responsiveness of spinous synapses are often reflected by changes in the ultrastructure of PSDs [67] such as the increase of perforated PSDs shown here (Figure 6). Additional ultrastructural modifications are known to reflect dendritic spine plasticity, for example, spine head size [64,68] or neck dimensions [56,69]. To finally investigate if these structures are affected by the deletion of the ßNrxn variants, we outlined the head and neck of mushroom spines in our high-resolution electron microscopic images (Figure 7A). Quantitative analysis of the head area of mushroom spines revealed a small reduction of about 12% in ßNrxn-deficient mice compared to controls (WT control: 0.17 ± 0.008 µm2, TKO: 0.15 ± 0.008 µm2, p = 0.0254), whereas their neck length remained unchanged (WT control: 0.32 ± 0.012 µm, TKO: 0.33 ± 0.015 µm2, p = 0.5926). Together, our morphological results demonstrate that deletion of ßNrxn did not change the overall number of excitatory (asymmetric) synaptic contacts but caused a shift towards more mushroom-type spinous synapses with slightly smaller head size and a higher proportion of perforated PSDs.

3. Discussion

Studies using so-called chimeric synapse formation assays in vitro demonstrated a strong synaptogenic activity for recombinantly expressed ßNrxn [32,70,71,72,73], which fostered the expectation that the deletion of these molecules would reduce the number of all or at least of a subpopulation of synaptic contacts. Contrary to such expectations, we show here in ßNrxn knockout mice that the overall number of asymmetric spinous synapses remains unchanged. Strikingly, the absence of ßNrxn even leads to an increase in longer spinous protrusions and more mature mushroom-type spines with slightly reduced head size as well as more spines with perforations of their PSD. Thus, we suggest that presynaptic ßNrxn are necessary to maintain normal proportions of spine subpopulations and normal dendritic spine structure.

3.1. Our strategy to detect the ßNrxn spine phenotype is sensitive and reliable

We hypothesized based on previous analyses of ßNrxn knockouts [27,31,47] that any putative morphological phenotype at synapses, if present at all, was likely moderate rather than bold. We therefore strictly observed the following precautions to obtain reliable results: (i) investigators were blinded to the identity of genotypes of the samples; (ii) all experiments were carried out in at least three independent biological replicates, i.e. three different brains/3 mice and three culture preparations at different timepoints from offspring of 3 timed-pregnancies; (iii) the major conclusions were based on at least two different experimental strategies or distinct methods, i.e. cultures/in vitro versus tissue/in vivo and conditional versus constitutive knockout neurons; and (iv), we made sure to analyze a large enough number of spines (>3,000), dendritic length (> 5,000 µm) or tissue area (>13,000 µm2) per genotype in both experimental models, all exceeding the recommendations for samples sizes outlined recently [10].
We first investigated dendritic spines in primary neurons in vitro due to the superior visibility of fluorescently labeled DCVs and spines in cultures by light microscopy. An advantage of primary neurons grown at low density on glass coverslips is that fewer spines are hidden from view due to their position on the dendrite. Attesting to the robustness of this approach, we determined a density of 6.6 spines/10 µm dendritic length in lentivirus-treated control neurons (Cremut) from the conditional ßNrxn mouse line which was almost identical to the 6.5 spines/10 µm measured in control neurons of the constitutive knockout line (Figure 3). These values are also similar across studies as Anderson and colleagues found 7.5 spines/10 µm in cultured cortical control neurons from the same cKO line used here [27]. Furthermore, our values fit into the general range of 2-10 spines/10 µm dendrite depending on the area of origin and age of neurons as well as on dissociated culture or intact tissue experiments [74,75]. On the downside, neuronal cultures tend to show an inevitable degree of variability depending on conditions such as, for example, plus/minus astrocytes, plus/minus serum, or the cell density chosen, factors that might all affect the time course of spinogenesis and the density of spines. Moreover, due to the inherent resolution limits of conventional epifluorescent microscopy, any classification of spines that relies on precise estimations of head and neck diameters is likely inaccurate [76]. In particular, recent studies using super-resolution microscopy have cautioned that short spines are not sufficiently resolved leading to an overrepresentation of so-called stubby spines with a limited resolution [56].
We therefore measured by fluorescent microscopy in the culture model the labeled DCVs and density of RFP-filled spinous protrusions (Figure 1, Figure 2 and Figure 3) but refrained from a more detailed quantitative investigation of the mushroom-type subpopulation of spines, the prototypical mature and stable subtype in the stratum radiatum of adult CA1 hippocampus [6,7,8]. For this, we relied on fixed tissue from a corresponding hippocampal area and transmission electron microscopy (Figure 4, Figure 6 and Figure 7) because electron microscopy remains the gold standard for the unbiased investigation of the precise dimensions of synapse morphology [77]. Additionally, EM enables three-dimensional reconstructions from serial sections to explore individual protrusions at the highest possible resolution (Figure 5). Thus, we conclude that our approach in this study produced reliable results and was sensitive enough to detect small-to-moderate differences in spine morphology.

3.2. Putative mechanisms to explain the ßNrxn spine phenotype

ßNrxn variants are less abundant than αNrxn [78,79] and show distinct dynamic behavior at the cell surface of axons and synapses where ßNrxn molecules appear less mobile [31,80,81]. Based on their total protein amount in the lowest femtomolar range per µg brain tissue, the copy number of ßNrxn proteins was estimated at 7-16 molecules per synapse [78]. These values might yet be an overestimation since we recently found by uPAINT, dSTORM, and immunoelectron microscopy that about 50% of endogenous ßNrxn molecules are present on the axon outside synapses and that less than 40% of glutamatergic terminals in hippocampal neurons contain ßNrxn [31]. These data suggest that very few copies of ßNrxn might be responsible for the remarkable regulation of both presynaptic DCVs and postsynaptic spine structure reported here. The phenotype of an elevated density of mature mushroom-type spines with slightly reduced head size as well as more synapses with perforations of their PSD may in fact point to a rather specific role of ßNrxn in the regulation of spinous synapses. Such a specific role underscores the earlier idea that βNrxn variants also have non-redundant functions to αNrxn [46] and, consistently, no alteration of spine structure was found in KO mice lacking multiple αNrxn [30]. How, then, can the spine phenotype in KO mice of these highly elusive molecules be explained?
A straightforward possibility could point out that the spine formation or their subtype ratios depend on intact excitatory synaptic release [82] and ßNrxn KO neurons suffer from decreased miniature EPSC frequency, lower presynaptic Ca2+ influx and reduced AMPAR- and NMDAR-mediated evoked EPSCs as reported previously [27,31,47]. However, we did not observe reduced spine numbers but a specific shift towards more mature mushroom-type spines in adult mouse brains, arguing against this possibility. In addition, our result is consistent with other mouse models that completely lack spontaneous and action potential-evoked presynaptic transmitter release from excitatory, glutamatergic synapses but develop an almost normal spine architecture [83,84,85]. In a similar argument, one could suspect that the lower number of neuromodulator-containing DCVs in ßNrxn-deficient neurons (Figure 1; and [47]) is responsible for the spine phenotype. Neuromodulators such as brain-derived neurotrophic factor (BDNF) are stored in presynaptic DCVs of hippocampal neurons [48] and stimulate dendritic spine growth as well as maturation independent of synaptic activity [86,87]. It was a remarkable finding in the earlier analysis that deletion of the very few copies of ßNrxn was sufficient to shift a considerable proportion of presynaptic terminals containing 1-2 DCVs to terminals with zero DCVs [47]. In line with these data, reduced DCV/BDNF levels would rather explain a reduced density of mature mushroom spines, not found in this study (Figure 4). Thus, explanations based on the presynaptic functions of ßNrxn in neurotransmitter or neuromodulator release appear unlikely to account for their role in regulating spine structure.
An alternative possibility to explain how presynaptic ßNrxn might regulate spine plasticity could emphasize that Nrxn molecules constitute building blocks of transsynaptic nanocolumns [25,88]. According to this concept, the different postsynaptic binding partners of Nrxn at excitatory synapses, for example, Nlgn, LRRTM, or Cbln, might preferentially connect them to particular glutamatergic postsynaptic receptors [25,88] that are arranged in distinct clusters within the postsynaptic density [89,90]. For example, splice variants of Nrxn1 have been shown to control NMDA receptor responses and Nrxn3 isoforms control AMPA receptor strength [26,91,92,93]. Since AMPAR-to-NMDAR ratios are linked to spine structure [94,95,96], alterations of spine morphology should be no surprise in the absence of distinct Nrxn variants as shown in this study for ßNrxn. Although this concept appears stringent, there are also confounding observations from knockouts of the postsynaptic binding partners of Nrxn. For example, deletion models of multiple Nlgn variants revealed no major effect on spine numbers [97,98,99], whereas the ablation of another prominent partner, LRRTM1, alone and in combination with SynCAM1, produced a clear reduction in spine numbers [100]. Moreover, deletion of LRRTM1 led to an altered spine morphology with longer spines [101], resembling our finding in neuronal cultures (Figure 2 and Figure 3), and a shift between different subtypes toward fewer mushroom spines [100], the opposite effect of what we observed in βNrxn KOs (Figure 4).
The concept that Nrxn at excitatory synapses may impact AMPAR and NMDAR signaling through alignment in transsynaptic nanocolumns could reconcile the seemingly disparate presynaptic and postsynaptic effects seen in βNrxn mutants here and elsewhere [27,31,47]. Postsynaptic spine plasticity accompanying learning and memory processes can be triggered by sensory stimulation or local glutamate signaling that requires opening of NMDAR [102,103]. Moreover, transient changes in synaptic strength produce opposing effects as spines expand during long-term potentiation (LTP) and shrink with long-term depression (LTD) [8,75]. Accordingly, the reduced spine head dimension reported here for ßNrxn KO neurons (Figure 7) could reflect such an adaptive change because deletion of ßNrxn blocked the induction of LTP in neuronal subpopulations [27]. In support, these adaptive changes often involve actin remodeling in spines [1] and actin-dependent adaptations of spine head curvature could be blocked by the exogenous addition of soluble recombinant Nrxn1ß, possibly by disrupting the formation of transsynaptic complexes with Nlgn [15]. Together, the available data suggest that βNrxn along with their binding partners and postsynaptic receptors are part of transsynaptic nanocolumns which constitute signaling pathways that orchestrate pre- and postsynaptic function and structure.

3.3. Disease association of the ßNrxn phenotype

Human genetic studies have linked disruptions in all three human Nrxn genes (NRXN1-3) to neurodevelopmental disorders such as autism spectrum disorders (ASD) or schizophrenia (SCZ) [104,105,106,107]. Although these disorders present complex genetic pictures consistent with a multiple rare variant scenario and a large number of candidate genes [108,109], defects in Nrxn genes are among the most frequently found variants in ASD cohort studies [110,111]. According to ClinVar, there are currently close to 2,000 mutations in Nrxn genes identified. Most cases represent copy-number variations of parts or the entire gene [112,113,114,115,116]. These clinical studies have also provided valuable insights into a remarkable functional pleiotropy of Nrxn molecules because individuals with ASD, SCZ, intellectual disability, or epilepsy can all harbor Nrxn mutations [105,107]. This pleiotropy along with a frequently observed incomplete penetrance may point to complex genetic compensatory mechanisms at the transcriptomic level [117,118]. Importantly, the pathogenic mutations overlapping with Nrxn are exonic, rare, and non-recurrent, and the majority of patients harbor deletions [116], providing a rationale for the investigation of deletion mouse models.
Even though ßNrxn-specific genomic sequences cover only a small fraction of the chromosomal areas of their respective genes [23,107], several ASD-associated cases have been linked to these ßNrxn sequences. Two rare missense mutations have been identified in exon 18, the first coding exon of Nrxn1ß (amino acid changes: S14L and T40S) causing abnormalities in its unusually long signal peptide [119]. Another study in a different cohort of cases identified two ßNrxn-specific mutations in the Kozak sequence and the initiator methionine of Nrxn1ß in patients suffering from ASD and mental retardation, leading to reduced levels of Nrxn1ß at synapses [120]. Most recently, a case study of a young girl with ASD and global developmental delay reported a ß-specific frameshift mutation 15 amino acids downstream of the signal peptide in exon 18 of Nrxn3 [121]. In addition, some patients with deletions covering sequences shared by αNrxn and ßNrxn have been reported as well for all three Nrxn genes (reviewed in [105,107]). Assuming that the mutations reported in the literature are causative, it is interesting to note that the severity of clinical symptoms does not appear to correspond to any particular isoform (αNrxn or ßNrxn or combined) or gene (Nrxn1-3) affected.
While no ASD-related behavioral analysis has been published thus far for ßNrxn knockout mice, relevant abnormalities such as increased repetitive behavior and impaired social interaction were observed in a transgenic mouse model overexpressing a defective Nrxn1ß construct lacking c-terminal sequences (Nrx1ßΔC) in adult mice [122]. Most importantly, alteration of dendritic spines is generally a hallmark of mouse models of neurodevelopmental disorders [16,17,18,123] and is reported here for ßNrxn-deficient neurons and brains. While most disease models reveal an up- or down-regulated overall spine density [10,17], the combination of an increase of mature mushroom-type spines with an unchanged overall spine density (Figure 3 and Figure 4) and more perforated PSDs (Figure 6) as seen here is relatively rare. Exactly this combination of structural changes, in addition to reduced LTP and EPSPs, was also observed in a mouse model of hippocampal demyelination to study cognitive decline in patients with multiple sclerosis [124]. This is an interesting result because it confirms that under pathological conditions dysfunctional spinous synapses can have more, and not less, mature spines with more perforated PSDs. Such findings are in contrast to the general opinion that a mature mushroom spine morphology reflects intact, strong presynaptic function [8,64,94]. While mouse models of diseases provide essential insights into possible pathomechanisms, there are also caveats. An important lesson could recently be learned from critical tests of the prominent excitatory-to-inhibitory synaptic conductance idea or E-I ratio hypothesis of ASD [125,126]. Although many ASD mouse models show an increased E-I ratio, this might rather reflect a compensation to stabilize synaptic depolarization than lead to hyperexcitability at the level of neural circuitry or social impairment in patients [127,128]. Thus, understanding how specific alterations at synapses, possibly via compensatory processes, translate to the systemic level in ASD patients remains a challenge for the future.

4. Materials and Methods

4.1. Animals

The mouse strains used in this study were previously described [27,31,47]. Briefly, conditional deletion of all βNrxn variants was achieved via transduction with Cre-recombinase expressing lentivirus in neuronal cell cultures from a triple βNrxn floxed mouse strain (βNrxn KI; available from JAX Labs as B6;129-Nx1TM 2 Sud Nx2TM 2 Sud Nx3TM 2 Sud /J, RRID:IMSR_JAX:008416). The constitutive triple βNrxn knockout mice (βNrxn TKO) were created from the same line by crossing to a transgenic Cre recombinase deleter strain (B6.FVB-Tg (Ella-Cre) C5379Lmgd/J; RRID:IMSR_JAX:003724). Conditional and constitutive KO strains were subsequently bred into a C57BL/6J background (RRID:IMSR_JAX:000664) over multiple generations. Mice were maintained at the central animal facility in Münster under standard housing conditions with food and water available ad libitum on a 12 h light/dark cycle. All animal experiments were performed at the University of Münster according to government regulations for animal welfare.

4.2. Analysis of βNrxn-deficient neurons in culture

4.2.1. Neuronal cell culture

Primary hippocampal neurons were prepared from timed-pregnant βNrxn KI and βTKO mice, plated on poly-L-lysine-coated glass coverslips, cocultured on a 70-80% confluent monolayer of mouse astrocytes grown in 12-well plates, and maintained at 37° C in an atmosphere of 95% air and 5% CO2 as described [44,47]. All analysis was done on culture at days-in-vitro (DIV) 19.

4.2.2. Lentivirus production and transduction

The generation of lentivirus particles and the subsequent infection protocol have been described in detail before [31,47]. In this study, βNrxn KI neurons in culture were transduced by two lentivirus vectors, (i) active Cre recombinase expressing virus particles to delete all βNrxn or (ii) inactive Cremut virus for controls. Lentivirus particles were added to neuronal cultures at DIV5 for 3 days. Infection efficiency was routinely checked by nuclear expression of EGFP, which was fused to Cre/ Cremut constructs, and only preparations with an efficiency above 95% were included in our experiments. In addition, fluorescent labeling of MAP2, a cytoskeleton marker in neuronal cell bodies and dendrites was performed in every experiment to verify healthy cell cultures and to exclude cells with compromised architecture.

4.2.3. Transfection of cell cultures

To visualize processes and dendritic spines, βTKO neurons were transfected with pSyn5-t-dimer2-RFP cDNA (T. Oertner, Basel, Switzerland) at DIV 14. In brief, mixtures of 2 µg Lipofectamine 2000 (Fisherscientific, Waltham, MA, United States, Cat #11668019) with 100 µl neuralbasal medium (NBM) and 1 µg of pSyn5-t-dimer2-RFP DNA with 100 µl NBM were combined and incubated for 20 min. The mix was then added dropwise to the neuronal cell culture and incubated for 30 min. Before being transferred back to the astrocyte plate, the neuronal coverslips were washed twice with NBM to remove the transfection mixture. Cells were used 5 days after transfection for immunofluorescence studies.

4.2.4. Immunocytochemistry of cell cultures

For chromogranin A labeling, we used polyclonal rabbit anti-ChrgA primary antibody (1:500; Synaptic Systems Cat #259003, RRID:AB_2619972) and goat anti-rabbit conjugated to Cy3 as secondary antibody (1:500; Jackson ImmunoResearch Labs, Cat #111-165-003, RRID: AB_2338000). For MAP2 labeling, the primary antibody used was polyclonal chicken anti-MAP2 (1:5,000; Abcam Cat #ab5392, RRID: AB_2138153) along with goat anti-chicken as a secondary antibody conjugated to Alexa fluor 647 (1:500; Thermo Fisher Scientific, Cat #A21449, RRID: AB_2535866).

4.2.5. Fluorescent microscopy of cell cultures

Coverslips with primary neurons were dipped in PBS with 4% sucrose and subsequently fixed in 4% paraformaldehyde with 4% sucrose in PBS for 10 min. After washing, they were incubated in a blocking solution (0.3% TritonX-100 and 5% NGS in PBS) for 30 min. Primary antibody staining was performed on a shaker at RT for 1 hour. Neurons were washed and incubated with the secondary fluorescent antibody at RT for 1 hour in the dark. Both antibody solutions contained 5% NGS to prevent unspecific binding. Finally, after washing again in PBS, coverslips were mounted on slides with Dako fluorescent mounting medium. Images were acquired with a x63 oil immersion objective at the VisiScope cell analyzer / Zeiss Axio Imager.Z2 fluorescence microscope (Zeiss, Germany) equipped with VisiView software (Visitron Systems, Puchheim, Germany) and analyzed with ImageJ software (NIH Image, version 2.14.0/1.54f, RRID: SCR_003073).

4.2.6. Analysis of ChrgA-stained axons

The analysis of anti-ChrgA fluorescent intensity of conditional βNrxn KO and constitutive βNrxn TKO neurons and their respective controls was performed by an investigator blinded to the genotype. ChrgA-labeled parts of an axon were outlined by rectangular measuring windows with a width of 5 µm. A maximum of 100 µm ChrgA-positive axonal length per image was analyzed and an average value was calculated. Similar axon lengths were studied for each genotype, including ≈2800 µm for the constitutive βNrxn TKO and ≈1600 µm for conditional βNrxn KO plus the same lengths from their respective control cultures. Three sets of independent neuronal cultures (n=3) from each genotype were included in this analysis.

4.2.7. Analysis of RFP-labeled dendrites and spines

The length of all spines along a dendritic segment as well as the length of the dendritic segment itself were measured in conditional βNrxn KO and constitutive βNrxn TKO neurons and of their respective controls. As outlined in Figure 2, spines longer than 2 µm were marked with a yellow segmented line, and spines shorter than 2 µm were marked with a turquoise point. Branched spines were counted as one spine and only the longer branch was measured and included in the quantification. For spine densities, the overall number of spines, the number of spines longer than 2 µm, and the number of spines shorter than 2 µm were divided by the length of dendritic segments analyzed. In summary, we examined a total dendritic length of 6720 µm with 4601 spines for constitutive βNrxn TKO plus 5010 µm with 3160 spines of their controls and 3450 µm with 2338 spines for conditional βNrxn KO neurons plus 3490 µm with 2295 spines of their controls.

4.3. Electron microscopic analysis of βNrxn-deficient brain tissue

4.3.1. Preparation of mouse hippocampi

The protocols for transcardial perfusion, sample preparation, and embedding of brain tissue from constitutive βNrxn TKO and control mice for transmission electron microscopy were described in detail recently [47]. For this study, we used three mice/genotype and trimmed the resin-embedded hippocampal samples to include the stratum radiatum of CA1 regions. Ultrathin sections of ≈70 nm thickness were mounted on Formvar-coated copper grids and examined on a LIBRA 120 transmission electron microscope (Zeiss, Germany) at 80 kV.

4.3.2. 3D-reconstructions

For 3D reconstructions of dendritic spines, we obtained serial sections from small sharp-edged tissue blocks using a trimming-diamond knife (Trim 45 diamond knife T3516). A continuous band of about 25-30 serial sections (≈ 50 nm thick with a dimension of 0.1 x 1.0 µm) was cut, picked up with a droplet of distilled H2O on an uncoated copper slot grid, and also transferred on droplets. Sections were contrasted with a saturated solution of uranyl acetate, followed by a lead citrate solution. Washing was achieved by transferring the grid from one drop to another (15 drops in total). The grid was then put on a Formvar foil-coated hole of a plastic object slide (Science Services, Germany, Cat #E71891-10, foil), the foil being thicker according to the manufacturer’s instructions. The slide/grid sandwich was dried overnight. The next day, the foil was perforated around the grid with forceps, and the grid was ready to use for TEM. Serial sections through a spine were imaged at the same position with x6300 magnification until the spine disappeared.

4.3.3. Ultrastructural image analysis

To study the ultrastructure of mushroom spines (total number, area of spine heads, length of spine necks) and the number of synapses with perforated PSDs, we obtained images with a magnification of x1260 (or x6300 for illustrative purposes) using the TEM morphometry software (Tröndle, Moorenweis, Germany). The following criteria had to be fulfilled to count for a mushroom spine: Firstly, the dimension of the head width (Figure 7A, green area) was at least twice the diameter of the neck (Figure 7A, red area). Secondly, the total length of the spine was not longer than 2 µm, and thirdly, a clear connection to a dendrite had to be present. The latter was also important for the measurement of the length of the neck (Figure 7A, yellow line). A total area of 13,760 µm2 was studied for constitutive βNrxn TKO and similarly for control mice to count mushroom spine numbers and numbers of spines with perforated PSD. 50 spines of each experiment (150 in total) were further analyzed for head area and neck length. In addition, the numbers of asymmetric synapses were counted in images taken at a magnification of x4000 with a total investigated area of 1,840 µm2 for each, TKO and control animals. To count for an asymmetric synapse, at least three presynaptic vesicles, a visible synaptic cleft, and prominent postsynaptic density had to be present.

4.4. Software and statistics

4.4.1. 3D reconstruction

For the alignment of serial sections, an algorithm was programmed in MATLAB. Dendritic spines of interest were then segmented using the TrakEM2 plugin of ImageJ. After assembly into 3-D structures, each spine was interactively edited with the remesh modifier of the Blender program (Version 3.4.1; RRID:SCR_008606). To reconcile the smoothing of the surface and preservation of relevant details, the following settings were chosen for the voxel size: dendrite 0.1 m, spine 0.05 m, PSD 0.02 m. 10 reconstructed spines of each genotype are presented in Figure 4.

4.4.2. Statistical analysis

All statistical analysis was performed with Prism Software (Version 7.0e, GraphPad; RRID:SCR_002798). Data in the figures are shown ± SEM for KO and control samples. To assess the statistical significance between the two groups, we used a two-tailed unpaired Student’s t-test with Welch’s correction. Significance differences are indicated in detail in the corresponding figure legends.

Author Contributions

Concepstualization, M.M. and A.R.; methodology, L.M. and A.R.; validation, L.M., M.M. and A.R.; formal analysis, L.M. and A.R.; investigation, L.M., J.S. and A.R.; software, J.S.; resources, M.M. and A.R..; data curation, M.M. and A.R..; writing—original draft preparation, M.M.; writing—review and editing, L.M., J.S., M.M. and A.R..; visualization, L.M. and M.M.; supervision, A.R.; project administration, M.M and A.R.; funding acquisition, M.M. All authors have read and agreed to the published version of the manuscript.

Funding

This research was funded by the Deutsche Forschungsgemeinschaft (SFB1348 TP A03 to MM).

Institutional Review Board Statement

The animal study protocol was approved by the Landesamt für Natur, Umwelt und Verbraucherschutz (LANUV, NRW, Germany), license numbers 84-02.05.20.11.209 and 84-02.04.2015.A423.

Data Availability Statement

Data is contained within the article and raw data presented in this study are available on request from the corresponding author.

Acknowledgments

This work is part of the Master thesis of L.M. We thank T. C. Südhof (Stanford University, Palo Alto) for providing βNrxn KI mice (B6;129-Nrxn3TM 2 Sud Nrxn1TM 2 Sud Nrxn2TM 2 Sud /J; JAX Mice database), K. Seiling for assisting with all light and electron microscopic experiments, I. Wolff and K. Kerkhoff for technical support, and E.-F. Löffler for helping with figure preparation.

Conflicts of Interest

The authors declare no conflict of interest.

References

  1. Hotulainen, P.; Hoogenraad, C.C. Actin in dendritic spines: connecting dynamics to function. J. Cell Biol. 2010, 189, 619–629. [Google Scholar] [CrossRef]
  2. Meldolesi, J. Post-Synapses in the Brain: Role of Dendritic and Spine Structures. Biomedicines 2022, 10. [Google Scholar] [CrossRef]
  3. Kasai, H.; Ziv, N.E.; Okazaki, H.; Yagishita, S.; Toyoizumi, T. Spine dynamics in the brain, mental disorders and artificial neural networks. Nat. Rev. Neurosci. 2021, 22, 407–422. [Google Scholar] [CrossRef]
  4. Bourne, J.N.; Harris, K.M. Balancing structure and function at hippocampal dendritic spines. Annu. Rev. Neurosci. 2008, 31, 47–67. [Google Scholar] [CrossRef] [PubMed]
  5. Yuste, R. Dendritic spines and distributed circuits. Neuron 2011, 71, 772–781. [Google Scholar] [CrossRef]
  6. Harris, K.M.; Jensen, F.E.; Tsao, B. Three-dimensional structure of dendritic spines and synapses in rat hippocampus (CA1) at postnatal day 15 and adult ages: implications for the maturation of synaptic physiology and long-term potentiation. J. Neurosci. 1992, 12, 2685–2705. [Google Scholar] [CrossRef] [PubMed]
  7. Basu, R.; Duan, X.; Taylor, M.R.; Martin, E.A.; Muralidhar, S.; Wang, Y.; Gangi-Wellman, L.; Das, S.C.; Yamagata, M.; West, P.J.; et al. Heterophilic Type II Cadherins Are Required for High-Magnitude Synaptic Potentiation in the Hippocampus. Neuron 2017, 96, 160–176.e168. [Google Scholar] [CrossRef]
  8. Bourne, J.; Harris, K.M. Do thin spines learn to be mushroom spines that remember? Curr. Opin. Neurobiol. 2007, 17, 381–386. [Google Scholar] [CrossRef] [PubMed]
  9. Chirillo, M.A.; Waters, M.S.; Lindsey, L.F.; Bourne, J.N.; Harris, K.M. Local resources of polyribosomes and SER promote synapse enlargement and spine clustering after long-term potentiation in adult rat hippocampus. Scientific reports 2019, 9, 3861. [Google Scholar] [CrossRef]
  10. Baczynska, E.; Pels, K.K.; Basu, S.; Wlodarczyk, J.; Ruszczycki, B. Quantification of Dendritic Spines Remodeling under Physiological Stimuli and in Pathological Conditions. Int J Mol Sci 2021, 22. [Google Scholar] [CrossRef]
  11. Harris, K.M.; Weinberg, R.J. Ultrastructure of synapses in the mammalian brain. Cold Spring Harb Perspect Biol 2012, 4. [Google Scholar] [CrossRef] [PubMed]
  12. Alvarez, V.A.; Sabatini, B.L. Anatomical and physiological plasticity of dendritic spines. Annu. Rev. Neurosci. 2007, 30, 79–97. [Google Scholar] [CrossRef] [PubMed]
  13. Kasai, H.; Fukuda, M.; Watanabe, S.; Hayashi-Takagi, A.; Noguchi, J. Structural dynamics of dendritic spines in memory and cognition. Trends Neurosci. 2010, 33, 121–129. [Google Scholar] [CrossRef] [PubMed]
  14. Moyer, C.E.; Zuo, Y. Cortical dendritic spine development and plasticity: insights from in vivo imaging. Curr. Opin. Neurobiol. 2018, 53, 76–82. [Google Scholar] [CrossRef] [PubMed]
  15. Kashiwagi, Y.; Higashi, T.; Obashi, K.; Sato, Y.; Komiyama, N.H.; Grant, S.G.N.; Okabe, S. Computational geometry analysis of dendritic spines by structured illumination microscopy. Nat Commun 2019, 10, 1285. [Google Scholar] [CrossRef] [PubMed]
  16. Lin, Y.C.; Koleske, A.J. Mechanisms of synapse and dendrite maintenance and their disruption in psychiatric and neurodegenerative disorders. Annu. Rev. Neurosci. 2010, 33, 349–378. [Google Scholar] [CrossRef] [PubMed]
  17. Joensuu, M.; Lanoue, V.; Hotulainen, P. Dendritic spine actin cytoskeleton in autism spectrum disorder. Prog. Neuropsychopharmacol. Bol. Psychiatry 2018, 84, 362–381. [Google Scholar] [CrossRef]
  18. Penzes, P.; Cahill, M.E.; Jones, K.A.; VanLeeuwen, J.E.; Woolfrey, K.M. Dendritic spine pathology in neuropsychiatric disorders. Nat. Neurosci. 2011, 14, 285–293. [Google Scholar] [CrossRef]
  19. Gomez, A.M.; Traunmuller, L.; Scheiffele, P. Neurexins: molecular codes for shaping neuronal synapses. Nat. Rev. Neurosci. 2021, 22, 137–151. [Google Scholar] [CrossRef]
  20. Reissner, C.; Runkel, F.; Missler, M. Neurexins. Genome Biol. 2013, 14, 213. [Google Scholar] [CrossRef] [PubMed]
  21. Sudhof, T.C. Synaptic Neurexin Complexes: A Molecular Code for the Logic of Neural Circuits. Cell 2017, 171, 745–769. [Google Scholar] [CrossRef] [PubMed]
  22. Schreiner, D.; Nguyen, T.M.; Russo, G.; Heber, S.; Patrignani, A.; Ahrne, E.; Scheiffele, P. Targeted combinatorial alternative splicing generates brain region-specific repertoires of neurexins. Neuron 2014, 84, 386–398. [Google Scholar] [CrossRef] [PubMed]
  23. Treutlein, B.; Gokce, O.; Quake, S.R.; Sudhof, T.C. Cartography of neurexin alternative splicing mapped by single-molecule long-read mRNA sequencing. Proc. Natl. Acad. Sci. U. S. A. 2014, 111, E1291–E1299. [Google Scholar] [CrossRef] [PubMed]
  24. Biederer, T.; Kaeser, P.S.; Blanpied, T.A. Transcellular Nanoalignment of Synaptic Function. Neuron 2017, 96, 680–696. [Google Scholar] [CrossRef] [PubMed]
  25. Nozawa, K.; Sogabe, T.; Hayashi, A.; Motohashi, J.; Miura, E.; Arai, I.; Yuzaki, M. In vivo nanoscopic landscape of neurexin ligands underlying anterograde synapse specification. Neuron 2022, 110, 3168–3185.e3168. [Google Scholar] [CrossRef]
  26. Lloyd, B.A.; Han, Y.; Roth, R.; Zhang, B.; Aoto, J. Neurexin-3 subsynaptic densities are spatially distinct from Neurexin-1 and essential for excitatory synapse nanoscale organization in the hippocampus. Nat Commun 2023, 14, 4706. [Google Scholar] [CrossRef]
  27. Anderson, G.R.; Aoto, J.; Tabuchi, K.; Foldy, C.; Covy, J.; Yee, A.X.; Wu, D.; Lee, S.J.; Chen, L.; Malenka, R.C.; et al. beta-Neurexins Control Neural Circuits by Regulating Synaptic Endocannabinoid Signaling. Cell 2015, 162, 593–606. [Google Scholar] [CrossRef]
  28. Chen, L.Y.; Jiang, M.; Zhang, B.; Gokce, O.; Sudhof, T.C. Conditional Deletion of All Neurexins Defines Diversity of Essential Synaptic Organizer Functions for Neurexins. Neuron 2017, 94, 611–625.e614. [Google Scholar] [CrossRef]
  29. Missler, M.; Zhang, W.; Rohlmann, A.; Kattenstroth, G.; Hammer, R.E.; Gottmann, K.; Sudhof, T.C. Alpha-neurexins couple Ca2+ channels to synaptic vesicle exocytosis. Nature 2003, 423, 939–948. [Google Scholar] [CrossRef]
  30. Dudanova, I.; Tabuchi, K.; Rohlmann, A.; Sudhof, T.C.; Missler, M. Deletion of alpha-neurexins does not cause a major impairment of axonal pathfinding or synapse formation. J. Comp. Neurol. 2007, 502, 261–274. [Google Scholar] [CrossRef]
  31. Klatt, O.; Repetto, D.; Brockhaus, J.; Reissner, C.; El Khallouqi, A.; Rohlmann, A.; Heine, M.; Missler, M. Endogenous beta-neurexins on axons and within synapses show regulated dynamic behavior. Cell reports 2021, 35, 109266. [Google Scholar] [CrossRef]
  32. Boucard, A.A.; Chubykin, A.A.; Comoletti, D.; Taylor, P.; Sudhof, T.C. A splice code for trans-synaptic cell adhesion mediated by binding of neuroligin 1 to alpha- and beta-neurexins. Neuron 2005, 48, 229–236. [Google Scholar] [CrossRef]
  33. Ichtchenko, K.; Hata, Y.; Nguyen, T.; Ullrich, B.; Missler, M.; Moomaw, C.; Sudhof, T.C. Neuroligin 1: a splice site-specific ligand for beta-neurexins. Cell 1995, 81, 435–443. [Google Scholar] [CrossRef] [PubMed]
  34. Reissner, C.; Klose, M.; Fairless, R.; Missler, M. Mutational analysis of the neurexin/neuroligin complex reveals essential and regulatory components. Proc. Natl. Acad. Sci. U. S. A. 2008, 105, 15124–15129. [Google Scholar] [CrossRef]
  35. de Wit, J.; Sylwestrak, E.; O’Sullivan, M.L.; Otto, S.; Tiglio, K.; Savas, J.N.; Yates, J.R., 3rd; Comoletti, D.; Taylor, P.; Ghosh, A. LRRTM2 interacts with Neurexin1 and regulates excitatory synapse formation. Neuron 2009, 64, 799–806. [Google Scholar] [CrossRef]
  36. Ko, J.; Fuccillo, M.V.; Malenka, R.C.; Sudhof, T.C. LRRTM2 functions as a neurexin ligand in promoting excitatory synapse formation. Neuron 2009, 64, 791–798. [Google Scholar] [CrossRef] [PubMed]
  37. Siddiqui, T.J.; Pancaroglu, R.; Kang, Y.; Rooyakkers, A.; Craig, A.M. LRRTMs and neuroligins bind neurexins with a differential code to cooperate in glutamate synapse development. J. Neurosci. 2010, 30, 7495–7506. [Google Scholar] [CrossRef]
  38. Reissner, C.; Stahn, J.; Breuer, D.; Klose, M.; Pohlentz, G.; Mormann, M.; Missler, M. Dystroglycan Binding to alpha-Neurexin Competes with Neurexophilin-1 and Neuroligin in the Brain. J. Biol. Chem. 2014, 289, 27585–27603. [Google Scholar] [CrossRef]
  39. Sugita, S.; Saito, F.; Tang, J.; Satz, J.; Campbell, K.; Sudhof, T.C. A stoichiometric complex of neurexins and dystroglycan in brain. J. Cell Biol. 2001, 154, 435–445. [Google Scholar] [CrossRef] [PubMed]
  40. Boucard, A.A.; Ko, J.; Sudhof, T.C. High affinity neurexin binding to cell adhesion G-protein-coupled receptor CIRL1/latrophilin-1 produces an intercellular adhesion complex. J. Biol. Chem. 2012, 287, 9399–9413. [Google Scholar] [CrossRef]
  41. Matsuda, K.; Yuzaki, M. Cbln family proteins promote synapse formation by regulating distinct neurexin signaling pathways in various brain regions. Eur. J. Neurosci. 2011, 33, 1447–1461. [Google Scholar] [CrossRef]
  42. Uemura, T.; Lee, S.J.; Yasumura, M.; Takeuchi, T.; Yoshida, T.; Ra, M.; Taguchi, R.; Sakimura, K.; Mishina, M. Trans-synaptic interaction of GluRdelta2 and Neurexin through Cbln1 mediates synapse formation in the cerebellum. Cell 2010, 141, 1068–1079. [Google Scholar] [CrossRef] [PubMed]
  43. Joo, J.Y.; Lee, S.J.; Uemura, T.; Yoshida, T.; Yasumura, M.; Watanabe, M.; Mishina, M. Differential interactions of cerebellin precursor protein (Cbln) subtypes and neurexin variants for synapse formation of cortical neurons. Biochemical and Biophysical Research Communications 2011, 406, 627–632. [Google Scholar] [CrossRef] [PubMed]
  44. Brockhaus, J.; Schreitmuller, M.; Repetto, D.; Klatt, O.; Reissner, C.; Elmslie, K.; Heine, M.; Missler, M. alpha-Neurexins Together with alpha2delta-1 Auxiliary Subunits Regulate Ca(2+) Influx through Cav2.1 Channels. J. Neurosci. 2018, 38, 8277–8294. [Google Scholar] [CrossRef] [PubMed]
  45. Kattenstroth, G.; Tantalaki, E.; Sudhof, T.C.; Gottmann, K.; Missler, M. Postsynaptic N-methyl-D-aspartate receptor function requires alpha-neurexins. Proc. Natl. Acad. Sci. U. S. A. 2004, 101, 2607–2612. [Google Scholar] [CrossRef] [PubMed]
  46. Zhang, W.; Rohlmann, A.; Sargsyan, V.; Aramuni, G.; Hammer, R.E.; Sudhof, T.C.; Missler, M. Extracellular domains of alpha-neurexins participate in regulating synaptic transmission by selectively affecting N- and P/Q-type Ca2+ channels. J. Neurosci. 2005, 25, 4330–4342. [Google Scholar] [CrossRef]
  47. Ferdos, S.; Brockhaus, J.; Missler, M.; Rohlmann, A. Deletion of beta-Neurexins in Mice Alters the Distribution of Dense-Core Vesicles in Presynapses of Hippocampal and Cerebellar Neurons. Frontiers in neuroanatomy 2022, 15, 757017. [Google Scholar] [CrossRef]
  48. Dieni, S.; Matsumoto, T.; Dekkers, M.; Rauskolb, S.; Ionescu, M.S.; Deogracias, R.; Gundelfinger, E.D.; Kojima, M.; Nestel, S.; Frotscher, M.; et al. BDNF and its pro-peptide are stored in presynaptic dense core vesicles in brain neurons. J. Cell Biol. 2012, 196, 775–788. [Google Scholar] [CrossRef]
  49. Puntman, D.C.; Arora, S.; Farina, M.; Toonen, R.F.; Verhage, M. Munc18-1 is essential for neuropeptide secretion in neurons. J. Neurosci. 2021, 41, 5980–5993. [Google Scholar] [CrossRef]
  50. Persoon, C.M.; Moro, A.; Nassal, J.P.; Farina, M.; Broeke, J.H.; Arora, S.; Dominguez, N.; van Weering, J.R.; Toonen, R.F.; Verhage, M. Pool size estimations for dense-core vesicles in mammalian CNS neurons. EMBO J. 2018, 37. [Google Scholar] [CrossRef]
  51. Zagrebelsky, M.; Tacke, C.; Korte, M. BDNF signaling during the lifetime of dendritic spines. Cell Tissue Res 2020, 382, 185–199. [Google Scholar] [CrossRef]
  52. Colucci-D’Amato, L.; Speranza, L.; Volpicelli, F. Neurotrophic Factor BDNF, Physiological Functions and Therapeutic Potential in Depression, Neurodegeneration and Brain Cancer. Int J Mol Sci 2020, 21. [Google Scholar] [CrossRef]
  53. Bharat, V.; Siebrecht, M.; Burk, K.; Ahmed, S.; Reissner, C.; Kohansal-Nodehi, M.; Steubler, V.; Zweckstetter, M.; Ting, J.T.; Dean, C. Capture of Dense Core Vesicles at Synapses by JNK-Dependent Phosphorylation of Synaptotagmin-4. Cell reports 2017, 21, 2118–2133. [Google Scholar] [CrossRef]
  54. Dominguez, N.; van Weering, J.R.T.; Borges, R.; Toonen, R.F.G.; Verhage, M. Dense-core vesicle biogenesis and exocytosis in neurons lacking chromogranins A and B. J. Neurochem. 2018, 144, 241–254. [Google Scholar] [CrossRef]
  55. Sorra, K.E.; Mishra, A.; Kirov, S.A.; Harris, K.M. Dense core vesicles resemble active-zone transport vesicles and are diminished following synaptogenesis in mature hippocampal slices. Neuroscience 2006, 141, 2097–2106. [Google Scholar] [CrossRef] [PubMed]
  56. Tonnesen, J.; Katona, G.; Rozsa, B.; Nagerl, U.V. Spine neck plasticity regulates compartmentalization of synapses. Nat. Neurosci. 2014, 17, 678–685. [Google Scholar] [CrossRef] [PubMed]
  57. Cornejo, V.H.; Ofer, N.; Yuste, R. Voltage compartmentalization in dendritic spines in vivo. Science 2022, 375, 82–86. [Google Scholar] [CrossRef] [PubMed]
  58. Kinney, J.P.; Spacek, J.; Bartol, T.M.; Bajaj, C.L.; Harris, K.M.; Sejnowski, T.J. Extracellular sheets and tunnels modulate glutamate diffusion in hippocampal neuropil. J. Comp. Neurol. 2013, 521, 448–464. [Google Scholar] [CrossRef]
  59. Kaech, S.; Banker, G. Culturing hippocampal neurons. Nat. Protoc. 2006, 1, 2406–2415. [Google Scholar] [CrossRef] [PubMed]
  60. Nishida, H.; Okabe, S. Direct astrocytic contacts regulate local maturation of dendritic spines. J. Neurosci. 2007, 27, 331–340. [Google Scholar] [CrossRef] [PubMed]
  61. Bernardinelli, Y.; Muller, D.; Nikonenko, I. Astrocyte-synapse structural plasticity. Neural Plast 2014, 2014, 232105. [Google Scholar] [CrossRef]
  62. Verbich, D.; Prenosil, G.A.; Chang, P.K.; Murai, K.K.; McKinney, R.A. Glial glutamate transport modulates dendritic spine head protrusions in the hippocampus. Glia 2012, 60, 1067–1077. [Google Scholar] [CrossRef]
  63. Gray, E.G. Axo-somatic and axo-dendritic synapses of the cerebral cortex: an electron microscope study. J. Anat. 1959, 93, 420–433. [Google Scholar] [PubMed]
  64. Arellano, J.I.; Benavides-Piccione, R.; Defelipe, J.; Yuste, R. Ultrastructure of dendritic spines: correlation between synaptic and spine morphologies. Front Neurosci 2007, 1, 131–143. [Google Scholar] [CrossRef] [PubMed]
  65. Rosado, J.; Bui, V.D.; Haas, C.A.; Beck, J.; Queisser, G.; Vlachos, A. Calcium modeling of spine apparatus-containing human dendritic spines demonstrates an “all-or-nothing” communication switch between the spine head and dendrite. PLoS Comput Biol 2022, 18, e1010069. [Google Scholar] [CrossRef]
  66. Sorra, K.E.; Fiala, J.C.; Harris, K.M. Critical assessment of the involvement of perforations, spinules, and spine branching in hippocampal synapse formation. J. Comp. Neurol. 1998, 398, 225–240. [Google Scholar] [CrossRef]
  67. Sun, Y.; Smirnov, M.; Kamasawa, N.; Yasuda, R. Rapid Ultrastructural Changes in the PSD and Surrounding Membrane after Induction of Structural LTP in Single Dendritic Spines. J. Neurosci. 2021, 41, 7003–7014. [Google Scholar] [CrossRef]
  68. Fortin, D.A.; Davare, M.A.; Srivastava, T.; Brady, J.D.; Nygaard, S.; Derkach, V.A.; Soderling, T.R. Long-term potentiation-dependent spine enlargement requires synaptic Ca2+-permeable AMPA receptors recruited by CaM-kinase I. J. Neurosci. 2010, 30, 11565–11575. [Google Scholar] [CrossRef] [PubMed]
  69. Araya, R.; Vogels, T.P.; Yuste, R. Activity-dependent dendritic spine neck changes are correlated with synaptic strength. Proc. Natl. Acad. Sci. U. S. A. 2014. [Google Scholar] [CrossRef]
  70. Chubykin, A.A.; Liu, X.; Comoletti, D.; Tsigelny, I.; Taylor, P.; Sudhof, T.C. Dissection of synapse induction by neuroligins: effect of a neuroligin mutation associated with autism. J. Biol. Chem. 2005, 280, 22365–22374. [Google Scholar] [CrossRef]
  71. Dean, C.; Scholl, F.G.; Choih, J.; DeMaria, S.; Berger, J.; Isacoff, E.; Scheiffele, P. Neurexin mediates the assembly of presynaptic terminals. Nat. Neurosci. 2003, 6, 708–716. [Google Scholar] [CrossRef]
  72. Graf, E.R.; Zhang, X.; Jin, S.X.; Linhoff, M.W.; Craig, A.M. Neurexins induce differentiation of GABA and glutamate postsynaptic specializations via neuroligins. Cell 2004, 119, 1013–1026. [Google Scholar] [CrossRef]
  73. Cvetkovska, V.; Ge, Y.; Xu, Q.; Li, S.; Zhang, P.; Craig, A.M. Neurexin-beta Mediates the Synaptogenic Activity of Amyloid Precursor Protein. J. Neurosci. 2022, 42, 8936–8947. [Google Scholar] [CrossRef]
  74. Nimchinsky, E.A.; Sabatini, B.L.; Svoboda, K. Structure and function of dendritic spines. Annu. Rev. Physiol. 2002, 64, 313–353. [Google Scholar] [CrossRef]
  75. Yuste, R.; Bonhoeffer, T. Morphological changes in dendritic spines associated with long-term synaptic plasticity. Annu. Rev. Neurosci. 2001, 24, 1071–1089. [Google Scholar] [CrossRef]
  76. Kashiwagi, Y.; Okabe, S. Imaging of spine synapses using super-resolution microscopy. Anatomical science international 2021, 96, 343–358. [Google Scholar] [CrossRef] [PubMed]
  77. Borczyk, M.; Radwanska, K.; Giese, K.P. The importance of ultrastructural analysis of memory. Brain Res. Bull. 2021, 173, 28–36. [Google Scholar] [CrossRef] [PubMed]
  78. Schreiner, D.; Simicevic, J.; Ahrne, E.; Schmidt, A.; Scheiffele, P. Quantitative isoform-profiling of highly diversified recognition molecules. eLife 2015, 4, e07794. [Google Scholar] [CrossRef] [PubMed]
  79. Fuccillo, M.V.; Foldy, C.; Gokce, O.; Rothwell, P.E.; Sun, G.L.; Malenka, R.C.; Sudhof, T.C. Single-Cell mRNA Profiling Reveals Cell-Type-Specific Expression of Neurexin Isoforms. Neuron 2015, 87, 326–340. [Google Scholar] [CrossRef] [PubMed]
  80. Fu, Y.; Huang, Z.J. Differential dynamics and activity-dependent regulation of alpha- and beta-neurexins at developing GABAergic synapses. Proc. Natl. Acad. Sci. U. S. A. 2010, 107, 22699–22704. [Google Scholar] [CrossRef] [PubMed]
  81. Neupert, C.; Schneider, R.; Klatt, O.; Reissner, C.; Repetto, D.; Biermann, B.; Niesmann, K.; Missler, M.; Heine, M. Regulated Dynamic Trafficking of Neurexins Inside and Outside of Synaptic Terminals. J. Neurosci. 2015, 35, 13629–13647. [Google Scholar] [CrossRef] [PubMed]
  82. Yuste, R.; Bonhoeffer, T. Genesis of dendritic spines: insights from ultrastructural and imaging studies. Nat. Rev. Neurosci. 2004, 5, 24–34. [Google Scholar] [CrossRef] [PubMed]
  83. Sigler, A.; Oh, W.C.; Imig, C.; Altas, B.; Kawabe, H.; Cooper, B.H.; Kwon, H.B.; Rhee, J.S.; Brose, N. Formation and Maintenance of Functional Spines in the Absence of Presynaptic Glutamate Release. Neuron 2017, 94, 304–311.e304. [Google Scholar] [CrossRef]
  84. Verhage, M.; Maia, A.S.; Plomp, J.J.; Brussaard, A.B.; Heeroma, J.H.; Vermeer, H.; Toonen, R.F.; Hammer, R.E.; van den Berg, T.K.; Missler, M.; et al. Synaptic assembly of the brain in the absence of neurotransmitter secretion. Science 2000, 287, 864–869. [Google Scholar] [CrossRef] [PubMed]
  85. Sando, R.; Bushong, E.; Zhu, Y.; Huang, M.; Considine, C.; Phan, S.; Ju, S.; Uytiepo, M.; Ellisman, M.; Maximov, A. Assembly of Excitatory Synapses in the Absence of Glutamatergic Neurotransmission. Neuron 2017, 94, 312–321.e313. [Google Scholar] [CrossRef]
  86. Tyler, W.J.; Pozzo-Miller, L. Miniature synaptic transmission and BDNF modulate dendritic spine growth and form in rat CA1 neurones. J. Physiol. 2003, 553, 497–509. [Google Scholar] [CrossRef]
  87. Gottmann, K.; Mittmann, T.; Lessmann, V. BDNF signaling in the formation, maturation and plasticity of glutamatergic and GABAergic synapses. Exp. Brain Res. 2009, 199, 203–234. [Google Scholar] [CrossRef]
  88. Ramsey, A.M.; Tang, A.H.; LeGates, T.A.; Gou, X.Z.; Carbone, B.E.; Thompson, S.M.; Biederer, T.; Blanpied, T.A. Subsynaptic positioning of AMPARs by LRRTM2 controls synaptic strength. Sci Adv 2021, 7. [Google Scholar] [CrossRef]
  89. Goncalves, J.; Bartol, T.M.; Camus, C.; Levet, F.; Menegolla, A.P.; Sejnowski, T.J.; Sibarita, J.B.; Vivaudou, M.; Choquet, D.; Hosy, E. Nanoscale co-organization and coactivation of AMPAR, NMDAR, and mGluR at excitatory synapses. Proc. Natl. Acad. Sci. U. S. A. 2020, 117, 14503–14511. [Google Scholar] [CrossRef]
  90. Li, S.; Raychaudhuri, S.; Lee, S.A.; Brockmann, M.M.; Wang, J.; Kusick, G.; Prater, C.; Syed, S.; Falahati, H.; Ramos, R.; et al. Asynchronous release sites align with NMDA receptors in mouse hippocampal synapses. Nat Commun 2021, 12, 677. [Google Scholar] [CrossRef]
  91. Dai, J.; Aoto, J.; Sudhof, T.C. Alternative Splicing of Presynaptic Neurexins Differentially Controls Postsynaptic NMDA and AMPA Receptor Responses. Neuron 2019, 102, 993–1008.e1005. [Google Scholar] [CrossRef] [PubMed]
  92. Aoto, J.; Foldy, C.; Ilcus, S.M.; Tabuchi, K.; Sudhof, T.C. Distinct circuit-dependent functions of presynaptic neurexin-3 at GABAergic and glutamatergic synapses. Nat. Neurosci. 2015, 18, 997–1007. [Google Scholar] [CrossRef]
  93. Dai, J.; Patzke, C.; Liakath-Ali, K.; Seigneur, E.; Sudhof, T.C. GluD1 is a signal transduction device disguised as an ionotropic receptor. Nature 2021, 595, 261–265. [Google Scholar] [CrossRef] [PubMed]
  94. Berry, K.P.; Nedivi, E. Spine Dynamics: Are They All the Same? Neuron 2017, 96, 43–55. [Google Scholar] [CrossRef] [PubMed]
  95. Kasai, H.; Matsuzaki, M.; Noguchi, J.; Yasumatsu, N.; Nakahara, H. Structure-stability-function relationships of dendritic spines. Trends Neurosci. 2003, 26, 360–368. [Google Scholar] [CrossRef] [PubMed]
  96. Bhouri, M.; Morishita, W.; Temkin, P.; Goswami, D.; Kawabe, H.; Brose, N.; Sudhof, T.C.; Craig, A.M.; Siddiqui, T.J.; Malenka, R. Deletion of LRRTM1 and LRRTM2 in adult mice impairs basal AMPA receptor transmission and LTP in hippocampal CA1 pyramidal neurons. Proc. Natl. Acad. Sci. U. S. A. 2018. [Google Scholar] [CrossRef]
  97. Jiang, M.; Polepalli, J.; Chen, L.Y.; Zhang, B.; Sudhof, T.C.; Malenka, R.C. Conditional ablation of neuroligin-1 in CA1 pyramidal neurons blocks LTP by a cell-autonomous NMDA receptor-independent mechanism. Mol. Psychiatry 2017, 22, 375–383. [Google Scholar] [CrossRef]
  98. Varoqueaux, F.; Aramuni, G.; Rawson, R.L.; Mohrmann, R.; Missler, M.; Gottmann, K.; Zhang, W.; Sudhof, T.C.; Brose, N. Neuroligins determine synapse maturation and function. Neuron 2006, 51, 741–754. [Google Scholar] [CrossRef]
  99. Zhang, B.; Chen, L.Y.; Liu, X.; Maxeiner, S.; Lee, S.J.; Gokce, O.; Sudhof, T.C. Neuroligins Sculpt Cerebellar Purkinje-Cell Circuits by Differential Control of Distinct Classes of Synapses. Neuron 2015, 87, 781–796. [Google Scholar] [CrossRef]
  100. de Arce, K.P.; Ribic, A.; Chowdhury, D.; Watters, K.; Thompson, G.J.; Sanganahalli, B.G.; Lippard, E.T.C.; Rohlmann, A.; Strittmatter, S.M.; Missler, M.; et al. Concerted roles of LRRTM1 and SynCAM 1 in organizing prefrontal cortex synapses and cognitive functions. Nat Commun 2023, 14, 459. [Google Scholar] [CrossRef]
  101. Takashima, N.; Odaka, Y.S.; Sakoori, K.; Akagi, T.; Hashikawa, T.; Morimura, N.; Yamada, K.; Aruga, J. Impaired cognitive function and altered hippocampal synapse morphology in mice lacking Lrrtm1, a gene associated with schizophrenia. PloS one 2011, 6, e22716. [Google Scholar] [CrossRef]
  102. Kwon, H.B.; Sabatini, B.L. Glutamate induces de novo growth of functional spines in developing cortex. Nature 2011, 474, 100–104. [Google Scholar] [CrossRef]
  103. Holtmaat, A.; Wilbrecht, L.; Knott, G.W.; Welker, E.; Svoboda, K. Experience-dependent and cell-type-specific spine growth in the neocortex. Nature 2006, 441, 979–983. [Google Scholar] [CrossRef]
  104. Kirov, G.; Rujescu, D.; Ingason, A.; Collier, D.A.; O’Donovan, M.C.; Owen, M.J. Neurexin 1 (NRXN1) deletions in schizophrenia. Schizophr. Bull. 2009, 35, 851–854. [Google Scholar] [CrossRef]
  105. Kasem, E.; Kurihara, T.; Tabuchi, K. Neurexins and neuropsychiatric disorders. Neurosci. Res. 2018, 127, 53–60. [Google Scholar] [CrossRef]
  106. Sudhof, T.C. Neuroligins and neurexins link synaptic function to cognitive disease. Nature 2008, 455, 903–911. [Google Scholar] [CrossRef] [PubMed]
  107. Tromp, A.; Mowry, B.; Giacomotto, J. Neurexins in autism and schizophrenia-a review of patient mutations, mouse models and potential future directions. Mol. Psychiatry 2021, 26, 747–760. [Google Scholar] [CrossRef] [PubMed]
  108. Huguet, G.; Ey, E.; Bourgeron, T. The genetic landscapes of autism spectrum disorders. Annu Rev Genomics Hum Genet 2013, 14, 191–213. [Google Scholar] [CrossRef] [PubMed]
  109. Doherty, J.L.; O’Donovan, M.C.; Owen, M.J. Recent genomic advances in schizophrenia. Clin. Genet. 2012, 81, 103–109. [Google Scholar] [CrossRef] [PubMed]
  110. Larsen, E.; Menashe, I.; Ziats, M.N.; Pereanu, W.; Packer, A.; Banerjee-Basu, S. A systematic variant annotation approach for ranking genes associated with autism spectrum disorders. Molecular autism 2016, 7, 44. [Google Scholar] [CrossRef] [PubMed]
  111. Duda, M.; Zhang, H.; Li, H.D.; Wall, D.P.; Burmeister, M.; Guan, Y. Brain-specific functional relationship networks inform autism spectrum disorder gene prediction. Translational psychiatry 2018, 8, 56. [Google Scholar] [CrossRef]
  112. Kim, H.G.; Kishikawa, S.; Higgins, A.W.; Seong, I.S.; Donovan, D.J.; Shen, Y.; Lally, E.; Weiss, L.A.; Najm, J.; Kutsche, K.; et al. Disruption of neurexin 1 associated with autism spectrum disorder. American Journal of Human Genetics 2008, 82, 199–207. [Google Scholar] [CrossRef] [PubMed]
  113. Szatmari, P.; Paterson, A.D.; Zwaigenbaum, L.; Roberts, W.; Brian, J.; Liu, X.Q.; Vincent, J.B.; Skaug, J.L.; Thompson, A.P.; Senman, L.; et al. Mapping autism risk loci using genetic linkage and chromosomal rearrangements. Nat. Genet. 2007, 39, 319–328. [Google Scholar] [CrossRef] [PubMed]
  114. Bucan, M.; Abrahams, B.S.; Wang, K.; Glessner, J.T.; Herman, E.I.; Sonnenblick, L.I.; Alvarez Retuerto, A.I.; Imielinski, M.; Hadley, D.; Bradfield, J.P.; et al. Genome-wide analyses of exonic copy number variants in a family-based study point to novel autism susceptibility genes. PLoS Genet. 2009, 5, e1000536. [Google Scholar] [CrossRef]
  115. Glessner, J.T.; Wang, K.; Cai, G.; Korvatska, O.; Kim, C.E.; Wood, S.; Zhang, H.; Estes, A.; Brune, C.W.; Bradfield, J.P.; et al. Autism genome-wide copy number variation reveals ubiquitin and neuronal genes. Nature 2009, 459, 569–573. [Google Scholar] [CrossRef] [PubMed]
  116. Lowther, C.; Speevak, M.; Armour, C.M.; Goh, E.S.; Graham, G.E.; Li, C.; Zeesman, S.; Nowaczyk, M.J.; Schultz, L.A.; Morra, A.; et al. Molecular characterization of NRXN1 deletions from 19,263 clinical microarray cases identifies exons important for neurodevelopmental disease expression. Genet. Med. 2017, 19, 53–61. [Google Scholar] [CrossRef] [PubMed]
  117. Flaherty, E.; Zhu, S.; Barretto, N.; Cheng, E.; Deans, P.J.M.; Fernando, M.B.; Schrode, N.; Francoeur, N.; Antoine, A.; Alganem, K.; et al. Neuronal impact of patient-specific aberrant NRXN1alpha splicing. Nat. Genet. 2019, 51, 1679–1690. [Google Scholar] [CrossRef]
  118. Ebert, D.H.; Greenberg, M.E. Activity-dependent neuronal signalling and autism spectrum disorder. Nature 2013, 493, 327–337. [Google Scholar] [CrossRef]
  119. Feng, J.; Schroer, R.; Yan, J.; Song, W.; Yang, C.; Bockholt, A.; Cook, E.H., Jr.; Skinner, C.; Schwartz, C.E.; Sommer, S.S. High frequency of neurexin 1beta signal peptide structural variants in patients with autism. Neurosci. Lett. 2006, 409, 10–13. [Google Scholar] [CrossRef]
  120. Camacho-Garcia, R.J.; Planelles, M.I.; Margalef, M.; Pecero, M.L.; Martinez-Leal, R.; Aguilera, F.; Vilella, E.; Martinez-Mir, A.; Scholl, F.G. Mutations affecting synaptic levels of neurexin-1beta in autism and mental retardation. Neurobiol. Dis. 2012, 47, 135–143. [Google Scholar] [CrossRef]
  121. Feichtinger, R.G.; Preisel, M.; Brugger, K.; Wortmann, S.B.; Mayr, J.A. Case Report-An Inherited Loss-of-Function NRXN3 Variant Potentially Causes a Neurodevelopmental Disorder with Autism Consistent with Previously Described 14q24.3-31.1 Deletions. Genes (Basel) 2023, 14. [Google Scholar] [CrossRef] [PubMed]
  122. Rabaneda, L.G.; Robles-Lanuza, E.; Nieto-Gonzalez, J.L.; Scholl, F.G. Neurexin dysfunction in adult neurons results in autistic-like behavior in mice. Cell reports 2014, 8, 338–346. [Google Scholar] [CrossRef] [PubMed]
  123. Blanpied, T.A.; Ehlers, M.D. Microanatomy of dendritic spines: emerging principles of synaptic pathology in psychiatric and neurological disease. Biol. Psychiatry 2004, 55, 1121–1127. [Google Scholar] [CrossRef] [PubMed]
  124. Baltan, S.; Jawaid, S.S.; Chomyk, A.M.; Kidd, G.J.; Chen, J.; Battapady, H.D.; Chan, R.; Dutta, R.; Trapp, B.D. Neuronal hibernation following hippocampal demyelination. Acta Neuropathol Commun 2021, 9, 34. [Google Scholar] [CrossRef] [PubMed]
  125. Del Pino, I.; Rico, B.; Marin, O. Neural circuit dysfunction in mouse models of neurodevelopmental disorders. Curr. Opin. Neurobiol. 2018, 48, 174–182. [Google Scholar] [CrossRef] [PubMed]
  126. Rubenstein, J.L.; Merzenich, M.M. Model of autism: increased ratio of excitation/inhibition in key neural systems. Genes Brain Behav 2003, 2, 255–267. [Google Scholar] [CrossRef]
  127. Antoine, M.W.; Langberg, T.; Schnepel, P.; Feldman, D.E. Increased Excitation-Inhibition Ratio Stabilizes Synapse and Circuit Excitability in Four Autism Mouse Models. Neuron 2019, 101, 648–661.e644. [Google Scholar] [CrossRef]
  128. Nelson, S.B.; Valakh, V. Excitatory/Inhibitory Balance and Circuit Homeostasis in Autism Spectrum Disorders. Neuron 2015, 87, 684–698. [Google Scholar] [CrossRef]
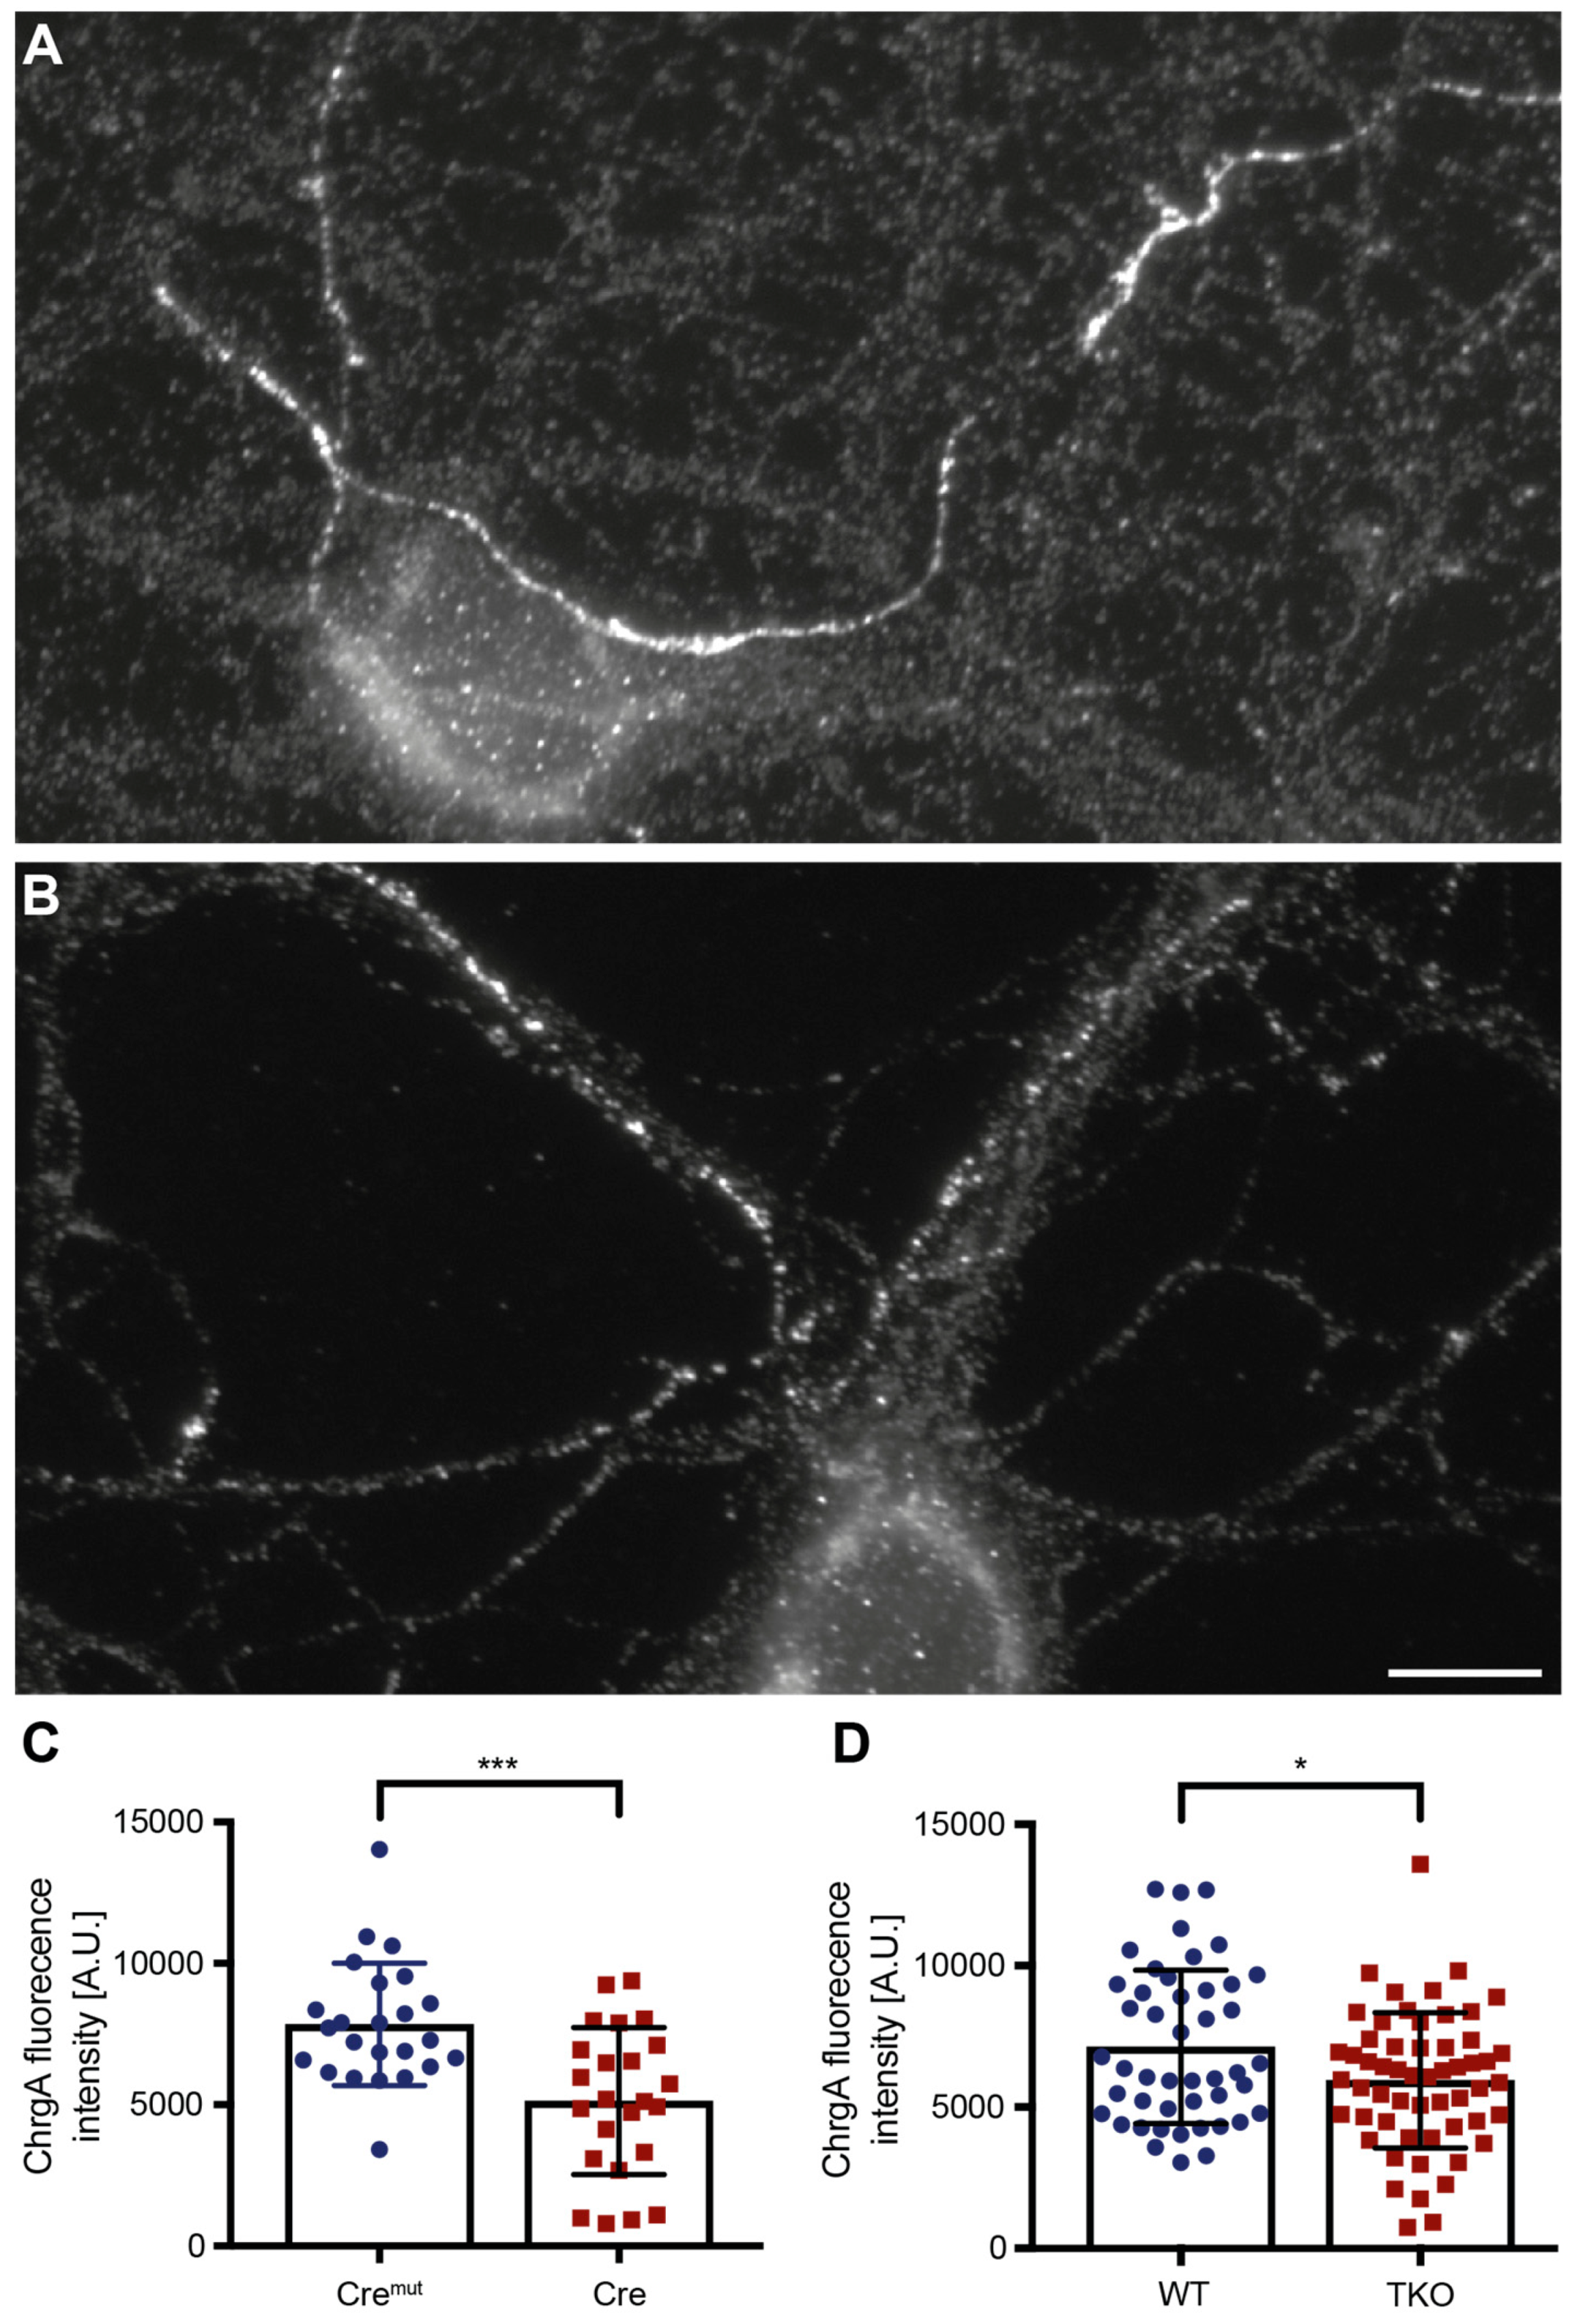
Figure 1. Reduction in chromogranin A (ChrgA) levels in conditional and constitutive ßNrxn KO neurons. Representative images for ChrgA immunofluorescence labeling of primary hippocampal neurons from control (A) and constitutive ßNrxn TKO (B) mice. Scale bar, 10 µm. (C) Quantification of mean ChrgA fluorescence intensity in floxed ßNrxn KI neurons transduced with lentivirus expressing either inactive (Cremut) or active Cre recombinase. (D) Comparison of mean fluorescence intensity in neurons from constitutive ßNrxn TKO neurons and their controls (WT), confirming reduction of ChrgA-positive DCVs in the absence of ßNrxn. Data are from three independent cultures per genotype and mouse line, and are shown as mean ± SEM; two-sided unpaired t-test with significance levels indicated as *p < 0.05, ***p < 0.001.
Preprints 94212 g001
Figure 2. Morphology of dendritic spines in cultured βNrxn-deficient neurons. Representative images of dendrites and spinous protrusions of primary hippocampal neurons from WT control (A) and constitutive ßNrxn TKO (B) mice transfected with pSyn5-t-dimer2-RFP. (C) Classification of different dendritic spine types according to length of protrusions. Spines longer than 2 µm were marked with a segmented line (yellow) and spines shorter than 2 µm with a point (turquoise). Scale bar, 5 µm.
Preprints 94212 g002
Figure 3. Increased proportion of longer and branched dendritic spines in ßNrxn-deficient neurons. (A) The number of spines per 10 µm dendritic length does not significantly differ between control and ßNrxn TKO neurons. The number of spines longer than 2 µm is increased in mutant neurons (B), while the number of spines shorter than 2 µm is decreased (C). (D) The number of branched spines was augmented in ßNrxn TKO neurons. Data are from three independent cultures per genotype and shown as mean ± SEM; two-sided unpaired t-test with *p < 0.05, ***p < 0.001, ****p < 0.0001, and ns = non-significant.
Preprints 94212 g003
Figure 4. Increase in the number of mushroom spines in ßNrxn-deficient mice. Representative electron microscopic images of the stratum radiatum of hippocampal CA1 regions from control (A) and ßNrxn TKO (B) mice. Mushroom spines are colored in red; scale bar, 2 µm. (C) Unchanged area density of asymmetric, type 1 synapses in control and ßNrxn TKO samples. (D) Area density of mushroom spines is increased in ßNrxn TKO compared to the control. Data are from three animals per genotype and shown as mean ± SEM; two-sided unpaired t-test with ****p < 0.0001, and ns = non-significant.
Preprints 94212 g004
Figure 5. Three-dimensional reconstructions of dendritic spines. Mushroom-type spines were reconstructed in 3D from serial sections prepared for electron microscopy from WT control (A) and ßNrxn TKO (B) samples of the stratum radiatum in hippocampal CA1 regions. Relevant ultrastructural features were interactively outlined on all aligned images and color-coded as dendritic processes (blue), spinous protrusions with head and neck (yellow), and postsynaptic densities, PSDs (red). In addition, arrows point to examples of PSDs with electron-lucent regions, commonly referred to as perforated PSDs [66]; arrowheads show examples of spinules. Scale bars, 0.2 µm.
Preprints 94212 g005
Figure 6. Dendritic spines with perforated PSD occur more frequently in ßNrxn-deficient mice. (A) Characteristic mushroom spine with macular PSD (white arrow) extending from a dendritic process in the stratum radiatum of CA1 hippocampus. (B) Mushroom-type spine containing a perforated PSD (white arrow) from the same region as (A). (C) Area density of mushroom spines with a perforated PSD is increased in ßNrxn TKO compared to control brains. Data are from three animals per genotype and shown as mean ± SEM; two-sided unpaired t-test with *p < 0.05. (D) Mushroom spine containing a spine apparatus (white arrow) from the same region as (A). Scale bar (for A,B,D), 0.5 µm.
Preprints 94212 g006
Figure 7. Head and neck dimensions of mushroom spines in ßNrxn TKO mice. (A) Mushroom spine (head area, green; neck, red; neck length, yellow line) extending from a dendritic process in the stratum radiatum of CA1 hippocampus. Scale bar, 0.5 µm. (B) Average head area and neck length (C) of mushroom spines in ßNrxn TKO compared to control neurons. Data are from three animals per genotype and shown as mean ± SEM; two-sided unpaired t-test with *p < 0.05, and ns = non-significant.
Preprints 94212 g007
Disclaimer/Publisher’s Note: The statements, opinions and data contained in all publications are solely those of the individual author(s) and contributor(s) and not of MDPI and/or the editor(s). MDPI and/or the editor(s) disclaim responsibility for any injury to people or property resulting from any ideas, methods, instructions or products referred to in the content.
Copyright: This open access article is published under a Creative Commons CC BY 4.0 license, which permit the free download, distribution, and reuse, provided that the author and preprint are cited in any reuse.
Prerpints.org logo

Preprints.org is a free preprint server supported by MDPI in Basel, Switzerland.

Subscribe

© 2024 MDPI (Basel, Switzerland) unless otherwise stated