Submitted:
25 December 2023
Posted:
26 December 2023
You are already at the latest version
Abstract
Keywords:
1. Introduction
2. Materials and Methods
2.1. Plant material and growing conditions
2.2. Photosynthetic pigment content
2.3. Phenol content
2.4. Grape anthocyanin content
2.5. PPO and SOD activities
2.6. RNA extraction and cDNA transformation
2.8. Statistical analysis
3. Results and Discussion
3.1. Photosynthetic pigment content
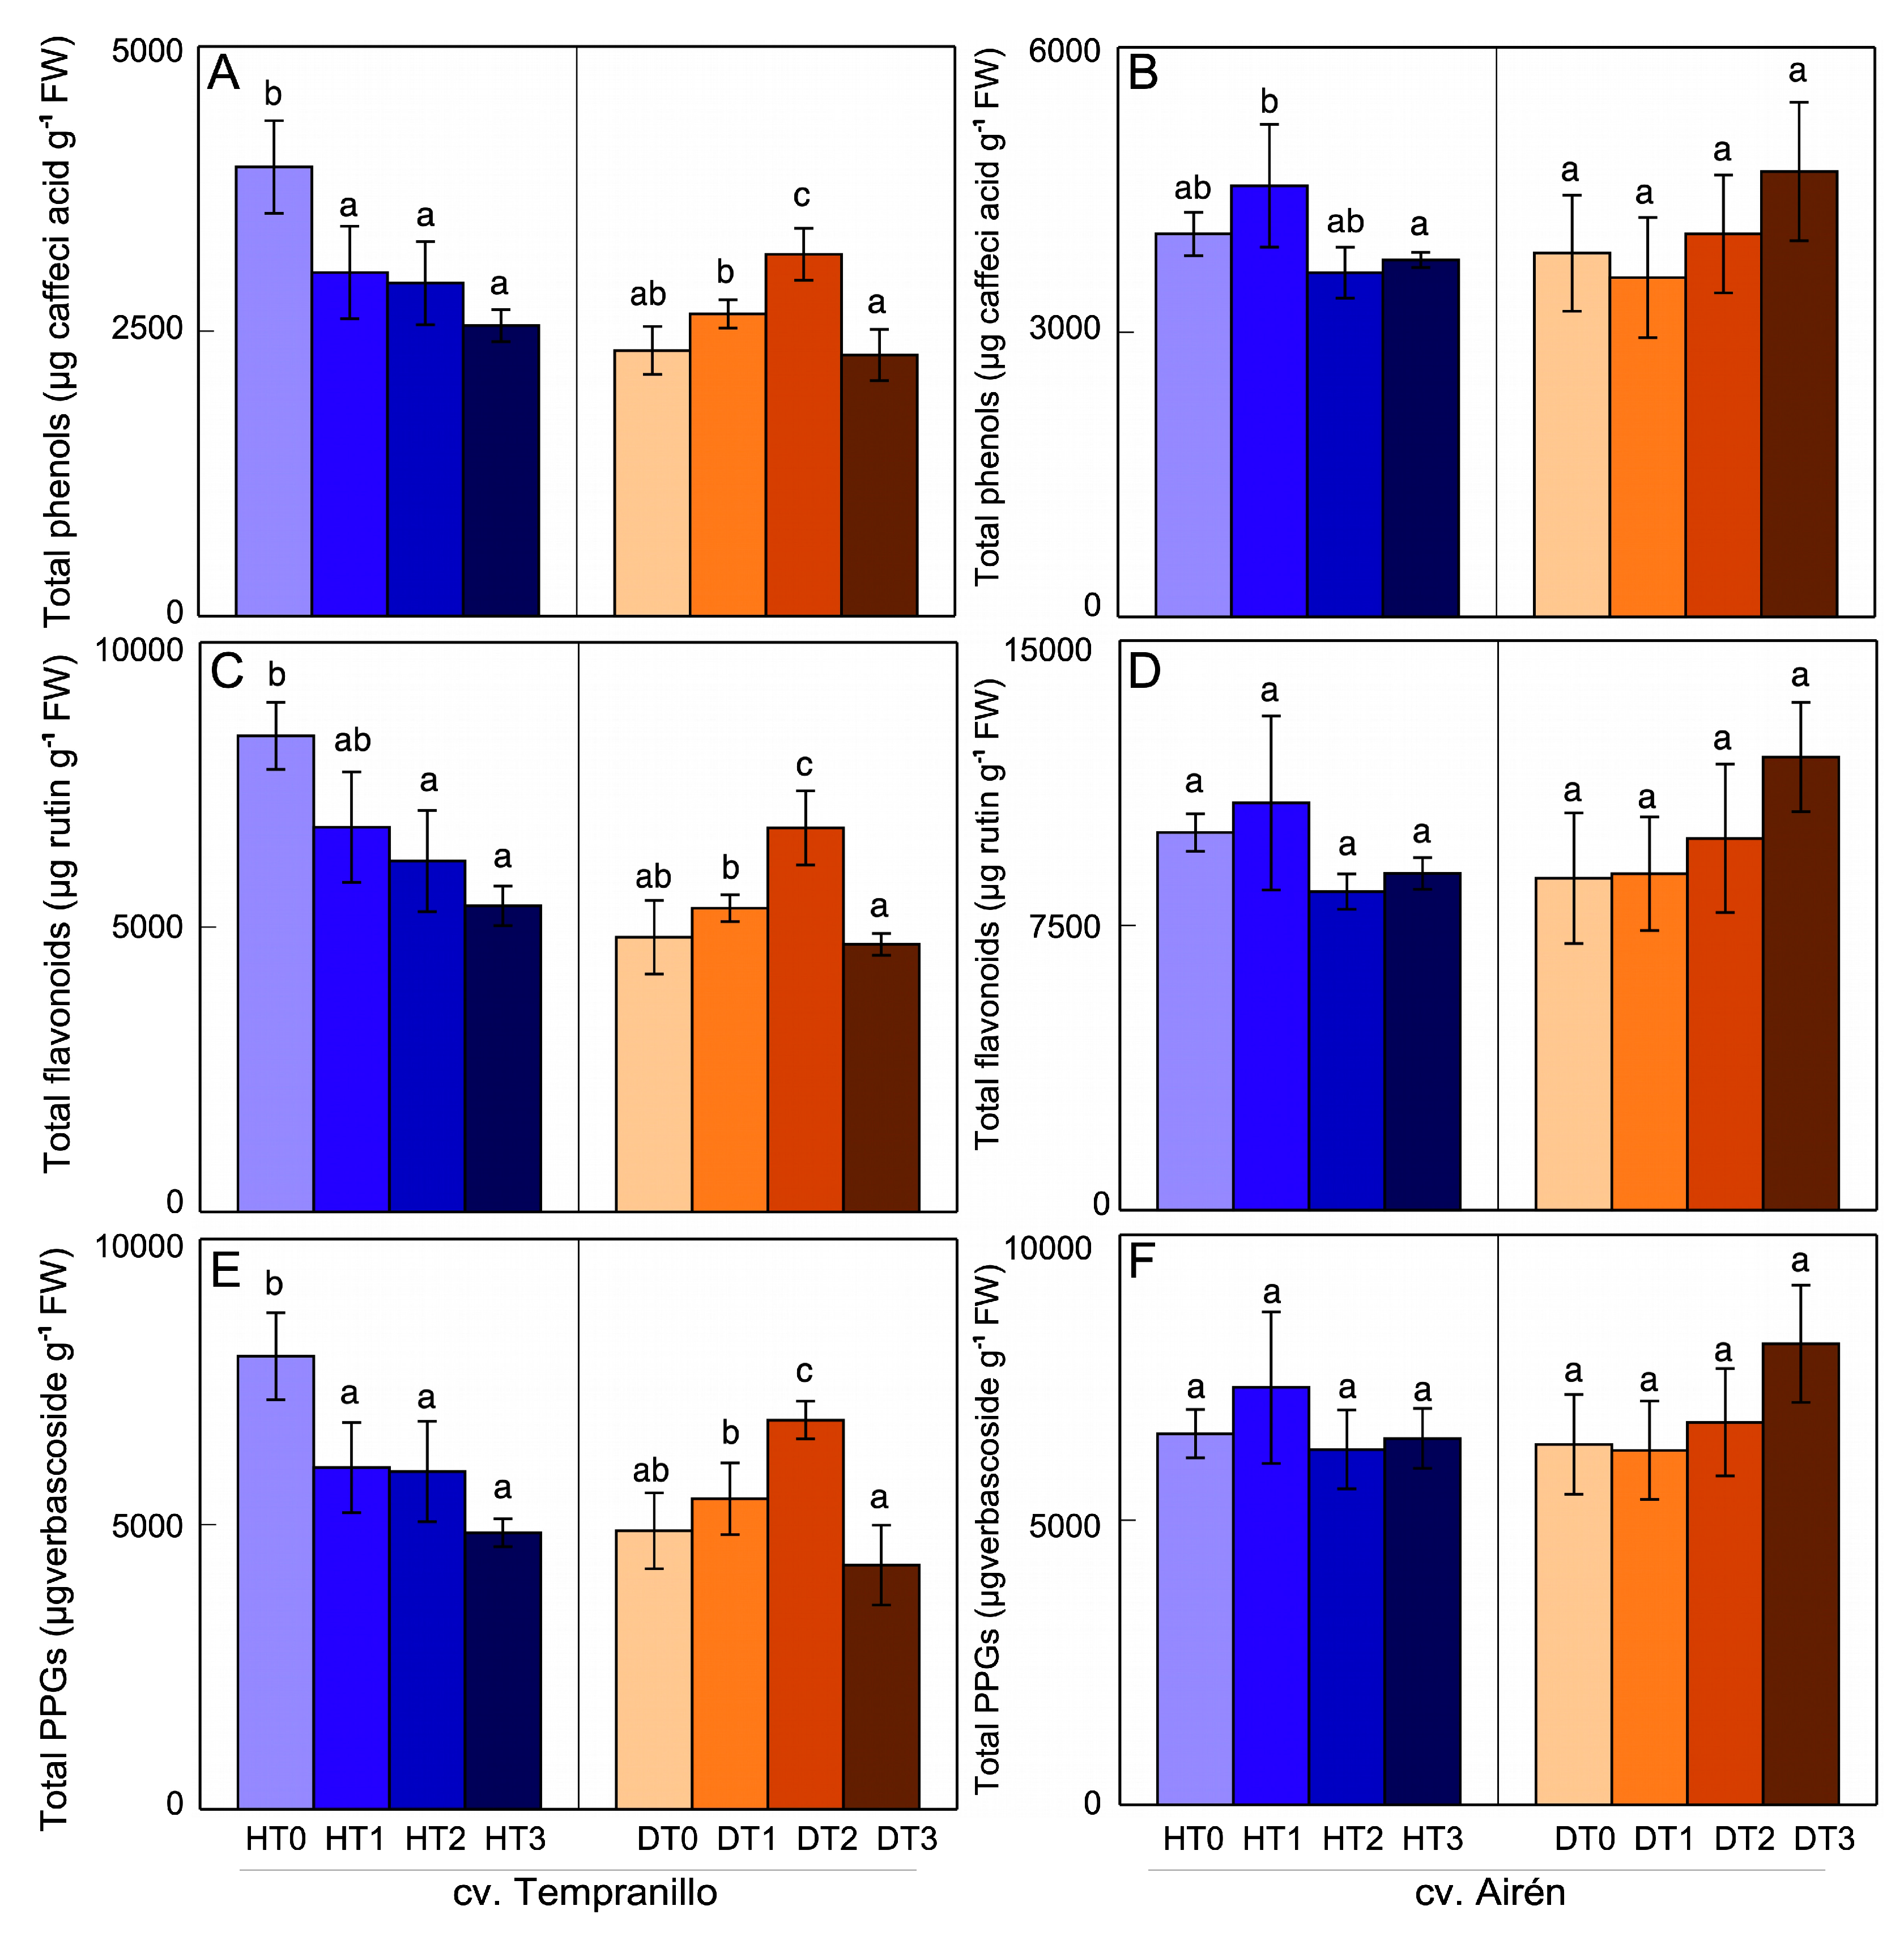
3.2. Phenol content
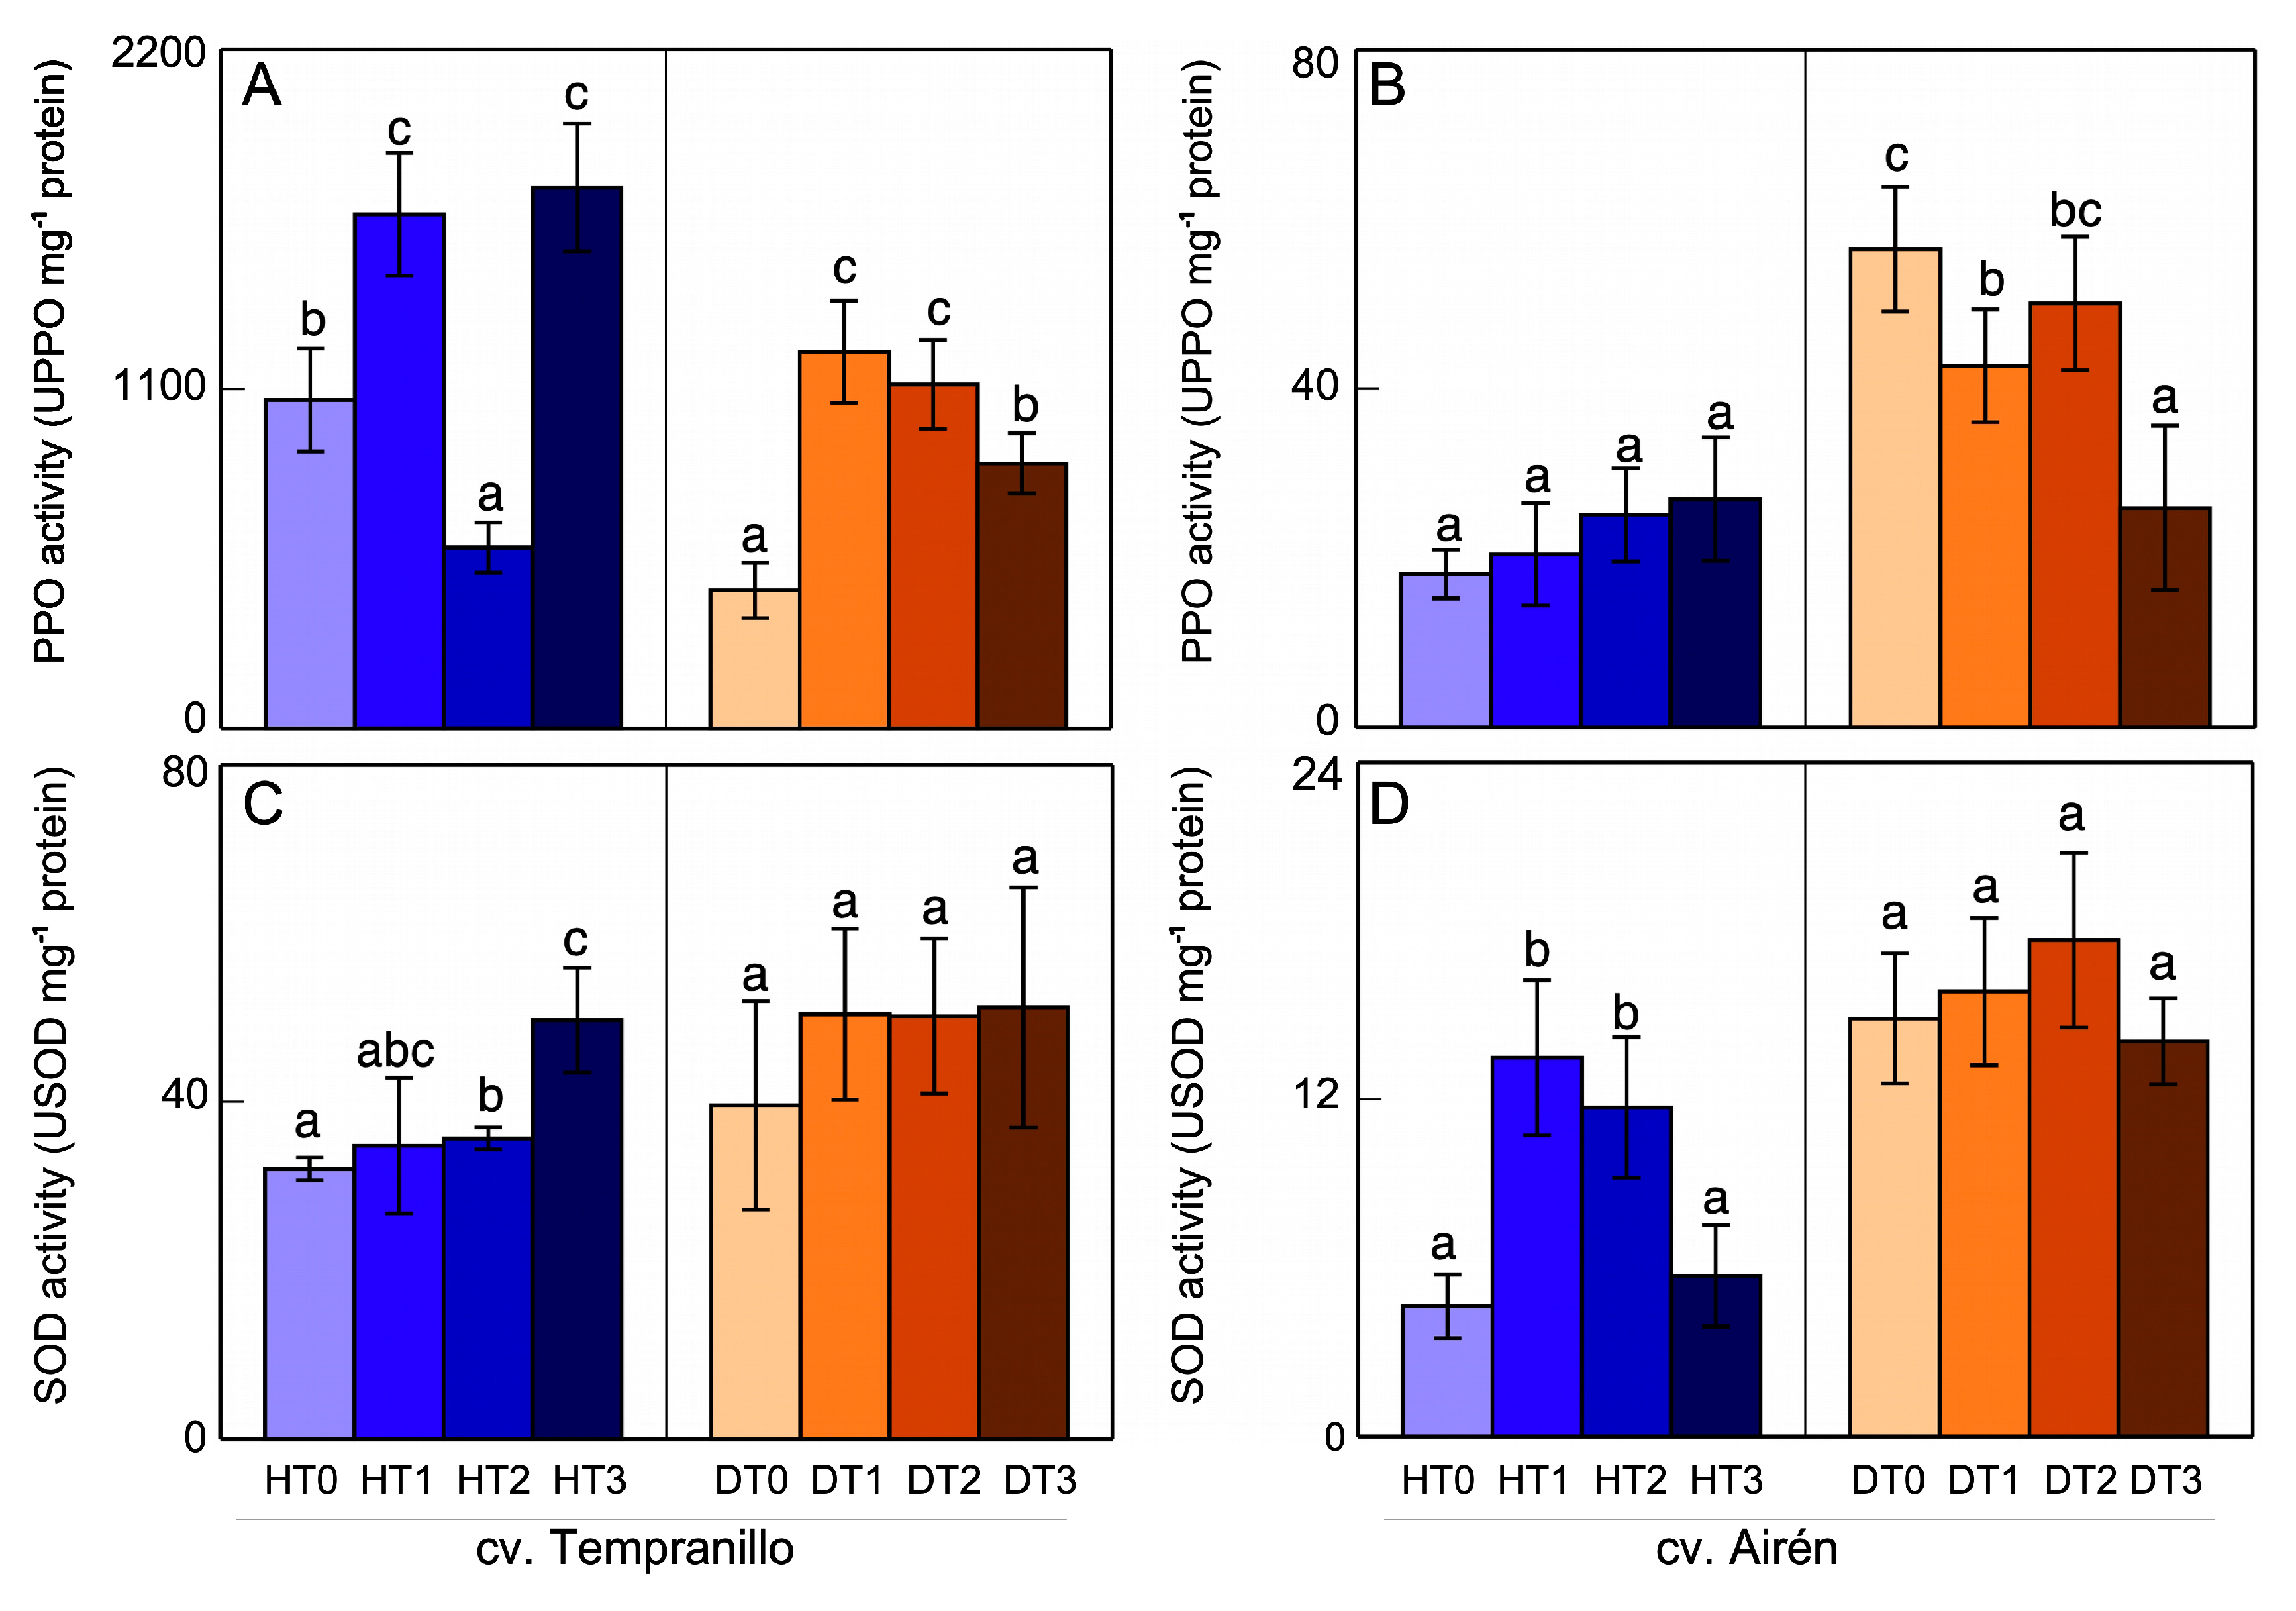
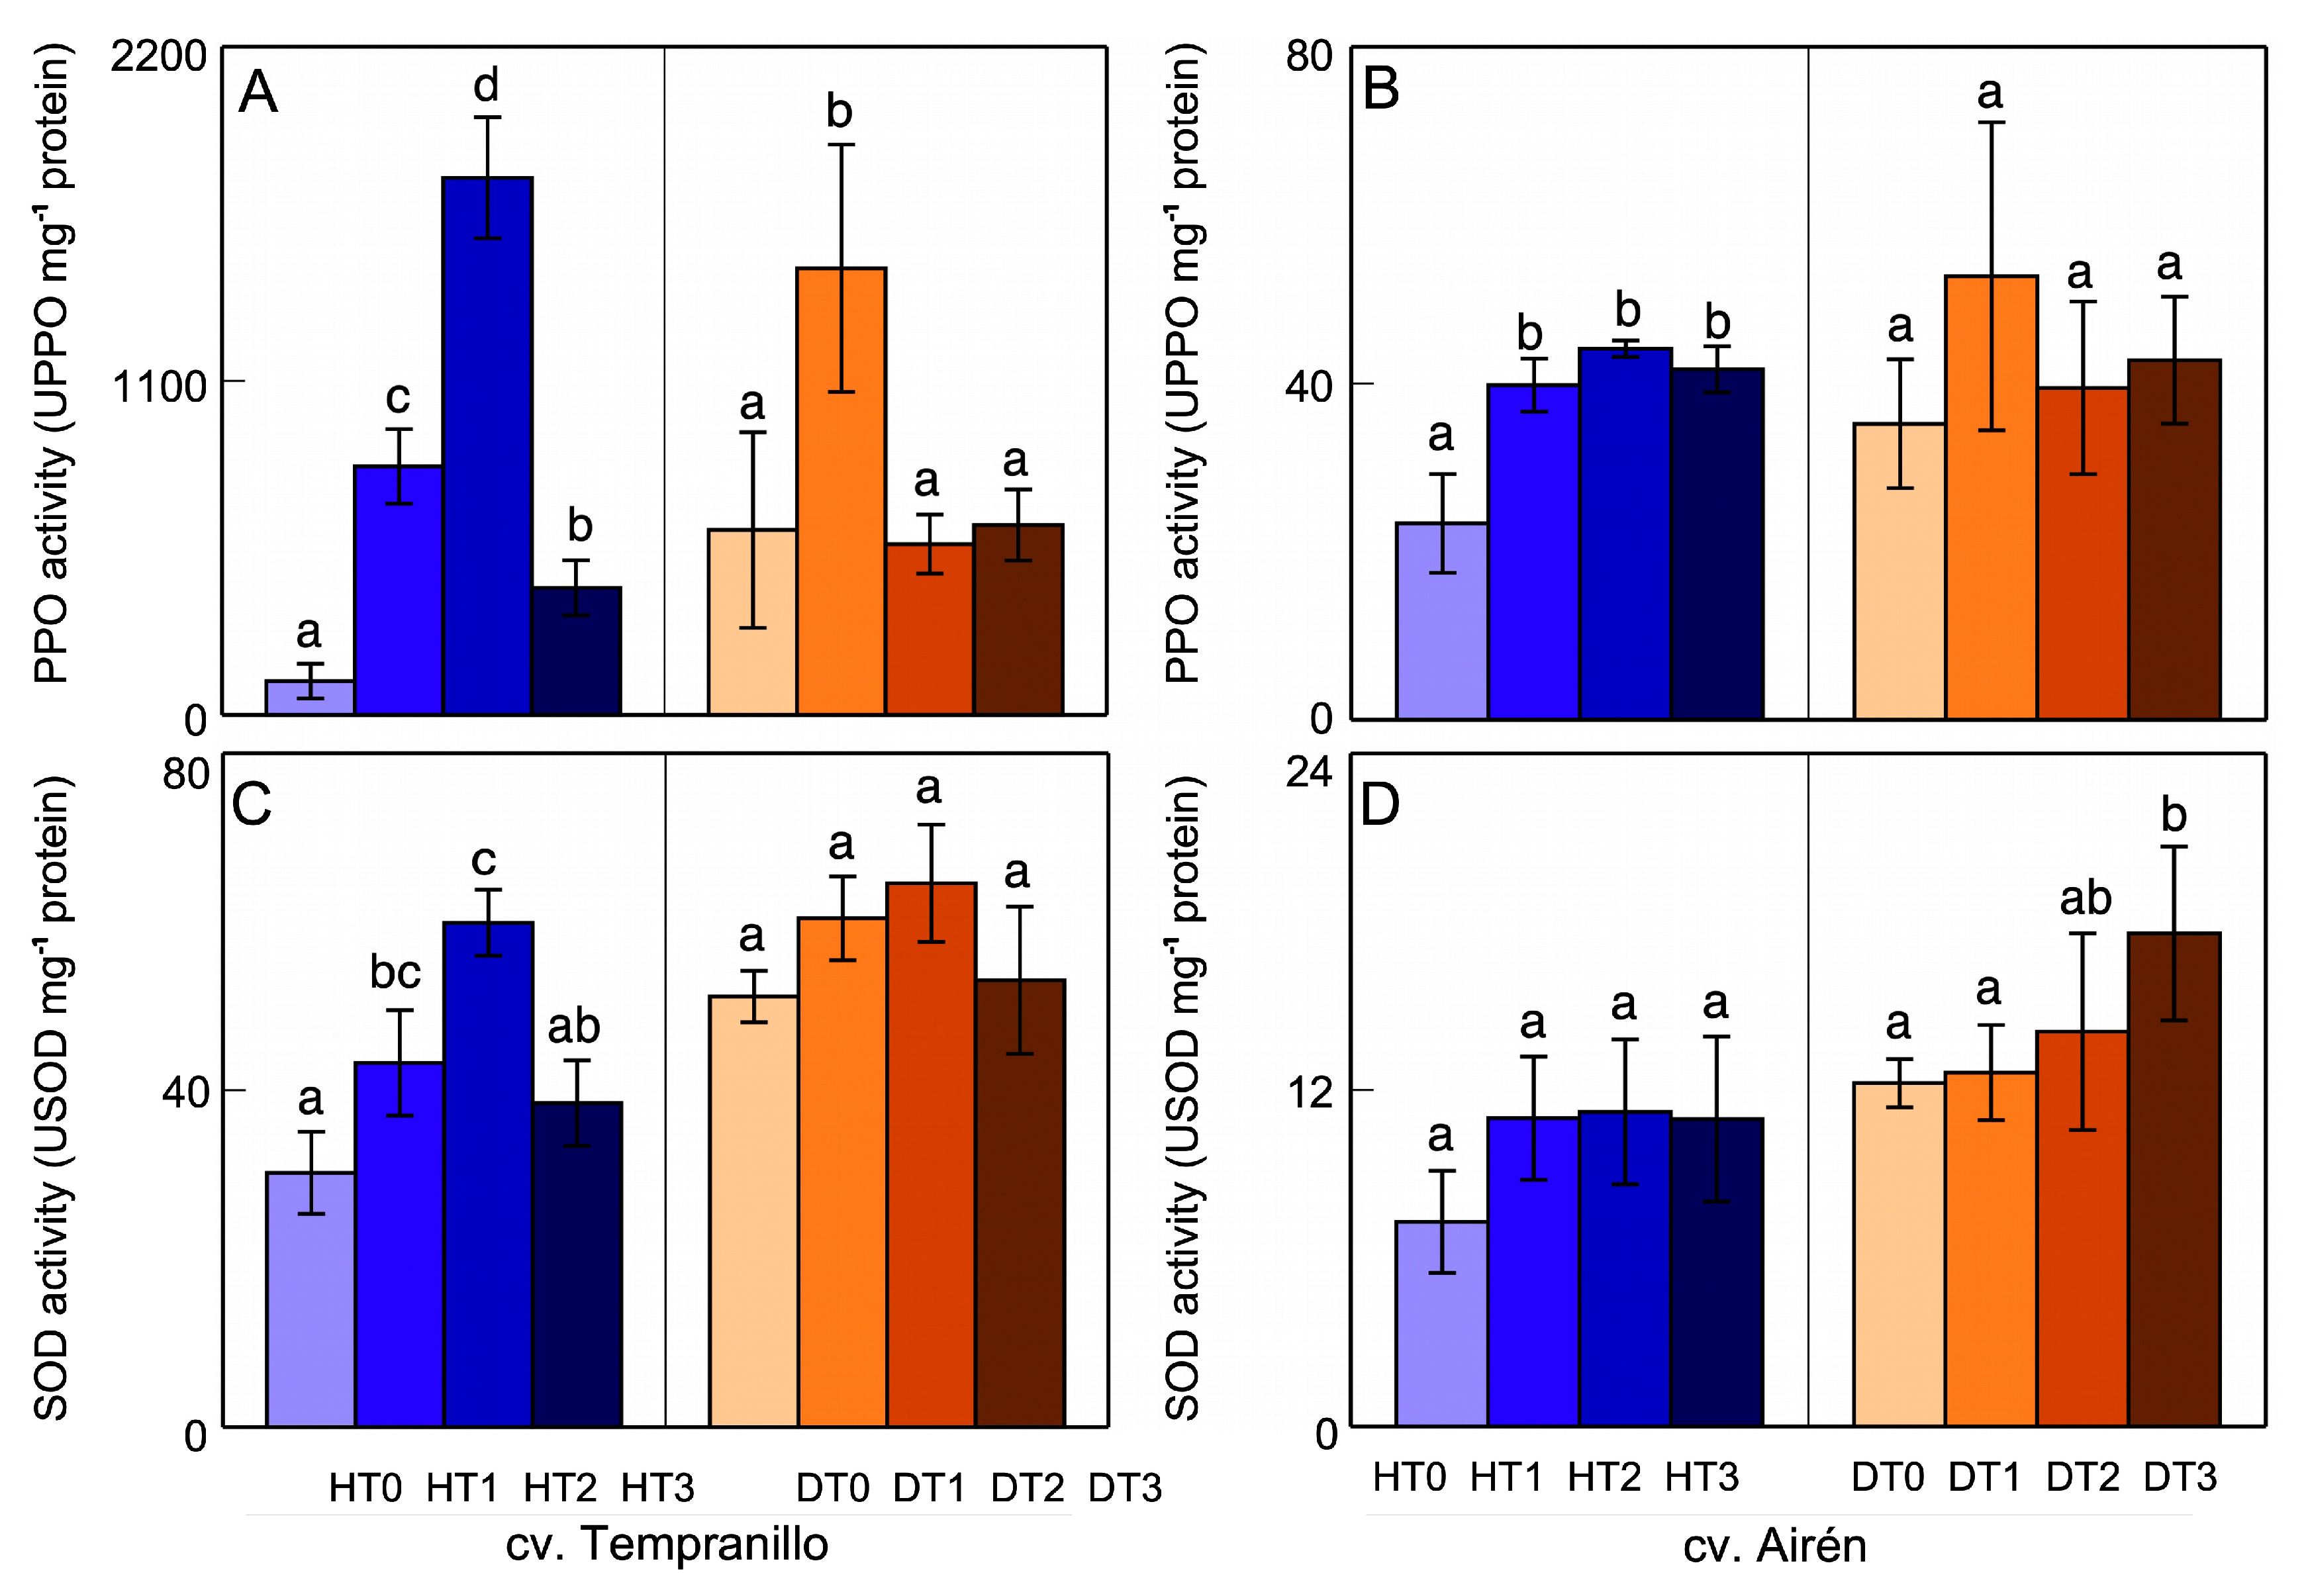
3.3. Polyphenol oxidase (PPO) and Superoxide dismutase (SOD) activities
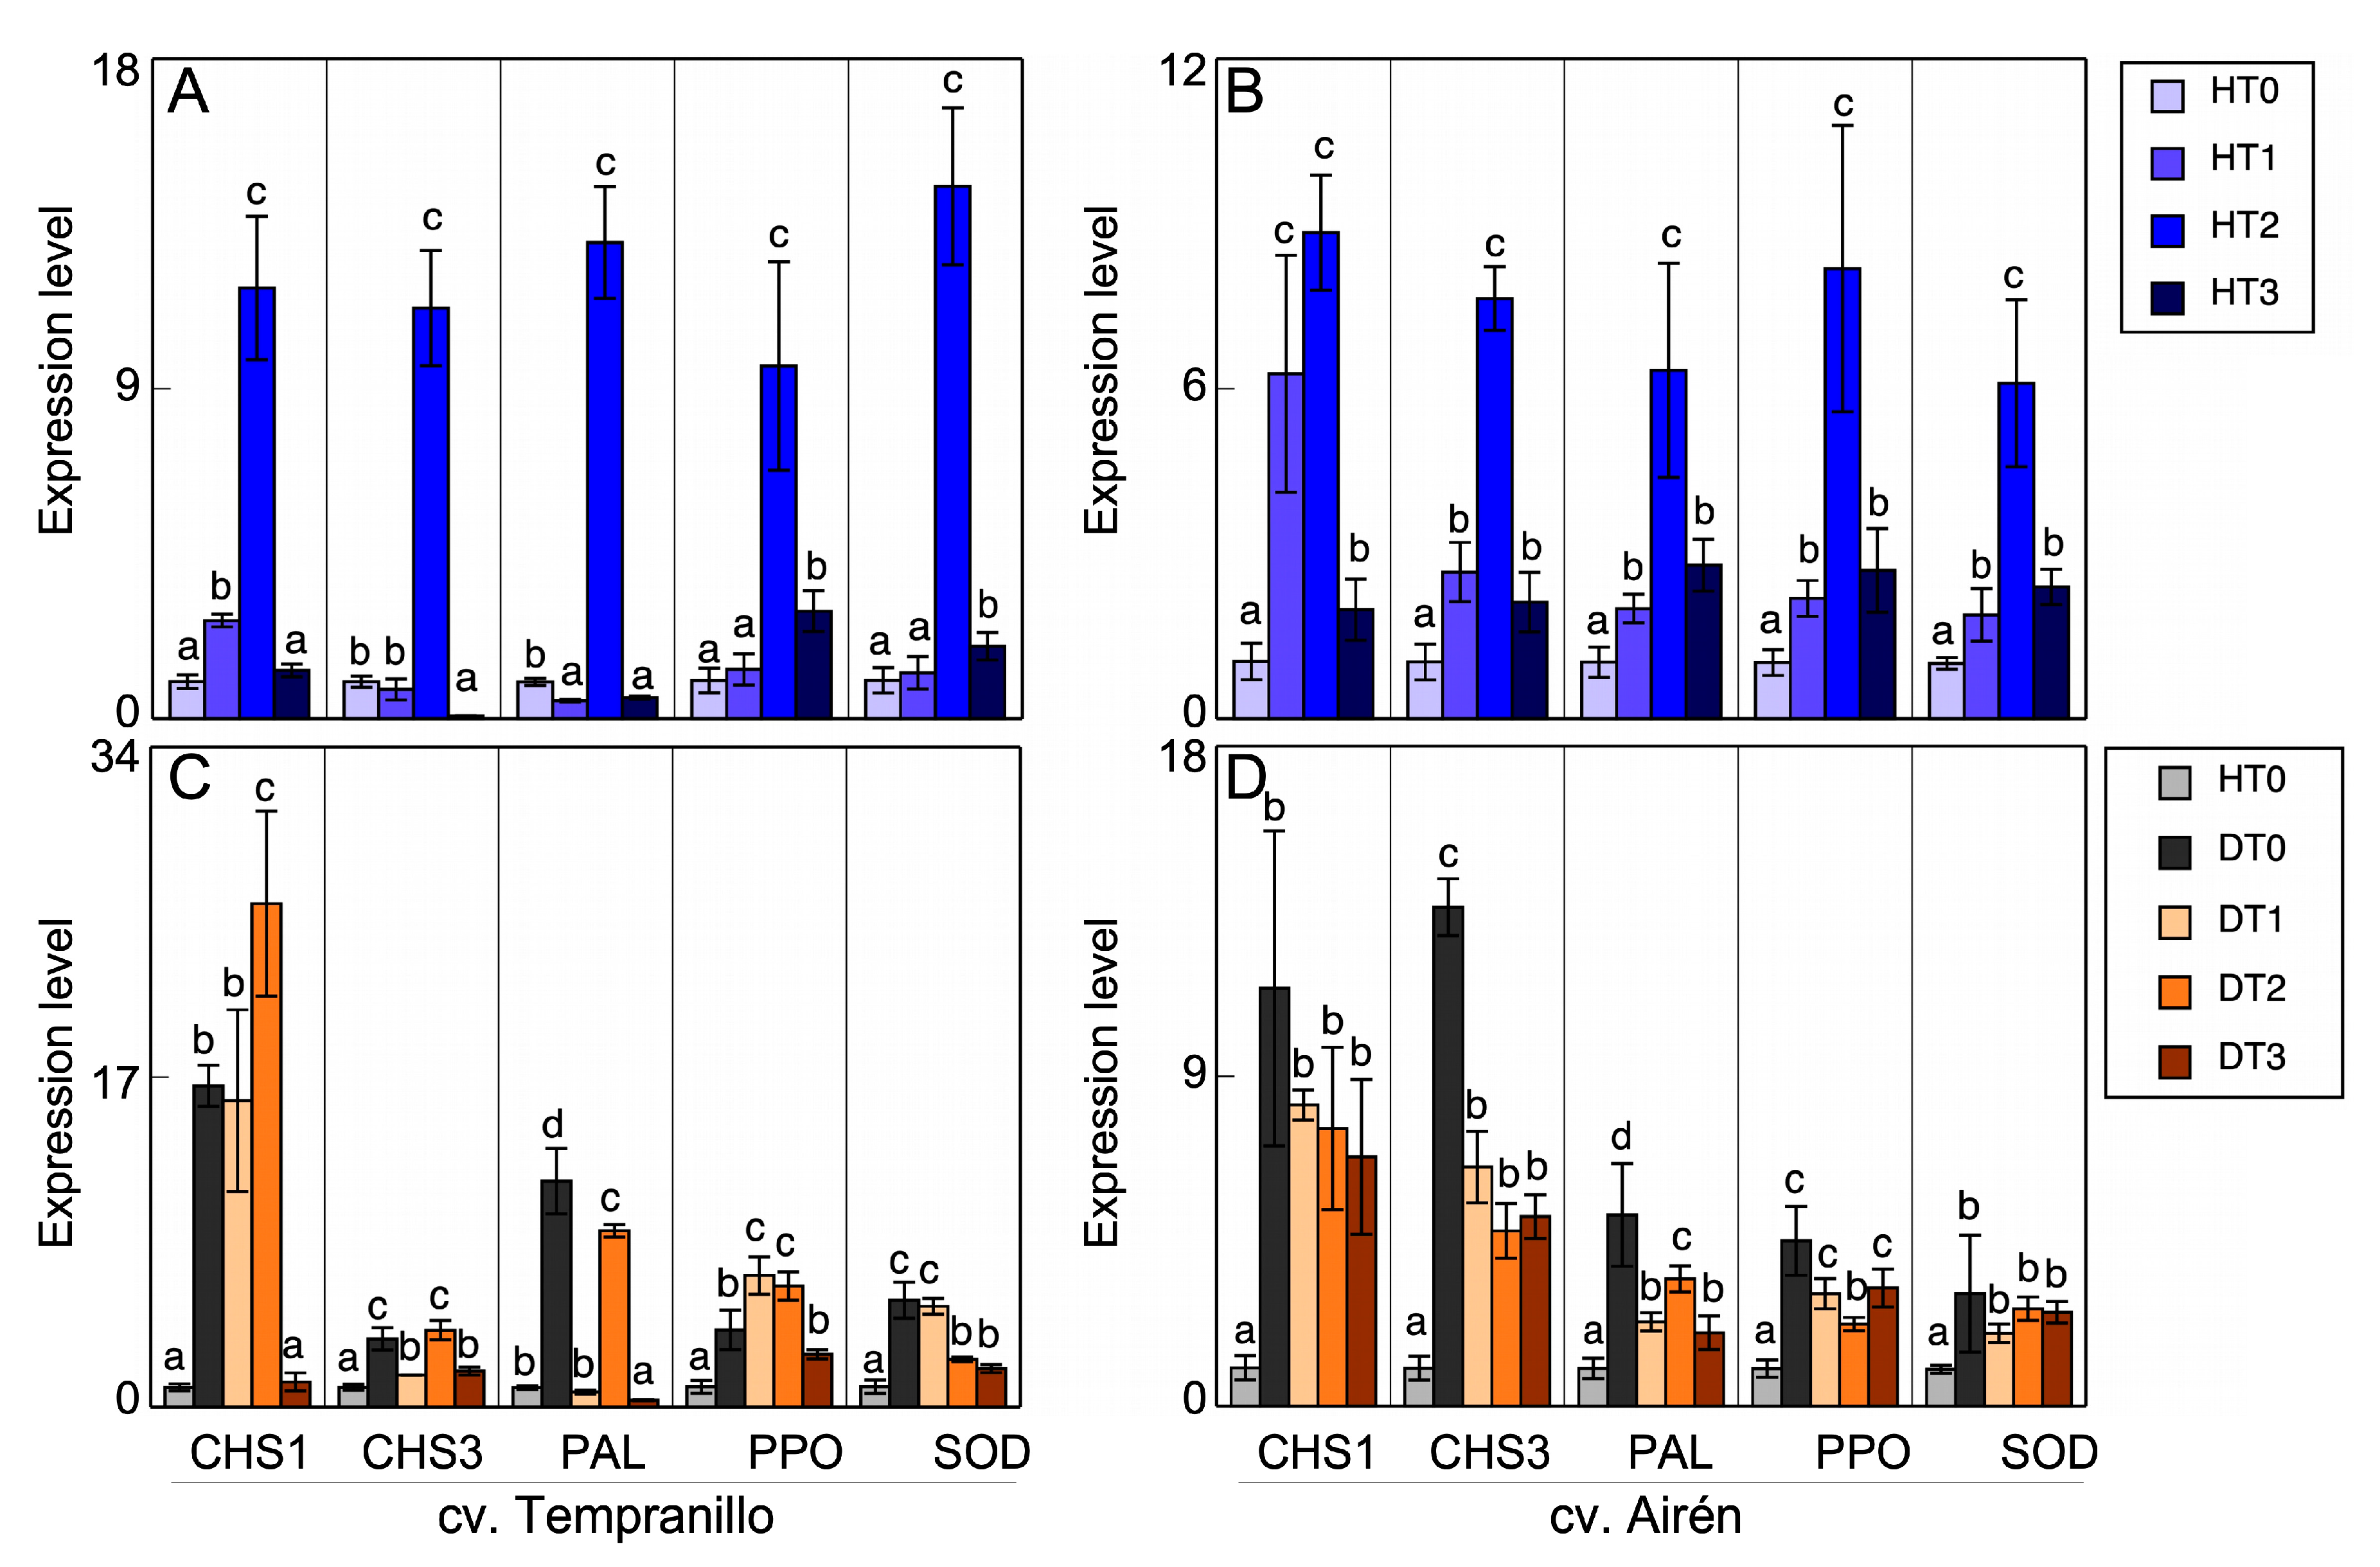
3.4. Gene expression
4. Conclusions
Author Contributions
Funding
Institutional Review Board Statement
Data Availability Statement
Acknowledgments
Conflicts of Interest
References
- Abhilash, P.; Tripathi, V.; Edrisi, S.A.; Dubey, R.K.; Bakshi, M.; Dubey, P.K.; Singh, H.; Ebbs, S.D. Sustainability of crop production from polluted lands. Energy Ecol Environ. 2016, 1, 54–65. [Google Scholar] [CrossRef]
- Pandey, G. Challenges and future prospects of agri-nanotechnology for sustainable agriculture in India. Environ Technol Innov. 2018, 11, 299–307. [Google Scholar] [CrossRef]
- Acharya, A.; Pal, P.K. Agriculture nanotechnology: translating research outcome to field applications by influencing environmental sustainability. NanoImpact. 2020, 19, 100232. [Google Scholar] [CrossRef]
- Safdar, M.; Kim, W.; Park, S.; Gwon, Y.; Kim, Y.O.; Kim, J. Engineering plants with carbon nanotubes: a sustainable agriculture approach. J. Nanobiotechnology. 2022, 20(1), 1–30. [Google Scholar] [CrossRef] [PubMed]
- Deshpande, P.; Dapkekar, A.; Oak, M.D.; Paknikar, K.M.; Rajwade, J.M. Zinc complexed chitosan/TPP nanoparticles: a promising micronutrient nanocarrier suited for foliar application. Carbohydr Polym. 2017, 165, 394–401. [Google Scholar] [CrossRef] [PubMed]
- FAO. The future of food and agriculture—Trends and challenges. Annual Report. Rome 2017. [Google Scholar]
- Panpatte, D.G.; Jhala, Y.K.; Shelat, H.N.; Vyas, R.V. Nanoparticles: the next generation technology for sustainable agriculture. In Microbial inoculants in sustainable agricultural productivity. Vol. 2. Functional application; Singh, D.P., Singh, H.B., Prabha, R., Eds.; Springer: New Delhi, 2016; pp. 289–300. [Google Scholar] [CrossRef]
- Kah, M.; Tufenkji, N.; White, J.C. Nano-enabled strategies to enhance crop nutrition and protection. Nat Nanotechnol. 2019, 14, 532–40. [Google Scholar] [CrossRef] [PubMed]
- Lowry, G.V.; Avellan, A.; Gilbertson, L.M. Opportunities and challenges for nanotechnology in the agri-tech revolution. Nat Nanotechnol. 2019, 14, 517–22. [Google Scholar] [CrossRef]
- Kgang, I.E.; Klein, A.; Husselmann, L.; Nkomo, A.; Mathabe, P. M.; Belay, Z.A.; Caleb, O.J. Bioassays and proteomics as early detection tools in postharvest management of table grapes (Vitis vinifera L.) diseases–A Review. Food Biosci, 2023; 102645. [Google Scholar] [CrossRef]
- Pezzuto, J.M. Grapes and human health: A perspective. J. Agric. Food Chem. 2008, 56, 6777–6784. [Google Scholar] [CrossRef]
- Mesguida, O.; Haidar, R.; Yacoub, A.; Dreux-Zigha, A.; Berthon, J.Y.; Guyoneaud, R.; Attard, E.; Rey, P. Microbial Biological Control of Fungi Associated with Grapevine Trunk Diseases: A Review of Strain Diversity, Modes of Action, and Advantages and Limits of Current Strategies. J. Fungi, 2023; 9, 638. [Google Scholar] [CrossRef]
- Guerin-Dubrana, L.; Fontaine, F.; Mugnai, L. Grapevine Trunk disease in European and Mediterranean vineyards: Occurrence, distribution and associated disease-affecting cultural factors. Phytopathol. Mediterr. 2019, 58, 49–71. [Google Scholar] [CrossRef]
- Cobos, R.; Ibañez, A.; Diez-Galán, A.; Calvo-Peña, C.; Ghoreshizadeh, S.; Coque, J.J.R. The grapevine microbiome to the rescue: implications for the biocontrol of trunk diseases. Plants. 2022, 11(7), 840. [Google Scholar] [CrossRef] [PubMed]
- Gramaje, D.; Úrbez-Torres, J.R.; Sosnowski, M.R.; Urbez-Torres, J.R.; Sosnowski, M.R. Managing Grapevine Trunk Diseases with Respect to Etiology and Epidemiology: Current Strategies and Future Prospects. Plant Dis. 2018, 102, 12–39. [Google Scholar] [CrossRef] [PubMed]
- Bertsch, C.; Ramírez-Suero, M.; Magnin-Robert, M.; Larignon, P.; Chong, J.; Abou-Mansour, E.; Spagnolo, A.; Clément, C.; Fontaine, F. Grapevine trunk diseases: Complex and still poorly understood. Plant Pathol. 2013, 62, 243–265. [Google Scholar] [CrossRef]
- Mondello, V.; Songy, A.; Battiston, E.; Pinto, C.; Coppin, C.; Trotel-Aziz, P.; Clément, C.; Mugnai, L.; Fontaine, F. Grapevine Trunk Diseases: A Review of Fifteen Years of Trials for Their Control with Chemicals and Biocontrol Agents. Plant Dis. 2018, 102, 1189–1217. [Google Scholar] [CrossRef] [PubMed]
- Pouzoulet, J.; Pivovaroff, A.L.; Santiago, L.S.; Rolshausen, P.E. Can vessel dimension explain tolerance toward fungal vascular wilt diseases in woody plants? lessons from dutch elm disease and Esca disease in grapevine. Front. Plant Sci. 2014, 5, 253. [Google Scholar] [CrossRef] [PubMed]
- Ouadi, L.; Bruez, E.; Bastien, S.; Yacoub, A.; Coppin, C.; Guérin-Dubrana, L.; Fontaine, F.; Domec, J.C.; Rey, P. Sap flow disruption in grapevine is the early signal predicting the structural, functional, and genetic responses to Esca disease. Front. Plant Sci. 2021, 12, 695846. [Google Scholar] [CrossRef] [PubMed]
- Perez-Gonzalez, G.; Sebestyen, D.; Petit, E.; Jellison, J.; Mugnai, L.; Lee, N.; Farine, S.; Bertsch, C.; Goodell, B. Oxygen Radical-Generating Metabolites Secreted by Eutypa and Esca Fungal Consortia: Understanding the Mechanisms Behind Grapevine Wood Deterioration and Pathogenesis. Front. Plant Sci. 2022, 13, 921961. [Google Scholar] [CrossRef] [PubMed]
- Sánchez-Amat, A.; Solano, F. A pluripotent polyphenol oxidase from the melanogenic marine Alteromonas sp shares catalytic capabilities of tyrosinases and laccases. Biochem. Biophys. Res. Commun. 1997, 240, 787–792. [Google Scholar] [CrossRef]
- Abou-Mansour, E.; Polier, J.; Pezet, R. Tabacchi, R. Purification and partial characterisation of a 60 KDa laccase from Fomitiporia mediterranea. Phytopathol. Mediterr. 2009, 48, 447–453. [Google Scholar]
- García, J.A.; Garrido, I.; Ortega, A.; Del Moral, J.; Llerena, J.L.; Espinosa, F. Physiological and Molecular Responses of Vitis vinifera cv. Tempranillo Affected by Esca Disease. Antioxidants. 2022, 11(9), 1720. [Google Scholar] [CrossRef]
- Aroca, A.; Gramaje, D.; Armengol, J.; García-Jiménez, J.; Raposo, R. Evaluation of the grapevine nursery propagation process as a source of Phaeoacremonium spp. and Phaeomoniella chlamydospora and occurrence of trunk disease pathogens in rootstock mothervines in Spain. Eur. J. Plant Pathol. 2010, 126, 165–174. [Google Scholar] [CrossRef]
- Gramaje, D.; Armengol, J. Fungal Trunk Pathogens in the Grapevine Propagation Process: Potential Inoculum Sources, Detection, Identification, and Management Strategies. Plant Dis. 2011, 95, 1040–1055. [Google Scholar] [CrossRef] [PubMed]
- Agustí-Brisach, C.; Gramaje, D.; García-Jiménez, J.; Armengol, J. Detection of black-foot disease pathogens in the grapevine nursery propagation process in Spain. Eur. J. Plant Pathol. 2013, 137, 103–112. [Google Scholar] [CrossRef]
- Luque, J.; Elena, G.; Garcia-Figueres, F.; Reyes, J.; Barrios, G.; Legorburu, F.J. Natural infections of pruning wounds by fungal trunk pathogens in mature grapevines in Catalonia (Northeast Spain). Aust. J. Grape Wine Res. 2014, 20, 134–143. [Google Scholar] [CrossRef]
- Trouvelot, S.; Héloir, M.C.; Poinssot, B.; Gauthier, A.; Paris, F.; Guillier, C.; Combier, M.; Trdá, L.; Daire, X.; Adrian, M. Carbohydrates in plant immunity and plant protection: roles and potential application as foliar sprays. Front. Plant Sci. 2014, 5, 592. [Google Scholar] [CrossRef] [PubMed]
- Zang, H.; Xie, S.; Zhu, B.; Yang, X.; Gu, C.; Hu, B. , GAo, T.; Chen, Y.; Gao, X. Mannan oligosaccharides trigger multiple defence responses in rice and tobacco as a novel danger-associated molecular pattern. Mol. Plant Pathol. 1067. [Google Scholar] [CrossRef]
- Liu, N.; Shen, H.; Zhang, F.; Liu, X.; Xiao, Q.; Jiang, Q.; Tan, B.; Ma, X. Applications and prospects of functional oligosaccharides in pig nutrition: a review. Anim. Nutr. 2023, 13, 206–215. [Google Scholar] [CrossRef] [PubMed]
- Laere, V.; Hartemink, R.; Bosveld, M.; Schols, H.; Voragen, A. Fermentation of plant cell wall derived polysaccharides and their corresponding oligosaccharides by intestinal bacteria. J. Agr. Food Chem. 2000, 48, 1644–1652. [Google Scholar] [CrossRef] [PubMed]
- Aziz, A.; Poinssot, B.; Daire, X.; Adrian, M.; Bézier, A.; Lambert, B.; Joubert, J.M; Pugin, A. Laminarin elicitors defense responses in grapevine and induces protection against Botrytis cinerea and Plasmopara viticola. Mol. Plant Microbe Interact. 2003, 16, 1118–1128. [Google Scholar] [CrossRef]
- Paulert, R.; Ebbinghaus, D.; Urlass, C.; Moerschbacher, B.M. Priming of the oxidative burst in rice and wheat cell cultures by ulvan, a polysaccharide from green macroalgae, and enhanced resistance against powdery mildew in wheat and barley plants. Plant Pathol. 2010, 59, 634–642. [Google Scholar] [CrossRef]
- Li, Y.; Yin, H.; Wang, Q.; Zhao, X.M.; Du, Y.G.; Li, F.L. Oligochitosan-induced Brassica napus L. production of NO and H2O2 and their physiological function. Carbohydr. Polym. 2009, 75, 612–617. [Google Scholar] [CrossRef]
- Yin, H.; Zhao, X.M; Du, Y.G. Oligochitosan: a plant diseases vaccine. A review. Carbohyd. Polym. 2010, 82, 1–8. [Google Scholar] [CrossRef]
- Kaida, R.; Sugawara, S.; Negoro, K.; Maki, H.; Hayashi, T.; Kaneko, T.S. Acceleration of cell growth by xyloglucan oligosaccharides in suspension-cultured tobacco cells. Mol. Plant. 2010, 3, 549–554. [Google Scholar] [CrossRef] [PubMed]
- Benedetti, M.; Pontiggia, D.; Raggi, S.; Cheng, Z.; Scaloni, F.; Ferrari, S.; Ausubel, F.; Cervone, F.; Lorenzo, G. Plant immunity triggered by engineered in vivo release of oligogalacturonides, damage-associated molecular patterns. Proc. Natl. Acad. Sci. USA, 2015, 112, 5533–5538. [Google Scholar] [CrossRef]
- Iriti, M.; Vitalini, S.; Di Tommaso, G.; D’Amico, S.; Borgo, M.; Faoro, F. New chitosan formulation prevents grapevine powdery mildew infection and improves polyphenol content and free radical scavenging activity of grape and wine. Aust. J. Grape Wine Res. 2011, 17, 263–269. [Google Scholar] [CrossRef]
- Nascimento, T.; Rego, C.; Oliveira, H. Potential use of chitosan in the control of grapevine trunk diseases. Phytopathol. Mediterr. 2007, 46, 218–224. [Google Scholar] [CrossRef]
- Denoux, C.; Galletti, R.; Mammarella, N.; Gopalan, S.; Werck, D.; Lorenzo, G.D.; Ferrari, S.; Ausubel, F.; Dewdney, J. Activation of defense response pathways by OGs and Flg22 elicitors in Arabidopsis seedlings. Mol. Plant. 2008, 1, 423–445. [Google Scholar] [CrossRef]
- Brutus, A.; Sicilia, F.; Macone, A.; Cervone, F.; Lorenzo, G.D. A domain swap approach reveals a role of the plant wall-associated kinase 1 (WAK1) as a receptor of oligogalacturonides. Proc. Natl. Acad. Sci. USA, 2010, 107, 9452–9457. [Google Scholar] [CrossRef]
- Galletti, R.; Ferrari, S.; Lorenzo, G. Arabidopsis MPK3 and MPK6 play different roles in basal and oligogalacturonide- or flagellin-induced resistance against Botrytis cinerea. Plant Physiol. 2011, 157, 804–814. [Google Scholar] [CrossRef]
- Portu, J.; López, R.; Baroja, E.; Santamaría, P.; Garde-Cerdán, T. Improvement of grape and wine phenolic content by foliar application to grapevine of three different elicitors: Methyl jasmonate, chitosan, and yeast extract. Food Chem. 2016, 201, 213–221. [Google Scholar] [CrossRef]
- Gutiérrez-Gamboa, G.; Romanazzi, G.; Garde-Cerdán, T.; Pérez-Álvarez, E.P. A review of the use of biostimulants in the vineyard for improved grape and wine quality: effects on prevention of grapevine diseases. J Sci Food Agric. 2019, 99(3), 1001–1009. [Google Scholar] [CrossRef] [PubMed]
- Malik, A.; Preety. Purification and properties of plant chitinases: A review. J. Food Biochem. 2019, 43, e12762. [Google Scholar] [CrossRef]
- Shehata, S.; Fawzy, Z.; El-Ramady, H. Response of Cucumber Plants to Foliar Application of Chitosan and Yeast under Greenhouse Conditions. Aust. J. Basic Appl. Sci. 2012, 4, 63–71. [Google Scholar]
- Yan, Q.; Shi, M.; Ng, J.; Wu, J. Elicitor-induced rosmarinic acid accumulation and secondary metabolism enzyme activities in Salvia miltiorrhiza hairy roots. Plant Sci. 2006, 170, 853–858. [Google Scholar] [CrossRef]
- Dawood, M.G.; El-Lethy, S.R.; Sadak, M. Role of methanol and yeast in improving growth, yield, nutritive value and antioxidants of soybean. World Appl. Sci. J. 2013, 26, 6–14. [Google Scholar] [CrossRef]
- Narusaka, M.; Minami, T.; Iwabuchi, C.; Hamasaki, T.; Takasaki, S.; Kawamura, K.; Narusaka, Y. Yeast cell wall extract induces disease resistance against bacterial and fungal pathogens in Arabidopsis thaliana and Brassica crop. PLoS One. 2015, 10(1), e0115864. [Google Scholar] [CrossRef] [PubMed]
- Sun, C.; Lin, M.; Fu, D.; Yang, J.; Huang, Y.; Zheng, X.; Yu, T. Yeast cell wall induces disease resistance against Penicillium expansum in pear fruit and the possible mechanisms involved. Food Chem. 2018, 241, 301–307. [Google Scholar] [CrossRef] [PubMed]
- Liu, Y.; Sun, Y.; Huang, G. Preparation and antioxidant activities of important traditional plant polysaccharides. Int. J. Biol. Macromol. 2018, 111, 780–786. [Google Scholar] [CrossRef]
- De Miccolis Angelini, R.M.; Rotolo, C.; Gerin, D.; Abate, D.; Pollastro, S.; Faretra, F. Global transcriptome analysis and differentially expressed genes in grapevine after application of the yeast-derived defense inducer cerevisane. Pest Manag. Sci. 2019, 75(7), 2020–2033. [Google Scholar] [CrossRef]
- Gutiérrez-Gamboa, G.; Portu, J.; Santamaría, P.; López, R.; Garde-Cerdán, T. Effects on grape amino acid concentration through foliar application of three different elicitors. Food Res Int. 2017, 99(Pt 1), 688–692. [Google Scholar] [CrossRef]
- Lorenz, D.H.; Eichhorn, K.W.; Blei-Holder, H.; Klose, R.; Meier, U.; Weber, E. Phänologische Entwicklungsstadien der Weinrebe (Vitis vinifera L. ssp. vinifera). Codierung und Beschreibung nach der erweiterten BBCH-Skala. Vitic. Enol. Sci 1994, 49, 66–70. [Google Scholar]
- Wellburn, A.R. The spectral determination of chlorophyll a and chlorophyll b, as well as total carotenoids, using various solvents with spectrophotometers of different resolution. Journal Plant Physiol. 1994, 144, 307–313. [Google Scholar] [CrossRef]
- Singleton, V.L.; Salgues, M.; Zaya, J.; Troudsale, E. Caftaric acid disappearance and conversion to products of enzymatic oxidation in grape must and wine. Am. J. Enol. Vitic. 1985, 36, 50–56. [Google Scholar] [CrossRef]
- Kim, D.; Jeong, S.W.; Leo, C.Y. Antioxidant capacity of phenolic phytochemicals from various cultivars of plums. Food Chem. 2003, 81, 321–326. [Google Scholar] [CrossRef]
- Gálvez, M.; Martín-Cordero, C.; Houghton, P.J.; Ayuso, M.J. Antioxidant activity of methanol extracts obtained from Plantago species. J. Agric. Food Chem. 2008, 53, 1927–1933. [Google Scholar] [CrossRef] [PubMed]
- Giusti, M.M.; Wrolstadm, R.E. Characterization and measurement of anthocyanins by UV-visible spectroscopy. Curr. Protoc. Food Anal. Chem. 2001, F1.2.1-F1.2.13. [CrossRef]
- MohdMaidin, N.; Oruna-Concha, M.J.; Jauregi, P. Surfactant TWEEN20 provides stabilisation effect on anthocyanins extracted from red grape pomace. Food Chem. 2019, 271, 224–231. [Google Scholar] [CrossRef] [PubMed]
- Bradford, M.M. A rapid and sensitive method for the quantitation of microgram quantities of protein utilizing the principle of protein-dye binding. Anal. Biochem. 1976, 72, 248–254. [Google Scholar] [CrossRef] [PubMed]
- Walker, J. Polarographic and Spectrophotometric Assay of Diphenol Oxidases (Polyphenol Oxidase). In Current Protocols in Food Analytical Chemistry; Wiley, 2001; pp. C4.1.1–C4.1.15. [Google Scholar] [CrossRef]
- Beaucham, C.; Fridovich, I. Superoxide dismutase: Improved assays and an assay applicable to acrylamide gels. Anal. Biochem. 1971, 44, 276–287. [Google Scholar] [CrossRef]
- Pilati, S.; Perazzolli, M.; Malossini, A.; Cestaro, A.; Demattè, L.; Fontana, P.; Dal Ri, A.; Viola, R.; Velasco, R.; Moser, C. Genome-wide transcriptional analysis of grapevine berry ripening reveals a set of genes similarly modulated during three seasons and the occurrence of an oxidative burst at vèraison. BMC Genomics 2007, 8, 428. [Google Scholar] [CrossRef]
- Gamm, M.; He´loir, M.C.; Kelloniemi, J.; Poinssot, B.; Wendehenne, D.; Adrian, M. Identification of reference genes suitable for qRT-PCR in grapevine and application for the study of the expression of genes involved in pterostilbene synthesis. Mol. Genet. Genom. 2011, 285, 273–285. [Google Scholar] [CrossRef]
- Joseph, J.T.; Poolakkalody, N.J.; Shah, J.M. Plant reference genes for development and stress response studies. J. Biosci. 2018, 43, 173–187. [Google Scholar] [CrossRef]
- Zhou, X.; Sun, C.; Zhu, P.; Liu, F. Effects of Antimony Stress on Photosynthesis and Growth of Acorus calamus. Front Plant Sci. 2018, 9, 579. [Google Scholar] [CrossRef] [PubMed]
- Petit, A.N.; Vaillant, N.; Boulay, M.; Clément, C.; Fontaine, F. Alteration of Photosynthesis in Grapevines Affected by Esca. Phytopathology. 2006, 96, 1060–1066. [Google Scholar] [CrossRef] [PubMed]
- Martin, L.; Fontaine, F.; Castaño, F.J.; Songy, A.; Roda, R.; Vallet, J.; Ferrer-Gallego, R. Specific profile of Tempranillo grapevines related to Esca-leaf symptoms and climate conditions. Plant Physiol. Biochem. 2019, 135, 575–587. [Google Scholar] [CrossRef] [PubMed]
- Santos, C.; Fragoeiro, S.; Phillips, A. Physiological response of grapevine cultivars and a rootstock to infection with Phaeoacremonium and Phaeomoniella isolates: an in vitro approach using plants and calluses. Sci. Hortic. 2005, 103, 187–198. [Google Scholar] [CrossRef]
- Sák, M.; Dokupilová, I.; Mihálik, D.; Lakatosová, J.; Gubisová, M.; Kraic, J. Elicitation Phenolic Compounds in Cell Culture of Vitis vinifera L. by Phaeomoniella chlamydospora. Nova Biotechnol. et Chim. 2014, 13, 162–171. [Google Scholar] [CrossRef]
- García-Pastor, M.E.; Serrano, M.; Guillén, F.; Castillo, S.; Martínez-Romero, D.; Valero, D.; Zapata, P. Methyl jasmonate effects on table grape ripening, vine yield, berry quality and bioactive compounds depend on applied concentration. Sci. Hortic. 2019, 247, 380–389. [Google Scholar] [CrossRef]
- Mutawila, C.; Stander, C.; Halleen, F.; Vivier, M.A.; Mostert, L. Response of Vitis vinifera cell cultures to Eutypa lata and Trichoderma atroviride culture filtrates: expression of defence-related genes and phenotypes. Protoplasma. 2017, 254, 863–879. [Google Scholar] [CrossRef] [PubMed]
- Sgherri, C.; Stevanovic, B.; Navari-Izzo, F. Role of phenolics in the antioxidative status of the resurrection plant Ramonda serbica during dehydration and rehydration. Physiol. Plant. 2004, 122, 478–485. [Google Scholar] [CrossRef]
- Lorrain, B.; Ky, I.; Pasquier, G.; Jourdes, M.; Dubrana, L.G.; Gény, L.; Rey, P.; Donéche, B.; Teissedre, P.L. Effect of Esca disease on the phenolic and sensory attributes of Cabernet Sauvignon grapes, musts and wines. Aust. J. Grape Wine Res. 2012, 18, 64–72. [Google Scholar] [CrossRef]
- Carvalho, L.C.; Vidigal, P.; Amâncio, S. Oxidative stress homeostasis in grapevine (Vitis vinifera, L.). Front. Environ. Sci. 2015, 3, 20. [Google Scholar] [CrossRef]
- Calzarano, F.; Seghetti, L.; Del Carlo, M.; Cichelli, A. Effect of esca on the quality of berries, musts and wines. Phytopathol. Mediterr. 2004, 43, 125–135. [Google Scholar] [CrossRef]
- Lima, M.R.M.; Felgueiras, M.L.; Cunha, A.; Chicau, G.; Ferreres, F.; Dias, A.C.P. Differential phenolic production in leaves of Vitis vinifera cv. Alvarinho affected with esca disease. Plant Physiol. Biochem. 2017, 112, 45–52. [Google Scholar] [CrossRef]
- Spagnolo, A.; Magnin-Robert, M.; Alayi, T.D.; Cilindre, C.; Mercier, L.; Schaeffer-Reiss, C.; Van Dorsselaer, A.; Clément, C.; Fontaine, F. Physiological Changes in Green Stems of Vitis vinifera L. cv. Chardonnay in Response to Esca Proper and Apoplexy Revealed by Proteomic and Transcriptomic Analyses. J. Proteome Res. 2012, 11, 461–475. [Google Scholar] [CrossRef] [PubMed]
- Pasquier, G.; Lapaillerie, D.; Vilain, S.; Dupuy, J.W.; Lomenech, A.M.; Clavero, S.; Gény, L.; Bonneu, M.; Teissedre, P.L.; Donèche, B. Impact of foliar symptoms of “Esca proper” on proteins related to defense and oxidative stress of grape skins during ripening. Proteomics. 2013, 13, 108–118. [Google Scholar] [CrossRef]
- Rusjan, D.; Halbwirth, H.; Stich, K.; Mikulic-Petkovsek, M.; Veberic, R. Biochemical response of grapevine variety ‘Chardonnay’ (Vitis vinifera L.) to infection with grapevine yellows (Bois noir). Eur. J. Plant Pathol. 2012, 134, 231–237. [Google Scholar] [CrossRef]
- Shi, W.; He, W.; Zhang, Z.; Sun, J.; Zhu, C.; Liu, Z.; Xu, Y.; Zhao, B. Study on the Resistance of ‘Cabernet Sauvignon’ Grapevine with Different Rootstocks to Colomerus vitis. Sustainability 2022, 14, 15193. [Google Scholar] [CrossRef]
- Singh, R.K.; Soares, B.; Goufo, P.; Castro, I.; Cosme, F.; Pinto-Sintra, A.L.; Inês, A.; Oliveira, A.A.; Falco, V. Chitosan Upregulates the Genes of the ROS Pathway and Enhances the Antioxidant Potential of Grape (Vitis vinifera L. ’Touriga Franca’ and ’Tinto Cão’) Tissues. Antioxidants (Basel) 2019, 8, 525. [Google Scholar] [CrossRef] [PubMed]
- Ozden, M.; Demirel, U.; Kahraman, A. Effects of proline on antioxidant system in leaves of grapevine (Vitis vinifera L.) exposed to oxidative stress by H2O2. Sci. Hortic. 2009, 119, 163–168. [Google Scholar] [CrossRef]
- Sgherri, C.; Ranieri, A.; Quartacci, M.F. Antioxidative responses in Vitis vinifera infected by grapevine fanleaf virus. J Plant Physiol. 2013, 170(2), 121–128. [Google Scholar] [CrossRef]
- Singh, R.K.; Martins, V.; Soares, B.; Castro, I.; Falco, V. Chitosan Application in Vineyards (Vitis vinifera L. cv. Tinto Cão) Induces Accumulation of Anthocyanins and Other Phenolics in Berries, Mediated by Modifications in the Transcription of Secondary Metabolism Genes. Int. J. Mol. Sci. 2020, 21, 306, polluted lands. Energy Ecol Environ. 2016, 1, 54–65. DOI: 10.1007/s40974-016-0007-x. [Google Scholar] [CrossRef]

| Gene | F/R | Sequence 5´-3´ | Information | Size (bp) |
|---|---|---|---|---|
| SOD | F | CTGCGGGTTGGTGTTCTAAT | superoxide dismutase, chloroplastic/cytosolic VIT_02s0025g04830 | 156 |
| R | TTCCCATATGGTGGTTCCAT | |||
| PAL | F | ACAACAATGGACTGCCATCA | Phenylalanine ammonia lyase VIT_16s0039g01300 | 192 |
| R | GGAGGAGATTAAGCCCAAGG | |||
| PPO | F | GGCTTTTCTTCCCTTTCCAC | V. vinifera polyphenol oxidase, chloroplastic-like (LOC100261681), misc_RNA | 205 |
| R | ATTACAGTCGGAGGCAGGTG | |||
| Actine 1 | F | ACTGCTGAACGGGAAATTGT | V. vinifera actin 2 (act2) mRNA chensunanActin2-S1 AF369525 | 189 |
| R | AGTCCTCTTCCAGCCATCT | |||
| CHS1 | F | AGCCAGTGAAGCAGGTAGCC | chalcone synthase (AB015872) | 155 |
| R | GTGATCCGGAAGTAGTAAT | |||
| CHS3 | F | GTTTCGGACCAGGGCTCACT | chalcone synthase 3 (AB066274) | 93 |
| R | GGCAAGTAAAGTGGAAACAG | |||
| VATP16 | F | CTTCTCCTGTATGGGAGCTG | V-type proton ATPase chensunan16 kDa proteolipid subunit | 112 |
| R | CCATAACAACTGGTACAATCGAC |
| cv | Treatment | Chl a | Chl b | Chl a+b | Chl a/b | Carotenoids | Car/Chl |
|---|---|---|---|---|---|---|---|
 |
HT0 | 1723.4±52.9c | 1138.6±87.1c | 2861.9±128.7c | 1.52±0.08a | 100.0±13.4ab | 0.030±0.008a |
| HT1 | 1560.5±67.0b | 909.1±98.7b | 2469.6±165.5b | 1.73±0.11b | 107.2±16.0ab | 0.044±0.009ab | |
| HT2 | 1448.4±19.3b | 784.4±31.2ab | 2232.8±49.7b | 1.85±0.04b | 123.0±2.8b | 0.055±0.001b | |
| HT3 | 1219.8±74.2a | 700.6±73.3a | 1920.4±144.3a | 1.75±0.09b | 95.2±7.4a | 0.050±0.007b | |
| DT0 | 996.9±68.6a | 439.7±20.6a | 1520.2±104.8a | 2.00±0.10bc | 116.2±4.9ab | 0.078±0.006b | |
| DT1 | 1134.7±120.5a | 589.2±68.5a | 1724.0±187.2a | 1.93±0.06b | 125.3±12.0ab | 0.074±0.007b | |
| DT2 | 973.2±211.4a | 485.1±118.9a | 1456.5±331.5a | 2.02±0.07c | 130.0±12.5b | 0.090±0.019b | |
| DT3 | 1020.4±168.1a | 627.6±120.6a | 1647.9±273.8a | 1.67±0.19a | 107.2±11.2a | 0.053±0.007a | |
 |
HT0 | 1330.4±70.1a | 668.8±26.3a | 1999.2±95.8a | 1.99±0.03b | 117.6±17.6a | 0.060±0.012a |
| HT1 | 1275.0±244.3a | 663.6±163.2a | 1938.6±405.9a | 1.94±0.11b | 118.6±8.8a | 0.064±0.014a | |
| HT2 | 1066.9±92.4a | 536.3±49.6a | 1603.2±127.1a | 2.00±0.17b | 114.4±19.5a | 0.071±0.010a | |
| HT3 | 1248.4±208.0a | 747.8±129.0a | 1996.2±331.8a | 1.67±0.10a | 84.5±21.7a | 0.044±0.011a | |
| DT0 | 868.8±0.8c | 405.6±12.4a | 1274.4±12.0b | 2.14±0.06a | 111.8±11.7 b | 0.089±0.011a | |
| DT1 | 680.8±85.8b | 303.0±38.3a | 983.8±123.5a | 2.18±0.14a | 115.8±20.6 b | 0.112±0.023a | |
| DT2 | 647.8±115. b | 314.6±70.7a | 962.4±183.8a | 2.08±0.13a | 83.2±12.6 a | 0.088±0.016a | |
| DT3 | 509.2±111.5a | 293.4±112.8a | 802.6±216.1a | 2.01±0.25a | 75.5±11.6 a | 0.109±0.042a |
Disclaimer/Publisher’s Note: The statements, opinions and data contained in all publications are solely those of the individual author(s) and contributor(s) and not of MDPI and/or the editor(s). MDPI and/or the editor(s) disclaim responsibility for any injury to people or property resulting from any ideas, methods, instructions or products referred to in the content. |
© 2023 by the authors. Licensee MDPI, Basel, Switzerland. This article is an open access article distributed under the terms and conditions of the Creative Commons Attribution (CC BY) license (http://creativecommons.org/licenses/by/4.0/).


