1. Introduction
Triclopyr (2-(3,5,6-trichloropyridin-2-yl)oxyacetic acid) is a highly effective auxin-like herbicide extensively utilized as a pre-emergence herbicide in crops like corn, soybean, and wheat, and as a post-emergence herbicide in rice, eucalyptus, soy crops, and pastures to manage broadleaf weeds and woody plants [
1,
2]. Moreover, it finds application in urban environments for weed and plant control [
1]. Triclopyr is also available in two commercial formulations, namely butoxyethyl ester (Triclopyr BEE) and triethylamine salt (Triclopyr TEA) [
1]. Triclopyr displays low mammalian toxicity via the acute oral route as 96h LD50 = 630-729 mg/Kg [
3]. In Brazil, the Maximum Residue Limit (MRL) of triclopyr in agricultural products is 0,07 mg/Kg [
2]. Additionally, a Dietary Ingestion Acceptable (DIA) value of 0.03 mg/Kg has been set by the European Food Safety Authority [
4], ensuring the safe consumption of food products containing triclopyr residues.
Like many pollutants, triclopyr exhibits high water solubility (440 mg/L), enabling it to reach aquatic environments following its application. Consequently, triclopyr is frequently detected in different aquatic matrices, highlighting the extent of water contamination attributed to this herbicide [
1]. Groundwater analysis revealed levels of triclopyr ranging from 0.006 to 0.58 parts per billion (ppb) [
5]. Rawn et al. [
6] reported concentrations of 0.50 to 33.4 nanograms per liter (ng/L) triclopyr in rivers. Notably, water bodies near agricultural fields exhibited high triclopyr levels surpassing 2 milligrams per liter (mg/L) [
7]. Estuaries revealed a maximum of 0.079 micrograms per liter (μg/L) triclopyr [
8], and wastewater effluents contained 620 ng/L of triclopyr [
9].
Furthermore, triclopyr demonstrates stability to abiotic hydrolysi s, with negligible degradation observed over a 30-day period at pH 5, 7, and 9 [
10]. Additionally, triclopyr exhibits stability to abiotic hydrolysis at pH 5, 7, and 9, as well as resistance to photolysis in the soil, and is essentially unaltered by anaerobic aquatic metabolism, boasting a half-life exceeding 1,000 days [
11]. These comprehensive findings contribute significantly to our understanding of the presence and persistence of triclopyr in diverse aquatic environments [
12].
Previous toxicity studies have shown a 96h LC50 of 117 mg/L for Rainbow trout (
Oncorhynchus mykiss) [
3]. A 96h LC50 ranging from 5.3 to 9.7 mg/L for different species of juvenile salmonids has been also reported [
13]. Kreutzweiser et al. [
14] showed potential acute lethal effects on fish exposed to triclopyr for over six hours. Sublethal effects, such as disorientation, coughing, and widening of the gill surfaces, were also observed in Rainbow trout (
Oncorhynchus mykiss) and King salmon (
Oncorhynchus tshawytscha) exposed to 30 and 120 µg/L triclopyr for three days [
14]. Furthermore, in a study conducted by Guilherme et al. [
15], the genotoxic effects of triclopyr in European eel (
Anguilla anguilla L.) fish were investigated using the comet assay and showed that triclopyr induced genotoxicity in the fish species when exposed to concentrations of 30 and 120 µg/L over a short-term period [
15]. However, the actual mechanisms of triclopyr's toxicity to non-target aquatic organisms remain unknown. In addition, little is known about triclopyr toxicity in the early fish development stages, especially with respect to potential embryotoxicity and neurotoxicity induced in fish by low triclopyr concentrations.
Fish are suitable organisms for research due to their essential roles in the aquatic food chain and their effectiveness as bioindicators. Their high sensitivity to aquatic pollutants further supports their utility in ecotoxicological studies [
16]. Zebrafish (
Danio rerio), a freshwater teleost cyprinid fish, has emerged as a key predictive and high-throughput model in toxicological research [
17]. Zebrafish is an attractive organism model due to its small size, ease of handling and breeding in large numbers, and transparency during early development [
18]. Zebrafish display a noteworthy resemblance in their xenobiotic metabolism to that of humans [
19]. This similarity in metabolism enables researchers to extrapolate and gain a deeper understanding of how these substances may impact human health. Moreover, zebrafish exhibit a high degree of sensitivity to the toxicity of herbicides [
20], which provides valuable insights into the impact of these compounds on aquatic ecosystems and human health, promoting a safer and more sustainable environment [
21].
Although other studies have already shown its toxicity in other aquatic organisms, we aimed to gain a deeper understanding of triclopyr's toxicity through different approaches. We conducted toxicity tests at a range of concentrations of triclopyr found in the environment providing novel insights into understanding the mode of action of triclopyr and its effects on non-target aquatic organisms. These findings can contribute to improved environmental risk assessments and the development of strategies to safeguard non-target species in aquatic ecosystems.
3. Results
During the 144-hour of FET test (OECD, 2013), the control group displayed no instances of mortality and exhibited typical development, consistent with the findings outlined by Kimmel et al. [
24]. The positive control group, exposed to 4 mg/L 3,4-DCA, exhibited embryo mortality exceeding 30% within the first 96 hours, thus confirming the reliability of our test procedure in alignment with OECD [
23]. Regarding the triclopyr-treated groups, no significant mortality was observed.
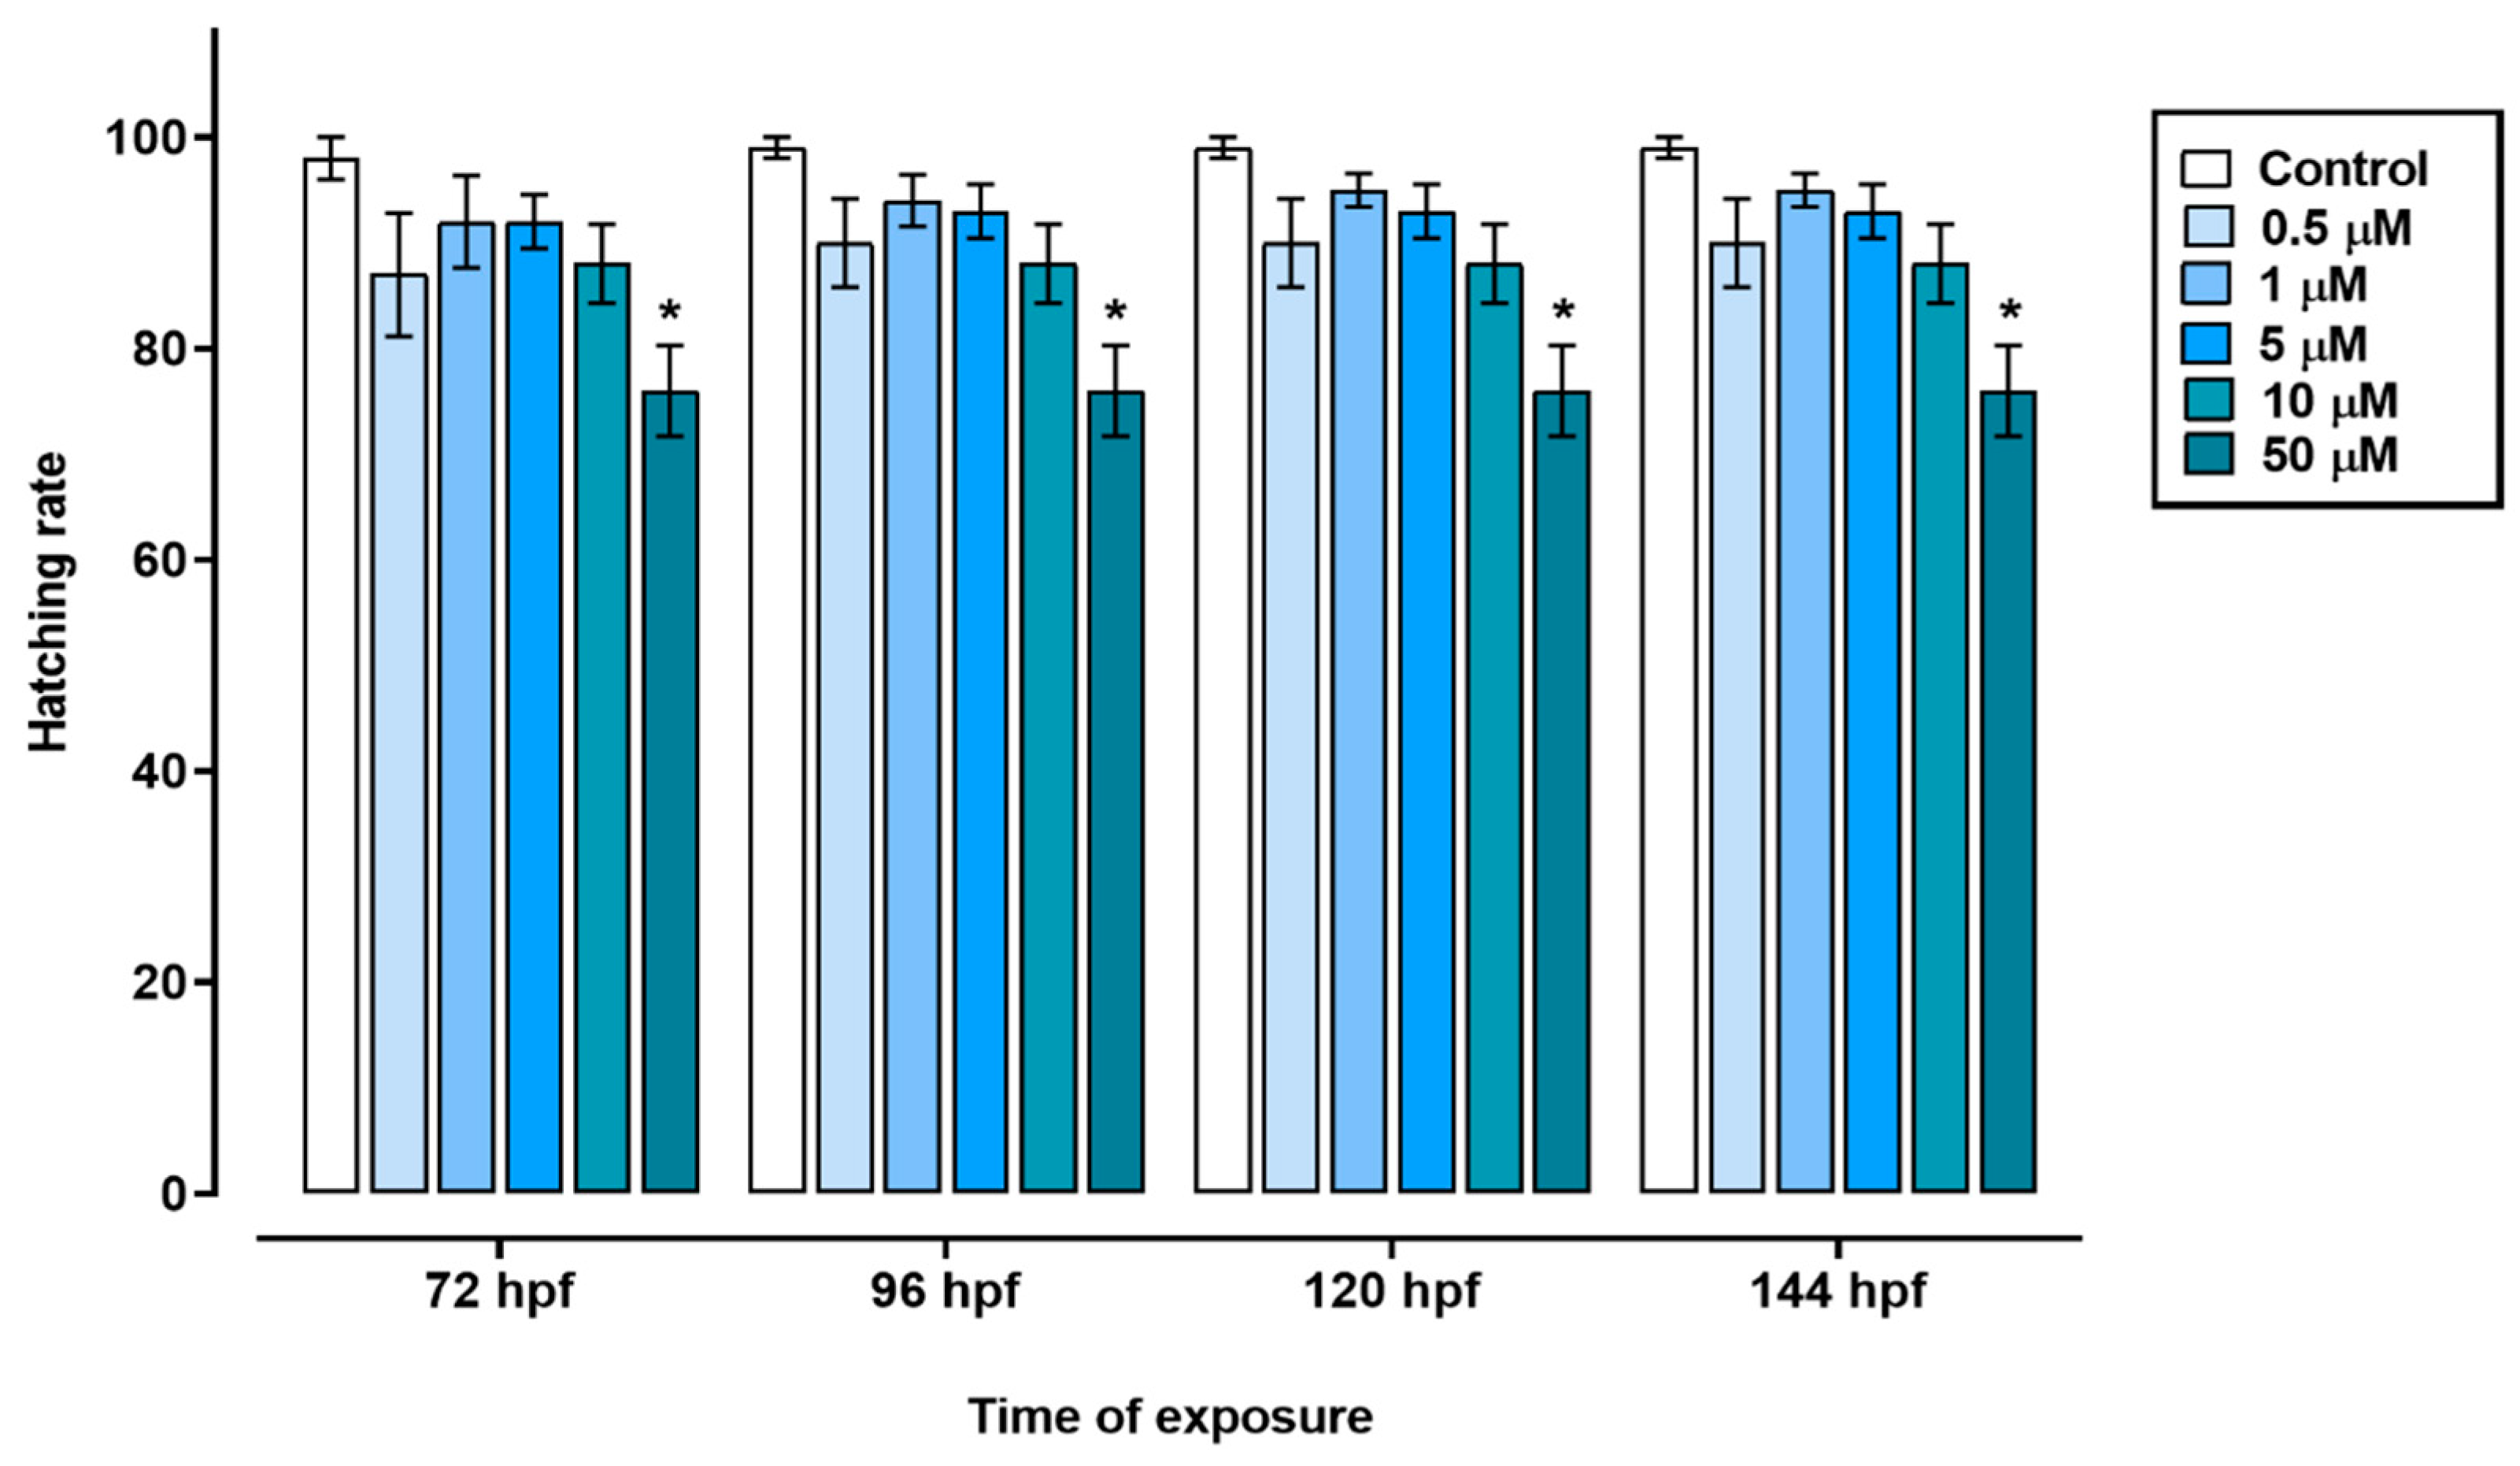
The exposure of zebrafish embryos to triclopyr resulted in impaired embryo development. In the time frame of 72 to 144 hours, the groups treated with 0.5, 1, 5, or 10 µM triclopyr, as well as the control group, showed similar egg hatching rates. However, the group exposed to 50 µM triclopyr demonstrated a significant decrease in embryo hatching at 72 h, and this reduction persisted until 144 h (
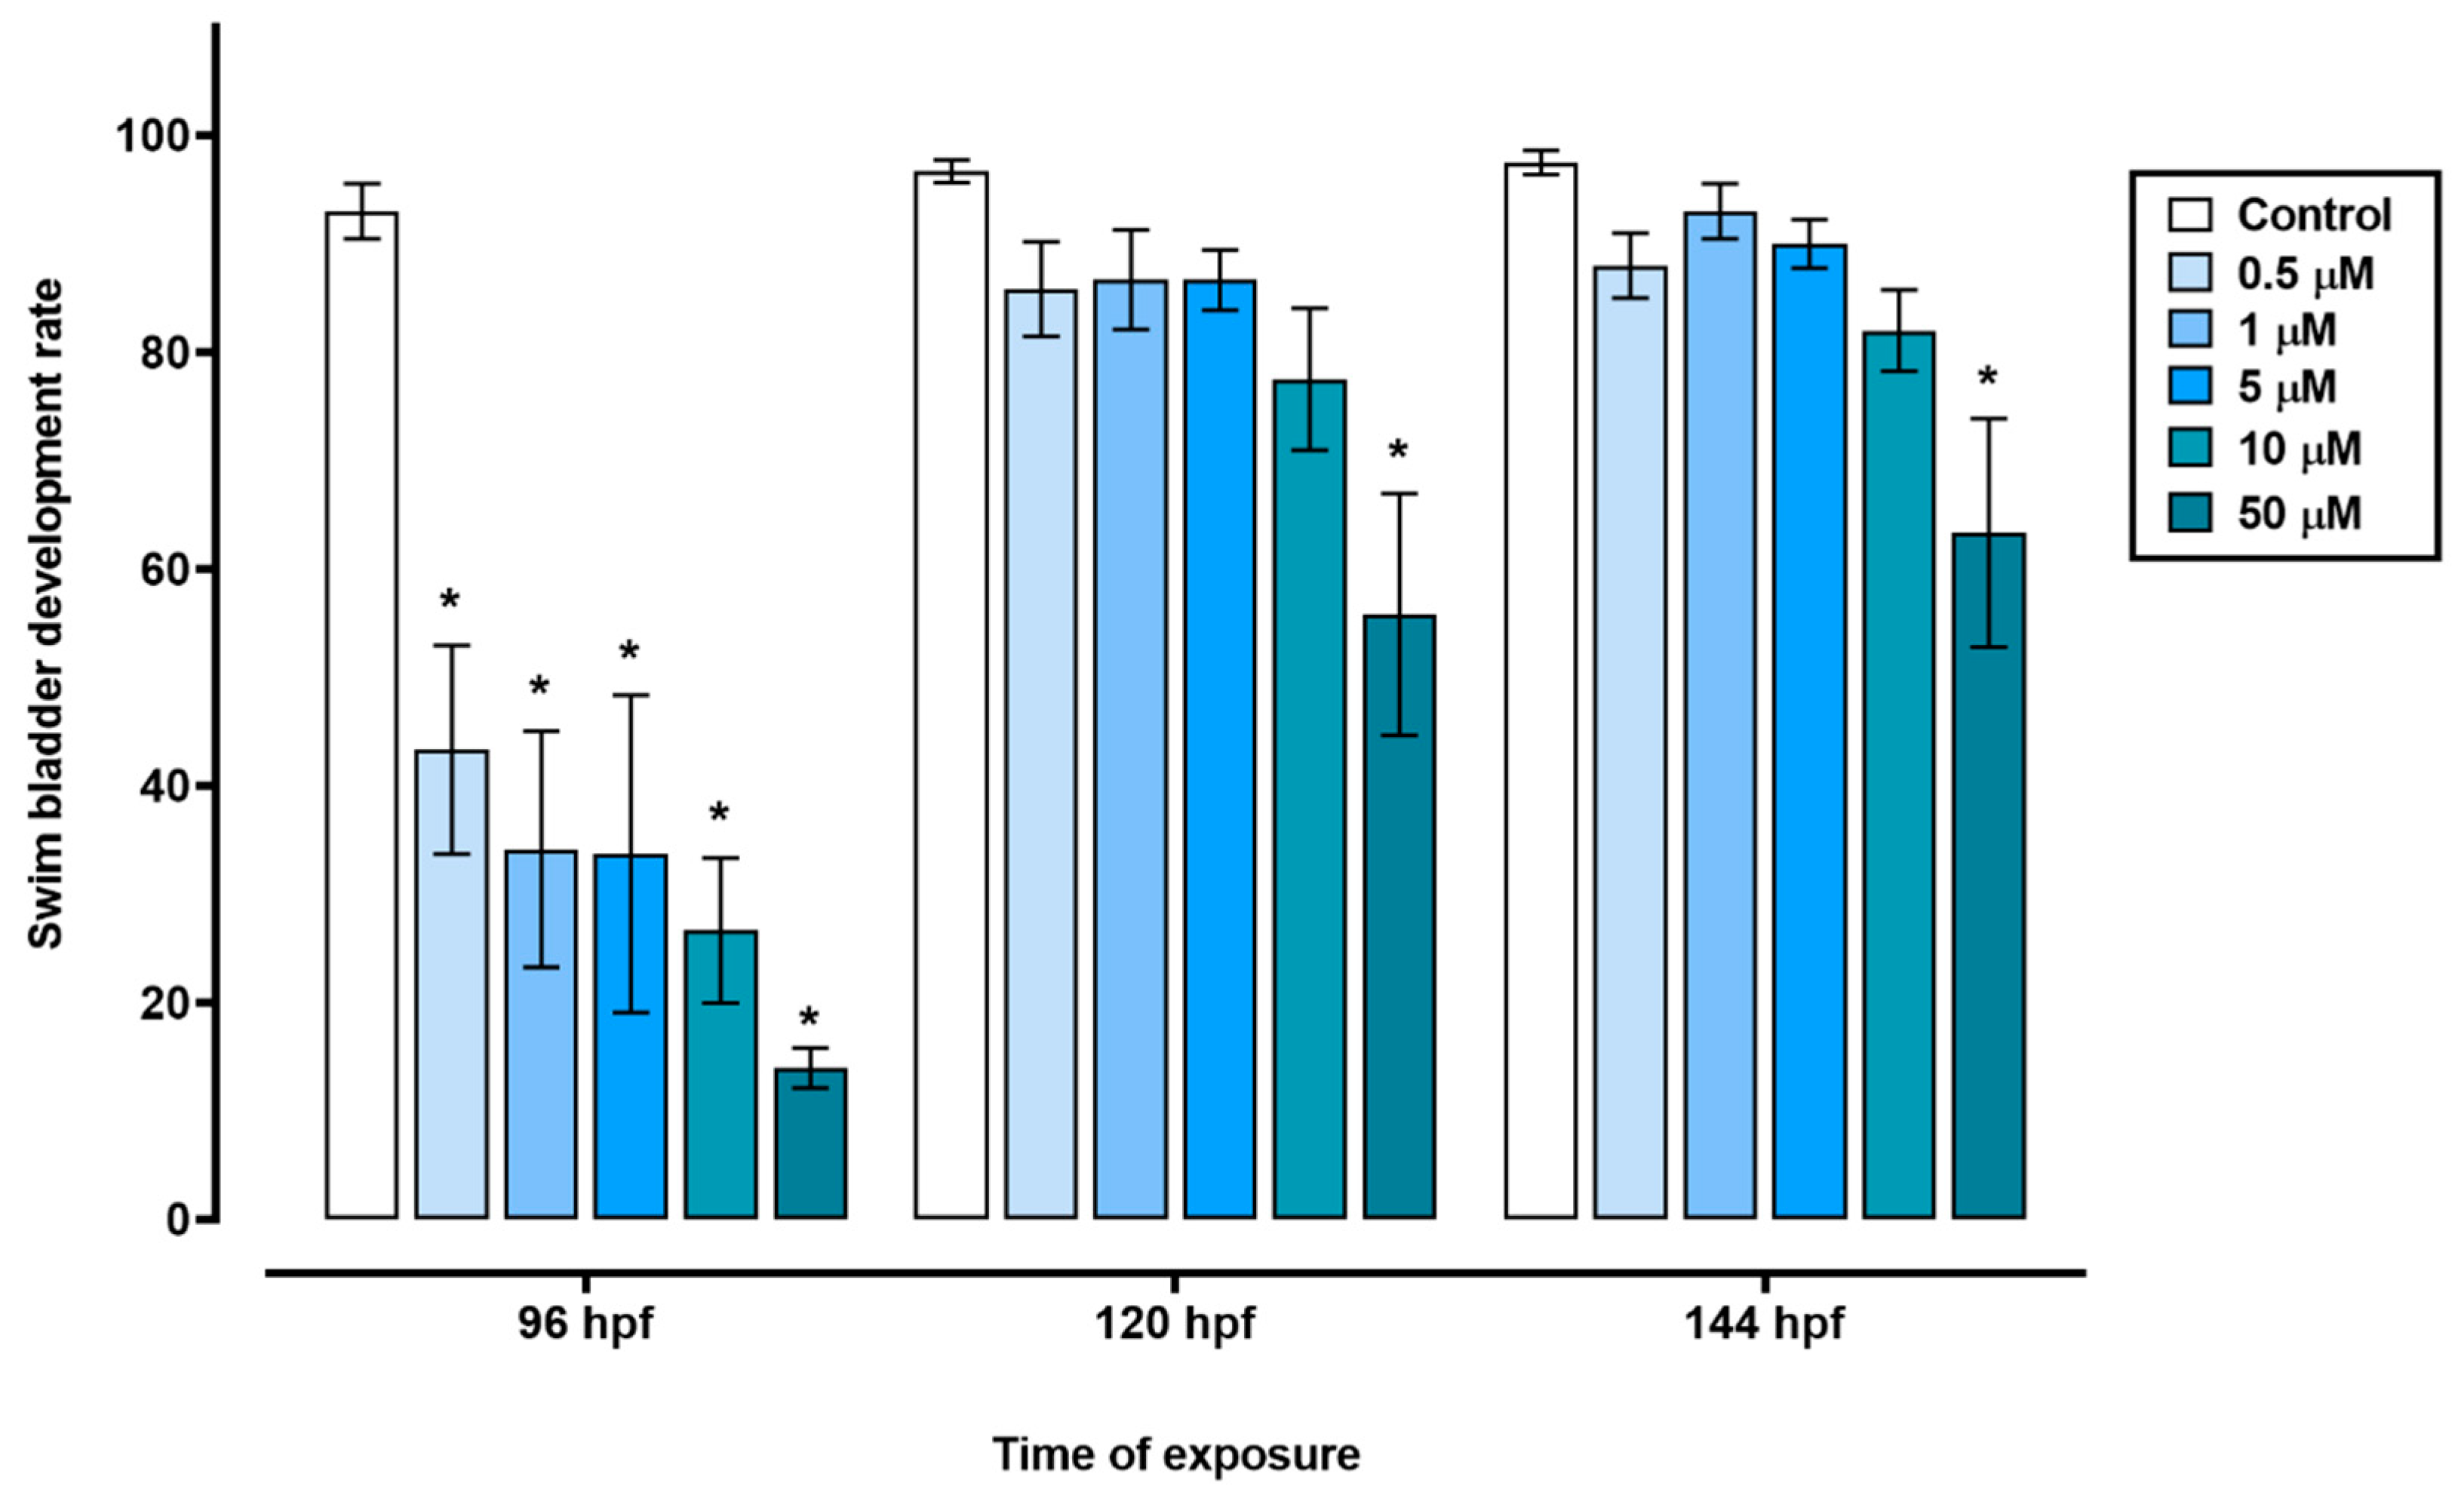
Figure 1). Furthermore, exposure to triclopyr at concentrations of 0.5, 1, 5, 10, or 50 µM resulted in delayed swim bladder development, which was recorded at 96 hpf. Nevertheless, by the time the larvae reached 120 or 144 hpf, this delay was only significantly evident in the group exposed to 50 µM triclopyr (
Figure 2).
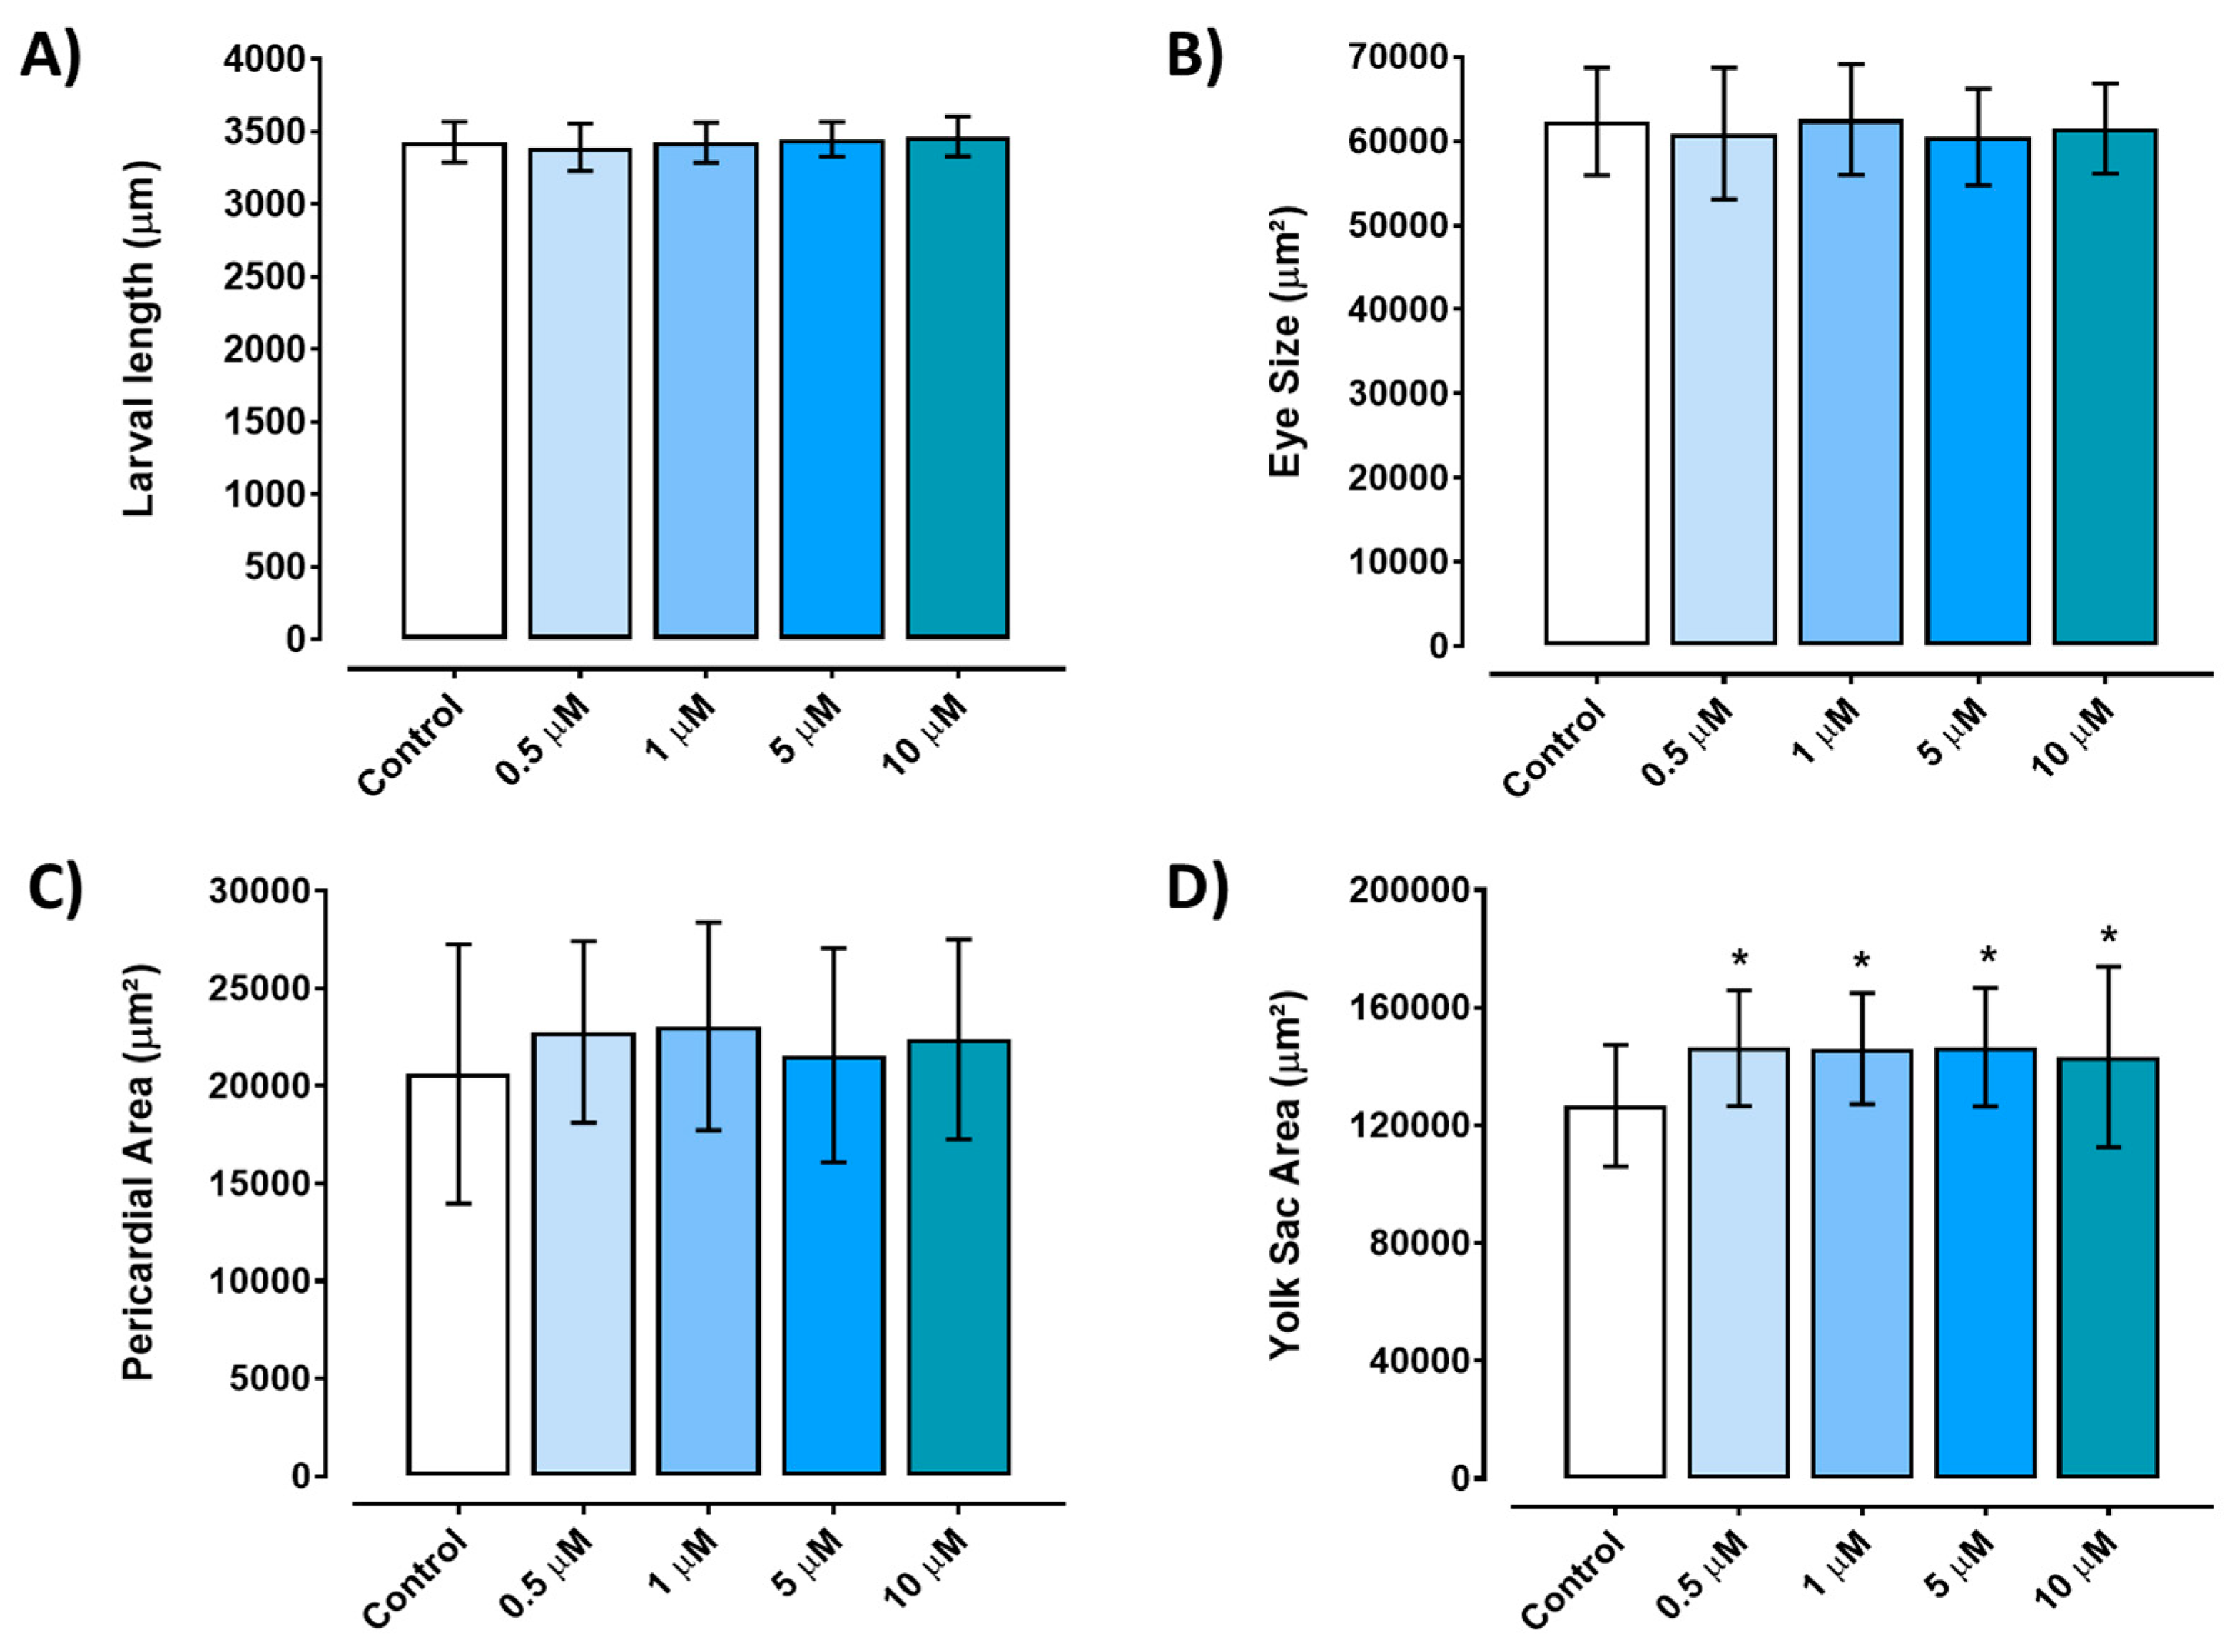
Embryos exposed to any of the tested concentrations of triclopyr (0.5–10 µM) for up to 96 hours did not exhibit a significant reduction in length compared to the control group (p≤0.05) (
Figure 3A). The eye area of zebrafish larvae did not show any significant alterations when compared to the control group (
Figure 3B). Similarly, the pericardium area did not display a significant difference when compared to the control group, although there was a suggestive trend towards an increase (
Figure 3C). However, triclopyr exposure led to the retention of yolk sac absorption (malabsorption) in zebrafish embryos, and a significant difference was observed in the yolk sac area among all the triclopyr-treated groups and the control group (
Figure 3D).
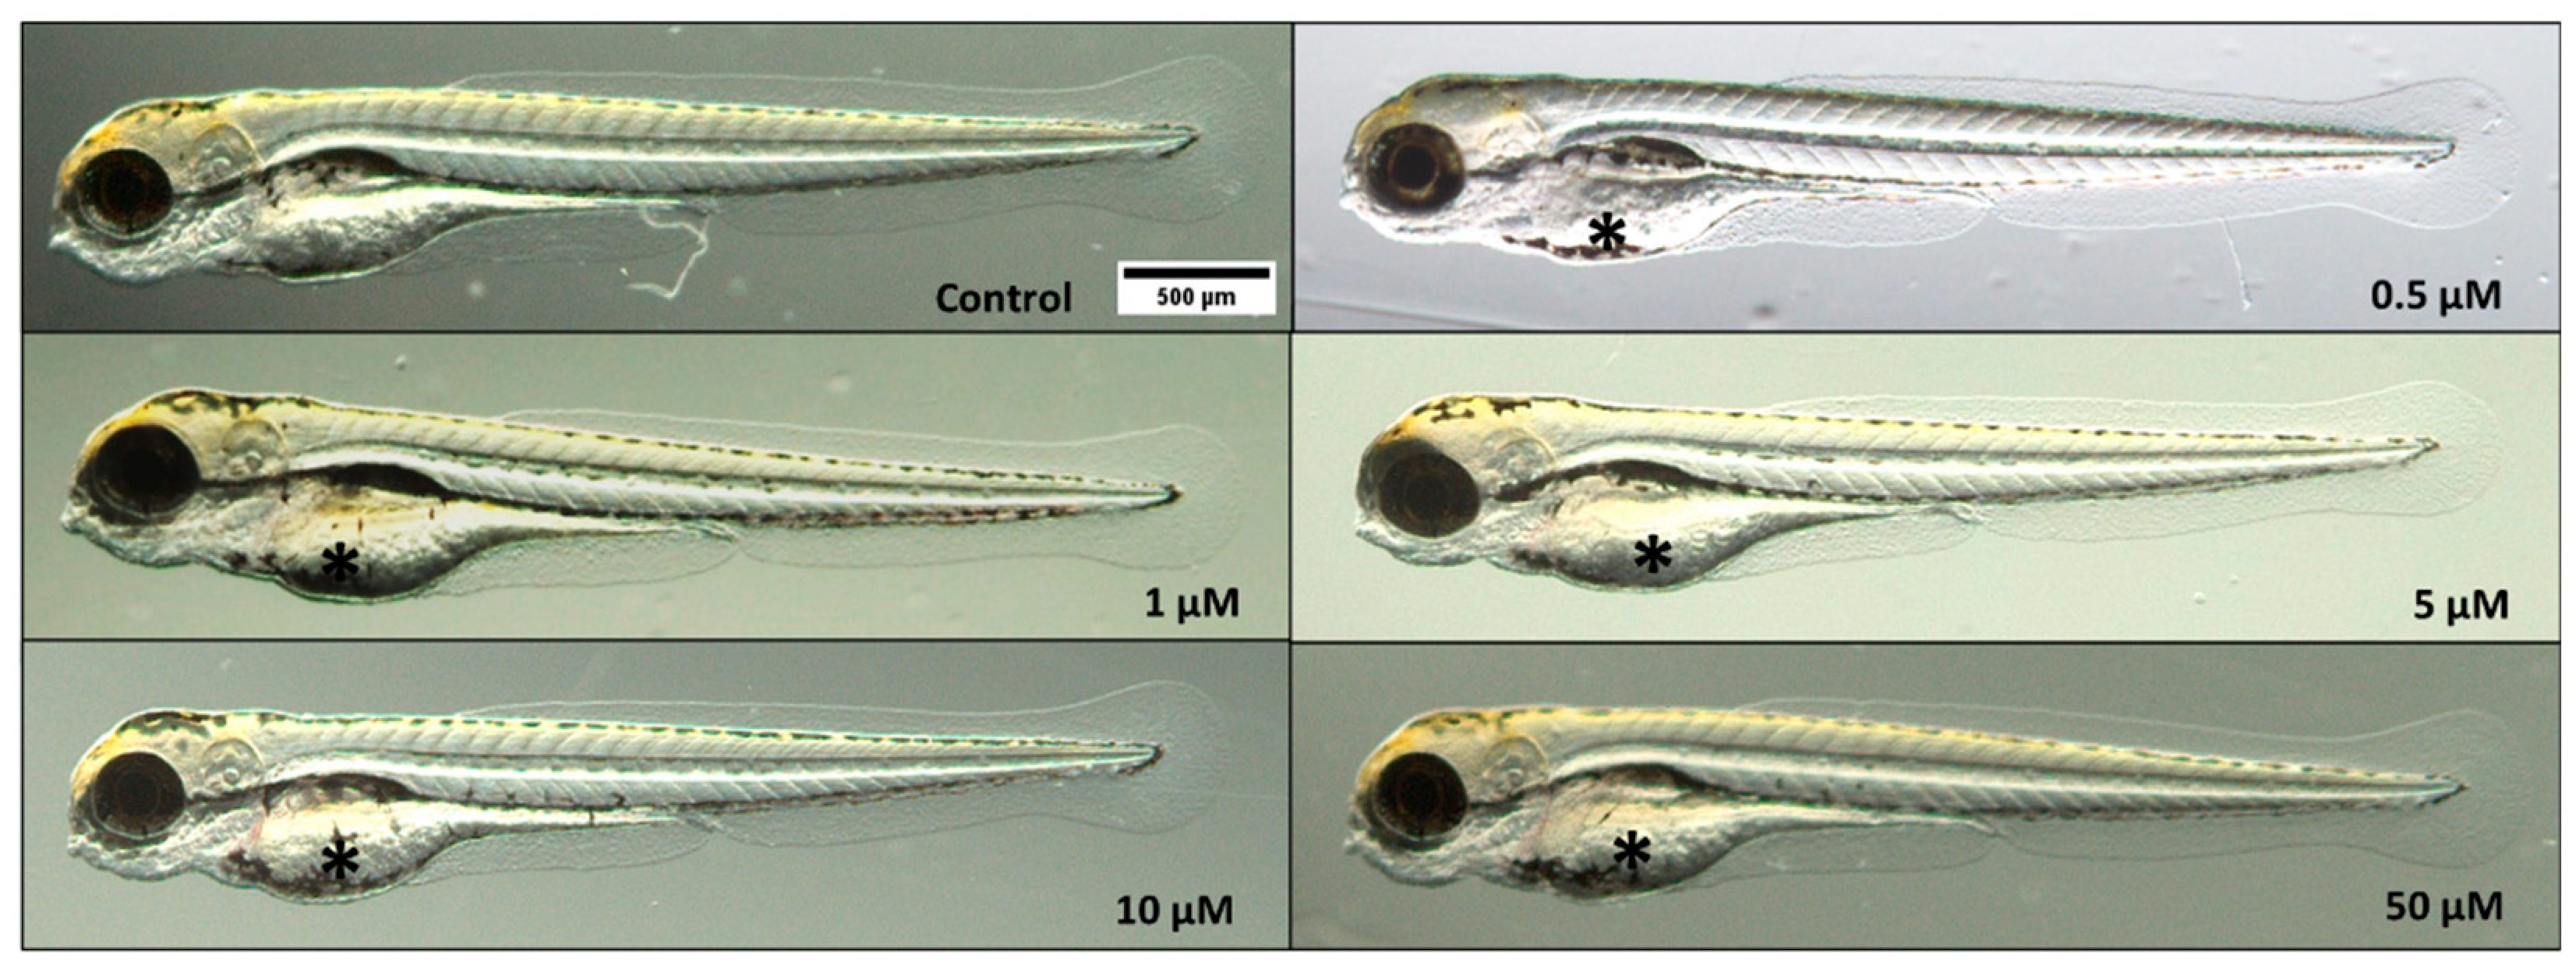
Figure 4 illustrates the comparison between the morphology of zebrafish larvae at 96 hpf in the control and triclopyr-treated groups.
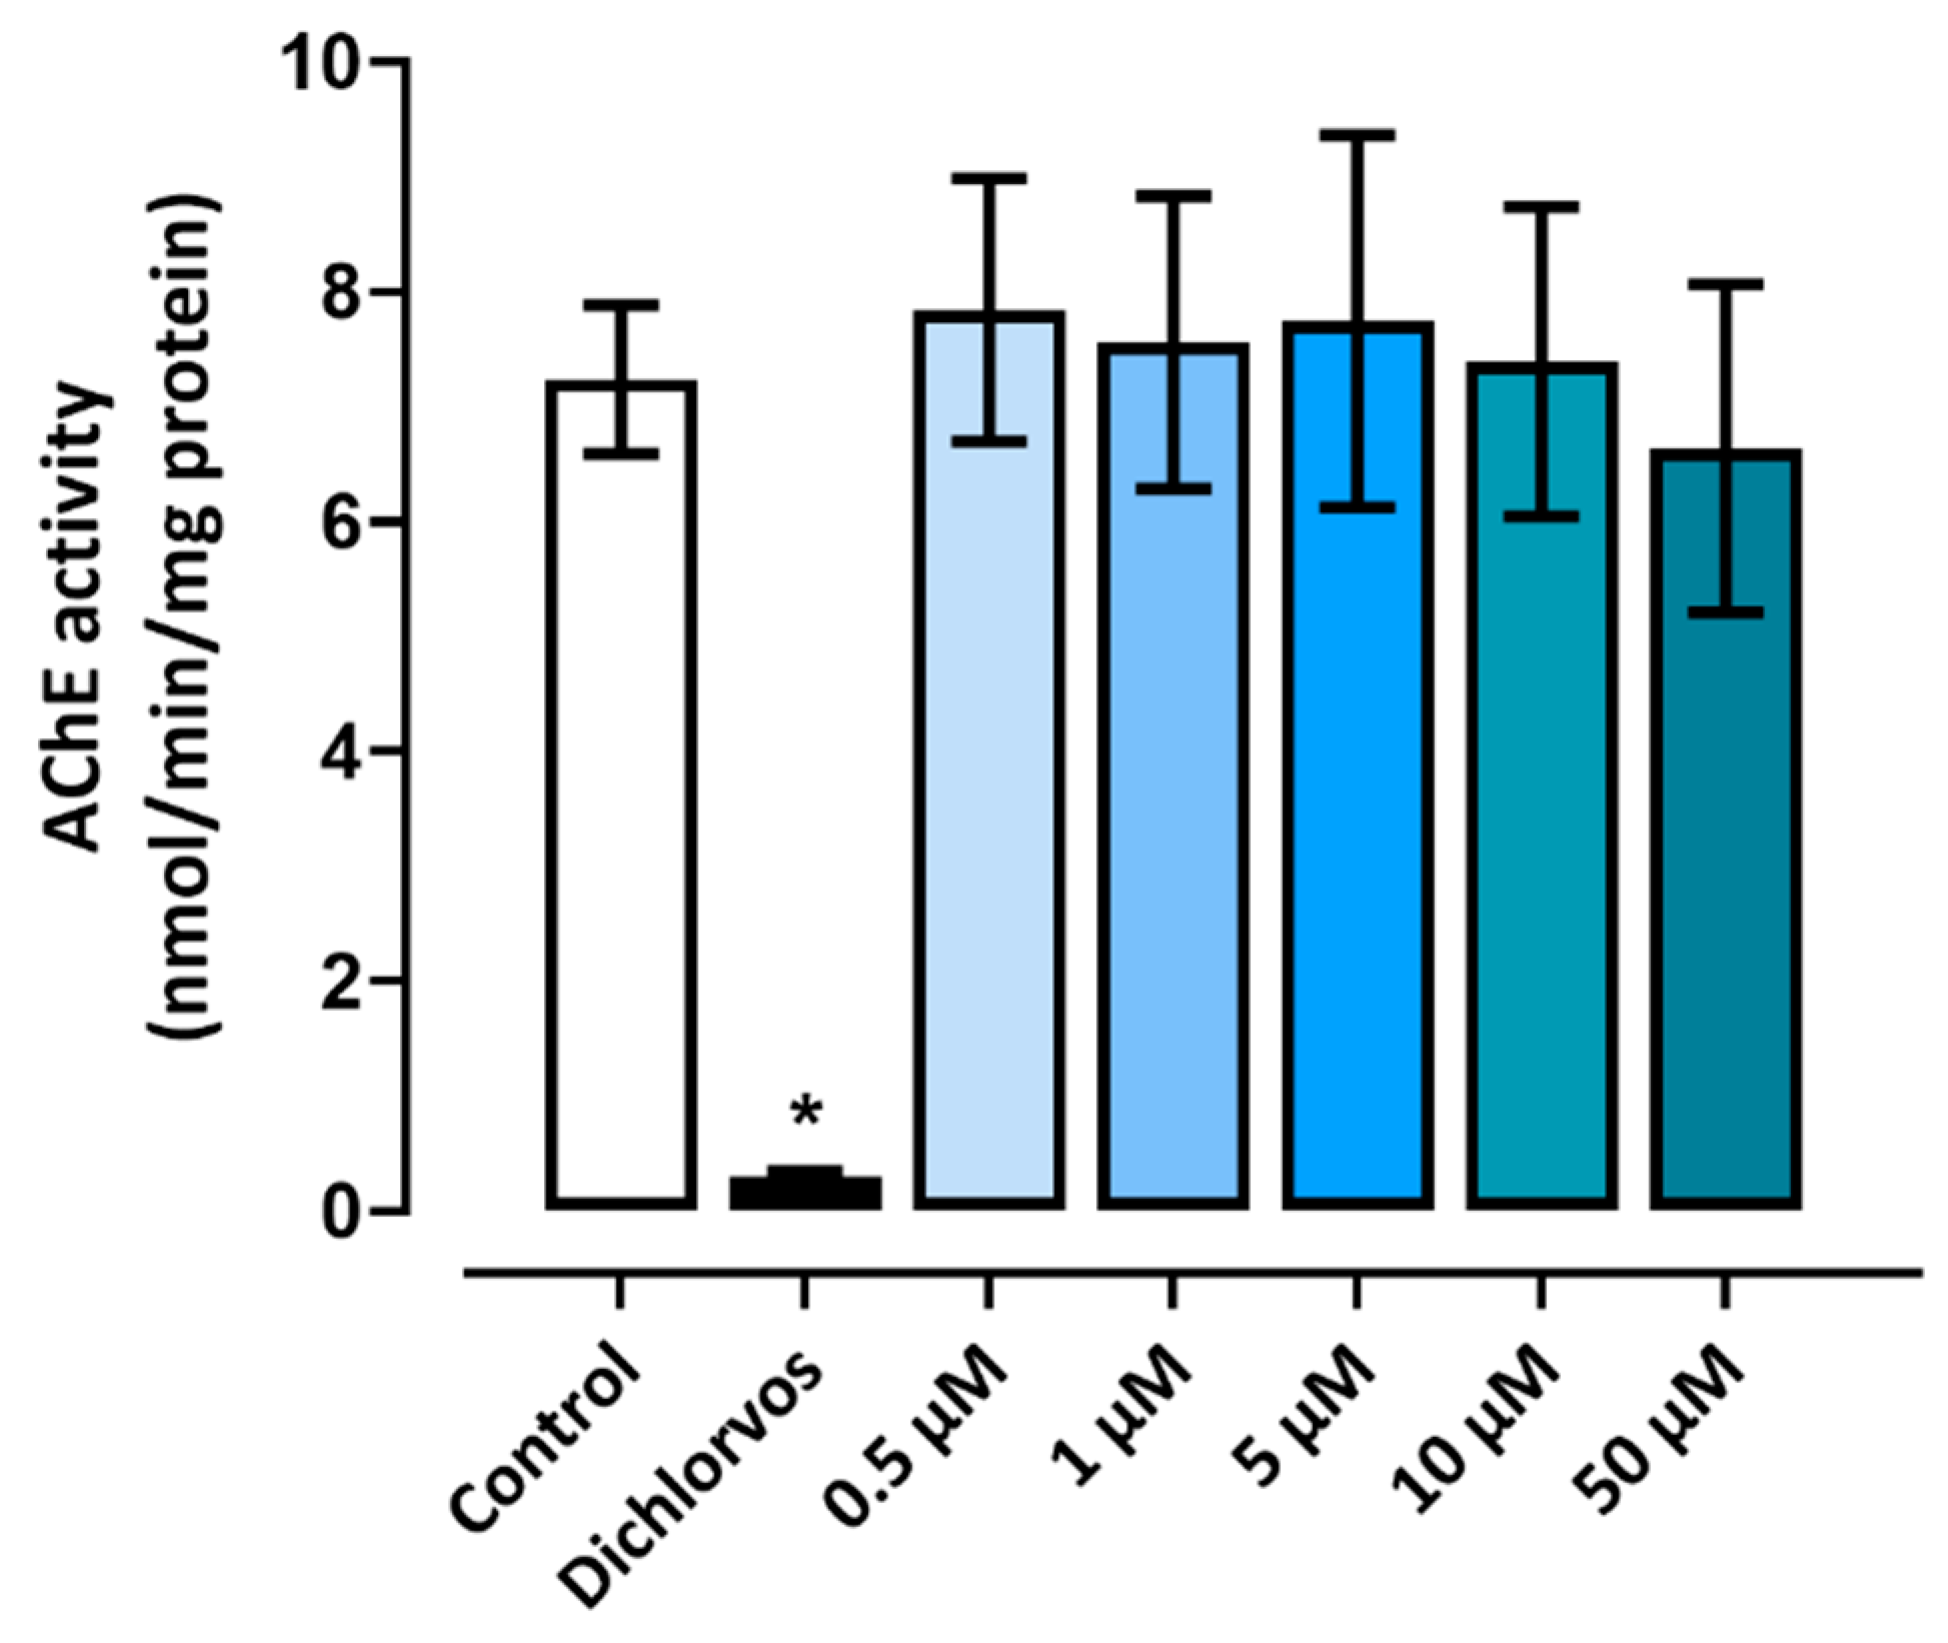
The AChE activity in zebrafish larvae was evaluated at 96 hpf. None of the groups treated with triclopyr showed significant results compared to the negative control. Therefore, at the tested concentrations, triclopyr did not interfere in the AChE enzymatic functions in embryos or larvae. These results are shown in figure 5.
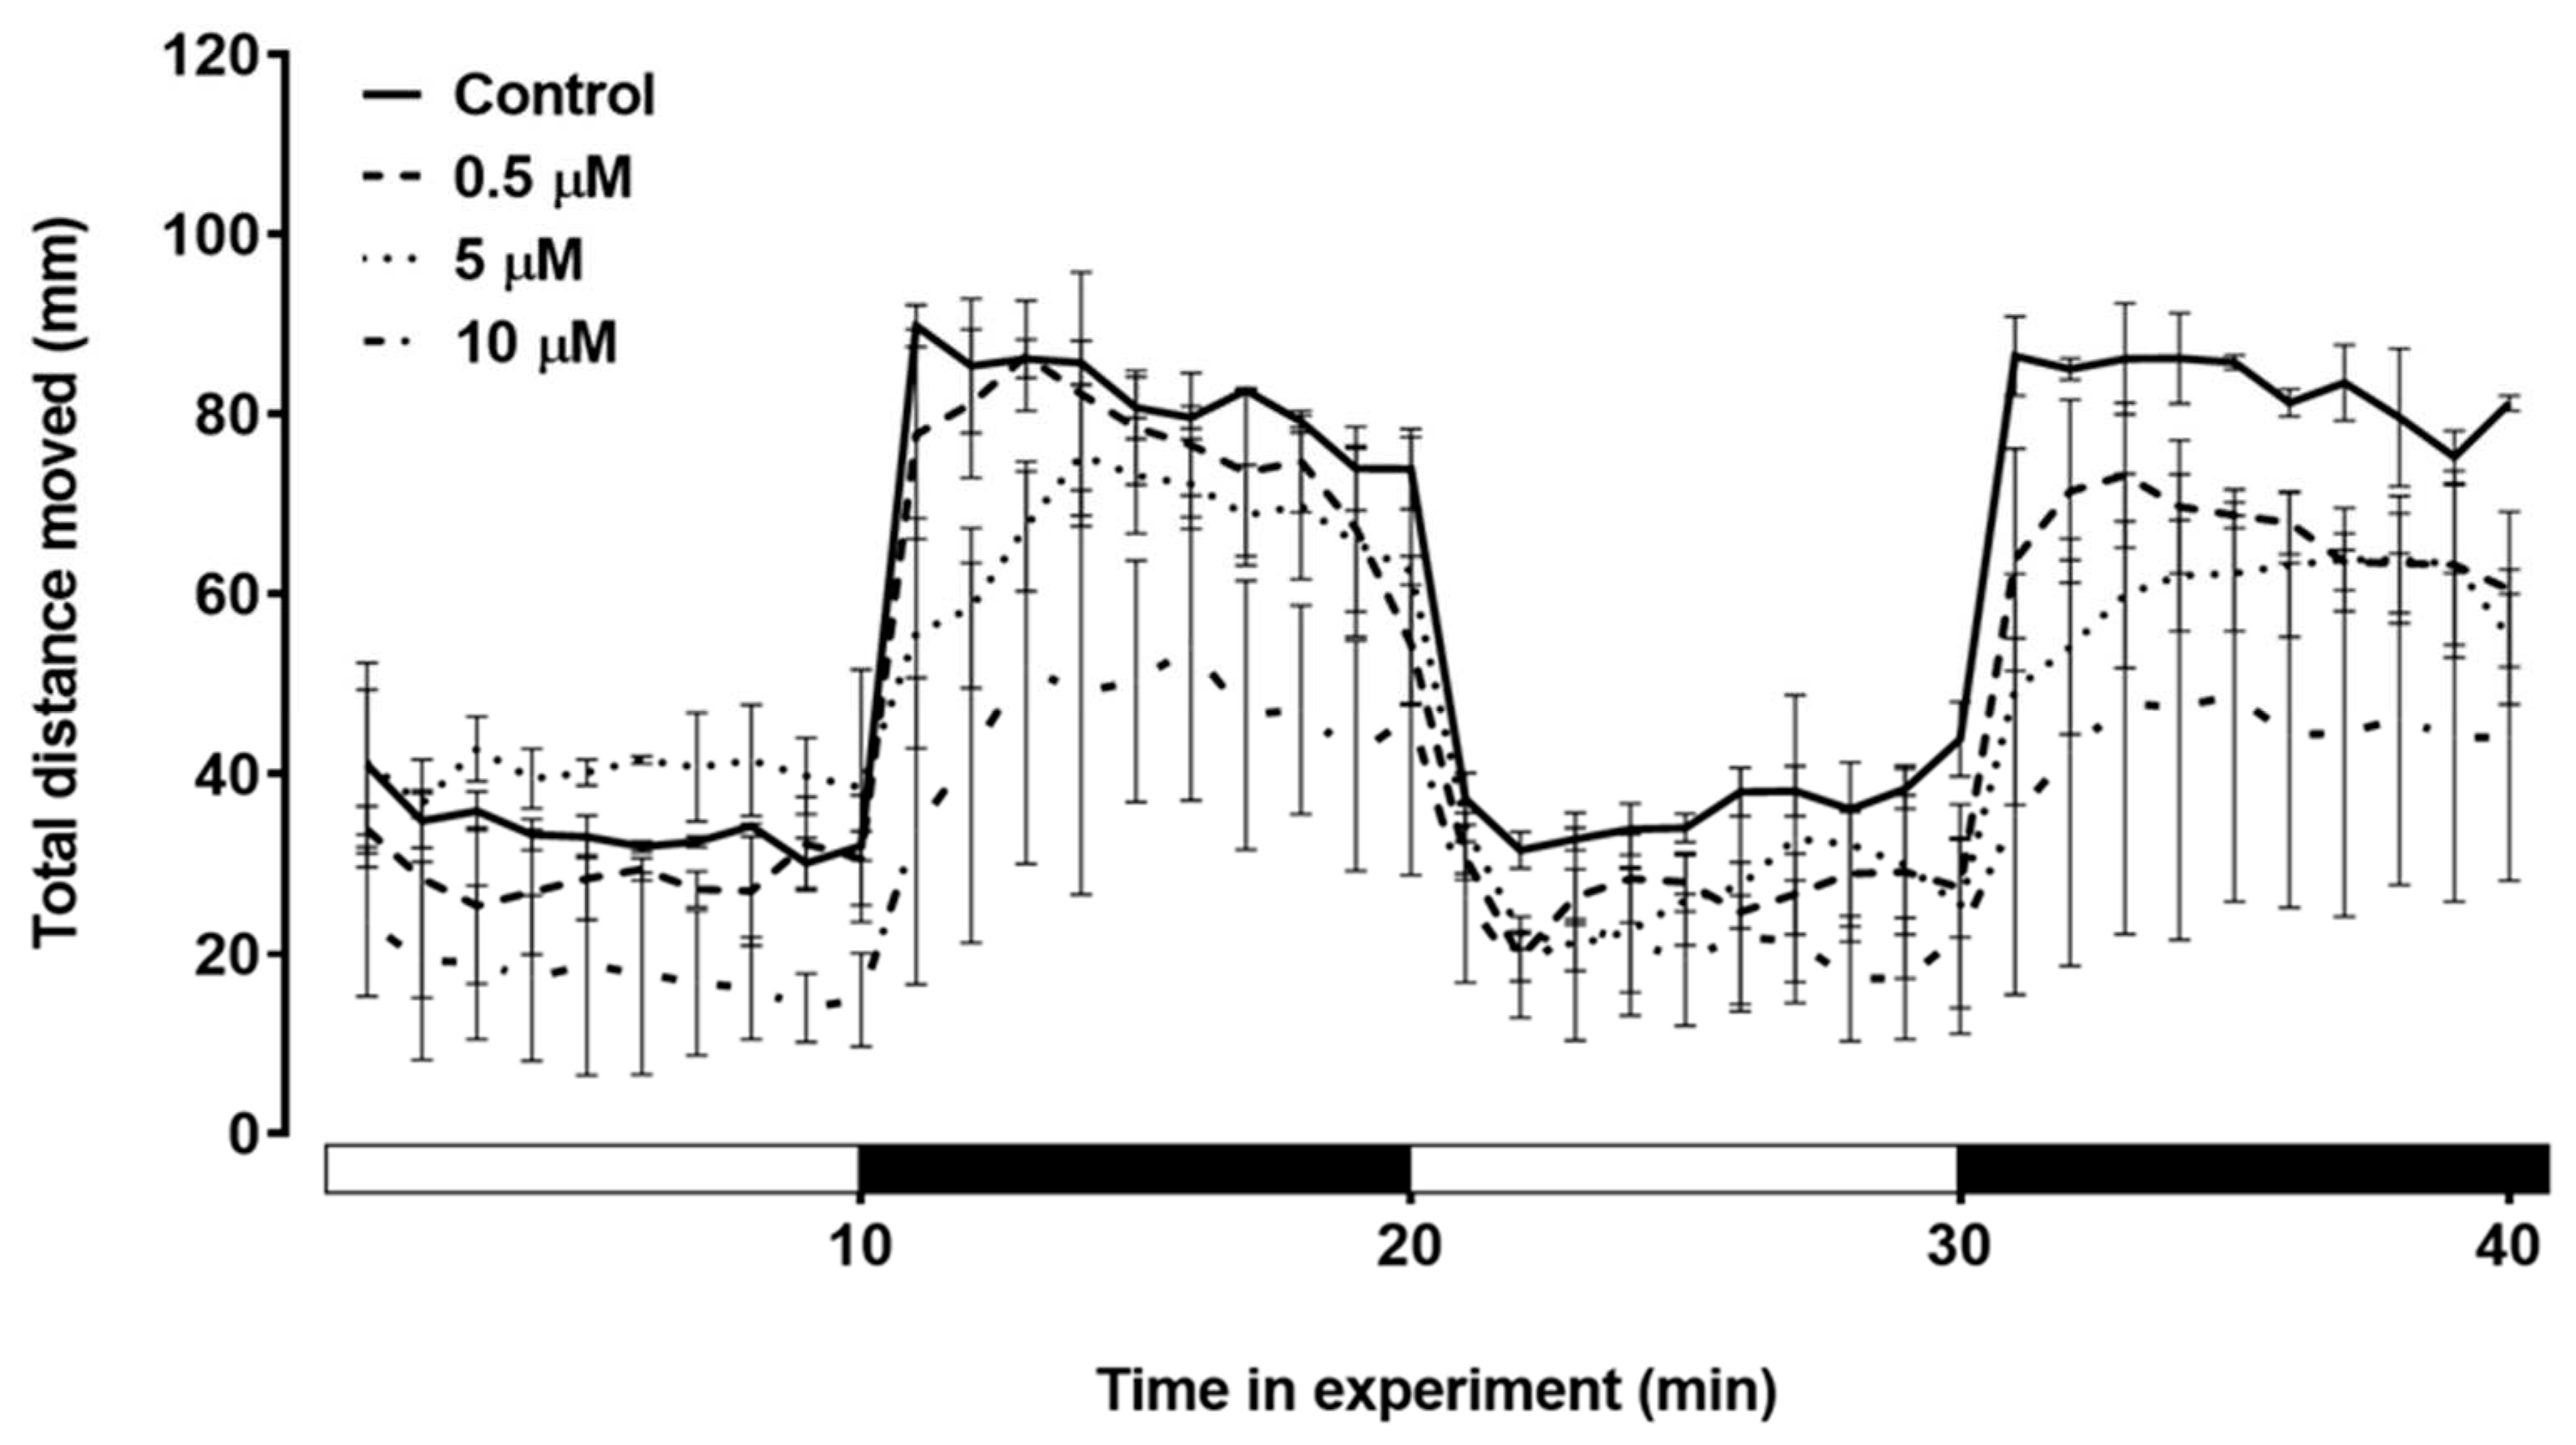
The swimming behavior of zebrafish larvae during the light/dark stimulus was assessed (
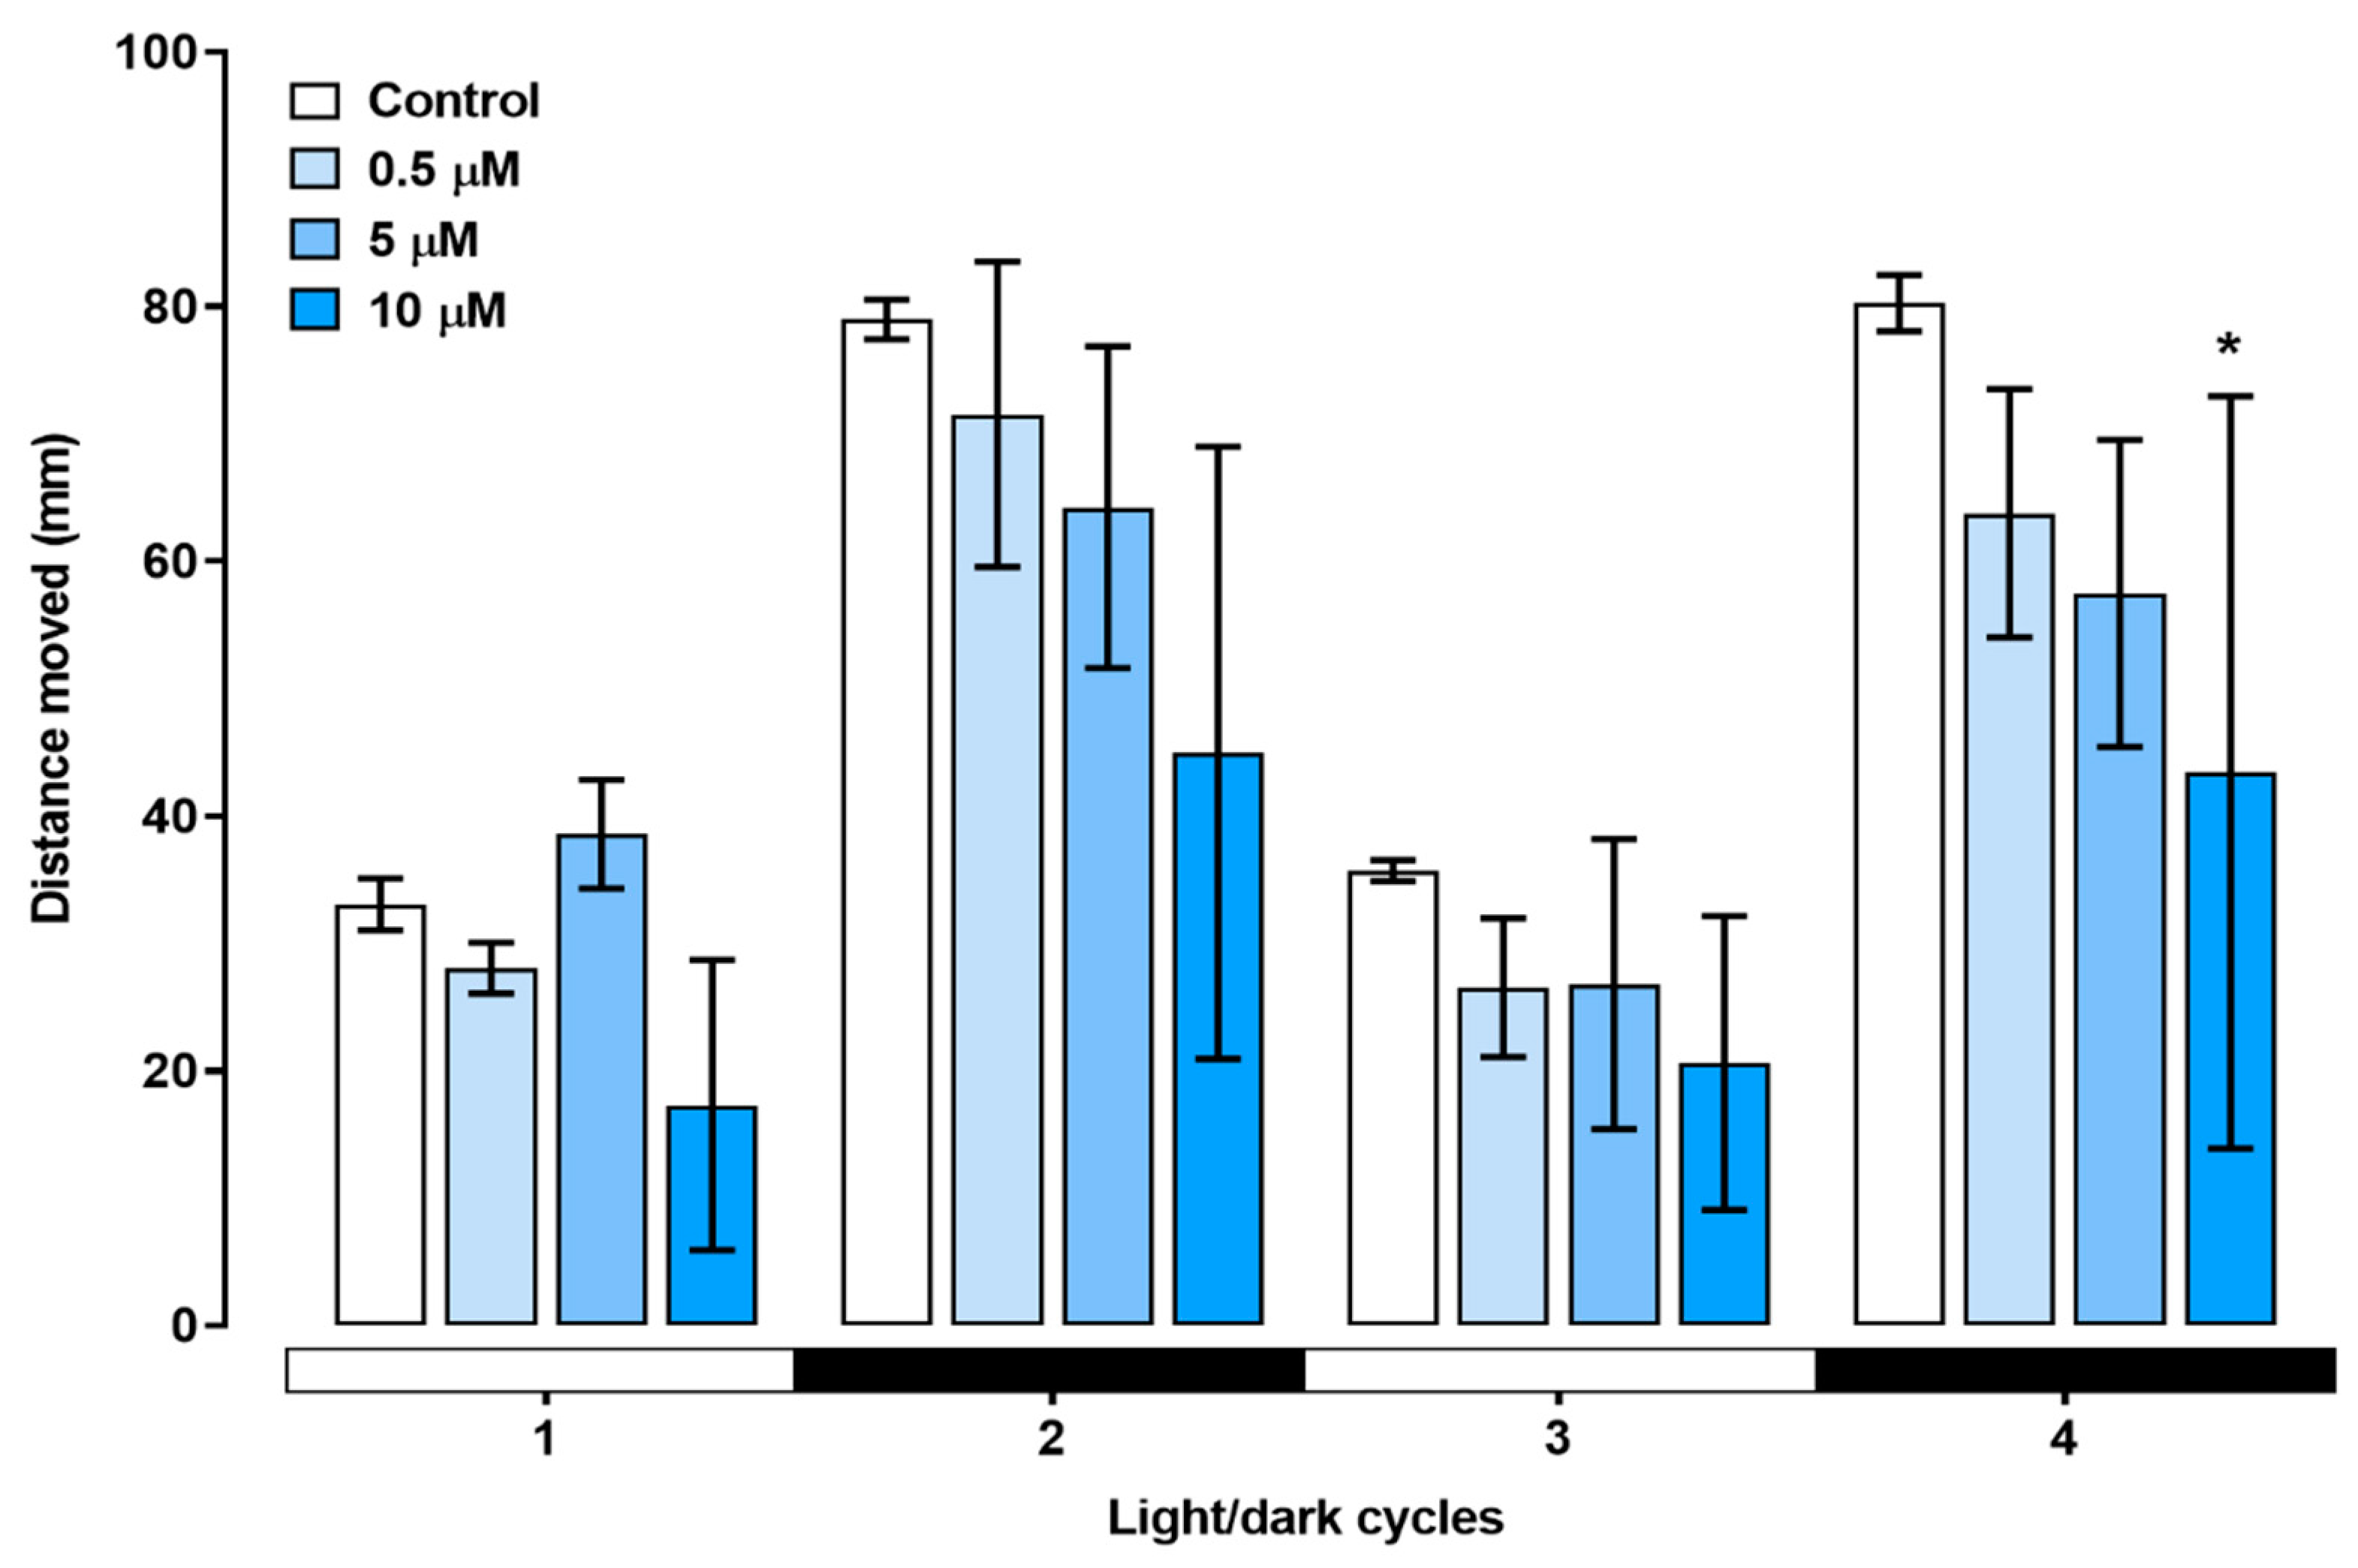
Figure 6). In the first dark stimulus, the larvae showed a visible decrease in total distance moved. In the second dark stimulus, the group treated with 10 µM triclopyr showed a significant decrease in the total distance moved compared to the control (
Figure 7).
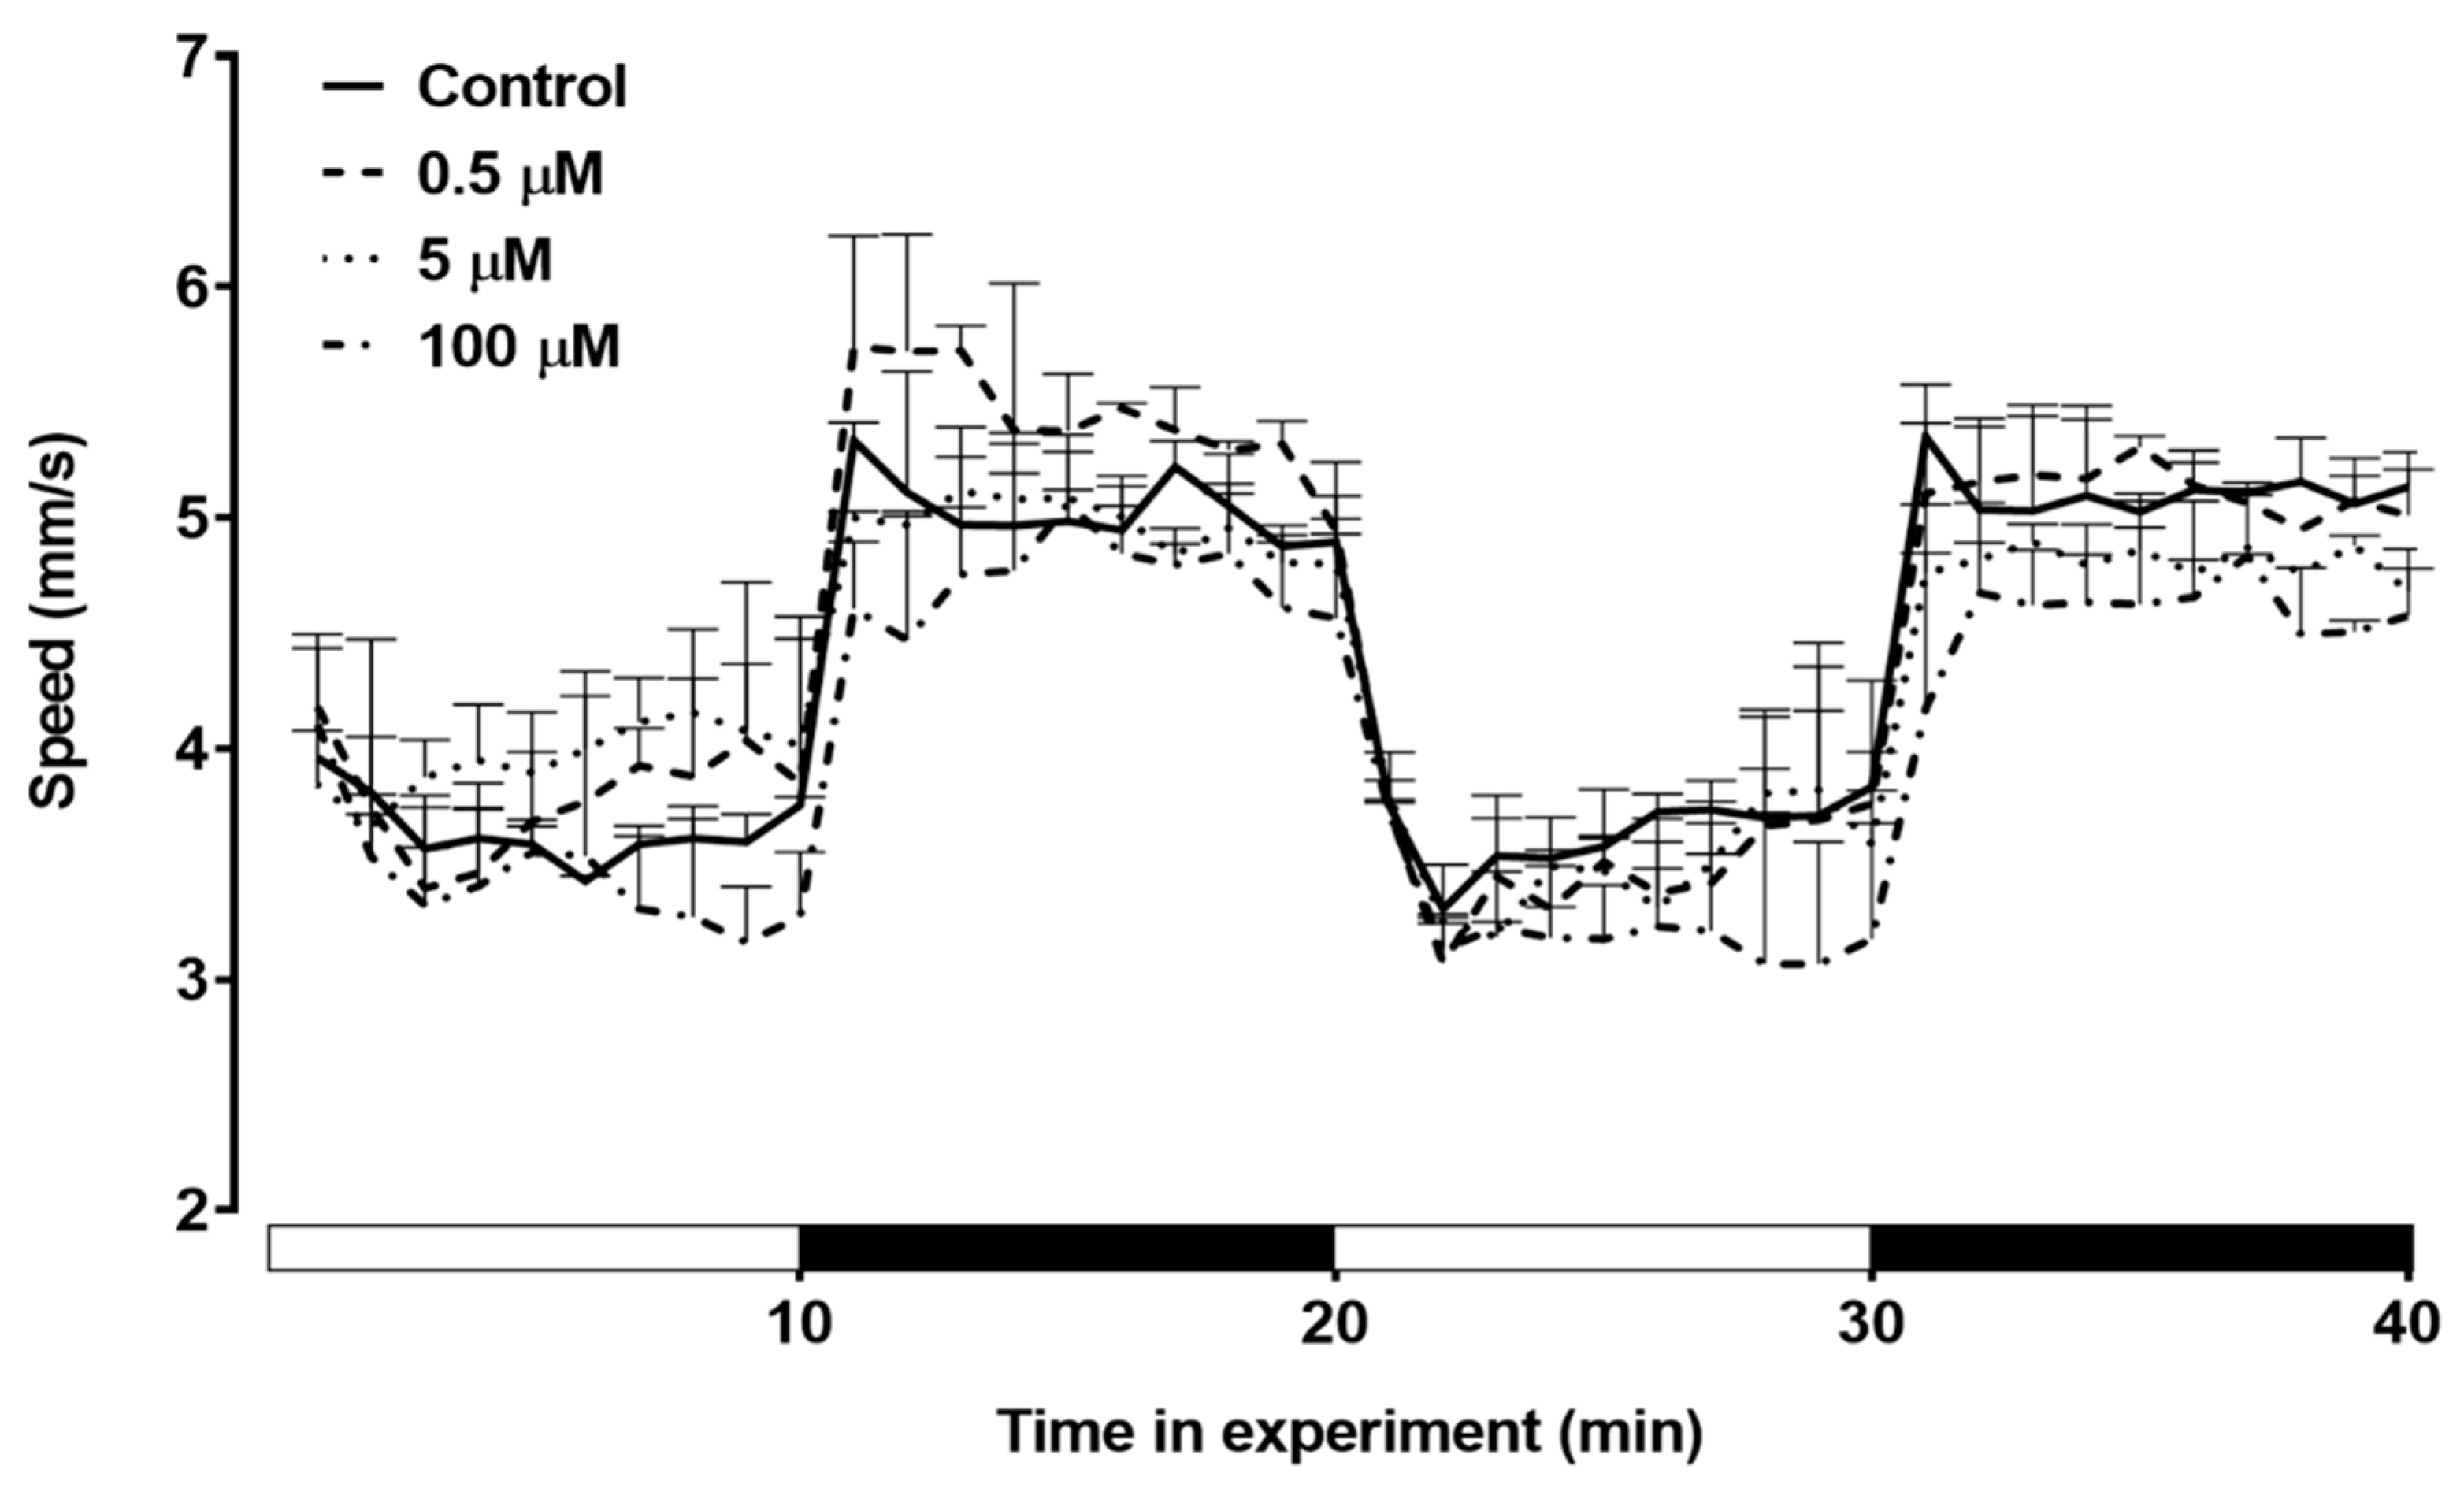
The impact of triclopyr exposure on the average swimming speed of zebrafish larvae was investigated. The results indicate that there were no significant alterations in the mean swimming speed observed among the treated groups throughout this period (
Figure 8). These findings suggest that, under the conditions of this experiment, triclopyr did not induce discernible changes in the average swimming speed of zebrafish larvae up to 144 hpf.
4. Discussion
While some studies demonstrated the reproductive and developmental safety of triclopyr in mammals [
28], exposing zebrafish embryos to triclopyr has resulted in significant sublethal effects. These findings highlight the embryotoxic potential of triclopyr in zebrafish, with negative impacts on hatching rate, yolk sac absorption, swim bladder development and swimming behavior. These discoveries emphasize the importance of carefully evaluating the environmental effects of chemicals like triclopyr, particularly in sensitive aquatic organisms. The triclopyr acute toxicity to fish has already been evaluated. The toxicity of triclopyr encompass mortality [
13], as well as other outcomes such as disorientation, coughing, and gill surface widening in adult fish [
14]. Conversely, in a 96-hour semi-static experimentation, Stehr et al. [
29] noted the absence of adverse effects on embryos exposed to triclopyr concentrations of up to 10 mg/L (39 µM). However, our study revealed that triclopyr induced embryotoxicity during the early development of zebrafish, yielding unprecedented findings among fish species exposed to triclopyr. During this period, the interplay of intrinsic and environmental factors, including environmental contaminants, can lead to modifications in typical physiological and morphological traits [
30].
According to Belanger et al. [
31], the LC50 values obtained from assays using zebrafish embryos (FET test) are very close to those observed in conventional acute toxicity tests. In our study, a LC50-96h 87.17 mg/L of triclopyr for zebrafish embryos was established. For five juvenile Pacific salmonids species (Coho salmon, Chinook salmon, Chum salmon, Pink salmon, Sockeye salmon and Rainbow trout) the triclopyr LC50-96h was determined in a range between 5.3 and 9.7 mg/L (20.66 and 37.82 µM) [
13]. However, when zebrafish were exposed to triclopyr at concentrations within the same range, up to 50 µM (12.82 mg/L), no significant mortality was observed.
The egg hatching is crucial for zebrafish development and survival [
24]. Delayed egg hatching was observed in zebrafish embryos exposed to 50 µM triclopyr, with a 24% delay in the hatching rate observed between 72 and 144 hpf. This observation aligns with the findings of Ahmad et al. [
32]. The authors also reported a similar delay in the zebrafish egg hatching rate when exposed to 39 µM triclopyr for 96 hours [
32]. Berrill et al. [
33] did not observe any effect on egg hatching in bull frog (
Rana catesbeiana), leopard frog (
Rana pipiens), or green frog (
Rana clamitans) embryos and tadpoles treated with triclopyr (2.33–19 µM at 48 hpf). However, the authors observed increased mortality after hatching due to organism sensitivity to triclopyr [
33].
Malabsorption of the yolk sac in zebrafish embryos was observed during exposure to all tested concentrations of triclopyr for up to 96 hours. The yolk sac serves as a crucial primary nutrient source for developing fish embryos, supplying vital energy reserves in the form of lipids and proteins for growth and development during the initial 5 days post-fertilization (dpf), when it is expected to be completely absorbed [
34]. The observed malabsorption during triclopyr exposure may be linked to triclopyr's potential interference with the nutrient transport process from the yolk to the developing zebrafish embryo. This transport process is mediated by lipoproteins within the yolk syncytial layer, which surrounds the yolk sac in zebrafish embryos [
34]. If triclopyr negatively affects the function of the yolk syncytial layer, lipoproteins, or apolipoproteins, it may lead to the larvae's inability to adequately absorb essential lipids from the yolk, resulting in nutritional deficiencies and malabsorption [34, 35]. Therefore, we suggest that exposure to triclopyr may hinder the normal availability and mobilization of yolk sac content.
Our results suggest that triclopyr induces structural or functional disturbances during zebrafish embryonic development, which may be associated with delayed hatching. This may have modified the mechanical force exerted by the embryos for egg hatching [
36]. Defects in swim bladder development indicate an environmental risk related to exposure to contaminants [
37]. In zebrafish, the swim bladder starts to inflate at 96 hpf [
24]. In this study, a decrease on number of uninflated swim bladder was observed to all triclopyr treatments at 96hpf. At 120 and 144 hpf, only the 50 µM remain the decrease, significatively. The abnormal development of the swim bladder is a sublethal effect [
38], which can affect aspects relevant to the survival of the organism, such as feeding behavior, predator escape, growth, and reproduction in fish [
39].
The behavioral analysis proves to be a reliable and highly responsive method to identify the impacts of chemicals on fish. In the light/dark illumination exchange test, a consistent pattern of increased motor activity during the dark phase is observed. This pattern is recognized as indicative of anxious behavior; however, upon the restoration of light, zebrafish larvae return to their baseline swimming activity [
40]. In the transition from light to dark, zebrafish larvae treated with triclopyr exhibited increase in distance moved during the dark period, an anxiety behavior pattern, followed by a decrease in moved distance during light stimulus. The same pattern has been reported for Gaaied et al. [
41], during the exposure of zebrafish to 2,4-D even at the lowest tested dose (0.02 mg/L) [
41].
The acute exposure to 10 µM of triclopyr resulted in a significant decrease in swimming activity of zebrafish larvae. Levin et al. [
42], found that on 120 hpf, the exposure to 100 ng/ml chlorpyrifos consistently exhibited notable decreases in swimming activity of larvae of zebrafish. Stehr et al. [
29] reported a significantly reduced touch response on zebrafish embryos exposed to 10 mg/L (52 µM) clopyralid, an herbicide of the picolinic acid family, which also includes triclopyr. Furthermore, Berrill et al. [
33], have shown that the herbicide Garlon 4®, which contains triclopyr acid as active ingredient, can lead to behavioral alterations that potentially impact the survival of frog tadpoles. Similarly, when salmon fry was exposed to doses lower than those which induce lethal effects, they also exhibited behavioral changes. All these findings suggest that triclopyr plays as a neurotoxic compound, which supports the findings in the zebrafish motor activity assay.
Altogether, the assay of AChE activity was carried out to explore the neurotoxicity of triclopyr. AChE plays a crucial role in neural signal transmission by breaking down the acetylcholine neurotransmitter. Moreover, AChE activity is often used as a biological marker to assess exposure to neurotoxic compounds [
43]. Chlorpyrifos-methyl and its primary metabolite, 3,5,6-trichloro-2-pyridinol, are compounds related to triclopyr, and both inhibit AChE activity in zebrafish embryos [
44]. In our study, triclopyr did not significantly inhibit or reduce AChE activity in zebrafish larvae after 96 hours of exposure. However, swimming behavior in the light/dark challenge test was significantly altered in zebrafish larvae at 144 hpf when exposed to triclopyr at 10 µM. In addition to AChE, other neurotransmitters such as dopamine, serotonin, acetylcholine, gamma-aminobutyric acid (GABA), glutamate, histamine, and glycine also play a crucial role in motor activity [
45]. The disruption of the activity of these neurotransmitters can directly impact motor performance [
46].
Finally, CEC toxicity studies are of great value and provide information that enables the possible impacts of these contaminants in the short and long term to be predicted in terms of environmental, animal, and human health. This is the first study that has demonstrated that triclopyr negatively impacts early development stages of zebrafish. Fish represent only one of the trophic levels in the aquatic environment. The use of these species at early development stages in ecotoxicological tests allows us to gain insights into the possible consequences for the species in future projections such as survival [
47]. Collectively, the effects observed in this study due to exposure to triclopyr can also predict the extent of its impact on other trophic levels, including the risk to non-target aquatic organisms. Moreover, data obtained here can support decision-making by regulatory agencies, aiding in the assessment of potential impacts, the development of risk management strategies, and the establishment of continuous monitoring programs for this contaminant.
Figure 1.
Hatching rate of zebrafish exposed to triclopyr. Effect on the hatching rate of zebrafish embryos upon exposure to triclopyr in relation to exposure time. The proportion of hatched embryos by time and concentration is represented by different blue scales. The bars represent means, and the error bars represents standard error of the means (SEM) (n = 60). *One-way ANOVA followed by Dunnett’s test, p ≤ 0.05 for significant differences between exposed and control groups.
Figure 2.
Swim bladder development of zebrafish exposed to triclopyr. Graphic representation of the swim bladder development rate in zebrafish larvae by time of exposure to triclopyr. The proportion of swim bladder development by time and concentration is represented by different blue scales. The bars represent means, and the error bars represents standard error of the means (SEM) (n = 60). *One-way ANOVA followed by Dunnett’s test, p ≤ 0.05 for significant differences between exposed and control groups.
Figure 3.
Developmental alterations induced by different concentrations of triclopyr in zebrafish. A) Larvae length at 96 hours post-fertilization. B) Eye size area of zebrafish at 96 hours post-fertilization. C) Pericardial area of zebrafish larvae at 96 hours post-fertilization. D) Yolk sac area of zebrafish larvae at 96 hours post-fertilization with edemas. Larvae measurements by exposure concentration is represented by different blue scales. The bars represent means, and the error bars represents standard error of the means (SEM) (n=45). *One-way ANOVA followed by Dunnett’s test, p≤0.05 for significant differences between exposed and control groups.
Figure 4.
Effects of triclopyr on zebrafish larvae development at 96 hours post-fertilization (hpf). Representative pictures of zebrafish larvae exposed to different concentrations of triclopyr, namely 0.5, 1, 5, 10, and 50 µM (1.25× magnification), show evident yolk sac malabsorption (*) in all treatment groups.
Figure 5.
AChE activity in embryos and larvae exposed to triclopyr. Acetylcholinesterase activity in larvae at 96 hpf, after exposure to triclopyr. AChE activity was determined in nmol per minute per milligram of protein. The bars represent means, and the error bars represents standard error of the means (SEM) (n = 90). *One-way ANOVA followed by Dunnett’s test, p≤0.05 for significant differences between exposed and control groups.
Figure 6.
Total distance moved by zebrafish larvae exposed to triclopyr after 144h. Kinetics of the total distance (mm) moved by larvae during the light/dark stimulus. The lines represent different exposed groups (n = 24), and the error bars denote the standard error of the means (SEM). *One-way ANOVA followed by Dunnett’s test was conducted, with p≤0.05 indicating significant differences between the exposed and control groups.
Figure 7.
The total distance moved in response to the light/dark stimulus test applied for larvae treated with triclopyr up to 144 hpf. The X-axis shows the whole experiment time and light/dark transition every 10 minutes. The bars represent means (n = 24), and the error bars represents standard error of the means (SEM). *One-way ANOVA followed by Dunnett’s test, p≤0.05 for significant differences between exposed and control groups.
Figure 8.
Swimming speed of zebrafish larvae exposed to triclopyr up to 144 hpf. The graphic illustrates the kinetics of swimming speed (mm/s) exhibited by larvae during the light/dark stimulus. The lines represent different exposed groups (n = 24), and the error bars denote the standard error of the means (SEM). *One-way ANOVA followed by Dunnett’s test was conducted, with p≤0.05 indicating significant differences between the exposed and control groups.
