3. Results
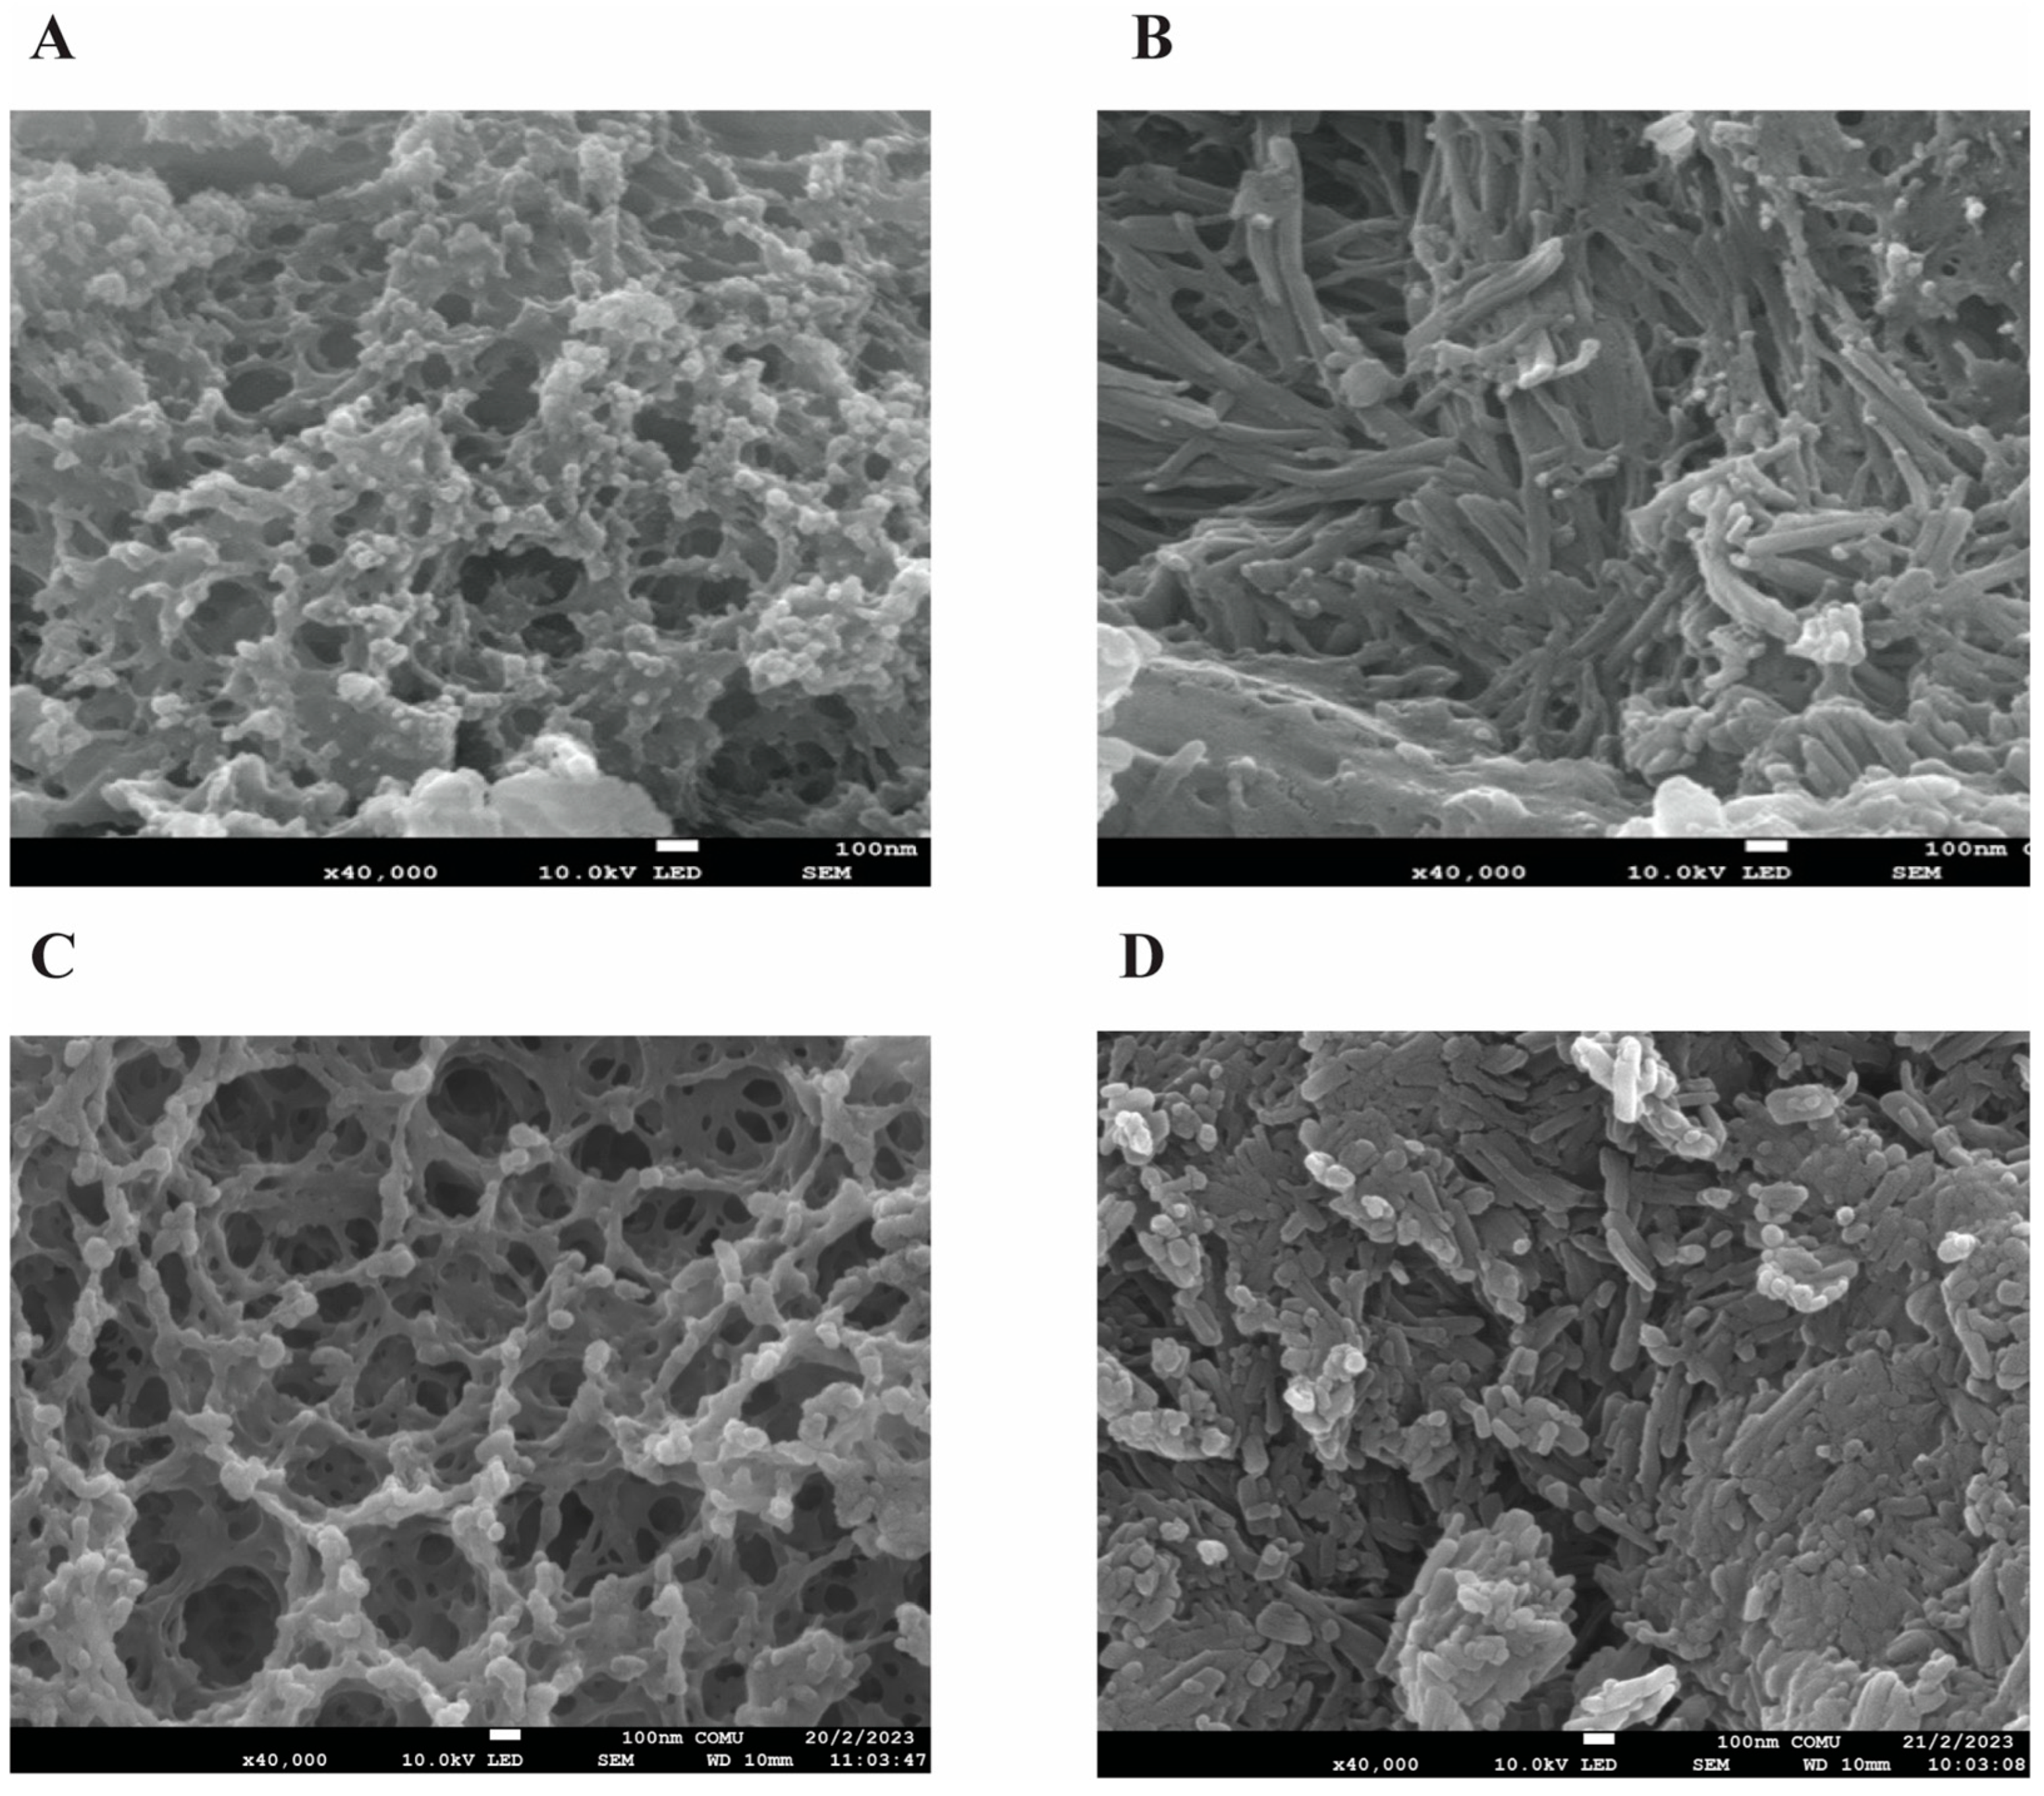
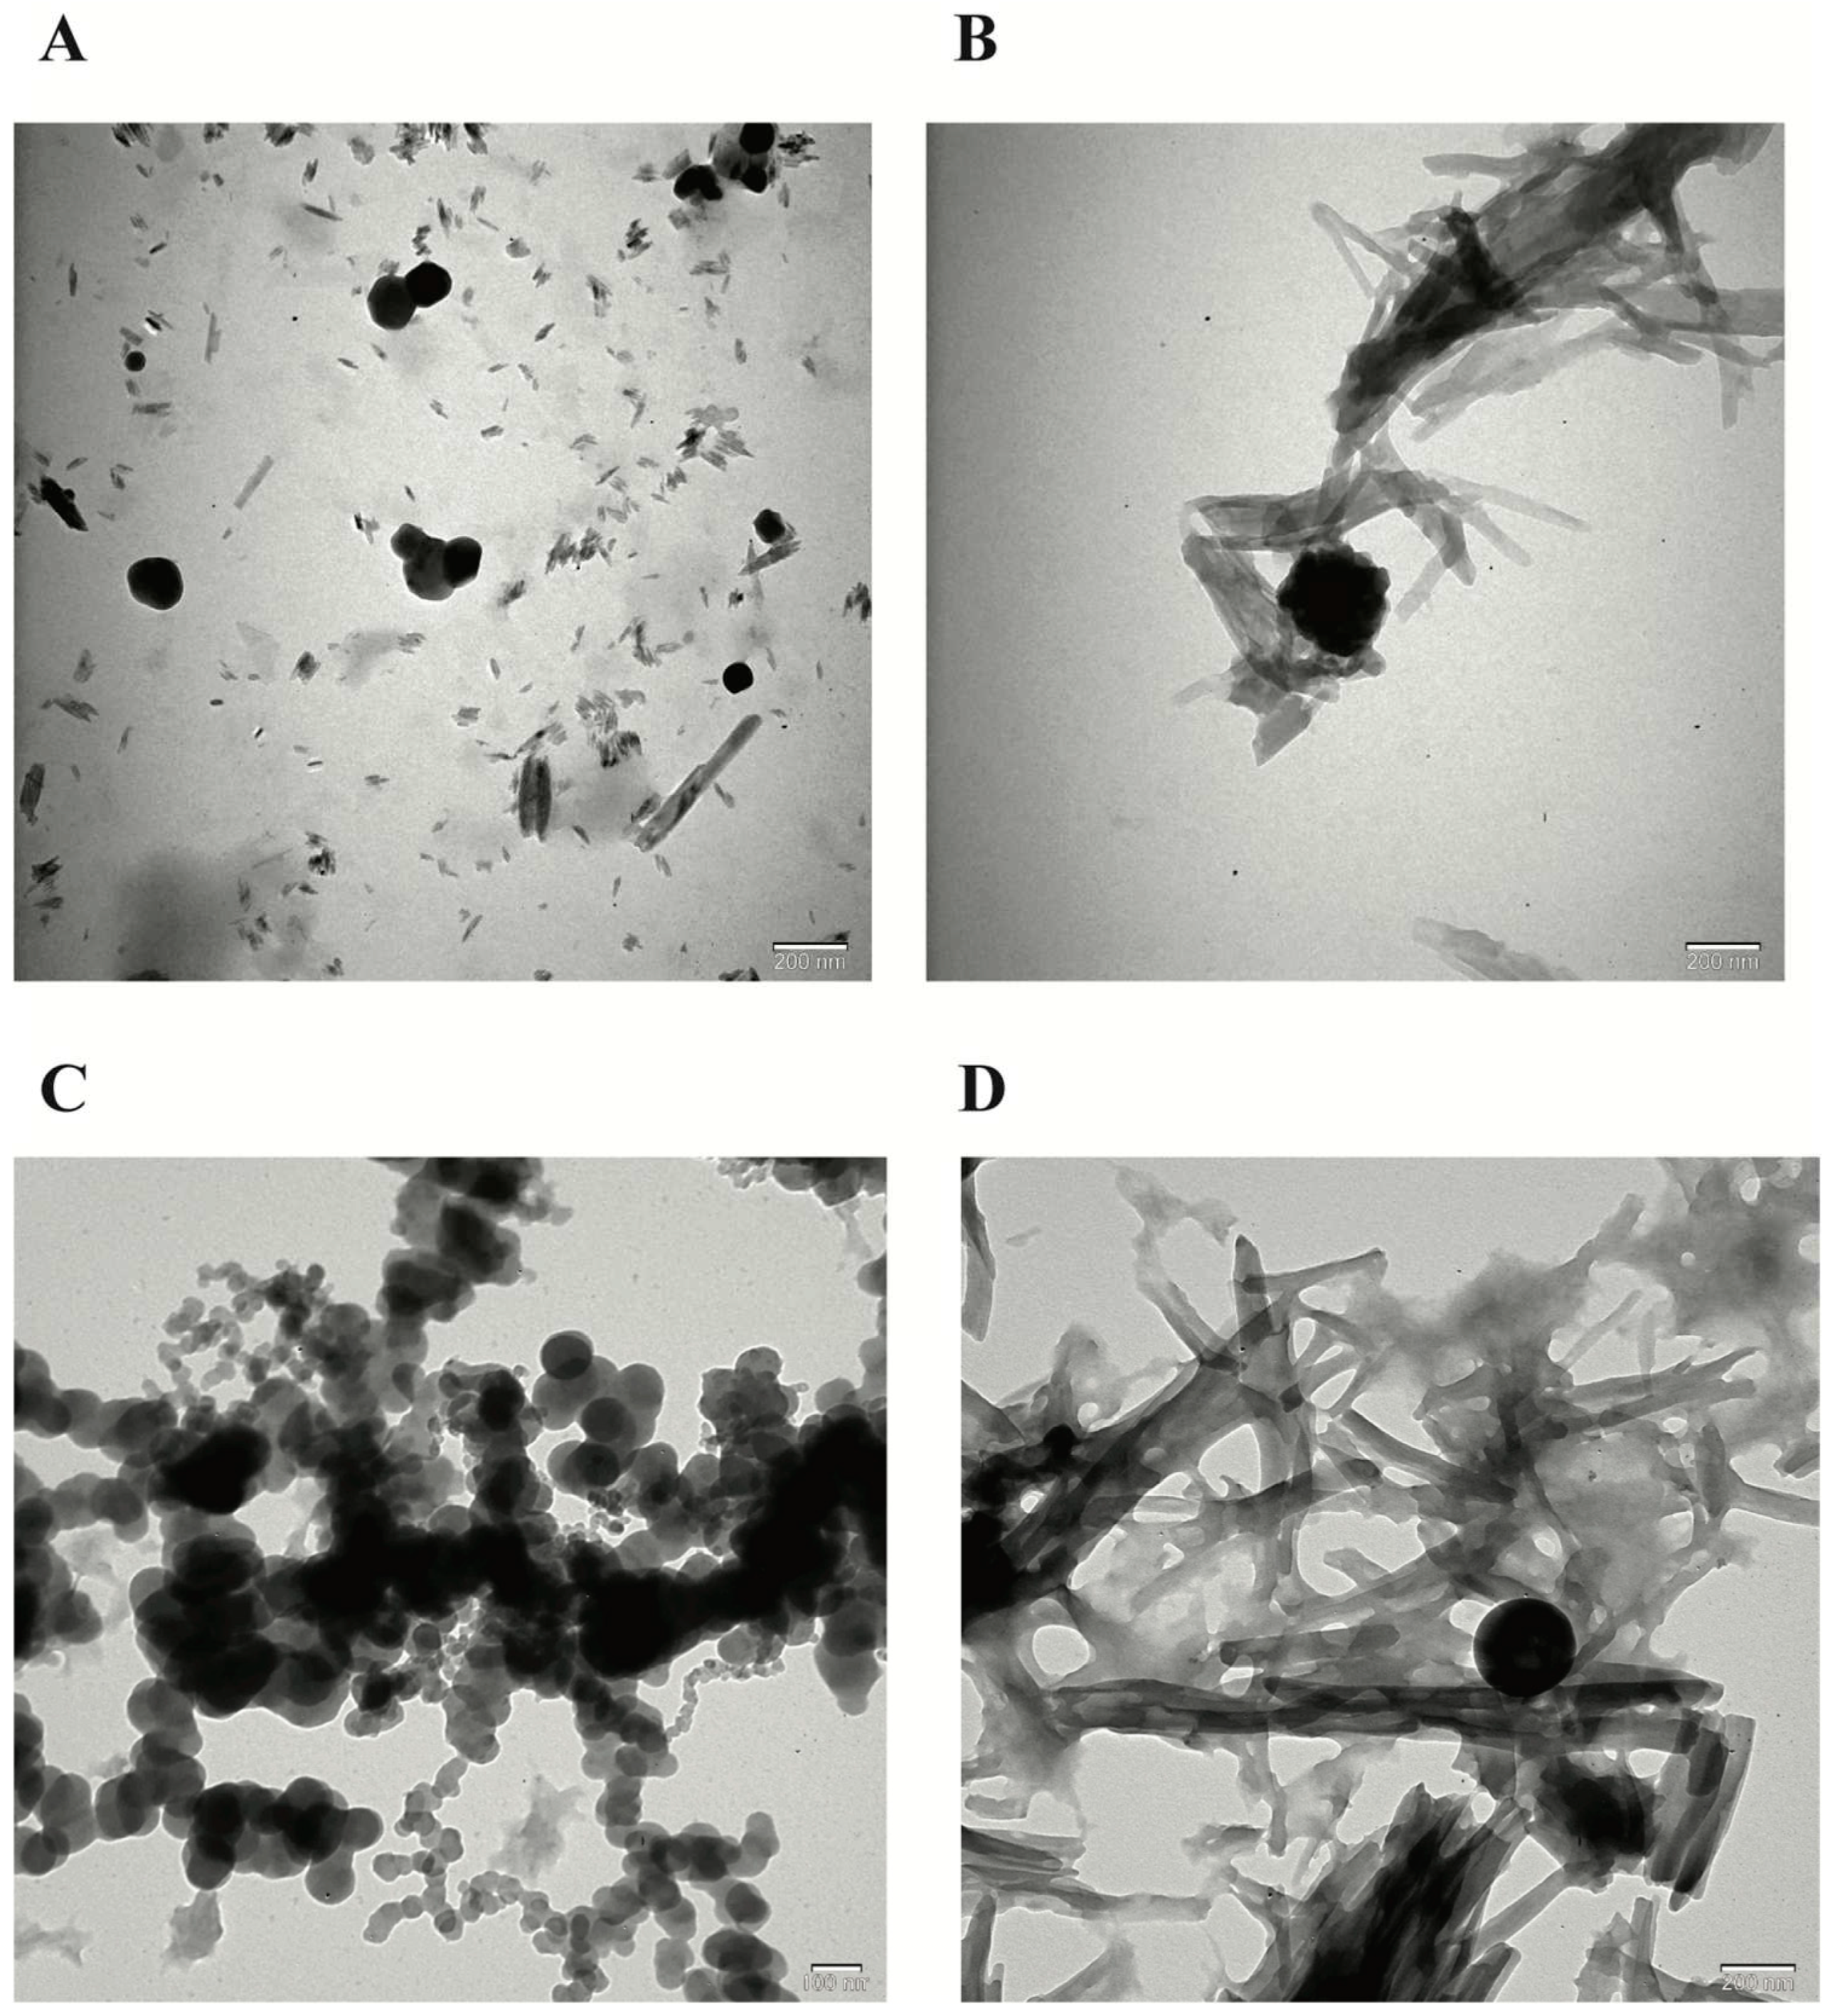
When the FE-SEM and TEM images of the NPs developed by the ionic chelation method are examined in
Figure 1 and
Figure 2, it is seen that NP1 and NP3 are spherical in shape, while NP2 and NP4 have a strip-like structure.
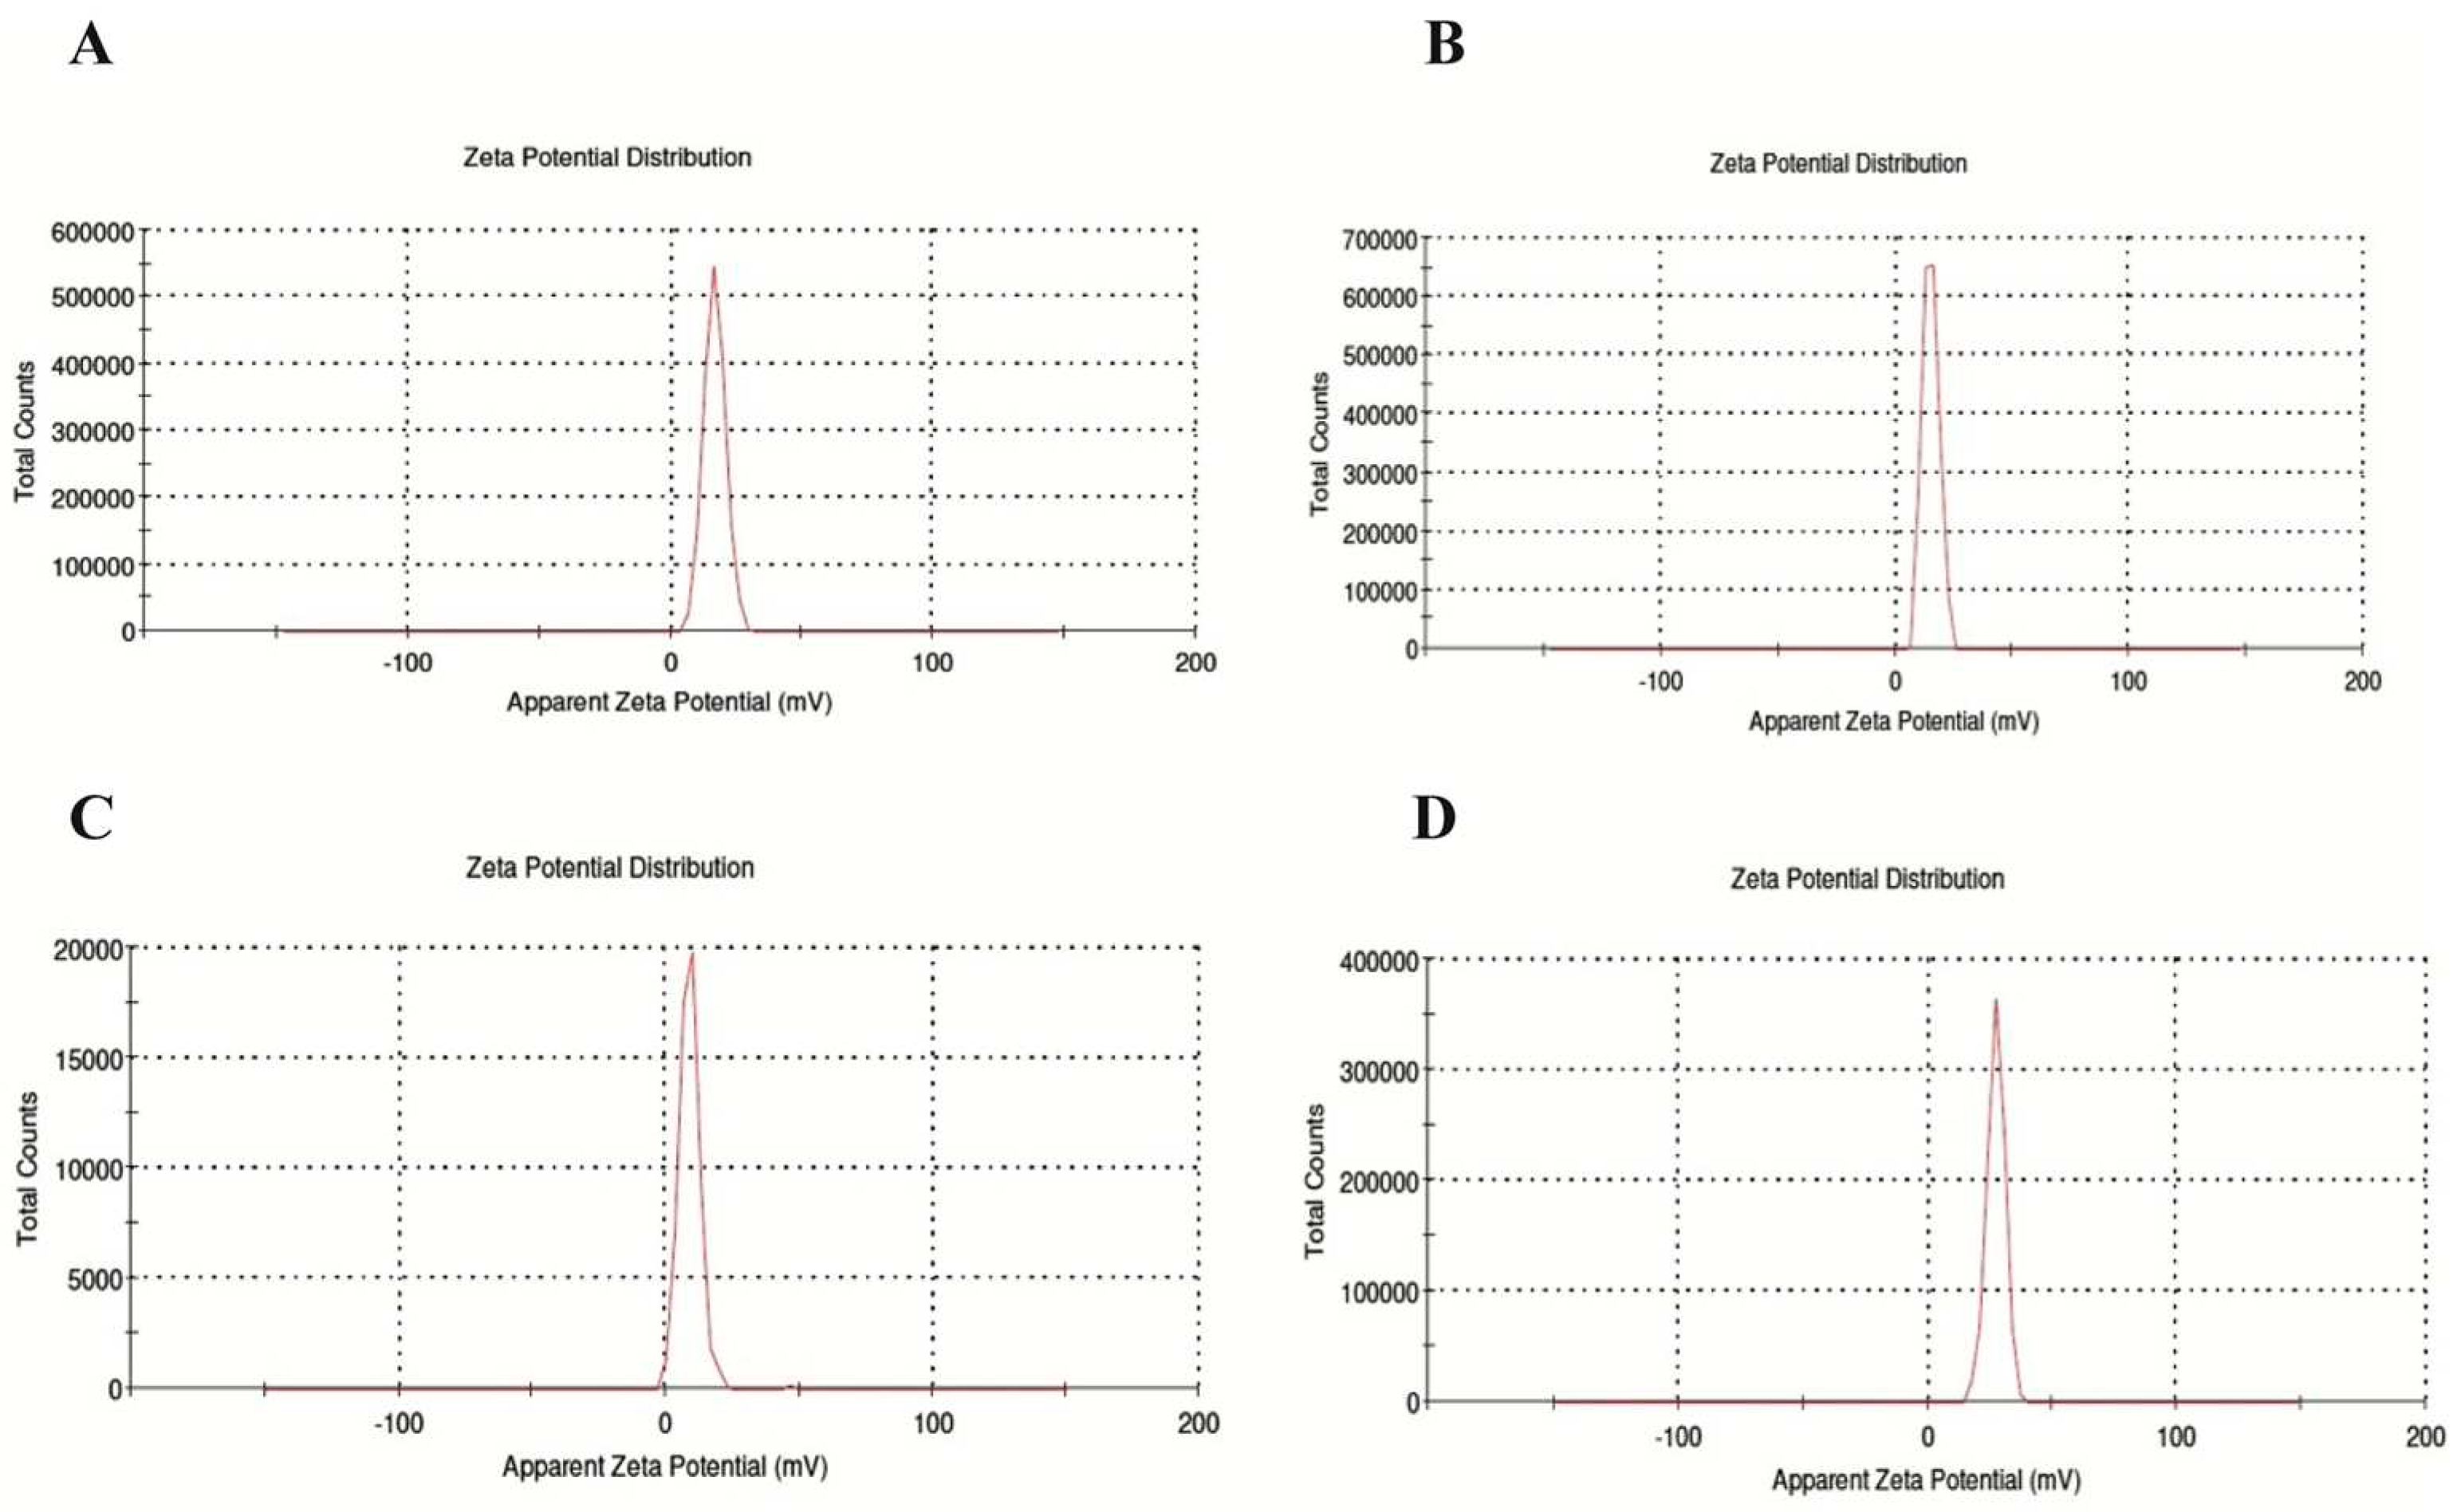
Table 1 shows the NPs' particle size (nm) and zeta potential (mV) values according to TEM and Zeta analysis results. The mean particle size and zeta potential value of NP1, NP2, NP3, and NP4 were 153.6 ± 12.81 nm and 16.6 ± 4.12 mV, 180.5 ± 8.23 nm and 15.1 ± 3.42 mV, 93.2 ± 7.25 and 8.89 ± 3.82, 198.7 ± 9.13 and 27.2 ± 3.67 respectively. When examining the Zeta analysis results, the sharpness of the chromatograms, the zeta potential, and low PDI values indicate a stable and homogeneous distribution of the developed NPs within the solution. However, the stability of NP3 appears to be lower than the other NPs (
Table 1,
Figure 3).
The encapsulation efficiency of Que and VPA in the NPs has been determined to be above 95%, as calculated in Equation 1 (
Table 1).
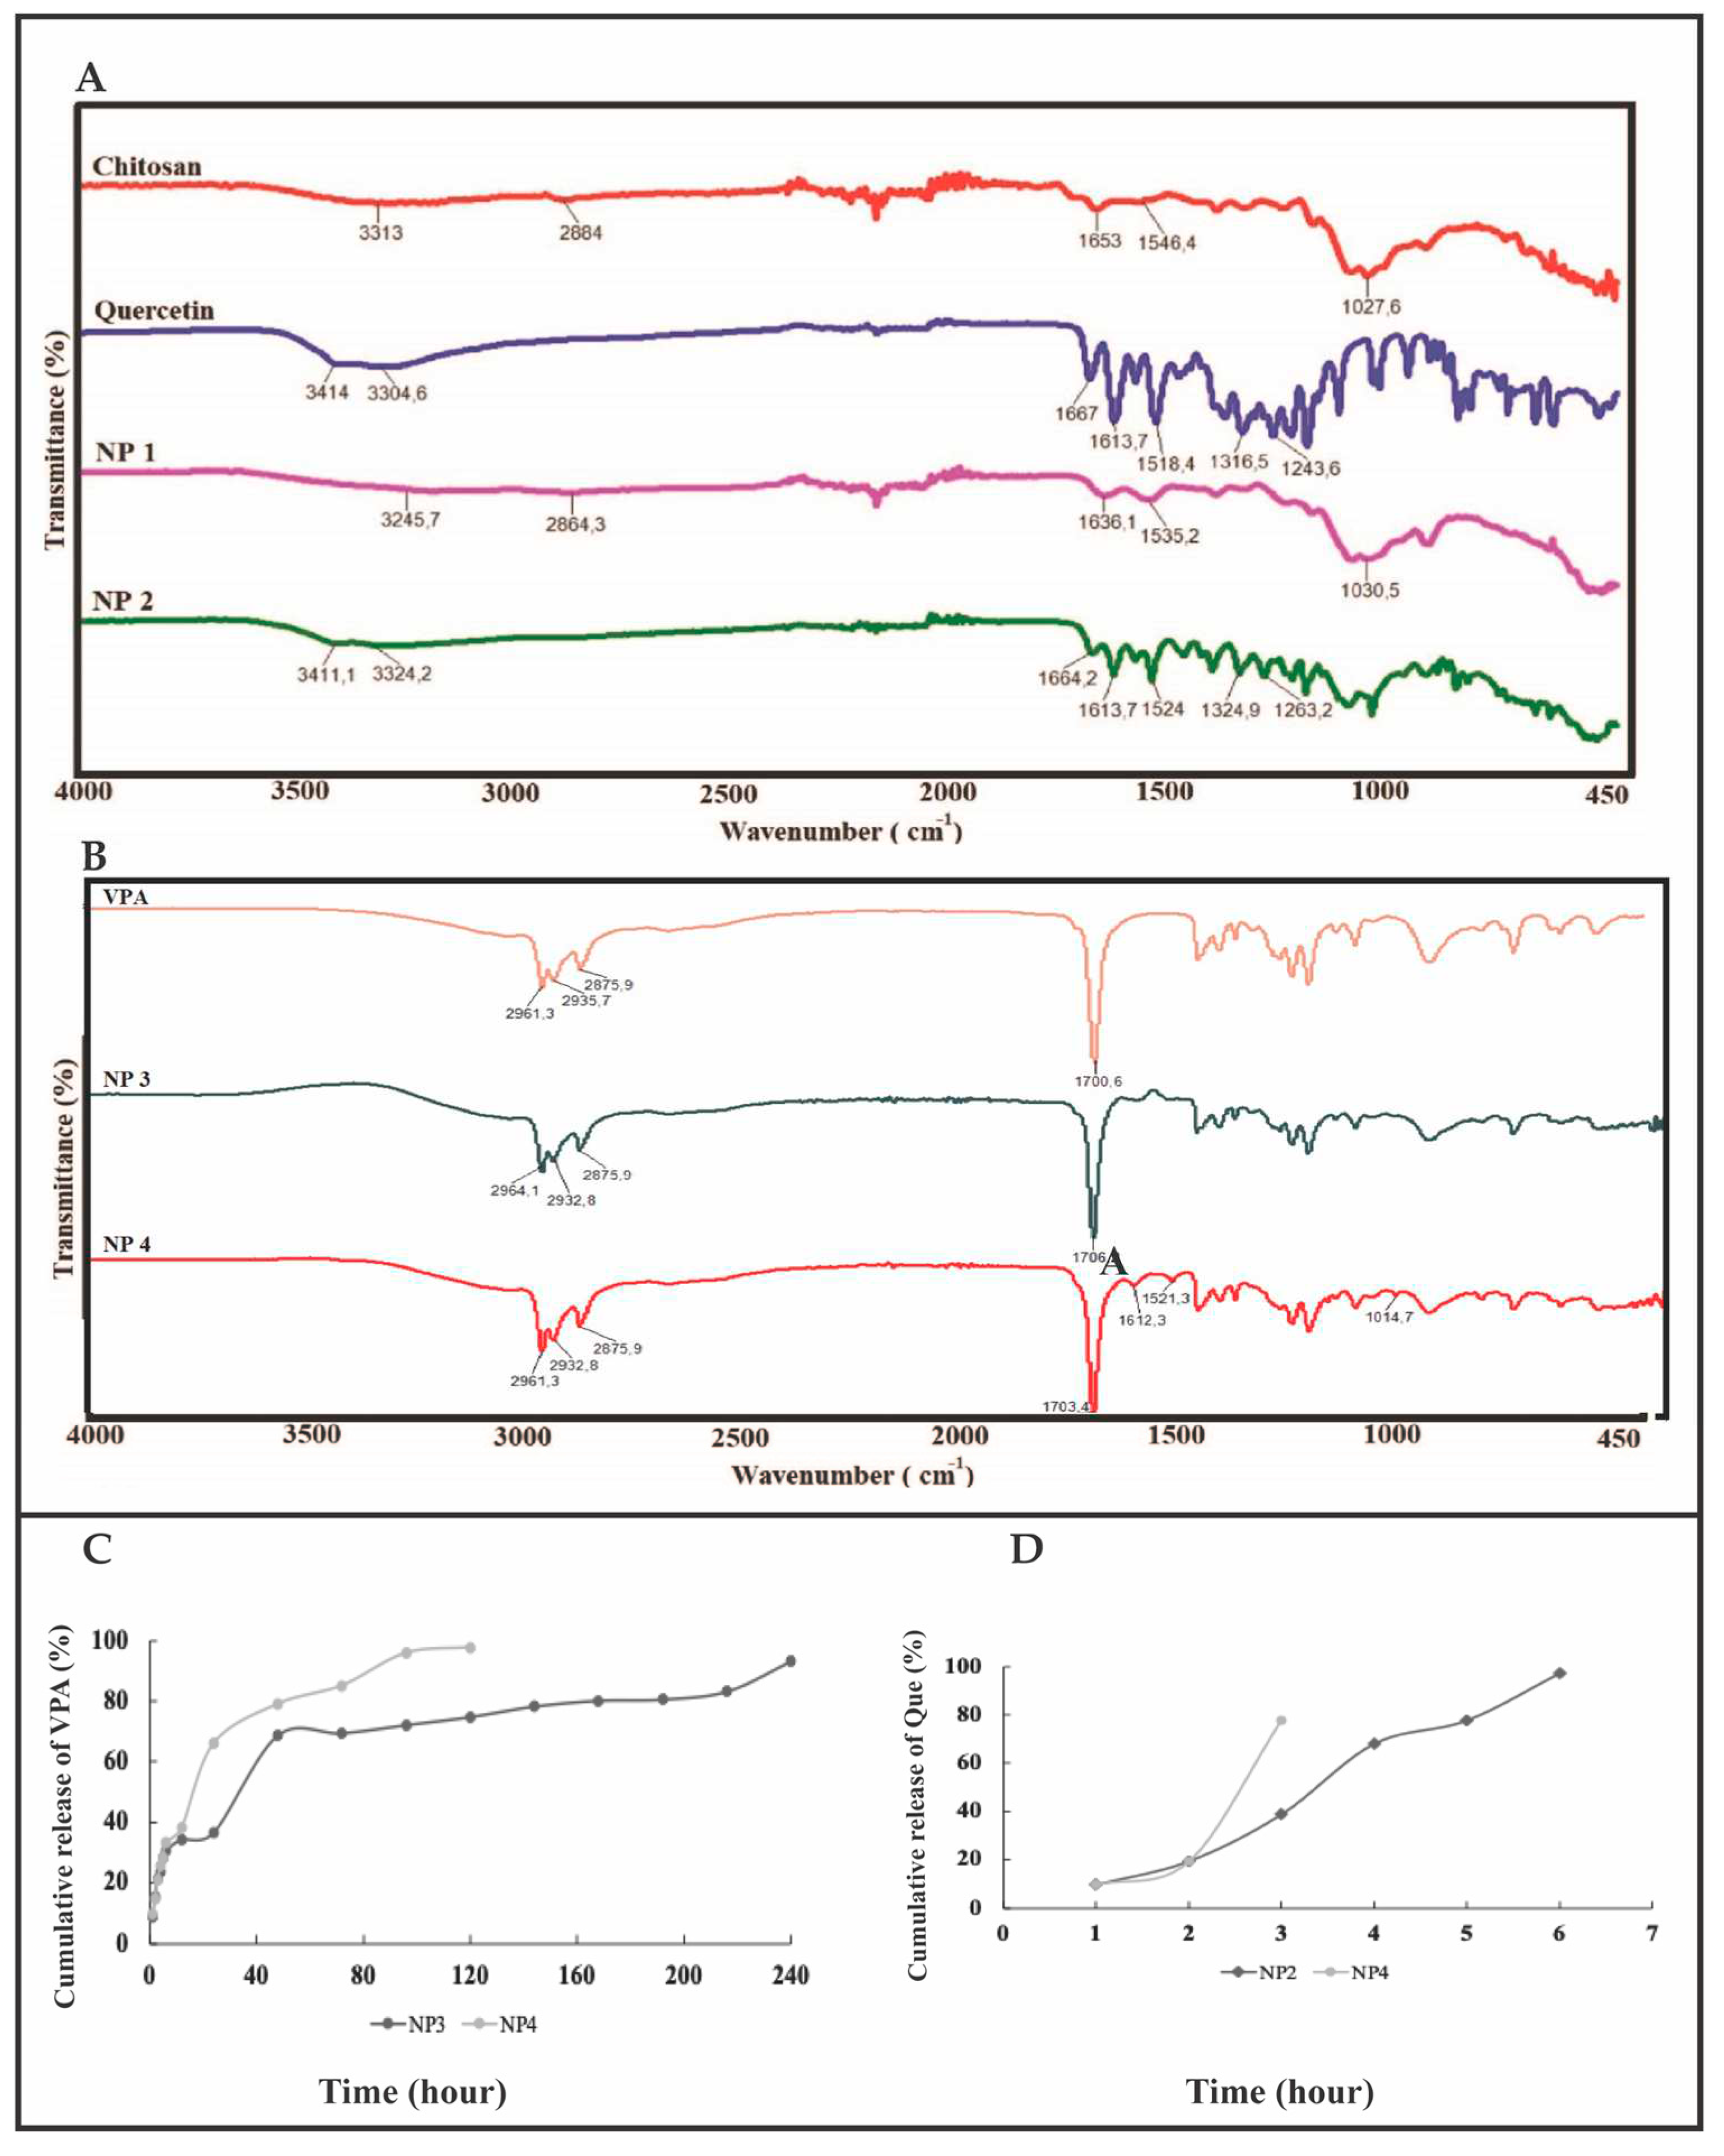
Table 1 demonstrates a high encapsulation efficiency of Que and VPA loaded onto chitosan. Examination of the release of NPs at pH 7.4 and 37 ± 0.1°C indicated that Que exhibited a rapid release within the first 10 hours. In contrast, the burst release of VPA from chitosan NPs containing VPA commenced at the 50th hour in NP3 and at an earlier time, the 30th hour, in NP4 (
Figure 4).
The broad peak observed at 3313 cm
-1 in the FT-IR spectrum of chitosan is due to the -OH and -NH stretching vibrations (
Figure 4A). C-H bonds' symmetric and asymmetric stretching vibrations were observed at 2884 cm
-1 (
Figure 4A). The peaks observed around 1653 cm
-1 indicate the presence of primary amine groups and N-H bending vibrations of amine-terminated chitosan [
16]. The peak at 1027 cm
-1 is due to the C−O stretching of the glucosamine ring, and the peak at 1545 cm
-1 is ascribed to the N−H bending of the amino group [
17]. Similar results were obtained in the FT-IR spectrum of the synthesized NP1. In the FT-IR spectrum of Que, the broad peaks observed at 3414-3304 cm
-1 correspond to O-H stretching vibration, while the peak observed at 1666 cm
-1 corresponds to C=O aryl ketonic stretching vibration (
Figure 4A). The 1518 cm
-1 and 1613 cm
-1 peaks correspond to C=C aromatic ring stretching vibrations. The peak at 1263 cm
-1 corresponds to the C-O stretching vibration in the aryl ether ring, and the peak at 1324 cm
-1 corresponds to the C-H stretching vibration of the aromatic ring [
18]. Similar results were obtained in the FT-IR spectrum of NP2, and the C=O stretching vibration observed at 1664 cm
-1 confirmed the presence of Que in chitosan (
Figure 4A). Upon examination of
Figure 4B, it is evident that both the VPA standard and the NPs containing VPA (NP3 and NP4) exhibit similar peaks at approximately 2961 cm
-1 and 1700.6 cm
-1. In the FT-IR spectrum of VPA, the broad peaks observed at 2961.3 cm
-1 indicate aliphatic O-H stretching vibration, while the peak at 1700.6 cm
-1 corresponds to C=O stretching vibration [
19,
20]. Additionally, peaks attributed to Que, specifically the C=C aromatic ring, are observed at 1621 cm
-1 and 1521 cm
-1 in NP3 and NP4 (
Figure 4B). This observation reveals that NPs can be appropriately developed.
DPPH
• and ABTS
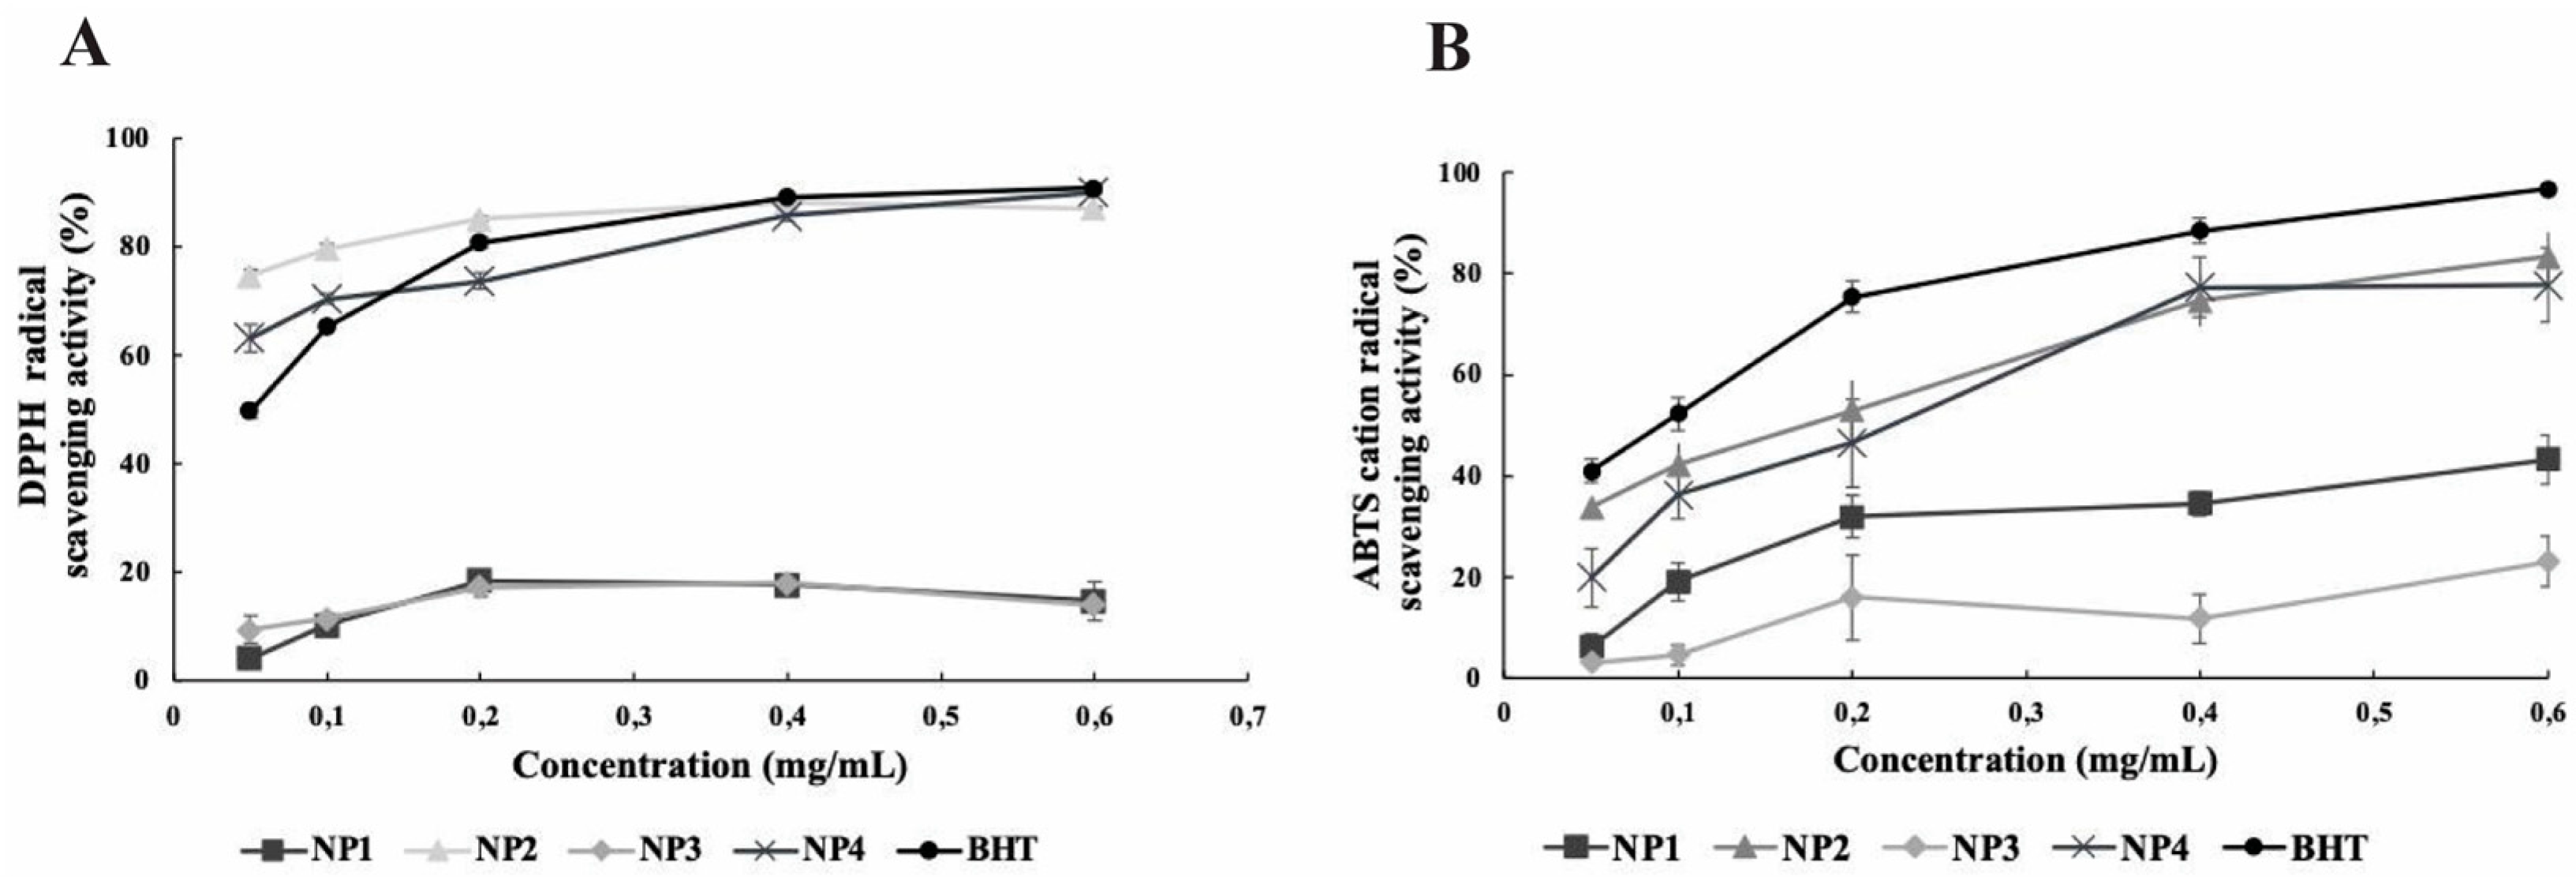
•+ radical scavenging activities are frequently used in studies investigating the antioxidant effect of Que-loaded NPs. In our study, the antioxidant activity of NPs was determined using these methods. Each NP's antioxidant activity within the dose range of 0.05-0.6 mg/mL was compared with the standard antioxidant activity of BHT. The analysis data are depicted in
Figure 5. In the DPPH and ABTS analysis results, the antioxidant activity of NP1 and NP3, which do not contain Que, was found to be lower compared to the antioxidant activity of BHT at all concentrations. A statistically significant difference was found between BHT, NP1, and NP3 antioxidant activity results in both antioxidant activity analyses (p < 0.05). In the DPPH analysis result, the antioxidant activity of NP2 and NP4, which contain Que, was comparable to or higher than the antioxidant activity of BHT. Antioxidant activity increased dose-dependently. The antioxidant activity of BHT varies between 49.77% and 90.84%, while the antioxidant activity of NP2 appears to range from 74.67% to 88.33%, and NP4's antioxidant activity is observed to be between 63.19% and 90.15%.
In DPPH analysis, the antioxidant activity of NP2 was higher than that of BHT at 0.05, 0.1, and 0.2 mg/mL levels, while it was close to the activity of BHT at 0.4, and 0.6 mg/mL levels. The antioxidant activity of NP4 was higher than that of BHT at 0.05, and 0.1 mg/mL levels, while it was close to the activity of BHT at 0.2, 0.4, and 0.6 mg/mL levels. NP2 showed the highest DPPH scavenging activity at 0.4 mg/mL, and NP4 showed the highest DPPH scavenging activity at 0.6 mg/mL (
Figure 5A).
In the ABTS analysis results, although the antioxidant activity of NP2 and NP4 was lower than that of BHT, a dose-dependent antioxidant activity was observed, similar to the BHT standard regarding antioxidant effect. NP2 and NP4 showed the highest ABTS
•+ radical scavenging activity at 0.6 mg/mL concentration (83.21 ± 4.91 and 77.70 ± 7.27, respectively). When the antioxidant analysis data were examined, it was found that NP2 and NP4 containing Que exhibited antioxidant activity close to BHT, while NP1 and NP3 were the NPs with the lowest antioxidant activity (
Figure 5B).
To evaluate the cytotoxicity and antioxidant effect of the synthesized NPs on human neuroblastoma SH-SY5Y cell lines, the H
2O
2 value to be applied to the cells was determined. As a result of the MTT test, IC
50 value was determined as 200 µM (
Figure 6).
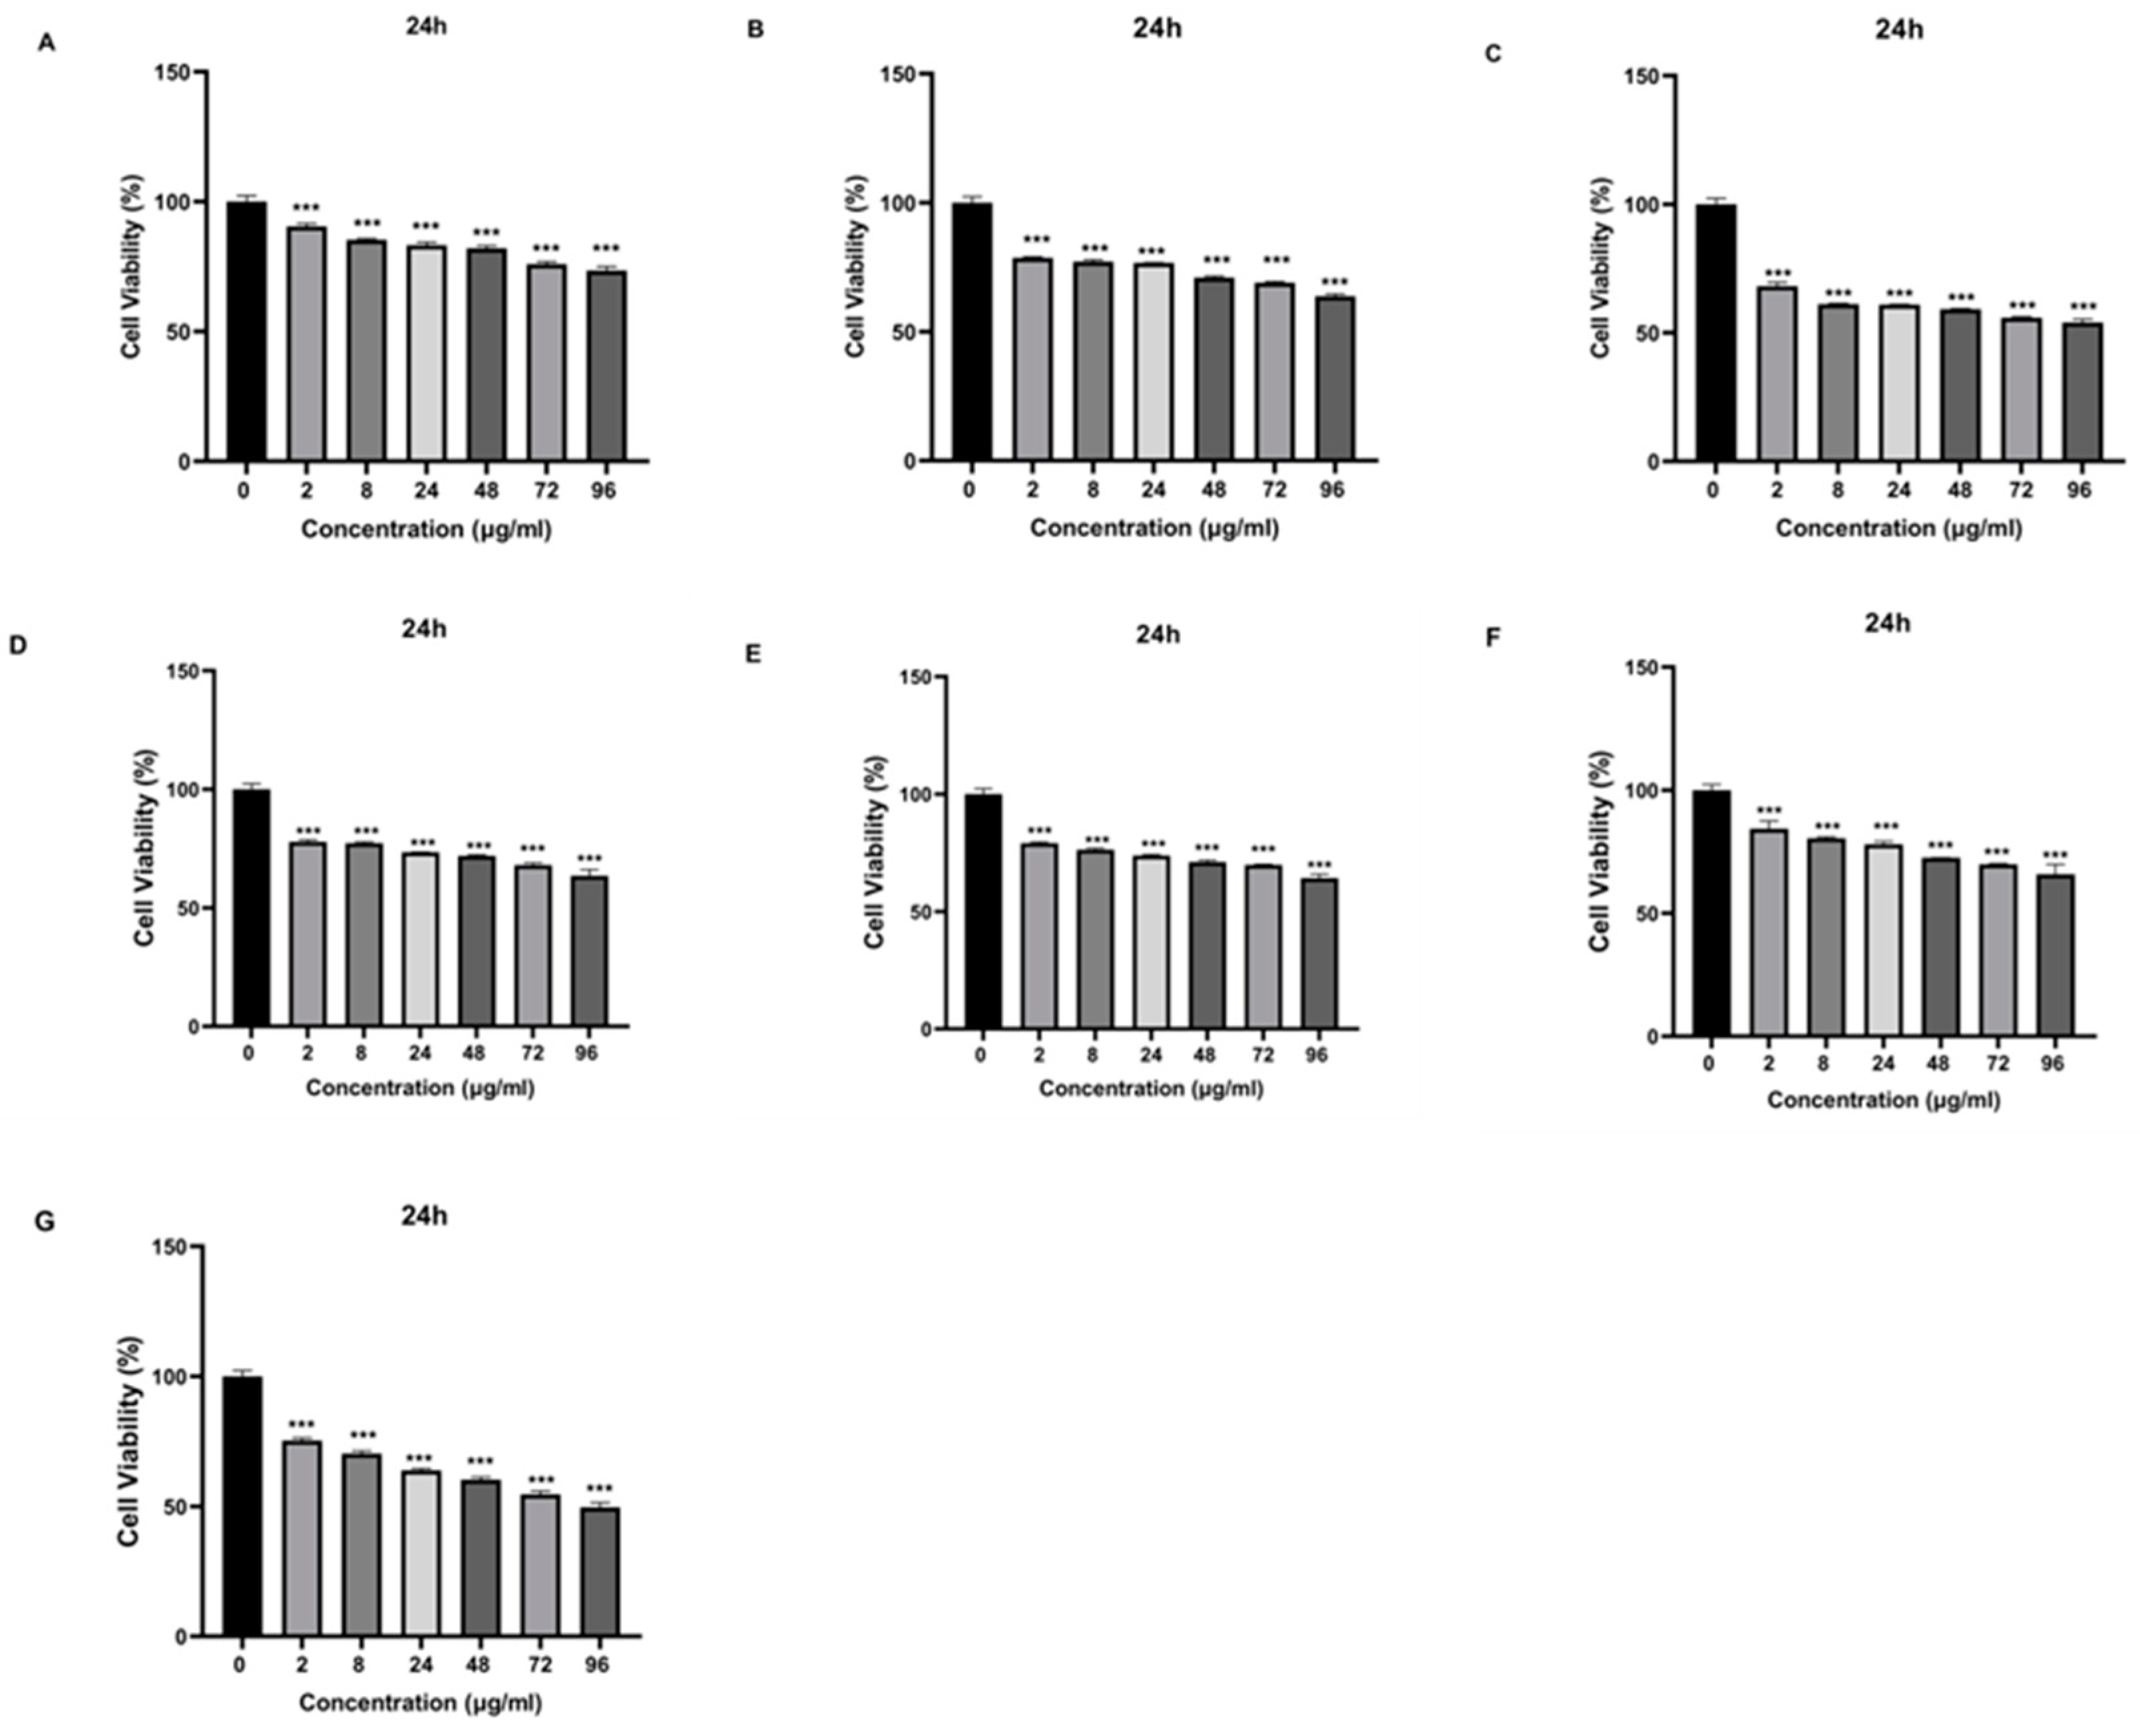
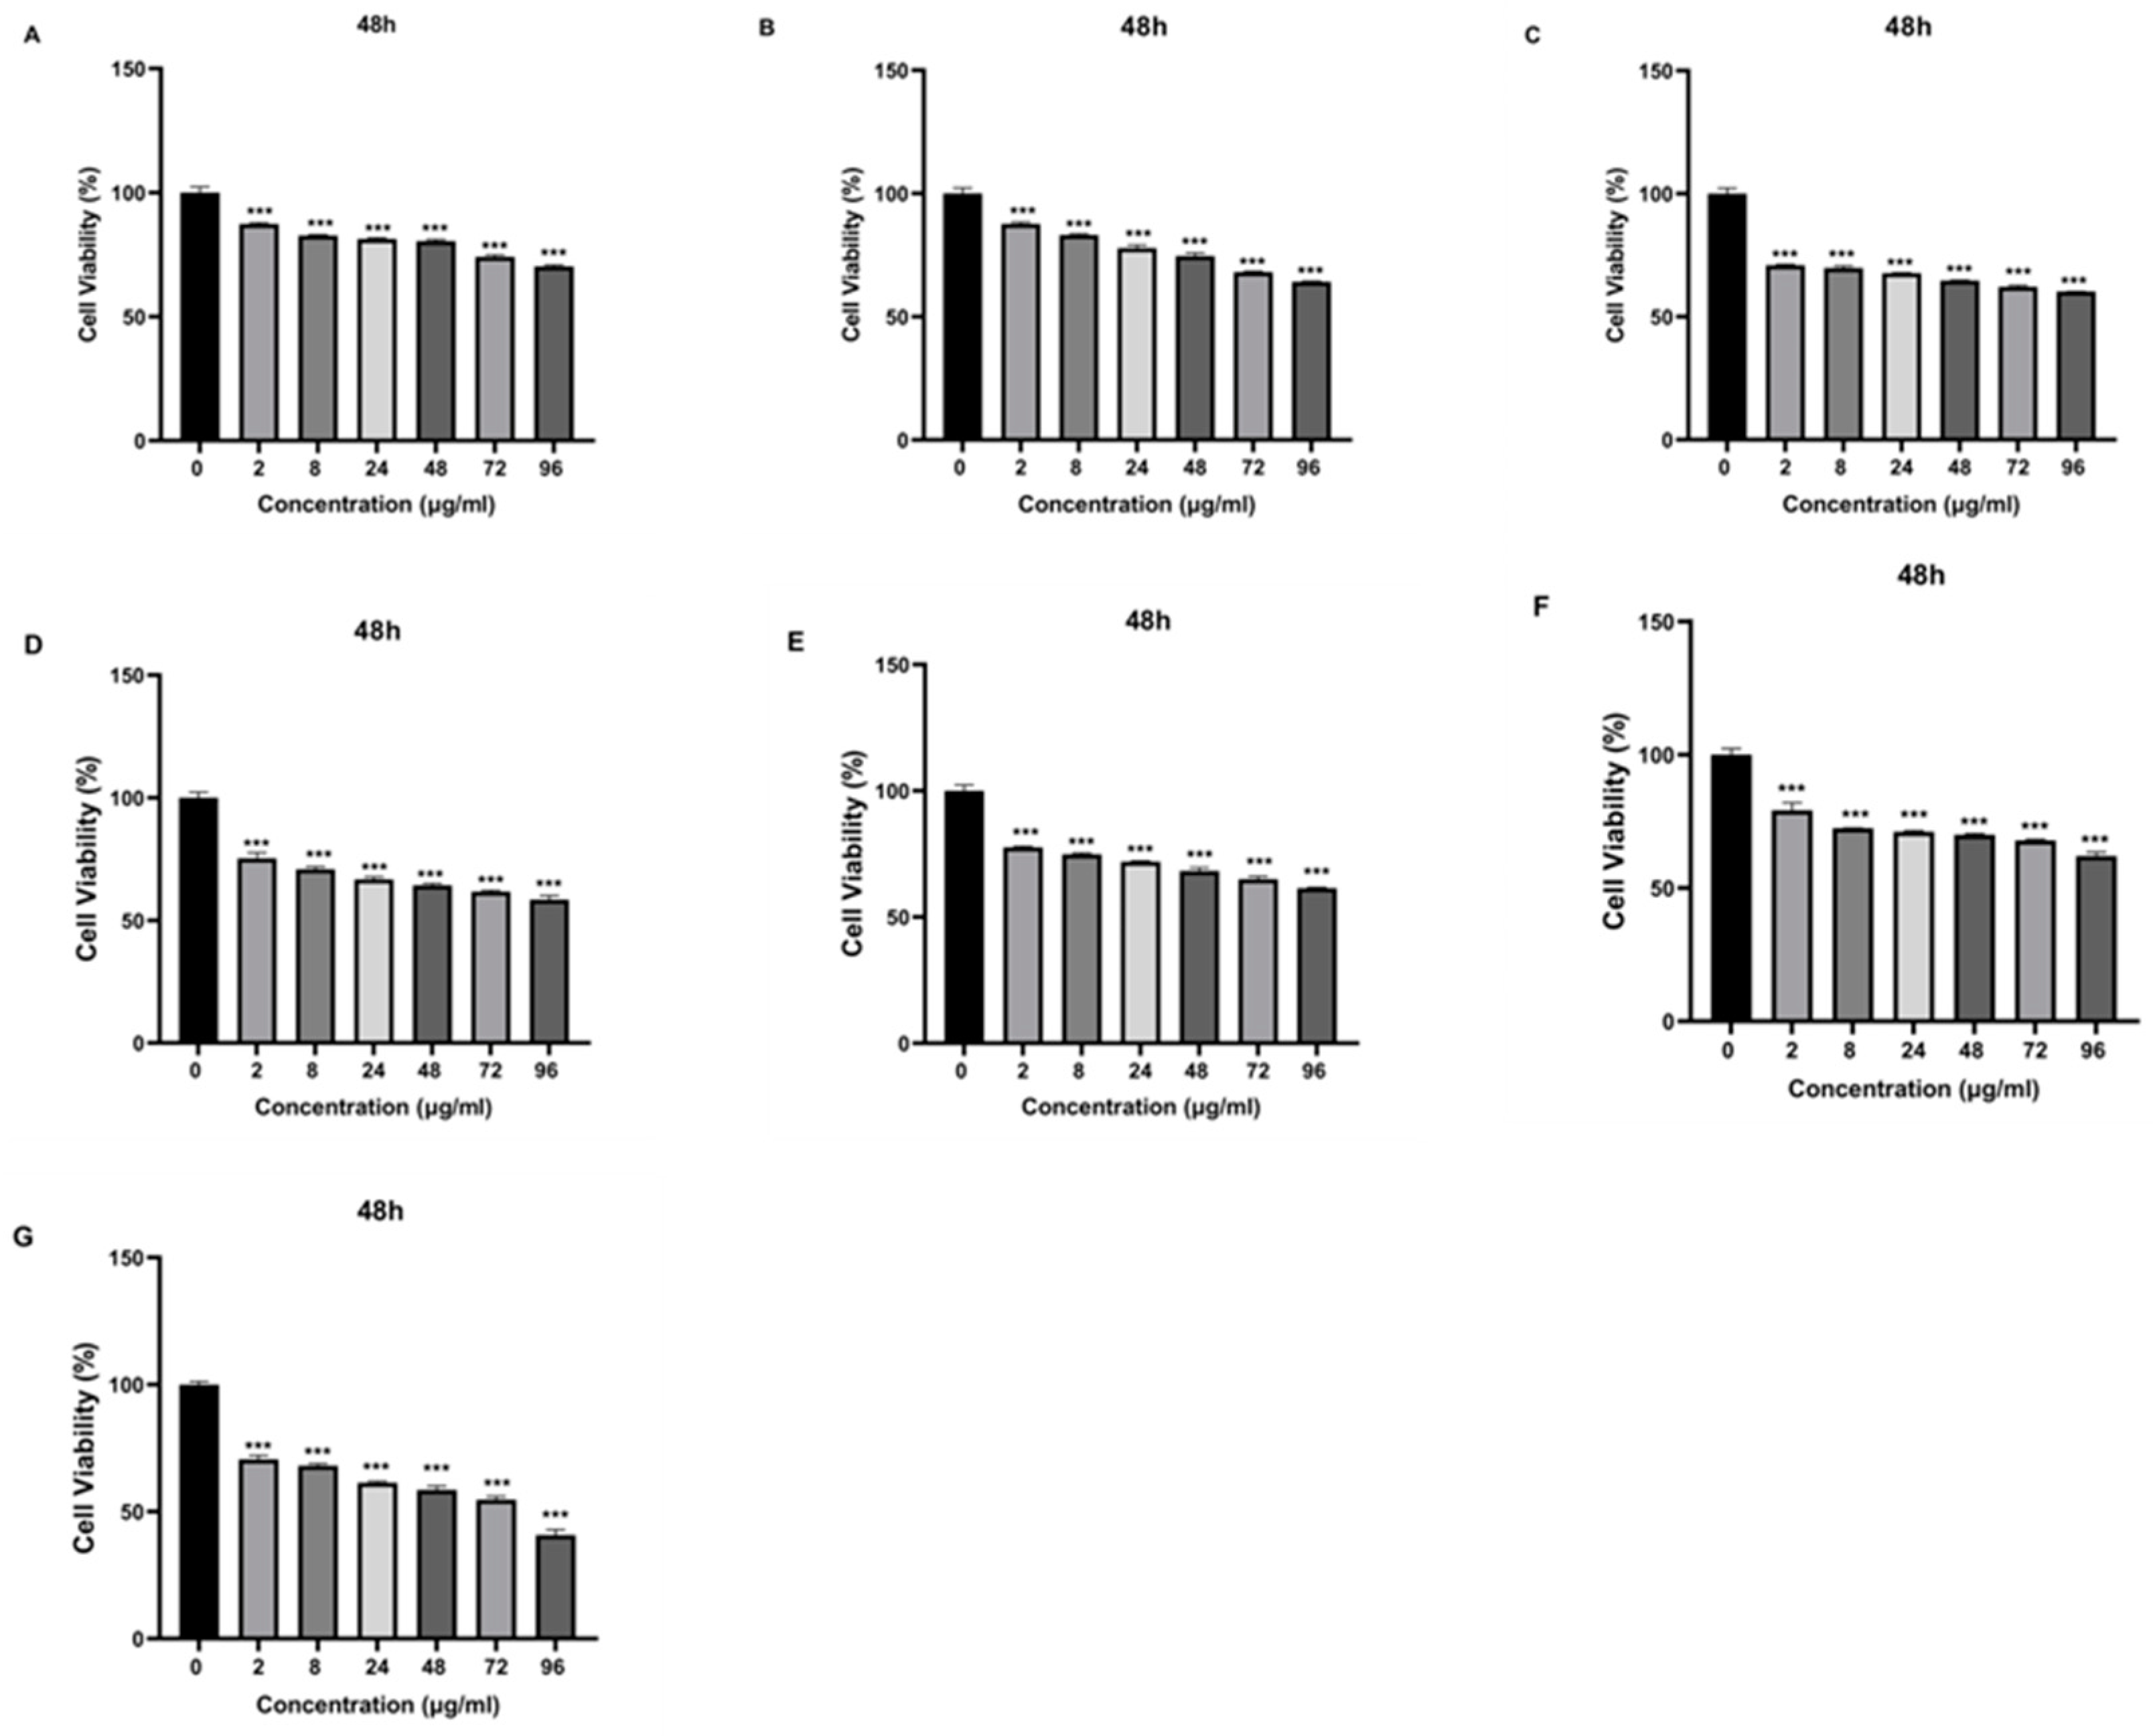
Que and VPA-loaded chitosan NPs were applied to SH-SY5Y cells at different doses, and cell cytotoxicity was evaluated. Except for high doses of NP4, none of the samples showed cytotoxic effects at the concentrations used in the study. At the concentration of 96 µg/mL applied to the cells, NP4 was observed to reduce cell viability by approximately 50% at 24 h (
Figure 7), and by around 40% at 48 h (
Figure 8).
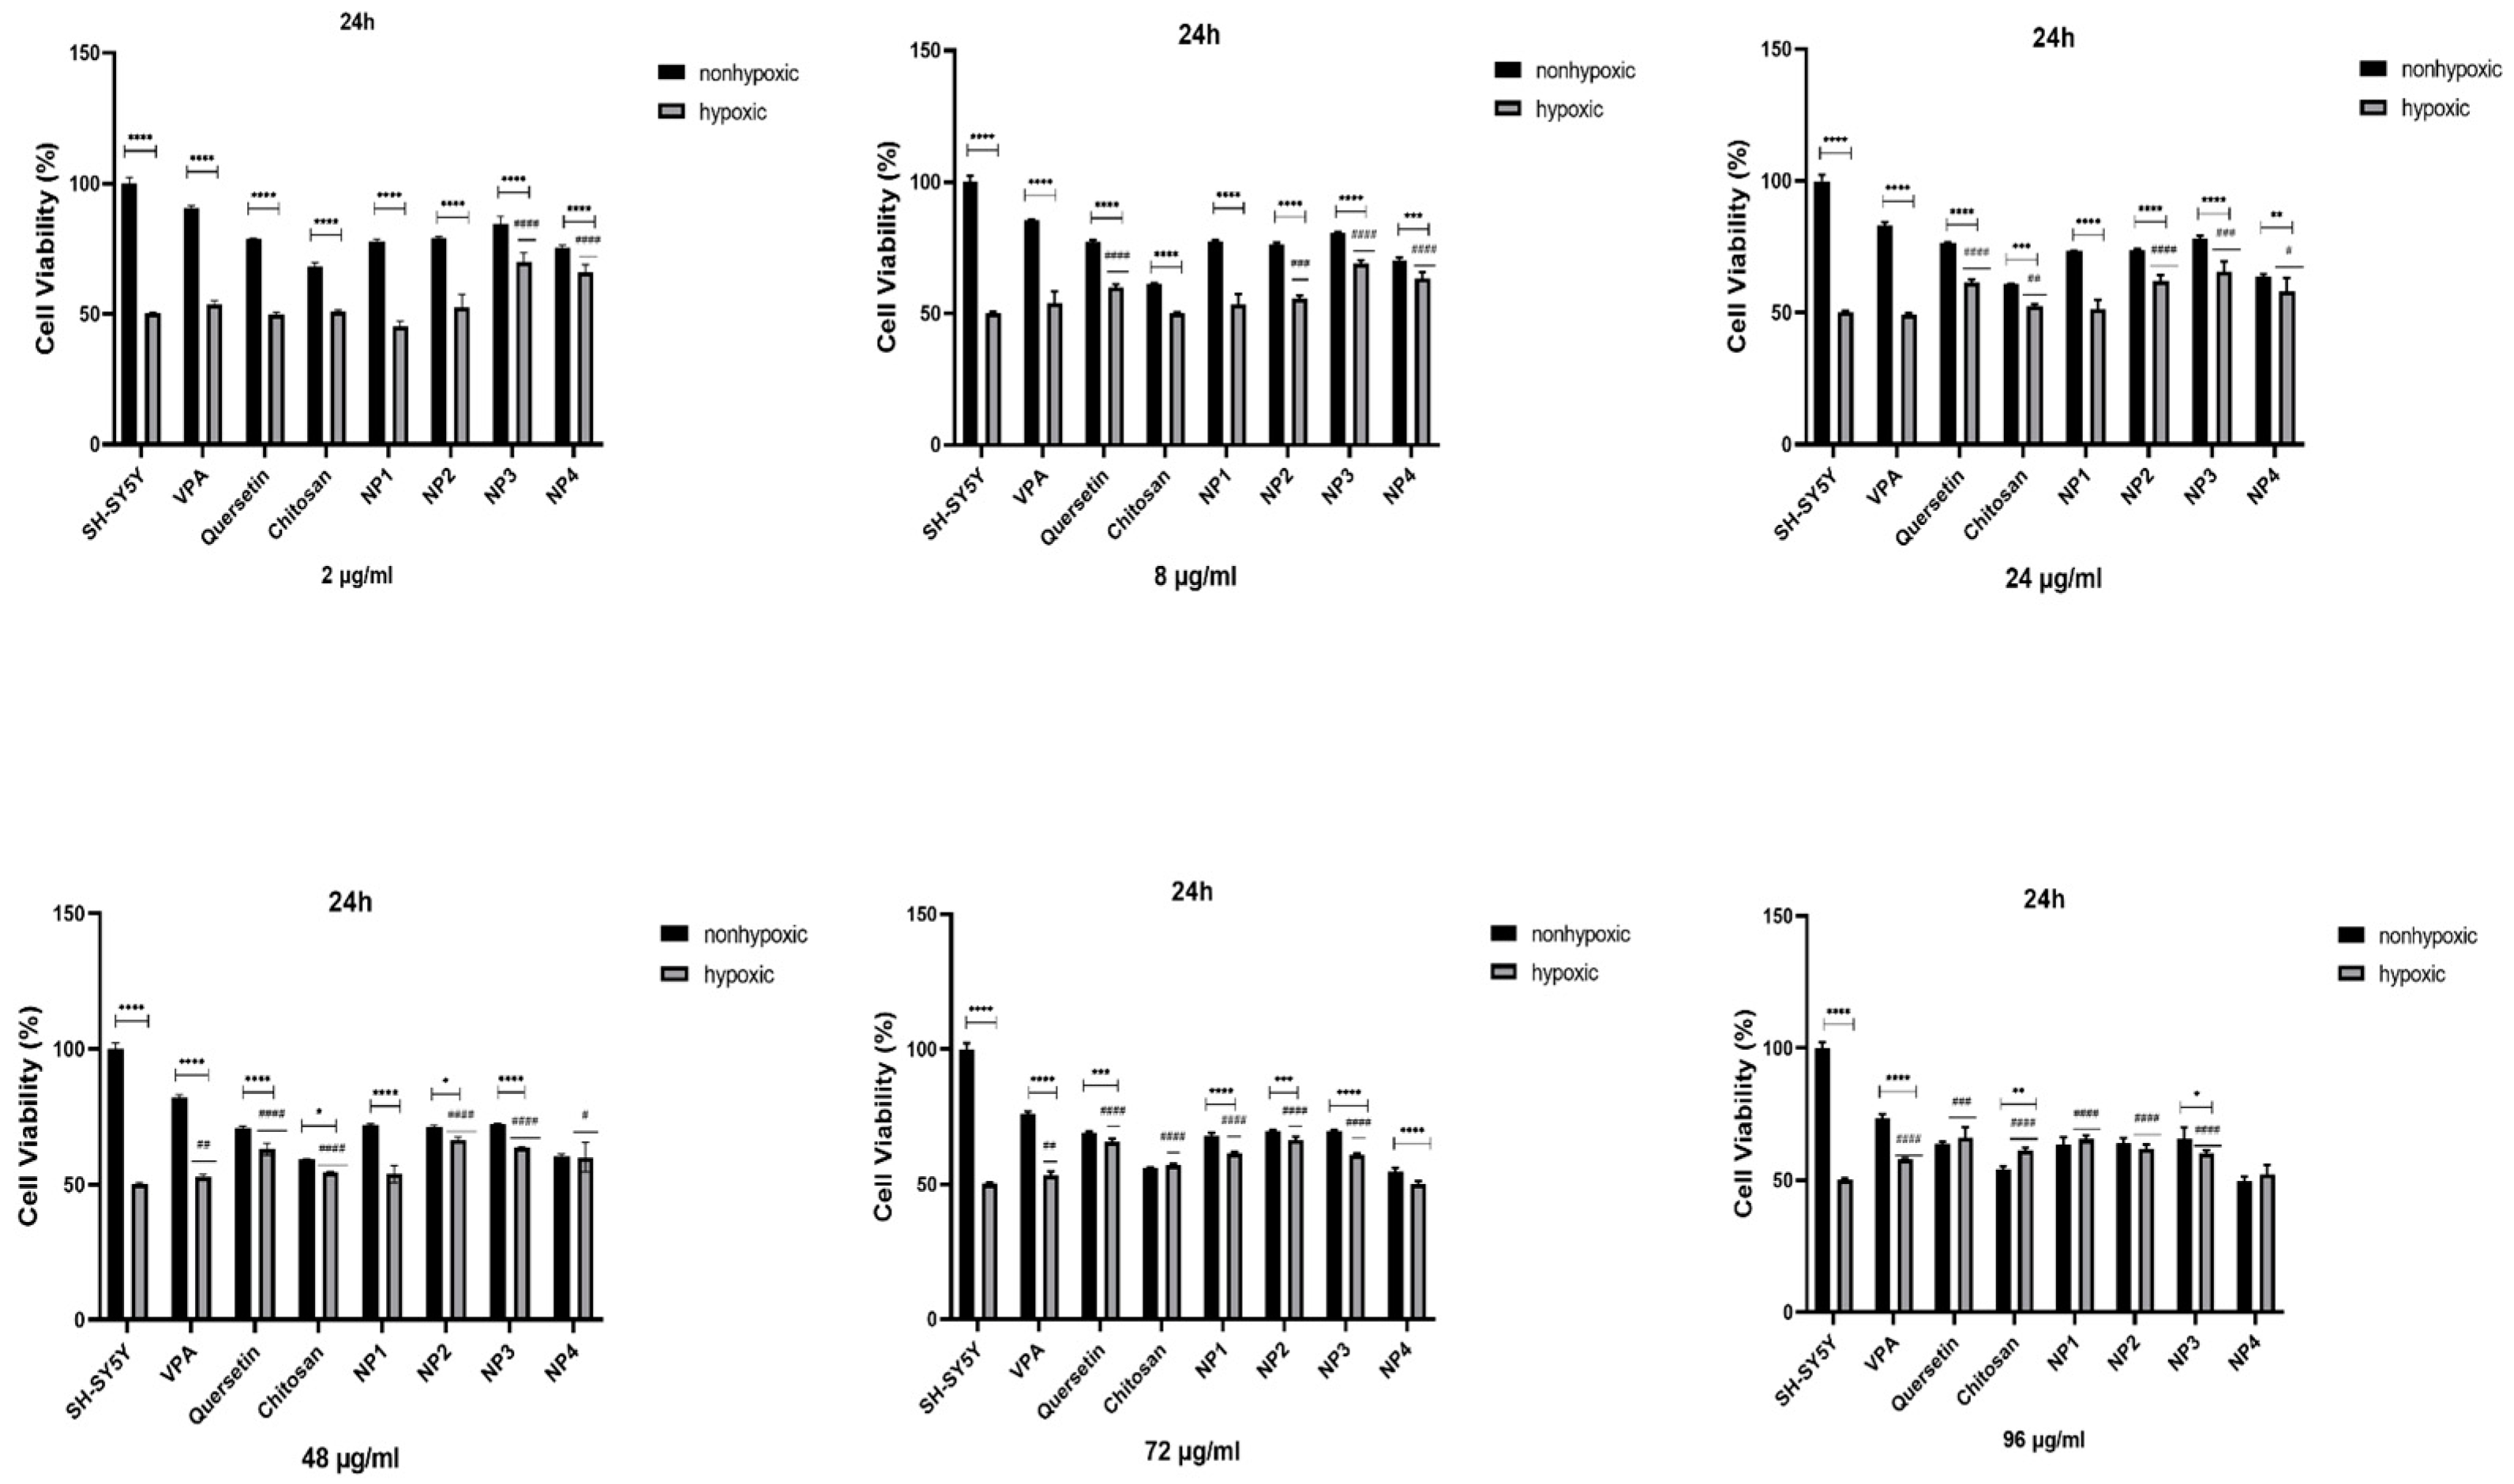
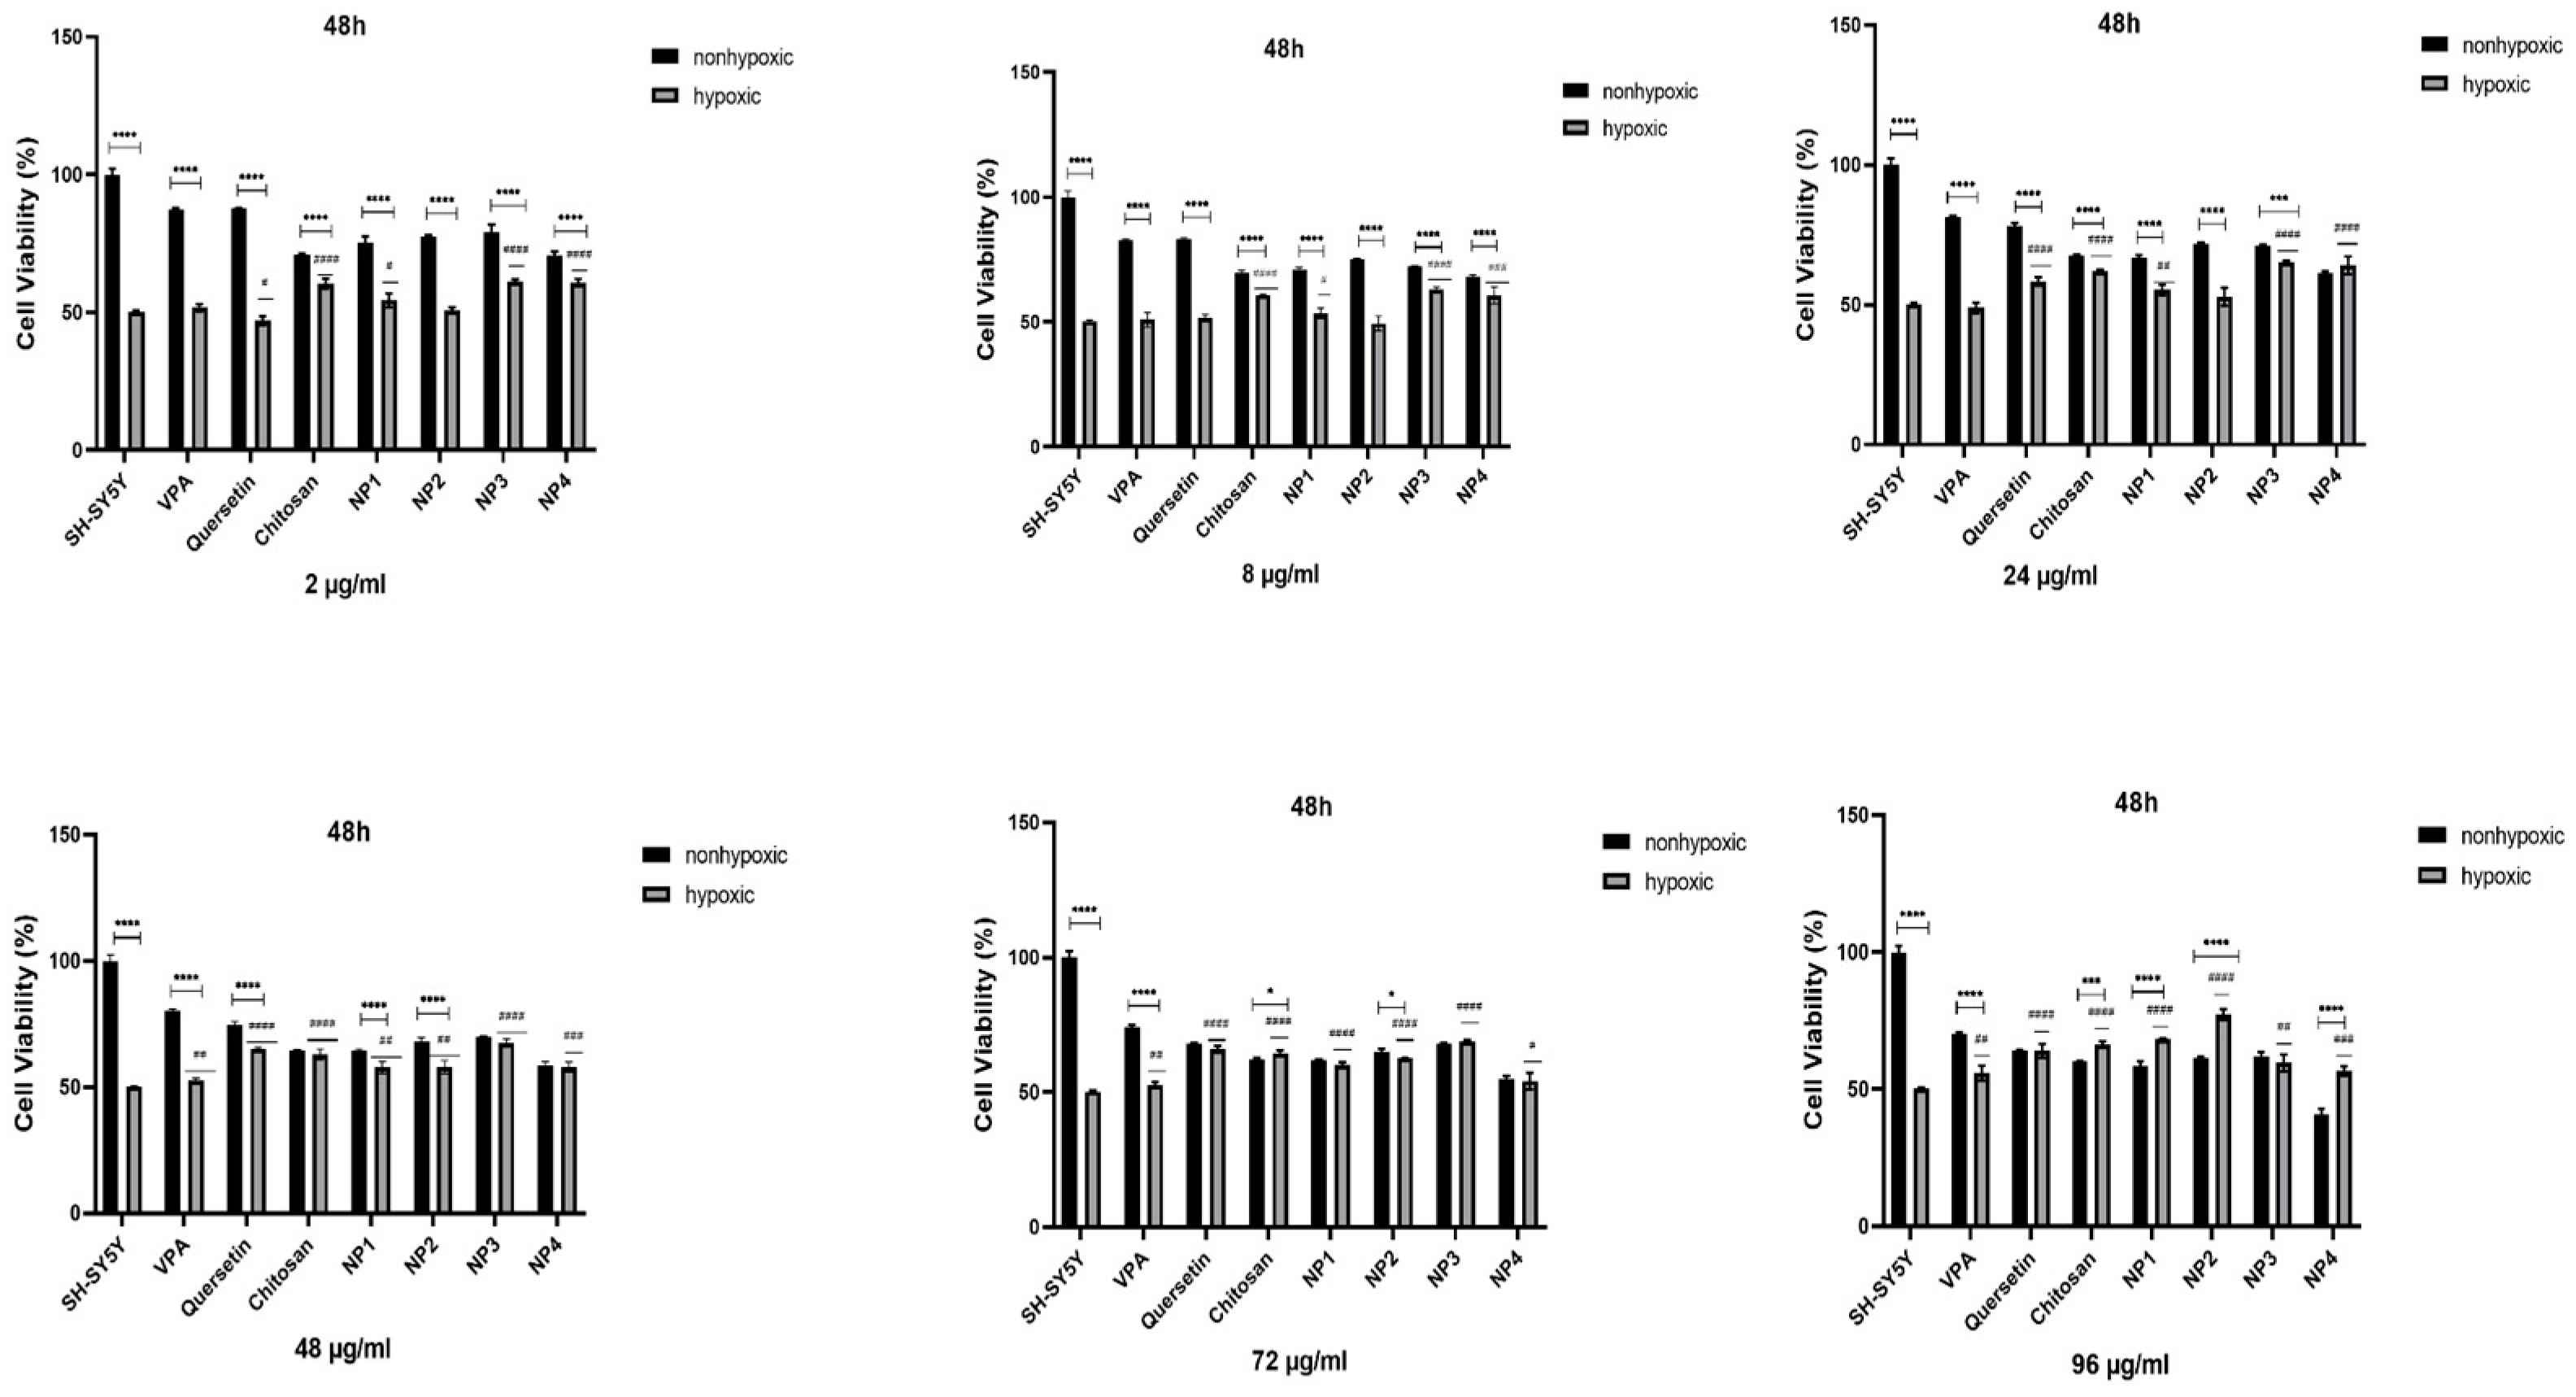
To assess the antioxidant potential of NPs against oxidative stress, SH-SY5Y cells were subjected to pretreatment with different concentrations of NPs for 24 h and 48 h, followed by exposure to 200 µM H2O2 for 24 h. While 50% cell viability was observed in SH-SY5Y cells treated solely with H2O2, cell viability increased when cells were pretreated with NPs before exposure to H2O2. Additionally, it has been observed that when VPA, Que, and chitosan molecules present in the composition of NPs are applied to SH-SY5Y cells exposed to hypoxia at different concentrations (2 µg/ml, 8 µg/ml, 24 µg/ml, 48 µg/ml, 72 µg/ml, and 96 µg/ml), these molecules exhibit antioxidant activity, thereby exerting a protective effect on cell viability (
Figure 9,
Figure 10).
When 48 µg/ml, 72 µg/ml, and 96 µg/ml of VPA were applied to the cells, it was determined that cell viability increased at 24 h and 48 h. With the increase in dose, cell viability was significantly elevated (p < 0.01). At 24 h, the increase in dose resulted in a cell viability range of 52.77% to 57.89% (
Figure 9), while at 48 h, the increase in dose led to a cell viability range of 52.7% to 55.83% (p < 0.01) (
Figure 10). The highest efficacy was achieved at 24 h by applying 96 µg/ml VPA, resulting in 57.89% cell viability (p < 0.0001). However, it was observed that low and moderate doses of VPA (2 µg/ml, 8 µg/ml, and 24 µg/ml) did not have a significant impact on cell viability (p > 0.05) (
Figure 9).
When Que was applied to the cells at different doses during both intervals, the lowest dose did not show a noticeable effect on cell viability. In 24 h, the cell viability was 49.95% in cells treated with 2 µg/ml of Que, and this rate decreased to 47.06% at 48 h (p< 0.05), resulting in a significant difference compared to the control group. However, the application of 8 µg/ml Que began to demonstrate efficacy by increasing cell viability by 59.8% at 24 h (p < 0.0001) (
Figure 9). At the same time, no significant effect was observed at this dose at 48 h (
Figure 10). It was observed that the application of 24 µg/ml, 48 µg/ml, 72 µg/ml, and 96 µg/ml Que significantly increased cell viability with dose increment at both 24 h and 48 h. At 24 h, cell viability increased by 61.3% to 66.0% with dose increment, while at 48 h, cell viability increased by 58.32% to 65.99% with dose increment (p < 0.0001). The highest efficacy was achieved by applying 96 µg/ml Que at 24 h, resulting in 66.0% cell viability (p < 0.0001).
When chitosan was applied to the cells at different doses, it was observed that low doses of chitosan (2 µg/ml and 8 µg/ml) did not significantly increase cell viability at 24 h (p > 0.05) (
Figure 9). However, at 48 h, these low doses significantly increased cell viability, reaching approximately 60% (p < 0.0001) (
Figure 10). It was determined that the application of 24 µg/ml, 48 µg/ml, 72 µg/ml, and 96 µg/ml of chitosan significantly increased cell viability with dose escalation at both 24 h and 48 h. At 24 h, cell viability increased in the range of 52.54% to 61.04% with dose escalation, while at 48 h, cell viability increased in the range of 62.12% to 66.31% with dose escalation (p < 0.0001). The highest efficacy was achieved by applying 96 µg/ml chitosan at 48 hours (p < 0.0001).
When NP1 was applied to the cells at different doses, it was observed that the low and moderate doses of NP1 (2 µg/ml, 8 µg/ml, 24 µg/ml, and 48 µg/ml) did not significantly increase cell viability at 24 h (p > 0.05) (
Figure 9). However, at 48 h, these doses were found to significantly increase cell viability (p < 0.01, p < 0.05) (
Figure 10). NP1 treatment exhibited a protective effect at concentrations of 72 µg/ml and 96 µg/ml against H2O2 toxicity at both time points (24 h and 48 h) (p < 0.0001). It was determined that applying 72 µg/ml NP1 at 24 h and 48 h increased cell viability to approximately 60% (p < 0.0001). Additionally, the application of 96 µg/ml NP1 at 24 h and 48 h elevated cell viability to above 65%, with the highest efficacy observed at 48 h with 96 µg/ml NP1, reaching 68% cell viability (p < 0.0001).
Upon application of NP2 at different doses to the cells, it was observed that, at 24 hours, only the low dose (2 µg/ml) did not significantly increase cell viability (p > 0.05) (
Figure 9). However, at 48 hours, it was observed that low and moderate doses (2 µg/ml, 8 µg/ml, and 24 µg/ml) did not significantly increase cell viability (p > 0.05) (
Figure 10). When NP2 levels of 8 µg/ml, 24 µg/ml, 48 µg/ml, 72 µg/ml, and 96 µg/ml were applied to the cells for 24 h, a significant increase in cell viability by 55.49% to 66.53% was observed (p < 0.0001). The highest efficacy was achieved by applying 48 µg/ml NP2 at 24 h (p < 0.0001). However, when NP2 levels of 48 µg/ml, 72 µg/ml, and 96 µg/ml were applied to the cells for 48 h, a significant increase in cell viability by 60.38% to 77.30% was observed (p < 0.0001). NP2 demonstrated a protective effect against H2O2-induced cytotoxicity at all doses, with a more pronounced effect at higher doses. Particularly at 96 µg/ml, it exhibited a 77.30% protective effect against H2O2-induced cytotoxicity.
In NP3 applications, cell viability remained above 60% for all dose applications at both time points (24 h and 48 h). However, in the 24th h cell viability analysis, the cell viability ratio was significantly high for all doses (60.24-70.06%), and as the dose increased, the increase in cell viability decreased (
Figure 9). As shown in
Figure 9, NP3 demonstrated the highest antioxidant effect when applied at 2 μg/ml, maintaining cell viability up to 70%.
In the 24th h application, it was observed that the low and moderate doses of NP4 (2 µg/ml, 8 µg/ml, 24 µg/ml, and 48 µg/ml) significantly increased cell viability up to 66% (
Figure 9). In the 24 h pre-treatment experiment, NP4 at 72 µg/ml, and 96 µg/ml provided lower protection against neurotoxicity (
Figure 9). In contrast, 2 and 8 µg/ml NP4 preserved cell viability up to 66.03% and 63.18%, against H2O2, respectively. NP4 exhibited the highest viability at a concentration of 2 µg/ml at 24 h. In other words, the dose with the best protective effect for NP4 was 2 µg/ml at 24 hours. In the 48 h pre-treatment experiment, the low, moderate, and high doses (2 µg/ml, 8 µg/ml, 24 µg/ml, 48 µg/ml, 72 µg/ml, and 96 µg/ml) were observed to significantly increase cell viability in the range of 54.13% to 64.09% for all doses (
Figure 10). The efficiency of 48 µg/ml, 72 µg/ml, and 96 µg/ml NP4 was lower, whereas 2 µg/ml, 8 µg/ml, and 24 µg/ml NP4 protected cell viability up to 60.78%, 60.63%, and 64.09% against H2O2, respectively.
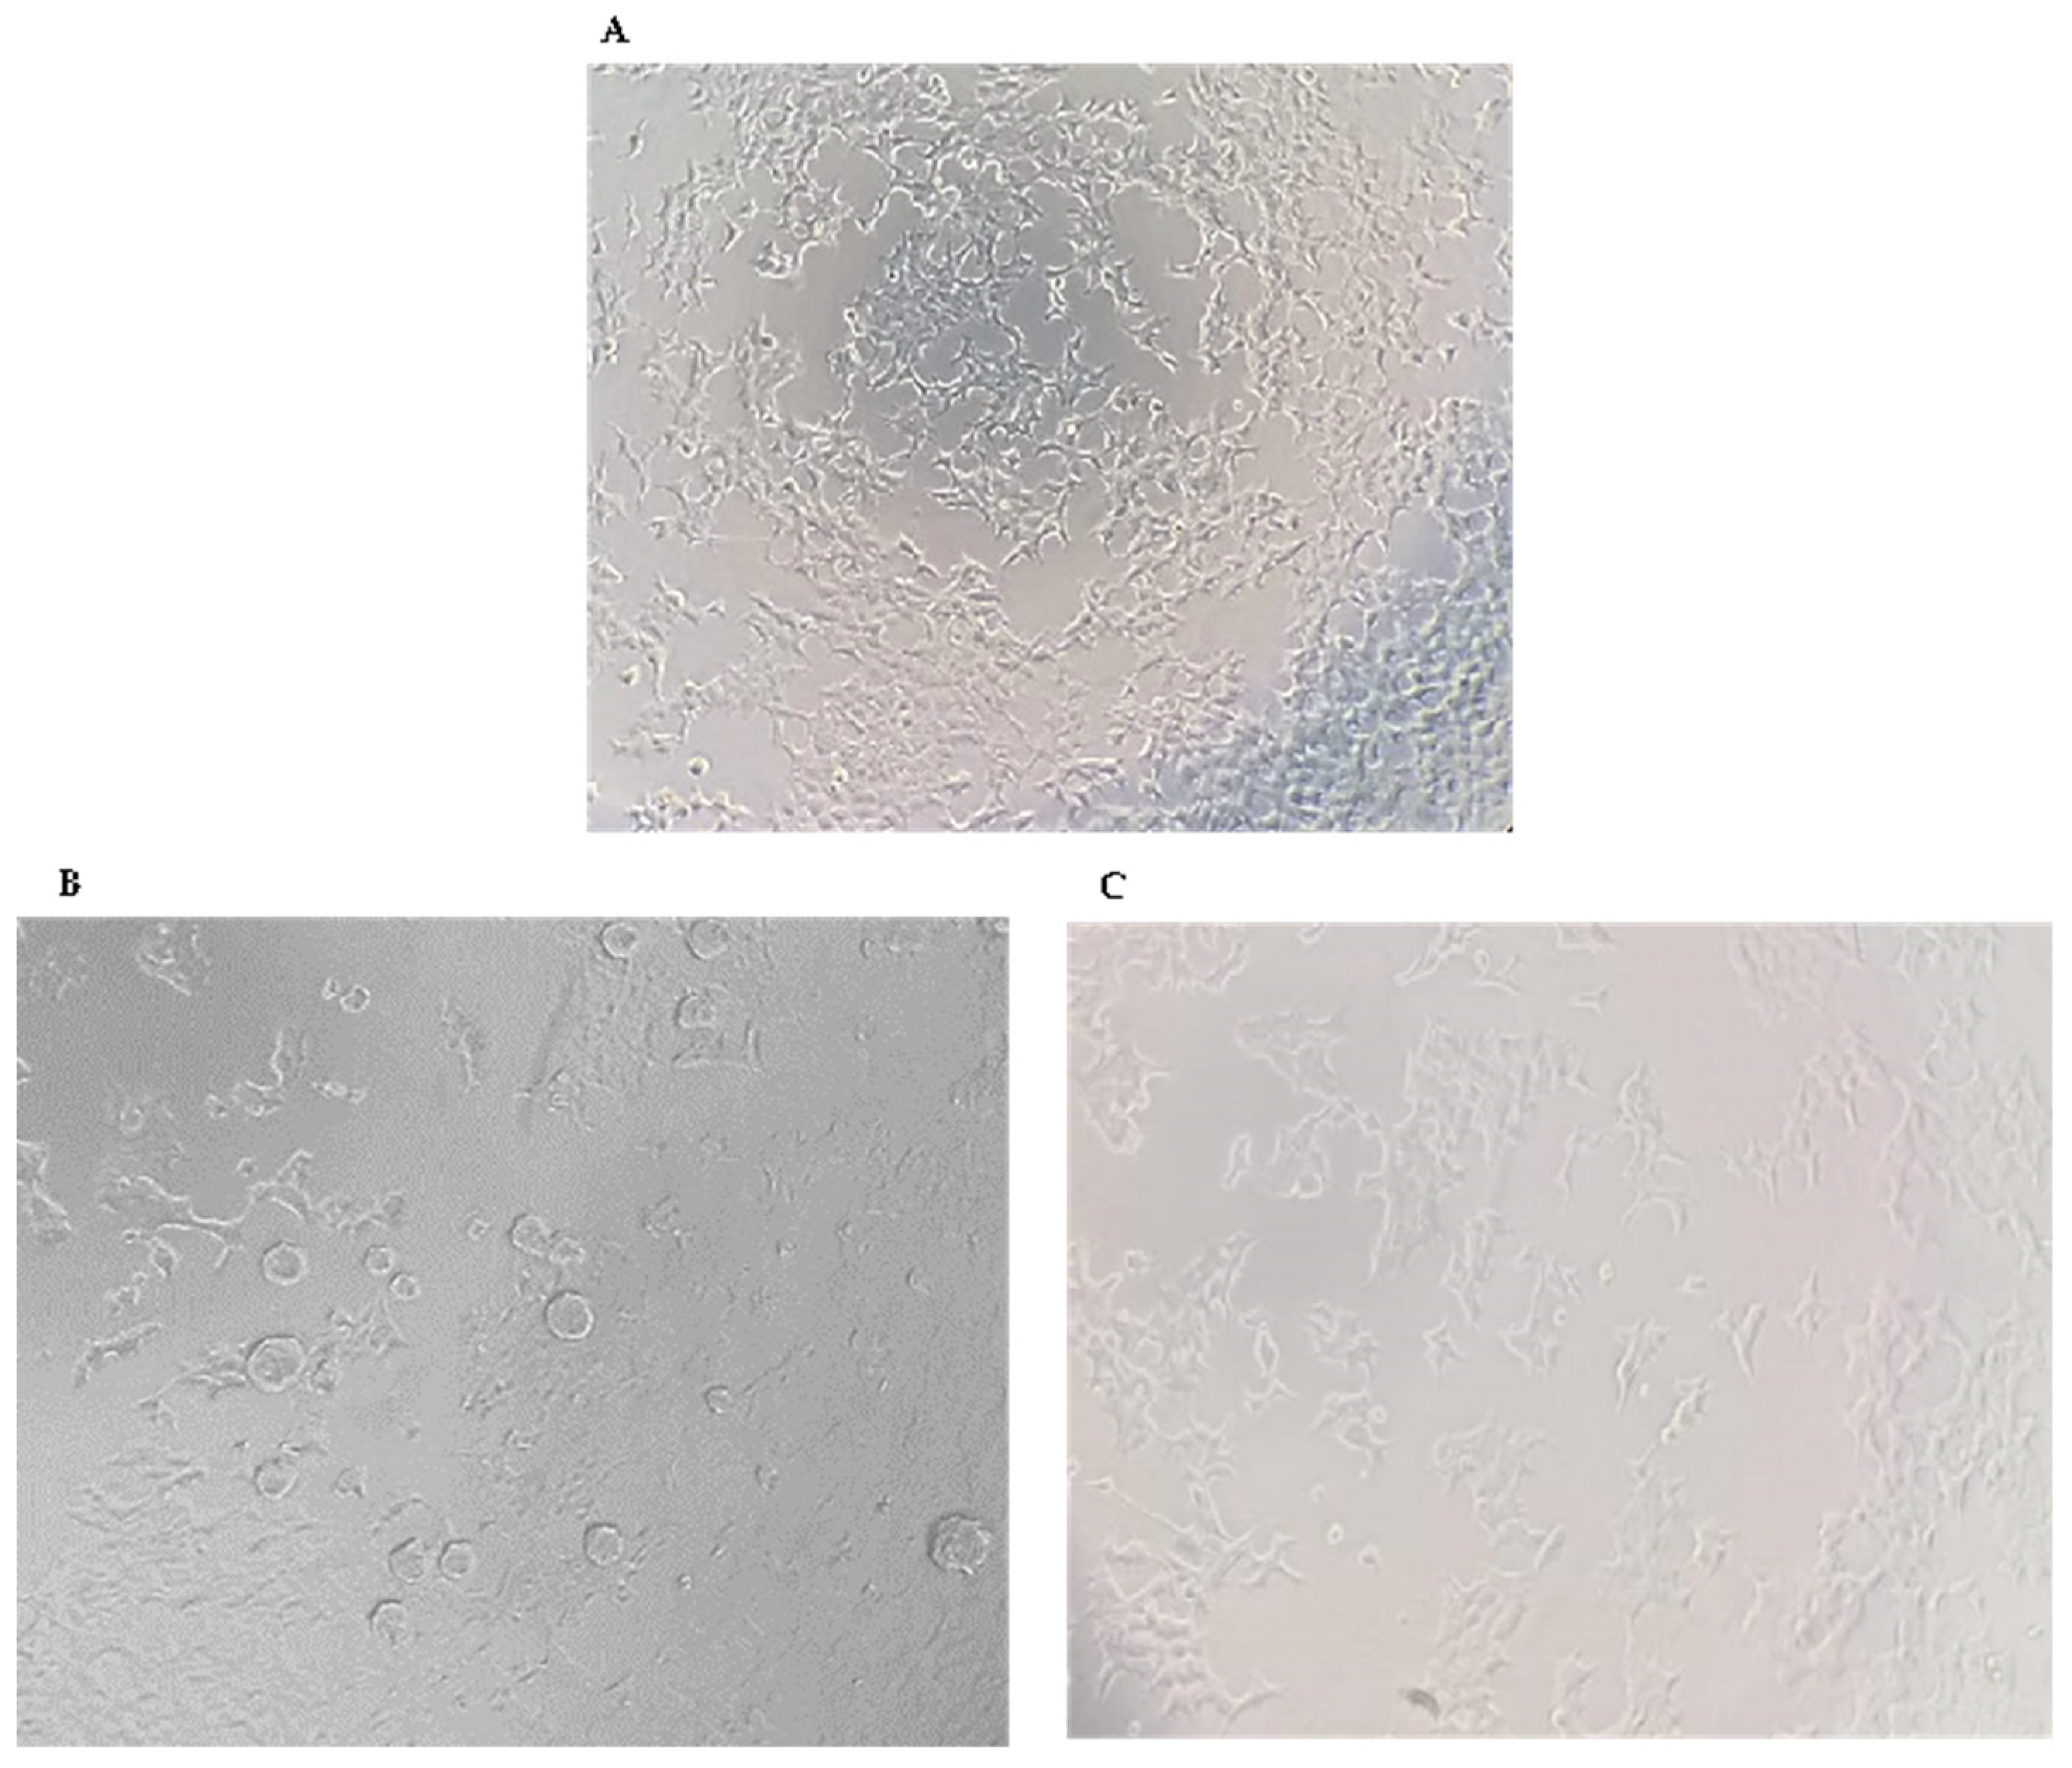
In cell culture analyses, it has been observed that all NPs increased cell viability against H2O2-induced cell damage (
Figure 11).
4. Discussion
The synthesis of the NPs in this study was carried out by modifying the methods of Zhang et al 2008, Wang et al 2020, Jardim et al 2022, and Messias de Souza et al 2022 [
7,
9,
10,
11]. The preparation of chitosan NPs is based on an ionic gelation interaction between positively charged chitosan and negatively charged STPP at room temperature. The chitosan NPs prepared in the experiment were in white powder, similar to the literature [
7,
9,
10,
11]. Que stock solution was prepared in ethanol as in the literature [
7,
9,
11]. NP1 and NP3 were white, while NP2 and NP4 were yellowish, indicating that the Que was loaded into the chitosan. In synthesizing NPs, pH, ultrasonic bath soaking time, stirring speed, and duration were considered. In our study, when FE-SEM (
Figure 1) and TEM (
Figure 2) images are examined, it is seen that NP1 and NP3 are nearly spherical shape [
21], and NP2 and NP4 are strip-like structures [
22]. The FE-SEM and TEM images of the NPs synthesized in our study exhibit similarities with the images of NPs containing Que and VPA in the literature [
22,
23,
24,
25,
26]. Images and zeta potential values of NPs kept in an ultrasonic bath at pH 4.5 for 5 minutes and stirring at low speed for 24 hours are given in
Table 1 and
Figure 3.
The mean particle size and zeta potential value of NP1 and NP2 were 153.6 ± 12.81 nm and 16.6 ± 4.12 mV, 180.5 ± 8.23 nm and 15.1 ± 3.42 mV, respectively (
Table 1). The positive zeta potential of NP substrate assisted suitable interaction and ionic cross-linking of NPs to negatively charged molecules. This clearly shows that the loading of Que on chitosan NPs causes a significant decrease in the zeta potential. A similar situation was also reported in the Roy and Rhim study (2021) [
6]. Li et al. 2018 performed single and double-molecule loadings to chitosan. In the study, the particle size of Que loaded on chitosan NP was found to be 190.7 ± 2.8 nm [
26]. The particle size of the NPs obtained in our study is similar to the literature. In our study, NP1 and NP3 were formulated with a mean diameter of 153.6 ± 12.81nm and 93.2 ± 7.25 nm, for both chitosan and VPA-loaded chitosan samples, respectively (
Table 1). The loading of VPA into chitosan led to a decrease in size by about 60 nm. The results may be attributed to the electrostatic interaction and ionic cross-linking between negatively charged VPA and positively charged chitosan molecules, which have led to electric attraction force among substrates and final shrinkage of the particles. A similar situation to our study is also observed in the study conducted by Jafarimanesh et al [
23]. In their 2023 study, Jafarimanesh et al developed chitosan NPs loaded with VPA. When the particle sizes of the synthesized NPs in Jafarimanesh et al.'s study were examined, a decrease in particle size was observed with VPA loading. In our study, in NP4, where dual drug loading occurred, the NP size increased upon adding Que. Therefore, the data from our study demonstrates similarity with the literature. The biochemical influence of scaffolds is a key factor in their applicability, and great attention is required for the particle surface characteristics and particle size distribution. The magnitude of the zeta potential provides information about particle stability [
23]. To evaluate the stability of the synthesized NPs, zeta potential measurements were used. Higher magnitude potentials indicate increased electrostatic repulsion and, thus, increased stability. Particles with zeta potentials in the 0-5 mV range tend to aggregate or cluster, particles in the 5-20 mV range are stable, and particles above 20 mV are highly stable [
27]. When the zeta potential data in
Table 1 and
Figure 3 are examined, it is seen that the zeta potential values of NP1, NP2, and NP3 are in the range of 5-20 mV and can show a stable structure. The NP with the highest zeta potential and exhibiting high stability in our study was identified as NP4. The proximity of the PDI values of all developed NPs to zero in our study indicates a homogeneous nanoparticle distribution (
Table 1). This observation suggests that each NP exhibits similar sizes, and their distributions are not widely spread. In addition, the sharpness of the zeta potential peak in
Figure 3 provides information about the homogeneity of the structure. When examining the Zeta analysis results, the sharpness of the chromatograms and the potential values indicate a stable and homogeneous distribution of the developed NPs within the solution. All obtained results indicate that drugs were homogeneously loaded onto NPs, and this loading was uniformly distributed. This situation may support the effectiveness of drug transport, enabling the drug to reach the targeted area more efficiently. Thus, it suggests a potential contribution to enhancing the bioavailability of the drugs.
FT-IR spectroscopy revealed that both spectra of Que standard and NP2 have the same characteristic peaks of O-H (3400 cm-1) and aromatic C=C (1510 cm-1, 1610 cm-1). Still, the intensity of the sample peaks is lower (
Figure 4A). The peaks at 3411.1 cm-1, 1613.7 cm-1, and 1515.6 cm-1 appearing in the FT-IR analysis of the Que standard are observed at approximate values in NP2. The peaks at 1653 cm-1 and 1022 cm-1 appearing in the FT-IR analysis of the chitosan standard are also seen at approximate values in NP1 and NP2. In the Roy and Rhim study, 1614 cm-1 was noted as the prominent peak of Que [
6]. This observation reveals that NPs can be developed appropriately, as our data are similar to other studies in the literature [
6,
24,
26,
28]. Upon examination of
Figure 4B, it is evident that both the VPA standard and the NPs containing VPA (NP3 and NP4) exhibit similar peaks at approximately 2961 cm-1 and 1700.6 cm-1. In the FT-IR spectrum of VPA, the broad peaks observed at 2961.3 cm-1 indicate aliphatic O-H stretching vibration, while the peak at 1700.6 cm-1 corresponds to C=O stretching vibration [
19,
20]. Additionally, peaks attributed to Que, specifically the C=C aromatic ring, are observed at 1621 cm-1 and 1521 cm-1 in NP3 and NP4. This observation reveals that nanoparticles can be appropriately developed.
Encapsulation efficiency is a crucial factor in drug delivery release. For the sustained release of an adequate amount of the drug at the target site, a high level of entrapment of the drug into the NPs is expected [
11]. The encapsulation efficiency of Que NPs developed with different methods in the literature was obtained as 79.8 ± 1.5% [
29], 83.8 ±0.33% [
11], and 92% [
30]. In our study, when the amounts of drugs in the filtrates were analyzed for encapsulation efficiency, it was observed that due to the trace amounts of drugs in the filtrates, drug loading in the NPs was achieved with high encapsulation efficiency. In our study, Que encapsulation efficiency was found to be 93.46 ± 5.52% and 99.23 ± 4.73% in NP2 and NP4, respectively. In our study, VPA encapsulation efficiency was found to be 99.9 ± 7.88% and 97.8± 5.42% in NP3 and NP4, respectively (
Table 1). In our study, NPs with higher encapsulation efficiency were synthesized compared to the literature. The reasons for this include that adjusting the optimal solvent, pH, stirring speed, and time during synthesis effectively develops NPs.
The results showed that VPA and Que release profiles from chitosan NPs were rapid in our study. In the study conducted by Jafarimanesh et al. in 2023, VPA was loaded onto chitosan NPs within a hybrid of alginate/chitosan hydrogel. The study observed a rapid release of VPA from the chitosan hydrogel loaded with VPA, with the initial burst release of VPA observed after 72 hours of incubation [
23]. In our study, the burst release of VPA from chitosan nanoparticles containing VPA started at the 50th hour in NP3 and at an earlier time, the 30th hour, in NP4 (
Figure 4C). Raj et al. 2015 reported that the release of Que was rapid in the first 10 hours [
25]. In our study, when the release of NPs at pH 7.4 37 ±0.1°C was examined, it was observed that Que was rapidly within the first 8 hours (
Figure 4D). The data of our study are similar to the literature.
Due to the antioxidant properties of Que, Que-loaded NPs have been developed using different nanostructures in the literature. When the antioxidant activities of NPs in the literature are examined, Li et al. 2018 reported that genipin and Que-loaded chitosan NPs showed antioxidant activity in DPPH and ABTS assays [
26]. Wu et al. (2008) reported that NPs composed of Que, polyvinyl alcohol, and aminoalkyl methacrylate copolymers showed antioxidant activity in vitro [
31]. Zhang et al (2008) studied the radical removal activity of Que-loaded chitosan NPs in the 0.5-3 mg/mL range. As a result of the analysis, it was reported that the NP showed antioxidant activity [
32]. Unlike Zhang et al.'s (2008) study, the radical scavenging activity and antioxidant capacity of NPs at lower concentrations were investigated in our study. In our study, antioxidant activity analysis of samples in the range of 0.05-0.6 mg/mL was performed. In our study, determining the antioxidant capacities of the NPs developed against ROS was among our research objectives. To achieve this, in vitro antioxidant capacity analyses were conducted to determine the effectiveness of the NPs. In our study, the antioxidant activity capacity of NPs containing Que was observed to be close to the antioxidant activity capacity of the BHT standard (
Figure 5). Effective antioxidant activity was observed in NP2 and NP4. However, NP1 and NP3 without Que showed significantly lower antioxidant activity than the BHT standard (
Figure 5). In a study conducted by Palol et al. (2021), the antioxidant activity of VPA was evaluated using the DPPH analysis method [
33]. Compared to ascorbic acid, the antioxidant activity of VPA was found to be approximately 35%, exhibiting lower antioxidant capacity than ascorbic acid. In our study, it was observed that NP3, which contains only VPA, exhibited low antioxidant activity. However, NP4, which underwent dual drug loading by adding Que, showed antioxidant activity close to the BHT standard. Our study results are consistent with similar findings in the literature. The analysis results indicate that the antioxidant property of Que can be successfully utilized in NP systems, and this property of Que persists within the NP system.
Additionally, in our study, the antioxidant activity of the developed NPs was analyzed on hypoxia-induced SH-SY5Y cells, selected for evaluating neurotoxicity processes. H2O2 is commonly used as an inducer of oxidative stress in in vitro models. As a result of the MTT test, IC50 value was determined as 200 µM (
Figure 6). Additionally, the potential cytotoxic effects of free VPA, Que, chitosan, and NPs were determined after 24 h (
Figure 7) and 48 h (
Figure 8). Except for high doses of NP4, none of the samples showed significant cytotoxic effects at the concentrations used in the study (
Figure 7,
Figure 8). At the concentration of 96 µg/mL applied to the cells, NP4 was observed to reduce cell viability to below 50%. When reviewing studies examining the cytotoxic effects of VPA, Que, and chitosan in SH-SY5Y cells, it was observed in a study by Suematsu et al. (2011) that Que did not demonstrate any significant cytotoxic effect in the range of 0–100 µM [
34]. Manigandan et al. (2019) reported that chitosan did not show any significant cytotoxic effect at levels between 0 and 50 µM [
35], while Terzioglu Bebitoglu et al. (2020) found that VPA at concentrations of 1 mM, 5 mM, or 10 mM did not exhibit any cytotoxic effect on SH-SY5Y cells [
36]. In our study, antioxidant effects were explored in a model of H2O2-induced oxidative stress in SH-SY5Y cells. The mechanism of H2O2-induced cell damage includes the production of reactive hydroxyl radicals and byproducts by Fenton’s reaction that further interact directly with cellular components to damage proteins, lipids, and DNA [
37]. Antioxidants can block these effects. Cell viability was measured 24 h and 48 h after H2O2-induced damage. Suematsu et al. (2011) examined the protective effects of Que against the death of H2O2-treated SH-SY5Y cells [
34]. When SH-SY5Y cells were incubated in a medium containing 100 µM H2O2 and Que, H2O2-mediated damage was suppressed. When SH-SY5Y cells were cultured with 100 µM H2O2, cell viability decreased to approximately 38% of the vehicle-treated cells. In the presence of Que, the viability of H2O2-treated cells increased in a Que concentration-dependent manner, reaching about 67% of that of the vehicle-treated ones at 100 µM Que [
34]. Xi et al. (2012) studied the protective effects of Que in H2O2-induced SH-SY5Y cells [
38]. SH-SY5Y cells were pre-cultured with Que in different concentrations for 12 h or 10 µM for various periods, then pre-conditioned cells were treated with H2O2 (0.5 mM, 12 h). The study revealed that Que arrested cellular damage. In the 2018 study by Han et al., the antioxidant effect of Que-loaded NP was analyzed in SH-SY5Y cells [
39]. The DCFH-DA fluorescent probe was selected to determine the total intracellular ROS level, and 200 µM H2O2 was used as a positive control in the study. Que powders could reduce amounts of ROS products to some extent, as indicated by most of the studies. When Que NPs were introduced, the ROS level was neutralized, similar to the cell control, indicating that Que NPs exhibit a unique ROS scavenging activity. Cell viability increased from 40% to 70% with 10 µg/mL of Que NPs [
39]. Similar to the literature, in our study, a hypoxic environment was created by applying 200 µM H2O2 to SH-SY5Y cells (
Figure 6). In our study, the antioxidant activity of free Que and NP2-containing Que became apparent starting from 8 µg/mL after 24 h (
Figure 9). The highest efficacy was achieved by applying 96 µg/mL Que and 48 µg/mL NP2 at 24 h, resulting in approximately 66.0% cell viability (p < 0.0001) (
Figure 9). Additionally, it was observed that the antioxidant activity of free Que and Que-containing NP2 was initiated at 24 µg/mL for free Que and 48 µg/mL for NP2 after 48 h of application (
Figure 10). The highest efficacy was achieved by applying 72 µg/mL Que (65.99% cell viability) and 96 µg/mL NP2 at 48 hours, resulting in 77.30% cell viability (p < 0.0001) (
Figure 10). Our study demonstrates a similarity to the literature regarding the antioxidant effect of Que on H2O2-induced SH-SY5Y cells.
All NPs developed in our study were synthesized using chitosan. Publications indicate that chitosan positively enhances cell viability in H2O2-induced SH-SY5Y cells. In a study conducted by Manigandan et al. (2019), applying 5-20 µM chitosan to H2O2-induced SH-SY5Y cells was reported to increase cell viability by approximately 70% [
35]. Similarly, in our study, it was observed that both free chitosan and all NPs developed using chitosan increased cell viability in hypoxic cells. The application of 24 µg/mL, 48 µg/mL, 72 µg/mL, and 96 µg/mL chitosan significantly increased cell viability in a dose-dependent manner at both 24 h and 48 h. Within 24 h, cell viability increased between 52.54% and 61.04% in a dose-dependent manner (
Figure 9), and within 48 h, cell viability increased between 62.12% and 66.31% in a dose-dependent manner (p < 0.0001) (
Figure 10). The highest efficacy was achieved with the application of 96 µg/mL chitosan at 48 h, reaching 70% cell viability (p < 0.0001) (
Figure 10). The application of NP1 (blank chitosan NP) showed a protective effect against H2O2 toxicity at concentrations of 72 µg/mL and 96 µg/mL (p < 0.0001). Applying 96 µg/mL NP1 for 24 h and 48 h raised cell viability to over 65%, with the highest efficacy observed at 48 h with 96 µg/mL NP1, resulting in 68% cell viability (p < 0.0001). Similar to the findings in the literature, the results of our study also indicate a positive effect of chitosan on cell viability. This suggests the potential for a synergistic effect in antioxidant activity within NPs developed with chitosan, owing to its protective impact.
In a study conducted by Terzioglu Bebitoglu et al. (2020), SH-SY5Y human neuroblastoma cells were pre-treated with 1 mM, 5 mM, or 10 mM VPA and then compared with 15 mM glutamate exposure [
36]. The MTT test was applied to determine cell viability, and the treatment with 1 mM VPA effectively increased the viability of cells exposed to glutamate for 24 h. In our study, the effect of free VPA as well as single and dual drug-loaded NPs on cell viability after H2O2 treatment was investigated. When cells were treated with 48 µg/ml, 72 µg/ml, and 96 µg/ml VPA, an increase in cell viability was observed at 24 h and 48 h. Moreover, an evident increase in cell viability was observed with dose escalation (p < 0.01). The highest efficacy was achieved by applying 96 µg/ml VPA at 24 h, reaching 57.89% cell viability (p < 0.0001). However, no significant effect on cell viability was observed with low and medium doses of VPA (2 µg/ml, 8 µg/ml, and 24 µg/ml) (p > 0.05). The positive effect of VPA on cell viability in our study is consistent with the literature. In NP3 applications, cell viability remained above 60% in all dose applications at both time points (24 h and 48 h). NP3 exhibited the highest neuroprotective effect when applied at 2 µg/ml, maintaining cell viability up to 70%. While free VPA does not exhibit antioxidant activity at low doses, it is observed that NP3 (chitosan-loaded VPA NP) shows antioxidant activity even at low doses. This suggests a synergistic effect of chitosan and VPA molecules in the NP3 content contributing to antioxidant activity.
In the 24 h application experiment, low and medium doses of NP4 (2 µg/ml, 8 µg/ml, 24 µg/ml, and 48 µg/ml) significantly increased cell viability up to 66% (
Figure 9). In the 24-h pre-treatment experiment, NP4 provided lower protection against neurotoxicity at concentrations of 72 µg/ml, and 96 µg/ml (
Figure 9). In other words, the optimal dose for the best antioxidant effect of NP4 was determined to be 2 µg/ml at 24 h. In the 48 h pre-treatment experiment, low, medium, and high doses (2 µg/ml, 8 µg/ml, 24 µg/ml, 48 µg/ml, 72 µg/ml, and 96 µg/ml) significantly increased cell viability between 54.13% and 60.78% (
Figure 10). The efficiency of 48 µg/ml, 72 µg/ml, and 96 µg/ml NP4 was lower, whereas 2 µg/ml, 8 µg/ml, and 24 µg/ml NP4 protected cell viability up to 60.78%, 60.63%, and 64.09% against H2O2, respectively. In our study, free VPA demonstrated antioxidant effects at high doses, while when used in conjunction with chitosan and Que within NPs, it could exhibit antioxidant effects at lower doses. This indicates that combining bioactive molecule contents in nanoparticle formulations can achieve antioxidant effects at lower doses. However, the inability of NP4 to demonstrate antioxidant effects at high doses is thought to be related to the cytotoxicity analysis of NP4, where high doses may reduce the cell viability of healthy cells (
Figure 7,
Figure 8).
This study's findings demonstrate the in vitro antioxidant activities of the developed NPs and their protective effects in the H2O2-induced oxidative stress model. In vitro antioxidant capacity analyses have revealed that Que-containing NPs, especially NP2 and NP4, exhibit activity close to the antioxidant activity capacity of the BHT standard (
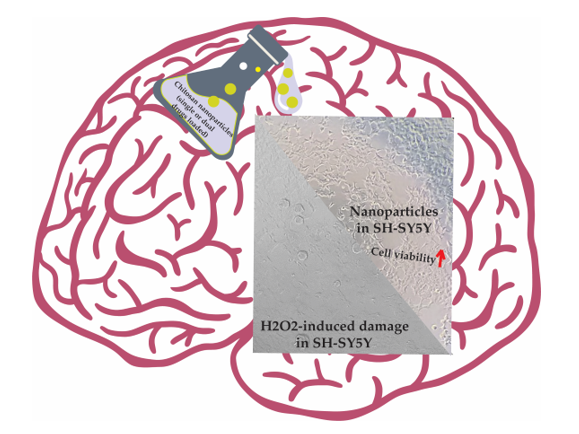
Figure 5). While the antioxidant activity of NP1 and NP3 without Que was found to be lower compared to the antioxidant activity of BHT (
Figure 5), all developed NPs were observed to protect against H2O2-induced cell damage and exhibit protective effects against oxidative stress in cell culture experiments (
Figure 9,
Figure 10).
In cell culture experiments, the protective effects of NPs on SH-SY5Y cells were assessed. NP applications that provided the highest protection against H2O2-induced cell damage (
Figure 11), respectively, were determined as follows: NP2 at 96 µg/ml (77.30%, 48 hours), NP3 at 2 µg/ml (70.06%, 24 hours), NP1 at 96 µg/ml (68.31%, 48 hours), and NP4 at 2 µg/ml (66.03%, 24 hours). Our study emphasizes the positive effects of chitosan on antioxidant activity. NP1, which contains chitosan, demonstrated a protective effect, especially at high doses, against H2O2 toxicity. Furthermore, the low doses of NP3 and NP4, containing valproic acid, exhibiting antioxidant activity in SH-SY5Y cells exposed to oxidative damage, suggest a potential novel therapeutic approach against oxidative injury during VPA treatment. Additionally, it was observed that NP2 and NP4, containing Que, exhibited a significant protective effect against oxidative stress induced by H2O2. Despite the cytotoxicity observed at high doses of NP4, its antioxidant effect persisted at low doses. This suggests that NP4 has a notable protective potential at appropriate doses, while higher doses may adversely affect cell viability. When evaluating studies in the literature regarding the effective use of drug-loaded NPs in brain diseases [
40] and considering our analysis results, it is believed that NPs developed by loading onto chitosan may potentially play a role in alleviating oxidative stress associated with neurodegenerative conditions.
Figure 1.
FE-SEM morphological evaluation of the nanoparticles (NPs). A) FE-SEM image of blank chitosan NP (NP1), B) FE-SEM image of Que-loaded chitosan NP (NP2), C) FE-SEM image of VPA-loaded chitosan NP (NP3), D) FE-SEM image of Que and VPA-loaded chitosan NP (NP4).
Figure 1.
FE-SEM morphological evaluation of the nanoparticles (NPs). A) FE-SEM image of blank chitosan NP (NP1), B) FE-SEM image of Que-loaded chitosan NP (NP2), C) FE-SEM image of VPA-loaded chitosan NP (NP3), D) FE-SEM image of Que and VPA-loaded chitosan NP (NP4).
Figure 2.
TEM morphological evaluation of the nanoparticles (NPs). A) TEM image of blank chitosan NP (NP1), B) TEM image of Que-loaded chitosan NP (NP2), C) TEM image of VPA-loaded chitosan NP (NP3), D) TEM image of Que and VPA-loaded chitosan NP (NP4).
Figure 2.
TEM morphological evaluation of the nanoparticles (NPs). A) TEM image of blank chitosan NP (NP1), B) TEM image of Que-loaded chitosan NP (NP2), C) TEM image of VPA-loaded chitosan NP (NP3), D) TEM image of Que and VPA-loaded chitosan NP (NP4).
Figure 3.
ZETA results of the developed nanoparticles (NPs) in the study. A) NP1; Blank chitosan NP, B) NP2; Que-loaded chitosan NP, C) NP3; VPA-loaded chitosan NP, D) NP4; Que and VPA-loaded chitosan NP.
Figure 3.
ZETA results of the developed nanoparticles (NPs) in the study. A) NP1; Blank chitosan NP, B) NP2; Que-loaded chitosan NP, C) NP3; VPA-loaded chitosan NP, D) NP4; Que and VPA-loaded chitosan NP.
Figure 4.
FT-IR and in vitro release analysis results. A) FT-IR analysis results of chitosan, Que, NP1, and NP2, B) FT-IR analysis results of VPA, NP1, and NP2, C) In vitro release analysis results of VPA, D) In vitro release analysis results of Que.
Figure 4.
FT-IR and in vitro release analysis results. A) FT-IR analysis results of chitosan, Que, NP1, and NP2, B) FT-IR analysis results of VPA, NP1, and NP2, C) In vitro release analysis results of VPA, D) In vitro release analysis results of Que.
Figure 5.
Results of in vitro antioxidant activity of the nanoparticles (NPs). NP1; Blank chitosan NP, NP2; Que-loaded chitosan NP, NP3; VPA-loaded chitosan NP, NP4; Que and VPA-loaded chitosan NP, A) DPPH activity analysis, B) ABTS activity analysis.
Figure 5.
Results of in vitro antioxidant activity of the nanoparticles (NPs). NP1; Blank chitosan NP, NP2; Que-loaded chitosan NP, NP3; VPA-loaded chitosan NP, NP4; Que and VPA-loaded chitosan NP, A) DPPH activity analysis, B) ABTS activity analysis.
Figure 6.
The cytotoxic effect of H2O2 with different concentrations (0 μg/ml, 2 μg/ml, 100 μg/ml, 200 μg/ml, 300 μg/ ml, 500 μg/ ml, 1000 μg/ ml) on SH-SY5Y cells at 24th. A) % cell viability of SH-SY5Y cells treated with H2O2 at different concentrations for 24h. B) The IC50 values of H2O2 for 24h. Experiments were carried out in triplicate. Data are expressed as mean ± standard deviation (S.D.). *p<0.05, ***<0.001.
Figure 7.
The cytotoxic effect of samples with different concentrations (0 μg/ml, 2 μg/ml, 8 μg/ml, 24 μg/ml, 48 μg/ml, 72 μg/ml, and 96 μg/ml) on SH-SY5Y cells at 24th h. A) VPA, B) Que, C) Chitosan, D) NP1, E) NP2, F) NP3, G) NP4. Experiments were carried out in triplicate. Data are expressed as mean±standard deviation (S.D.). ***p<0.001.
Figure 8.
The cytotoxic effect of samples with different concentrations (0 μg/ml, 2 μg/ml, 8 μg/ml, 24 μg/ml, 48 μg/ml, 72 μg/ml, and 96 μg/ml) on SH-SY5Y cells at 48th h. A) VPA, B) Que, C) Chitosan, D) NP1, E) NP2, F) NP3, G) NP4. Experiments were carried out in triplicate. Data are expressed as mean±standard deviation (S.D.). ***p<0.001.
Figure 9.
The antioxidant effect of samples with different concentrations (2 μg/ml, 8 μg/ml, 24 μg/ml, 48 μg/ml, 72 μg/ml, and 96 μg/ml) on H2O2-challenged SH-SY5Y cells for 24th h. Experiments were carried out in triplicate. Data are expressed as mean ± standard deviation (S.D.). Compared to hypoxic vs nonhypoxic groups ****; p<0.0001,***; p<0.0005, **; p<0.005, *; p<0.05, Compared to nonhypoxic SH-SY5Y vs sample hypoxic groups ####; p<0.0001, ###; p<0.0001, ##; p<0.005, #; p<0.05.
Figure 10.
The antioxidant effect of samples with different concentrations (2 μg/ml, 8 μg/ml, 24 μg/ml, 48 μg/ml, 72 μg/ml, and 96 μg/ml) on H2O2-challenged SH-SY5Y Cells for 48th h. Experiments were carried out in triplicate. Data are expressed as mean ± standard deviation (S.D.). Compared to hypoxic vs nonhypoxic groups ****; p<0.0001,***; p<0.0005, **; p<0.005, *; p<0.05, Compared to nonhypoxic SH-SY5Y vs sample hypoxic groups ####; p<0.0001, ###; p<0.0001, ##; p<0.005, #; p<0.05.
Figure 11.
Images of cell viability of SH-SY5Y cells are included in the study. A) untreated SH-SY5Y, B) H2O2-induced damage in SH-SY5Y Cell, C) NPs exposure to H2O2-induced damage in SH-SY5Y Cell.
Figure 11.
Images of cell viability of SH-SY5Y cells are included in the study. A) untreated SH-SY5Y, B) H2O2-induced damage in SH-SY5Y Cell, C) NPs exposure to H2O2-induced damage in SH-SY5Y Cell.
Table 1.
Results of characterization analysis of nanoparticles.
Table 1.
Results of characterization analysis of nanoparticles.
| Properties |
NP1
(mean ± std. dev.) |
NP2
(mean ± std. dev.) |
NP3
(mean ± std. dev.) |
NP4
(mean ± std. dev.) |
| Particle Size (nm) |
153.6 ± 12.81 |
180.5 ± 8.23 |
93.2 ± 7.25 |
198.7 ± 9.13 |
| Zeta Potential (mV) |
16.6 ± 4.12 |
15.1 ± 3.42 |
8.89 ± 3.82 |
27.2 ± 3.67 |
| PDI |
0.08 |
0.05 |
0.08 |
0.05 |
| Que level in total filtrate |
|
|
| Que (µg/mL) |
- |
196.56 ± 7.65 |
- |
23.49 |
| Encapsulation Efficiency (%) |
- |
93.46 ± 5.52 |
- |
99.23 |
| VPA level in total filtrate |
| VPA (µg/mL) |
- |
- |
1.35 |
43.2 |
| Encapsulation Efficiency (%) |
-
|
-
|
99.9 ± 7.88 |
97.8± 5.42 |
