1. Introduction
The global coronavirus disease 2019 (COVID-19) pandemic, caused by SARS-CoV-2 virus, has resulted in many deaths and serious economic problems in all countries around the world[
1,
2,
3]. In this context, the development of sensitive and accurate detection technology is very important in dealing with viruses with high spread rates and transmission that is difficult to avoid. The common methods have been used to detect COVID-19 including RNA detection by reverse transcription polymerase chain reaction (RT-PCR) from respiratory sample[
4], antibody detection by the enzyme-linked immunosorbent assay (ELISA)[
5], chest X-rays[
6], and computed tomography[
7].
Of the several methods mentioned, RT-PCR is still the gold standard clinical diagnostic method for detecting COVID-19[
8]. Unfortunately, this method requires special equipment with trained personnel. The RT-PCR procedure also takes a long time with complex steps[
9]. Therefore, testing samples in mass quantities is difficult to realize. In this case, methods that are simple, fast, accurate and sensitive are really needed to deal with the spread of the virus in the future.
SPR biosensors have been used for more than 30 years to rapidly and accurately measure several biological and chemical species with very low detection limits to the atto- or femtomolar order[
10]. By utilizing surface plasmon waves (SPW), the interaction between the receptor molecule and the analyte detected can be monitored in real time by observing the sensorgram signal. This device also offers parallel analysis through the development of surface plasmon resonance imaging (SPRi) so as to offer more complete information[
11]. This paper summarizes the development of SPR biosensors in the face of the COVID-19 pandemic. The paper begins by introducing the principles of SPR technology and continues by introducing the kinetic parameters of the SPR signal. At the end of this paper, we will describe the results that have been obtained by researchers in developing SPR biosensors both for the detection of SARS-CoV-2 and for studying the kinetic parameters of this virus. Affinity and dissociation in various variants of SARS-CoV-2 will also be reviewed in this paper.
2. Working principle and Development of SPR Biosensor
SPR biosensor is one type of biosensor that utilizes surface plasmon waves in its work. Surface plasmon waves are generated when light interacts with free electrons at the interface between metal (or other conducting material) and dielectric (usually glass, air, or liquid)[
12]. When monochromatic light with p-polarization strikes a metal surface, the light will be absorbed by electrons and cause collective oscillations of electrons called plasmons[
13]. Surface plasmon waves propagate on metal and dielectric surfaces with a wave number symbolized by
and its magnitude can be determined mathematically by the following equation[
14]:
where
is the frequency of incident light, c is the speed of light,
and
are the dielectric constants of the metal and the dielectric, respectively. Because the dielectric constant is related to the refractive index (n) based on the relationship
[
15], then
in Equation 1 can be modified to[
16]:
where
and
indicate the refractive index of the metal and dielectric.
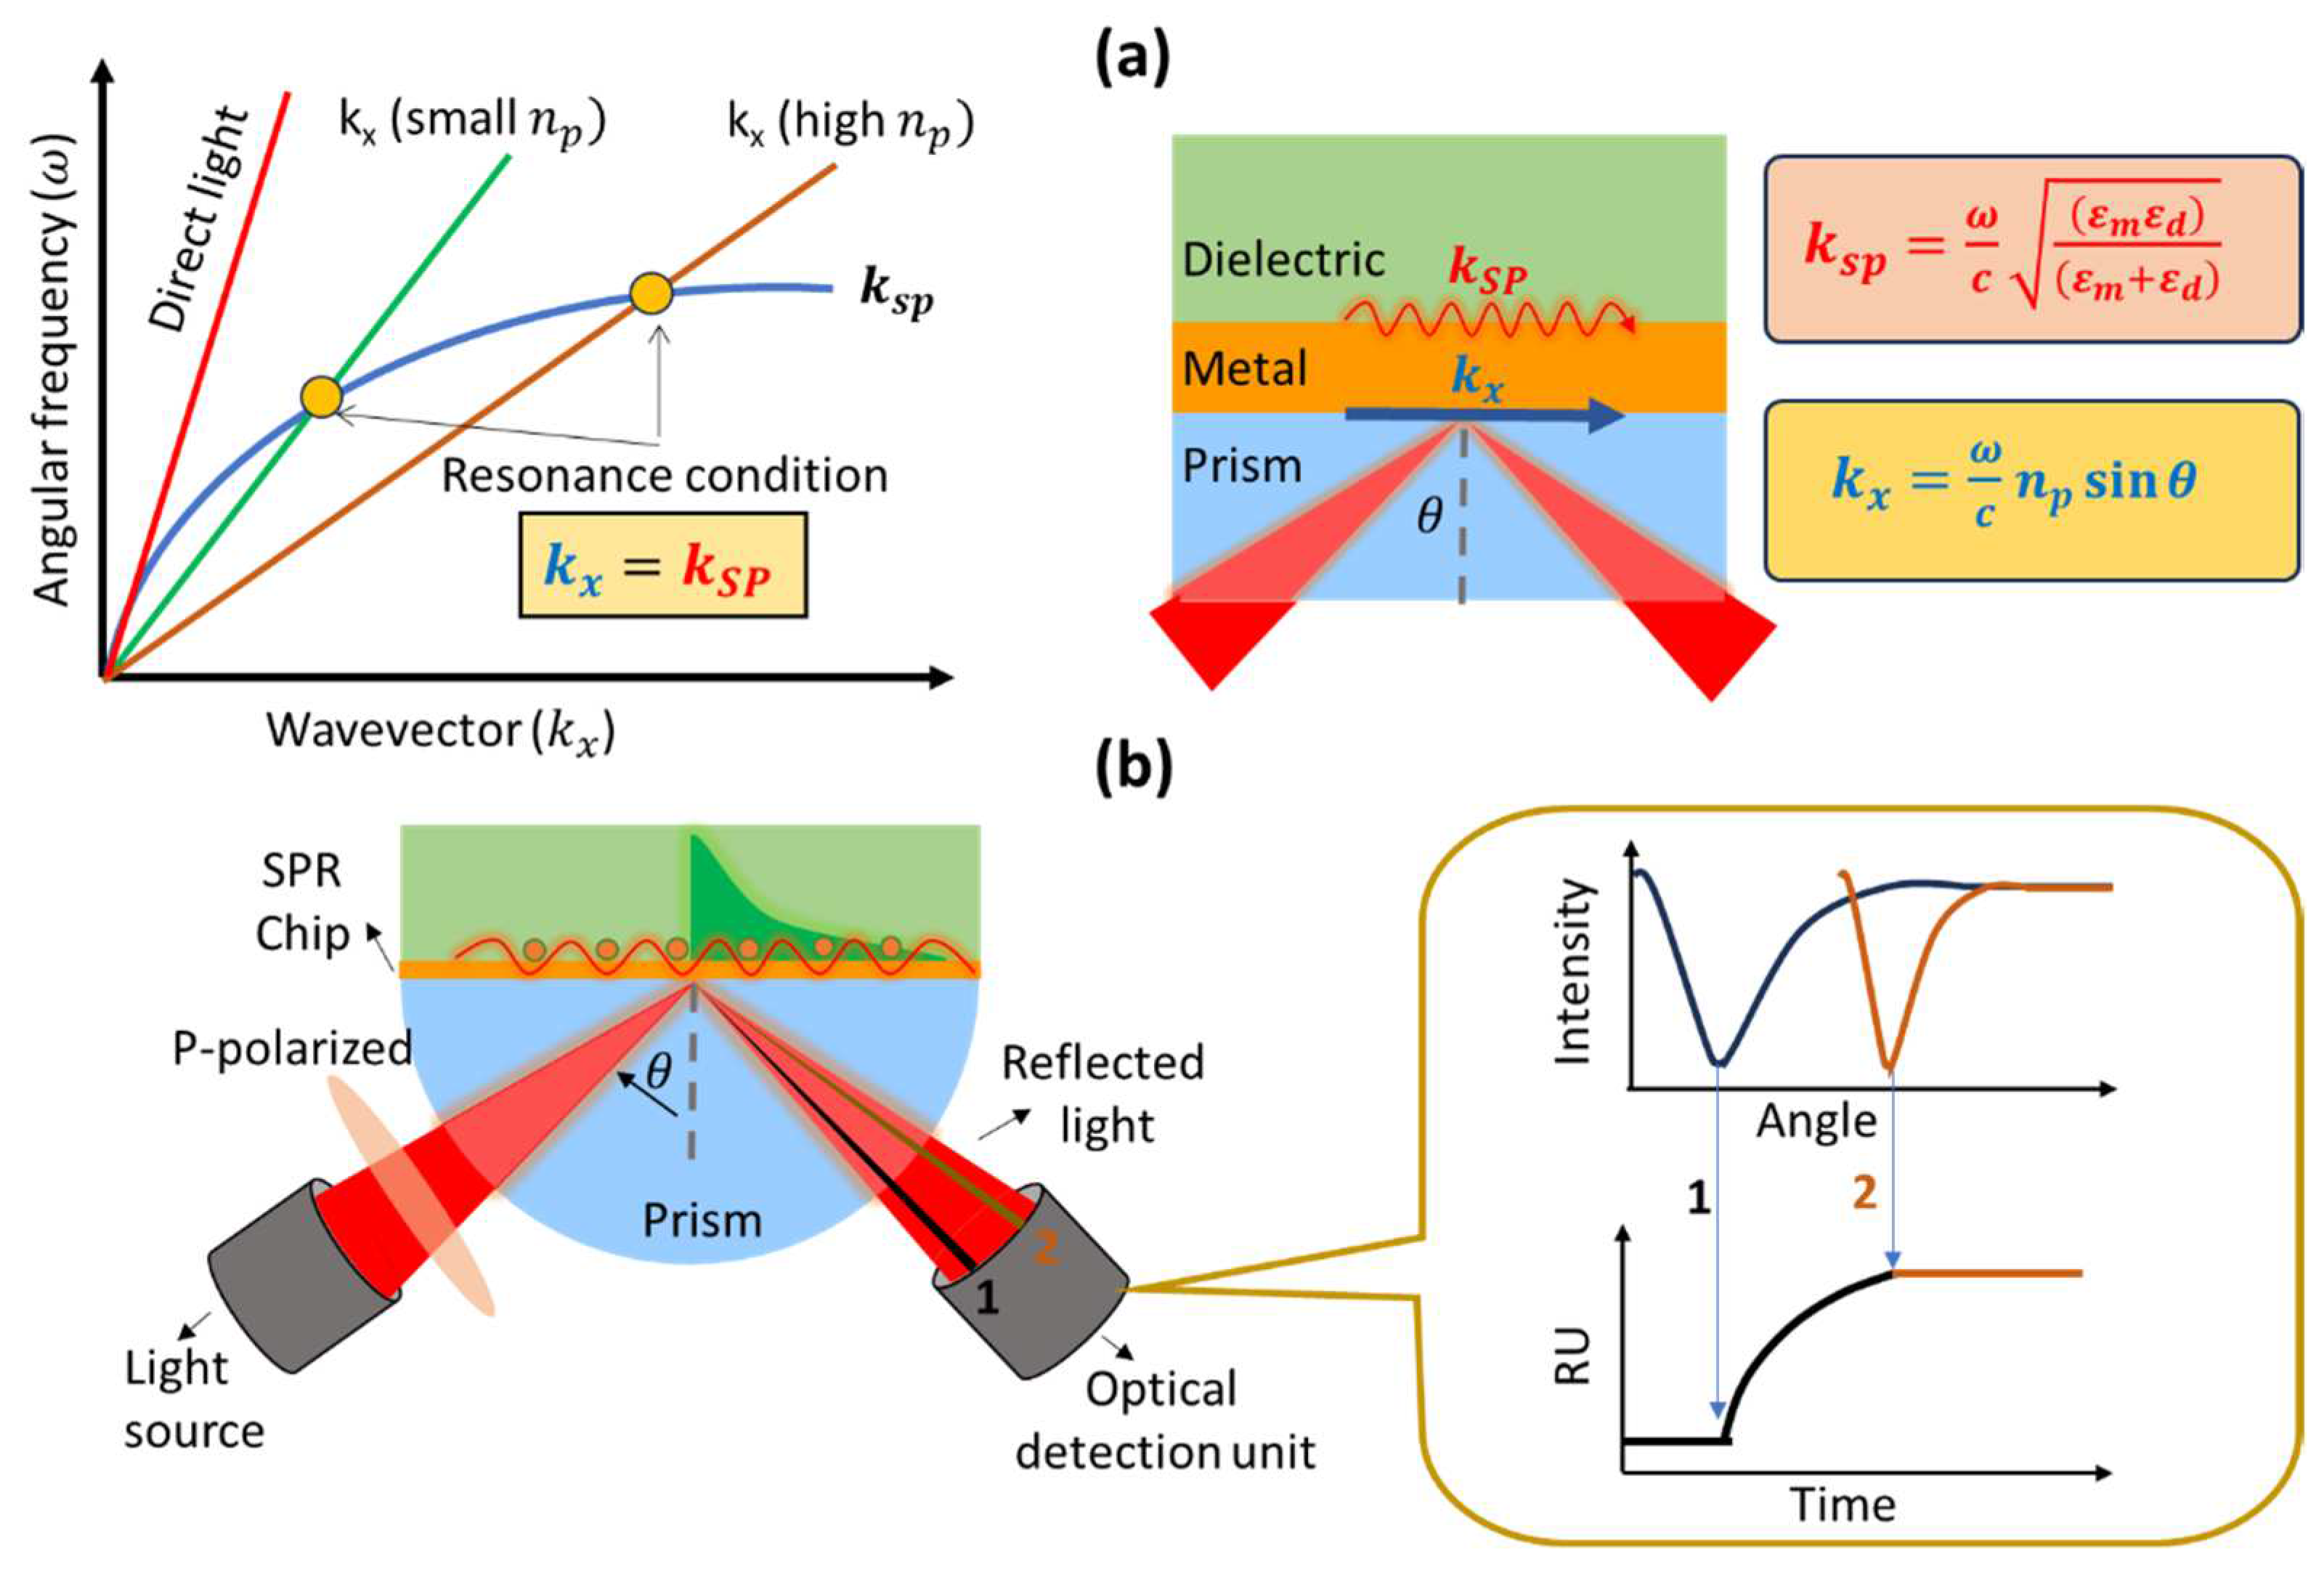
If we measure the intensity of reflected light, at a certain angle of incidence we will find an angle where the light will show a very low intensity. This happens because the incident light is completely absorbed by the electrons. The angle at which the intensity of the reflected light shows the smallest intensity is usually called the SPR angle or the resonance angle. The resonance condition occurs when the wave number of the photon is equal to the wave number of the surface plasmon. This can be explained from dispersion curve as shown in
Figure 1a. Surface plasmon waves cannot be excited by direct light because the wave vector of the surface plasmon is higher than the incident light. The wave vector of the surface plasmon (blue curve) will never intersect with the wave vector of the photon (red curve) over the entire wave number range. To achieve resonance conditions, the dispersion curve of the surface plasmon must be reduced or the dispersion curve of the photons increased. One widely used approach is to add a prism with a high refractive index to increase the photon dispersion curve. By adding a prism, the photon wavenumber changes from:
to
Since the refractive index of the prism is constant, the resonance angle will depend on the presence or absence of absorbed molecules at the metal and dielectric interfaces on the sensing surface. The presence of absorbed molecules will result in a shift in the resonance angle. Therefore, we can monitor the presence or absence of adsorbed molecules or find out how fast the molecules are absorbed (kinetic analysis) from the SPR sensorgram (
Figure 1b). There are several parameters that we get from the SPR sensorgram, which are association rate constant (k
a), dissociation rate constant (k
d), equilibrium association constant (K
A) and equilibrium dissociation constant (K
D). All these quantities will be discussed in the next section.
In 1982, SPR technology was used for gas detection. Until now, SPR technology continues to be developed for wider applications such as food safety[
17], environmental monitoring[
18], medical diagnosis and detection[
19], drug discovery[
20] and others. Apart from that, another focus in the development of SPR biosensors is in transducer engineering to achieve sensitive sensors so that analytes can be detected down to the smallest possible concentration. By modifying the SPR chip using 2D materials such as graphene and MoS
2, various biomarkers with very small concentrations can be detected. Chiu et al modified the surface of a thin layer of gold on an SPR chip with graphene oxide to detect human chorionic gonadotropin (hCG) proteins[
21]. The detection limit that can be achieved by this sensor system is 0.065 nM and when compared with conventional SPR biosensors, modification with graphene oxide can increase the sensitivity of the biosensor up to 16 times higher. In 2021, Chiu et al also modified the SPR chip using MoS
2 to detect pregnancy-associated plasma protein-A2 (PAPP-A2)[
22]. The detection limit obtained was 0.05 pg/mL with a linear range of detection ranging from 0.1 to 1100 pg/mL.
3. Principle of SPR Kinetics
SPR biosensor is a very powerful tool to investigate phenomena that occur on the sensing surface. Surface phenomena such as molecular absorption cause changes in the refractive index and change the SPR angle. The SPR angle will shift to a higher angle when a molecule is adsorbed and will shift to a smaller angle when a molecule is released from the sensing surface. The response of the SPR biosensor due to a phenomenon on the sensing surface can be plotted any time in real time and the resulting curve is called a sensorgram curve. Kinetic parameters that describe bonding events can be obtained such as association, dissociation and equilibrium constant[
23].
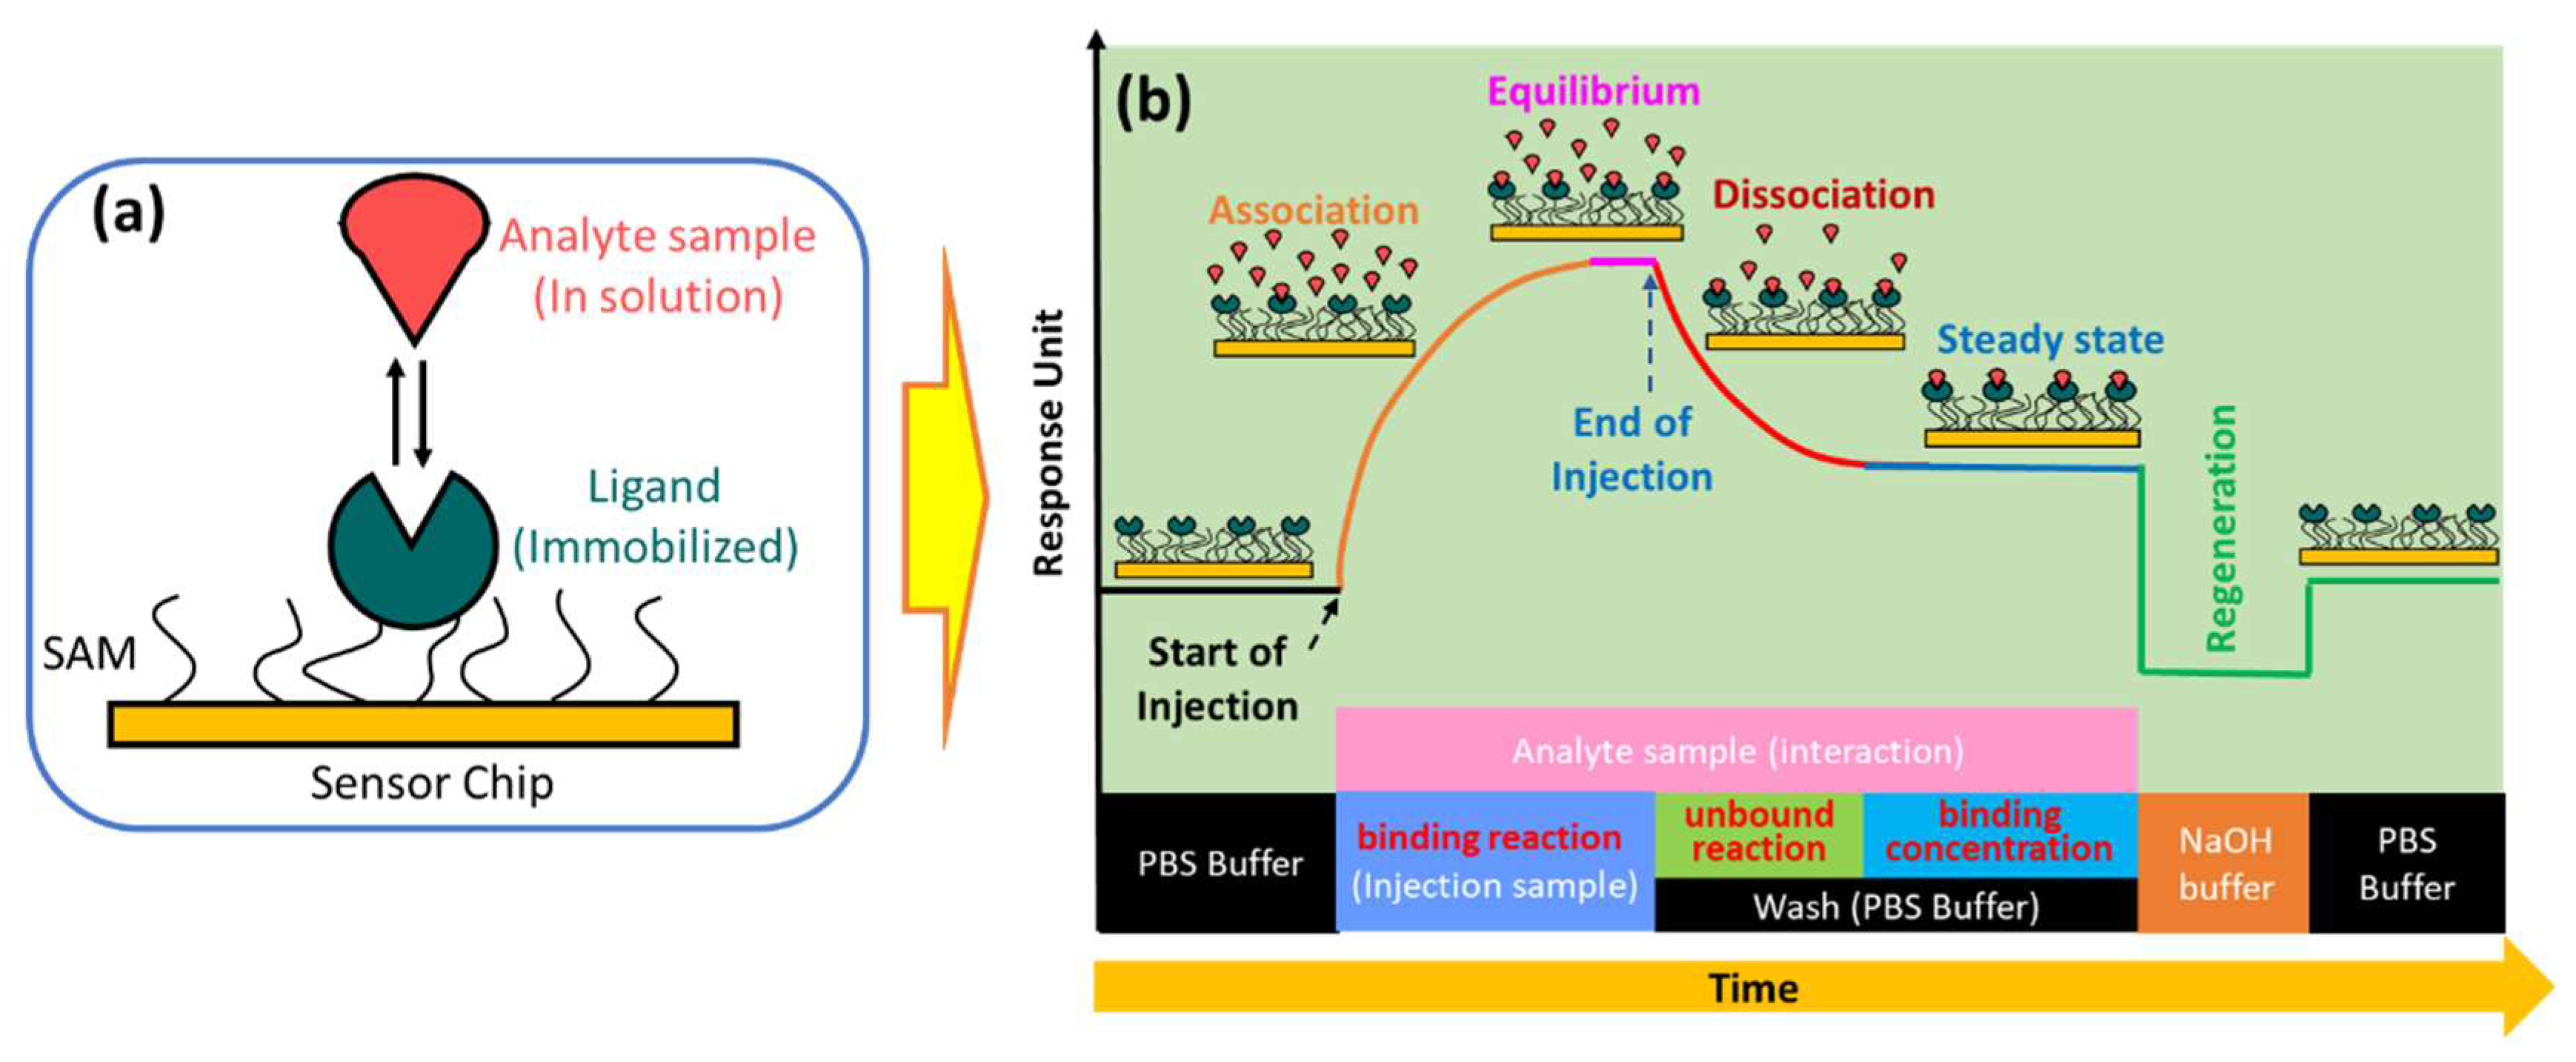
In the simplest SPR experiment, the experiment begins with immobilization of the active ligand to specifically recognize the molecule to be detected (
Figure 2a). Ligands can be immobilized on the sensor surface through a material which is usually called self-assembled monolayers (SAM)[
24]. The target molecule to be detected in this case is called the analyte. The buffer that flows over the sensor surface is called the running buffer[
25]. It is very important to condition the sensor surface with an appropriate buffer solution and the types of buffers that are widely used in SPR experiments are HEPES, Tris, or PBS[
26].
As shown in
Figure 2b, the capture of the analyte by the ligand begins with the conditioning of the running buffer signal. The signal on the sensorgram must form a stable baseline. External influences that cause signal fluctuations in the sensorgram, such as temperature, must be minimized as small as possible[
27]. Once a baseline is obtained, the solution containing the analyte can be injected. Ligands immobilized on the sensor surface will capture the analyte and this is indicated by an increase in the sensorgram signal. The magnitude of the sensorgram signal increase depends on the number of active ligands. After the active ligand pairs with the analyte, the sensorgram signal will be in an equilibrium state. This phase is called the association phase. In the same phase, non-specific interactions caused by the presence of impurities in the analyte solution are also very likely to occur. Therefore, washing is carried out using a running buffer. Remaining analytes and components that are not tightly bound will be removed from the sensor surface. This phase is called the dissociation phase. After this phase has been successfully completed, the sensorgram signal will show a steady state. Finally, the regeneration solution is injected on the sensing surface to break the bond between the analyte and the ligand. If the ligands are immobilized properly, all ligands will remain on the sensing surface and measurements for other analyte samples can be made using the same SPR chip[
23,
28,
29,
30]. SPR biosensors are usually equipped with two channels where the first channel is used to obtain a sensorgram signal from the analyte and the other channel is used to obtain a reference sensorgram signal. The actual signal is obtained after correction by subtracting the measured analyte signal minus the reference signal[
31,
32].
If the ligand on the sensing surface is symbolized by B bonded to the analyte symbolized by A, the bond between them produces a complex molecule symbolized by AB. The interaction can be written by the following equation[
30]:
The association rate constant is defined as the number of complex molecules formed per unit time at concentrations of A and B. This quantity is usually denoted by
and in some references it is denoted by
. Furthermore, the dissociation rate constant indicates the number of complex molecules that decay over time. This quantity is usually symbolized by
and in some references written as
. Equilibrium is reached when the rate of association and dissociation is equal. The association and dissociation equilibrium constants represent the affinity of interaction between ligand and analyte. The affinity of the molecule for association is expressed by equilibrium association constant (K
A). The last one is equilibrium dissociation constant (K
D). This quantity indicates the stability of the formation of the AB complex molecule where a high K
D value indicates the low stability of the formation or interaction of A and B molecules[
33].
Table 1 below shows the definitions, units, and typical ranges for
,
,
and
.
To produce a good sensorgram signal, there are a few tips to consider. Some of them are related to pH and type of buffer used, reactive group and molecular weight. The reactive group is important because it ensures covalent coupling of the ligands on the sensor surface. Ligands must contain reactive groups such as
or
to capture proteins and oligonucleotides. Molecular weight will affect the signal that will be generated where smaller molecules can change the refractive index to be lower than larger molecules. In many cases, researchers usually immobilize a molecule with a smaller molecular weight as a ligand to obtain a higher signal[
34]. The relationship between the molecular weight of the analyte (
), ligand (
), and the ligand response (
) with the binding capacity of the analyte is shown in the following equation[
35]:
The response to the binding capacity of the molecule is maximal only when the ligand on the sensing surface is fully active. However, in many experiments, some ligands on the sensing surface are not active so that the signal response obtained is smaller.
4. COVID-19 virus and its mutation
The SARS-CoV-2 virus is a member of the betacoronavirus genus and has a genome similar to that of SARS-CoV (about 80%) and middle east respiratory syndrome coronavirus (MERS) (about 50%)[
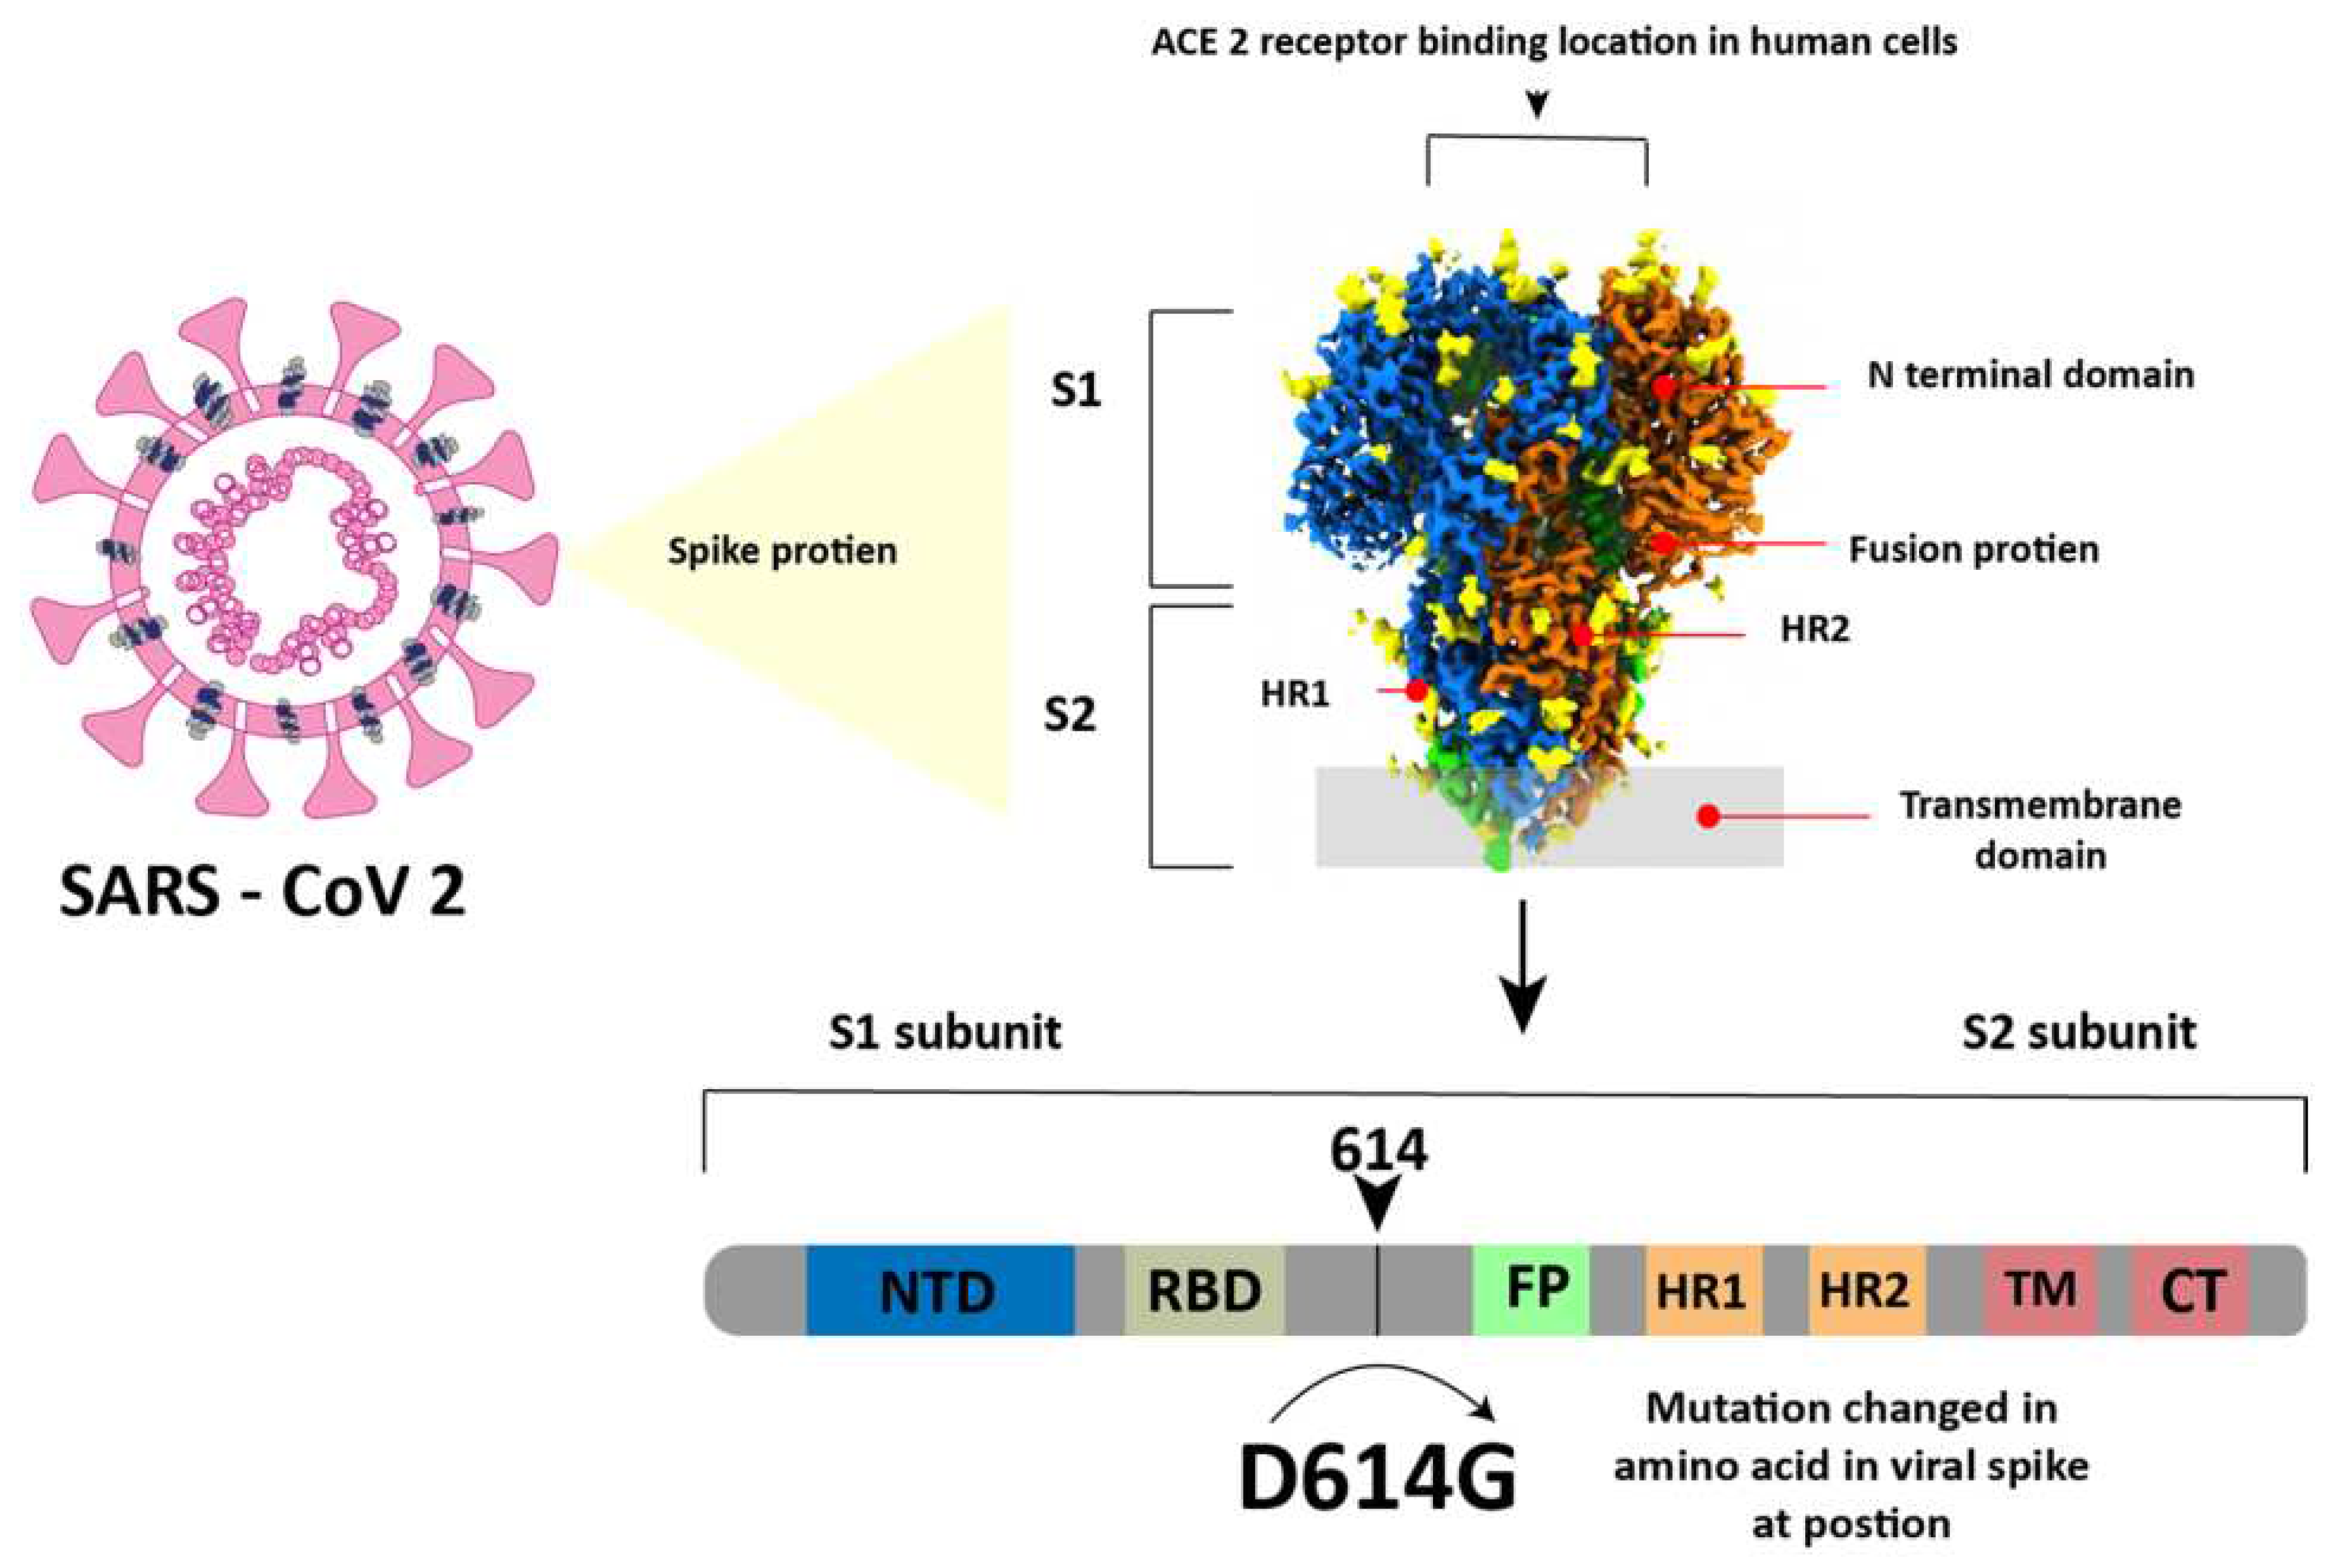
36]. In simple terms, this virus has a spherical shape with a diameter of 130 nm and is surrounded by a spike-like structure on its entire surface as shown in
Figure 3. This virus encodes sixteen non-structural proteins (NSPs) and four structural proteins which are the nucleocapsid protein (NP), spike glycoprotein (SP), membrane protein (MP), and envelope protein (EP)[
37]. The SP is composed of an N-terminal S1 subunit and a C-terminal S2 subunit located near the membrane[
38]. The S1 subunit contains RBD which can bind to ACE2 as a cellular receptor during virus entry and after that the Transmembrane domain in subunit S2 will help the virus enter the host cell[
37,
38].
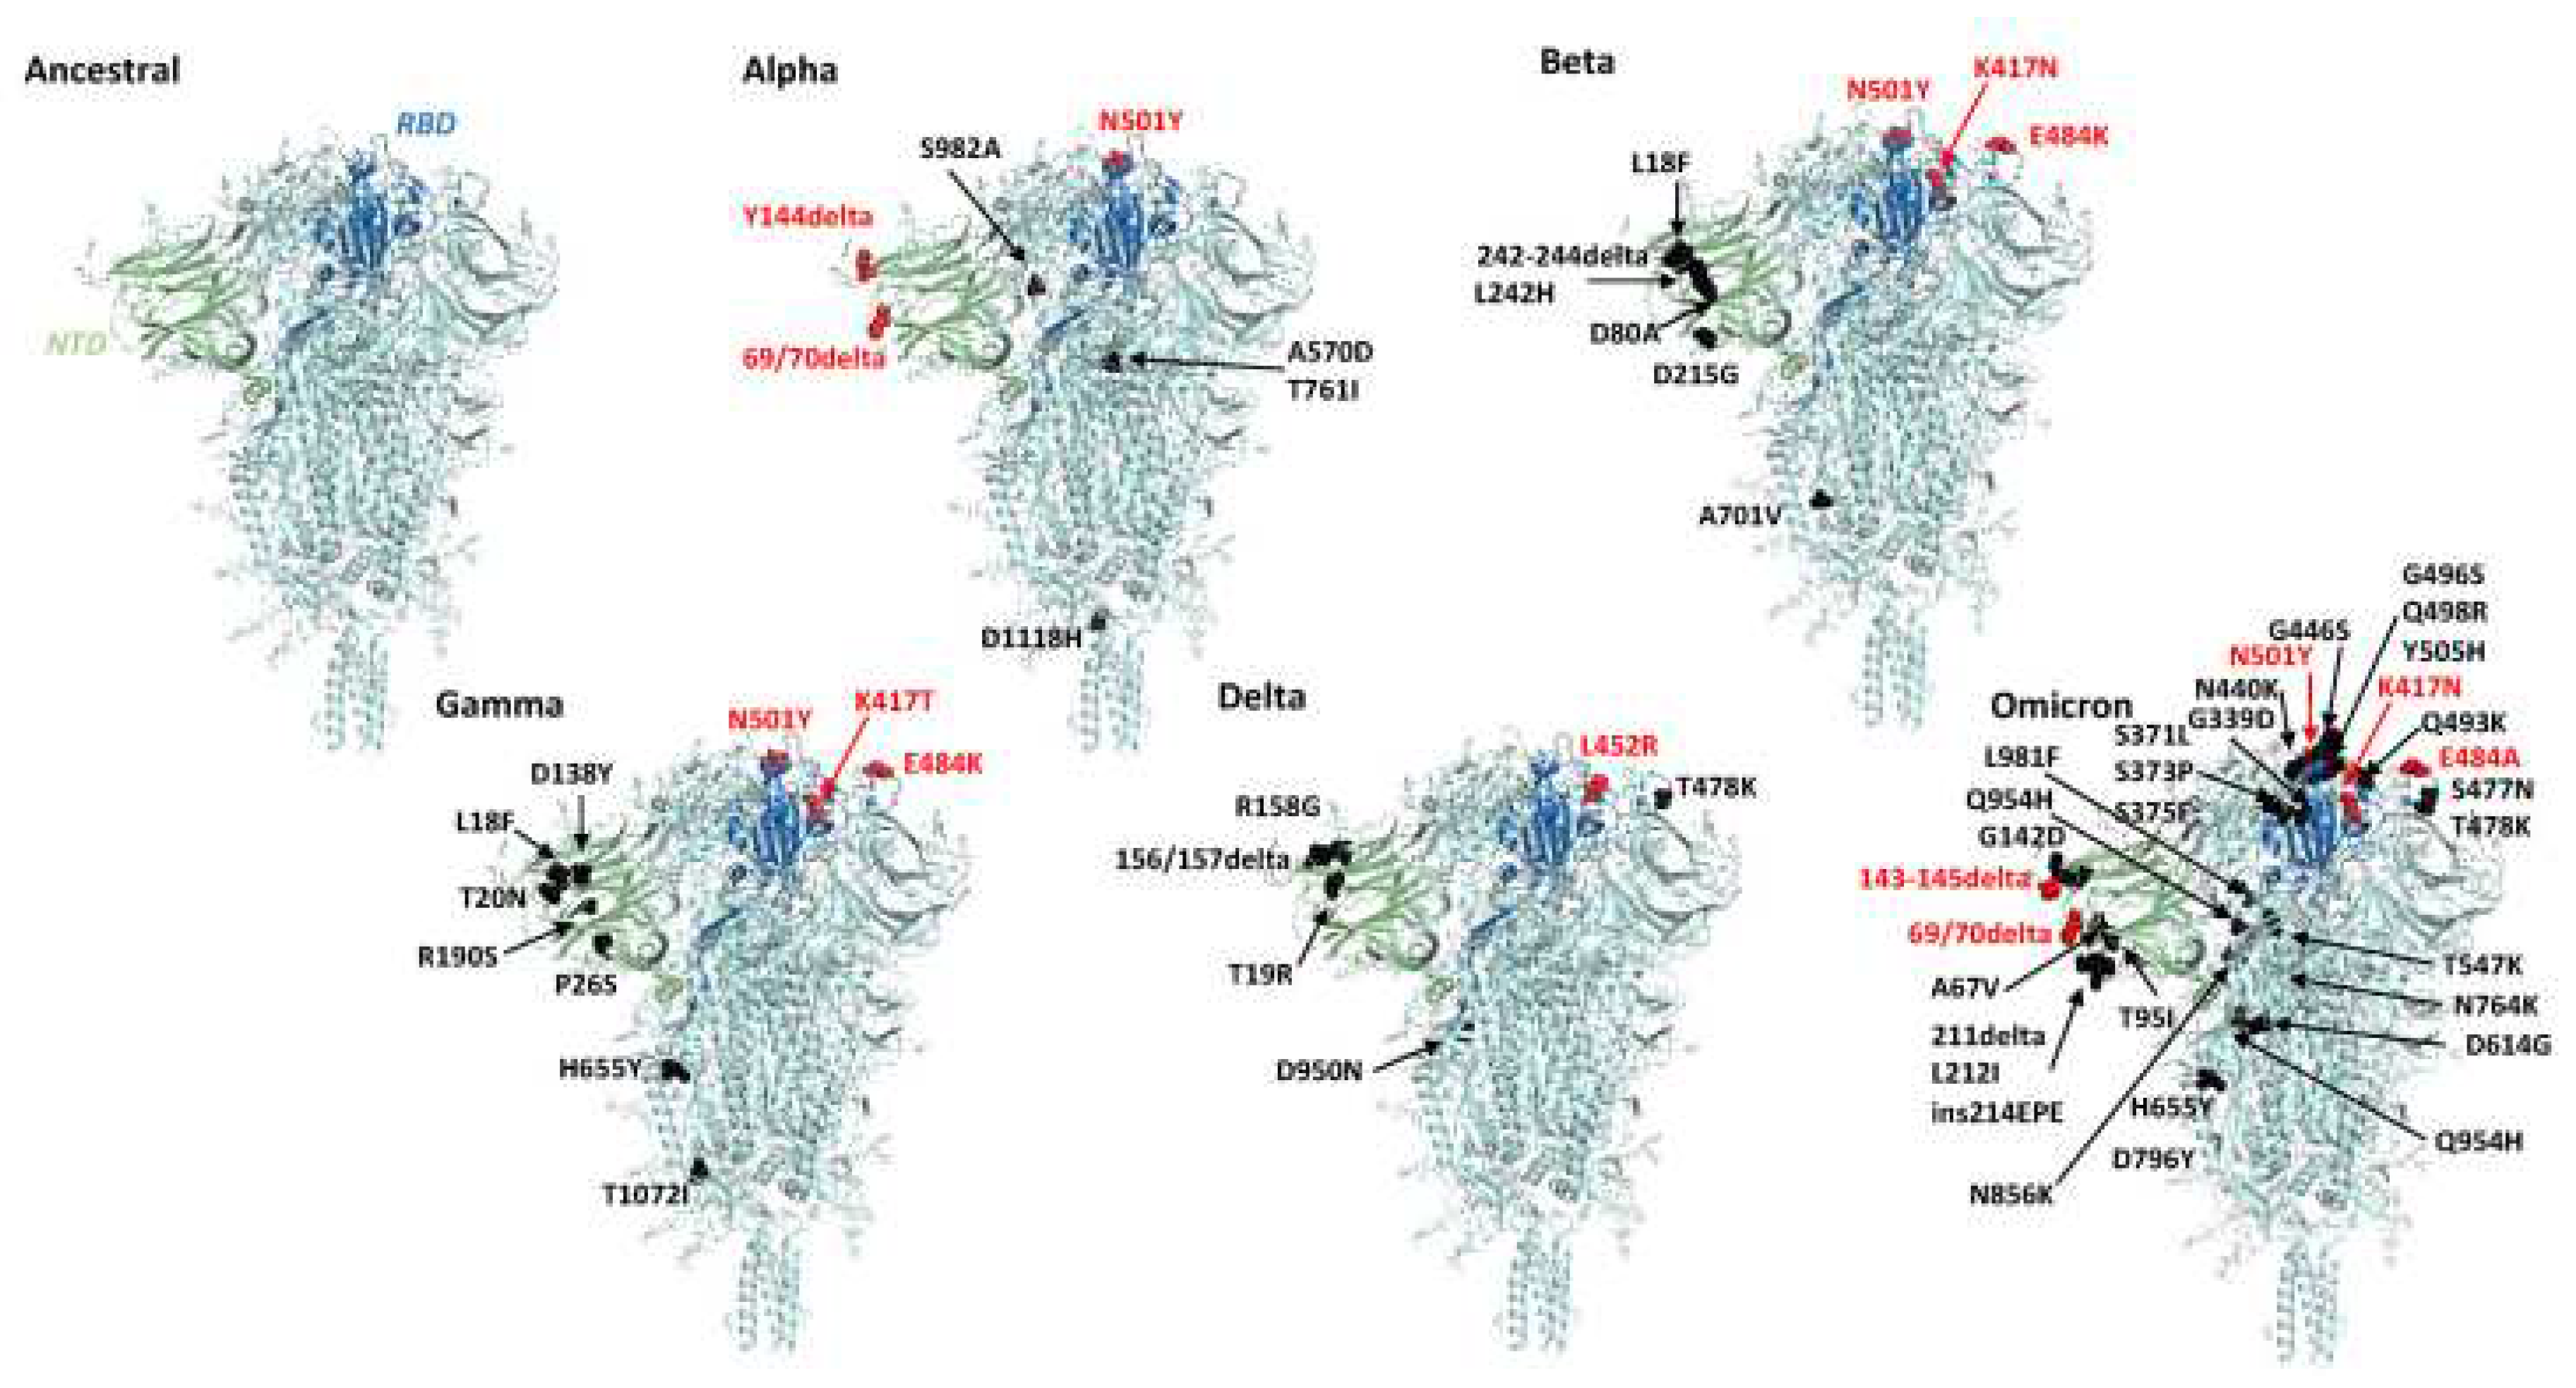
SARS-CoV-2 continues to evolve over time. These changes can affect the characteristics of the virus such as changes in the speed of its spread. Since it was first identified in December 2019 to November 2021, SARS-CoV2 has mutated 5 times with variants called alpha B.1.1.7 in September 2020, beta 1.351 in October 2020, gamma P.1 in November 2020, delta B.1.617.2 in December. 2020 and the last one is Omicron B.1.1.529 in November 2021. Before the discussion continues, it is very important to know the difference between mutation and variant to make the discussion clearer and to avoid misunderstanding. Mutations were defined as amino acid exchanges (nonsynonymous or missense) in spike glycoproteins, while other nucleotide changes (synonymous or non-missense) were defined as variants[
39,
40]. Because the mutations are associated with exchange in the spike glycoprotein,
Figure 4 below shows the location of the mutations in the spike glycoprotein of several variants namely alpha, beta, Gamma, Delta, and omicron and to see the differences clearly, we compared them with the Ancestral protein structure.
5. Application of SPR technology for SARS-CoV-2 detection and analysis of its binding
A number of papers have been published related to SPR technology. Some of them focus on studying the kinetic parameters of SARS-CoV-2 before and after they mutate and some other studies focus on modifying the transducer to produce a device that can detect SARS-CoV-2 at lower concentrations than conventional transducers. Regarding the detection mechanism, there are three different interactions that can be utilized as ligands and analytes. The first is to take advantage of the binding between the antibody and the spike protein. The second is the bond between spike protein and anti-spike protein and the last is probe RNA and single strand RNA virus[
42].
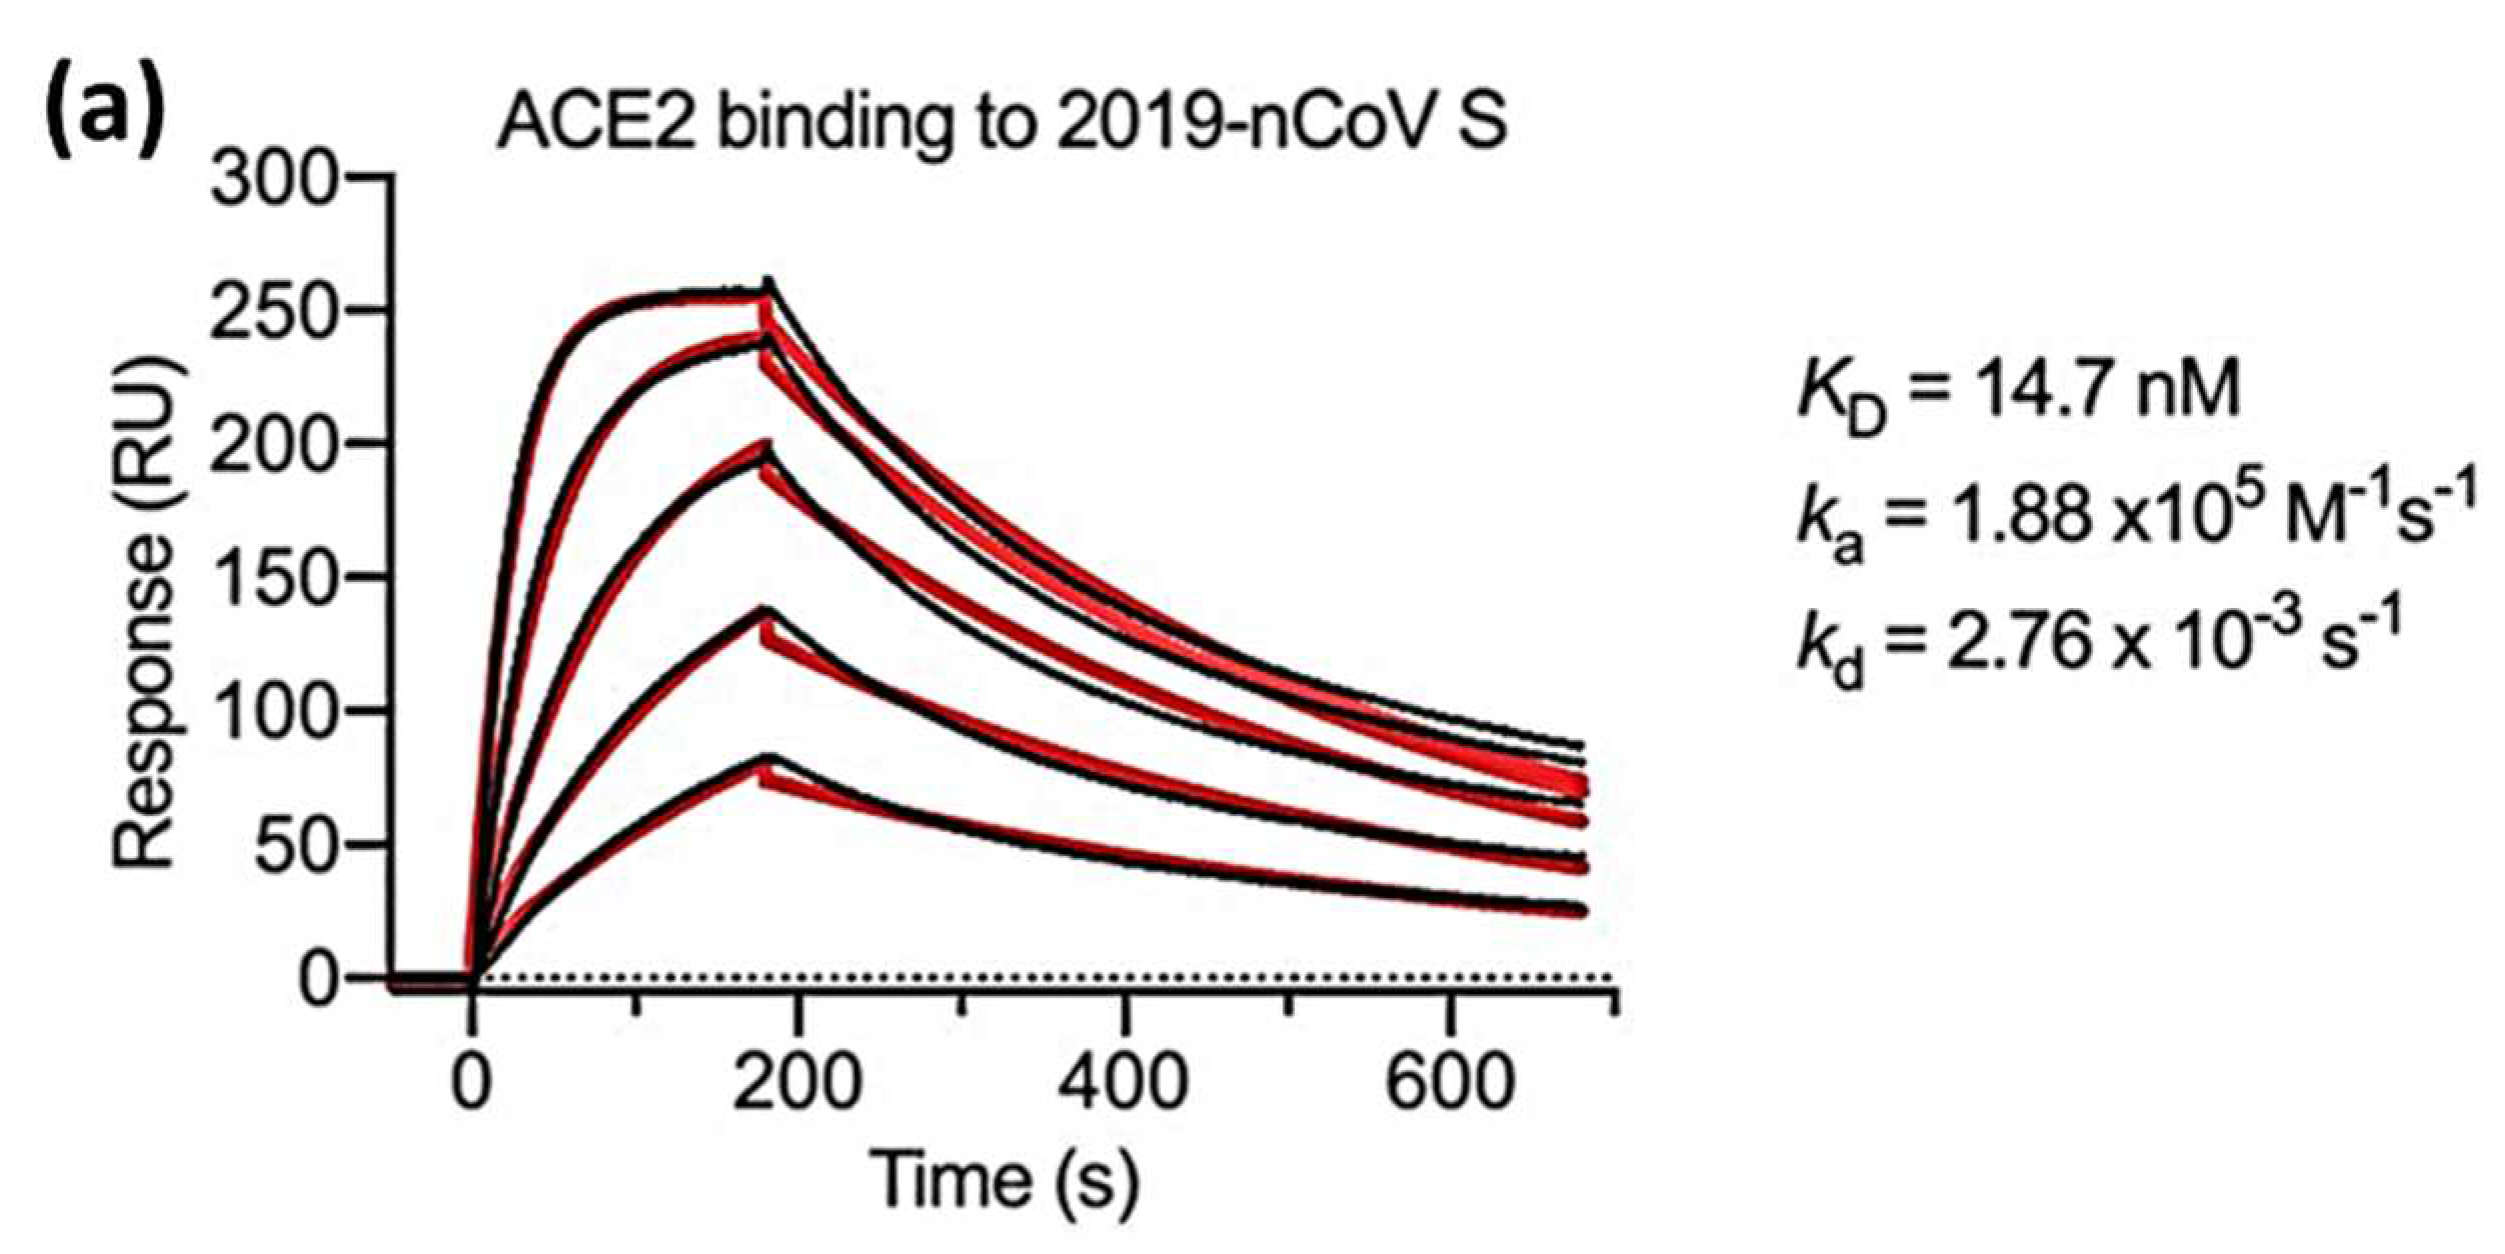
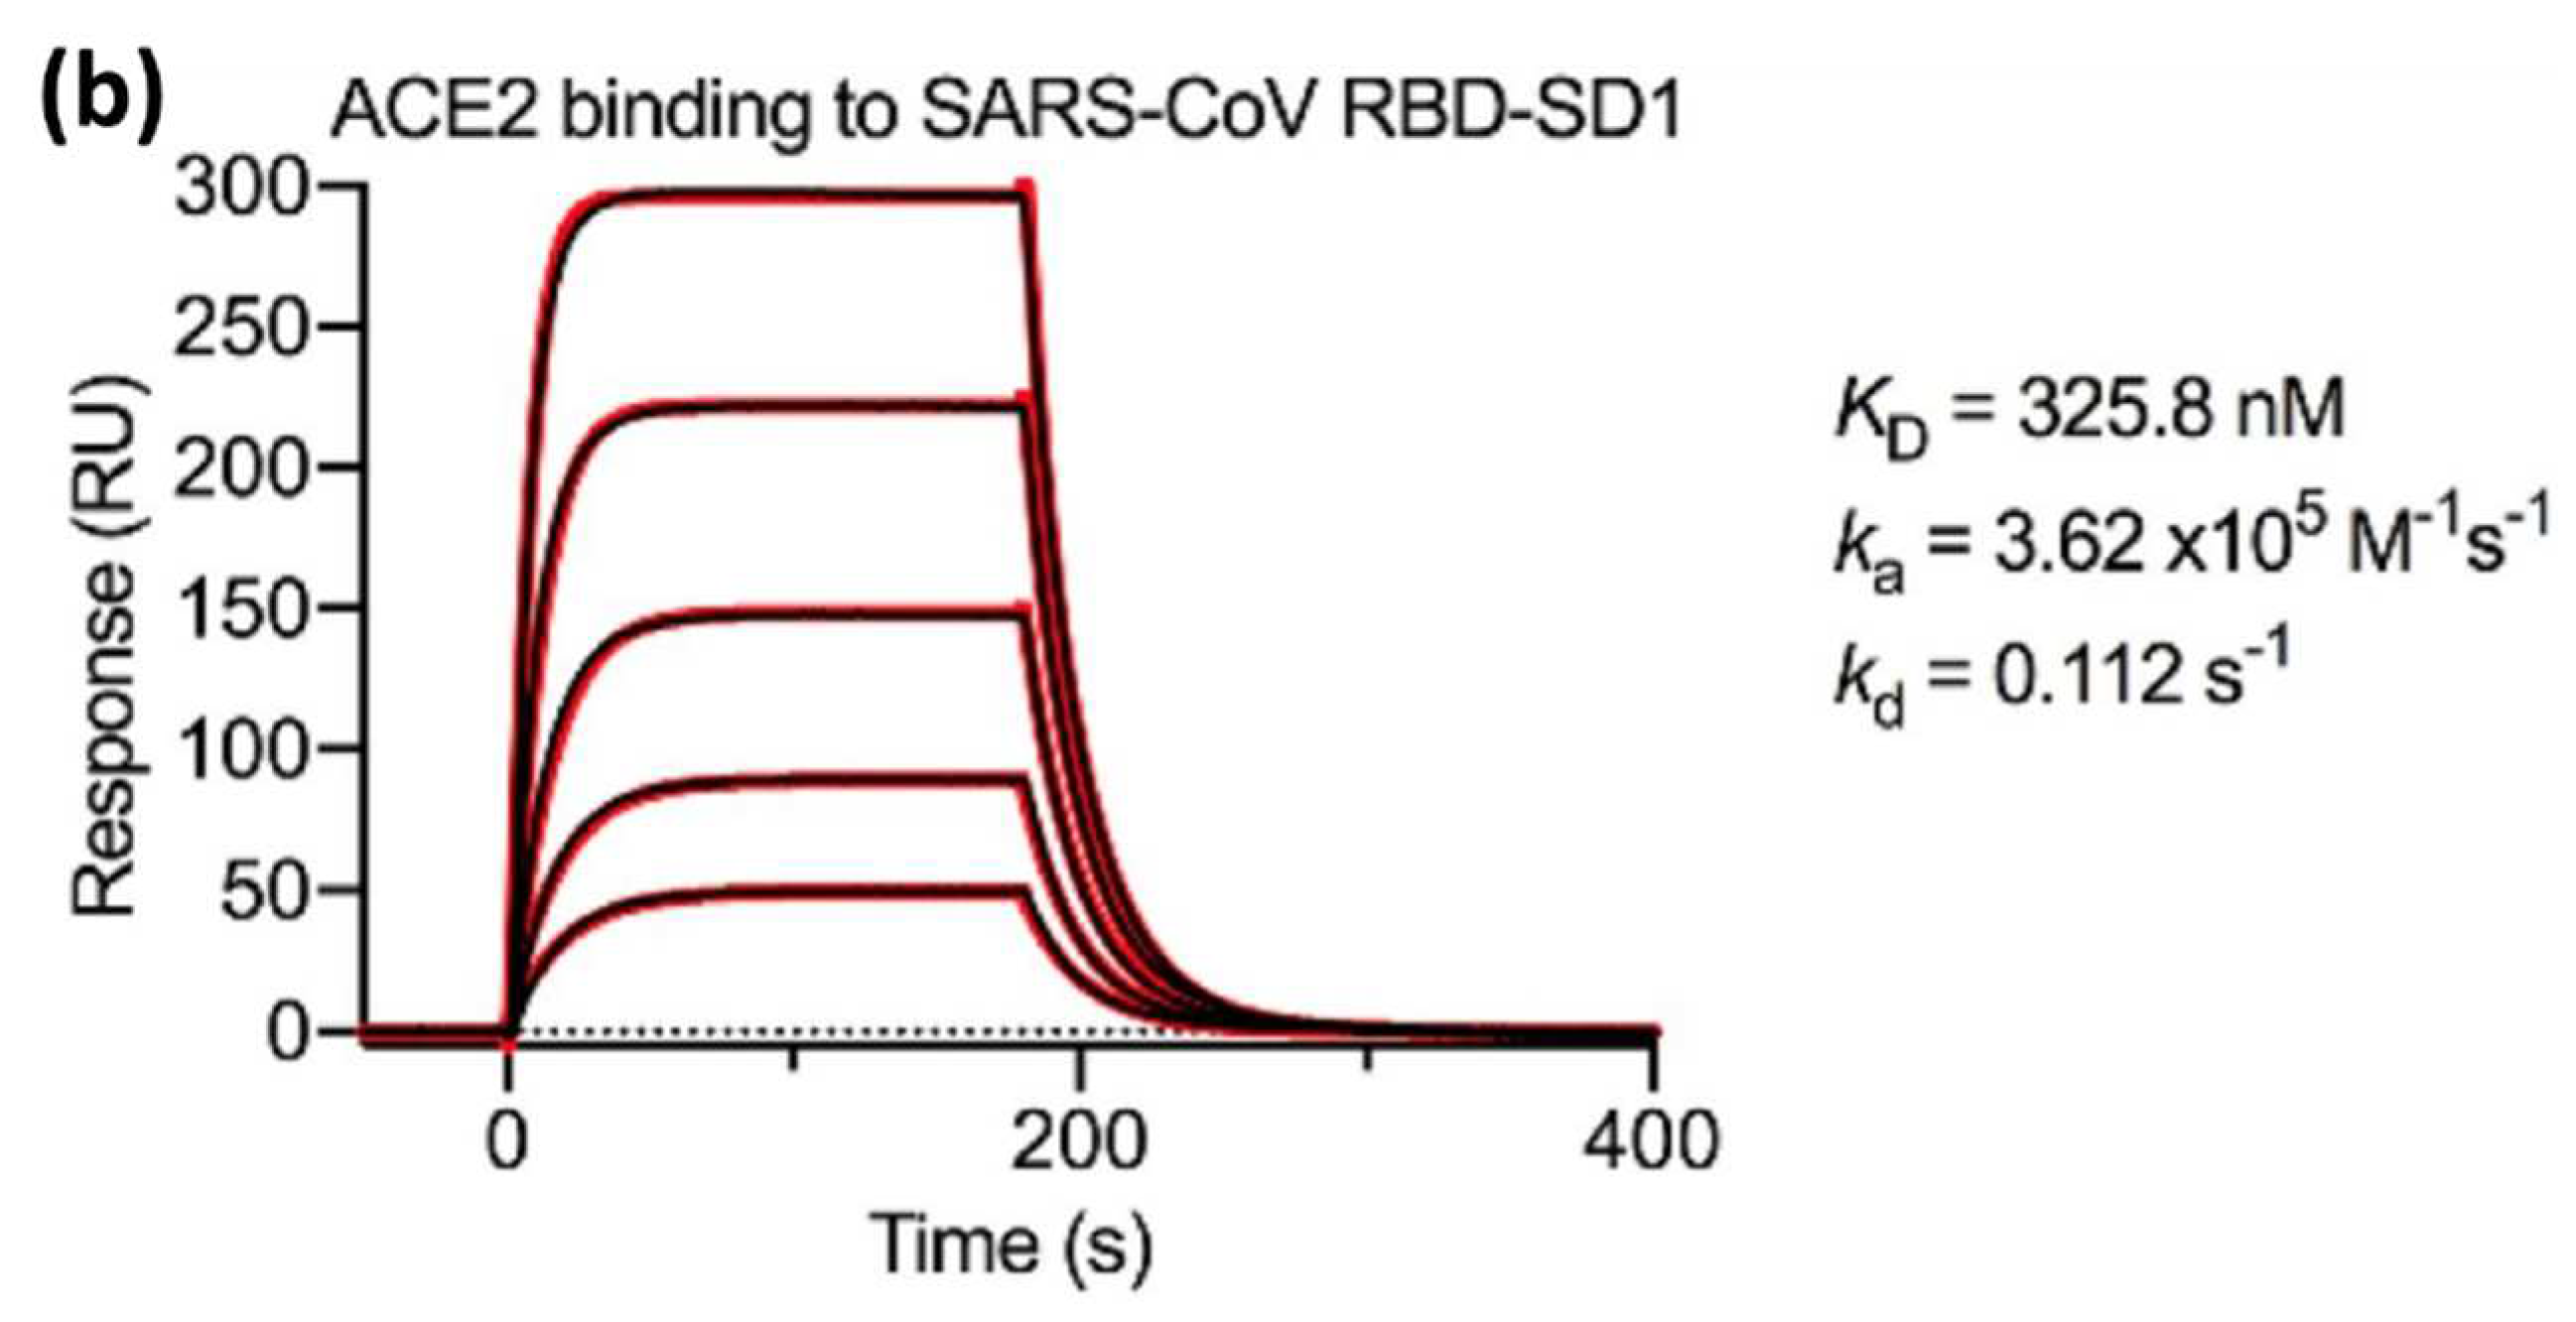
Wrapp et al in 2020 measured
,
and
using an SPR biosensor in which two viral strains namely the s-protein of the novel coronavirus (2019-nCoV) and the RBD sub-domain 1 (SD1) of SARS-CoV were compared. Serial dissolution of ACE2 was carried out to obtain a 1:1 binding stoichiometry. After ACE2 injection, a sensorgram for each concentration of ACE2 was obtained as shown in
Figure 5. The black line shows the real data while the red line shows the fitting data. If we compare the
value of 2019-nCoV S and SARS-CoV RBD-SD1, the
value of SARS-CoV RBD-SD1 shows a much higher value of 325.8 nM. As explained in the previous section in
Section 3, a high
value indicates low stability in the formation of bonds between the two molecules. Therefore, it can be concluded that 2019-nCoV S has a higher affinity which is 20 times higher than the binding between ACE2 and SARS-CoV RBD-SD1[
43].
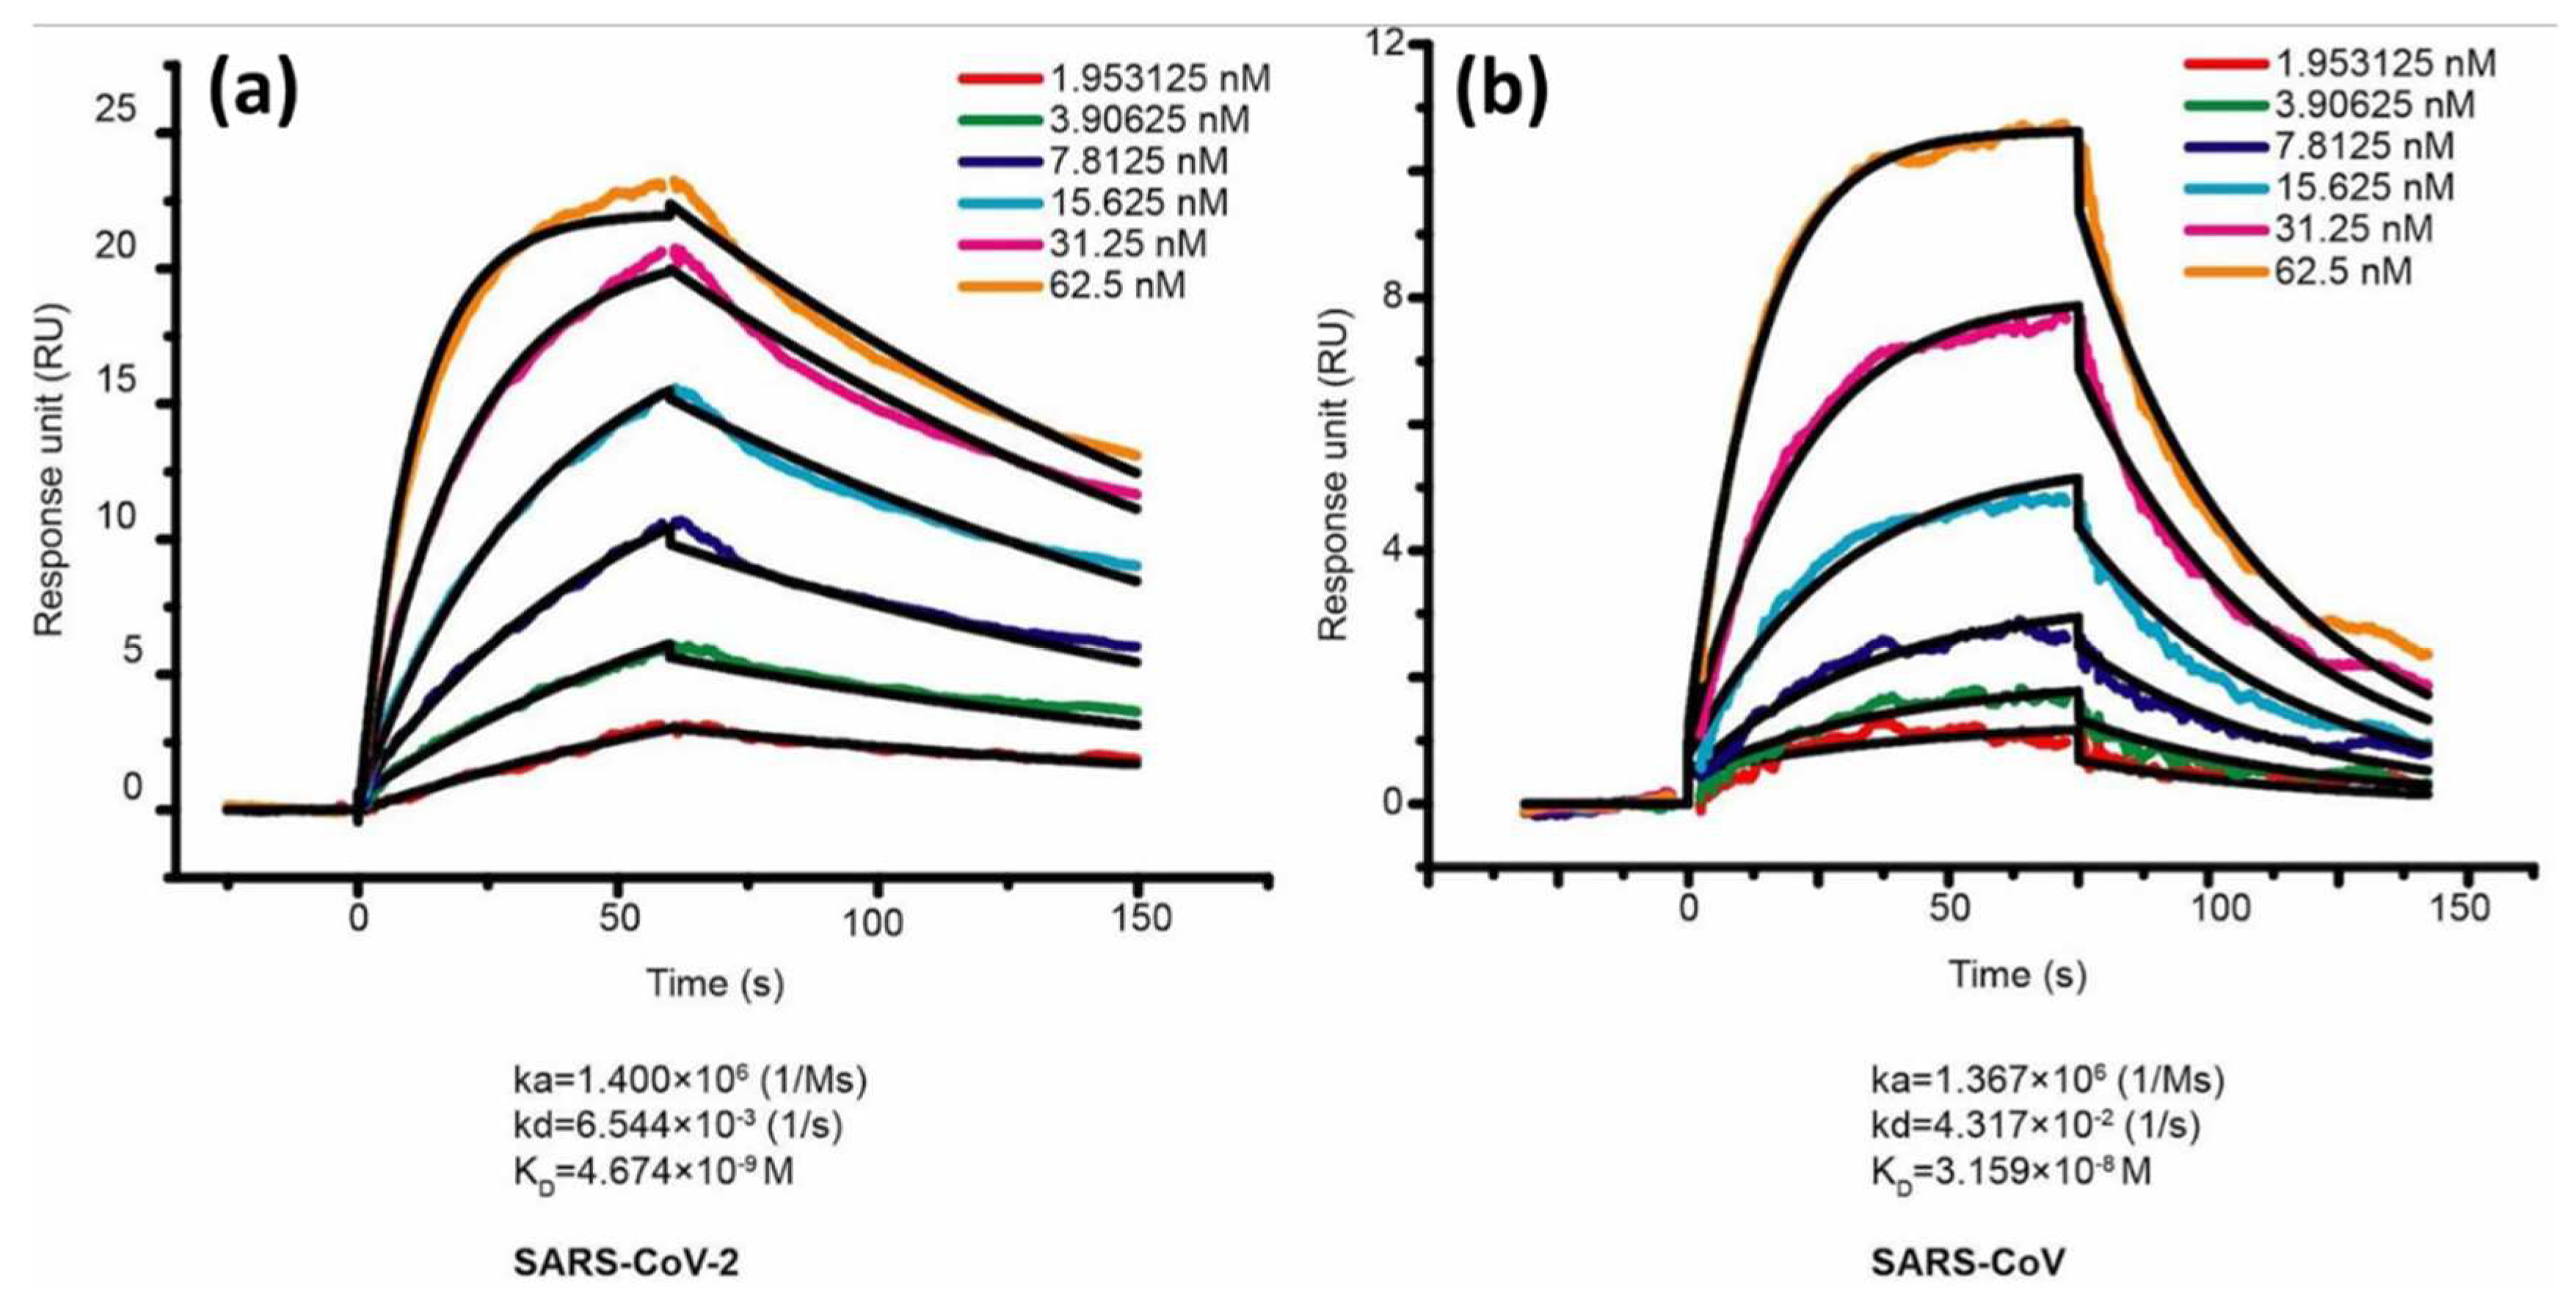
In the same year, Lan et al also compared the binding affinity between SARS-CoV-2 RBD and SARS-CoV RBD. ACE2 was employed as a ligand and immobilized on the CM5 chip sensor surface. The response generated after ACE2 injection is 500 response units. Serial dilution was carried out on samples of SARS-CoV-2 RBD and SARS-CoV RBD to obtain a 1:1 bonding model using Biocore evaluation software (GE Healthcare) and the concentrations obtained were in the range of 1.95 nM to 62.5 nM.
Figure 6 shows the sensorgram in this concentration range where the
values of SARS-CoV-2 RBD and SARS-CoV RBD were 4.7 nM and 31 nM, respectively [
36]. Walls et al in 2020 conducted a kinetic analysis between human ACE2 (hACE2) with SARS-CoV-2 S and SARS-CoV S using a biosensor based on biolayer interferometry (BLI). The results obtained showed that the
values of SARS-CoV-2 S and SARS-CoV S were 1.2 nM and 5 nM, respectively[
44]. If we compare some of the results above, the
values obtained show a slightly different magnitude, but both have similarities, namely the
of SARS-CoV-2 S is always smaller than that of SARS-CoV S. This indicates that the binding affinity is higher than that of SARS-CoV-2 S.
The SARS-CoV-2 variant that continues to mutate causes the infectivity of the virus to enter the body to be higher. Several studies have reported changes in the binding affinity of ACE2 after the virus mutates[
45]. Xue et al investigated 9 different mutations and compared them with wild type (WT). The mutants investigated were Q498W, Q498R, T500W, S477H, Y505W, T500R, N501V, Y489W, and Q493M. The
value of WT is 21.08 nM. Of the 9 mutants investigated, 3 of them had higher
values, namely T500W (
= 21.8 nM), N501V (
= 158.50 nM), and Y489W (
= 38.90 nM). Since most of the
decreased after mutation (the smallest
was Q493M (6.9 nM)), this indicates that the presence of viral mutations could strengthen the binding affinity[
46].
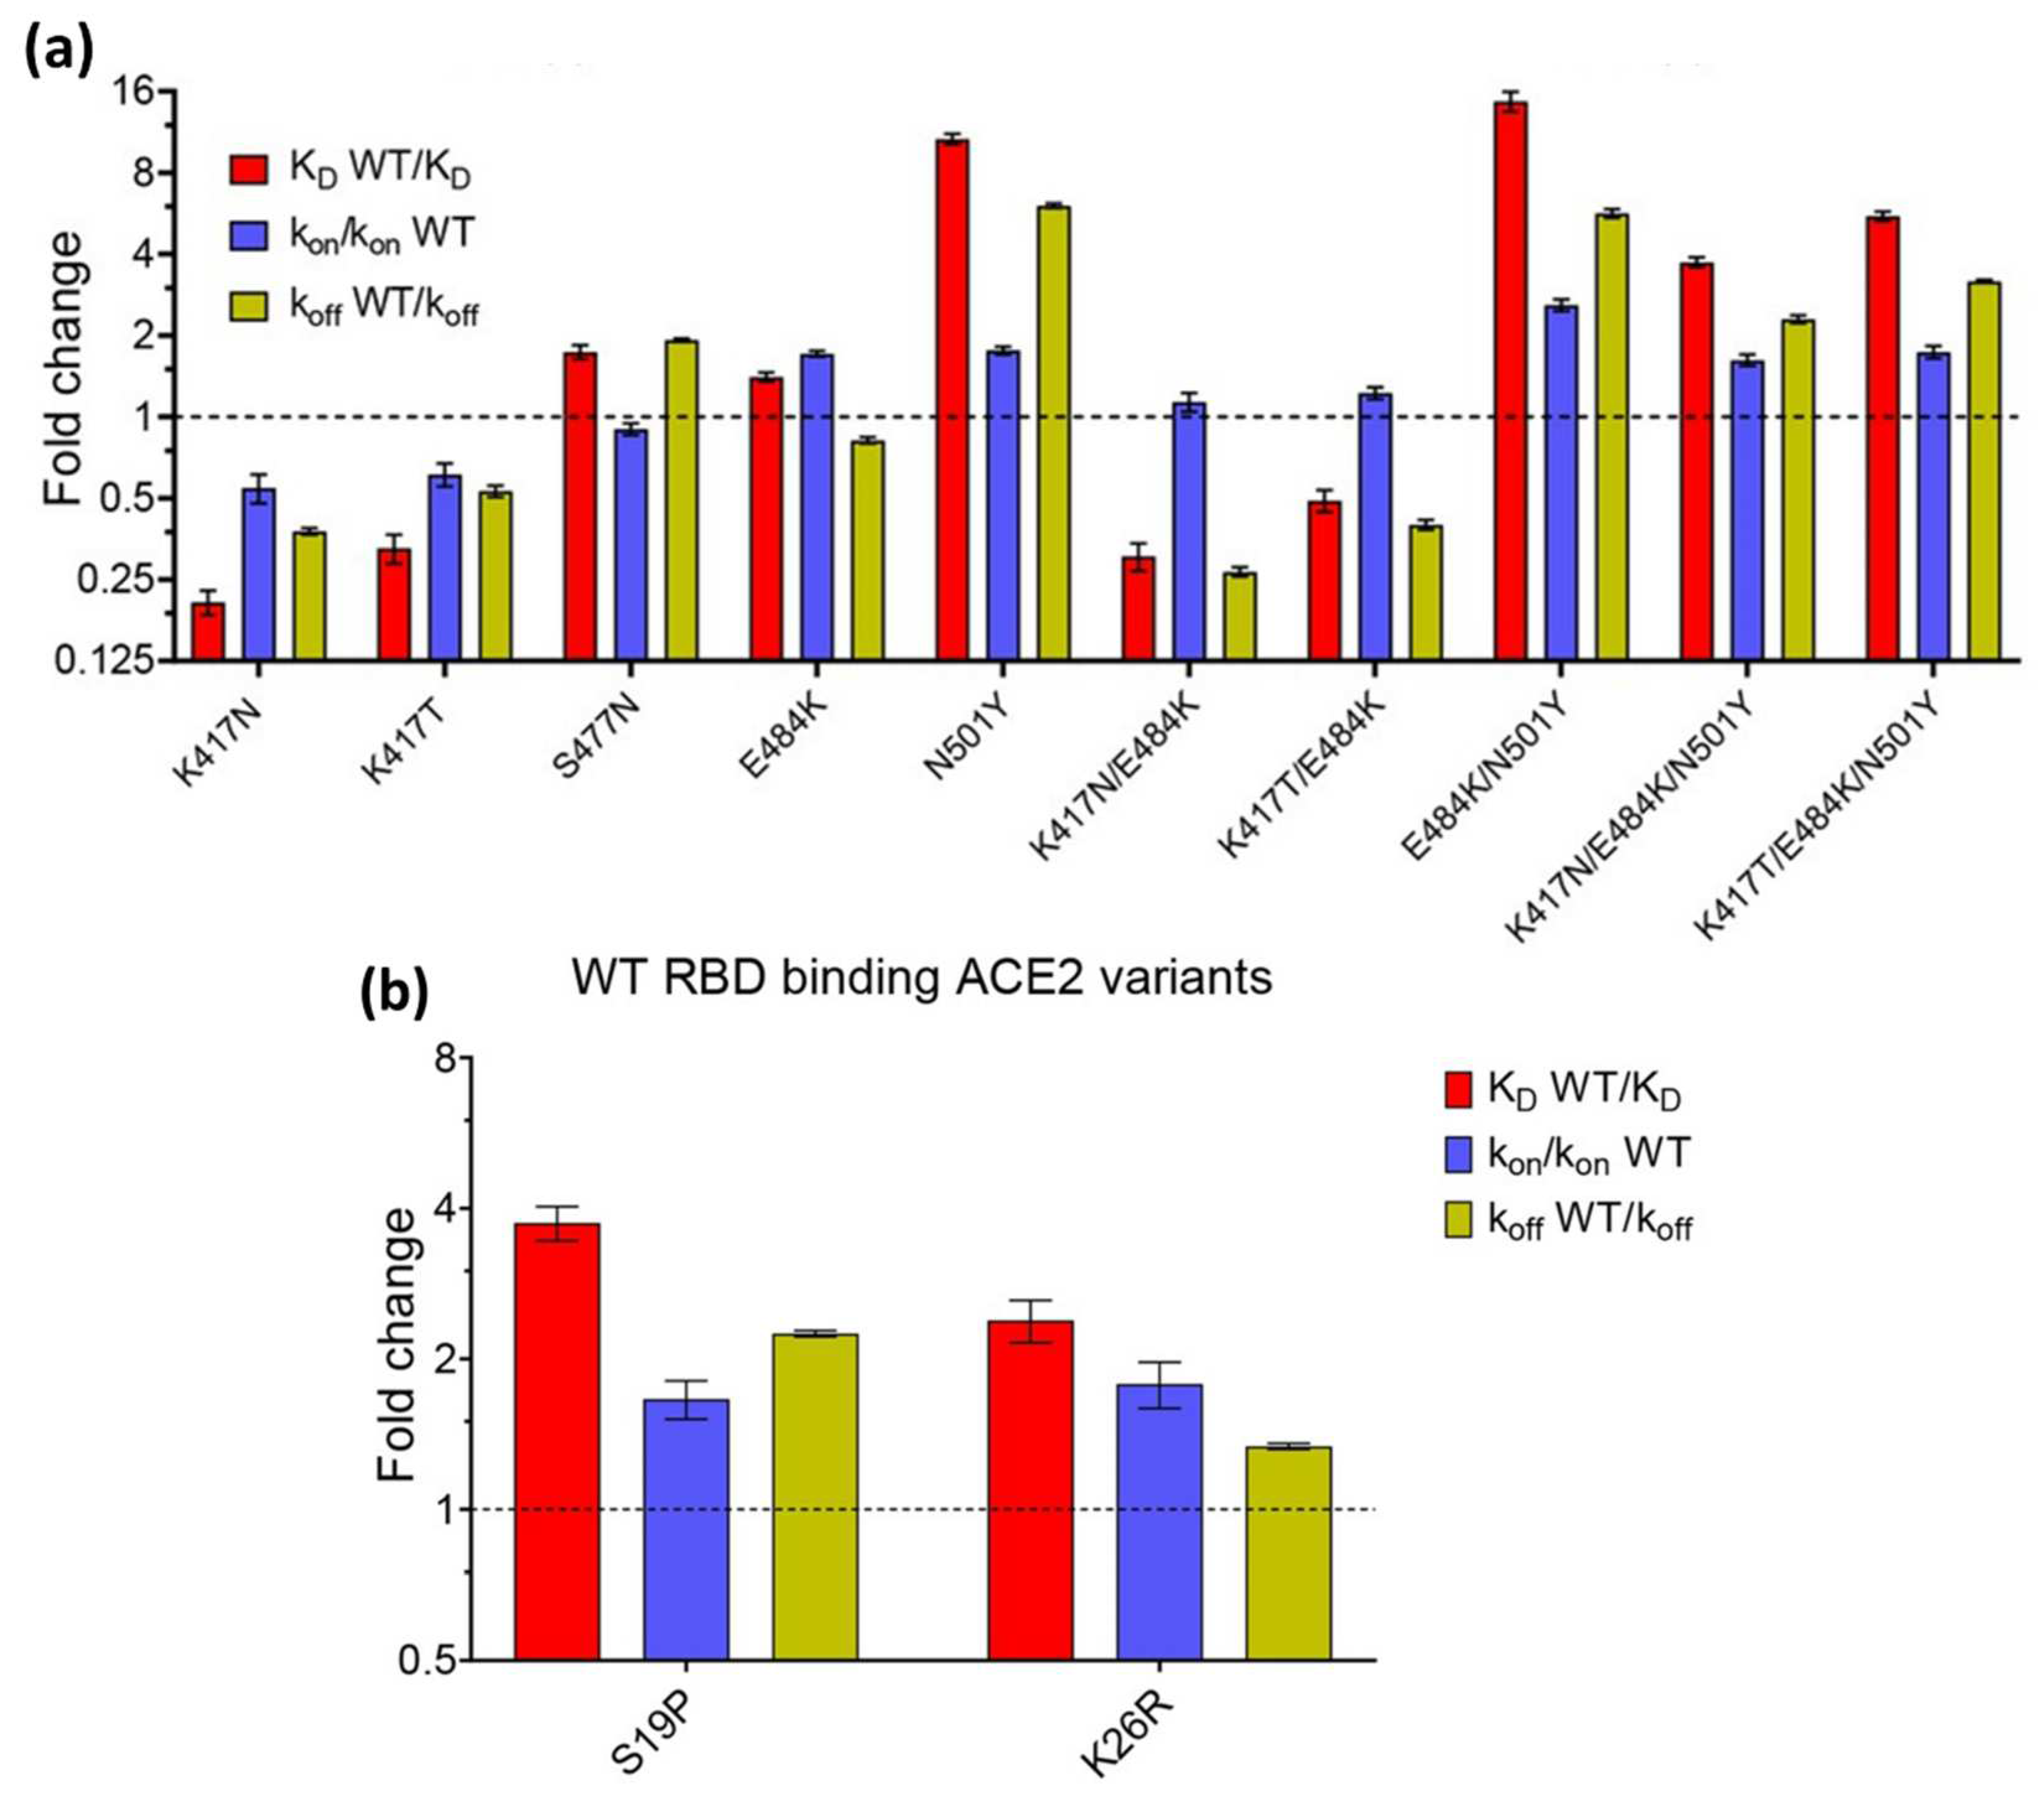
The effect of mutations was also investigated by Barton et al in 2021. They investigated the affinity and kinetics of 5 types of RBD mutations (K417N, K417T, N501Y, E484K, and S477N) and 2 ACE2 mutations (S19P and K26R). Then they compared it with WT RBD (In
Figure 7, the affinity and kinetics of WT RBD are shown by dashed lines). As shown in
Figure 7a, the RBD mutation increased binding to the single mutations (S477N, E484K, and N501Y). Of these three single mutation types, N501Y showed the highest increase which was 10 times higher than WT RBD. Not only single mutations, double (E484K/N501Y) and triple mutations (K417N/E484K/N501Y and K417T/E484K/N501Y) also have higher affinity than RBD WT. The same results also occur in ACE2 mutations. Of the 2 types of ACE2 mutations investigated, both increased the binding affinity between ACE2 and RBD[
47].
To date, several articles related to the effect of mutations on SARS-CoV2 have been published.
Table 2 shows a summary of several papers investigating kinetic parameters using SPR technology.
6. Conclusions
This study summarizes an in-depth kinetic analysis of SARS-CoV-2 mutations using SPR biosensors. Research results have shown that the SPR biosensor is a very effective tool for identifying and understanding molecular changes in the SARS-CoV-2 virus. The main advantage of SPR biosensors is seen in their ability to provide real-time monitoring of molecular interactions between viral mutations and receptors on the sensor surface. With this capability, deep insights into interaction dynamics can be explored in greater depth by analyzing rates of association and dissociation.
The high sensitivity of the SPR biosensor opens up opportunities for more efficient monitoring and rapid diagnosis. Its label-free characteristic can also reduce the complexity and disruption that may arise from using labels. The research results that have been obtained confirm that the SPR biosensor is a powerful tool for kinetic analysis of SARS-CoV-2 mutations. The implications of these findings include significant advances in the understanding of the biological response of the virus and provide a basis for the development of more sophisticated diagnostic and therapeutic strategies.
Author Contributions
D.T.N.: investigation, data curation, writing—original draft. N.-F.C.: conceptualization, methodology, data curation, supervision, data curation, investigation, resources, methodology. All the authors contributed equally and have given approval to the final version of the manuscript. All authors have read and agreed to the published version of the manuscript.
Funding
This study was funded by the Ministry of Science and Technology of the Republic of China (ROC), Taiwan, for financially supporting this research under Contract No. MOST 108-2221-E-003 -020 -MY3, MOST 109-2221-E-003-028-MY3. NSTC 112-2221-E-003 -016 -MY3.
Institutional Review Board Statement
Not applicable.
Informed Consent Statement
Not applicable.
Data Availability Statement
Not applicable.
Acknowledgments
This work is sponsored by “Higher Education Sprout Project” of National Taiwan Normal University and the Ministry of Education (MOE) in Taiwan.
Conflicts of Interest
The authors declare no conflict of interest.
References
- Ciotti, M.; Angeletti, S.; Minieri, M.; Giovannetti, M.; Benvenuto, D.; Pascarella, S.; Sagnelli, C.; Bianchi, M.; Bernardini, S.; Ciccozzi, M. COVID-19 Outbreak: An Overview. Chemotherapy 2020, 64, 215–223. [Google Scholar] [CrossRef]
- Hui, D.S.; I Azhar, E.; Madani, T.A.; Ntoumi, F.; Kock, R.; Dar, O.; Ippolito, G.; Mchugh, T.D.; Memish, Z.A.; Drosten, C.; et al. The Continuing 2019-NCoV Epidemic Threat of Novel Coronaviruses to Global Health — The Latest 2019 Novel Coronavirus Outbreak in Wuhan, China. Int. J. Infect. Dis. 2020, 91, 264–266. [Google Scholar] [CrossRef] [PubMed]
- Wu, J.T.; Leung, K.; Leung, G.M. Nowcasting and Forecasting the Potential Domestic and International Spread of the 2019-NCoV Outbreak Originating in Wuhan, China: A Modelling Study. Lancet 2020, 395, 689–697. [Google Scholar] [CrossRef] [PubMed]
- Dutta, D.; Naiyer, S.; Mansuri, S.; Soni, N.; Singh, V.; Bhat, K.H.; Singh, N.; Arora, G.; Mansuri, M.S. COVID-19 Diagnosis: A Comprehensive Review of the RT-QPCR Method for Detection of SARS-CoV-2. Diagnostics 2022, 12, 1–18. [Google Scholar] [CrossRef] [PubMed]
- Adnan, N.; Khandker, S.S.; Haq, A.; Chaity, M.A.; Khalek, A.; Nazim, A.Q.; Kaitsuka, T.; Tomizawa, K.; Mie, M.; Kobatake, E.; et al. Detection of SARS-CoV-2 by Antigen ELISA Test Is Highly Swayed by Viral Load and Sample Storage Condition. Expert Rev. Anti. Infect. Ther. 2022, 20, 473–481. [Google Scholar] [CrossRef] [PubMed]
- Hui, T.C.H.; Khoo, H.W.; Young, B.E.; Mohideen, S.M.H.; Lee, Y.S.; Lim, C.J.; Leo, Y.S.; Kaw, G.J.L.; Lye, D.C.; Tan, C.H. Clinical Utility of Chest Radiography for Severe COVID-19. Quant. Imaging Med. Surg. 2020, 10, 1540–1550. [Google Scholar] [CrossRef] [PubMed]
- Sharif, P.M.; Nematizadeh, M.; Saghazadeh, M.; Saghazadeh, A.; Rezaei, N. Computed Tomography Scan in COVID-19: A Systematic Review and Meta-Analysis. Polish J. Radiol. 2022, 87, e1–e23. [Google Scholar] [CrossRef] [PubMed]
- Oliveira, M.C.; Scharan, K.O.; Thomés, B.I.; Bernardelli, R.S.; Reese, F.B.; Kozesinski-Nakatani, A.C.; Martins, C.C.; Lobo, S.M.A.; Réa-Neto, Á. Diagnostic Accuracy of a Set of Clinical and Radiological Criteria for Screening of COVID-19 Using RT-PCR as the Reference Standard. BMC Pulm. Med. 2023, 23, 1–9. [Google Scholar] [CrossRef] [PubMed]
- Filchakova, O.; Dossym, D.; Ilyas, A.; Kuanysheva, T.; Abdizhamil, A.; Bukasov, R. Review of COVID-19 Testing and Diagnostic Methods. Talanta 2022, 244, 123409. [Google Scholar] [CrossRef]
- Mariani, S.; Minunni, M. Surface Plasmon Resonance Applications in Clinical Analysis. Anal. Bioanal. Chem. 2014, 406, 2303–2323. [Google Scholar] [CrossRef]
- Huo, Z.; Li, Y.; Chen, B.; Zhang, W.; Yang, X.; Yang, X. Recent Advances in Surface Plasmon Resonance Imaging and Biological Applications. Talanta 2023, 255. [Google Scholar] [CrossRef] [PubMed]
- Damborský, P.; Švitel, J.; Katrlík, J. Optical Biosensors. Essays Biochem. 2016, 60, 91–100. [Google Scholar] [CrossRef] [PubMed]
- Eddin, F.B.K.; Fen, Y.W. The Principle of Nanomaterials Based Surface Plasmon Resonance Biosensors and Its Potential for Dopamine Detection. Molecules 2020, 25, 1–20. [Google Scholar] [CrossRef] [PubMed]
- Sharma, A.K.; Jha, R.; Gupta, B.D. Fiber-Optic Sensors Based on Surface Plasmon Resonance: A Comprehensive Review. IEEE Sens. J. 2007, 7, 1118–1129. [Google Scholar] [CrossRef]
- Nurrohman, D.T.; Chiu, N.-F. Surface Plasmon Resonance Biosensor Performance Analysis on 2D Material Based on Graphene and Transition Metal Dichalcogenides. ECS J. Solid State Sci. Technol. 2020, 9. [Google Scholar] [CrossRef]
- Das, C.M.; Yang, F.; Yang, Z.; Liu, X.; Hoang, Q.T.; Xu, Z.; Neermunda, S.; Kong, K.V.; Ho, H.P.; Ju, L.A.; et al. Computational Modeling for Intelligent Surface Plasmon Resonance Sensor Design and Experimental Schemes for Real-Time Plasmonic Biosensing: A Review. Adv. Theory Simulations 2023, 6, 1–28. [Google Scholar] [CrossRef]
- D’Agata, R.; Bellassai, N.; Jungbluth, V.; Spoto, G. Recent Advances in Antifouling Materials for Surface Plasmon Resonance Biosensing in Clinical Diagnostics and Food Safety. Polymers (Basel). 2021, 13, 1–24. [Google Scholar] [CrossRef]
- Daniyal, W.M.E.M.M.; Fen, Y.W.; Fauzi, N.I.M.; Hashim, H.S.; Ramdzan, N.S.M.; Omar, N.A.S. Recent Advances in Surface Plasmon Resonance Optical Sensors for Potential Application in Environmental Monitoring. Sensors Mater. 2020, 32, 4191–4200. [Google Scholar] [CrossRef]
- Nurrohman, D.T.; Wang, Y.-H.; Chiu, N.-F. Exploring Graphene and MoS2 Chips Based Surface Plasmon Resonance Biosensors for Diagnostic Applications. Front. Chem. 2020, 8. [Google Scholar] [CrossRef]
- Pandey, P.S.; Raghuwanshi, S.K.; Shadab, A.; Ansari, M.T.I.; Tiwari, U.K.; Kumar, S. SPR Based Biosensing Chip for COVID-19 Diagnosis - A Review. IEEE Sens. J. 2022, 22, 13800–13810. [Google Scholar] [CrossRef]
- Chiu, N.F.; Kuo, C.T.; Lin, T.L.; Chang, C.C.; Chen, C.Y. Ultra-High Sensitivity of the Non-Immunological Affinity of Graphene Oxide-Peptide-Based Surface Plasmon Resonance Biosensors to Detect Human Chorionic Gonadotropin. Biosens. Bioelectron. 2017, 94, 351–357. [Google Scholar] [CrossRef] [PubMed]
- Chiu, N.F.; Tai, M.J.; Nurrohman, D.T.; Lin, T.L.; Wang, Y.H.; Chen, C.Y. Immunoassay-Amplified Responses Using a Functionalized Mos2-Based Spr Biosensor to Detect Papp-A2 in Maternal Serum Samples to Screen for Fetal down’s Syndrome. Int. J. Nanomedicine 2021, 16, 2715–2733. [Google Scholar] [CrossRef] [PubMed]
- Murali, S.; Rustandi, R.R.; Zheng, X.; Payne, A.; Shang, L. Applications of Surface Plasmon Resonance and Biolayer Interferometry for Virus–Ligand Binding. Viruses 2022, 14. [Google Scholar] [CrossRef] [PubMed]
- Kausaite-Minkstimiene, A.; Popov, A.; Ramanaviciene, A. Ultra-Sensitive SPR Immunosensors: A Comprehensive Review of Labeling and Interface Modification Using Nanostructures. TrAC - Trends Anal. Chem. 2024, 170, 117468. [Google Scholar] [CrossRef]
- Vachali, P.P.; Li, B.; Bartschi, A.; Bernstein, P.S. Surface Plasmon Resonance (SPR)-Based Biosensor Technology for the Quantitative Characterization of Protein-Carotenoid Interactions. Arch. Biochem. Biophys. 2015, 572, 66–72. [Google Scholar] [CrossRef] [PubMed]
- Sparks, R.P.; Jenkins, J.L.; Fratti, R. Use of Surface Plasmon Resonance (SPR) to Determine Binding Affinities and Kinetic Parameters Between Components Important in Fusion Machinery. In; Fratti, R., Ed.; Methods in Molecular Biology; Springer New York: New York, NY, 2019; Vol. 1860, pp. 199–210. ISBN 978-1-4939-8759-7.
- Dorozinska, H. V.; Turu, T.A.; Markina, O.M.; Dorozinsky, G. V.; Maslov, V.P. Influence of Temperature on the Measuring Accuracy of Devices Based on Surface Plasmon Resonance Phenomenon. Mod. Instrum. 2018, 07, 1–10. [Google Scholar] [CrossRef]
- Ritzefeld, M.; Sewald, N. Real-Time Analysis of Specific Protein-DNA Interactions with Surface Plasmon Resonance. J. Amino Acids 2012, 2012, 1–19. [Google Scholar] [CrossRef] [PubMed]
- Hahnefeld, C.; Drewianka, S.; Herberg, F.W. Determination of Kinetic Data Using Surface Plasmon Resonance Biosensors. In Molecular Diagnosis of Infectious Diseases; Humana Press: New Jersey, 2004; Vol. 94, pp. 299–320.
- Chiu, N.F.; Huang, T.Y.; Lai, H.C.; Liu, K.C. Graphene Oxide-Based SPR Biosensor Chip for Immunoassay Applications. Nanoscale Res. Lett. 2014, 9, 1–7. [Google Scholar] [CrossRef] [PubMed]
- Trabucchi, A.; Iacono, R.F.; Guerra, L.L.; Faccinetti, N.I.; Krochik, A.G.; Arriazu, M.C.; Poskus, E.; Valdez, S.N. Characterization of Insulin Antibodies by Surface Plasmon Resonance in Two Clinical Cases: Brittle Diabetes and Insulin Autoimmune Syndrome. PLoS One 2013, 8. [Google Scholar] [CrossRef]
- Hao, Y.; Yang, H.S.; Karbaschi, M.; Racine-Brzostek, S.E.; Li, P.; Zuk, R.; Yang, Y.J.; Klasse, P.J.; Shi, Y.; Zhao, Z. Measurements of SARS-CoV-2 Antibody Dissociation Rate Constant by Chaotrope-Free Biolayer Interferometry in Serum of COVID-19 Convalescent Patients. Biosens. Bioelectron. 2022, 209, 114237. [Google Scholar] [CrossRef]
- Maros, H.; Juniar, S. Handbook of Surface Plasmon Resonance; Schasfoort, R.B.M., Ed.; Royal Society of Chemistry: Cambridge, 2017. ISBN 978-1-78262-730-2.
- Ezzati Nazhad Dolatabadi, J.; de la Guardia, M. Tips on Ligand Immobilization and Kinetic Study Using Surface Plasmon Resonance. BioImpacts 2016, 6, 117–118. [Google Scholar] [CrossRef] [PubMed]
- Biacore Sensor Surface Handbook; 2008; Vol. BR-1005-71.
- Lan, J.; Ge, J.; Yu, J.; Shan, S.; Zhou, H.; Fan, S.; Zhang, Q.; Shi, X.; Wang, Q.; Zhang, L.; et al. Structure of the SARS-CoV-2 Spike Receptor-Binding Domain Bound to the ACE2 Receptor. Nature 2020, 581, 215–220. [Google Scholar] [CrossRef] [PubMed]
- Rahman, M.M. Progress in Electrochemical Biosensing of SARS-CoV-2 Virus for COVID-19 Management. Chemosensors 2022, 10. [Google Scholar] [CrossRef]
- Taha, B.A.; Al-Jubouri, Q.; Al Mashhadany, Y.; Zan, M.S.D. Bin; Bakar, A.A.A.; Fadhel, M.M.; Arsad, N. Photonics Enabled Intelligence System to Identify SARS-CoV 2 Mutations. Appl. Microbiol. Biotechnol. 2022, 106, 3321–3336. [Google Scholar] [CrossRef] [PubMed]
- Van Vo, G.; Bagyinszky, E.; An, S.S.A. COVID-19 Genetic Variants and Their Potential Impact in Vaccine Development. Microorganisms 2022, 10. [Google Scholar] [CrossRef] [PubMed]
- Mohammadi, M.; Shayestehpour, M.; Mirzaei, H. The Impact of Spike Mutated Variants of SARS-CoV2 [Alpha, Beta, Gamma, Delta, and Lambda] on the Efficacy of Subunit Recombinant Vaccines. Brazilian J. Infect. Dis. 2021, 25, 101606. [Google Scholar] [CrossRef] [PubMed]
- McLean, G.; Kamil, J.; Lee, B.; Moore, P.; Schulz, T.F.; Muik, A.; Sahin, U.; Türeci, Ö.; Pather, S. The Impact of Evolving SARS-CoV-2 Mutations and Variants on COVID-19 Vaccines. MBio 2022, 13. [Google Scholar] [CrossRef]
- Akib, T.B.A.; Mou, S.F.; Rahman, M.M.; Rana, M.M.; Islam, M.R.; Mehedi, I.M.; Parvez Mahmud, M.A.; Kouzani, A.Z. Design and Numerical Analysis of a Graphene-Coated Spr Biosensor for Rapid Detection of the Novel Coronavirus. Sensors 2021, 21, 1–21. [Google Scholar] [CrossRef] [PubMed]
- Wrapp, D.; Wang, N.; Corbett, K.S.; Goldsmith, J.A.; Hsieh, C.L.; Abiona, O.; Graham, B.S.; McLellan, J.S. Cryo-EM Structure of the 2019-NCoV Spike in the Prefusion Conformation. Science (80-. ). 2020, 367, 1260–1263. [Google Scholar] [CrossRef]
- Glycoprotein, C.-S.; Walls, A.C.; Park, Y.; Tortorici, M.A.; Wall, A.; Mcguire, A.T.; Veesler, D.; Walls, A.C.; Park, Y.; Tortorici, M.A.; et al. Structure, Function, and Antigenicity of the SARS-CoV-2 Spike Glycoprotein. Cell 2020, 181, 281–292.e6. [Google Scholar]
- Zhang, L.; Jackson, C.B.; Mou, H.; Ojha, A.; Peng, H.; Quinlan, B.D.; Rangarajan, E.S.; Pan, A.; Vanderheiden, A.; Suthar, M.S.; et al. SARS-CoV-2 Spike-Protein D614G Mutation Increases Virion Spike Density and Infectivity. Nat. Commun. 2020, 11, 1–9. [Google Scholar] [CrossRef] [PubMed]
- Xue, T.; Wu, W.; Guo, N.; Wu, C.; Huang, J.; Lai, L.; Liu, H.; Li, Y.; Wang, T.; Wang, Y. Single Point Mutations Can Potentially Enhance Infectivity of SARS-CoV-2 Revealed by: In Silico Affinity Maturation and SPR Assay. RSC Adv. 2021, 11, 14737–14745. [Google Scholar] [CrossRef] [PubMed]
- Barton, M.I.; Macgowan, S.; Kutuzov, M.; Dushek, O.; Barton, G.J.; Anton Van Der Merwe, P. Effects of Common Mutations in the Sars-Cov-2 Spike Rbd and Its Ligand the Human Ace2 Receptor on Binding Affinity and Kinetics. Elife 2021, 10, 1–19. [Google Scholar] [CrossRef] [PubMed]
- Walker, S.N.; Chokkalingam, N.; Reuschel, E.L.; Purwar, M.; Xu, Z.; Gary, E.N.; Kim, K.Y.; Helble, M.; Schultheis, K.; Walters, J.; et al. SARS-CoV-2 Assays to Detect Functional Antibody Responses That Block ACE2 Recognition in Vaccinated Animals and Infected Patients. J. Clin. Microbiol. 2020, 58. [Google Scholar] [CrossRef] [PubMed]
- McMillan, P.; Dexhiemer, T.; Neubig, R.R.; Uhal, B.D. COVID-19—A Theory of Autoimmunity Against ACE-2 Explained. Front. Immunol. 2021, 12, 1–7. [Google Scholar] [CrossRef] [PubMed]
- Wrapp, D.; De Vlieger, D.; Corbett, K.S.; Torres, G.M.; Wang, N.; Van Breedam, W.; Roose, K.; van Schie, L.; Hoffmann, M.; Pöhlmann, S.; et al. Structural Basis for Potent Neutralization of Betacoronaviruses by Single-Domain Camelid Antibodies. Cell 2020, 181, 1004–1015.e15. [Google Scholar] [CrossRef] [PubMed]
- Chi, X.; Liu, X.; Wang, C.; Zhang, X.; Li, X.; Hou, J.; Ren, L.; Jin, Q.; Wang, J.; Yang, W. Humanized Single Domain Antibodies Neutralize SARS-CoV-2 by Targeting the Spike Receptor Binding Domain. Nat. Commun. 2020, 11, 2–8. [Google Scholar] [CrossRef]
- Li, T.; Xue, W.; Zheng, Q.; Song, S.; Yang, C.; Xiong, H.; Zhang, S.; Hong, M.; Zhang, Y.; Yu, H.; et al. Cross-Neutralizing Antibodies Bind a SARS-CoV-2 Cryptic Site and Resist Circulating Variants. Nat. Commun. 2021, 12, 1–12. [Google Scholar] [CrossRef]
- Tian, X.; Li, C.; Huang, A.; Xia, S.; Lu, S.; Shi, Z.; Lu, L.; Jiang, S.; Yang, Z.; Wu, Y.; et al. Potent Binding of 2019 Novel Coronavirus Spike Protein by a SARS Coronavirus-Specific Human Monoclonal Antibody. Emerg. Microbes Infect. 2020, 9, 382–385. [Google Scholar] [CrossRef]
- Yang, G.; Li, Z.; Mohammed, I.; Zhao, L.; Wei, W.; Xiao, H.; Guo, W.; Zhao, Y.; Qu, F.; Huang, Y. Identification of SARS-CoV-2-against Aptamer with High Neutralization Activity by Blocking the RBD Domain of Spike Protein 1. Signal Transduct. Target. Ther. 2021, 6. [Google Scholar] [CrossRef]
- Liu, K.; Tan, S.; Niu, S.; Wang, J.; Wu, L.; Sun, H.; Zhang, Y.; Pan, X.; Qu, X.; Du, P.; et al. Cross-Species Recognition of SARS-CoV-2 to Bat ACE2. Proc. Natl. Acad. Sci. U. S. A. 2021, 118, 1–9. [Google Scholar] [CrossRef] [PubMed]
- Feng, S.; Luan, X.; Wang, Y.; Wang, H.; Zhang, Z.; Wang, Y.; Tian, Z.; Liu, M.; Xiao, Y.; Zhao, Y.; et al. Eltrombopag Is a Potential Target for Drug Intervention in SARS-CoV-2 Spike Protein. Infect. Genet. Evol. 2020, 85, 104419. [Google Scholar] [CrossRef] [PubMed]
- Zhang, Y.; Hu, S.; Wang, J.; Xue, Z.; Wang, C.; Wang, N. Dexamethasone Inhibits SARS-CoV-2 Spike Pseudotyped Virus Viropexis by Binding to ACE2. Virology 2021, 554, 83–88. [Google Scholar] [CrossRef] [PubMed]
|
Disclaimer/Publisher’s Note: The statements, opinions and data contained in all publications are solely those of the individual author(s) and contributor(s) and not of MDPI and/or the editor(s). MDPI and/or the editor(s) disclaim responsibility for any injury to people or property resulting from any ideas, methods, instructions or products referred to in the content. |
© 2023 by the authors. Licensee MDPI, Basel, Switzerland. This article is an open access article distributed under the terms and conditions of the Creative Commons Attribution (CC BY) license (http://creativecommons.org/licenses/by/4.0/).
