Submitted:
22 December 2023
Posted:
26 December 2023
You are already at the latest version
Abstract
Keywords:
1. Introduction
2. Results
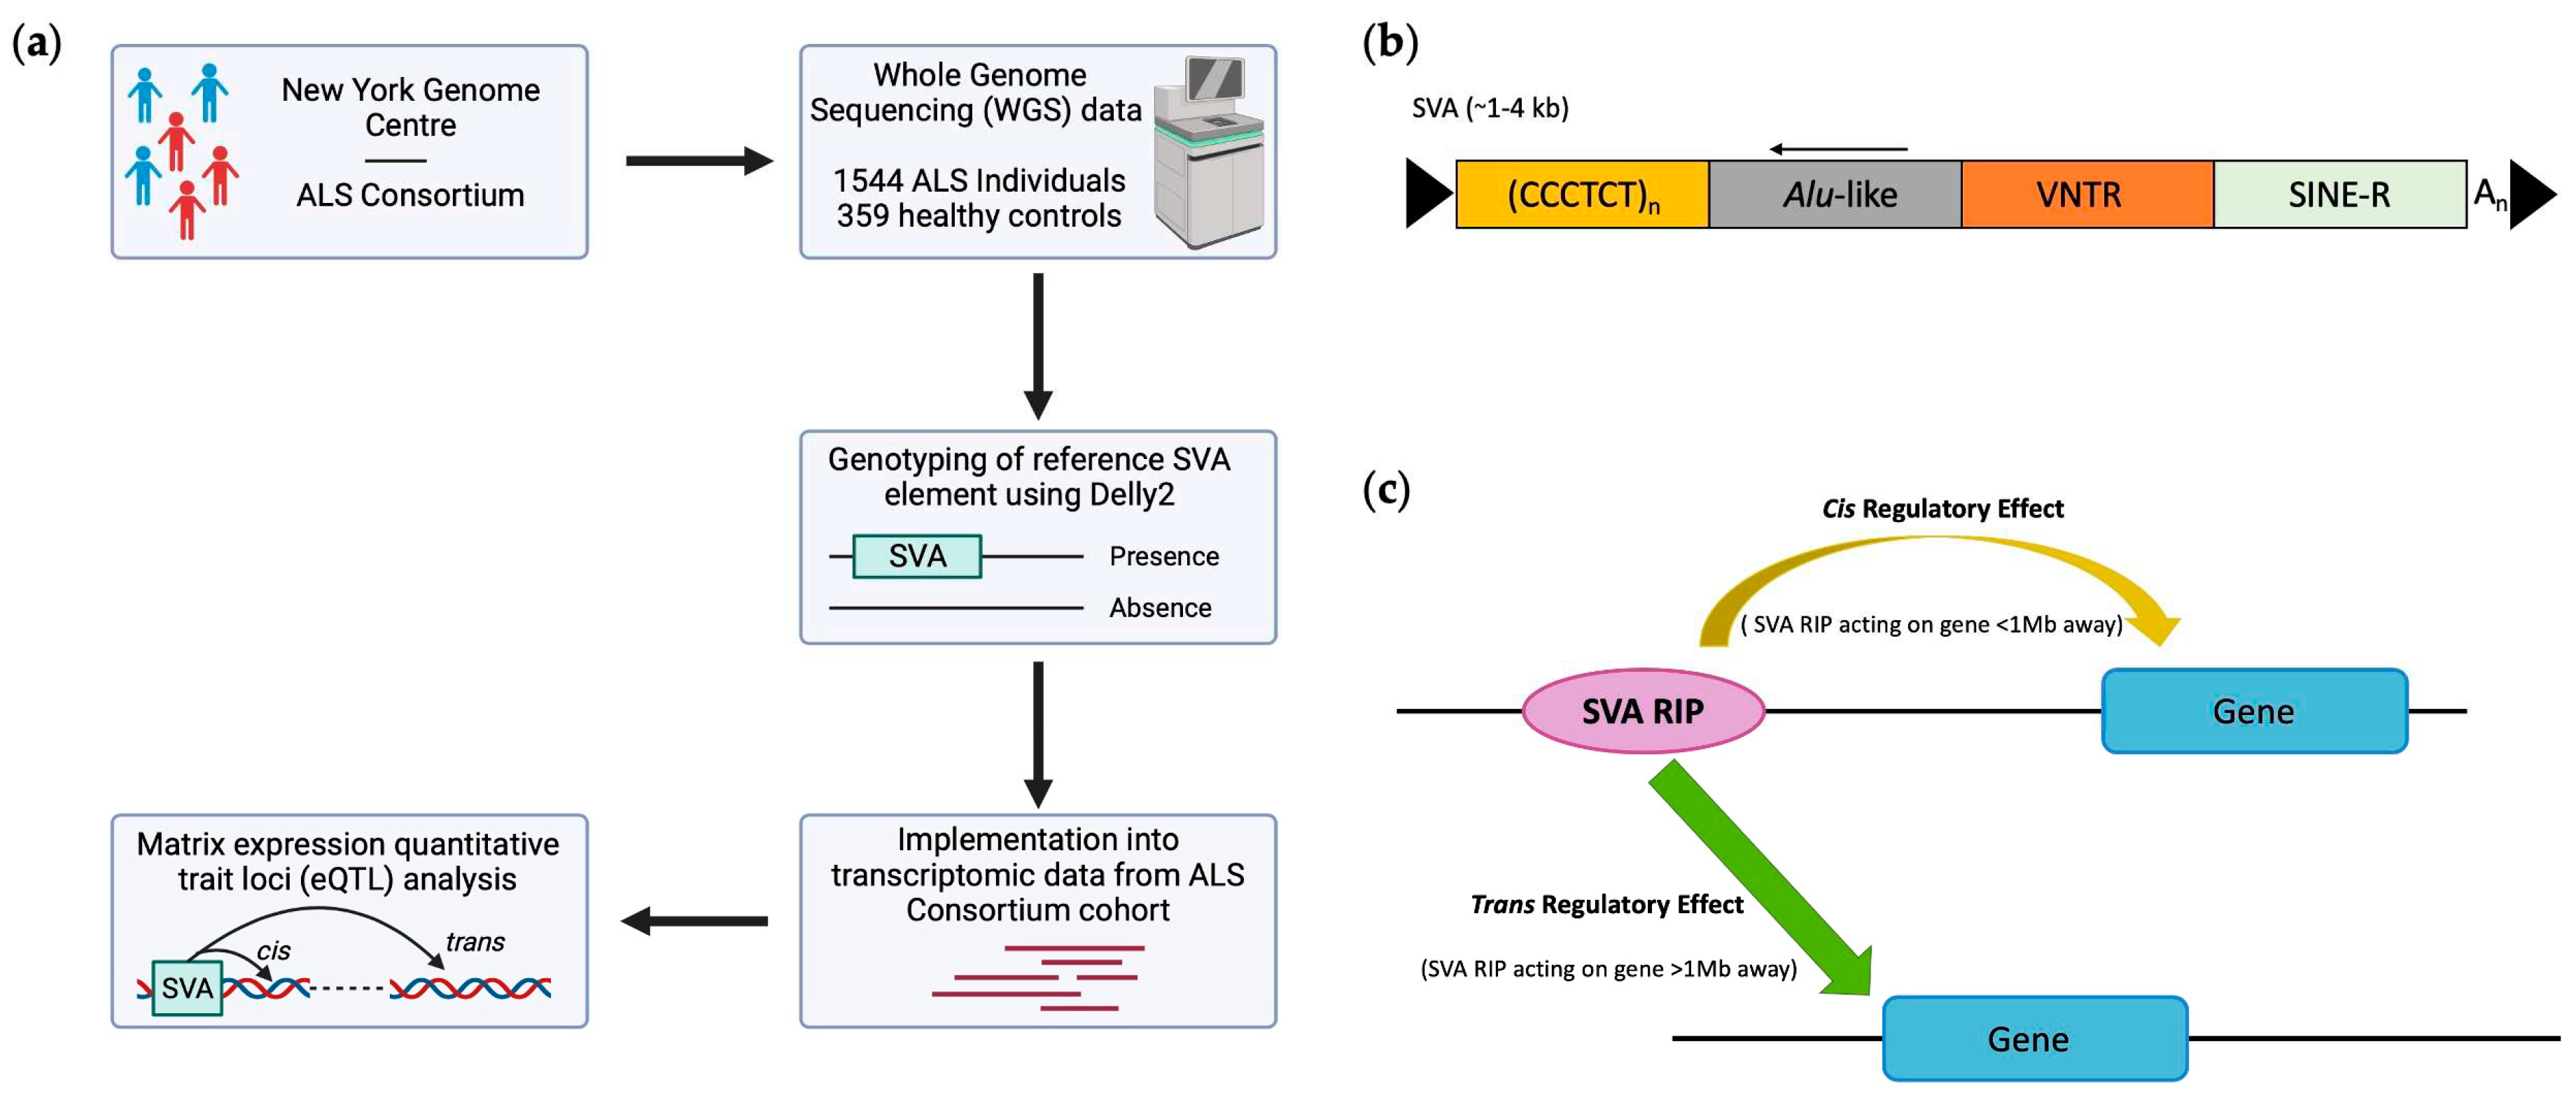
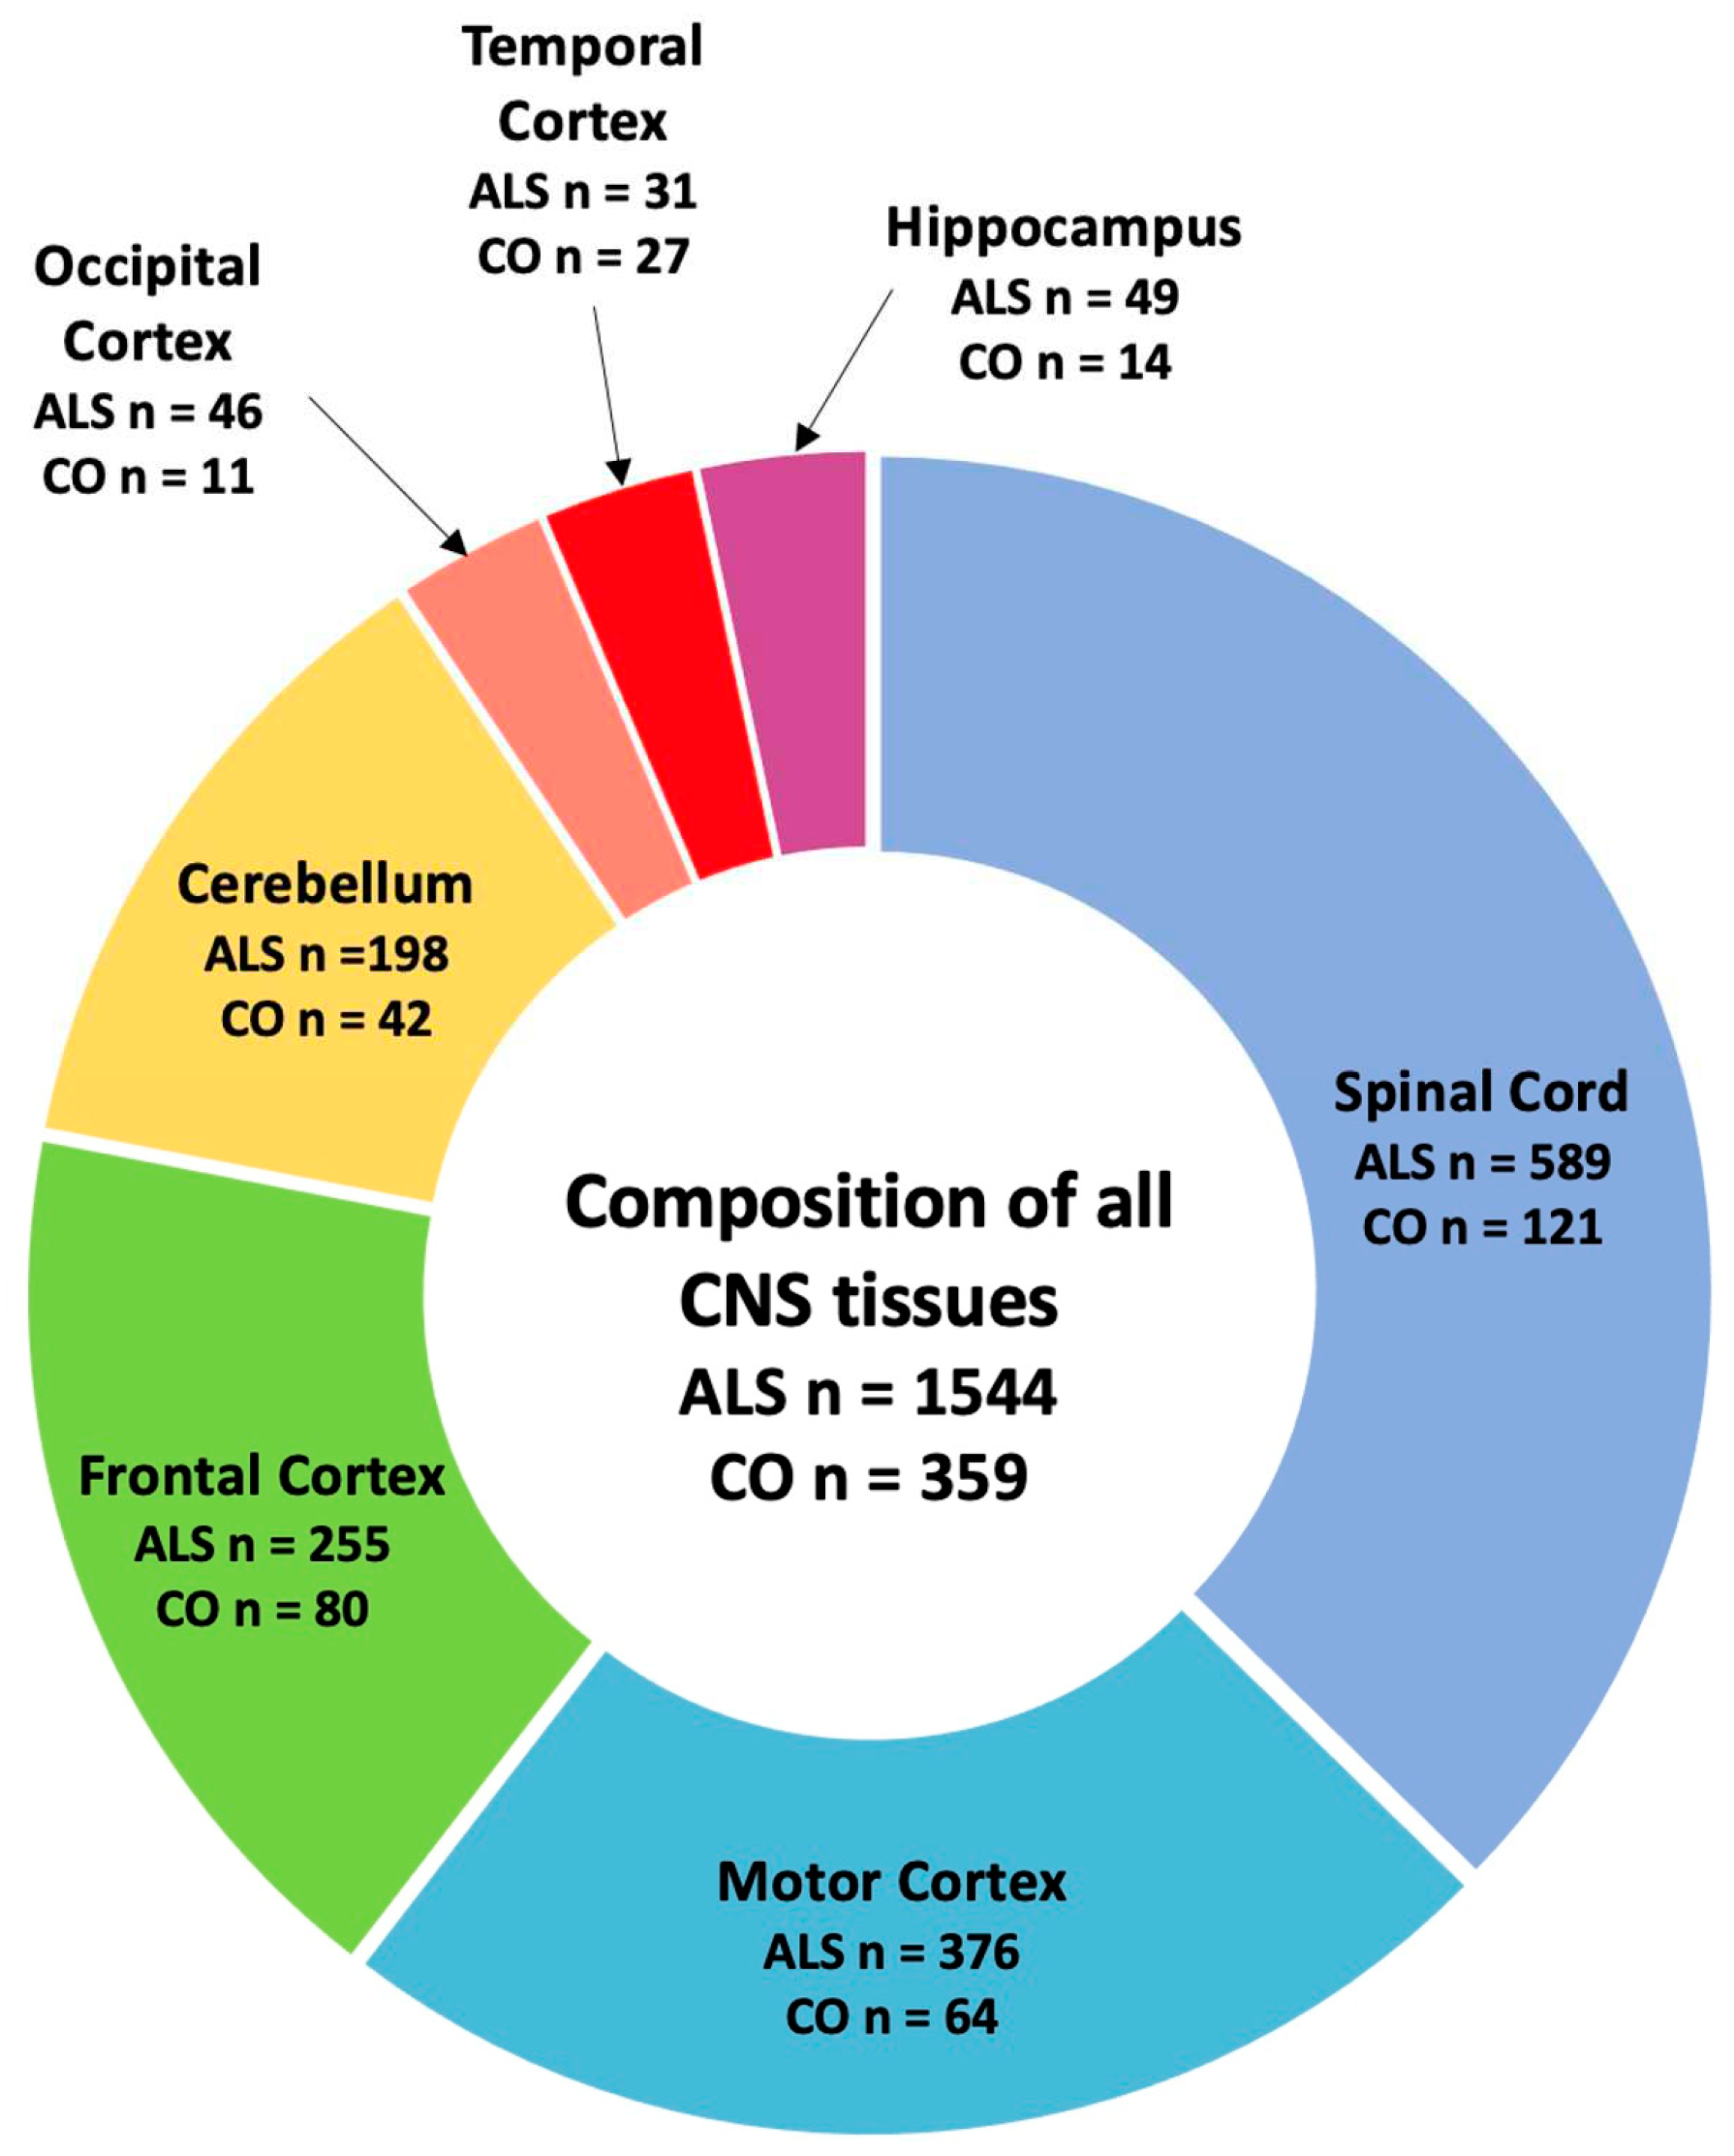
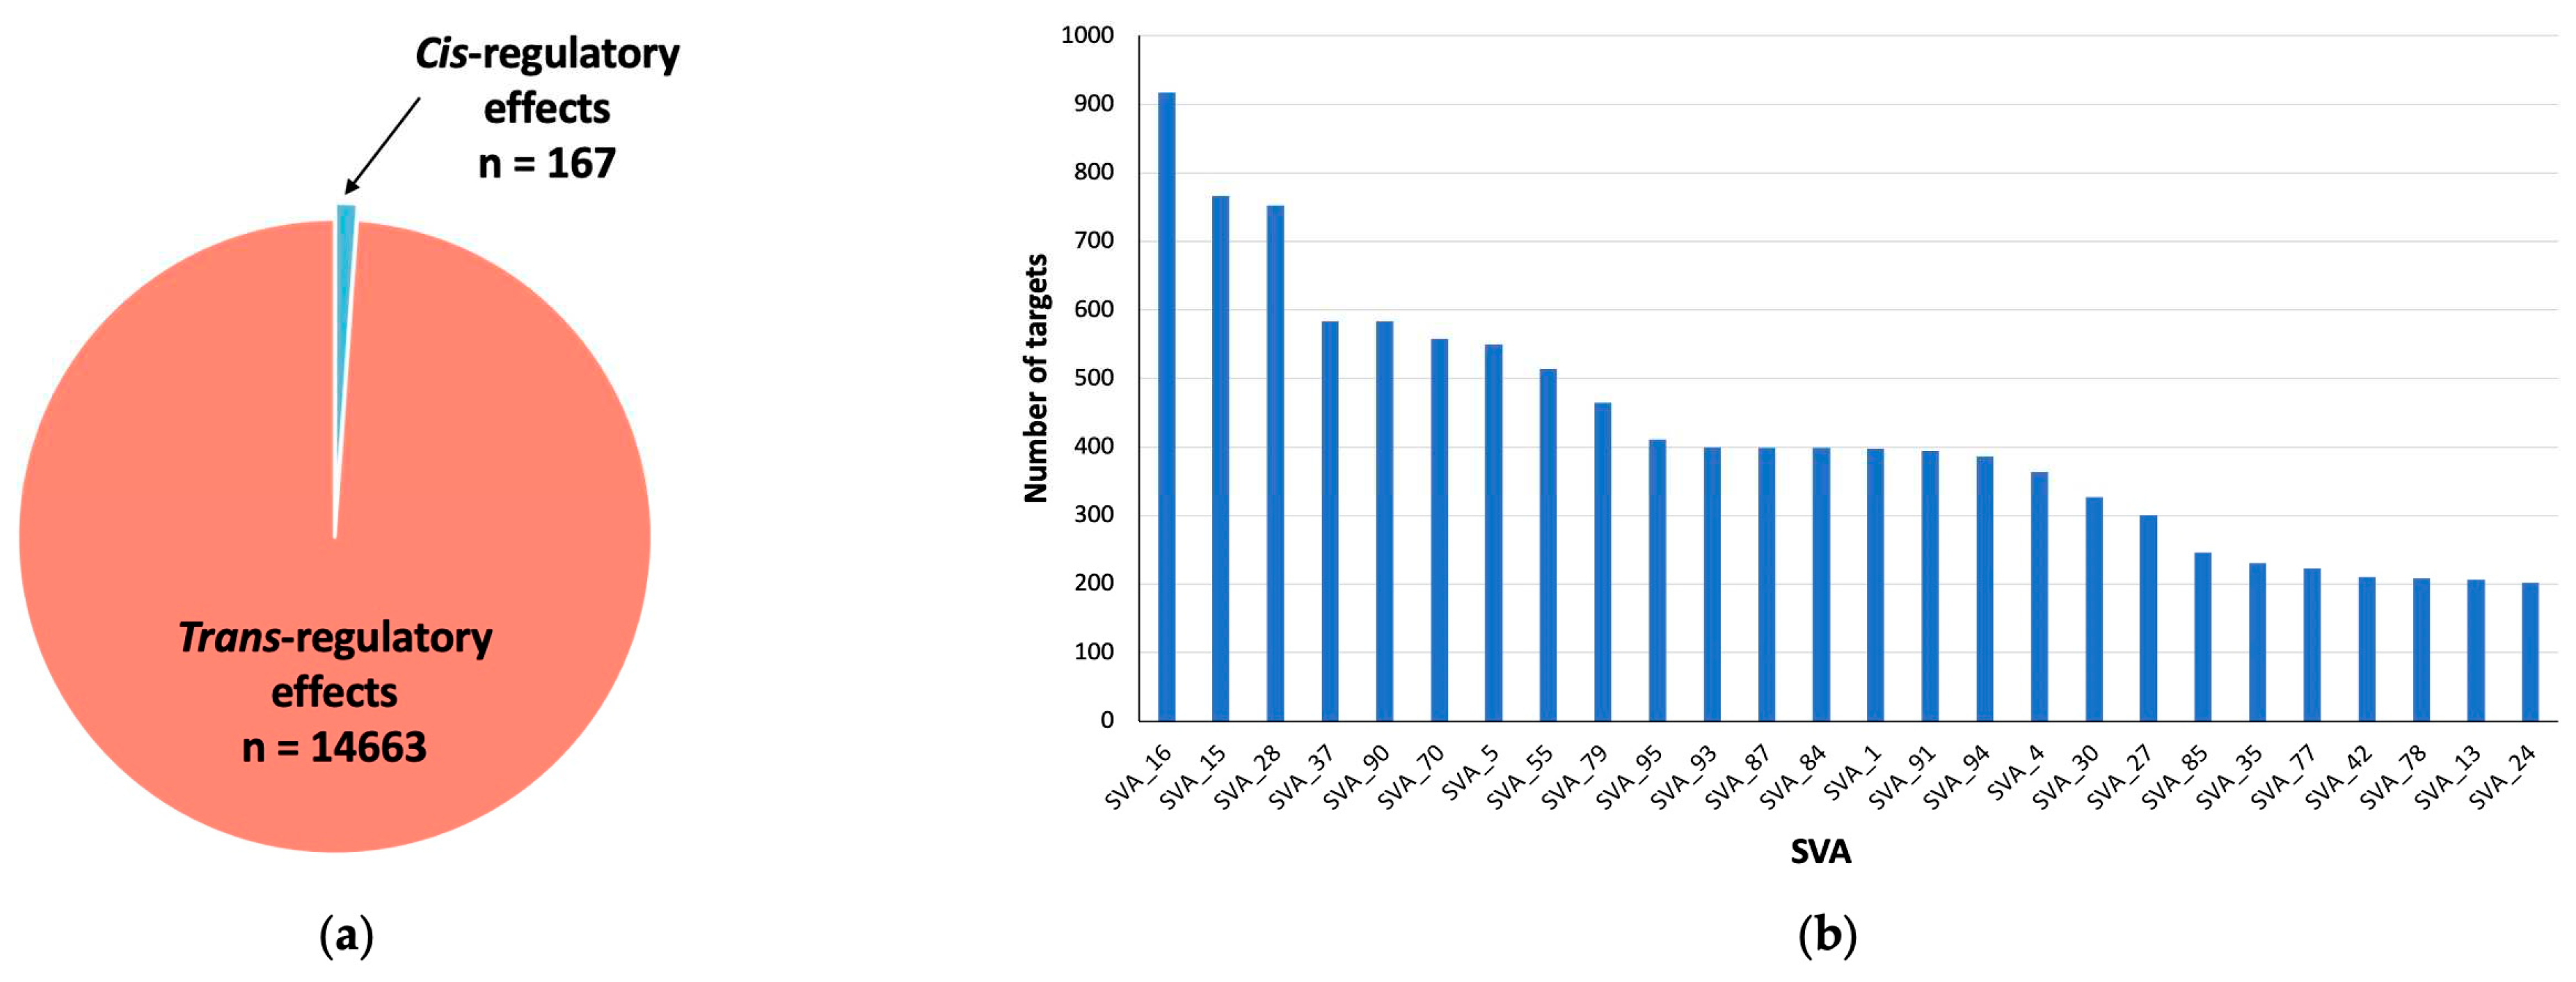
2.1. SVA RIPs act as eQTL genome wide in CNS tissues
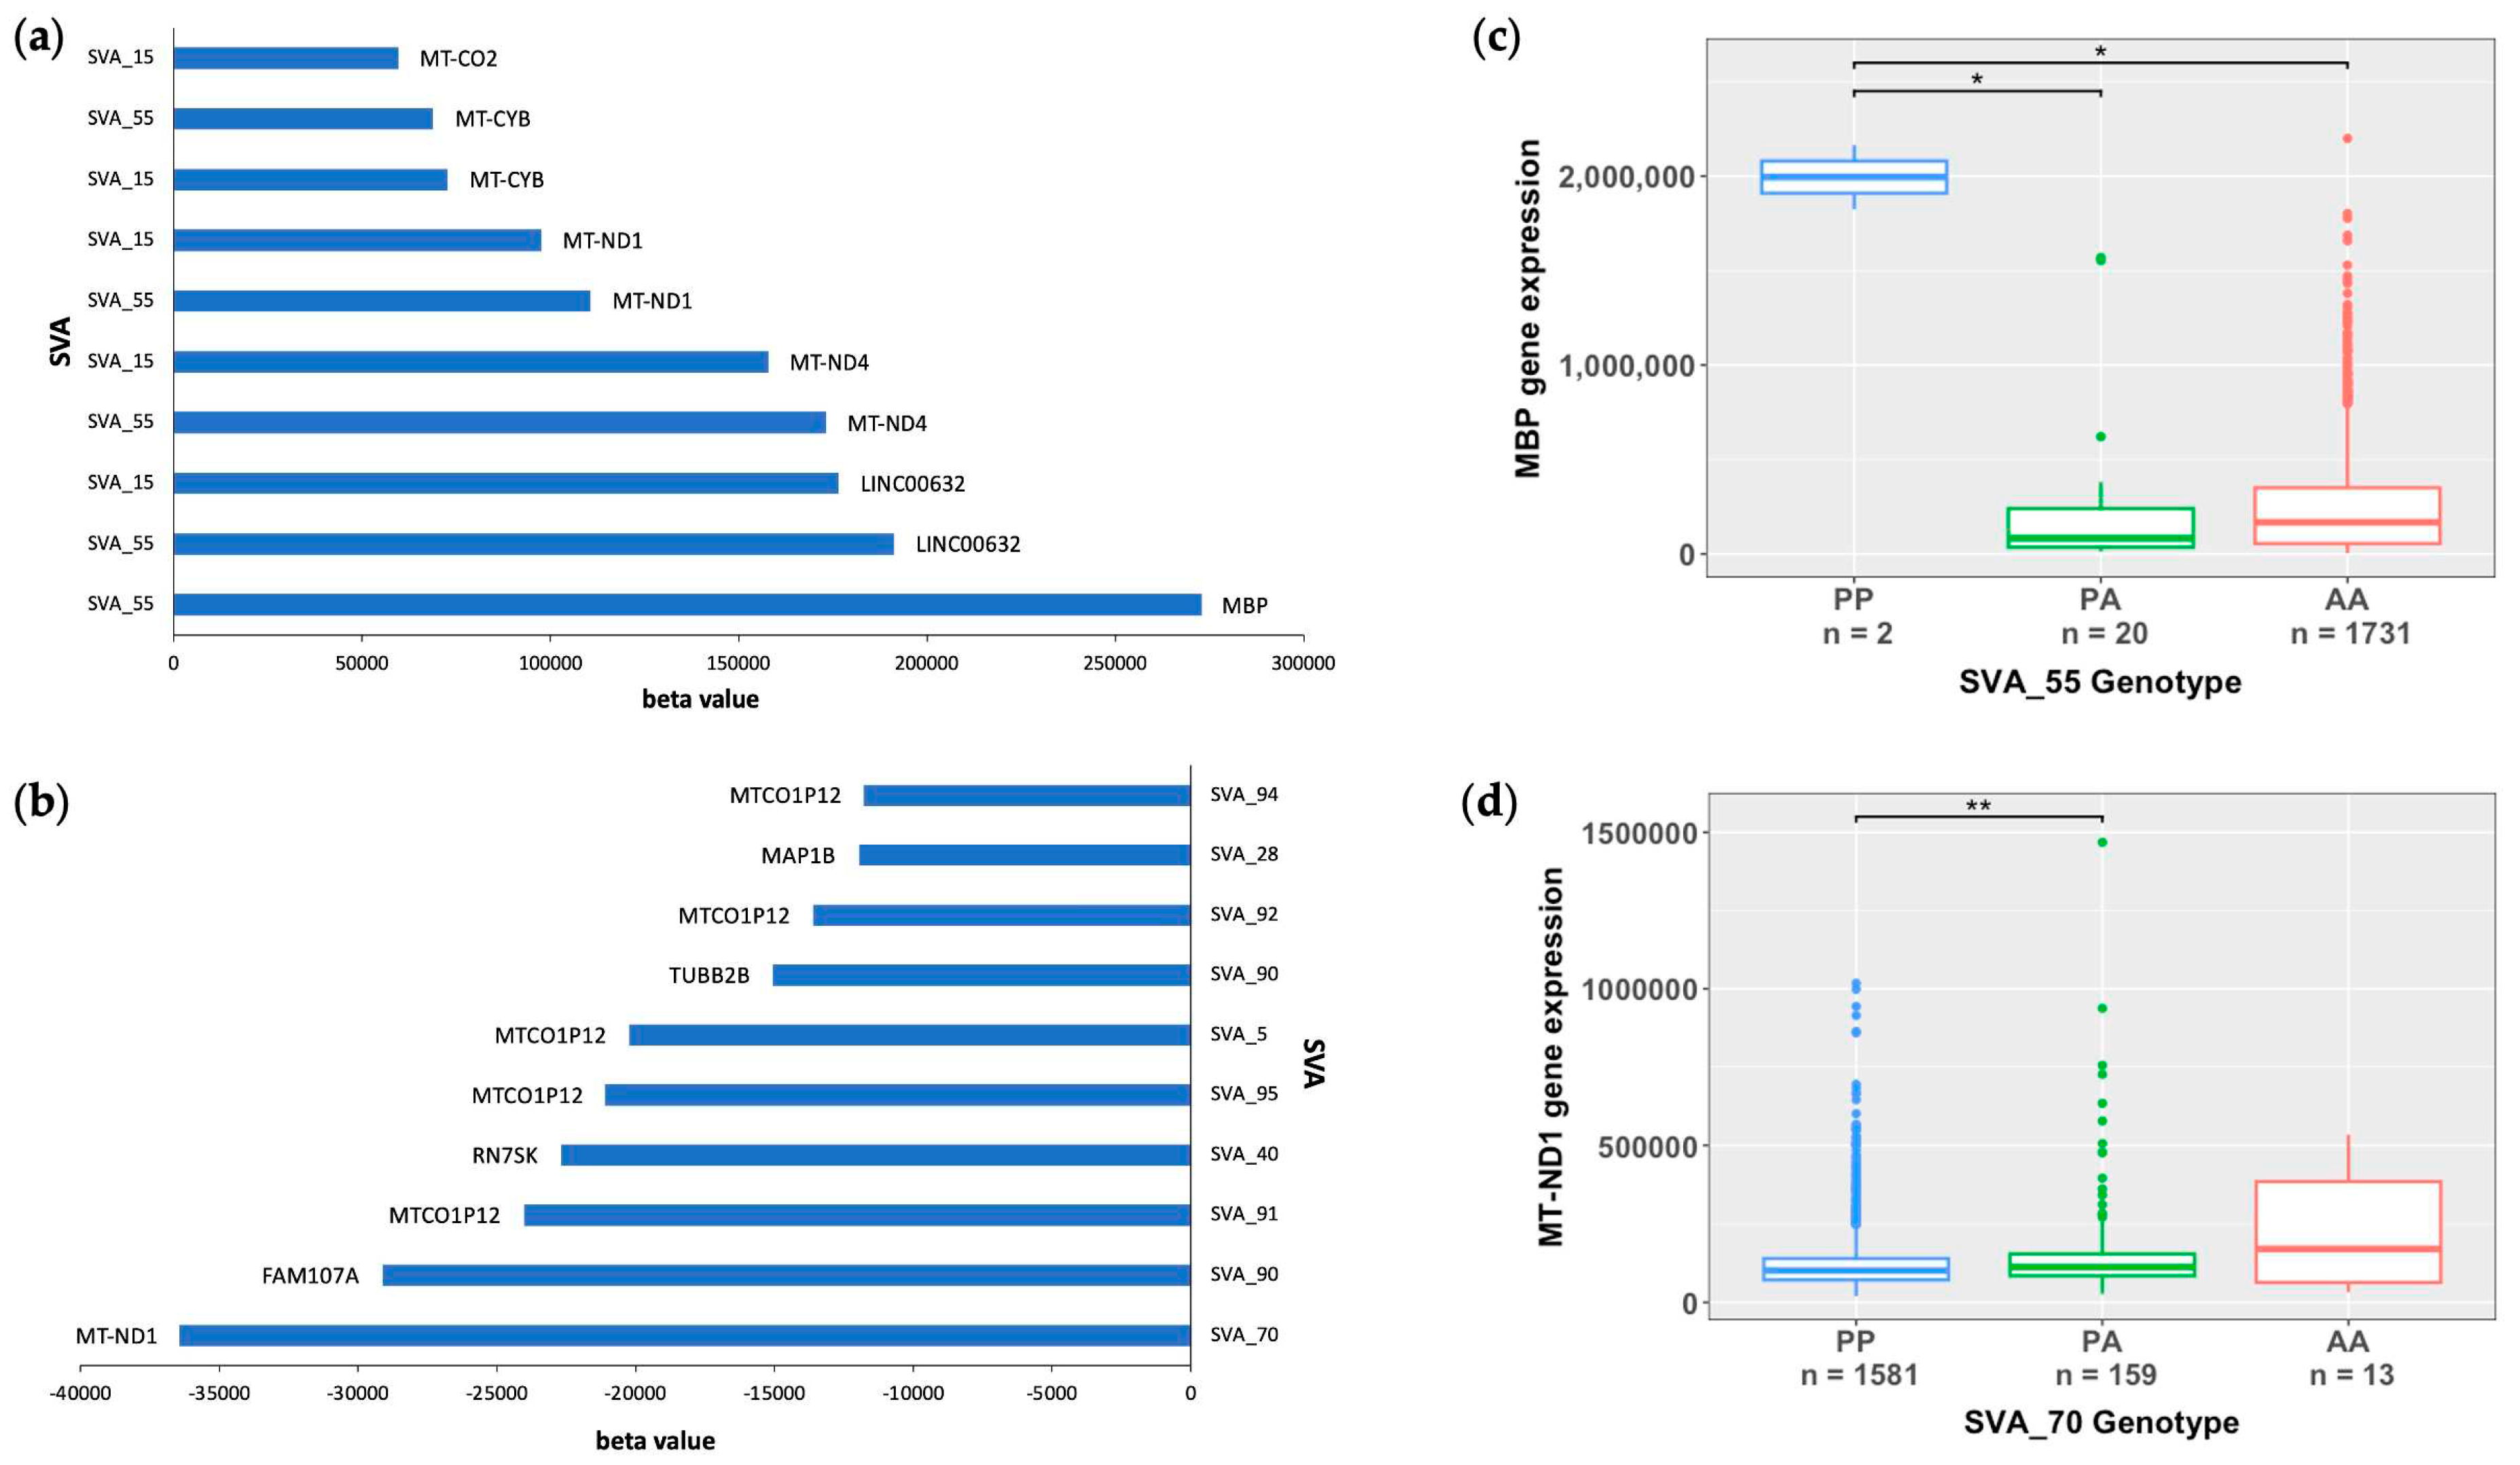
2.2. Mitochondrial genes are significantly modulated by SVA RIPs
2.3. SVA RIPs demonstrate cis effects on HLA and MAPT loci
2.4. SVA RIPs display tissue-specific modulation if gene expression
3. Discussion
4. Materials and Methods
4.1. Genotyping reference SVAs polymorphic for their presence/absence and disease association from whole genome sequencing data from ALS Consortium dataset
4.2. RNA-seq differential gene expression analysis
Supplementary Materials
Author Contributions
Funding
Informed Consent Statement
Data Availability Statement
Acknowledgments
Conflicts of Interest
References
- Zarei, S.; Carr, K.; Reiley, L.; Diaz, K.; Guerra, O.; Altamirano, P.; Pagani, W.; Lodin, D.; Orozco, G.; Chinea, A. A Comprehensive Review of Amyotrophic Lateral Sclerosis. Surg Neurol Int 2015, 6, 171. [Google Scholar] [CrossRef] [PubMed]
- Grad, L.I.; Rouleau, G.A.; Ravits, J.; Cashman, N.R. Clinical Spectrum of Amyotrophic Lateral Sclerosis (ALS). Cold Spring Harb Perspect Med 2017, 7, a024117. [Google Scholar] [CrossRef]
- Rowland, L.P.; Shneider, N.A. Amyotrophic Lateral Sclerosis. N Engl J Med 2001, 344, 1688–1700. [Google Scholar] [CrossRef]
- Masrori, P.; Van Damme, P. Amyotrophic Lateral Sclerosis: A Clinical Review. Euro J of Neurology 2020, 27, 1918–1929. [Google Scholar] [CrossRef] [PubMed]
- Mejzini, R.; Flynn, L.L.; Pitout, I.L.; Fletcher, S.; Wilton, S.D.; Akkari, P.A. ALS Genetics, Mechanisms, and Therapeutics: Where Are We Now? Front. Neurosci. 2019, 13, 1310. [Google Scholar] [CrossRef]
- Brown, R.H.; Al-Chalabi, A. Amyotrophic Lateral Sclerosis. N Engl J Med 2017, 377, 162–172. [Google Scholar] [CrossRef] [PubMed]
- Van Es, M.A.; Hardiman, O.; Chio, A.; Al-Chalabi, A.; Pasterkamp, R.J.; Veldink, J.H.; Van Den Berg, L.H. Amyotrophic Lateral Sclerosis. The Lancet 2017, 390, 2084–2098. [Google Scholar] [CrossRef] [PubMed]
- Savage, A.L.; Schumann, G.G.; Breen, G.; Bubb, V.J.; Al-Chalabi, A.; Quinn, J.P. Retrotransposons in the Development and Progression of Amyotrophic Lateral Sclerosis. J Neurol Neurosurg Psychiatry 2019, 90, 284–293. [Google Scholar] [CrossRef]
- Gregory, J.M.; Elliott, E.; McDade, K.; Bak, T.; Pal, S.; Chandran, S.; Abrahams, S.; Smith, C. Neuronal Clusterin Expression Is Associated with Cognitive Protection in Amyotrophic Lateral Sclerosis. Neuropathology Appl Neurobio 2020, 46, 255–263. [Google Scholar] [CrossRef]
- Suzuki, N.; Nishiyama, A.; Warita, H.; Aoki, M. Genetics of Amyotrophic Lateral Sclerosis: Seeking Therapeutic Targets in the Era of Gene Therapy. J Hum Genet 2023, 68, 131–152. [Google Scholar] [CrossRef]
- Zou, Z.-Y.; Zhou, Z.-R.; Che, C.-H.; Liu, C.-Y.; He, R.-L.; Huang, H.-P. Genetic Epidemiology of Amyotrophic Lateral Sclerosis: A Systematic Review and Meta-Analysis. J Neurol Neurosurg Psychiatry 2017, 88, 540–549. [Google Scholar] [CrossRef] [PubMed]
- Al-Chalabi, A.; Fang, F.; Hanby, M.F.; Leigh, P.N.; Shaw, C.E.; Ye, W.; Rijsdijk, F. An Estimate of Amyotrophic Lateral Sclerosis Heritability Using Twin Data. Journal of Neurology, Neurosurgery & Psychiatry 2010, 81, 1324–1326. [Google Scholar] [CrossRef]
- Theunissen, F.; Flynn, L.L.; Anderton, R.S.; Mastaglia, F.; Pytte, J.; Jiang, L.; Hodgetts, S.; Burns, D.K.; Saunders, A.; Fletcher, S.; et al. Structural Variants May Be a Source of Missing Heritability in sALS. Front. Neurosci. 2020, 14, 47. [Google Scholar] [CrossRef] [PubMed]
- Roses, A.D.; Akkari, P.A.; Chiba-Falek, O.; Lutz, M.W.; Gottschalk, W.K.; Saunders, A.M.; Saul, B.; Sundseth, S.; Burns, D. Structural Variants Can Be More Informative for Disease Diagnostics, Prognostics and Translation than Current SNP Mapping and Exon Sequencing. Expert Opinion on Drug Metabolism & Toxicology 2016, 12, 135–147. [Google Scholar] [CrossRef]
- GTEx Consortium; Chiang, C. ; Scott, A.J.; Davis, J.R.; Tsang, E.K.; Li, X.; Kim, Y.; Hadzic, T.; Damani, F.N.; Ganel, L.; et al. The Impact of Structural Variation on Human Gene Expression. Nat Genet 2017, 49, 692–699. [Google Scholar] [CrossRef]
- Liscic, R.M. Als and Ftd: Insights into the Disease Mechanisms and Therapeutic Targets. European Journal of Pharmacology 2017, 817, 2–6. [Google Scholar] [CrossRef] [PubMed]
- Elbarbary, R.A.; Lucas, B.A.; Maquat, L.E. Retrotransposons as Regulators of Gene Expression. Science 2016, 351, aac7247. [Google Scholar] [CrossRef]
- Ayarpadikannan, S.; Kim, H.-S. The Impact of Transposable Elements in Genome Evolution and Genetic Instability and Their Implications in Various Diseases. Genomics Inform 2014, 12, 98. [Google Scholar] [CrossRef]
- Gianfrancesco, O.; Geary, B.; Savage, A.L.; Billingsley, K.J.; Bubb, V.J.; Quinn, J.P. The Role of SINE-VNTR-Alu (SVA) Retrotransposons in Shaping the Human Genome. IJMS 2019, 20, 5977. [Google Scholar] [CrossRef]
- Prudencio, M.; Gonzales, P.K.; Cook, C.N.; Gendron, T.F.; Daughrity, L.M.; Song, Y.; Ebbert, M.T.W.; Van Blitterswijk, M.; Zhang, Y.-J.; Jansen-West, K.; et al. Repetitive Element Transcripts Are Elevated in the Brain of C9orf72 ALS/FTLD Patients. Human Molecular Genetics 2017, 26, 3421–3431. [Google Scholar] [CrossRef]
- Hancks, D.C.; Kazazian, H.H. Active Human Retrotransposons: Variation and Disease. Current Opinion in Genetics & Development 2012, 22, 191–203. [Google Scholar] [CrossRef]
- Fröhlich, A.; Pfaff, A.L.; Bubb, V.J.; Koks, S.; Quinn, J.P. Characterisation of the Function of a SINE-VNTR-Alu Retrotransposon to Modulate Isoform Expression at the MAPT Locus. Front. Mol. Neurosci. 2022, 15, 815695. [Google Scholar] [CrossRef]
- Wang, H.; Xing, J.; Grover, D.; Hedges, D.J.; Han, K.; Walker, J.A.; Batzer, M.A. SVA Elements: A Hominid-Specific Retroposon Family. Journal of Molecular Biology 2005, 354, 994–1007. [Google Scholar] [CrossRef]
- Savage, A.L.; Bubb, V.J.; Breen, G.; Quinn, J.P. Characterisation of the Potential Function of SVA Retrotransposons to Modulate Gene Expression Patterns. BMC Evol Biol 2013, 13, 101. [Google Scholar] [CrossRef] [PubMed]
- Quinn, J.P.; Bubb, V.J. SVA Retrotransposons as Modulators of Gene Expression. Mobile Genetic Elements 2014, 4, e32102. [Google Scholar] [CrossRef] [PubMed]
- Pfaff, A.L.; Bubb, V.J.; Quinn, J.P.; Koks, S. Reference SVA Insertion Polymorphisms Are Associated with Parkinson’s Disease Progression and Differential Gene Expression. npj Parkinsons Dis. 2021, 7, 44. [Google Scholar] [CrossRef] [PubMed]
- Verpillat, P.; Camuzat, A.; Hannequin, D.; Thomas-Anterion, C.; Puel, M.; Belliard, S.; Dubois, B.; Didic, M.; Michel, B.-F.; Lacomblez, L.; et al. Association Between the Extended Tau Haplotype and Frontotemporal Dementia. Arch Neurol 2002, 59, 935. [Google Scholar] [CrossRef] [PubMed]
- Wider, C.; Vilariño-Güell, C.; Jasinska-Myga, B.; Heckman, M.G.; Soto-Ortolaza, A.I.; Cobb, S.A.; Aasly, J.O.; Gibson, J.M.; Lynch, T.; Uitti, R.J.; et al. Association of the MAPT Locus with Parkinson’s Disease. Euro J of Neurology 2010, 17, 483–486. [Google Scholar] [CrossRef] [PubMed]
- Sánchez-Juan, P.; Moreno, S.; De Rojas, I.; Hernández, I.; Valero, S.; Alegret, M.; Montrreal, L.; García González, P.; Lage, C.; López-García, S.; et al. The MAPT H1 Haplotype Is a Risk Factor for Alzheimer’s Disease in APOE Ε4 Non-Carriers. Front. Aging Neurosci. 2019, 11, 327. [Google Scholar] [CrossRef] [PubMed]
- Fröhlich, A.; Hughes, L.S.; Middlehurst, B.; Pfaff, A.L.; Bubb, V.J.; Koks, S.; Quinn, J.P. CRISPR Deletion of a SINE-VNTR-Alu (SVA_67) Retrotransposon Demonstrates Its Ability to Differentially Modulate Gene Expression at the MAPT Locus. Front. Neurol. 2023, 14, 1273036. [Google Scholar] [CrossRef]
- Van Rheenen, W.; Van Der Spek, R.A.A.; Bakker, M.K.; Van Vugt, J.J.F.A.; Hop, P.J.; Zwamborn, R.A.J.; De Klein, N.; Westra, H.-J.; Bakker, O.B.; Deelen, P.; et al. Common and Rare Variant Association Analyses in Amyotrophic Lateral Sclerosis Identify 15 Risk Loci with Distinct Genetic Architectures and Neuron-Specific Biology. Nat Genet 2021, 53, 1636–1648. [Google Scholar] [CrossRef]
- Nona, R.J.; Greer, J.M.; Henderson, R.D.; McCombe, P.A. HLA and Amyotrophic Lateral Sclerosis: A Systematic Review and Meta-Analysis. Amyotrophic Lateral Sclerosis and Frontotemporal Degeneration 2023, 24, 24–32. [Google Scholar] [CrossRef]
- Koks, S.; Pfaff, A.L.; Bubb, V.J.; Quinn, J.P. Expression Quantitative Trait Loci (eQTLs) Associated with Retrotransposons Demonstrate Their Modulatory Effect on the Transcriptome. IJMS 2021, 22, 6319. [Google Scholar] [CrossRef]
- Wang, L.; Rishishwar, L.; Mariño-Ramírez, L.; Jordan, I.K. Human Population-Specific Gene Expression and Transcriptional Network Modification with Polymorphic Transposable Elements. Nucleic Acids Res 2017, gkw1286. [Google Scholar] [CrossRef]
- Pugacheva, E.M.; Teplyakov, E.; Wu, Q.; Li, J.; Chen, C.; Meng, C.; Liu, J.; Robinson, S.; Loukinov, D.; Boukaba, A.; et al. The Cancer-Associated CTCFL/BORIS Protein Targets Multiple Classes of Genomic Repeats, with a Distinct Binding and Functional Preference for Humanoid-Specific SVA Transposable Elements. Epigenetics & Chromatin 2016, 9, 35. [Google Scholar] [CrossRef]
- Sun, X.; Zhang, J.; Cao, C. CTCF and Its Partners: Shaper of 3D Genome during Development. Genes 2022, 13, 1383. [Google Scholar] [CrossRef] [PubMed]
- Aggarwal, S.; Snaidero, N.; Pähler, G.; Frey, S.; Sánchez, P.; Zweckstetter, M.; Janshoff, A.; Schneider, A.; Weil, M.-T.; Schaap, I.A.T.; et al. Myelin Membrane Assembly Is Driven by a Phase Transition of Myelin Basic Proteins Into a Cohesive Protein Meshwork. PLoS Biol 2013, 11, e1001577. [Google Scholar] [CrossRef]
- Kang, S.H.; Li, Y.; Fukaya, M.; Lorenzini, I.; Cleveland, D.W.; Ostrow, L.W.; Rothstein, J.D.; Bergles, D.E. Degeneration and Impaired Regeneration of Gray Matter Oligodendrocytes in Amyotrophic Lateral Sclerosis. Nat Neurosci 2013, 16, 571–579. [Google Scholar] [CrossRef] [PubMed]
- Raffaele, S.; Boccazzi, M.; Fumagalli, M. Oligodendrocyte Dysfunction in Amyotrophic Lateral Sclerosis: Mechanisms and Therapeutic Perspectives. Cells 2021, 10, 565. [Google Scholar] [CrossRef] [PubMed]
- Lubetzki, C.; Zalc, B.; Williams, A.; Stadelmann, C.; Stankoff, B. Remyelination in Multiple Sclerosis: From Basic Science to Clinical Translation. The Lancet Neurology 2020, 19, 678–688. [Google Scholar] [CrossRef] [PubMed]
- Lorente Pons, A.; Higginbottom, A.; Cooper-Knock, J.; Alrafiah, A.; Alofi, E.; Kirby, J.; Shaw, P.J.; Wood, J.D.; Highley, J.R. Oligodendrocyte Pathology Exceeds Axonal Pathology in White Matter in Human Amyotrophic Lateral Sclerosis. The Journal of Pathology 2020, 251, 262–271. [Google Scholar] [CrossRef]
- Hübner, C.A.; Orth, U.; Senning, A.; Steglich, C.; Kohlschütter, A.; Korinthenberg, R.; Gal, A. Seventeen Novel PLP1 Mutations in Patients with Pelizaeus-Merzbacher Disease: MUTATIONS IN BRIEF. Hum. Mutat. 2005, 25, 321–322. [Google Scholar] [CrossRef]
- Cloake, N.; Yan, J.; Aminian, A.; Pender, M.; Greer, J. PLP1 Mutations in Patients with Multiple Sclerosis: Identification of a New Mutation and Potential Pathogenicity of the Mutations. JCM 2018, 7, 342. [Google Scholar] [CrossRef] [PubMed]
- Cruz-Rivera, Y.E.; Perez-Morales, J.; Santiago, Y.M.; Gonzalez, V.M.; Morales, L.; Cabrera-Rios, M.; Isaza, C.E. A Selection of Important Genes and Their Correlated Behavior in Alzheimer’s Disease. JAD 2018, 65, 193–205. [Google Scholar] [CrossRef] [PubMed]
- Wang, Y.; Xu, E.; Musich, P.R.; Lin, F. Mitochondrial Dysfunction in Neurodegenerative Diseases and the Potential Countermeasure. CNS Neurosci Ther 2019, 25, 816–824. [Google Scholar] [CrossRef] [PubMed]
- Misra, M.K.; Damotte, V.; Hollenbach, J.A. The Immunogenetics of Neurological Disease. Immunology 2018, 153, 399–414. [Google Scholar] [CrossRef] [PubMed]
- Antel, J.P.; Arnason, B.G.W.; Fuller, T.C.; Lehrich, J.R. Histocompatibility Typing in Amyotrophic Lateral Sclerosis. Archives of Neurology 1976, 33, 423–425. [Google Scholar] [CrossRef] [PubMed]
- Behan, P.; Durward, W.; Dick, H. HISTOCOMPATIBILITY ANTIGENS ASSOCIATED WITH MOTOR-NEURONE DISEASE. The Lancet 1976, 308, 803. [Google Scholar] [CrossRef] [PubMed]
- Jokelainen, M.; Tiilikainen, A.; Lapinleimu, K. Polio Antibodies and HLA Antigens in Amyotrophic Lateral Sclerosis. Tissue Antigens 1977, 10, 259–266. [Google Scholar] [CrossRef] [PubMed]
- Kott, E.; Livni, E.; Zamir, R.; Kuritzky, A. Cell-Mediated Immunity to Polio and HLA Antigens in Amyotrophic Lateral Sclerosis. Neurology 1979, 29, 1040–1040. [Google Scholar] [CrossRef]
- Kulski, J.K.; Pfaff, A.L.; Marney, L.D.; Fröhlich, A.; Bubb, V.J.; Quinn, J.P.; Koks, S. Regulation of Expression Quantitative Trait Loci by SVA Retrotransposons within the Major Histocompatibility Complex. Exp Biol Med (Maywood) 2023, 15353702231209411. [Google Scholar] [CrossRef] [PubMed]
- Pfaff, A.L.; Bubb, V.J.; Quinn, J.P.; Koks, S. A Genome-Wide Screen for the Exonisation of Reference SINE-VNTR-Alus and Their Expression in CNS Tissues of Individuals with Amyotrophic Lateral Sclerosis. IJMS 2023, 24, 11548. [Google Scholar] [CrossRef] [PubMed]
| SVA | beta value | False Discovery Rate (FDR) | Target gene | cis/trans effect |
|---|---|---|---|---|
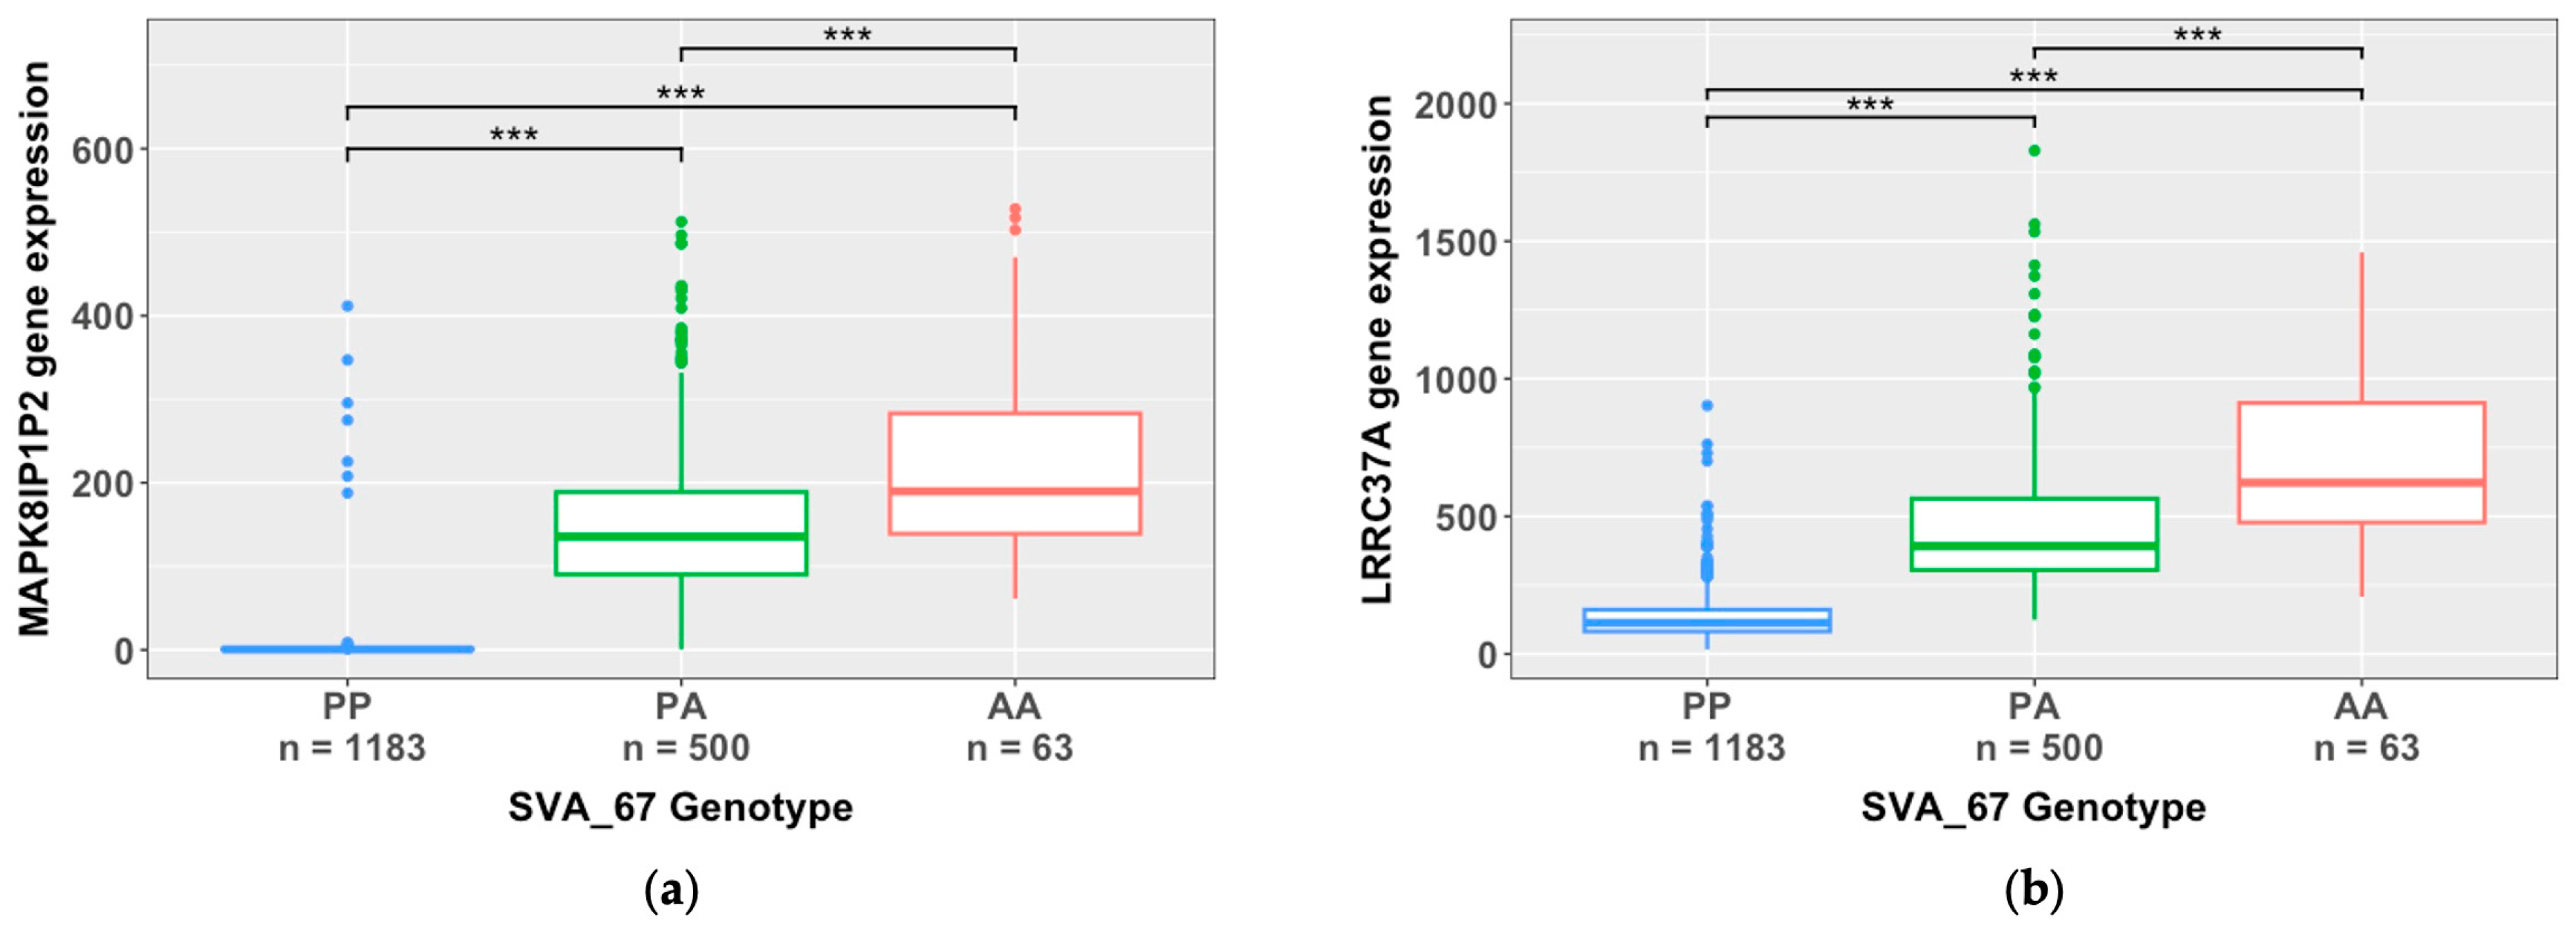
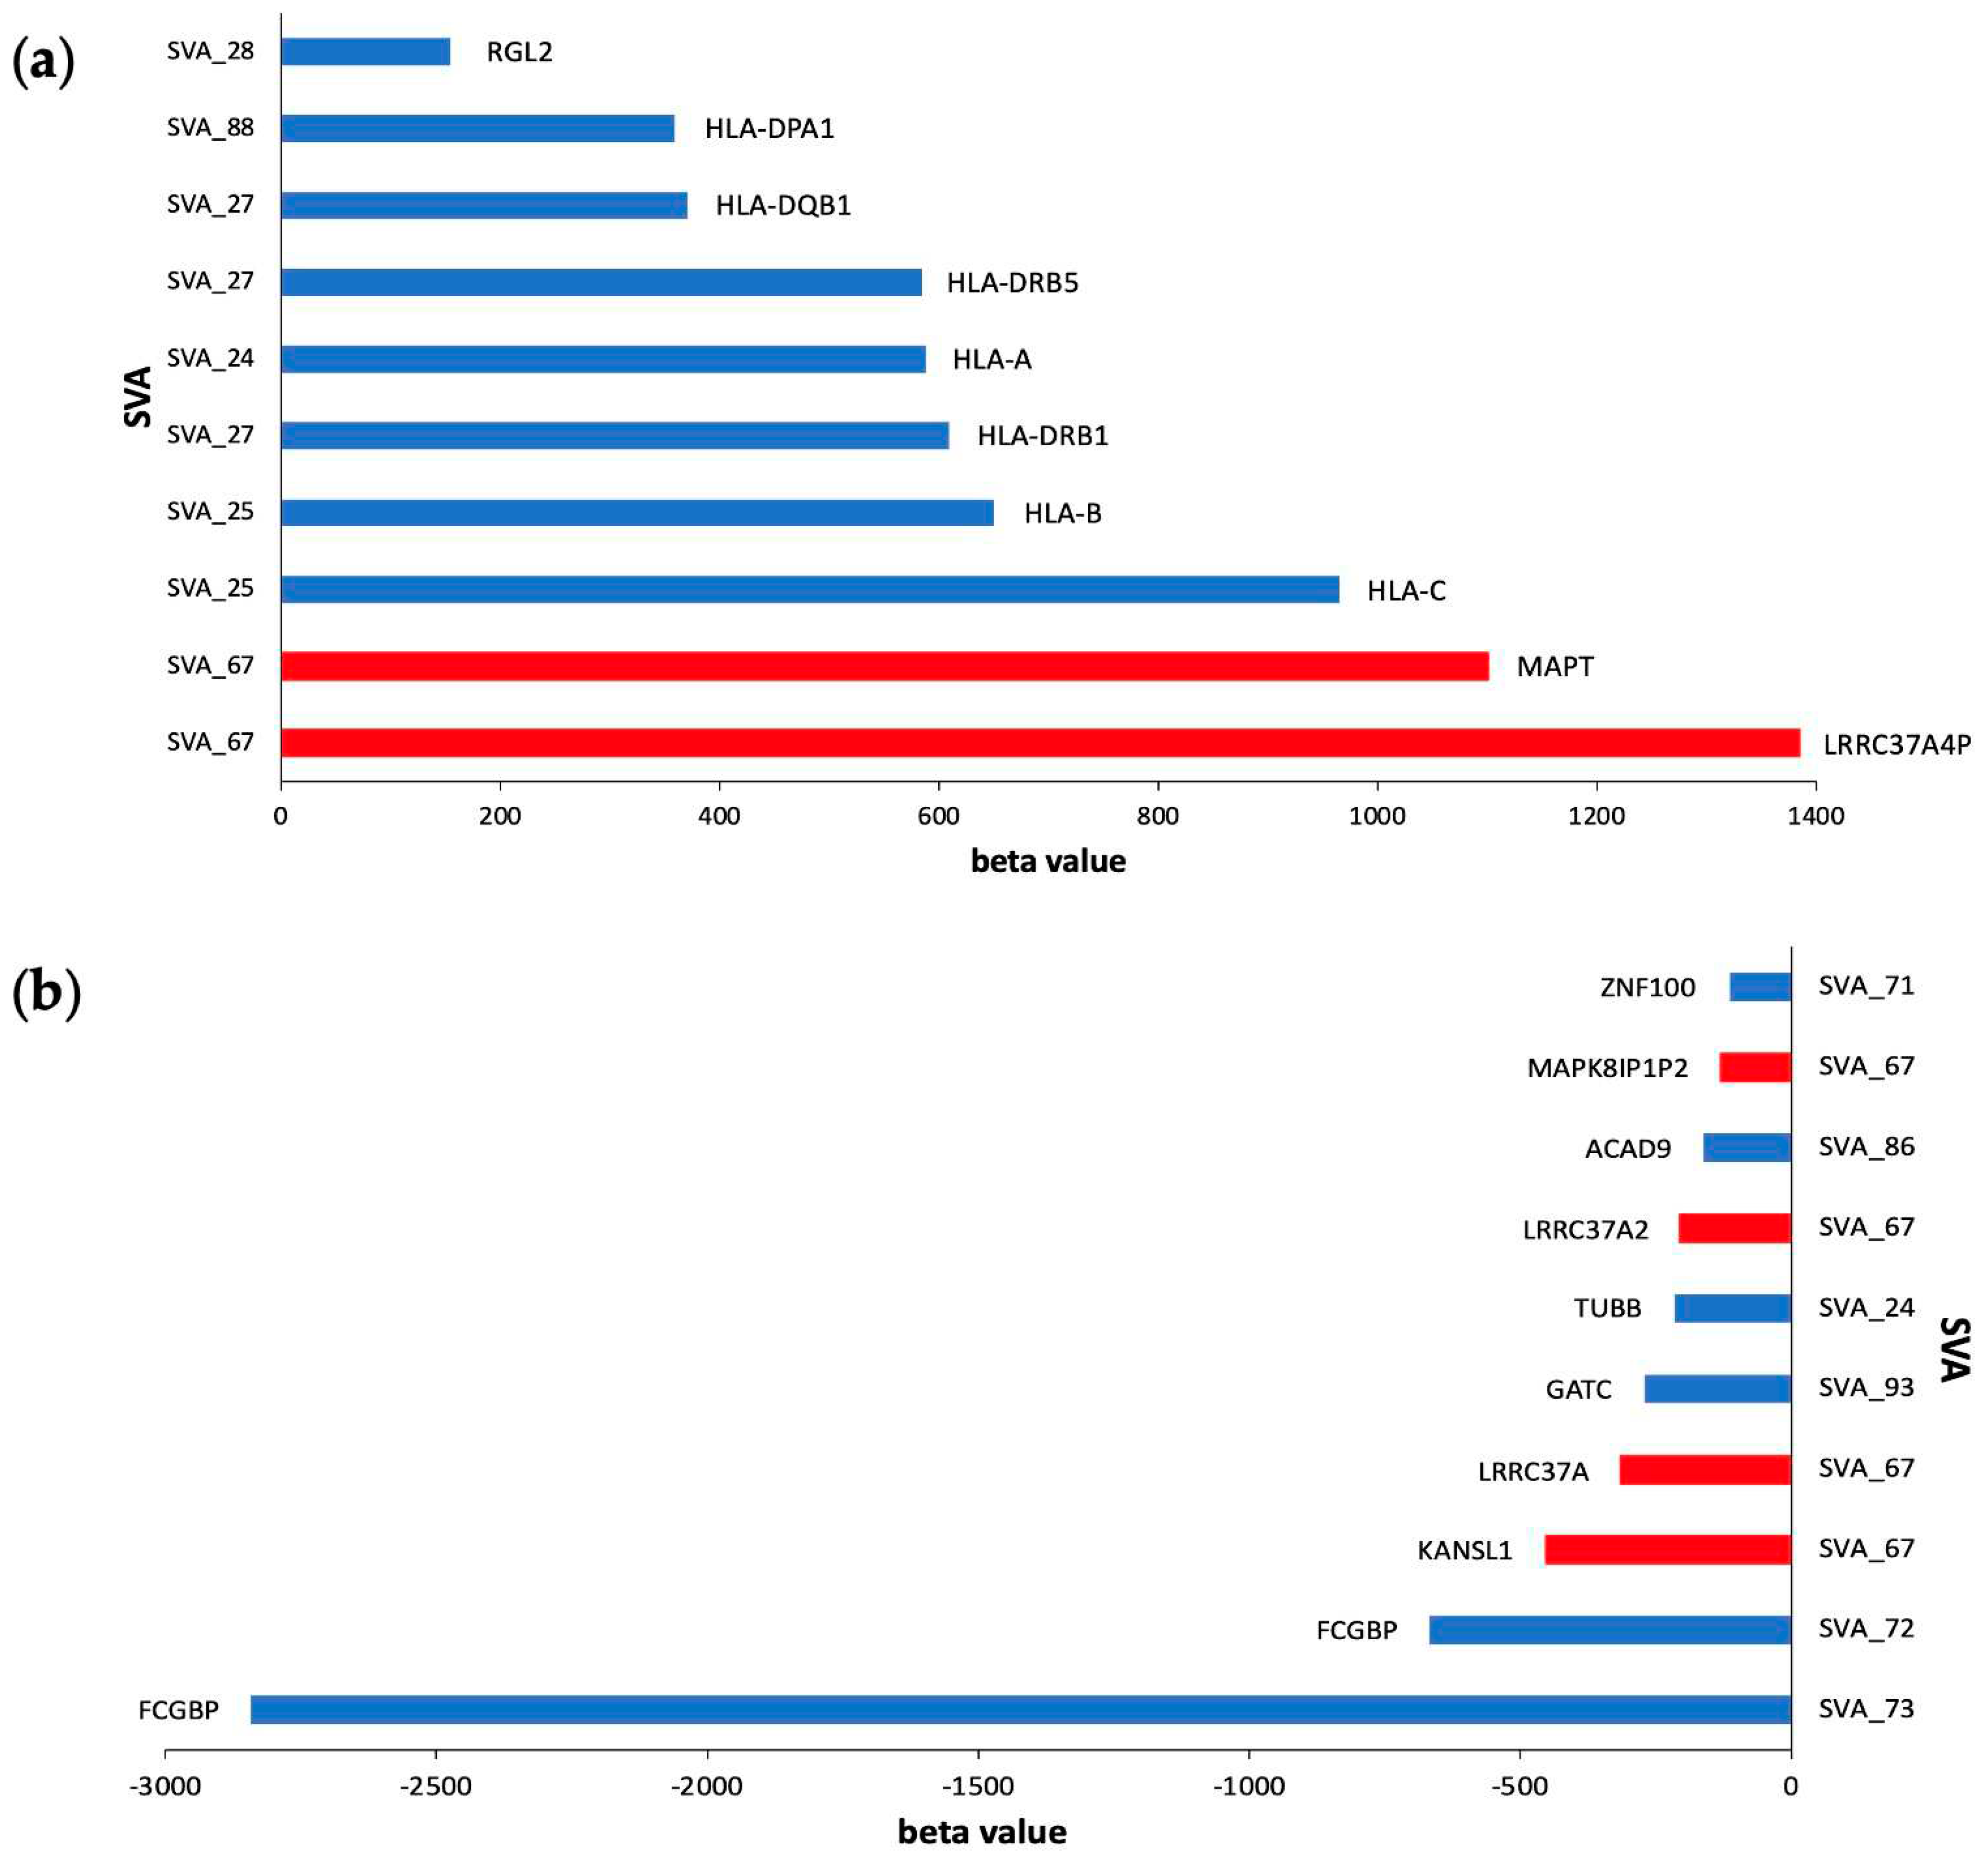
| SVA_67 | -131.2 | 1.93E-303 | MAPK8IP1P2 | cis |
| SVA_67 | -5.2 | 1.93E-303 | ENSG00000285668.1 | cis |
| SVA_67 | -315.1 | 5.12E-299 | LRRC37A | cis |
| SVA_87 | -126.2 | 3.02E-224 | MTND4P24 | trans |
| SVA_93 | -126.2 | 4.22E-224 | MTND4P24 | trans |
| SVA_84 | -63.1 | 4.22E-224 | MTND4P24 | trans |
| SVA_58 | 4.1 | 3.89E-211 | LLPH-DT | cis |
| SVA_24 | 12.3 | 5.06E-201 | HLA-K | cis |
| SVA_15 | 59.6 | 3.13E-189 | MTND4P24 | trans |
| SVA_33 | 48.4 | 8.84E-188 | ZFAND2A-DT | cis |
| SVA | Gene ID | FDR p-value | Beta value | Gene | Chr | Cis/trans | Tissue |
|---|---|---|---|---|---|---|---|
| SVA_55 | ENSG00000197971.16 | 5.99E-10 | 638804.662 | MBP | 18 | trans | Spinal Cord |
| SVA_15 | ENSG00000197971.16 | 3.59E-07 | 620026.724 | MBP | 18 | trans | Spinal Cord |
| SVA_37 | ENSG00000197971.16 | 8.76E-04 | 585791.502 | MBP | 18 | trans | Spinal Cord |
| SVA_85 | ENSG00000197971.16 | 2.08E-03 | 560691.911 | MBP | 18 | trans | Spinal Cord |
| SVA_37 | ENSG00000123560.14 | 3.72E-12 | 168441.474 | PLP1 | X | trans | Spinal Cord |
| SVA_55 | ENSG00000198888.2 | 1.47E-05 | 153947.476 | MT-ND1 | MT | trans | Spinal Cord |
| SVA_55 | ENSG00000203930.12 | 5.97E-04 | 148616.177 | LINC00632 | X | trans | Motor Cortex |
| SVA_15 | ENSG00000198888.2 | 1.62E-03 | 142961.051 | MT-ND1 | MT | trans | Spinal Cord |
| SVA_55 | ENSG00000203930.12 | 1.25E-16 | 115977.491 | LINC00632 | X | trans | Spinal Cord |
| SVA_15 | ENSG00000203930.12 | 1.86E-08 | 96910.7666 | LINC00632 | X | trans | Spinal Cord |
| SVA_55 | ENSG00000180354.16 | 1.34E-22 | 90266.4311 | MTURN | 7 | trans | Spinal Cord |
| SVA_15 | ENSG00000123560.14 | 3.43E-03 | 80380.5623 | PLP1 | X | trans | Spinal Cord |
| SVA_85 | ENSG00000203930.12 | 4.76E-03 | 78457.5282 | LINC00632 | X | trans | Spinal Cord |
| SVA_15 | ENSG00000180354.16 | 1.86E-12 | 77839.9088 | MTURN | 7 | trans | Spinal Cord |
| SVA_55 | ENSG00000198712.1 | 3.04E-03 | 76318.8326 | MT-CO2 | MT | trans | Spinal Cord |
| SVA_85 | ENSG00000180354.16 | 1.35E-05 | 67900.9382 | MTURN | 7 | trans | Spinal Cord |
| SVA_85 | ENSG00000237973.1 | 4.10E-33 | 66702.2584 | MTCO1P12 | 1 | trans | Motor Cortex |
| SVA_37 | ENSG00000168314.18 | 3.50E-09 | 65555.4973 | MOBP | 3 | trans | Spinal Cord |
| SVA_85 | ENSG00000237973.1 | 1.01E-32 | 53997.5748 | MTCO1P12 | 1 | trans | Frontal Cortex |
| SVA_15 | ENSG00000168314.18 | 5.02E-09 | 53362.8451 | MOBP | 3 | trans | Spinal Cord |
| SVA_55 | ENSG00000237973.1 | 3.61E-22 | 52048.0183 | MTCO1P12 | 1 | trans | Motor Cortex |
| SVA_55 | ENSG00000168314.18 | 1.38E-09 | 49216.1425 | MOBP | 3 | trans | Spinal Cord |
| SVA_15 | ENSG00000237973.1 | 2.83E-26 | 48449.3666 | MTCO1P12 | 1 | trans | Motor Cortex |
| SVA_85 | ENSG00000168314.18 | 3.76E-04 | 47350.2242 | MOBP | 3 | trans | Spinal Cord |
| SVA_85 | ENSG00000237973.1 | 8.82E-42 | 39521.0532 | MTCO1P12 | 1 | trans | Spinal Cord |
| SVA_55 | ENSG00000064787.13 | 1.62E-30 | 36504.4209 | BCAS1 | 20 | trans | Spinal Cord |
| SVA_37 | ENSG00000091513.16 | 1.65E-06 | 35838.5557 | TF | 3 | trans | Spinal Cord |
| SVA_55 | ENSG00000237973.1 | 1.49E-59 | 33728.2747 | MTCO1P12 | 1 | trans | Spinal Cord |
| SVA_4 | ENSG00000237973.1 | 3.59E-17 | 32837.5825 | MTCO1P12 | 1 | trans | Frontal Cortex |
| SVA_37 | ENSG00000237973.1 | 1.52E-23 | 32783.3654 | MTCO1P12 | 1 | trans | Motor Cortex |
| SVA_37 | ENSG00000237973.1 | 1.72E-31 | 32728.512 | MTCO1P12 | 1 | trans | Frontal Cortex |
| SVA_15 | ENSG00000237973.1 | 8.40E-41 | 32193.3558 | MTCO1P12 | 1 | trans | Spinal Cord |
| SVA_37 | ENSG00000099194.6 | 2.82E-04 | 31333.7253 | SCD | 10 | trans | Spinal Cord |
| SVA_85 | ENSG00000064787.13 | 3.78E-10 | 30888.7058 | BCAS1 | 20 | trans | Spinal Cord |
| SVA_15 | ENSG00000237973.1 | 3.46E-14 | 30602.307 | MTCO1P12 | 1 | trans | Frontal Cortex |
| SVA_15 | ENSG00000064787.13 | 1.97E-15 | 30356.5865 | BCAS1 | 20 | trans | Spinal Cord |
| SVA_37 | ENSG00000237973.1 | 1.28E-06 | 30025.949 | MTCO1P12 | 1 | trans | Cerebellum |
| SVA_15 | ENSG00000237973.1 | 5.29E-13 | 29472.617 | MTCO1P12 | 1 | trans | Cerebellum |
| SVA_55 | ENSG00000237973.1 | 2.00E-08 | 27693.2393 | MTCO1P12 | 1 | trans | Frontal Cortex |
| SVA_4 | ENSG00000237973.1 | 2.56E-09 | 27128.1241 | MTCO1P12 | 1 | trans | Motor Cortex |
| SVA | Gene ID | FDR p-value | Beta value | Gene | Chr | Cis/trans | Tissue |
|---|---|---|---|---|---|---|---|
| SVA_90 | ENSG00000197971.16 | 3.28E-03 | -1337611.1 | MBP | 18 | trans | Spinal Cord |
| SVA_5 | ENSG00000197971.16 | 3.06E-03 | -351064.11 | MBP | 18 | trans | Spinal Cord |
| SVA_87 | ENSG00000123560.14 | 1.98E-07 | -193423.77 | PLP1 | X | trans | Spinal Cord |
| SVA_93 | ENSG00000123560.14 | 2.05E-07 | -193266.83 | PLP1 | X | trans | Spinal Cord |
| SVA_30 | ENSG00000198888.2 | 8.47E-03 | -143159.48 | MT-ND1 | MT | trans | Cerebellum |
| SVA_70 | ENSG00000198886.2 | 1.029E-02 | -133464.74 | MT-ND4 | MT | trans | Cerebellum |
| SVA_30 | ENSG00000198763.3 | 7.85E-04 | -131182.45 | MT-ND2 | MT | trans | Motor Cortex |
| SVA_30 | ENSG00000198938.2 | 6.86E-03 | -111339.82 | MT-CO3 | MT | trans | Cerebellum |
| SVA_30 | ENSG00000198727.2 | 5.66E-03 | -104147.35 | MT-CYB | MT | trans | Cerebellum |
| SVA_84 | ENSG00000123560.14 | 2.11E-07 | -96556.036 | PLP1 | X | trans | Spinal Cord |
| SVA_30 | ENSG00000198786.2 | 7.25E-03 | -94294.133 | MT-ND5 | MT | trans | Motor Cortex |
| SVA_70 | ENSG00000198763.3 | 1.29E-02 | -82929.066 | MT-ND2 | MT | trans | Cerebellum |
| SVA_90 | ENSG00000259001.3 | 6.14E-03 | -73740.939 | ENSG00000259001 | 14 | trans | Spinal Cord |
| SVA_91 | ENSG00000203930.12 | 2.02E-03 | -71147.071 | LINC00632 | X | trans | Spinal Cord |
| SVA_87 | ENSG00000168314.18 | 3.60E-04 | -67162.942 | MOBP | 3 | trans | Spinal Cord |
| SVA_93 | ENSG00000168314.18 | 3.67E-04 | -67112.229 | MOBP | 3 | trans | Spinal Cord |
| SVA_91 | ENSG00000180354.16 | 2.99E-05 | -57438.97 | MTURN | 7 | trans | Spinal Cord |
| SVA_90 | ENSG00000168309.18 | 4.26E-03 | -48145.904 | FAM107A | 3 | trans | Spinal Cord |
| SVA_5 | ENSG00000180354.16 | 1.55E-05 | -43141.656 | MTURN | 7 | trans | Spinal Cord |
| SVA_70 | ENSG00000198712.1 | 6.03E-03 | -43049.326 | MT-CO2 | MT | trans | Cerebellum |
| SVA_90 | ENSG00000168309.18 | 2.45E-03 | -40637.548 | FAM107A | 3 | trans | Motor Cortex |
| SVA_91 | ENSG00000168314.18 | 5.48E-04 | -40457.332 | MOBP | 3 | trans | Spinal Cord |
| SVA_90 | ENSG00000177575.13 | 2.99E-19 | -36552.585 | CD163 | 12 | trans | Spinal Cord |
| SVA_84 | ENSG00000168314.18 | 3.83E-04 | -33494.891 | MOBP | 3 | trans | Spinal Cord |
| SVA_90 | ENSG00000087086.15 | 1.64E-08 | -32820.222 | FTL | 19 | trans | Motor Cortex |
| SVA_5 | ENSG00000168314.18 | 1.72E-04 | -31165.253 | MOBP | 3 | trans | Spinal Cord |
| SVA_16 | ENSG00000123560.14 | 8.97E-07 | -31144.963 | PLP1 | X | trans | Spinal Cord |
| SVA_91 | ENSG00000237973.1 | 6.16E-30 | -29834.037 | MTCO1P12 | 1 | trans | Spinal Cord |
| SVA_87 | ENSG00000173786.17 | 5.88E-04 | -28556.333 | CNP | 17 | trans | Spinal Cord |
| SVA_93 | ENSG00000173786.17 | 5.98E-04 | -28536.883 | CNP | 17 | trans | Spinal Cord |
| SVA_90 | ENSG00000137285.11 | 1.48E-40 | -27173.64 | TUBB2B | 6 | trans | Motor Cortex |
| SVA_5 | ENSG00000237973.1 | 3.92E-10 | -24995.474 | MTCO1P12 | 1 | trans | Motor Cortex |
| SVA_5 | ENSG00000237973.1 | 8.77E-13 | -24871.705 | MTCO1P12 | 1 | trans | Frontal Cortex |
| SVA_91 | ENSG00000064787.13 | 5.47E-07 | -22960.148 | BCAS1 | 20 | trans | Spinal Cord |
| SVA_93 | ENSG00000198840.2 | 3.12E-03 | -22049.981 | MT-ND3 | MT | trans | Spinal Cord |
| SVA_87 | ENSG00000198840.2 | 3.13E-03 | -22046.442 | MT-ND3 | MT | trans | Spinal Cord |
| SVA_90 | ENSG00000164733.22 | 1.39E-04 | -21828.547 | CTSB | 8 | trans | Spinal Cord |
| SVA_90 | ENSG00000079215.15 | 1.69E-05 | -21020.491 | SLC1A3 | 5 | trans | Motor Cortex |
| SVA_5 | ENSG00000237973.1 | 8.40E-24 | -19907.219 | MTCO1P12 | 1 | trans | Spinal Cord |
| SVA_87 | ENSG00000136541.15 | 1.45E-10 | -19551.323 | ERMN | 2 | trans | Spinal Cord |
Disclaimer/Publisher’s Note: The statements, opinions and data contained in all publications are solely those of the individual author(s) and contributor(s) and not of MDPI and/or the editor(s). MDPI and/or the editor(s) disclaim responsibility for any injury to people or property resulting from any ideas, methods, instructions or products referred to in the content. |
© 2023 by the authors. Licensee MDPI, Basel, Switzerland. This article is an open access article distributed under the terms and conditions of the Creative Commons Attribution (CC BY) license (http://creativecommons.org/licenses/by/4.0/).


