Preprint
Article

Crude Lipid Levels in Semi-Purified Diets for Zebrafish

Altmetrics

Downloads

87

Views

49

Comments

0

Submitted:

26 December 2023

Posted:

27 December 2023

You are already at the latest version

Alerts
Abstract
Zebrafish is a popular vertebrate model with limited knowledge of nutritional requirements and no established standard diets for scientific purposes. The aim of this study was to determine the inclusion range of lipids in semi-purified diets for zebrafish. Five isonitrogenous casein-gelatin based diets were formulated to contain 0.55%, 4.87%, 7.65%, 10.65%, and 13.94% of crude lipid (CL). Zebrafish (initial weight ± 232 mg) were distributed in 3 L aquaria in a recirculating water system in a completely randomized design (n=3). Fish were hand-fed twice daily to apparent satiety for 40 days. Weight gain, feed efficiency, and protein productive value of zebrafish increased signifi-cantly (P < 0.05) as CL increased up to 6.5, 8.3, and 8.6%, respectively, and decreased after this point. Survival of fish fed diets containing 0.55% CL was lower (P<0.05) than that of fish fed diets con-taining 4.87% to 13.94% CL. Body fat and adipocytes diameter of fish increased (P<0.05) increasing dietary CL levels. In conclusion, the ideal lipid level in semi-purified diets for zebrafish is between 6.5% and 8.6% of the diet.
Keywords: 
Subject: Biology and Life Sciences  -   Aquatic Science

1. Introduction

Zebrafish (Danio rerio) have emerged as a popular vertebrate model for biological and medical research due to their genetic similarity to humans, ease of breeding, and transparent embryos that allow for easy observation of developmental processes [1]. However, the health and welfare of zebrafish in trials are influenced by supply of nutritionally adequate and biologically safe diets [2,3]. In fact, develop standard diets, as stablished to rodents for example, has been appointed as key factor to consolidate D. rerio as vertebrate biological model guarantying the repeatability of studies among various laboratories [4].
Experimental standard diets for fish can be formulated using practical or purified ingredients [5,6]. Practical diets are cost-effective and readily available, showing high acceptability by D. rerio [3]. Despite this, true nutritional values of ingredients (digestibility) usually used in zebrafish diets are unknown until the present time, probably due the intrinsic difficulties imposed by the small size of specie. In fact, there are numerous nutritional and ingredient profiles among brands (or batches from them) of zebrafish diets [7,8,9,10]. Finally, the use of commercial practical diets can influence growth, health and/or cognitive parameters of zebrafish due to the presence of anti-nutritional factors [11], inadequate (high or below) levels of nutrients [12] and the use of food additives [13], introducing experimental bias once that these diets designed for a non-scientific purpose. In this context, the use of semi-purified diets in zebrafish research has advantages, as the use of refined ingredients, allowing precise control over the nutrient composition according to specific dietary requirements of fish [14]. However, semi-purified diets are more expensive and less palatable than practical diets, which can affect the feed intake and growth performance of D. rerio [15].
To develop adequate standard diets, it is essential to establish the requirements of zebrafish for several macro and micronutrients. While it is not feasible to establish a definitive “optimal” level of dietary lipid for any given fish species, there exists a range within which the provision of dietary lipid should be supplied [16]. Low lipidic diets can impair growth and feed efficiency due increasing the use of dietary protein as energy source [17,18]. On the other hand, negative effects on behavior [19], health [20] and growth of D. rerio were previously correlated with high dietary lipid levels. The level of dietary lipid in commercially available diets for zebrafish range from 11% to 19% [8,10]. This is higher than optimum lipid level recommended to several other cyprinid species [17,18,21,22], as well previous study with D. rerio [23]. However, considering the current knowledge of zebrafish nutrition, develop standard diets based on ingredients with high nutritional value and safety is recommended.
This study aimed to determine the inclusion range of lipids in semi-purified diets for zebrafish.

2. Materials and Methods

2.1. Experimental diets

Five experimental semi-purified diets were formulated varying the crude lipid (CL) levels (Table 1). The lipids were supplied - at the expense of corn starch - by a blend of fish oil, soybean oil, and soy lecithin, maintaining a 1:1:0.5 ratio, respectively, in all supplemented diets.
Dietary ingredients were thoroughly mixed, and oil was added to the dry mixture. Distilled water (around 40% v:w) was then incorporated into the diet mixes, which were subsequently pelleted. The granules were dried in a forced-air oven at 55 °C for 10 hours and then crumbled. The crumbles were shaken for 5 minutes through sieves, and only particles retained between 350-500 µm were used to feed the fish. All diets were packed in plastic containers and stored at -4°C until use.

2.2. Fish management before the trial

Wild-type zebrafish were purchased from local fish farmer (Toledo, PR). Fish were acclimated in a 1m3 circular tank with temperature control (26±1 °C) and biological filter-type airlift before the trial. To avoid an additional stress factor during the acclimatization period in the laboratory, fish was initially fed once per day a commercial flake diet (Novo Color, JBL), similar to the diet provided by the seller. The guaranteed levels provided by diet manufacturer are crude protein (minimum 43%), ether extract (minimum 8.5%), phosphorus (minimum 0.8%), crude fiber (maximum 1,9%), ash (maximum 9%), calcium (maximum 3%), and moisture (maximum 8%).
A week before the experiment, the fish were transitioned from a commercial flake diet to a semi-purified pellet diet. This semi-purified diet, produced in our lab for fish maintenance, has the same ingredients used in the experimental diets. The chemical composition comprises 90.9% dry matter, 36.7% crude protein, 11.5% ether extract, 8.7% crude fiber, 8.2% ash, and 4.6 kcal/f of gross energy of dry matter basis. Initially, the zebrafish were fed a mix of 75% commercial flake and 25% semi-purified diets for two days. This was followed by three days of a 50:50 mix, and then two days of a 25% commercial flake diet and a 75% semi-purified diet. Ultimately, the fish were exclusively fed the semi-purified diet until the experiment began.

2.3. Experimental management and sampling

The experiment begins with 120 zebrafish (average length ≈ 25.4 mm; average initial weight ≈ 232 mg), distributed across fifteen 3-L aquariums in a completely randomized design with three replicates per treatment. The aquariums were disposed in a recirculation water system with temperature control, mechanical and biological filters, and additional aeration. Water temperature (26.1±1.5 °C) and dissolved oxygen (6.5±0.4 mg/L) were monitored daily, while pH (7.5±0.0), ammonium (0 mg/L), and nitrite (0.2±0.1 mg/L) were checked weekly.
Over 40 days, the fish were hand-fed until apparent satiety at 9:00 a.m. and 3:00 p.m. Each week, the fish were fasted overnight, anesthetized with a benzocaine solution (50 mg/L), weighed, and counted. At the end of the experimental period, all fish were euthanized with an overdose of anesthetic (benzocaine solution; 500 mg/L), weighed, counted, and measured. The body condition scoring of all fish was evaluated according to methodology proposed by Clark et al. [24].
Two fish from each aquarium were randomized euthanized and subsequently fixed using a freshly prepared solution of 4% formaldehyde (0.1 M phosphate buffer, pH 7.2) for 48 hours at room temperature. Following this, they were embedded in Paraplast Plus (Sigma-Aldrich Co., St. Louis, Mo., USA), and sectioned to a thickness of 5 µm. These sections were then subjected to staining with hematoxylin and eosin for subsequent morphometric analysis of the intestine and visceral adipose tissue using the ImageJ software (National Institutes of Health, USA). The morphometry of the intestine was executed using photomicrographs of transverse segments. Measurements were procured for various parameters including the height of the intestinal villi, width of the intestinal villi, thickness of the muscularis mucosa, external perimeter, and absorptive perimeter. The morphometric analysis of the visceral adipose tissue was carried out on at least 30 adipocytes per animal, based on the measurement of their average diameter.
The remaining fish from each aquarium, after being euthanized as previously described, were ground to form a composite sample and then frozen at -20°C for the purpose of determining the whole-body chemical composition. The chemical composition of both the experimental diets and the whole-body fish samples was analyzed following the procedures recommended by the Association of Official Analytical Chemists [25]. The moisture content was determined using the gravimetric method in an oven set at 105°C until a constant weight was achieved. The crude protein (N × 6.25) was determined using the micro-Kjeldahl method, and the CL content was determined using the Soxhlet method.

2.4. Calculations and statistical analysis

The following performance parameters were calculated:
Weigh gain = final weight – initial weight,
Specific growth rate = 100 × [ln(final weight) – ln(initial weight)÷days] ,
Feed efficiency ratio = weight gain÷total feed intake ,
Protein product value = 100 × [(final weight × final body protein) - (initial weight × initial body protein)÷total protein intake]
Survival rate = 100 × final number of fish ÷ initial number of fish
The dataset was first tested for normality (Shapiro-Wilk) and homoscedasticity (Bartlett) to verify the assumptions of ANOVA. A one-way ANOVA was then conducted. If significant differences were detected, Duncan’s multiple range test was applied. Additionally, a regression analysis was performed to estimate the recommended dietary CL level. The influence of the fish’s sex was evaluated using an ANCOVA analysis. All analyses were conducted at a 5% significance level.

3. Results

The survival rate of the fish was 100% for all diets with CL levels above 0.55%, without significant differences among these diets (Table 2). The growth of the fish increased (p<0.05) with increasing CL levels in the diet. Fish fed with lipid-supplemented diets exhibited a higher growth compared to those on a non-supplemented diet. The ANOVA was not able to detect the effects of dietary lipid levels on daily feed intake of zebrafish at 5% of the probability (p=0.0963). However, the Duncan's multiple range test showed differences among means values registered, indicating an occurrence of Type I error in ANOVA. In this instance, it is recommended to interpret the results using the results of post-hoc test [26]. Fish fed the lipid-supplemented diets consumed 21% to 35% less feed than those fed the basal diet. The lowest feed intake was recorded in fish fed diets containing 7.65% and 10.65% lipids, which was consistent with the other performance parameters evaluated.
A dietary inclusion of 6.5% CL induced maximum weight gain in zebrafish, which declined beyond this point (Figure 1a). The fork length of fish has a significant quadratic trend (Y= 27.78210 + 0.80114x -0.04520x2; r2 = 0.5540) with maximum value registered at a level of 8.86% dietary crude lipid. The body condition scoring of D. rerio showed a linear effect (P<0.05), with females exhibiting a body scoring index that was 21.7% higher than males (Y=1.00472 + 0.03685x + 1.21675 sex, r2=0.4370). Nevertheless, no significant differences were observed in body condition means among zebrafish females, unlike the males, according to dietary lipid level. Interestingly, females fed lipid-supplemented diets displaying superior body condition scoring, but only males feeding high lipid levels slightly higher than this value (Figure 1b).
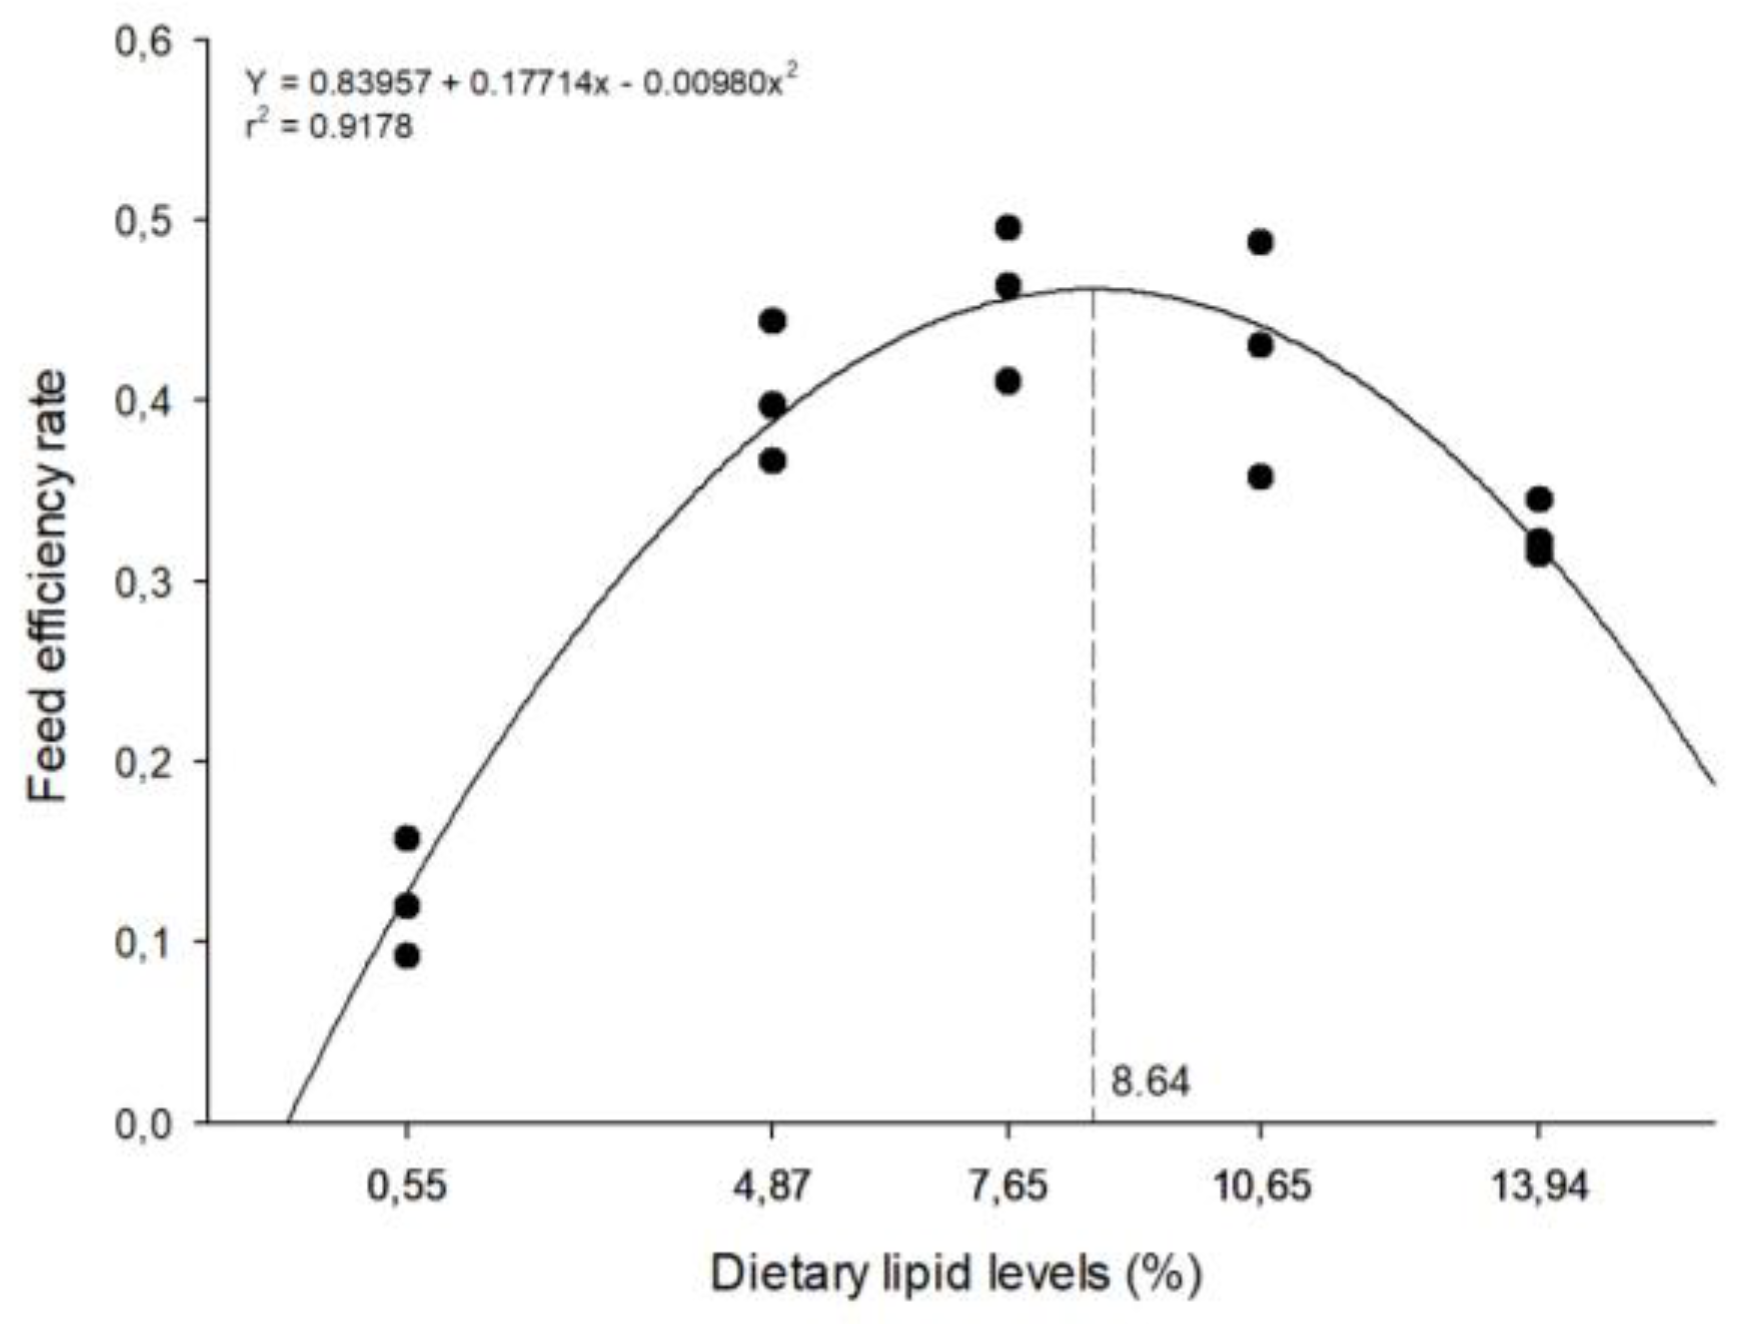
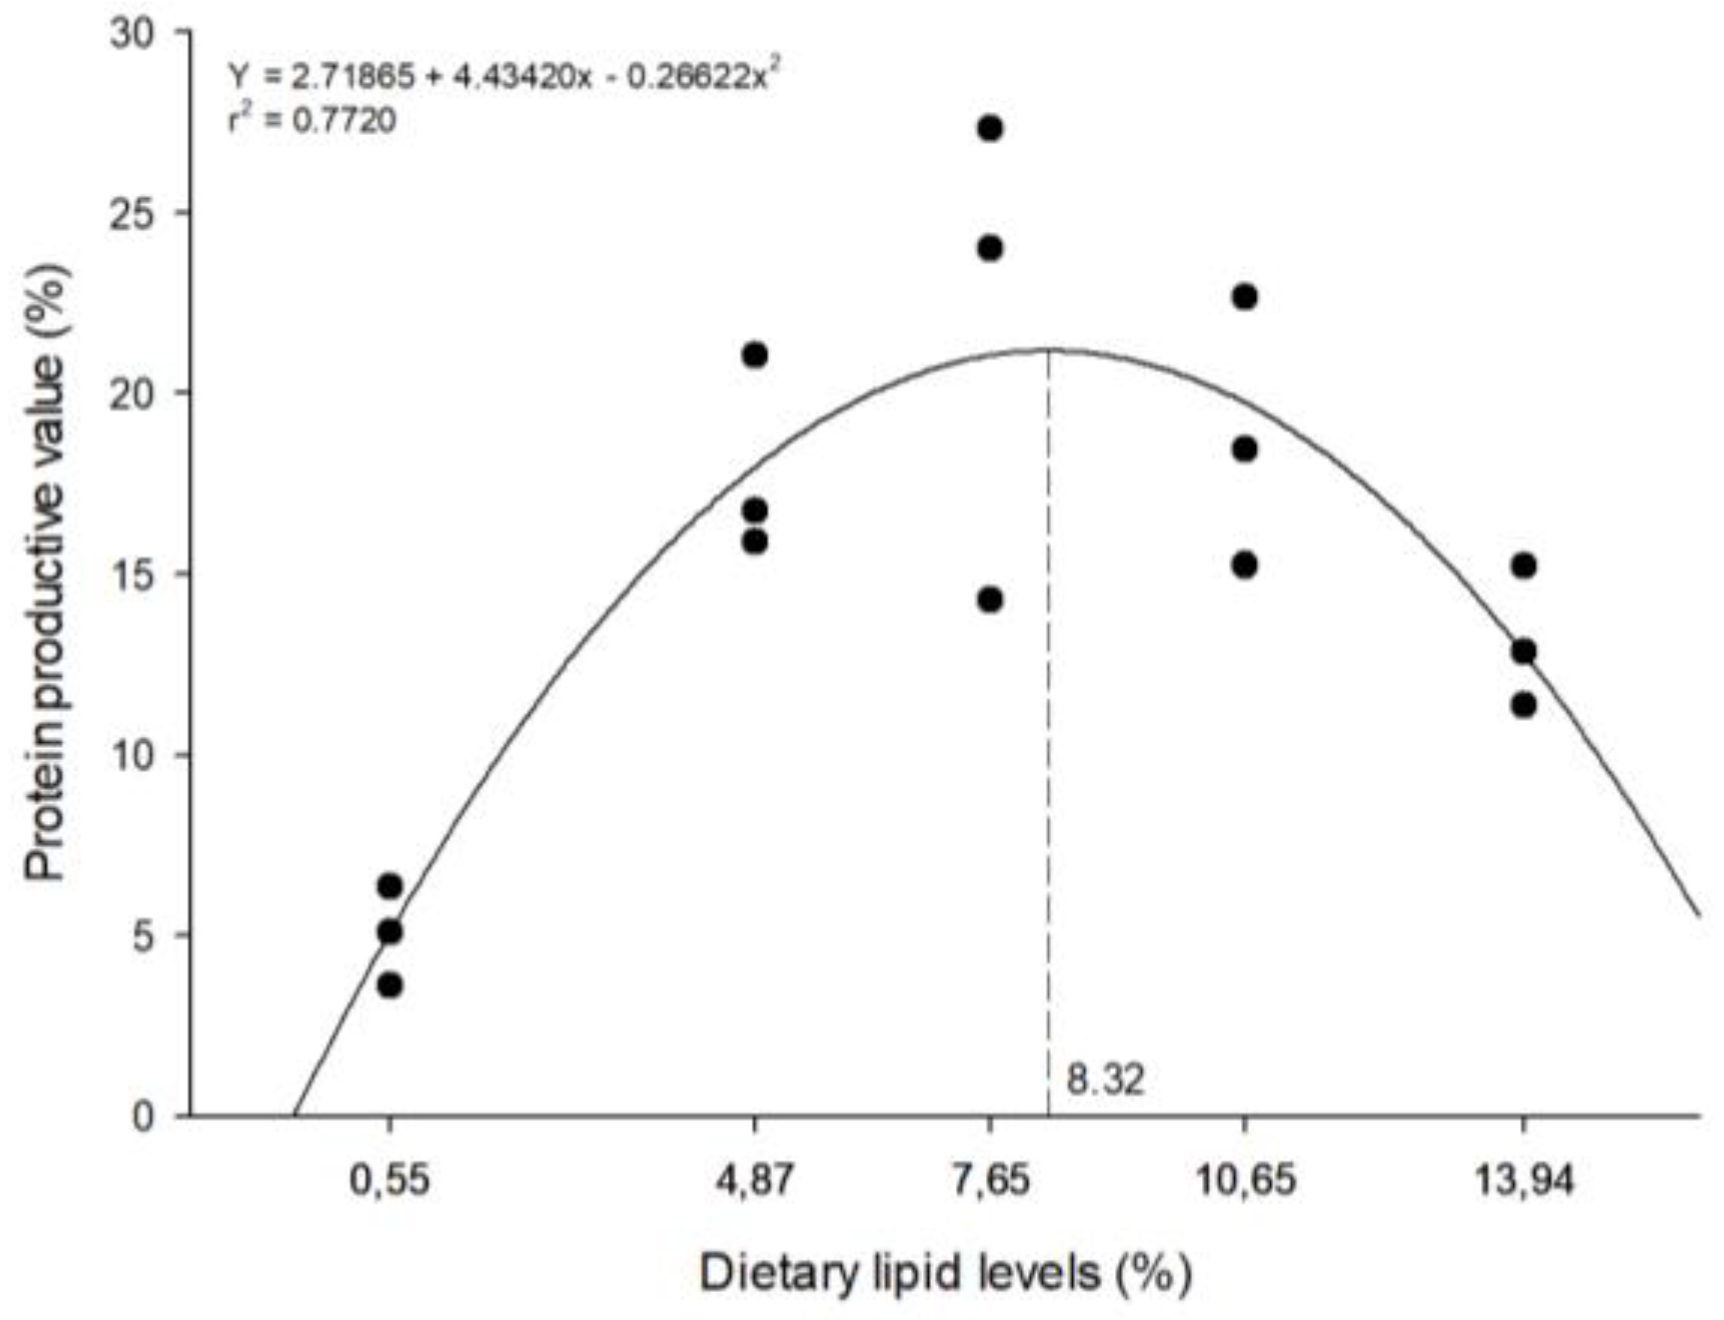
The highest feed efficiency rate was observed in fish fed a diet with 8.64% CL level (Figure 2), while the highest protein productive value was observed in fish fed a diet with 8.32% CL level (Figure 3). However, both these parameters decreased (p<0.05) in higher CL level.
There were no differences (p>0.05) in the whole-body moisture and crude protein of fish across all diets (Table 3). However, the CL in the fish body exhibited a significant increase (p<0.05) with rising dietary CL levels, following a quadratic trend (Y= 0.81937 + 0.21027x - 0.01211x2; r2= 0.5503).
The results of histomorphometry of zebrafish were summarized in Table 4. The measurements taken from the gut tissues did not differ (p>0.05) in fish fed with different experimental diets. The average diameter of adipocytes increased (p<0.05) in fish fed up to 10.65% dietary lipid, and decreased beyond this point.

4. Discussion

A suitable dietary lipid level is beneficial for growth, while a low or high lipid content can impair the growth and development of zebrafish, as demonstrated by this study. In fact, a dietary CL range of 6.5%-8.7% provided superior overall performance for D. rerio. This concentration is slightly lower than the 8% CL recommended by O’Brine et al. [23] , which was based on zebrafish growth. However, these authors adopted a restricted feeding management (5% BM/day), which differs from the apparent satiety used in the present study. Therefore, a lower dietary lipid concentration may be necessary to meet the energy requirements for growth when zebrafish are fed until apparent satiety. Moreover, the results obtained in this study align with those obtained for other species in the Cyprinidae family, such as grass carp (Ctenopharyngodon idella) [27,28] , catla (Catla catla) with 8% CL [29] and scaleless carp Gymnocypris przewalskii with 7.35% CL [21]. Conversely, crucian carp (Carassius auratus var. pengze) showed better growth at 5.1% [18], gibel carp (Carassius auratus gibelio) at 11.6%[22], and Israeli carp Cyprinus carpio at 14% [30], which are CL values largely different from those recorded for zebrafish in this study. These discrepant values for species in the same family reinforce the importance of determining the optimal dietary CL values for each species.
Fish fed basal diet had a low performance if compared to zebrafish fed lipid supplemented diets in all evaluated parameters. This poor performance can be attributed to a high carbohydrate-to-lipid ratio in this treatment. There is a noticeable limitation of fish to use high amount of soluble carbohydrates in diets [31]. Thus, as dietary lipid was unavailable, part of the protein of basal diet was used to provide energy to fish, decreasing growth, feed efficiency, and protein retention. Furthermore, the lower body score, body lipid concentration, and adipocyte diameter registered in fish fed the basal diet, indicating a possible mobilization of body lipid to provide energy for zebrafish. This study demonstrated that even an omnivorous species such as zebrafish cannot digest soluble carbohydrates as effectively as lipids. Therefore, the determination of the inclusion level of soluble carbohydrates, as well as the optimal carbohydrate: lipid ratio is an essential step to develop standard semi purified diets for zebrafish.
Additionally, adequate lipid levels also are needed to meet essential fatty acid requirements of fish. Although the fatty acids requirements are another gap in the knowledge about zebrafish nutrition, other species of cyprinids as common carp (Cyprinus carpio) and grass carp (Ctenopharyngodon idella) require a minimum of 1.0% of n-6 and 0.5-1.0% of n-3 of dry diets [32]. Essential fatty acid deficiencies can result in various pathologies, such as growth and reproduction disruption, and eventually death [16]. It is important to note that from the 29th day of the experiment, in two of the three aquaria, a decrease in the appetite of the zebrafish fed the 0.55% lipid diet was observed. Indeed, the only recorded fish mortalities occurred in the basal treatment, starting after 36 days of the experiment. This reinforces the hypothesis of body lipid mobilization to meet energy demand. It is plausible suppose that fish died when reached a “non-return point” due the depletion of lipid reserves.
Fish can use dietary protein to meet a significant portion of their energy requirements, although this is not ideal. Feed efficiency and protein retention of zebrafish were improved with increasing dietary lipid up to 8.32% and 8.6%, respectively, and decreased after these points. This result indicates that dietary protein was more efficient in the synthesis of body protein at an intermediate lipid level than energy consumption in a high lipid diet with a classical "protein-sparing effect". In addition, an appropriate ratio of lipids to carbohydrates (non-protein energy sources) also contributed to more efficient utilization of dietary protein by zebrafish. These results are consistent with previous reports in zebrafish [23] and other cyprinid species [27,30]. On the other hand, increasing dietary lipid does not result in protein-sparing in C. auratus [18], and curimatã-pacu Prochilodus argenteus [33].
Diets high in lipids can reduce feed intake, limiting nutrient intake and impairing growth performance [16]. Zebrafish showed lower feed intake when fed 7.65 and 10.65% CL if compared to unsupplemented lipid diets. Additionally, fish fed 4.87 and 13.94% CL showing intermediary ingestion of feed between unsupplemented and supplemented lipid diets. Meng et al [21] also observed a significant difference in feed intake when scaleless carp were fed diets with the lowest (4% CL) and highest (10% CL) lipid levels. However, similar feed intake (P>0.05) was reported by the same authors for fish fed 5.5, 7.0, and 8.5% crude lipid in the diet. Juvenile gibel carp showed similar feed intakes when fed diets ranging from 1.4% to 11.6% of CL [22]. In fact, when fish are fed to satiation, growth may depend not only on diet composition but also on the ability to regulate feed intake [34]. Zebrafish, like other cyprinids, showed to be able to regulate feed intake over a wide range of crude lipid levels.
Zebrafish are considered excellent models for diet-induced obesity through overfeeding or hypercaloric diets [34]. Usually, it is expected that increasing the lipid content of the diet will result in a proportional increase in body lipid content, as previously registered for grass carp [27], Israeli carp [30], and scaleless carp [21]. However, in this study higher body lipid content occurred in zebrafish feeding intermediary dietary lipid content (7.65% and 10.65%), decreasing around 14% in fish fed with high lipid diet. A similar trend was registered for adipocyte diameter, characterizing an obesity setting more pronounced in fish fed intermediate lipid levels. High dietary lipid:protein ratios can lead to metabolic stress resulting in low growth, protein retention, and feed efficiency, as occurred when zebrafish were fed diets containing more than 6.5, 8.3, and 8.6% crude lipid, respectively.
Typically, commercial diets for zebrafish have lipid contents ranging from 11% to 19%, which are about 2 to 2.5 times higher than those estimated in the present study. Despite the better palatability of practical diets than semi-purified diets, these values are higher than those reported for other cyprinid species, as previously discussed, except for the study by Aminikhoei et al. [30] that recommends 14% inclusion for Cyprinus carpio. In addition, not only the ratio of macronutrients but also the source of protein can influence fat accumulation in zebrafish [35] and consequently negatively affect the health of the fish. In fact, commercial diets use a variety of protein sources, for example in different batches of the same brand, unlike the casein-gelatin diets used in this study. These diets, when adequately supplied with lipids, were shown to be able to support adequate growth and health of zebrafish throughout the experimental period, becoming a reliable alternative to the use of commercial practical diets.

5. Conclusions

In conclusion, the ideal lipid level in semi-purified diets for zebrafish is between 6.5% and 8.6% of the diet.

Author Contributions

Conceptualization, A.J.A.B.; methodology, A.J.A.B., L.C.R.S. and A.R.C.B.V.; investigation, D.T., S.M., F.L.V. and B.F.V.S.; resources, A.J.A.B., L.C.R.S. and A.R.C.B.V.; data curation, A.J.A.B; writing—original draft preparation, D.T., S.M., F.L.V. and B.F.V.S.; writing—review and editing, A.J.A.B., L.C.R.S. and A.R.C.B.V.; supervision, A.J.A.B., L.C.R.S. and A.R.C.B.V.; project administration, A.J.A.B; funding acquisition, A.J.A.B., L.C.R.S. and A.R.C.B.V. All authors have read and agreed to the published version of the manuscript.

Funding

The authors are indebted to National Council of Scientific and Technological Development – CNPq (n° 404869/2021-1) and Federal University of Parana (n° 23075.019151/2023-68) for providing the financial support for this study.

Institutional Review Board Statement

The animal study protocol was approved by Ethics Committee on the Use of Animals of the Federal University of Paraná, Brazil (License nº 11/2022).

Data Availability Statement

The datasets generated and analyzed during the current study are available from the corresponding author on reasonable request.

Conflicts of Interest

The authors declare no conflict of interest.

References

  1. Trigueiro, N.S.D.S.; Canedo, A.; Braga, D.L.D.S.; Luchiari, A.C.; Rocha, T.L. Zebrafish as an emerging model system in the global south: Two decades of research in Brazil. Zebrafish 2020, 17, 412–425. [Google Scholar] [CrossRef]
  2. Canedo, A.; Saiki, P.; Santos, A.L.; da Silva Carneiro, K.; de Souza, A.M.; Qualhato, G.; da Silva Brito, R.; Mello-Andrade, F.; Rocha, T.L. Zebrafish (Danio rerio) meets bioethics: the 10Rs ethical principles in research. Cienc. Anim. Bras. 2022, 23. [Google Scholar] [CrossRef]
  3. Watts, S.A.; Lawrence, C.; Powell, M.L.; D’Abramo, L.R.; D’Abramo, L. The vital relationship between nutrition and health in zebrafish. Zebrafish 2016, 13 (Suppl. 1), S72–S76. [Google Scholar] [CrossRef] [PubMed]
  4. Brenes-Soto, A.; Tye, M.; Esmail, M.Y. The role of feed in aquatic laboratory animal nutrition and the potential impact on animal models and study reproducibility. ILAR J. 2019, 60, 197–215. [Google Scholar] [CrossRef]
  5. Carvalho, A.P.; Araujo, L.; Santos, M.M.; Araújo, L.; Santos, M.M. Rearing zebrafish (Danio rerio) larvae without live food: evaluation of a commercial, a practical and a purified starter diet on larval performance. Aquac. Res. 2006, 37, 1107–1111. [Google Scholar] [CrossRef]
  6. Siccardi, A.J.; Garris, H.W.; Jones, W.T.; Moseley, D.B.; D’Abramo, L.R.; Watts, S.A. Growth and survival of zebrafish (Danio rerio) fed different commercial and laboratory diets. Zebrafish 2009, 6, 275–280. [Google Scholar] [CrossRef]
  7. Farias, M.; Certal, A.C. Different feeds and feeding regimens have an impact on zebrafish larval rearing and breeding performance. Int. J. Mar. Biol. Res. 2016, 1, 1–8. [Google Scholar] [CrossRef]
  8. Kolb, A.; Hildebrandt, F.; Lawrence, C. Effects of diet and social housing on reproductive success in adult zebrafish, Danio rerio. Zebrafish 2018, 15, 445–453. [Google Scholar] [CrossRef] [PubMed]
  9. Monteiro, J.; Martins, S.; Farias, M.; Costa, T.; Certal, A.C. The impact of two different cold-extruded feeds and feeding regimens on zebrafish survival, growth and reproductive performance. J. Dev. Biol. 2018, 6, null. [Google Scholar] [CrossRef]
  10. Fowler, L.A.; Williams, M.B.; Dennis-Cornelius, L.N.; Farmer, S.C.; Barry, R.J.; Powell, M.L.; Watts, S.A. Influence of commercial and laboratory diets on growth, body composition, and reproduction in the zebrafish Danio rerio. Zebrafish 2019, 16, 508–521. [Google Scholar] [CrossRef]
  11. Dhanasiri, A.; Chen, X.; Dahle, D.; Siriyappagouder, P.; Fæste, C.K.; Fernandes, J.M.O. Dietary inclusion of plant ingredients induces epigenetic changes in the intestine of zebrafish. Epigenetics 2020, 15, 1035–1051. [Google Scholar] [CrossRef] [PubMed]
  12. Fowler, L.A.; Dennis-Cornelius, L.N.; Dawson, J.A.; Barry, R.; Davis, J.L.; Powell, M.L.; Yuan, Y.; Williams, M.B.; Makowsky, R.; D’Abramo, L.R.; et al. Both dietary ratio of n–6 to n–3 fatty acids and total dietary lipid are positively associated with adiposity and reproductive health in zebrafish. Curr. Dev. Nutr. 2020, 4, 1–11. [Google Scholar] [CrossRef] [PubMed]
  13. Xu, Y.; Zhang, S.; Luan, J.-L.; Fu, Z.-H.; Sun, M.-Z.; Zhao, X.; Feng, X.-Z. The food preservative sodium propionate induces hyperglycaemic state and neurological disorder in zebrafish. Neurotoxicol. Teratol. 2022, 93, 107123. [Google Scholar] [CrossRef] [PubMed]
  14. Watts, S.A.; D’Abramo, L.R. Standardized reference diets for zebrafish: addressing nutritional control in experimental methodology. Annu. Rev. Nutr. 2021, 41, 511–527. [Google Scholar] [CrossRef] [PubMed]
  15. Smith, D.L.; Barry, R.J.; Powell, M.L.; Nagy, T.R.; D’Abramo, L.R.; Watts, S.A. Dietary protein source influence on body size and composition in growing zebrafish. Zebrafish 2013, 10, 439–446. [Google Scholar] [CrossRef] [PubMed]
  16. NRC, N.R.C. Nutrients requirements of fish and shrimp; The National Academies Press: Washington, DC, USA, 2011. [Google Scholar]
  17. Cai, F.; Wang, Y.; Hu, X.; Huang, F.; Wang, F.; Liu, H. Effects of dietary lipid levels on growth performance, whole body composition and digestive enzyme activity of juvenile bighead carp (Aristichthys nobilis). Isr. J. Aquac. - Bamidgeh 2020, 72, 1–10. [Google Scholar] [CrossRef]
  18. Ding, L.; Chen, W.; Fu, H.; Xiao, J.; Fu, Y.; Ma, J. Estimation of the Optimum Dietary Protein to Lipid Ratio in Juvenile Pengze Crucian Carp (Carassius auratus Var. Pengze). Aquac. Nutr. 2022, 2022. [Google Scholar] [CrossRef]
  19. Meguro, S.; Hosoi, S.; Hasumura, T. High-fat diet impairs cognitive function of zebrafish. Sci. Rep. 2019, 9, 17063. [Google Scholar] [CrossRef] [PubMed]
  20. Li, J.; Xia, D.; Jing, X.; Zhao, Y.; Hao, Q.; Zhang, Q.; Xie, M.; Yang, Y.; Ran, C.; Xu, Q.; et al. Addition of solid-state fermentation product of yeast ameliorated the effects of high-fat diet on hepatic lipid metabolism, epidermal mucus, intestine and liver health, and gut microbiota of zebrafish. Aquac. Reports 2023, 30, 101589. [Google Scholar] [CrossRef]
  21. Meng, Y.; Li, C.; Qin, Q.; Tong, Y.; Zhu, R.; Xu, G.; Shi, Y.; Shi, J.; Ma, R. Dietary Lipid Levels Affect the Growth Performance, Lipid Deposition, and Antioxidative Capacity of Juvenile Scaleless Carp, Gymnocypris przewalskii, on the Qinghai-Tibetan Plateau. J. World Aquac. Soc. 2018, 49, 788–797. [Google Scholar] [CrossRef]
  22. Wang, A.; Yang, W.; Shen, Y.; Han, G.; Lv, F.; Yu, Y.; Huang, J.; Zhang, J. Effects of dietary lipid levels on growth performance, whole body composition and fatty acid composition of juvenile gibel carp (Carassius auratus gibelio). Aquac. Res. 2015, 46, 2819–2828. [Google Scholar] [CrossRef]
  23. O’Brine, T.M.; Vrtělová, J.; Snellgrove, D.L.; Davies, S.J.; Sloman, K.A. Growth, oxygen consumption, and behavioral responses of Danio rerio to variation in dietary protein and lipid levels. Zebrafish 2015, 12, 296–304. [Google Scholar] [CrossRef] [PubMed]
  24. Clark, T.S.; Pandolfo, L.M.; Marshall, C.M.; Mitra, A.K.; Schech, J.M. Body condition scoring for adult zebrafish (Danio rerio). J. Am. Assoc. Lab. Anim. Sci. 2018, 57, 698–702. [Google Scholar] [CrossRef] [PubMed]
  25. Association of Official Analytical Chemists - AOAC. Official Methods of Analysis, 15th ed.; Helrich, K., Ed.; Association of Official Analytical Chemists, Inc.: Arlington, Virginia, USA, 1990; Vol. 1. [Google Scholar]
  26. Chen, T.; Xu, M.; Tu, J.; Wang, H.; Niu, X. Relationship between omnibus and post-hoc tests : an investigation of performance of the F test in ANOVA. Shanghai Arch. Psychiatry 2018, 30, 60–64. [Google Scholar] [CrossRef]
  27. Jin, Y.; Tian, L.; Zeng, S.; Xie, S.; Yang, H.; Liang, G.; Liu, Y. Dietary lipid requirement on non-specific immune responses in juvenile grass carp (Ctenopharyngodon idella). Fish Shellfish Immunol. 2013, 34, 1202–8. [Google Scholar] [CrossRef] [PubMed]
  28. Feng, L.; Ni, P.J.; Jiang, W.D.; Wu, P.; Liu, Y.; Jiang, J.; Kuang, S.Y.; Tang, L.; Tang, W.N.; Zhang, Y.A.; et al. Decreased enteritis resistance ability by dietary low or excess levels of lipids through impairing the intestinal physical and immune barriers function of young grass carp (Ctenopharyngodon idella). Fish Shellfish Immunol. 2017, 67, 493–512. [Google Scholar] [CrossRef]
  29. Priya, K.; Pal, A.K.; Sahu, N.P.; Mukherjee, S.C. Effect of dietary lipid sources on growth, enzyme activities and immuno-hematological parameters in Catla catla fingerlings. Asian-Australasian J. Anim. Sci. 2005, 18, 1609–1616. [Google Scholar] [CrossRef]
  30. Aminikhoei, Z.; Choi, J.; Lee, S.-M. Optimal dietary protein and lipid levels for growth of juvenile Israeli carp Cyprinus carpio. Fish. Aquat. Sci. 2015, 18, 265–271. [Google Scholar] [CrossRef]
  31. NRC, N.R.C. Nutrient Requirements of Laboratory Animals: Fourth Revised Edition, 4th ed.; Subcommittee on Laboratory Animal, Nutrition, Ed.; National Research Council: Washington, DC, USA, 1995. [Google Scholar]
  32. Takeuchi, T. Essential fatty acid requirements in carp. Arch. Anim. Nutr. 1996, 49, 23–32. [Google Scholar] [CrossRef]
  33. Duarte Silva, G.; Cavalcante Lucena, J.; Cavalcanti, O.; Almeida Bicudo, A. Growth and body composition of juvenile curimata pacu (Prochilodus argenteus) fed diets with different protein: lipid ratios. Lat. Am. J. Aquat. Res. 2019, 47, 114–121. [Google Scholar] [CrossRef]
  34. Virote, B. do C.R.; Moreira, A.M.S.; Silva Souza, J.G. da; Castro, T.F.D.; Melo, N.; Carneiro, W.F.; Drummond, C.D.; Vianna, A.R. da C.B.; Murgas, L.D.S. Obesity induction in adult zebrafish leads to negative reproduction and offspring effects. Reproduction 2020, 160, 833–842. [Google Scholar] [CrossRef]
  35. Williams, M.B.; Dennis-Cornelius, L.N.; Miyasaki, N.D.; Barry, R.J.; Powell, M.L.; Makowsky, R.A.; Fowler, L.A.; Watts, S.A.; Smith, D.L. Macronutrient Ratio Modification in a Semi-Purified Diet Composition: Effects on Growth and Body Composition of Juvenile Zebrafish Danio rerio. N. Am. J. Aquac. 2022, 84, 493–504. [Google Scholar] [CrossRef]
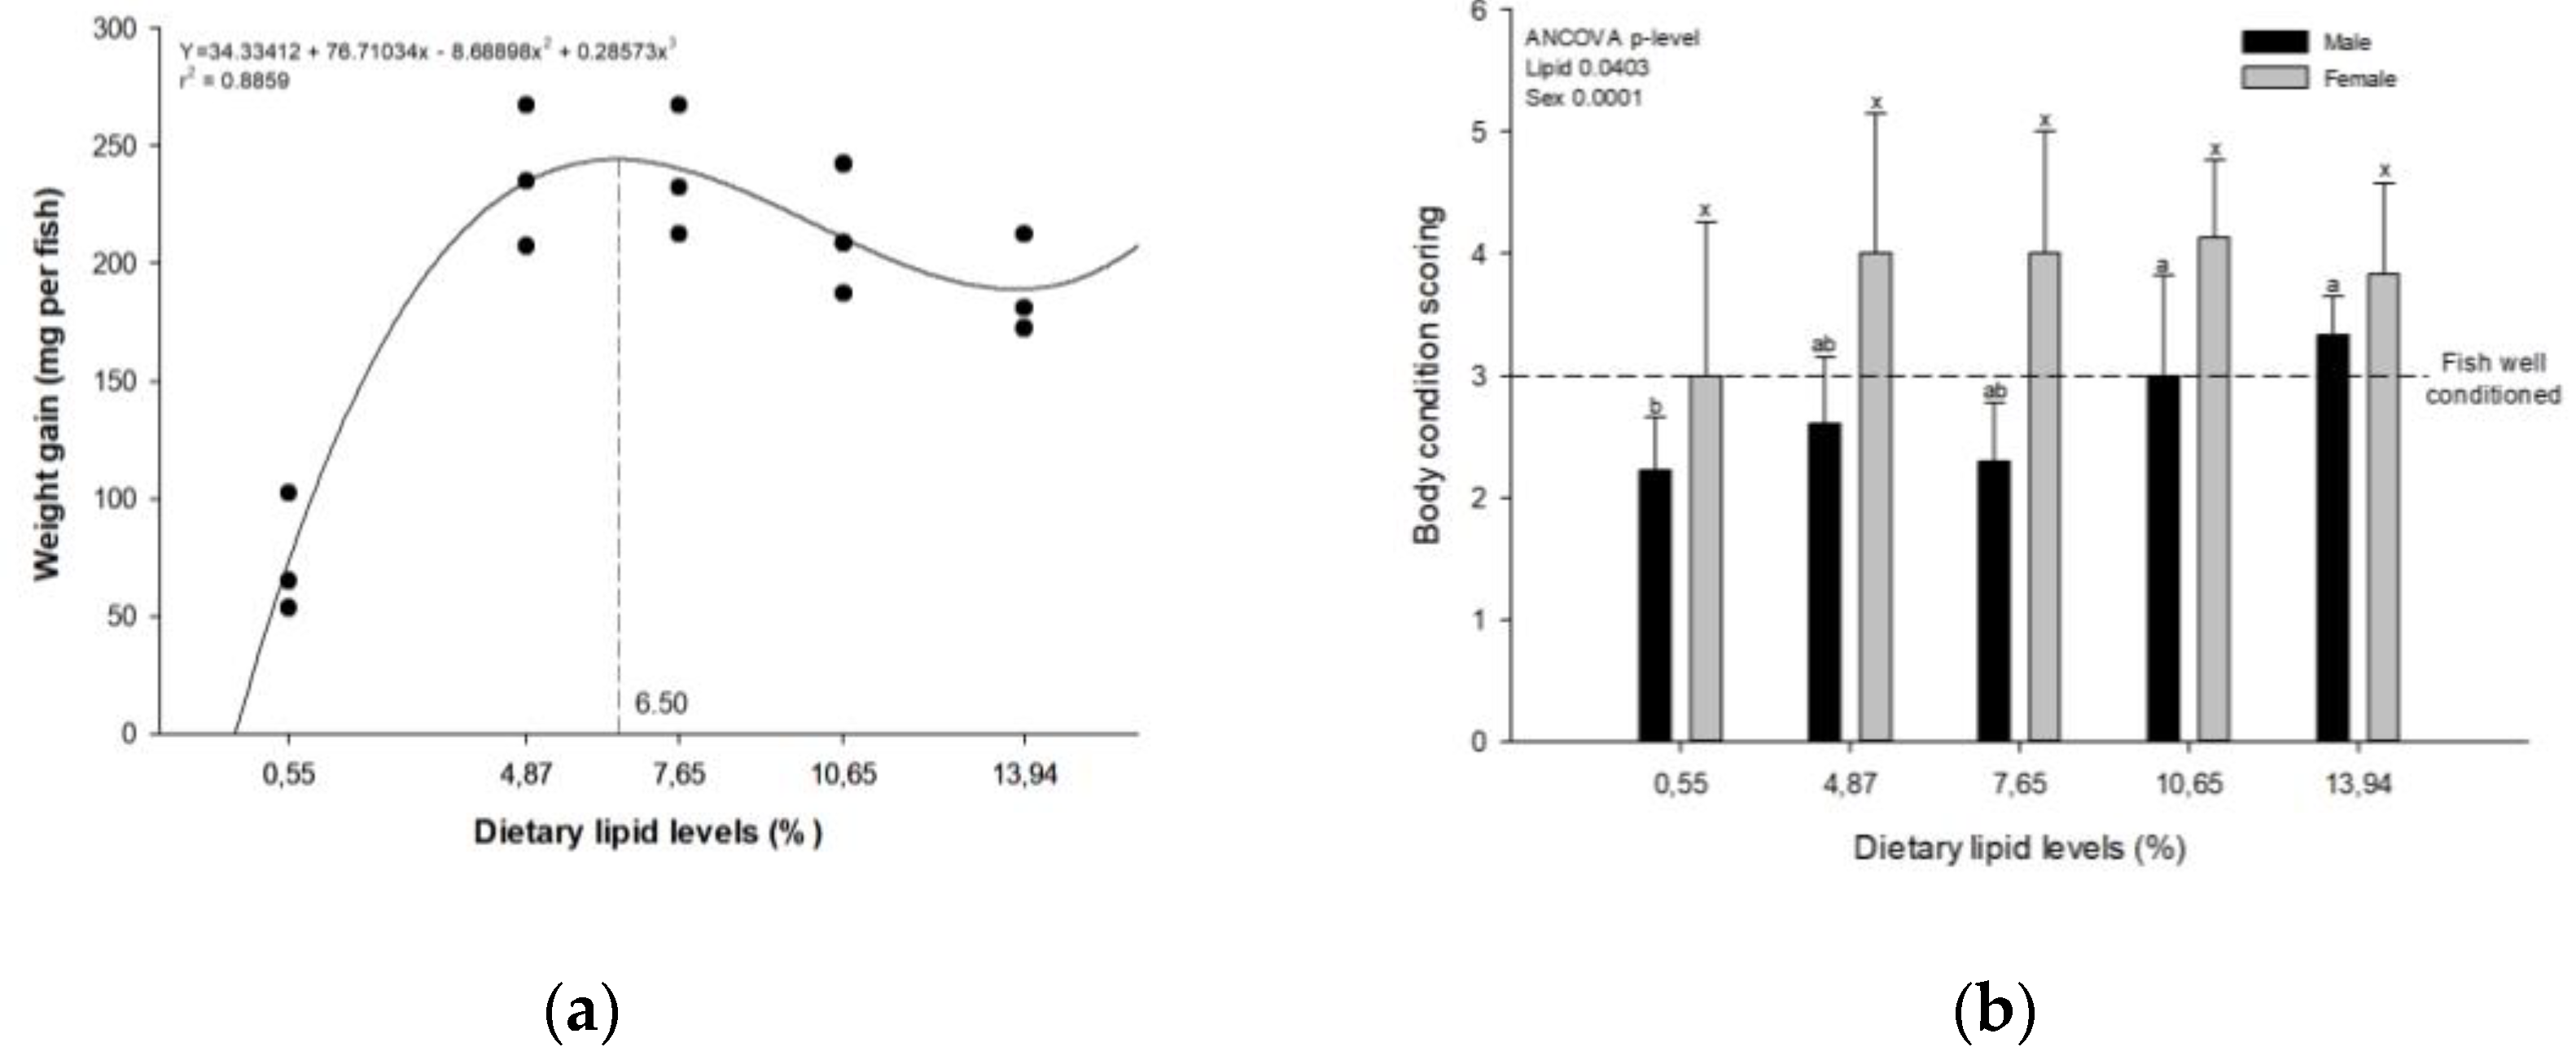
Figure 1. Growth parameters of zebrafish fed semi-purified diets containing increasing levels of crude lipids after 40 days of trial: (a) relationship between weigh gain and dietary lipid levels (dashed line indicates the level of dietary lipid for maximum response); (b) body condition scoring grouped by sex and dietary lipid levels (dashed line indicates ideal score according Clarck et al. [24]. The bars with different superscripts indicate significant difference (P < 0.05) between the zebrafish groups fed with varying levels of crude lipids according to Duncan's Multiple Range Test.
Preprints 94547 g001
Figure 2. The relationship between feed efficiency ratio of zebrafish and the levels of crude lipid levels in semi-purified diets over a period of 40 days. The dashed line on the graph indicates the estimated level of crude lipid for maximum response.
Preprints 94547 g002
Figure 3. The relationship between protein productive value of zebrafish and the levels of crude lipid levels in semi-purified diets over a period of 40 days. The dashed line on the graph indicates the estimated level of crude lipid for maximum response.
Preprints 94547 g003
Table 1. Ingredients and chemical composition of semi-purified diets for zebrafish.
Ingredients (%) Dietary crude lipid levels (% of diet)
0.55 4.87 7.65 10.65 13.94
Casein 42.00 42.00 42.00 42.00 42.00
Corn starch 31.43 26.43 21.43 16.43 11.43
Gelatin 7.00 7.00 7.00 7.00 7.00
Dicalcium phosphate 6.20 6.20 6.20 6.20 6.20
Microfine cellulose 3.00 3.00 3.00 3.00 3.00
Mineral and vitamin supplement1 3.00 3.00 3.00 3.00 3.00
Carboxymethylcellulose 2.00 2.00 2.00 2.00 2.00
Dextrin 5.00 5.00 5.00 5.00 5.00
Choline chloride 0.20 0.20 0.20 0.20 0.20
Betaine 0.15 0.15 0.15 0.15 0.15
Soy lecithin 0.00 1.00 2.00 3.00 4.00
Fish oil 0.00 2.00 4.00 6.00 8.00
Soybean oil 0.00 2.00 4.00 6.00 8.00
BHT 0.02 0.02 0.02 0.02 0.02
Analyzed chemical composition
Moisture (%) 93.6 94.3 95.9 96.3 97.0
Crude protein (%) 42.3 42.1 41.4 40.5 39.1
Crude lipid (%) 0.55 4.87 7.65 10.65 13.94
Ash (%) 10.25 10.88 10.97 11.23 10.61
Gross energy (kcal/kg) 4030 4223 4612 4869 4858
1 Composition per kilogram of product (Tectron, Toledo, Paraná, Brazil): Vitamin A 1,000,000 IU; Vitamin D3 500,000 IU; Vitamin E 20,000 IU; Vitamin K3 500 mg; Vitamin B1 1,900 mg; Vitamin B2 2,000 mg; Vitamin B6 2,400 mg; Vitamin B12 3,500 μg; Vitamin C 25 g; Niacin 5,000 mg; Pantothenic Acid 4,000 mg; Folic Acid 200 mg; Biotin 40 mg; Manganese 7,500 mg; Zinc 25 g; Iron 12.5 g; Copper 2,000 mg; Iodine 200 mg; Selenium 70 mg; BHT 300 mg.
Table 2. Performance parameters of zebrafish fed semi-purified diets containing increasing levels of crude lipids after 40 days of trial.
Ingredients (%) Dietary crude lipid levels (% of diet) p-value
0.55 4.87 7.65 10.65 13.94
Initial weight (mg/fish) 236.67±21.26 a 232.08±23.40 a 232.92±23.76 a 232.08±1.91 a 225.83±10.63 a 0.9656
Final weight (mg/fish) 310.33±41.22 b 468.75±40.10 a 470.42±21.84 a 445.00±26.34 a 414.58±27.68 a 0.0006
Weight gain (mg/fish) 73.67±25.62 b 236.67±30.03 a 237.50±27.84 a 212.92±27.74 a 188.75±21.03 a 0.0001
Specific growth rate (% live weight/day) 0.67±0.18 b 1.76±0.19 a 1.76±0.26 a 1.63±0.16 a 1.52±0.11 a 0.0001
Fork length (mm) 28.26±2.07 c 30.54± 3.69 ab 30.78±1.75 ab 32.06±1.92 a 29.84±1.71 bc 0.0396
Body condition scoring 2.53±0.92 b 3.42±1.16 a 3.00±1.13 ab 3.75±0.87 a 3.42±0.79 a 0.0225
Daily feed intake (% live weight/day) 5.64±1.84 a 4.20±0.09 ab 3.70±0.30 b 3.71±0.26 b 4.49±0.15 ab 0.0963
Feed efficiency ratio (g:g) 0.12±0.04 c 0.40±0.04 a 0.46±0.05 a 0.43±0.07 a 0.33±0.01 b 0.0001
Protein productive value (%) 5.01±1.35 c 17.89±2.76 ab 21.88±6.79 a 18.78±3.71 ab 13.13±1.95 b 0.0025
Survival rate (%) 70.83±26.02 b 100.00±0.00 a 100.00±0.00 a 100.00±0.00 a 100.00±0.00 a 0.0404
Values in the same row with different superscripts are significantly different according to Duncan's Multiple Range Test (P < 0.05).
Table 3. Whole-body composition (wet basis) of zebrafish fed semi-purified diets containing increasing levels of crude lipids after 40 days of trial.
Ingredients (%) Dietary crude lipid levels (% of diet) p-value
0.55 4.87 7.65 10.65 13.94
Moisture (%) 73.74±1.23 73.75± 0.57 72.91± 2.68 72.84± 0.32 73.49± 1.04 0.8782
Crude protein (%) 17.03±0.06 17.01± 0.50 17.41± 1.97 16.99± 0.36 16.67± 0.67 0.9211
Crude lipid (%) 0.94±0.41 b 1.46± 0.25 ab 1.62± 0.48 a 1.62± 0.13 a 1.40± 0.33 ab <.0001
Values in the same row with different superscripts are significantly different according to Duncan's Multiple Range Test (P < 0.05).
Table 4. Histomorphometry of zebrafish tissues fed semi-purified diets with increasing levels of crude lipids after 40 days of trial.
Ingredients (%) Dietary crude lipid levels (% of diet) p-value
0.55 4.87 7.65 10.65 13.94
Intestinal villi height (µm) 204.56±20.12 199.34±30.06 199.12±28.66 258.94± 74.99 207.89±11.21 0.3586
Intestinal villi width (µm) 77.08±14.48 83.25±8.07 71.39± 11.01 79.53± 8.32 74.89± 17.63 0.8097
Muscularis mucosa thickness (µm) 26.60±3.49 24.45±8.34 22.96±3.81 22.17± 8.36 25.47± 6.97 0.9174
External perimeter (×103 µm) 2.52± 0.37 3.45±0.74 2.78± 0.52 2.55±0.51 2.49± 0.29 0.1904
Absorptive perimeter (×103 µm) 4.22±1.95 1.95±0.95 1.93±1.23 3.18±0.05 3.63±2.63 0.5971
Adipocyte average diameter 30.82±4.54 c 48.22±10.18 ab 42.97±4.24 bc 61.85±11.61 a 50.46±7.07 ab 0.0107
Values in the same row with different superscripts are significantly different according to Duncan's Multiple Range Test (P < 0.05).
Disclaimer/Publisher’s Note: The statements, opinions and data contained in all publications are solely those of the individual author(s) and contributor(s) and not of MDPI and/or the editor(s). MDPI and/or the editor(s) disclaim responsibility for any injury to people or property resulting from any ideas, methods, instructions or products referred to in the content.
Copyright: This open access article is published under a Creative Commons CC BY 4.0 license, which permit the free download, distribution, and reuse, provided that the author and preprint are cited in any reuse.
Prerpints.org logo

Preprints.org is a free preprint server supported by MDPI in Basel, Switzerland.

Subscribe

© 2024 MDPI (Basel, Switzerland) unless otherwise stated