Submitted:
27 December 2023
Posted:
27 December 2023
You are already at the latest version
Abstract
Keywords:
1. Introduction
2. Materials and Methods
2.1. Soil Sampling
2.2. Experimental Design
2.3. Statistical Analyses
3. Results
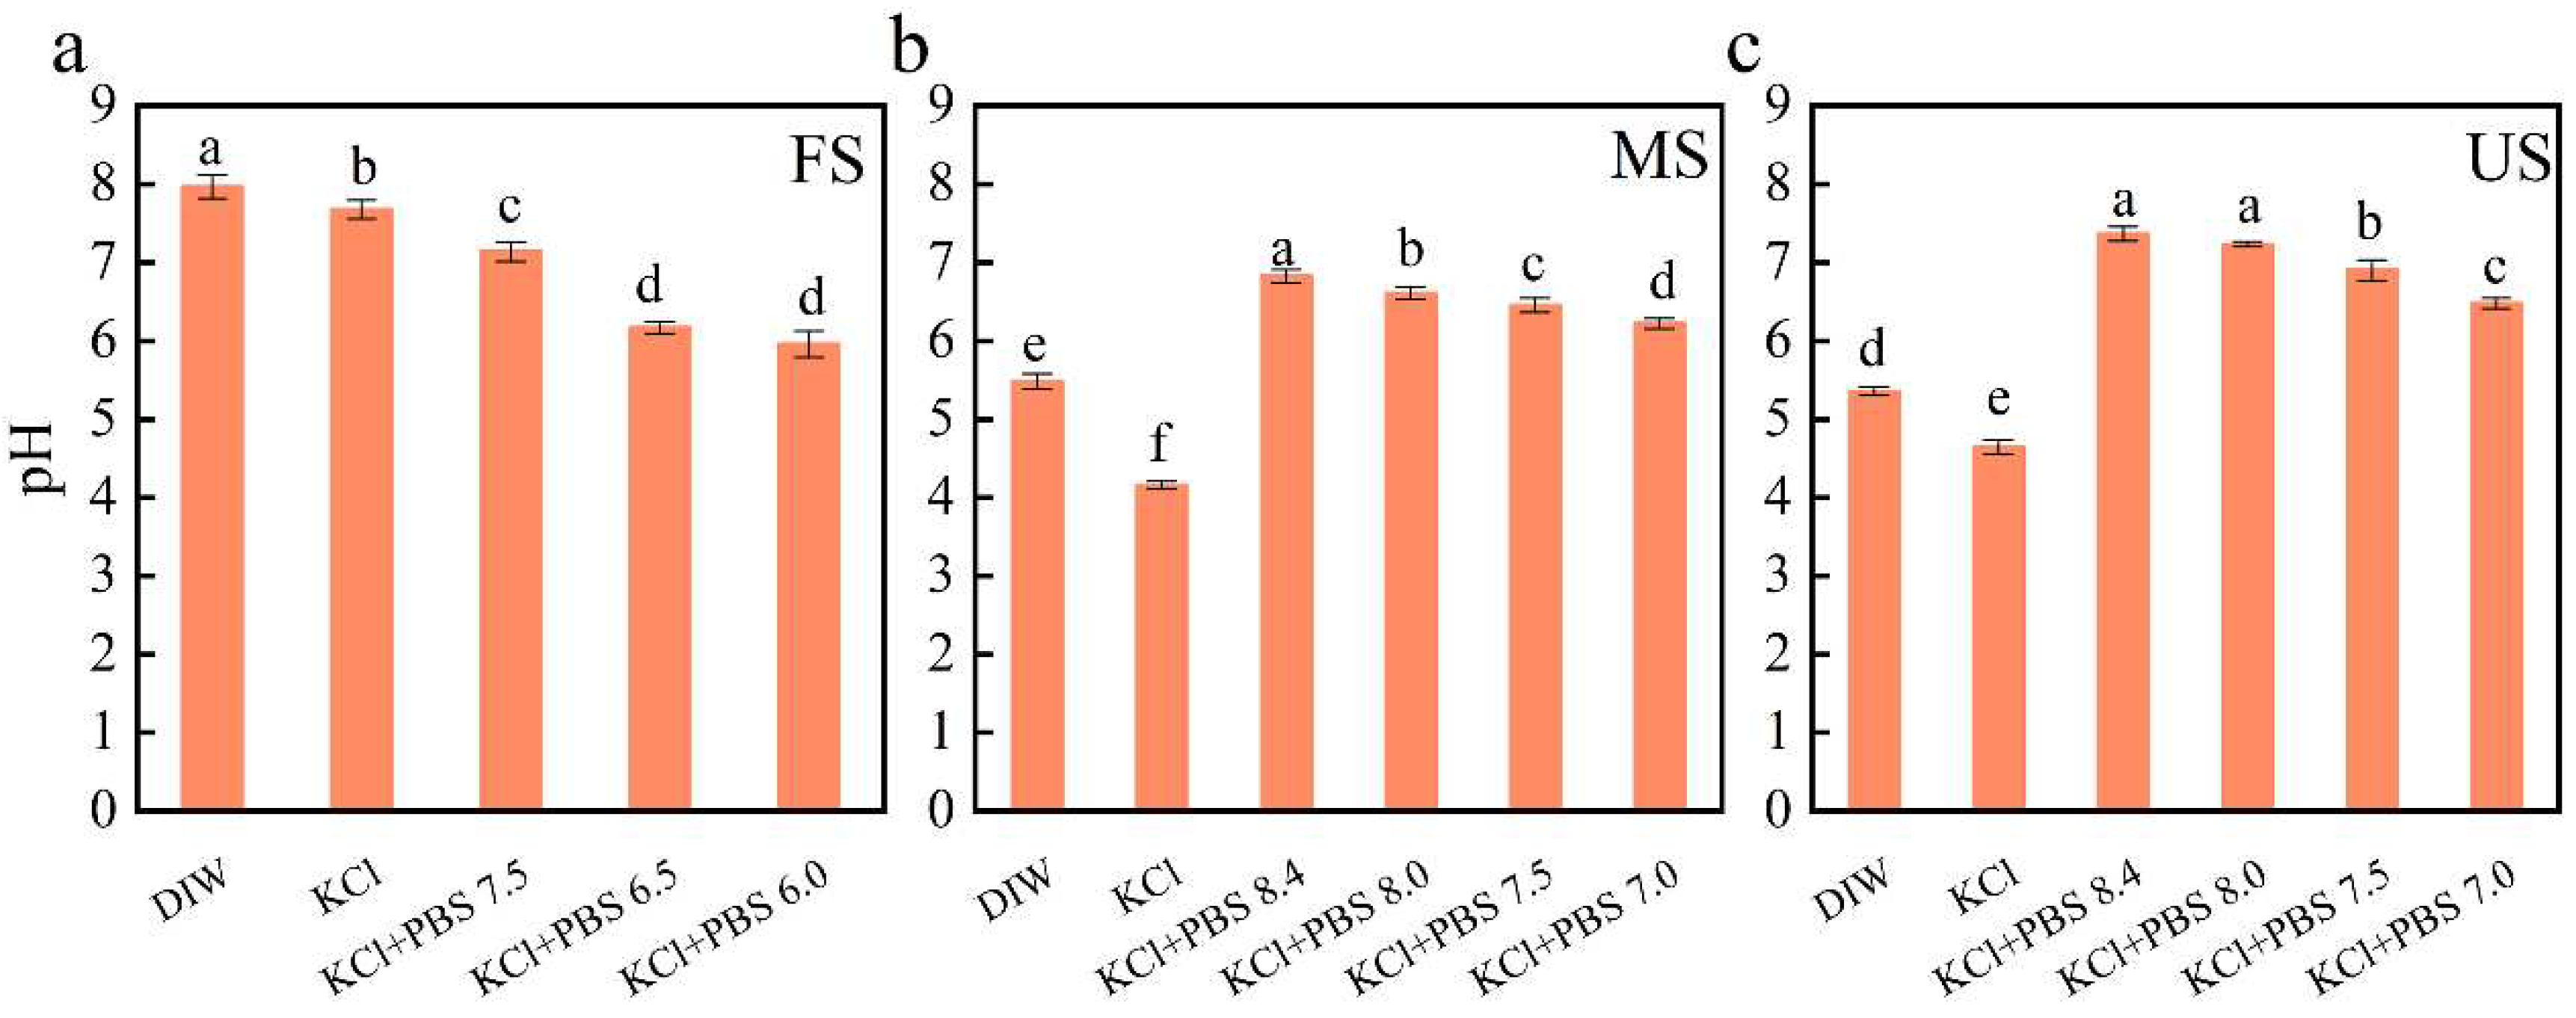
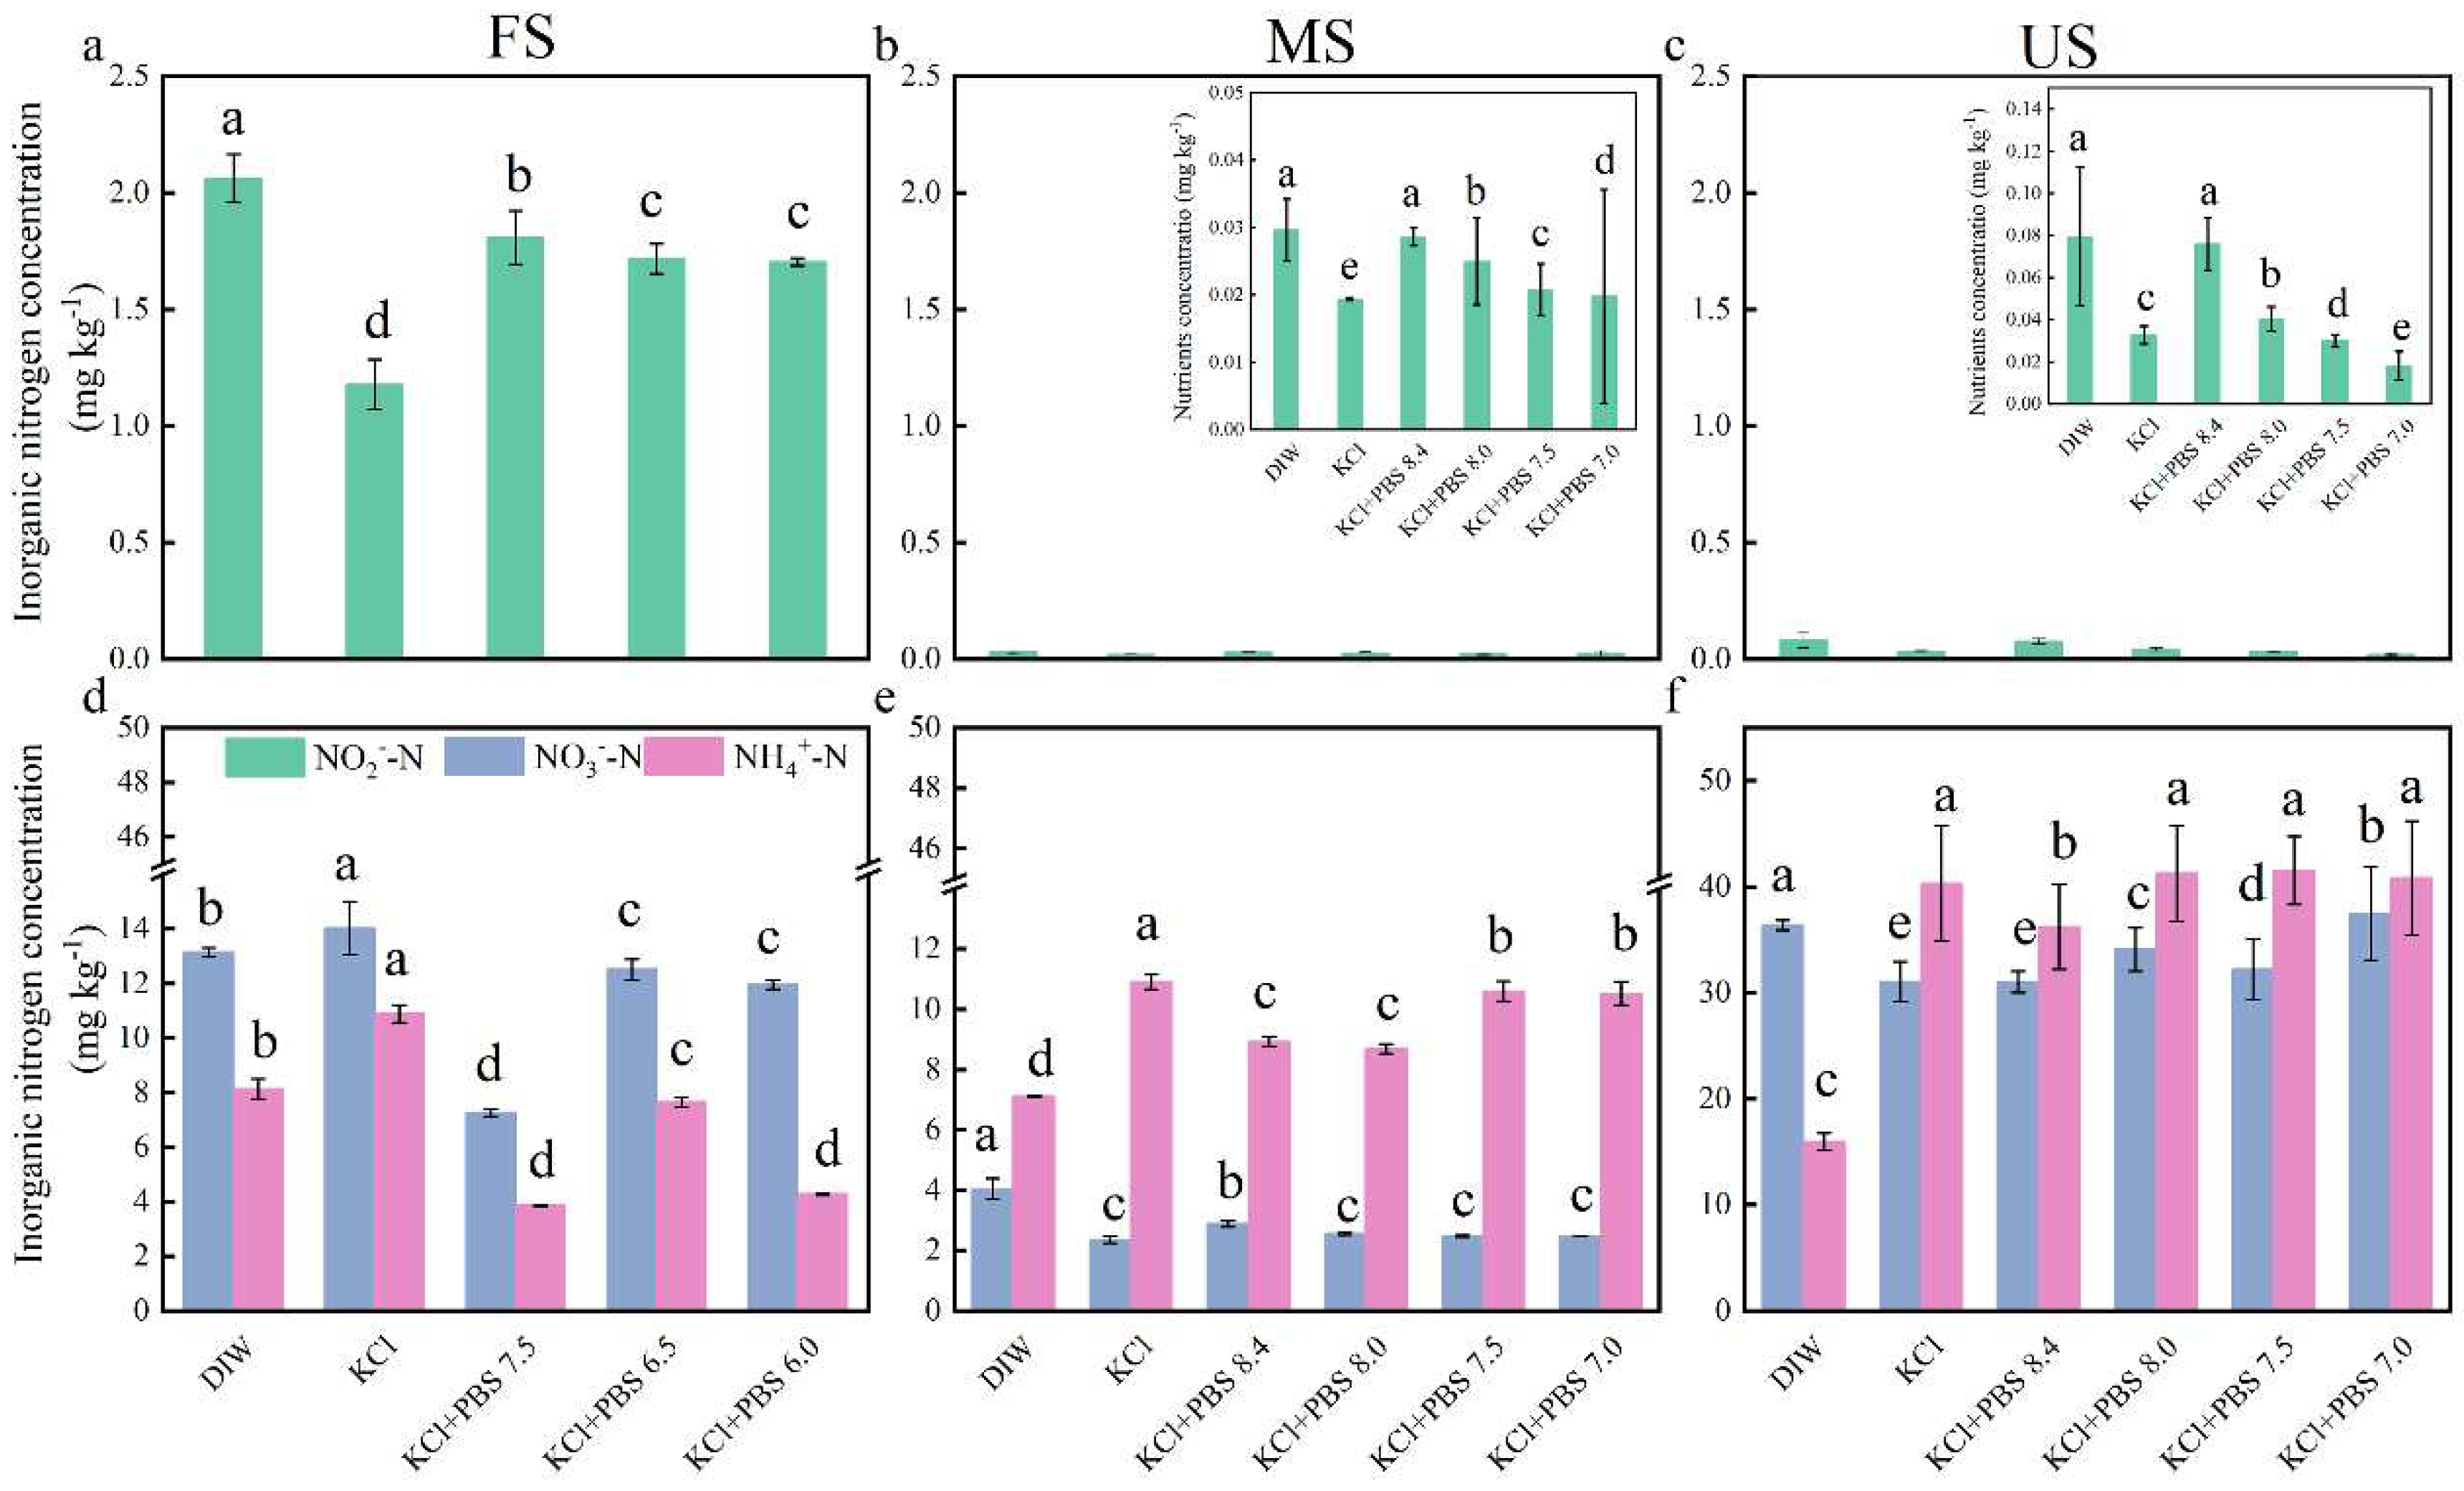
3.1. DIW Extraction Can Achieve Higher Soil NO2‒ Content
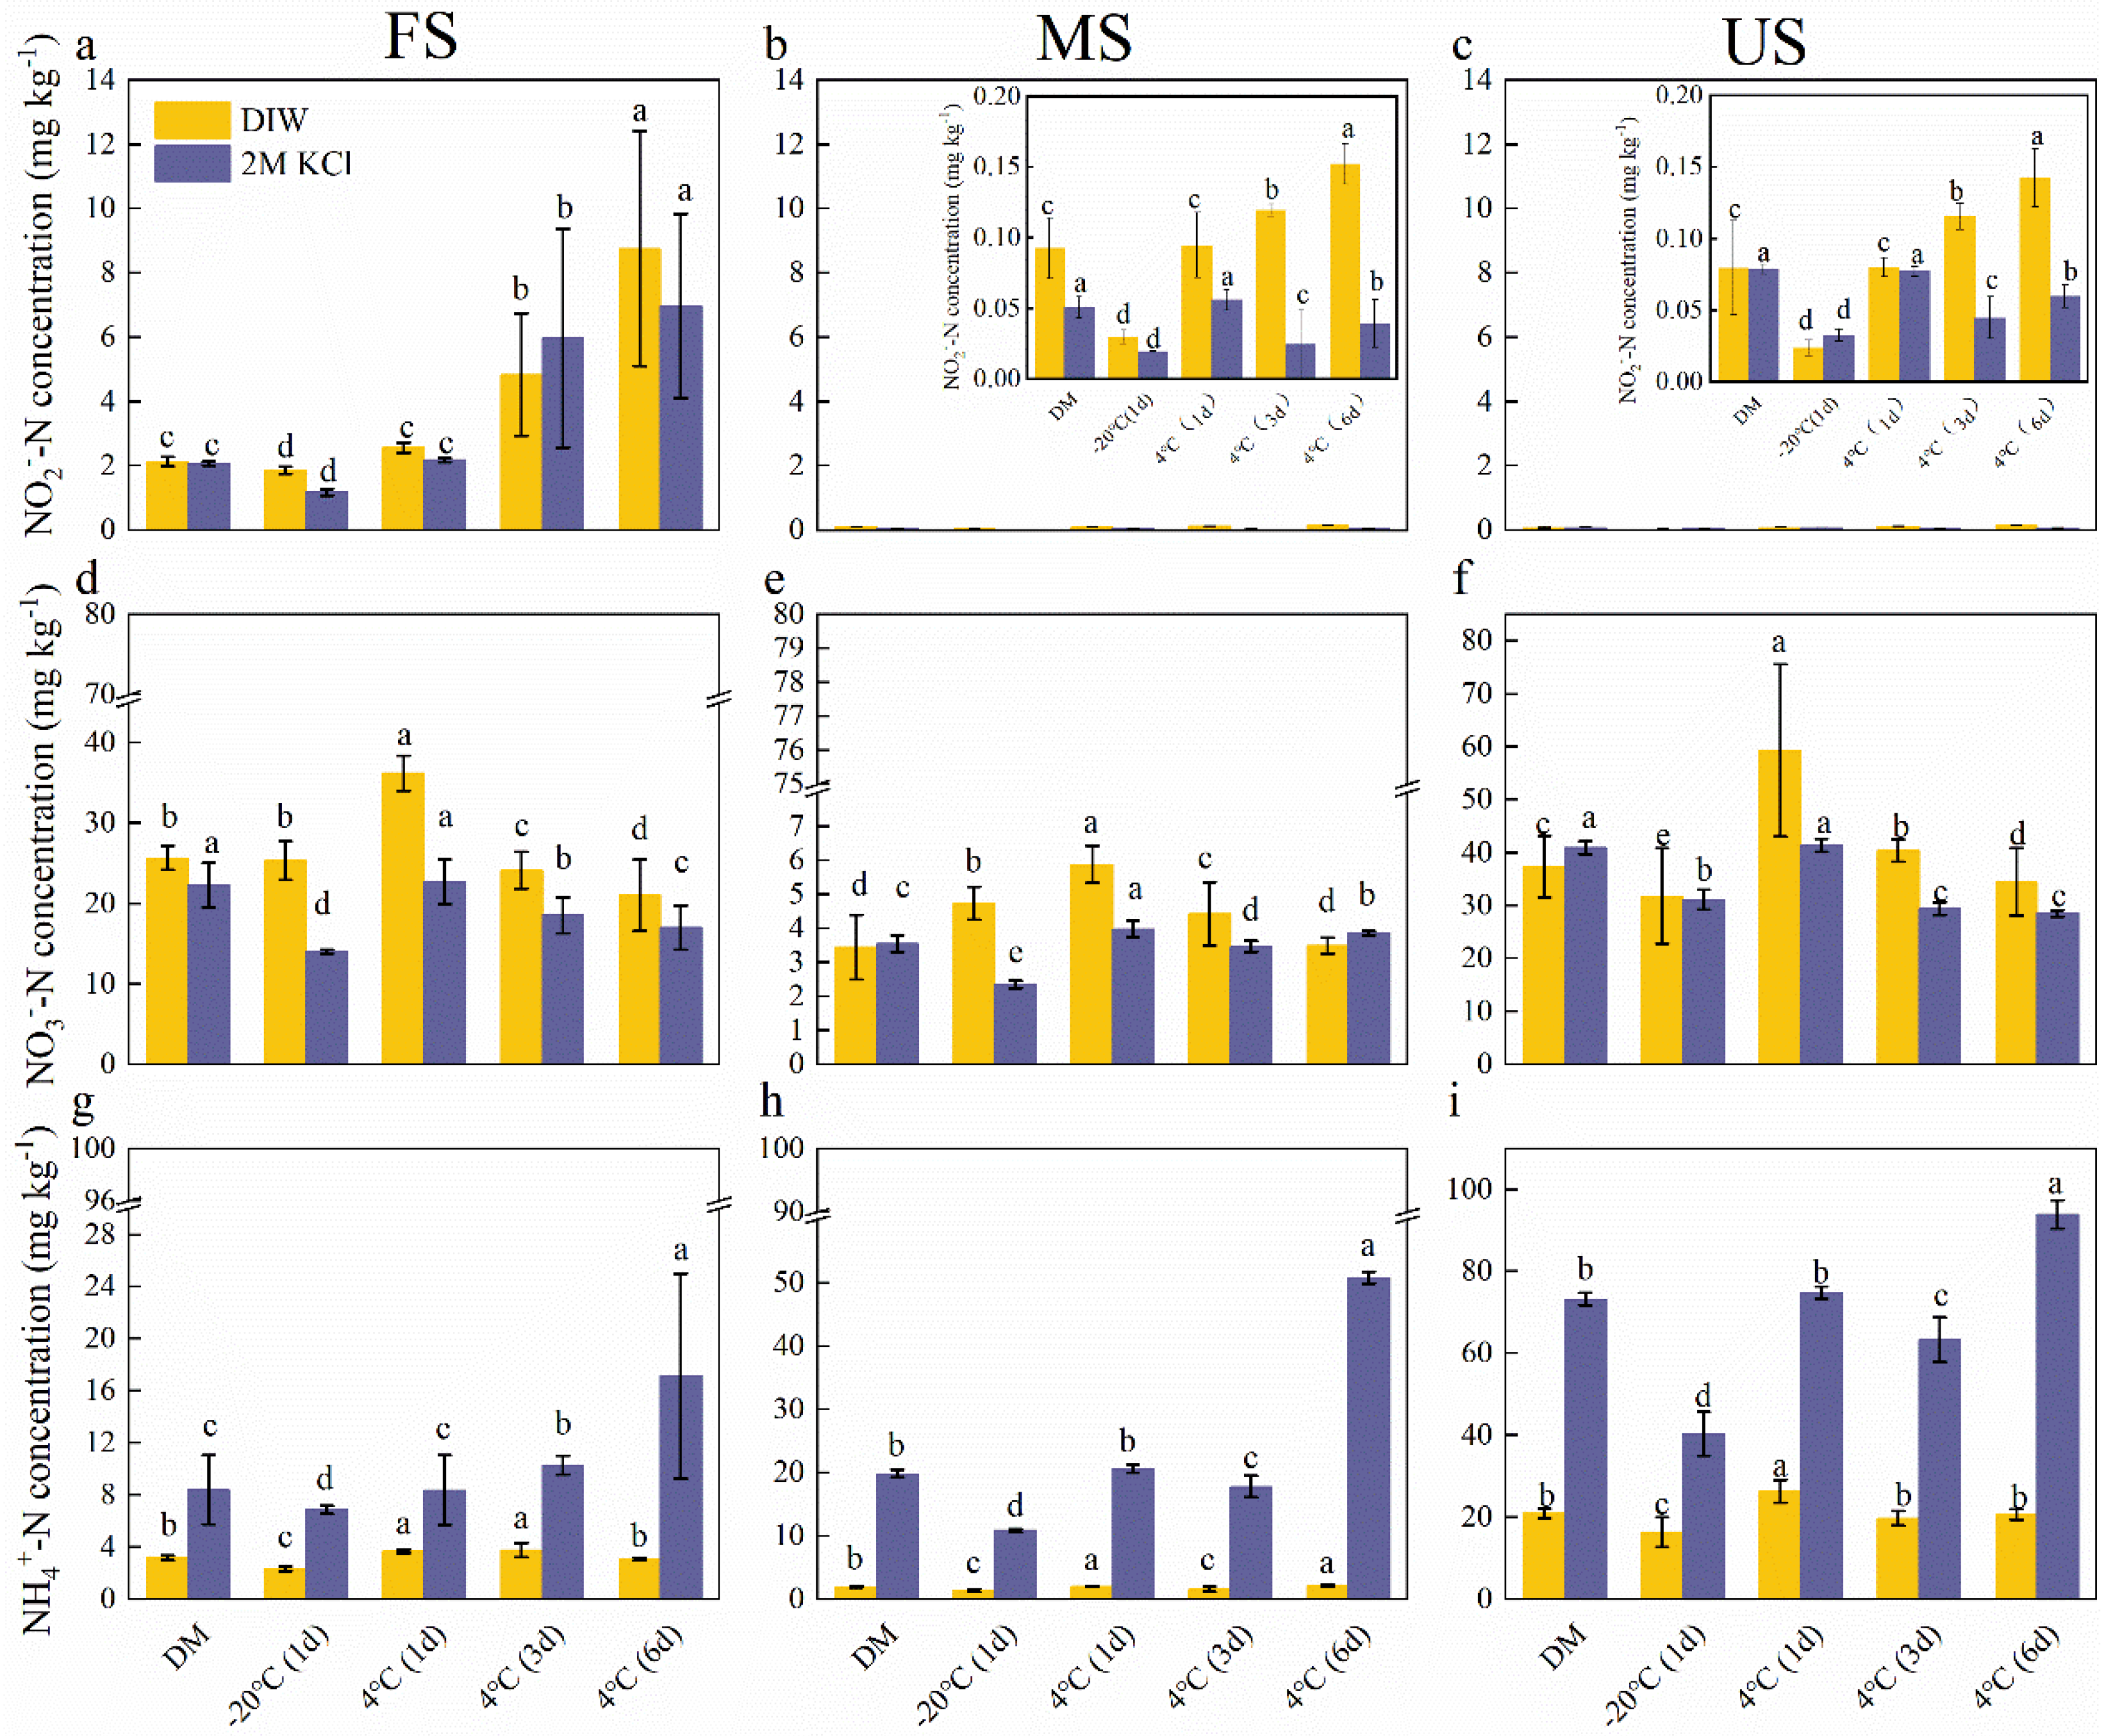
3.2. Storage Increased NO2‒ and NH4+ Content
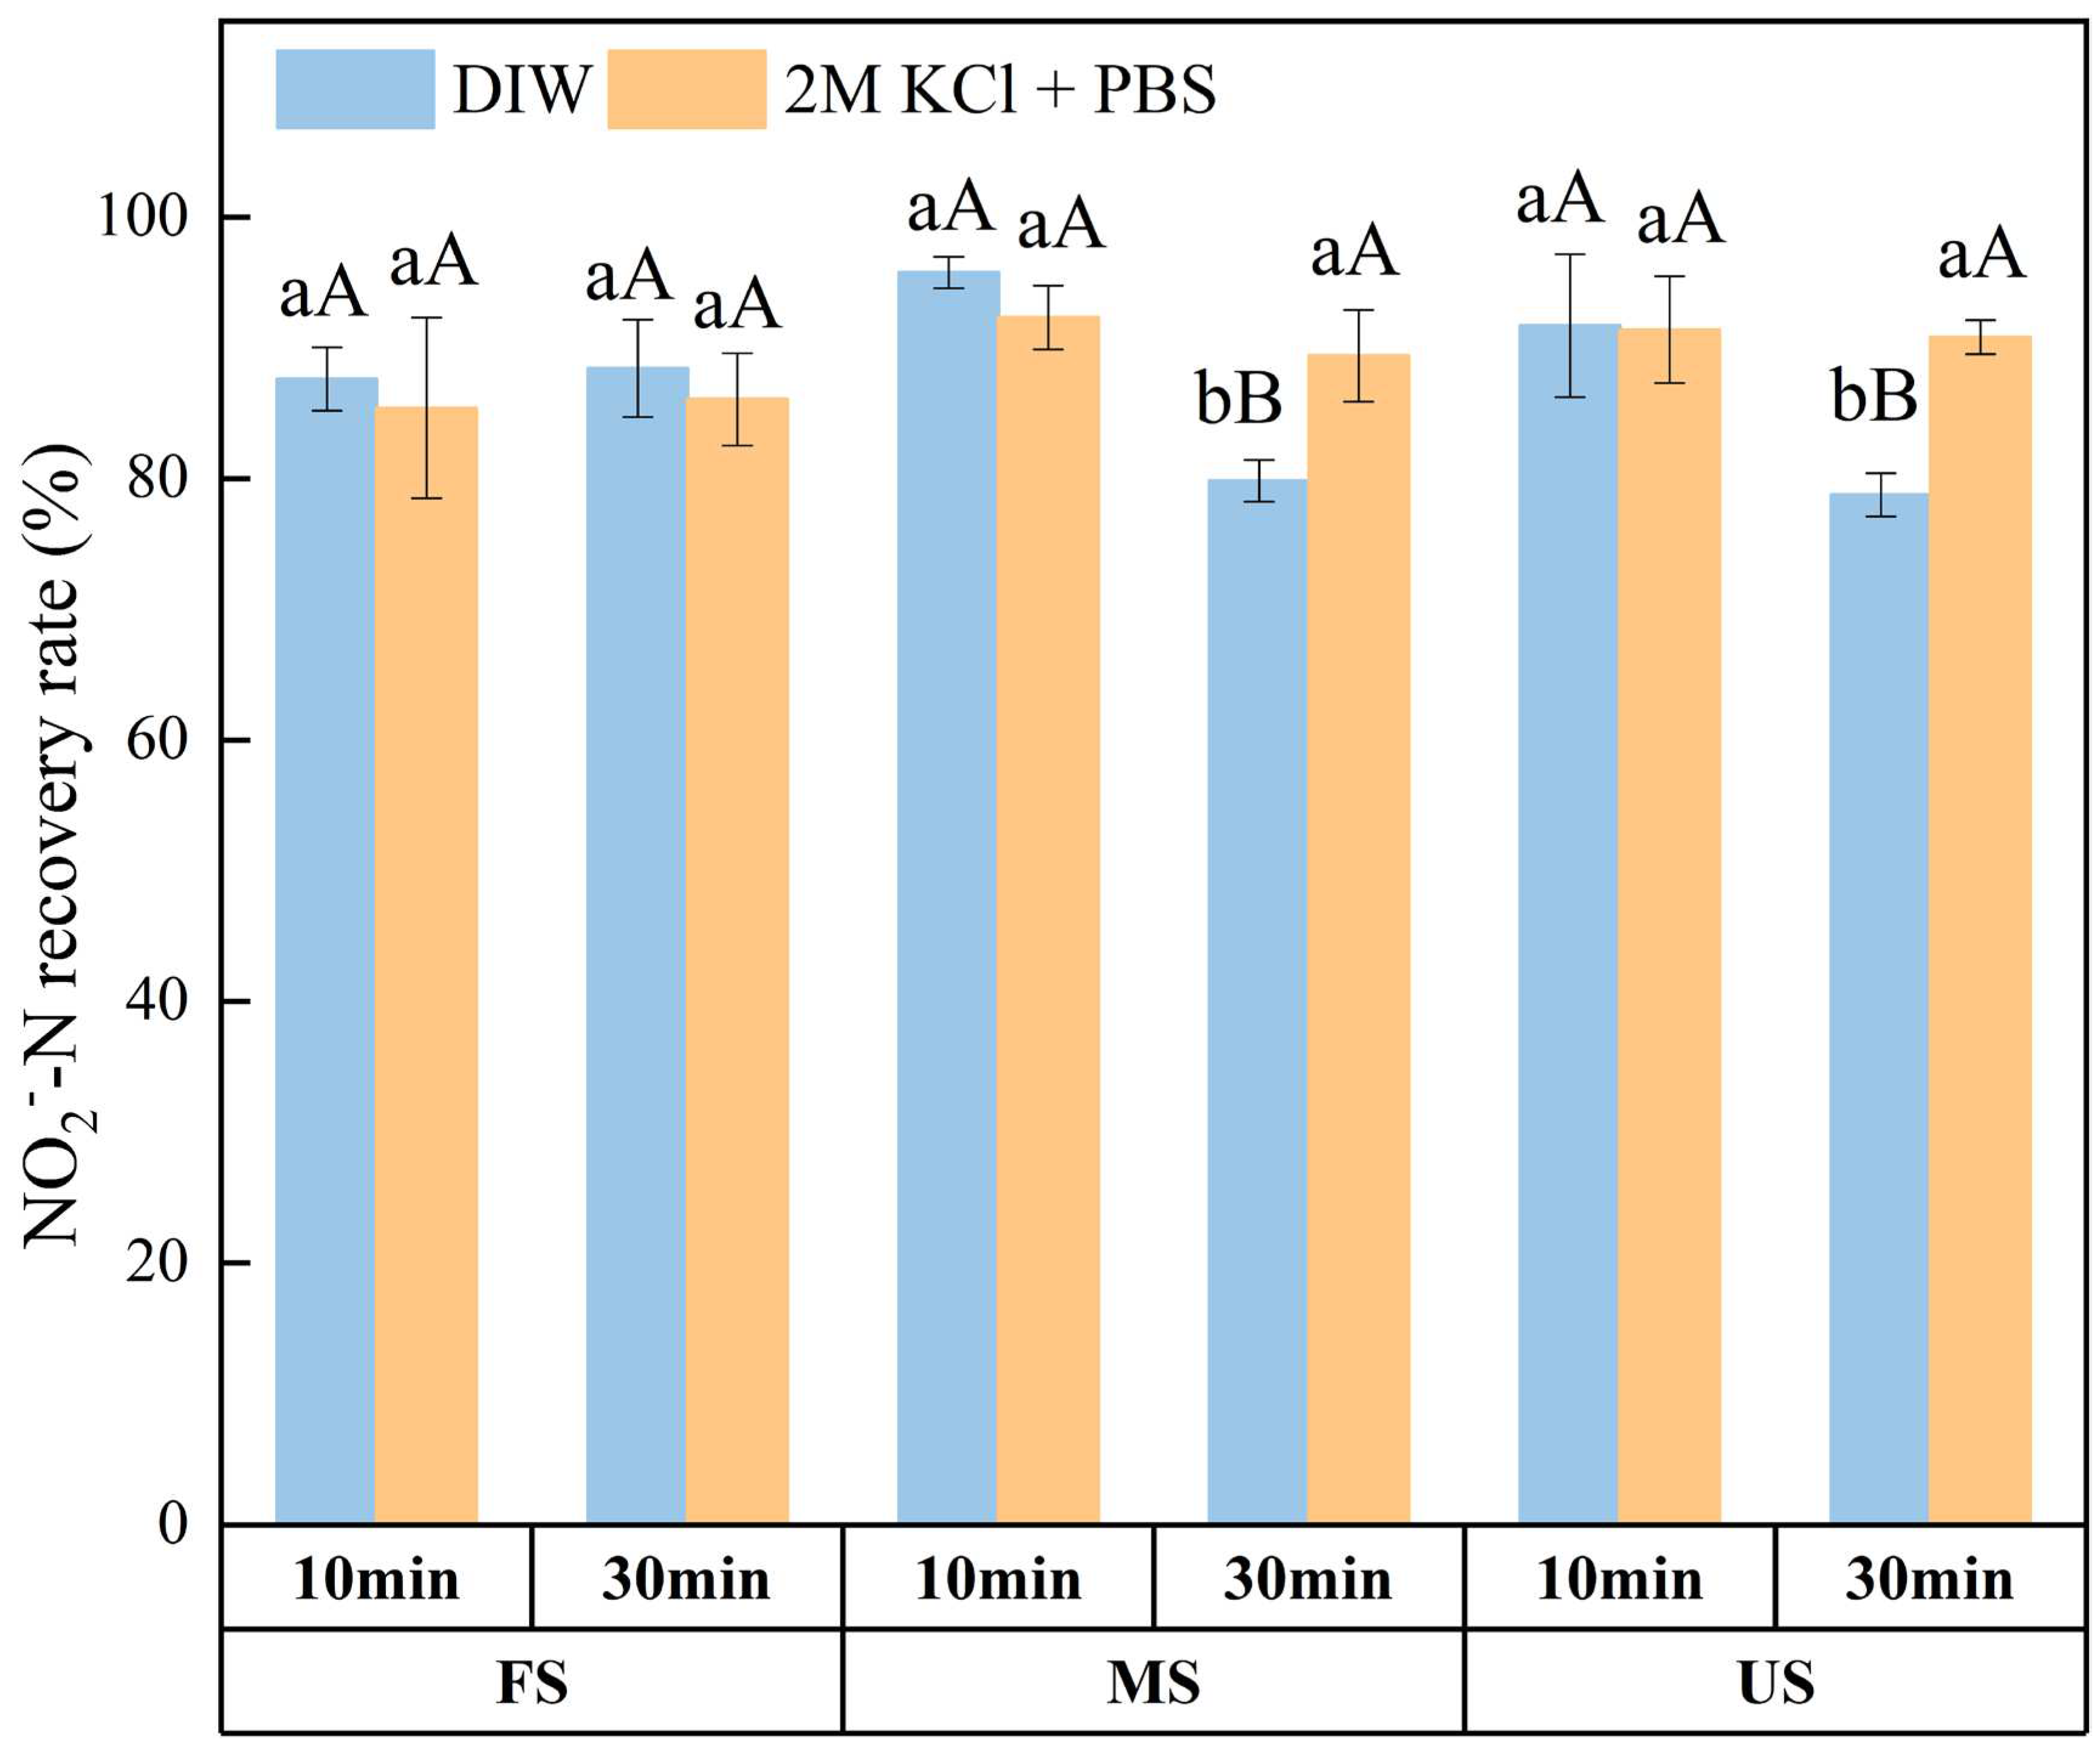
3.3. Effect of Oscillation Time on NO2‒ Recovery
4. Discussion
4.1. Soil NO2‒ Concentration
4.2. Soil NH4+ and NO3‒ Concentrations
5. Conclusions
Author Contributions
Declaration of competing interest
Acknowledgments
References
- Butterbach-Bahl K, Dannenmann M. Denitrification and associated soil N2O emissions due to agricultural activities in a changing climate. Environmental Sustainability. 2011;3:389-395. [CrossRef]
- Li Y, Ju X, Wu D. Transient nitrite accumulation explains the variation of N2O emissions to N fertilization in upland agricultural soils. Soil Biology and Biochemistry. 2023;177:108917. [CrossRef]
- Kool DM, Dolfing J, Wrage N, Van Groenigen JW. Nitrifier denitrification as a distinct and significant source of nitrous oxide from soil. Soil Biology and Biochemistry. 2011;43:174-178. [CrossRef]
- Pandey A, Suter H, He JZ, Hu HW, Chen DL. Dissimilatory nitrate reduction to ammonium dominates nitrate reduction in long-term low nitrogen fertilized rice paddies. Soil Biology and Biochemistry. 2019;131:149-156. [CrossRef]
- Wang M, Hu R, Ruser R, Schmidt C, Kappler A. Role of Chemodenitrification for N2O Emissions from Nitrate Reduction in Rice Paddy Soils. Acs Earth and Space Chemistry. 2020;4:122-132. [CrossRef]
- Müller C, Laughlin RJ, Spott O, Rütting T. Quantification of N2O emission pathways via a 15N tracing model. Soil Biology and Biochemistry. 2014;72:44-54. [CrossRef]
- Serna M, Bañuls J, Quiñones A, Primo-Millo E, Legaz F. Evaluation of 3,4-dimethylpyrazole phosphate as a nitrification inhibitor in a Citrus-cultivated soil. Biology and Fertility of Soils. 2000;32:41-46. [CrossRef]
- Yang L, Zhang X, Ju X, Wu D. Oxygen-depletion by rapid ammonia oxidation regulates kinetics of N2O, NO and N2 production in an ammonium fertilised agricultural soil. Soil Biology and Biochemistry. 2021;163:108460. [CrossRef]
- Zhu G, Song X, Ju X, Zhang J, Müller C, Sylvester-Bradley R, Thorman RE, Bingham I, Rees RM. Gross N transformation rates and related N2O emissions in Chinese and UK agricultural soils. Science of the Total Environment. 2019;666:176-186. [CrossRef]
- Giguere AT, Taylor AE, Suwa Y, Myrold DD, Bottomley PJ. Uncoupling of ammonia oxidation from nitrite oxidation: Impact upon nitrous oxide production in non-cropped Oregon soils. Soil Biology and Biochemistry. 2017;104:30-38. [CrossRef]
- Venterea R, Coulter J, Clough T. Nitrite accumulation and nitrogen gas production increase with decreasing temperature in urea-amended soils: Experiments and modeling. Soil Biology and Biochemistry. 2020;142:10772. [CrossRef]
- Maharjan B, Venterea RT. Nitrite intensity explains N management effects on N2O emissions in maize. Soil Biology and Biochemistry. 2013;66:229-238. [CrossRef]
- Ma L, Shan J, Yan X. Nitrite behavior accounts for the nitrous oxide peaks following fertilization in a fluvo-aquic soil. Biology and Fertility of Soils. 2015;51:563-572. [CrossRef]
- Lim NYN, Frostegård Å, Bakken LR. Nitrite kinetics during anoxia: The role of abiotic reactions versus microbial reduction. Soil Biology and Biochemistry. 2018;119:203-209. [CrossRef]
- Medinets S, Skiba U, Rennenberg H, Butterbach-Bahl K. A review of soil NO transformation: Associated processes and possible physiological significance on organisms. Soil Biology and Biochemistry. 2015;80:92-117. [CrossRef]
- Oswald R, Behrendt T, Ermel M, Wu D, Su H, Cheng Y, Breuninger C, Moravek A, Mougin E, Delon C, Loubet B, Pommerening-Roser A, Sorgel M, Poschl U, Hoffmann T, Andreae MO, Meixner FX, Trebs I. HONO emissions from soil bacteria as a major source of atmospheric reactive nitrogen. Science. 2013;341:1233-1235. [CrossRef]
- Song Y, Wu D, Ju X, Dörsch P, Wang M, Wang R, Song X, Deng L, Wang R, Gao Z, Haider H, Hou L, Liu M, Yu Y. Nitrite stimulates HONO and NOx but not N2O emissions in Chinese agricultural soils during nitrification. Science of the Total Environment. 2023;902:166451. [CrossRef]
- Homyak PM, Vasquez KT, Sickman JO, Parker DR, Schimel JP. Improving Nitrite Analysis in Soils: Drawbacks of the Conventional 2 M KCl Extraction. Soil Science Society of America Journal. 2015;79:1237-1242. [CrossRef]
- Stevens RJ, Laughlin RJ. Nitrite Transformations during Soil Extraction with Potassium Chloride. Soil Science Society of America Journal. 1995;59:933-938. [CrossRef]
- Islam A, Chen D, White RE, Weatherley AJ. Chemical decomposition and fixation of nitrite in acidic pasture soils and implications for measurement of nitrification. Soil Biology and Biochemistry. 2008;40:262-265. [CrossRef]
- Maynard DG, Kalra YP, Crumbaugh JA. Nitrate and exchangeable ammonium nitrogen; M.R. Carter and E.G. Gregorich: Soil sampling and methods of analysis. 2nd ed. CRC Press, Boca Raton, FL, 2007; 71–80.
- Pansu M, Gautheyrou J. Handbook of soil analysis: Mineralogical, organic and inorganic methods; Springer, New York; 2006.
- Soil quality Determination of nitrate, nitrite and ammonium in field-moist soils by extraction with potassium chloride solution-Part 2: Automated method with segmented flow analysis: ISO 14256-2: 2005. https://www.iso.org/obp/ui/#iso:std:iso:14256:-2:ed-1:v1:en.
- Reuss JO, Smith RL. Chemical Reactions of Nitrites in Acid Soils. Soil Science Society of America Journal. 1965;29:267-270. [CrossRef]
- Nelson DW, Bremner JM. Factors affecting chemical transformations of nitrite in soils. Soil Biology and Biochemistry. 1969;1:229-239. [CrossRef]
- Fujitake N, Kusumoto A, Tsukamoto M, Kawahigashi M, Suzuki T, Otsuka H. Properties of soil humic substances in fractions obtained by sequential extraction with pyrophosphate solutions at different pHs. Soil Science and Plant Nutrition;44:253-260. [CrossRef]
- Ju X, Zhang C. Nitrogen cycling and environmental impacts in upland agricultural soils in North China: A review. Journal of Integrative Agriculture. 2017;16:2848-2862. [CrossRef]
- Tu Q, Dou F, Salem HM. Optimizing Conditions for the Measurement of Soil Inorganic Nitrogen with a Micro-Plate Reader. Global Journal of Agricultural Innovation, Research & Development. 2021;8:22-31. [CrossRef]
- Ma BL, Ying J, Balchin D. Impact of Sample Preservation Methods on the Extraction of Inorganic Nitrogen by Potassium Chloride. Journal of Plant Nutrition. 2005;28:785-796. [CrossRef]
- Venterea RT, Burger M, Spokas KA. Nitrogen Oxide and Methane Emissions under Varying Tillage and Fertilizer Management. Journal of Environmental Quality. 2005;34:1467-1477. [CrossRef]
- Isobe K, Koba K, Suwa Y, Ikutani J, Kuroiwa M, Fang Y, Yohb M, Mo J, Otsukaa S, Senoo S. Nitrite transformations in an N-saturated forest soil. Soil Biology and Biochemistry. 2012;52:61-63. [CrossRef]
- Nelson DW, Bremner JM. Gaseous products of nitrite decomposition in soils. Soil Biology and Biochemistry. 1970;2:203-215. [CrossRef]
- Li K, Zhao Y, Yuan X, Zhhao H, Wang Z, Li S, Malhi S. Comparison of Factors Affecting Soil Nitrate Nitrogen and Ammonium Nitrogen Extraction. Communications in Soil Science and Plant Analysis. 2012;43:571-588. [CrossRef]
- Yang L, Zhou G, Qiu Z, Wang Z, Yu B. Study on the Methods of Sample Collection and Keeping in Forest Soil NO3--N Determination. Forest Research (in Chinese). 2005;18:209-213. [CrossRef]
- Zhu J, Wang C, Paerhati, Xiao Y, Cao X, Hua Z. Effect of Oscillation and Extraction Time on Measurement of Content of NO3--N and NH4+-N in Soil Held by Different Saving Methods. Xinjiang Agricultural Sciences (in Chinese). 2014;51:761-767.
Disclaimer/Publisher’s Note: The statements, opinions and data contained in all publications are solely those of the individual author(s) and contributor(s) and not of MDPI and/or the editor(s). MDPI and/or the editor(s) disclaim responsibility for any injury to people or property resulting from any ideas, methods, instructions or products referred to in the content. |
© 2023 by the authors. Licensee MDPI, Basel, Switzerland. This article is an open access article distributed under the terms and conditions of the Creative Commons Attribution (CC BY) license (http://creativecommons.org/licenses/by/4.0/).


