1. Introduction
As the frequency of space launch missions continues to rise, the deployment of rocket deflector troughs has a corresponding increase, introducing inherent structural fatigue challenges. According to statistics, more than 70% of the damage to marine engineering structures during their service life is caused by fatigue [
1]. Consequently, the initiation and propagation of cracks due to structural fatigue have emerged as the primary causes of marine engineering structure failures. In the context of the challenging maintenance conditions of offshore rocket launch platforms, it becomes imperative to comprehend the trajectory from crack initiation to structural failure within the direct impact zone of rocket plumes on deflectors. This understanding holds significant importance for evaluating the remaining structural life of these platforms, particularly in light of stringent damage tolerance requirements.
The Extended Finite Element Method (XFEM), as an emerging numerical approach for simulating fatigue crack propagation, preserves the merits of traditional finite element methods. By utilizing specialized crack tip enrichment functions, XFEM effectively models the stress singularity at the crack tip, enabling crack interfaces to remain independent of mesh partitions. This not only mitigates mesh dependency but also streamlines the precise treatment of crack tips [
2]. Numerous scholars have conducted in-depth research and experimental extensions of this method. PATZAK et al. [
3] conducted a more in-depth investigation into the analytical process of XFEM. DAUX et al. [
4] employed XFEM to simulate crack branching. FLECK et al. [
5], through experiments applying compressive stress to notched plates, observed that cracks originated in the residual tensile stress region near the notch root and expanded, highlighting the propensity of fatigue cracks to propagate in tensile stress conditions. SA-HOURYEH et al. [
6] conducted experimental studies on crack propagation under biaxial compression, revealing limited crack growth size and expansion parallel to the loading direction. ZHANG et al. [
7], utilizing XFEM, investigated the influence of compressive stress on crack propagation under tension-compression loading, establishing a correlation between crack initiation at the tip and compressive stress. MENOUILLARD et al. [
8] simulated dynamic crack propagation using XFEM with explicit time integration techniques. FRIES et al. [
9] introduced three explicitly computed level set functions to enhance XFEM's three-dimensional applicability, proposing a novel method that combines explicit and implicit simulations for crack propagation. Ni-KFAM et al. [
10] applied XFEM to simulate high-cycle fatigue tests on welded T-joints, validating the model's predictions of crack propagation rate, life, and shape against experimental results within reasonable margins. The numerical model's fracture morphology closely aligned with the experimental observations.
This study employs simulated rocket plume parameters as a foundational framework and integrates a coupling method of high temperature and impact loading to emulate the effects of rocket plume impact. Simultaneously, it takes into account the impact of temperature loading on the mechanical properties of the deflector trough's material. Utilizing the XFEM, the research conducts a comprehensive analysis of fatigue crack propagation on the sub-surface of the rocket deflector trough. The investigation meticulously explores various aspects, including the direction, initiation length, and propagation rate of cracks within the rocket deflector trough, arising from fatigue-induced damage during subsequent service.
2. Models and Environmental Parameters
2.1. Rocket Launch Platform Model
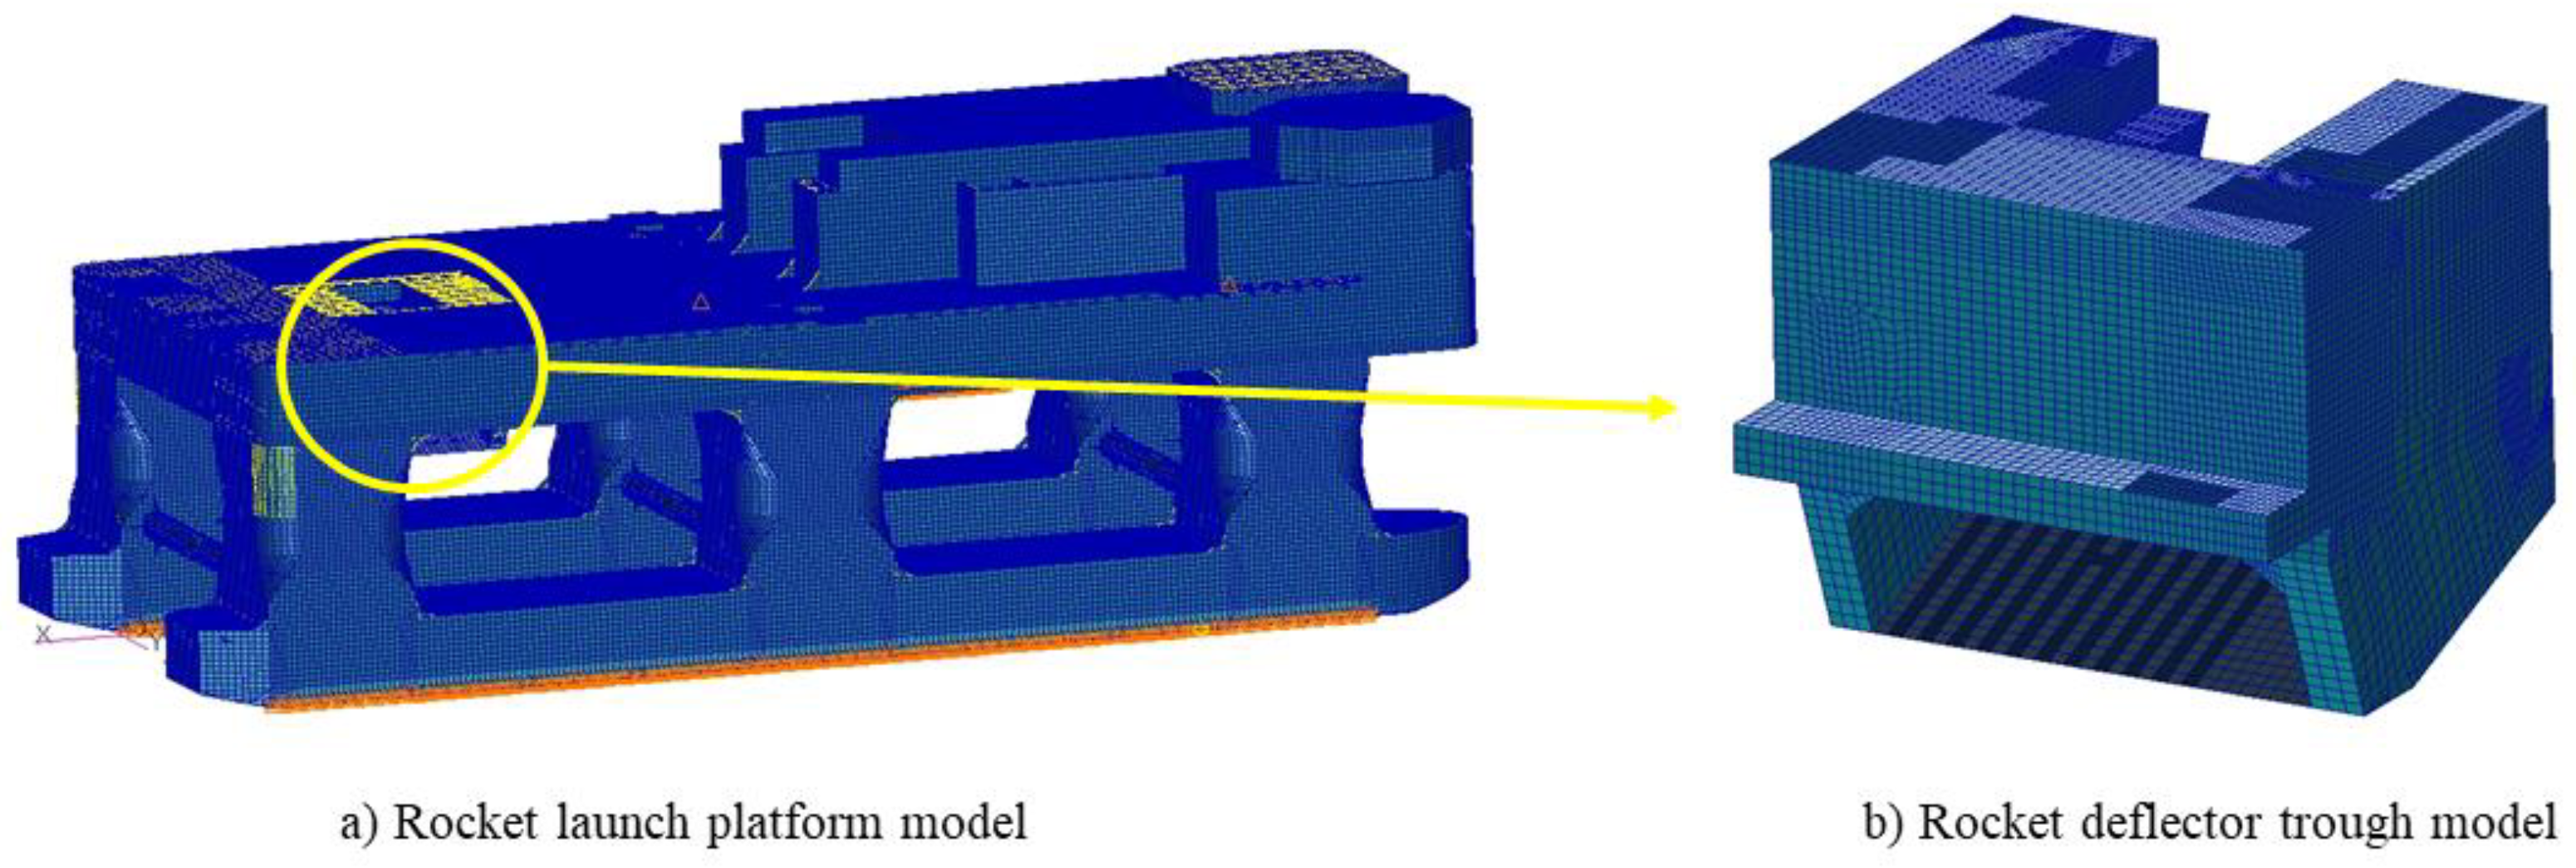
The research in this paper focuses on the lower surface of the rocket deflector trough subjected to direct impingement from the rocket plume, as illustrated in the overall model of the offshore rocket launch platform shown in
Figure 1-(a).
Given that the high-temperature and high-speed airflow during rocket launches primarily affects the launch area of the platform (the main body of the deflector trough and the connected upper deck region) and considering the symmetrical distribution of the deflector trough, the right side of the deflector trough is selected as the representation area for computational results to simplify the visualization, as illustrated in
Figure 1-(b).In the course of a rocket launch, the plume jet traverses the deflector trough inlet positioned at the center of the launch deck, exerting a direct impact on the deflector trough beneath the deflection hole. Subsequently, it follows the guidance of the deflector's lower surface, ultimately exiting from the openings at both ends of the deflector. The dimensions of the deflector trough are illustrated in
Figure 2.
2.2. Environmental Load Parameters
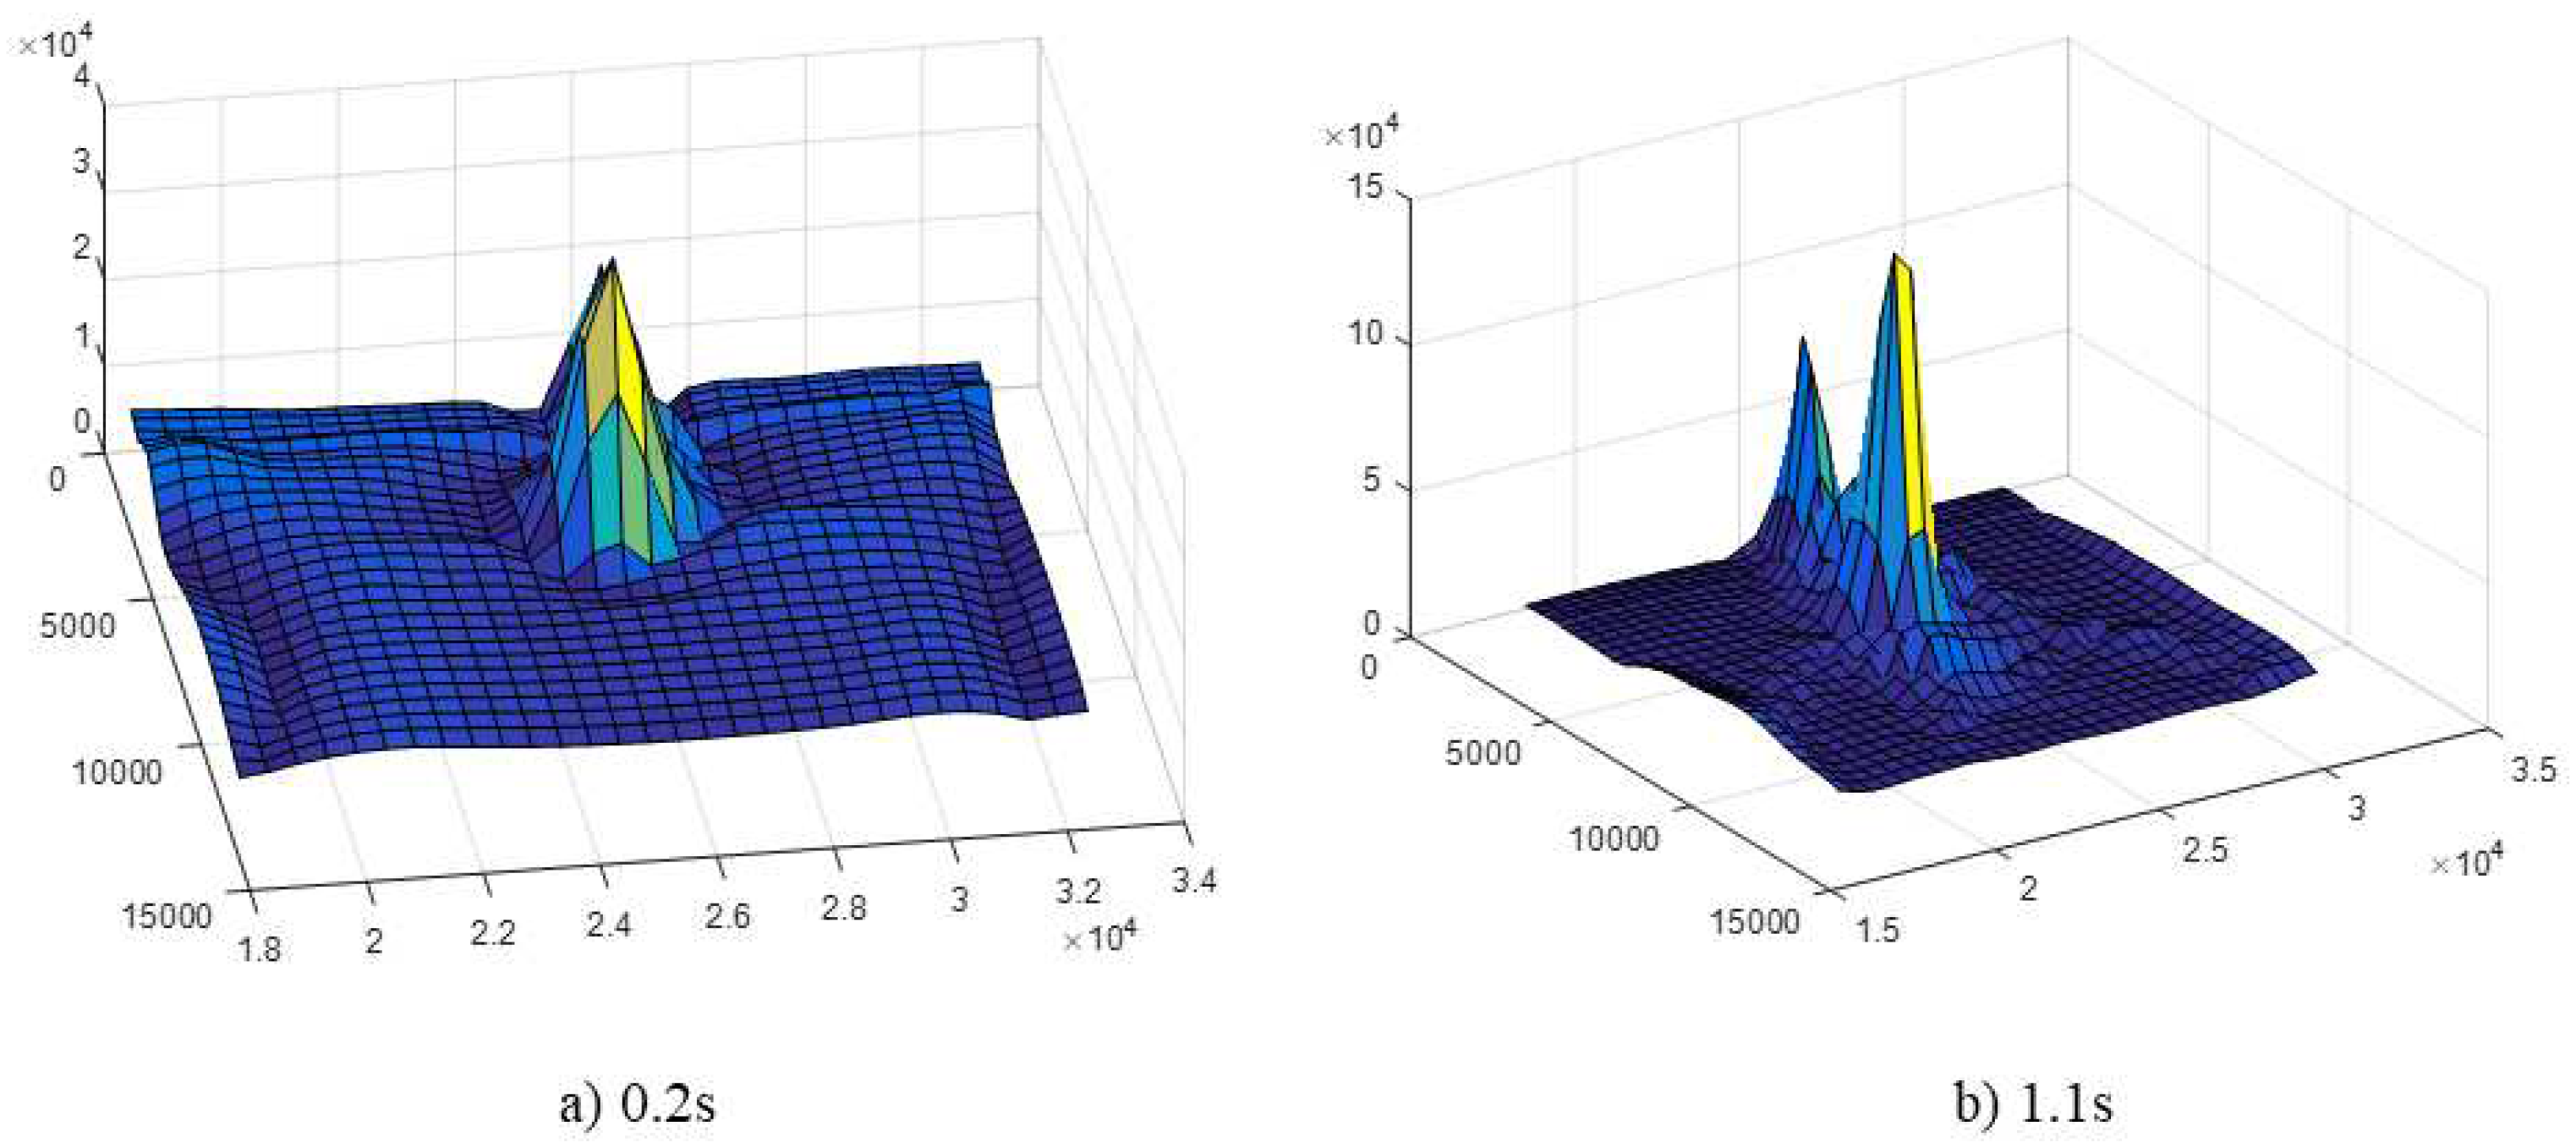
The external environmental parameters of the deflector are primarily divided into two parts: temperature parameters and impact load parameters. The conventional method to ensure the structural safety of the rocket deflector is to install heat insulation materials on the surface of the deflector, which can significantly reduce the temperature of the metal structure directly exposed to the rocket plume. By incorporating sensors beneath the insulating layer on the lower surface of the deflector, it becomes possible to capture data regarding temperature variations and impact loads during the initial 1.1 seconds of a rocket launch.
Figure 3 and
Figure 4 illustrate the numerical values of temperature and impact force at specific moments, providing a visual representation of these critical parameters.
The boundary conditions for the overall model are defined as an air environment with a pressure of 101325 Pa and an ambient temperature of 20°C. There is no heat exchange between the deflector and the external environment. The deflector walls are treated as no-slip surfaces. The boundary constraints are applied to both the symmetry planes of the deflector and the region where the deflector is connected to the upper deck of the platform, involving fixed displacement and rotation. The material chosen for the rocket deflector is Grade E ordinary shipbuilding steel. It is crucial to note that the increase in temperature not only diminishes the elastic modulus of the metal material but also attenuates its yield strength [
10]. Consequently, both these material properties are dynamically adjusted with temperature variations, as comprehensively outlined in
Table 1. Considering that the temperature referenced for the fracture mechanics properties of the deflector metal material is above 200°C, while the maximum temperature on the lower surface in this study is 132.2°C, and the actual temperature conducted to the metal is lower than this because we measured the temperature on the backside of the insulation material, the fracture mechanics properties of the deflector material are set using room temperature parameters, as detailed in
Table 2.
3. Simulation Calculation Equations
3.1. XFEM
The fundamental idea of XFEM[
12] is the method of unit decomposition, which introduces enriched functions into the displacement modes of FEM to characterize strong discontinuities in the displacement field:
is the discontinuous displacement field; is the shape function applied by standard finite elements; is the degrees of freedom of regular nodes; is the enriched approximation functions associated with the method of unit decomposition.
When applying XFEM to solve crack propagation, the software divides the material elements into three categories: standard elements, penetrating elements, and crack-tip elements. For the elements experiencing crack propagation, discontinuous shape functions can be introduced to control the displacement:
In the equation above, represents the approximate displacement field of the extended finite element; represents the approximate displacement field of the standard finite element; represents the approximate displacement field of the penetrating element crack; represents the approximate displacement field of the crack in the crack-tip element; is the set of all nodes in the solution domain; is the set of nodes penetrated by the crack; is the set of nodes affected by the crack-tip region; is the step function for the penetrating element; is the enrichment function for the crack-tip element; represents the degrees of freedom associated with enriched nodes related to the jump discontinuity; represents the degrees of freedom associated with enriched nodes related to the crack-tip approximation function.
3.2. Paris Equation
The Paris equation can represent the initiation and propagation of fatigue cracks[
13].
In the equation above, and are material-related constants.
The Paris law used in the simulation associates the crack propagation rate with the energy release rate () at the crack tip. , represents the strain energy release rate corresponding to the maximum load on the structure, and represents the strain energy release rate corresponding to the minimum load on the structure.
The Paris law operates within the bounds of and , where fatigue cracks do not propagate below the former and rapidly propagate until failure above the latter. The intermediate region between the two represents a stable crack propagation zone for fatigue cracks.
3.3. Crack Propagation Criteria
In the equation above, and are material-related constants, and is the number of cycles. In the simulation, fatigue crack propagation occurs only when both Equation (4) and are simultaneously satisfied.
4. Experimental Validation of the Simulation Method
4.1. Experimental Setup
The material used for the fatigue crack propagation experiment is the GH4133B alloy, in the form of standard CT specimens. The stress ratio for the fatigue experiment was set to 0.02 (R=0.02), and a sinusoidal wave with a frequency of 5 Hz was employed as the experimental loading frequency. The tensile stress direction was set as symmetrically reversed[
14].
The measurement method for fatigue crack propagation is as follows: After subjecting the specimen to a certain number of cyclic stress loadings, the test machine was temporarily halted. Subsequently, the specimen's crack was examined utilizing an electron microscope, with images of the crack tip captured. These images were then juxtaposed with prior observation results to trace the path of fatigue crack propagation, concurrently documenting the associated cycle counts.
Table 3.
Specimen parameters.
Table 3.
Specimen parameters.
| Specimen Number |
Symmetric Load(P/kN) |
Specimen Thickness(W/mm) |
| 1 |
7 |
6.8 |
| 2 |
6.5 |
6.8 |
| 3 |
8.5 |
6.4 |
| 4 |
8.8 |
6.8 |
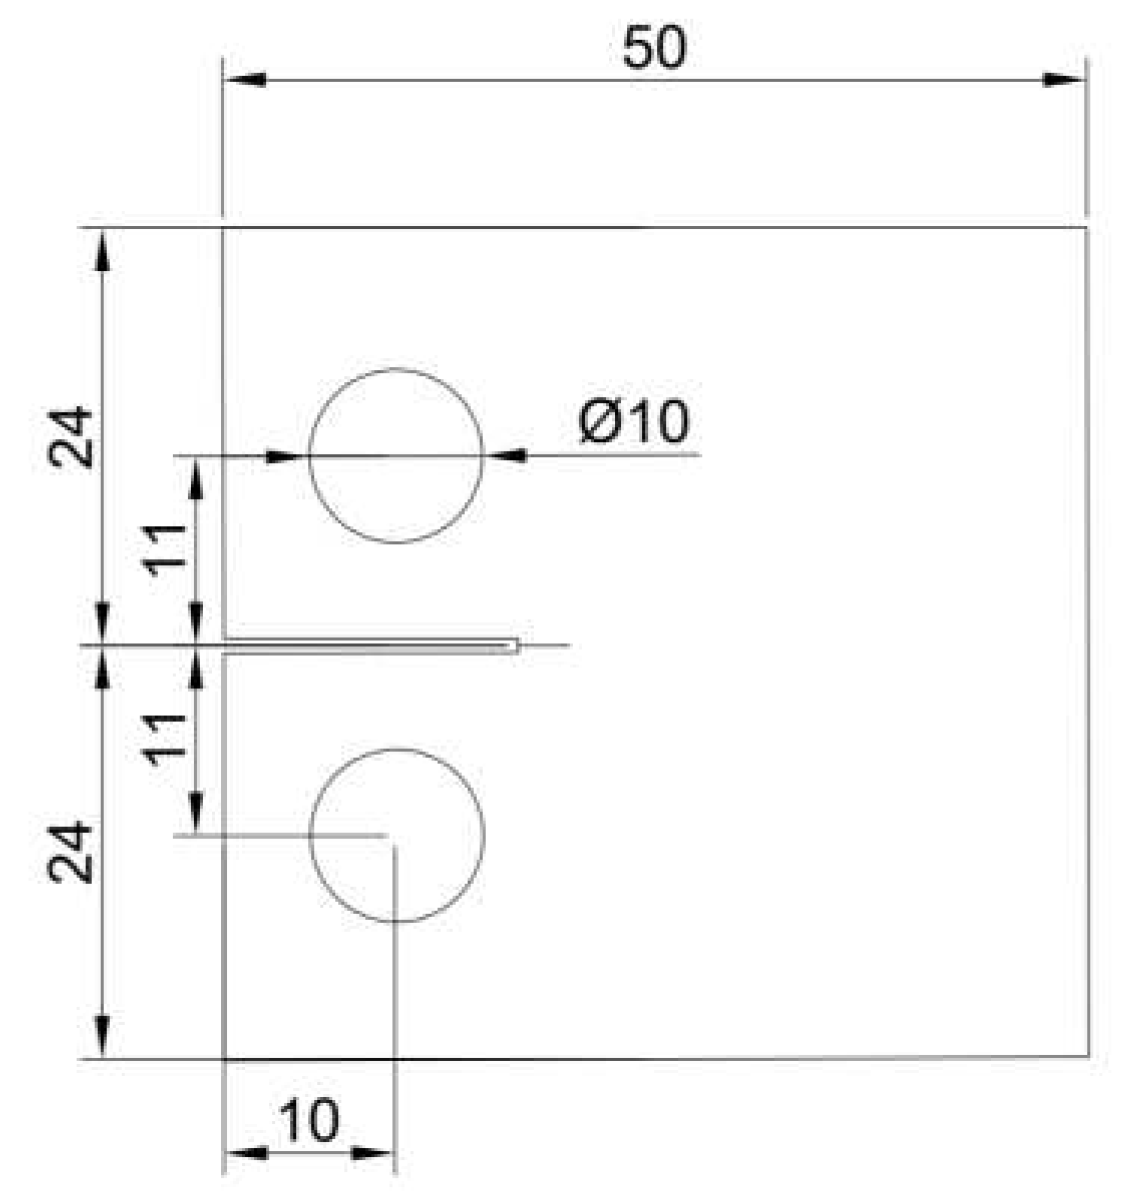
Figure 5.
Specimen dimensions and loading configuration.
Figure 5.
Specimen dimensions and loading configuration.
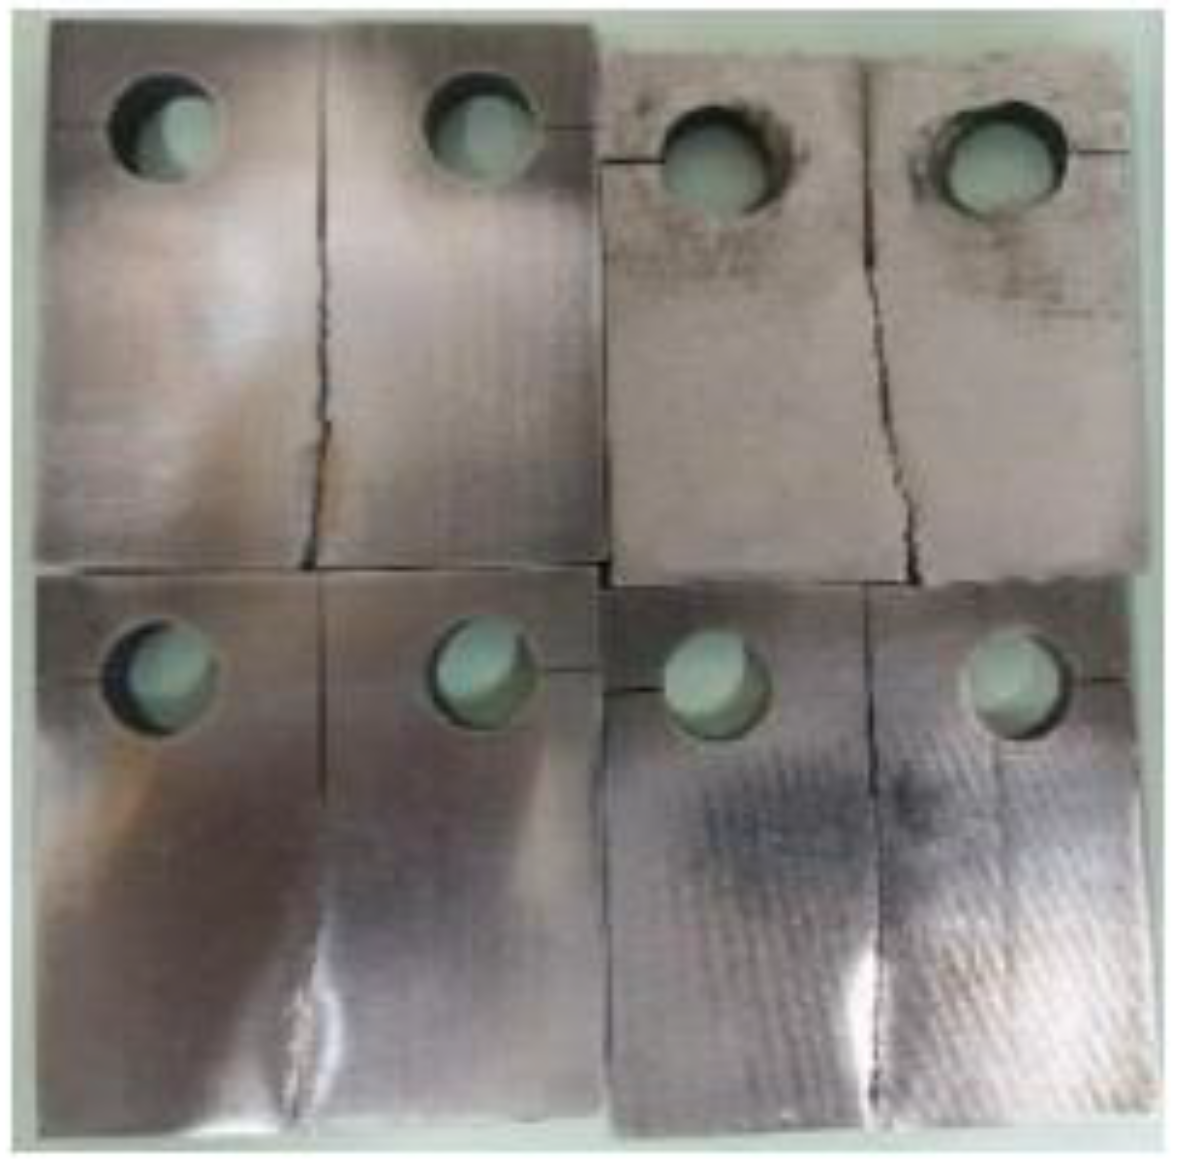
Figure 6.
Experimental specimen.
Figure 6.
Experimental specimen.
4.2. Comparison between Experimental Data and Simulation Data
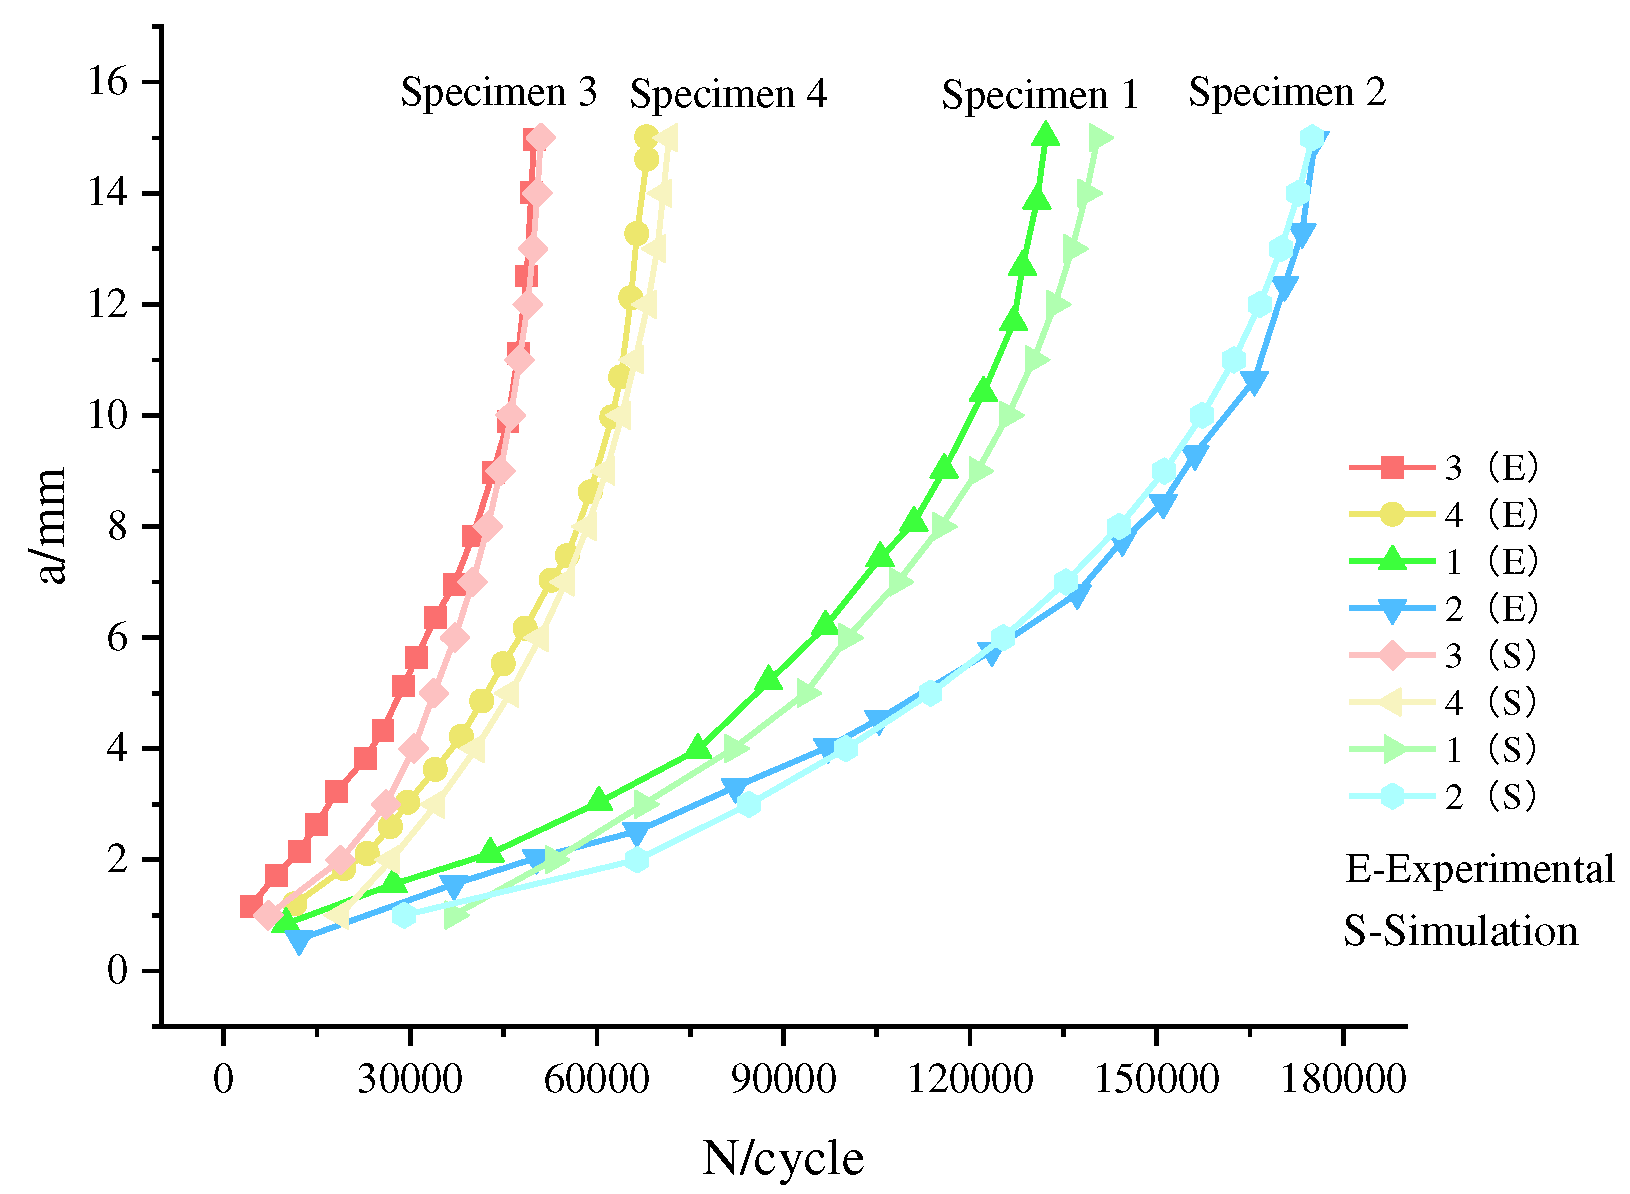
The stress cycle counts obtained through experimental measurements and simulated by the extended finite element method when the crack propagated to a length of 15mm are presented in
Table 4. The relationship between the crack length (a)and the number of cycles (N) for specimens measured through experimental methods and simulated using XFEM is illustrated in
Figure 7.
Table 4.
Comparison of experimental and simulation results.
Table 4.
Comparison of experimental and simulation results.
| Specimen Number |
Number of cycles in the experimental method
(N/cycle) |
Number of cycles in the simulation method
(N/cycle) |
Relative error
(%) |
| 1 |
135375 |
140515 |
3.80 |
| 2 |
179672 |
175050 |
2.57 |
| 3 |
50080 |
50975 |
1.79 |
| 4 |
70806 |
71575 |
1.09 |
| 1 |
135375 |
140515 |
3.80 |
Reviewing
Table 4, it becomes apparent that the maximum error in the number of cycles measured by the two methods is 3.8%.
Figure 7 illustrates that the crack propagation patterns of the specimens obtained through both methods generally align under equivalent thickness and load conditions. The observed trend indicates an increment in crack propagation rates with the number of load cycles, affirming the reliability of XFEM simulation.
Figure 7.
Comparison of experimental and simulation results.
Figure 7.
Comparison of experimental and simulation results.
5. Numerical Results and Discussion
5.1. Simulation Condition Settings and Crack Area Configuration
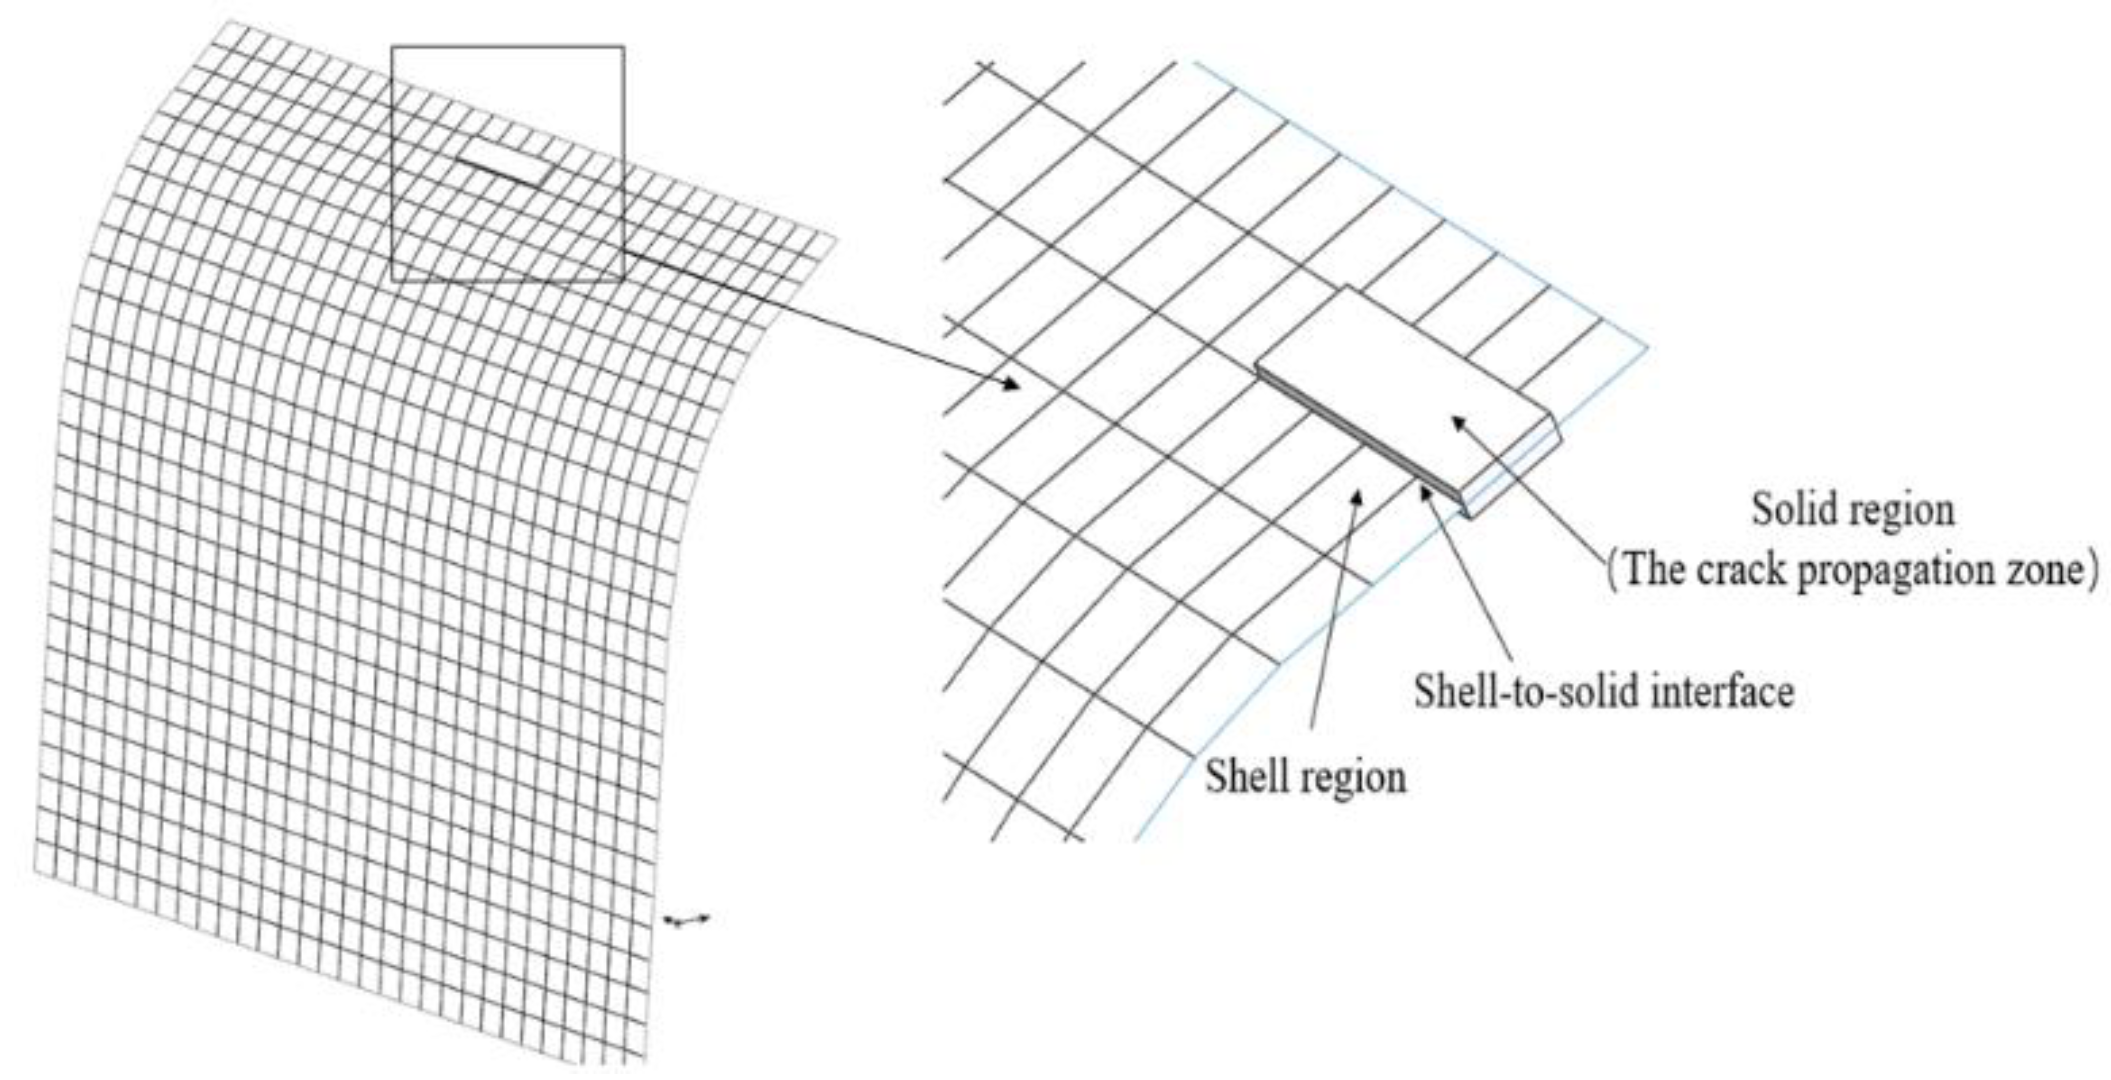
Considering that the crack propagation on the lower surface of the deflector occurs only in localized regions, a "shell-to-solid" coupling theory based on ABAQUS [
15] is adopted. In this approach, the localized regions where cracks need to be pre-existing are configured as three-dimensional solids, while the overall model region is kept as a two-dimensional shell. This configuration is implemented to simplify the computational process. The configuration of the crack propagation zone is illustrated in
Figure 8. The form of the crack is characterized as a penetrating crack.
Cracks are pre-positioned in two regions on the lower surface of the deflector based on stress-strain contour maps, corresponding to two distinct operating conditions. Condition A: Cracks are positioned at the locations of maximum stress. Condition B: Cracks are positioned at locations of maximum deformation. As shown in
Figure 9, the region circled in yellow represents the area designated for pre-inserted cracks. The initial crack length is 100mm.
Figure 8.
Shell-to-Solid coupling schematic diagram.
Figure 8.
Shell-to-Solid coupling schematic diagram.
Figure 9.
Schematic diagram of operating condition zones.
Figure 9.
Schematic diagram of operating condition zones.
5.2. Crack Propagation Direction
The pre-inserted cracks on the lower surface of the rocket deflector experience various types of stress, including tensile stress, compressive stress, torsional stress, and shear stress. Due to the non-uniformity in the motion of the rocket plume flow field, there are variations in the temperature and impact loads, both in terms of direction and magnitude, across different regions of the lower surface of the deflector trough. As a result, cracks at different positions and inclinations experience differences in the magnitude and direction of the principal stress.
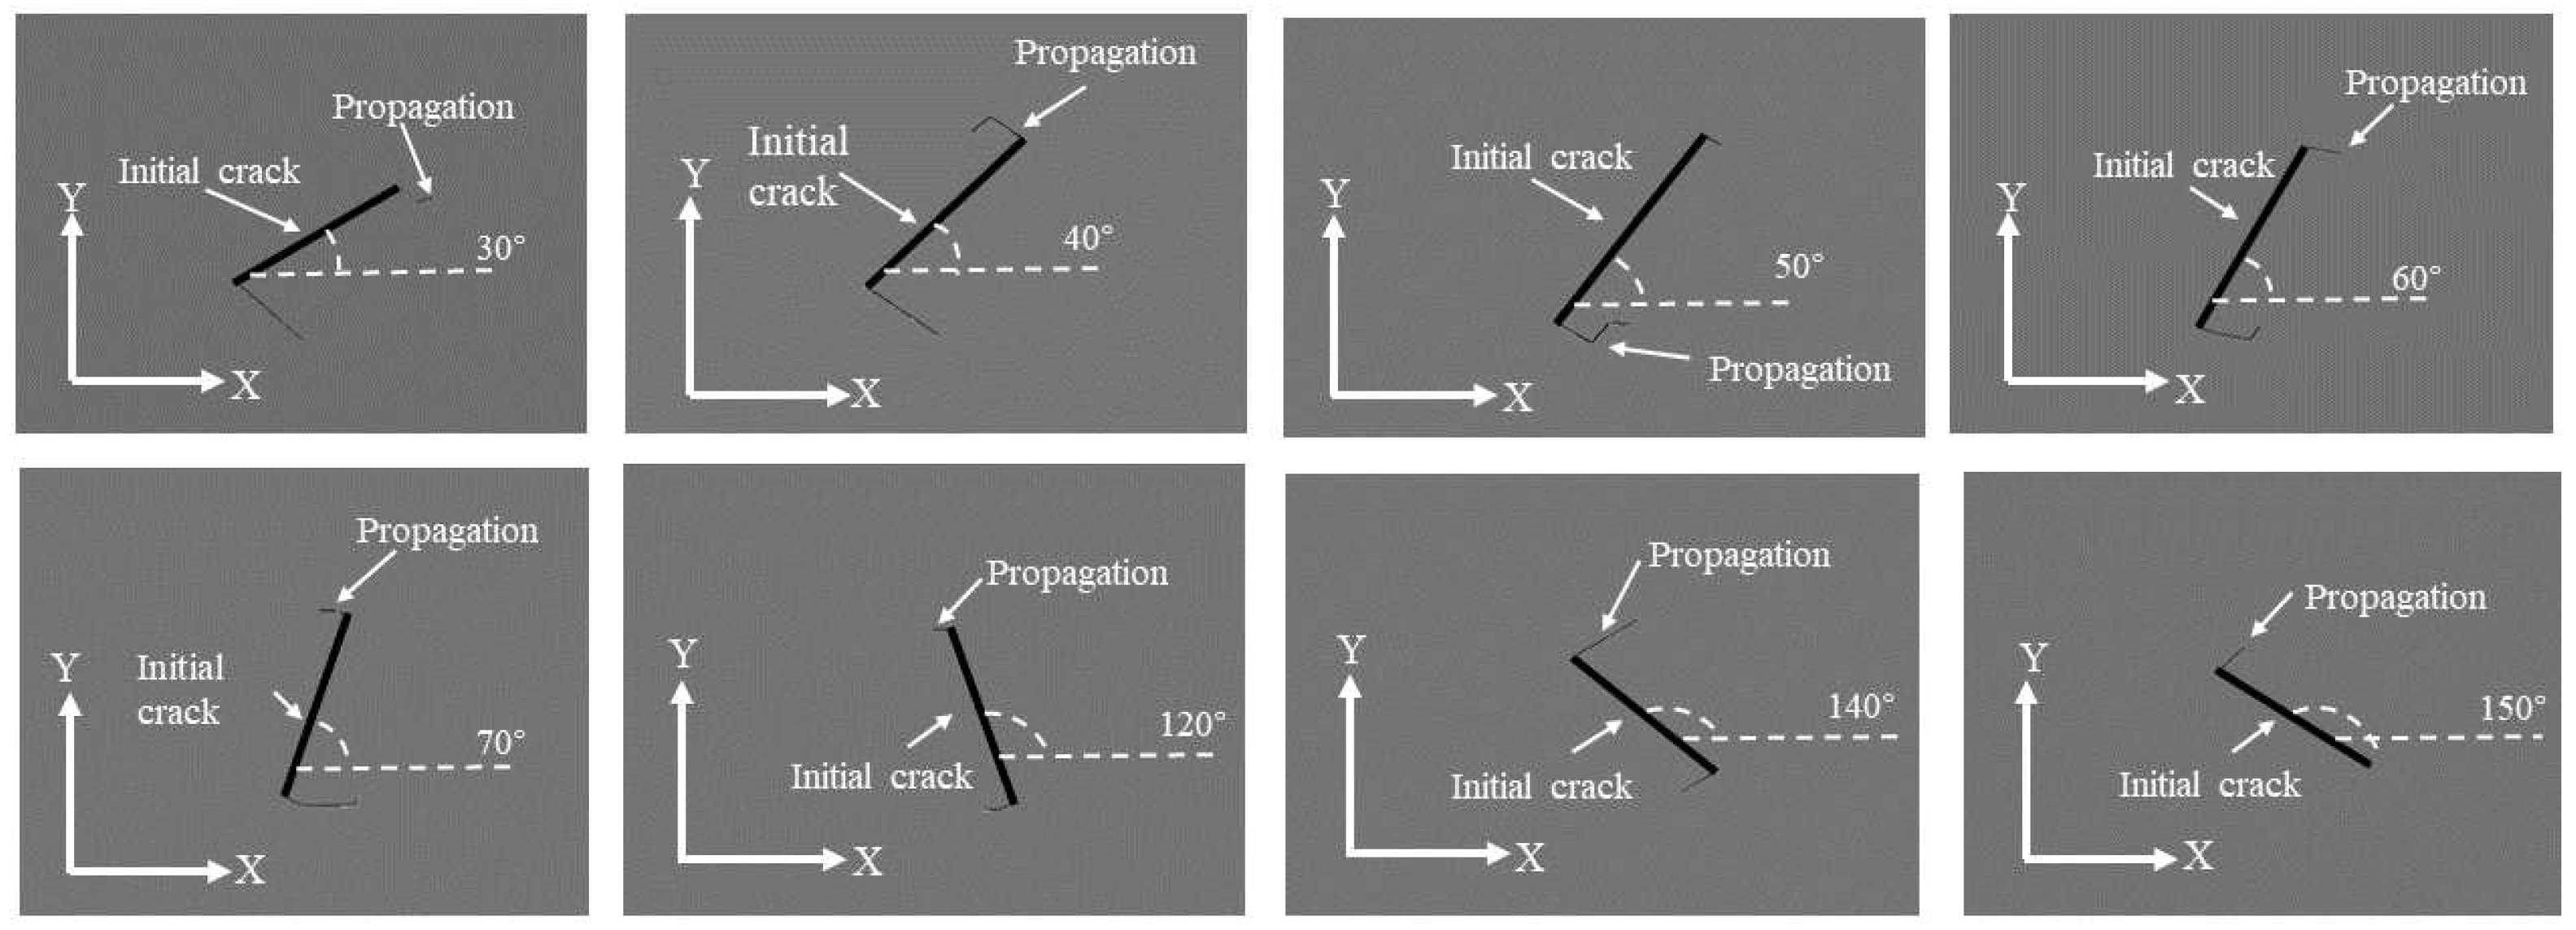
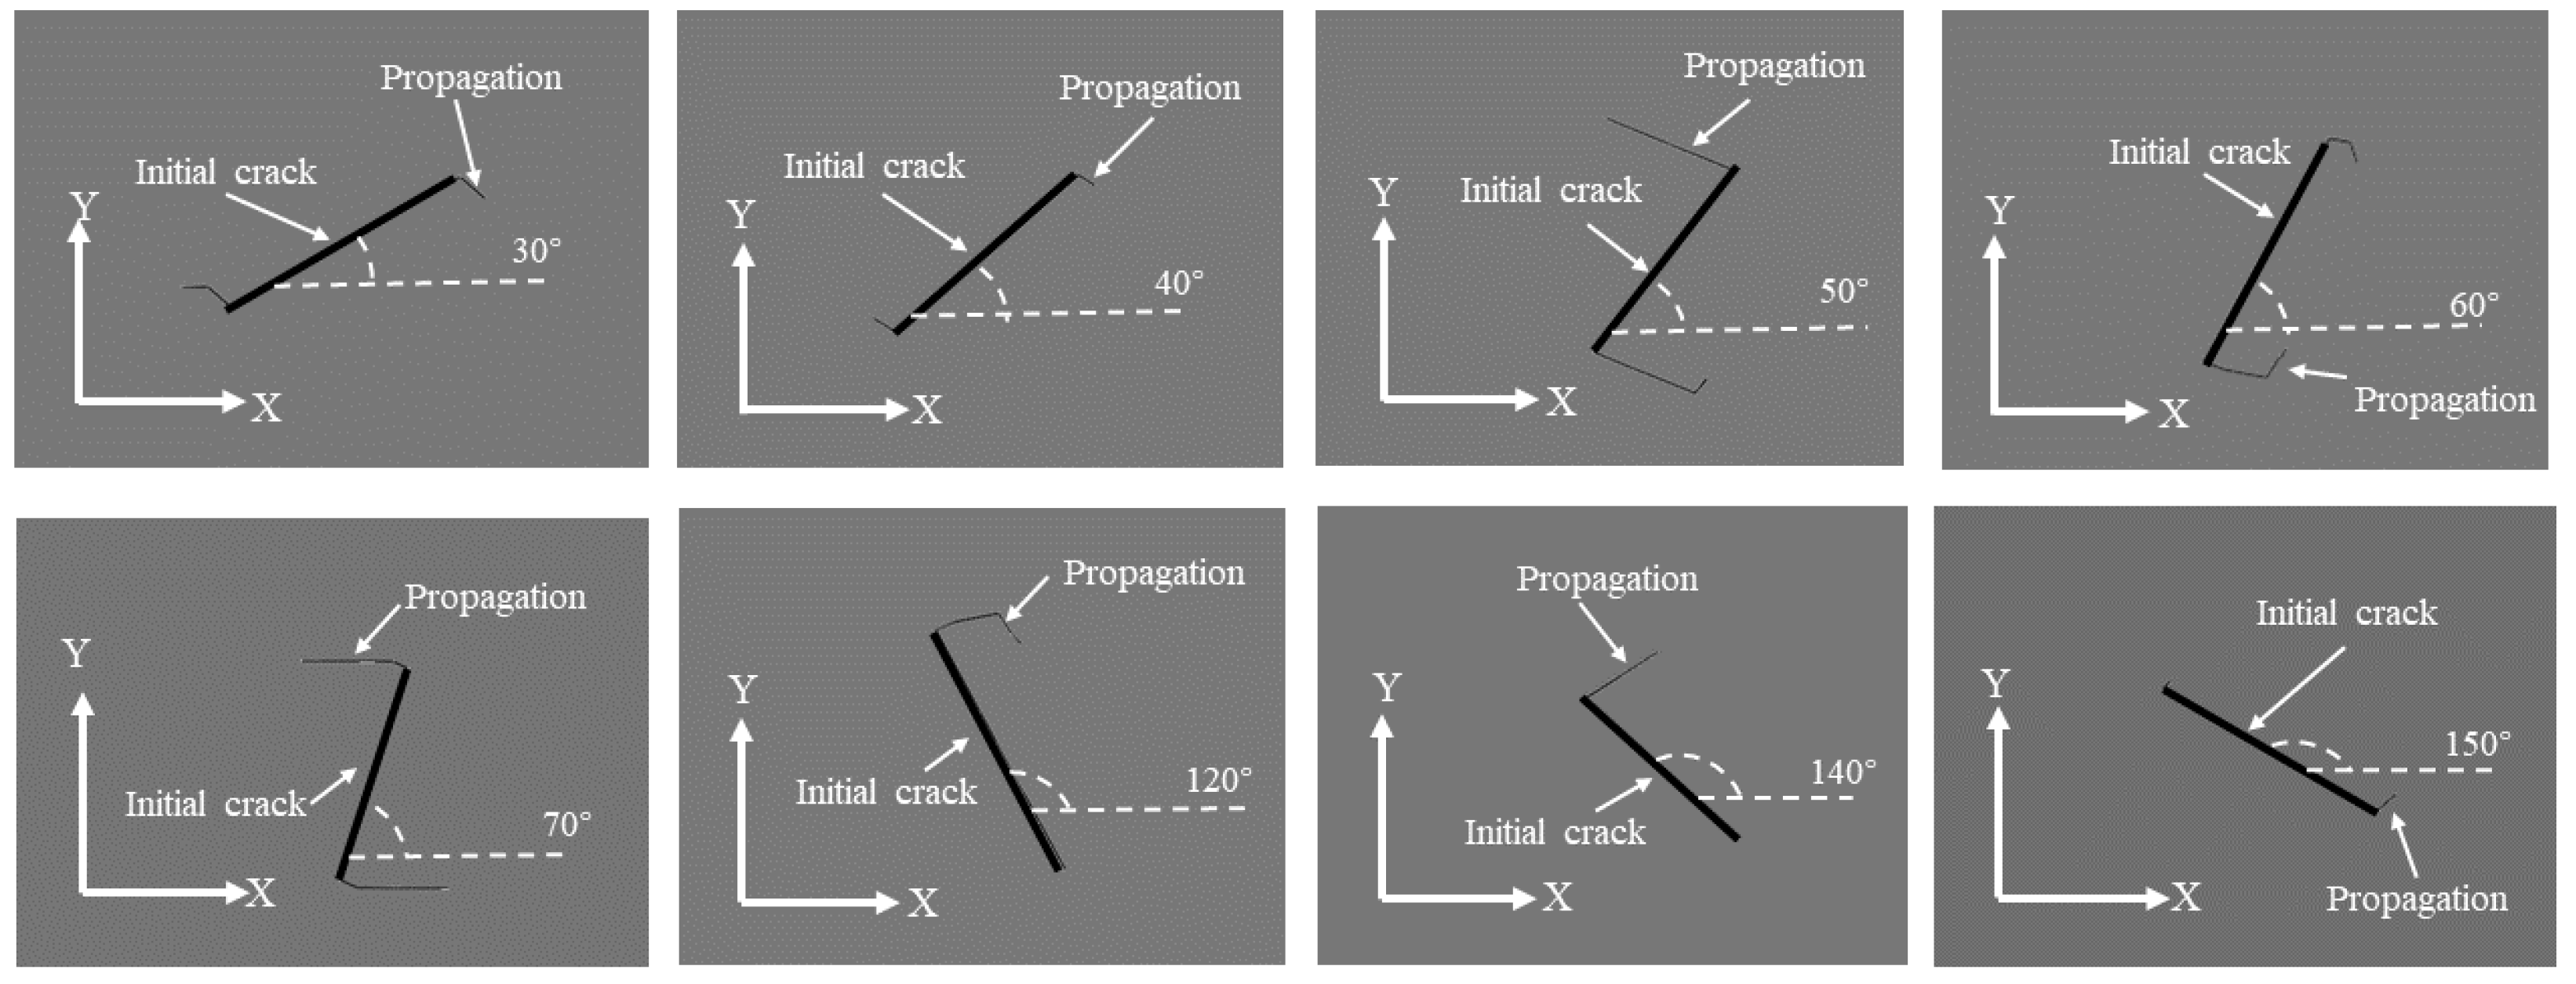
Figure 10 and
Figure 11 depict schematic diagrams illustrating the inclination and propagation of pre-inserted cracks under the propagation scenario for two operational conditions, both occurring within the same number of load cycles. In the figures, the X-axis direction corresponds to 0°, and the Y-axis direction to 90°. The counterclockwise direction represents an increase in inclination. The bold lines indicate the initially pre-inserted cracks, while the thinner lines represent the extended portions of the cracks.
According to the crack propagation results of pre-inserted cracks on the lower surface of the deflector trough under two operating conditions, it is evident that with the continuous increase in the preset inclination angle, the crack propagation length exhibits a trend of initially increasing and then decreasing. The maximum crack propagation length is attained when the inclination angle approaches 70°. Comparing the crack propagation lengths in the two operating conditions, it is observed that under the same inclination angle and the same number of stress cycles, the crack propagation length in the region of maximum deformation is generally greater than in the region of maximum stress.
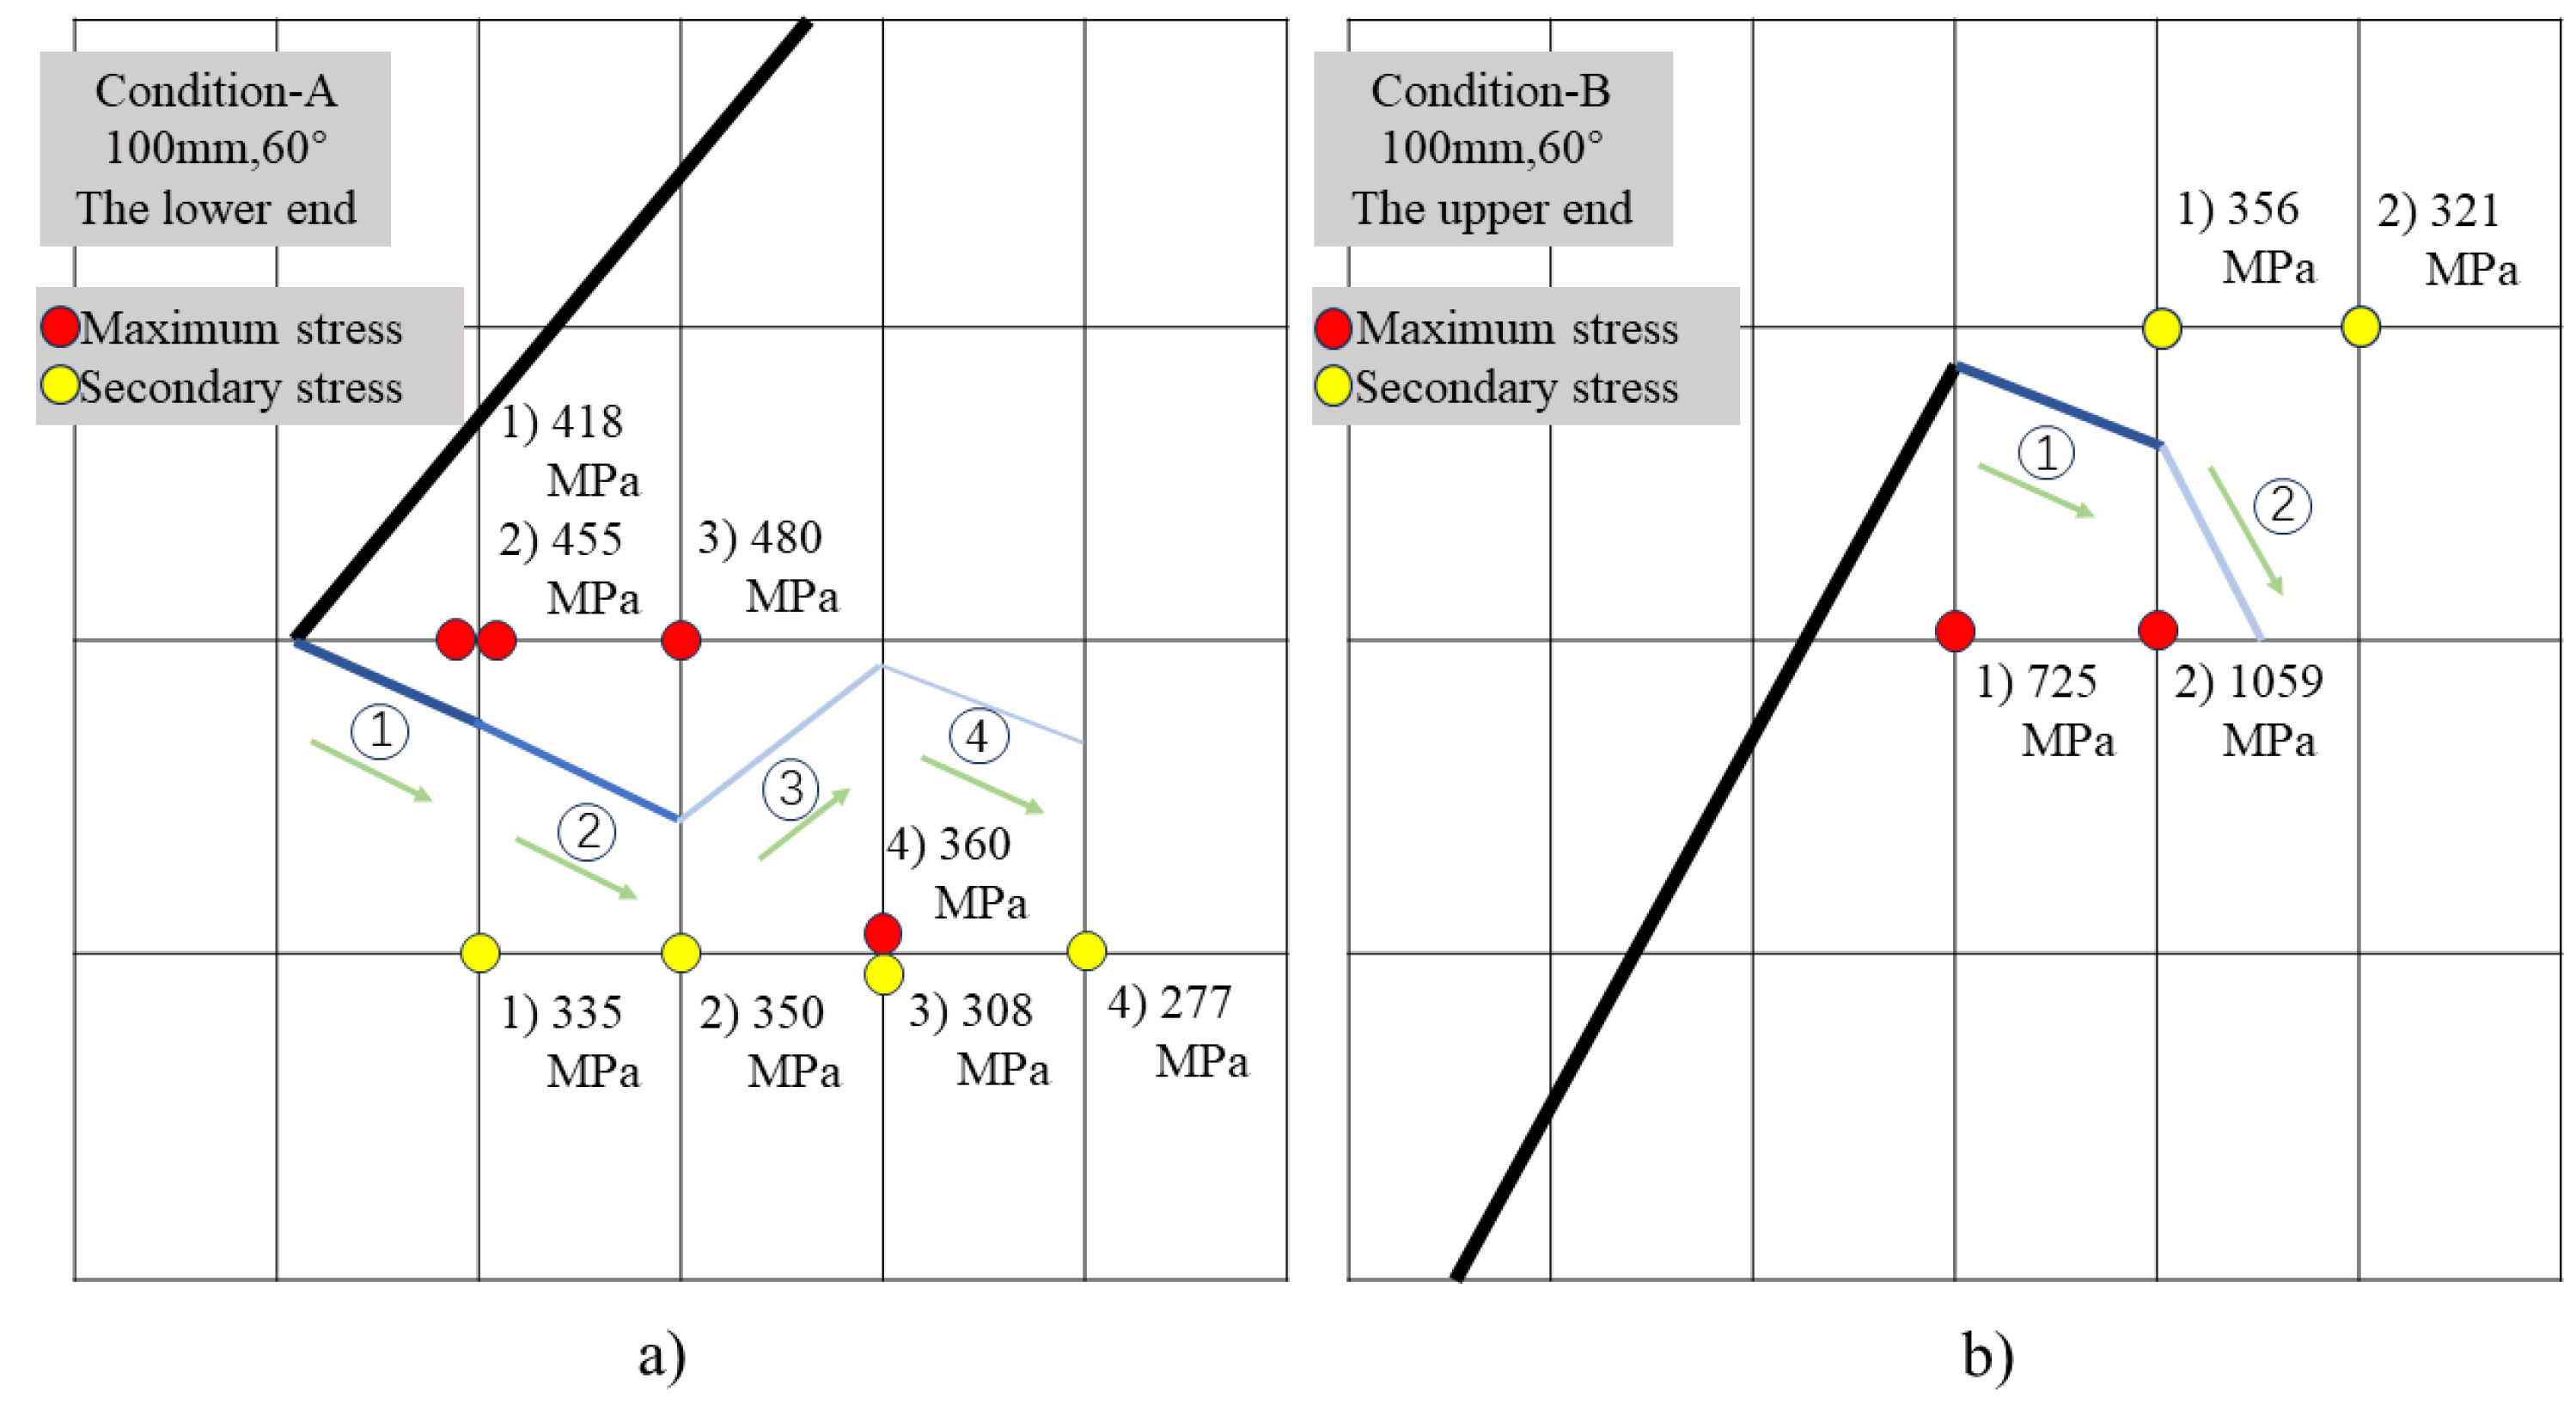
From
Figure 12, it can be observed that as the crack propagates within an element, stress concentrations occur at the nodes along its advancement direction. The position of the node with the maximum stress will determine the deviation direction of the crack tip within that element. Simultaneously, the position and stress magnitude of secondary stress nodes will influence the deflection angle of the crack propagation.
The combined analysis of crack propagation trends from both operating conditions reveals that, under certain preset inclination angles (50°, 60°), crack propagation is not solely oriented towards increasing the length of the crack. After a certain distance of cracking, the crack trajectories at the upper and lower ends, or one of them, tend to extend into the region where the fracture has already occurred. This indicates a tendency to detach the surrounding structure from the lower surface of the deflector. If this trend of crack propagation continues, it will compromise the integrity of the deflector trough structure, leading to a reduction in the strength of the lower surface structure. Simultaneously, detached fragments of the overall structure will be ejected with high kinetic energy, accompanying the plume flow field within the deflector trough. This can result in secondary damage to the deflector trough and other structures, posing a potential threat to the rocket engine. Therefore, particular attention should be given to the 50° and 60° inclination cracks originating from fatigue damage on the lower surface of the rocket deflector trough.
5.3. Minimum Initial Crack Length for Crack Propagation
From
Table 5, it can be observed that the number of load cycles required for the initiation and propagation of pre-inserted cracks at different inclinations exhibits an overall trend of initially decreasing and then increasing with the increase in the inclination angle. In Condition A, the minimum initiation and propagation angle is 50°, while in Condition B, the minimum initiation and propagation angle is 60°. In this section, the minimum initiation and propagation angles obtained from
Table 5 for the two operating conditions are taken as preset angles to investigate the minimum initiation and propagation lengths of cracks at these two angles under their respective conditions.
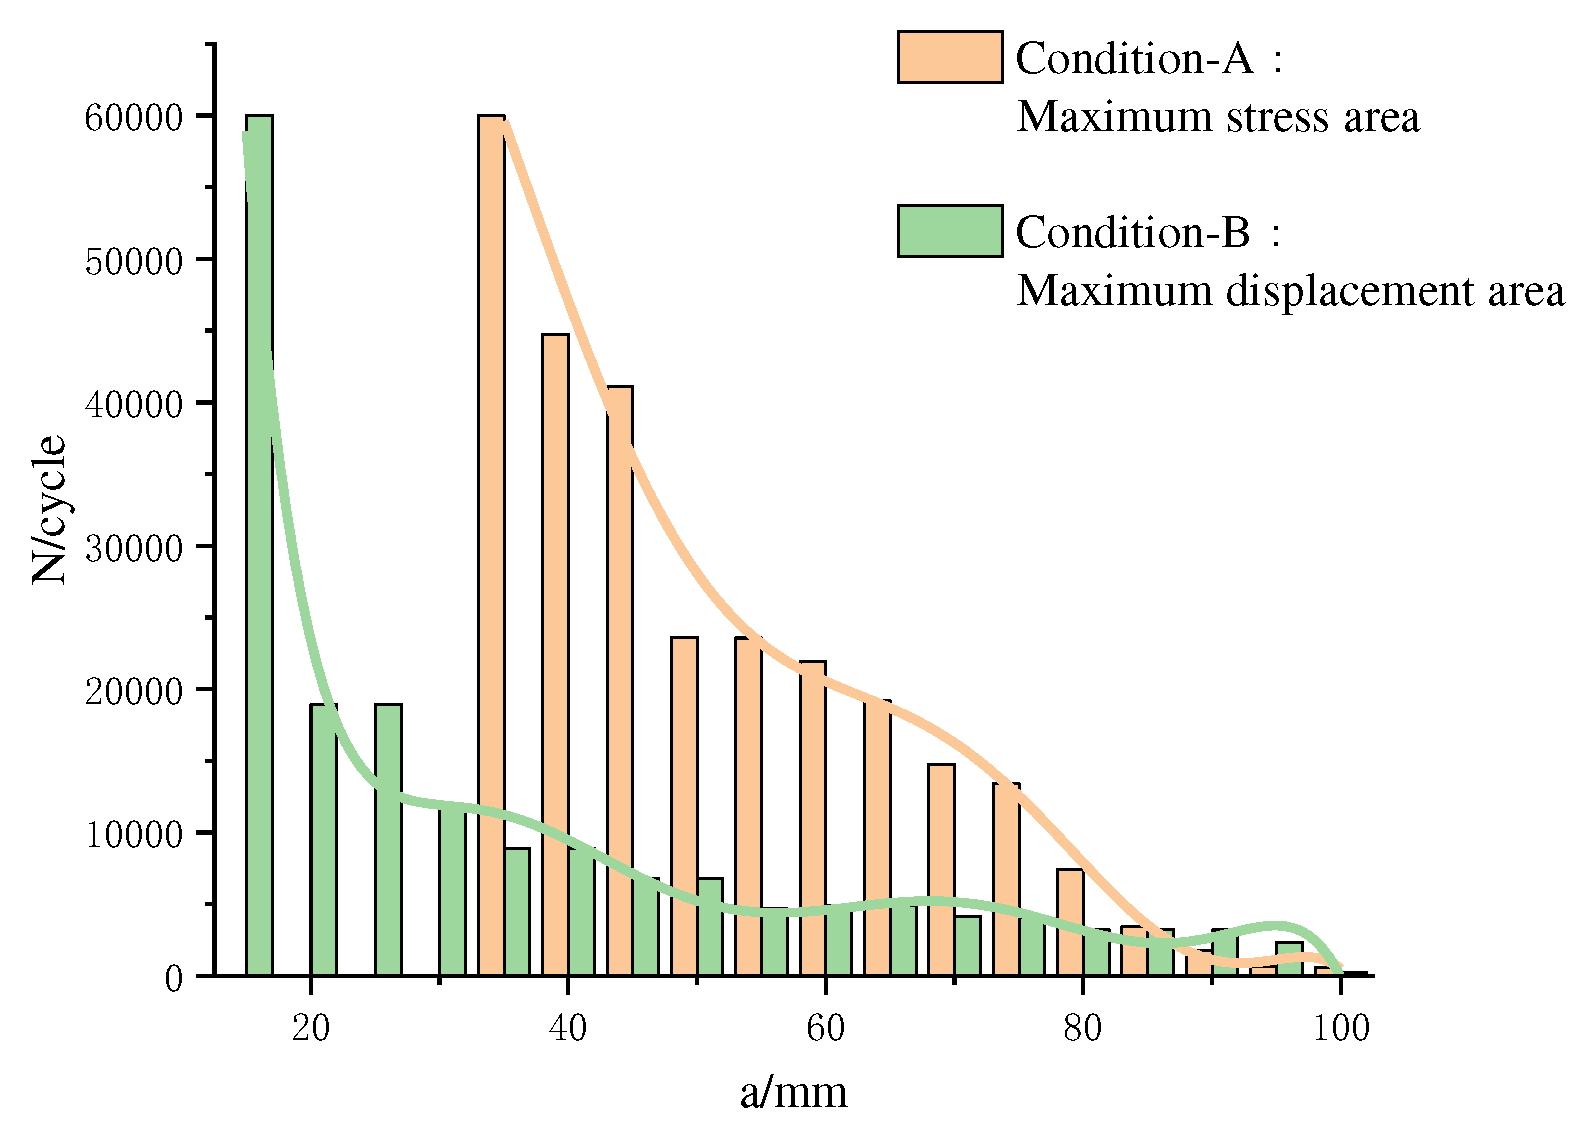
With the increase in the initial length of pre-existing cracks, the rate of fracture energy accumulation at the crack tip accelerates, leading to a reduction in the number of stress cycle repetitions required for crack initiation.
Figure 13 illustrates that, under Condition A, the minimum crack initiation length is approximately 40mm, whereas under Condition B, it is around 20mm. In the region of maximum stress, the number of cycles required for crack initiation is highly sensitive to changes in the initial crack length. As the initial crack length increases, the initiation cycles for cracks located at the point of maximum stress sharply decrease. In the region of maximum deformation, the increase in the initial crack length has a relatively weak impact on the reduction of the crack initiation cycles. The overall decrease remains relatively stable. From the figure, it can be observed that when the initial crack length exceeds 85mm, cracks pre-existing in the region of maximum stress exhibit a faster crack initiation rate, whereas, for lengths below 85mm, cracks situated in the region of maximum deformation demonstrate a faster initiation rate.
5.4. Crack Propagation Rate
From
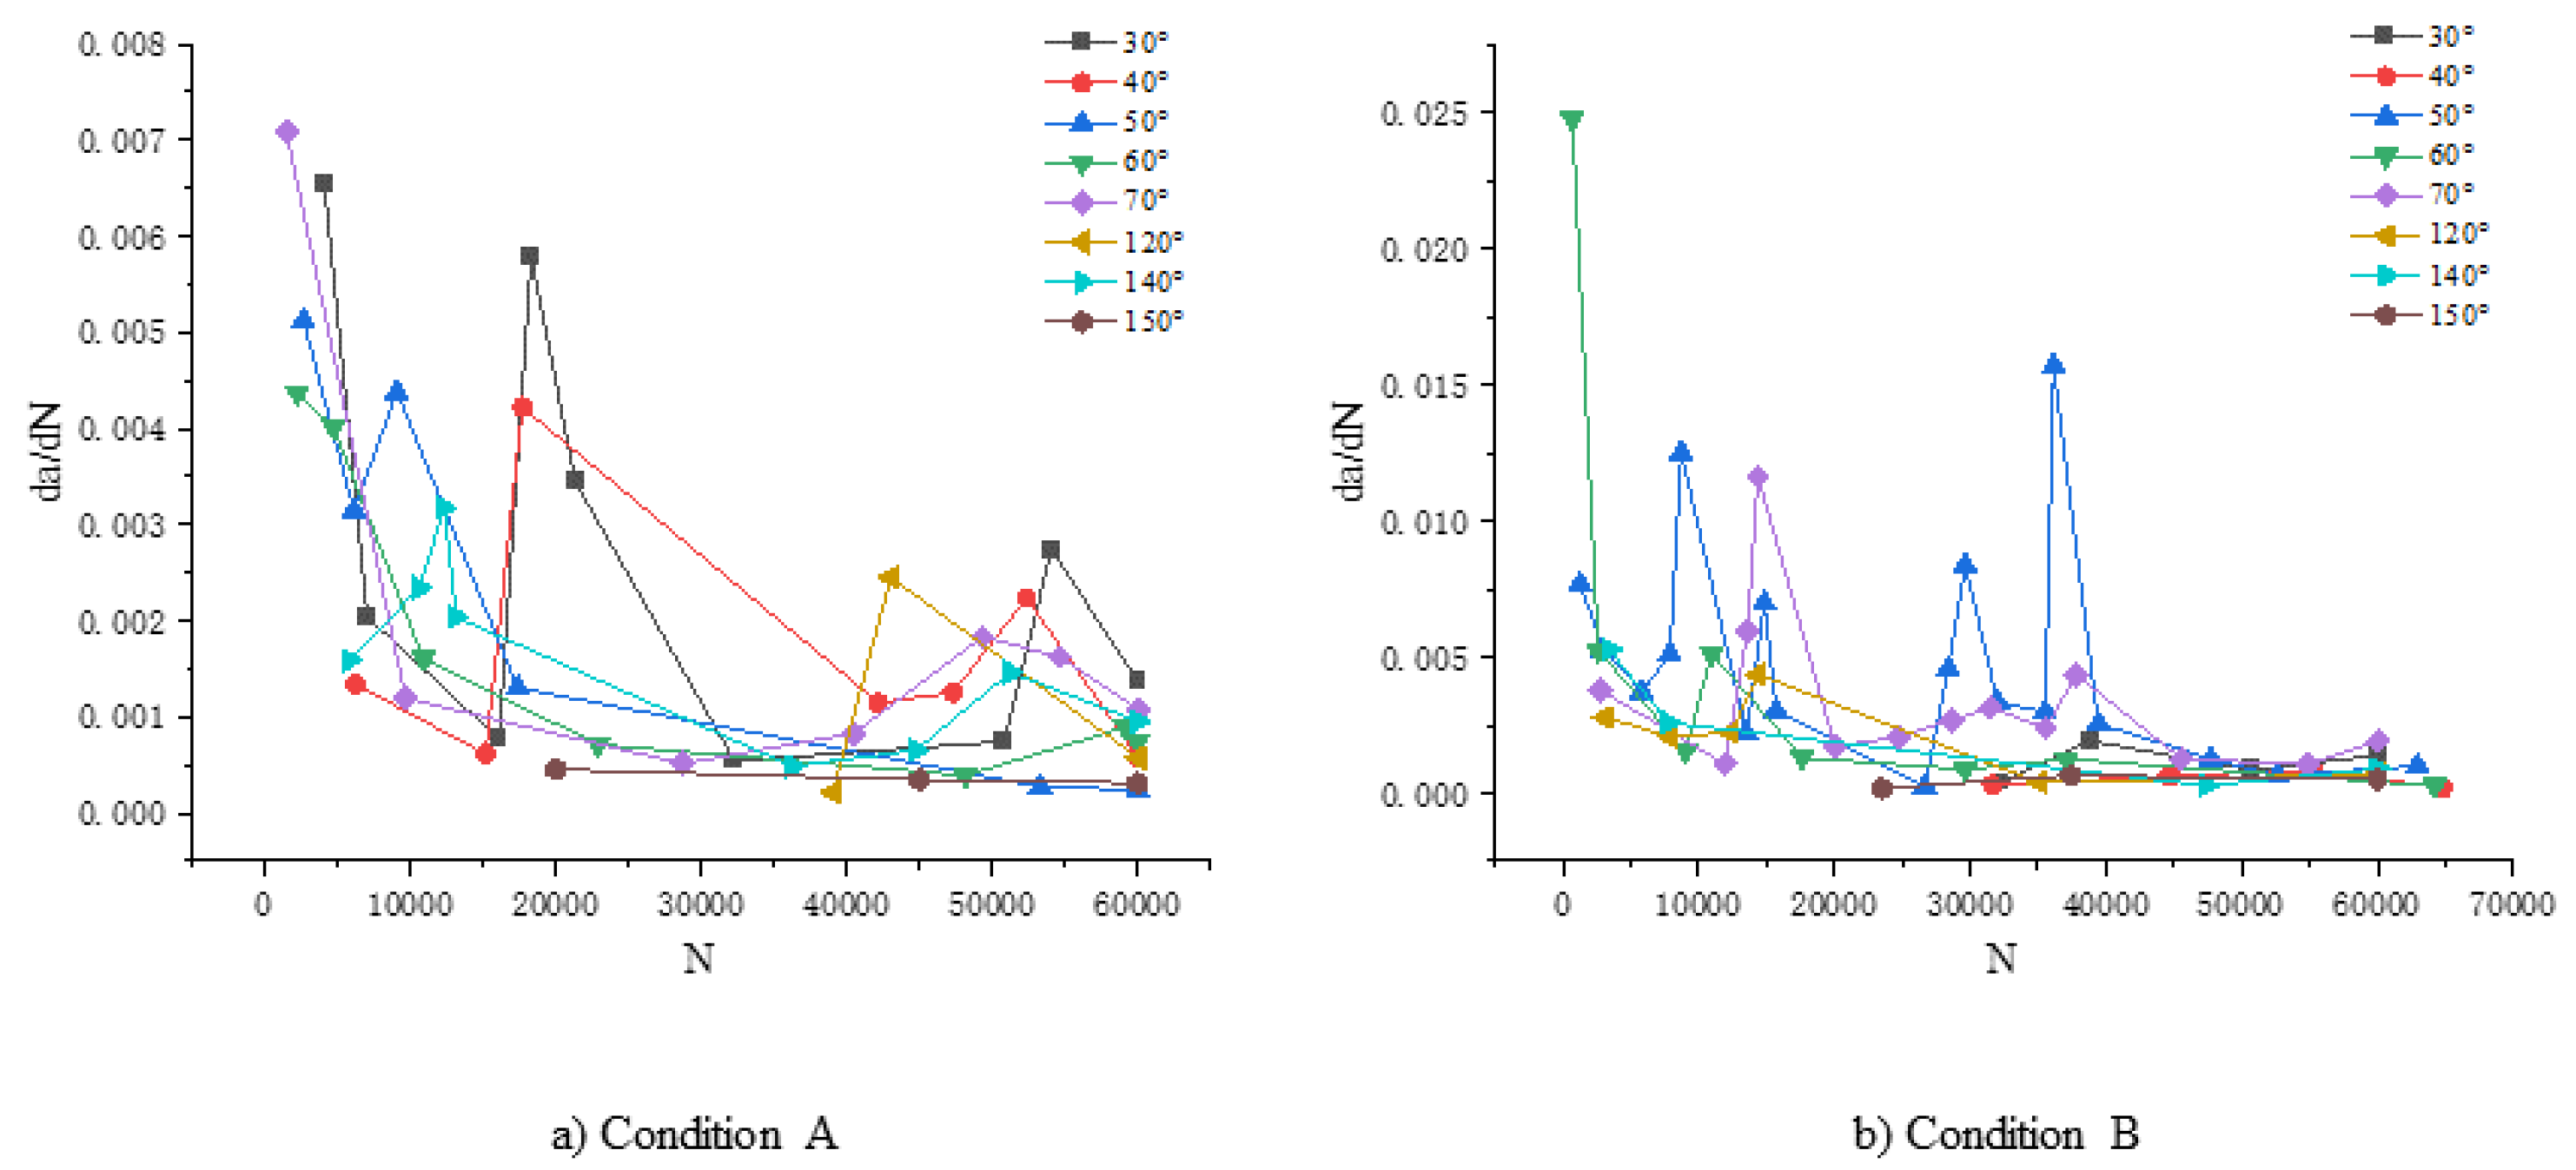
Figure 14, it can be observed that in both conditions, the crack propagation rate exhibits significant fluctuations and abrupt changes during the early stages of fatigue crack propagation. These fluctuations are attributed to variations in the crack propagation mechanism and changes in stress amplitude. However, with an increase in the number of stress cycles, both the crack propagation rate and fluctuations eventually stabilize.
By comparing the two operating conditions, it can be observed that the fluctuation amplitude of the crack propagation rate under Condition A is approximately 0.0063, which is smaller than the fluctuation amplitude under Condition B, which is 0.022. From
Figure 14, it can be observed that the crack propagation rate in the region of maximum deformation is higher than that in the region of maximum stress. Simultaneously, the crack in the region of maximum deformation reaches the stable propagation stage relatively faster compared to the region of maximum stress. This is because the region of maximum stress undergoes larger stress gradient changes during the loading process, leading to significant differences in stress gradients at the ends of the crack. This results in a smaller stress ratio, exacerbating the amplitude variations in cyclic stress, thereby prolonging the time for the crack propagation rate to stabilize.
Figure 14.
Crack propagation rate chart.
Figure 14.
Crack propagation rate chart.
5.5. Analysis of the Influence of High-Temperature Environment on Fatigue Life
To investigate the impact of temperature on the fatigue crack propagation of the lower surface of the deflector trough, it is necessary to first study the influence of temperature loads on the stress distribution of the lower surface.
Figure 15 presents the stress contour map of the lower surface of the rocket deflector at a specific moment under the influence of temperature loads or without them. As shown in the diagram, under the action of a single impact force, the maximum stress on the lower surface of the deflector is located in the middle region directly impacted by the tail flame, with a peak value of 175MPa. However, when coupled with temperature loads, the concentration of stress on the lower surface increases, and it is distributed more in the upper-middle region. The maximum stress value rises to 198MPa, representing an increase of approximately 13%.
According to
Table 6, it can be observed that in the early stages of rocket launch, as the launch time progresses, the impact of coupled temperature load on the increase in stress on the lower surface of the deflector trough exhibits a gradually decreasing trend. When the distribution state of the rocket tail flame jet stabilizes on the lower surface of the deflector trough, the temperature load increases the maximum stress value on the lower surface of the deflector trough, which is subjected only to a single impact force, by approximately 10%. Through
Figure 15, it can be observed that temperature load alters the stress distribution on the lower surface of the deflector under the action of a single impact load, causing the concentration of stress to shift from the central region directly impacted by the rocket's tail flame to the upper-middle region. The maximum stress value induced by the temperature load (205MPa) is greater than the maximum stress values under the sole impact load (175MPa) and the coupled load (198MPa). This indicates that the coupling of temperature and impact loads decreases the maximum stress on the lower surface, thereby enhancing the fatigue life of the deflector's lower surface.
The application of the S-N curve method for calculating the crack initiation life on the lower surface of the deflector reveals that cyclic loading from a single impact force alone does not lead to structural fatigue failure on the lower surface. Consequently, there is no initiation or propagation of cracks on the lower surface of the deflector under the influence of a sole impact load.
6. Conclusions
This paper, based on XFEM, draws the following conclusions through a study on fatigue crack propagation on the lower surface of an offshore rocket deflector:
- (1)
Under the coupling effect of high temperature and impact, the length of fatigue crack propagation on the lower surface of the rocket deflector exhibits an increasing trend with the increase in the preset tilt angle, followed by a decrease when the tilt angle exceeds70°. The maximum crack propagation length is reached when the tilt angle approaches 70°.
- (2)
The position of the node with the maximum circumferential stress at the crack tip will determine the direction of crack propagation. Simultaneously, the position and magnitude of secondary stress nodes will influence the deflection angle of crack propagation.
- (3)
Compared to the single impact force load, the coupled temperature load not only increases the maximum stress on the lower surface of the deflector by approximately 10% but also shifts the stress concentration region from the central area directly impacted by the rocket's tail flame to the upper-middle region. This, in turn, promotes the initiation and propagation of cracks on the lower surface of the deflector.
Author Contributions
Conceptualization, Z.X. and Y.Y.; methodology, Z.X.; software, C.Z.; validation, T.L.; formal analysis, C.Z.; investigation, R.L.; resources, Z.X.; data curation, T.L. and Y.Y.; writ-ing—original draft preparation, Z.X. and C.Z; writing—review and editing, Z.X, C.Z and Y.Y.; visualization, R.L. All authors have read and agreed to the published version of the manuscript.
Funding
This research received no external funding.
Institutional Review Board Statement
Not applicable.
Informed Consent Statement
Not applicable.
Data Availability Statement
The data presented in this study are available on request from the corresponding author.
Acknowledgments
Thanks to the support from the Marine Design and Research Institute of China Institute for software usage.
Conflicts of Interest
The authors declare no conflicts of interest.
References
- Cui, W.; Cai, X.; Leng, J. A state-of-the-art review for the fatigue strength. J. Ship Mech. 1998, 04, 63-81.
- Bergara, A.; Dorado, J.I.; Martín-Meizoso, A.; Martínez-Esnaola, J.M. Fatigue crack propagation in complex stress fields: Experiments and numerical simulations using the Extended Finite Element Method (XFEM). Int. J. Fatigue. 2017, 103, 112-121. [CrossRef]
- Patzák, B.; Jirásek, M. Process zone resolution by extended finite elements. Eng. Fract. Mech. 2003, 70, 957-977. [CrossRef]
- Daux, C.; Dolbow, J.E.; Sukumar, N.; Belytschko, T. Arbitrary branched and intersecting cracks with the eXtended Finite Element Method. Int. J. Numer. Methods Eng. 2000, 48, 1741-1760.
- Fleck, N.A.; Shin, C.S.; Smith, R.A. Fatigue crack growth under compressive loading. Eng. Fract. Mech. 1985, 21(1), 173–185. [CrossRef]
- Sahouryeh, E.; Dyskin, A.V.; Germanovich, L.N. Crack growth under biaxial compression. Eng. Fract. Mech. 2002, 69(18), 2187–2198. [CrossRef]
- Zhang, J.; He, X.D.; Sha, Y.; Du, S.Y. The compressive stress effect on fatigue crack growth under tension–compression loading. Int. J. Fatigue. 2010, 32(2), 361–367. [CrossRef]
- Menouillard, T.; Réthoré, J.; Combescure, A.; Bung, H. Efficient explicit time stepping for the eXtended Finite Element Method (X-FEM). Int. J. Numer. Methods Eng. 2006, 68(9), 911–939. [CrossRef]
- Fries, T.-P.; Baydoun, M. Crack propagation with the extended finite element method and a hybrid explicit-implicit crack description. Int. J. Numer. Methods Eng. 2011, 89(12), 1527–1558. [CrossRef]
- Nikfam, M.R.; Zeinoddini, M.; Aghebati, F.; Arghaei, A.A. Experimental and XFEM modelling of high cycle fatigue crack growth in steel welded T-joints. Int. J. Mech. Sci. 2019, 154, 178-193. [CrossRef]
- Xiao, M. Testing for paris coefficients C,m and ΔK_(th) of Q235. J. Mech. Strength. 2003, 02, 215-218. [CrossRef]
- Jin, S,; Zhang, W. Analysis and Verification for the Crack Growth of Lower-wing Panel Based on XFEM. Journal of Xi'an Aeronautical Institute. 2023, 41(01), 18-23. [CrossRef]
- He, L.; Liu Z.; Gu J, Wang J.; Men, K. Fatigue Crack Propagation Path and Life Prediction Based on XFEM. Journal of Northwestern Polytechnical University.2019, 37(04), 737-743.
- Li, Q. Aeroengine turbine disk GH4133B alloy fatigue crack propagation Numerical Simulation Study. M.D. Xiangtan University, Xiangtan, 2018.
- Killpack, M,; Abed-Meraim, F. Limit-point buckling analyses using solid, shell and solid–shell elements. J. Mech. Sci. Tech. 2011, 25(5), 1105-1117. [CrossRef]
|
Disclaimer/Publisher’s Note: The statements, opinions and data contained in all publications are solely those of the individual author(s) and contributor(s) and not of MDPI and/or the editor(s). MDPI and/or the editor(s) disclaim responsibility for any injury to people or property resulting from any ideas, methods, instructions or products referred to in the content. |
© 2023 by the authors. Licensee MDPI, Basel, Switzerland. This article is an open access article distributed under the terms and conditions of the Creative Commons Attribution (CC BY) license (http://creativecommons.org/licenses/by/4.0/).
