1. Introduction
Autosomal polycystic kidney disease (PKD) is a potentially lethal monogenic disorder characterized mainly by the development of fluid filled cysts in the kidneys of patients and various extra-renal manifestations [
1]. The disease is associated with mutations in the genes
PKD1 and
PKD2, which encode polycystin 1 (PC1) and polycystin 2 (PC2), respectively. These proteins are located to or near the primary cilium of tubule cells, and their dysfunction leads to abnormal cell proliferation and fluid secretion [
2].
In 1991, Wilson et al. found the Na, K-ATPase to be mislocated to the apical membrane of cyst-lining epithelia [
3]. This provided a possible explanation for the phenomenon of fluid secretion: Perhaps the epithelial cells were secreting rather than reabsorbing fluid because of a reversal of their apical-basal polarity. Cell polarity was further implicated in the pathogenesis of polycystic kidney disease by the discovery of aberrant planar cell polarity in animal models of PKD [
4,
5].
The establishment and maintenance of epithelial apical-basolateral cell polarity relies on three things: Intrinsic sorting of membrane proteins to different segments of the membrane, protein complexes situated at the respective membrane domains, and extrinsic stimuli that inform the cells of their orientation in the three-dimensional space [
6].
Intrinsic sorting is based on motifs inherent to the respective proteins as well as membrane properties. For instance, tyrosine-based and dileucine motifs in the cytosol facing-domains of membrane proteins are associated with basolateral sorting, while GPI-anchors and glycosylation are associated with sorting to the apical membrane [
7]. The docking of vesicles to membranes is dependent on interaction between v-SNARE and t-SNARE complexes. The apical and basolateral membranes differ in that syntaxin-3 is present in the t-SNARE complexes of the apical membrane, while syntaxin-4 is expressed in the basolateral membrane [
8,
9]. Furthermore, lipid composition may have implications for vesicle docking and protein trafficking as phosphatidylinositol 3,4,5-trisphosphate (PIP
3) is present in the basolateral membrane and phosphatidylinositol 4,5-bisphosphate (PIP
2) is found mainly in the apical membrane [
10,
11].
The polarity factors defining the apical domain are the portioning defective (Par) protein complex consisting of atypical protein kinase C (aPKC), Par-6, CDC-42, and the Crumbs complex comprised of Pals-1 and PATJ [
12,
13]. The aPKC forms a complex with Par-6 allowing aPKC to exert its phosphorylating properties [
14]. This activity is amplified by binding of CDC-42 and the Crumbs complex [
15]. The resultant phosphorylation is the basis of exclusion of proteins from the apical domain [
16,
17]. The basolateral domain is defined by polarity factors Scribble, Discs large (Dlg) and Lethal giant larvae (Lgl), collectively referred to as the Scribble complex [
12]. The tight junction constitutes a molecular fence separating the apical from the basolateral domain thereby hindering the lateral diffusion of membrane proteins belonging to the apical into the basolateral domain [
18].
Additionally, to polarize correctly, cells require extrinsic signals such as cell-cell interaction via E-cadherin [
19] and ECM-cell interaction with laminin [
20].
Thus, several molecules involved in cell polarity offer the opportunity to investigate the polarization of epithelia by means of immunohistochemistry. In this study, we investigated whether the apical-basolateral polarity of cyst-lining epithelia had been disturbed in kidney tissue from six PKD patients.
2. Results
The regular epithelial single cuboidal cell layer lining most cysts was replaced by apparently dedifferentiated and flattened epithelium in a subset of cysts in the hPKD sections [
21]. These cysts were void of almost any immunohistochemical staining. In some cases, staining was observed. However, the thinness of the cells made it impossible to distinguish the subcellular localization of the signal. Thus, assessment of the apical-basolateral polarity of the thin-walled cysts was hindered and, in the following, only cysts lined with taller epithelium are considered.
2.1. The Na,K-ATPase α1 Subunit and E-Cadherin Localize to the Basolateral Membranes of Renal Cyst Epithelia
Previous studies indicated that the Na,K-ATPase is expressed in luminal domains of renal cysts from human kidneys, thus indicating a reversed cell polarity [
3,
22]. As exemplified in
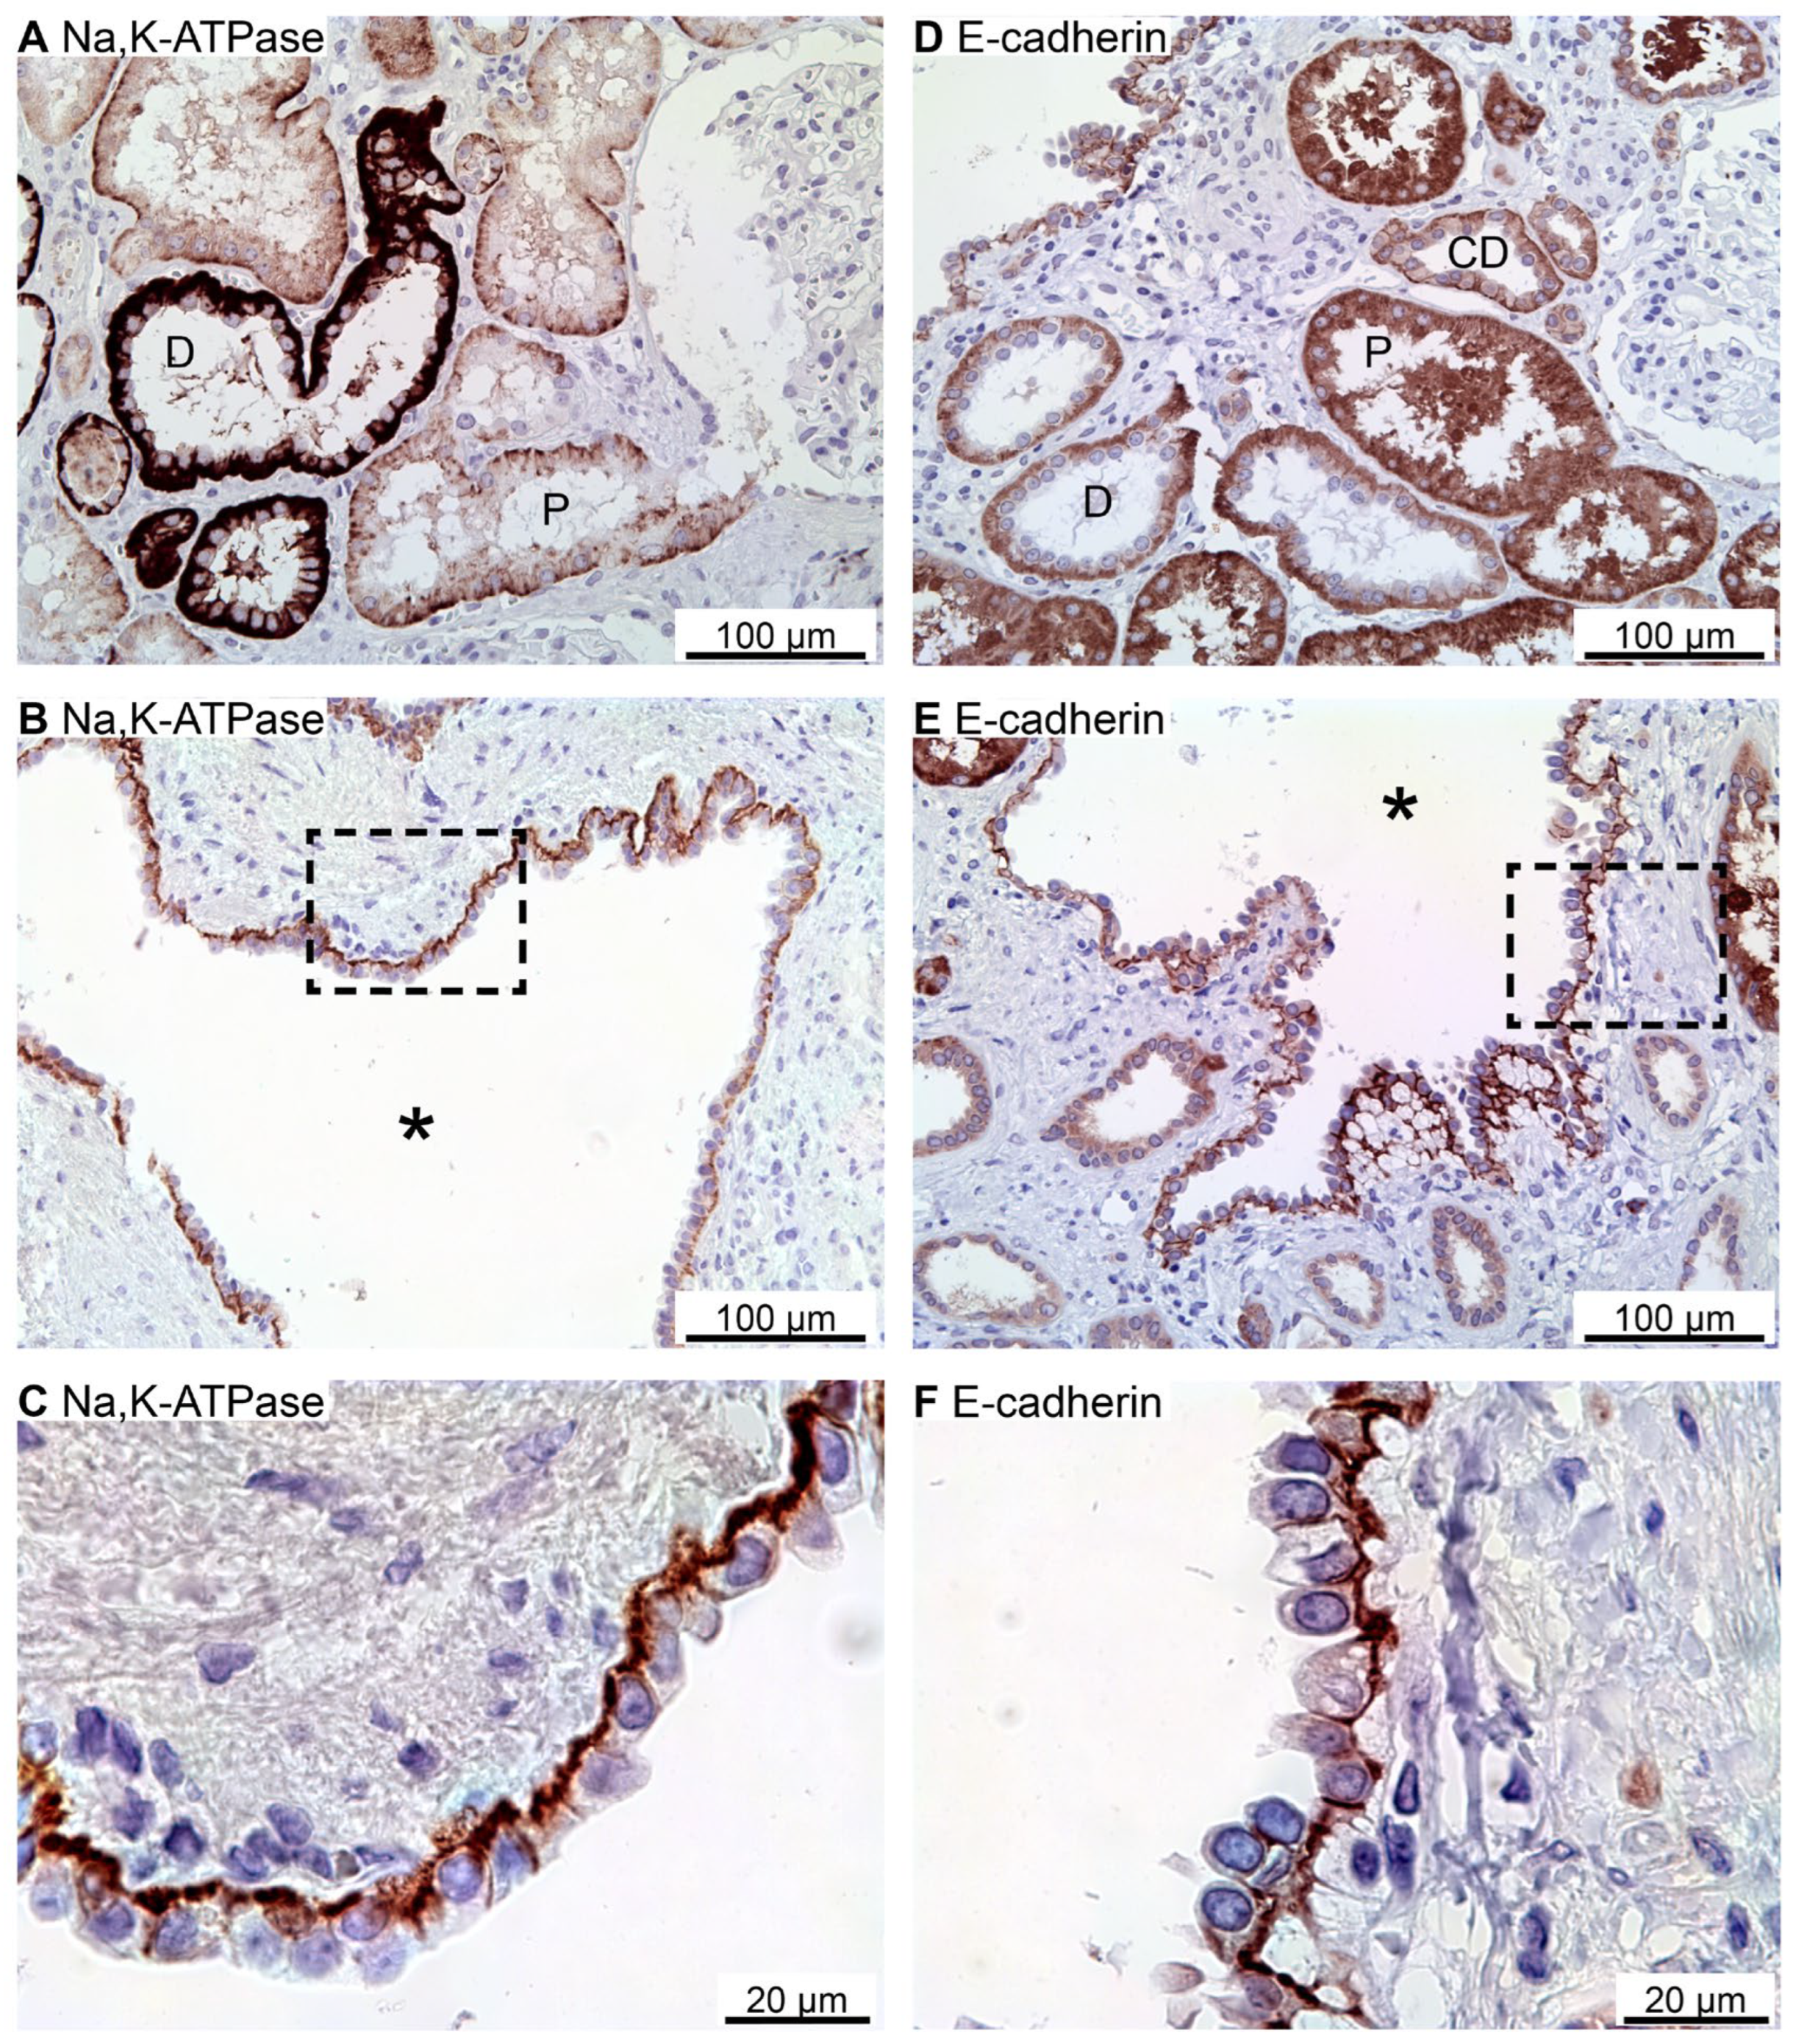
Figure 1A, immunolabelling for the Na,K-ATPase α1 subunit revealed the expected basolateral domain staining in proximal tubules and distal tubules. All stained cyst epithelia also displayed basolateral expression Na,K-ATPase (
Figure 1B,C). Apical immunolabelling of cysts was never observed in any of the 6 biopsies. E-cadherin is another example of a typical epithelial membrane protein from the basolateral domain [
23].
Figure 1D shows that the cell-cell adhesion molecule E-cadherin was also immunolocalized to the basolateral membrane domains of renal tubules, with the most prominent signal in the collecting ducts. In E-cadherin positive renal cysts (majority of cysts), the protein was confined to the basolateral plasma membrane domain (
Figure 1E,F). Thus, we did not find evidence of a reversed polarization of the Na,K-ATPase and E-cadherin in human renal cysts from 6 biopsies. We note that despite a marked unspecific reaction, there was no was no specific staining signal for E-cadherin in the proximal tubule.
2.2. SNARE-Protein Syntaxin-3, Crumbs and Par Complexes Are Confined to the Apical Membranes of Renal Cyst Epithelia
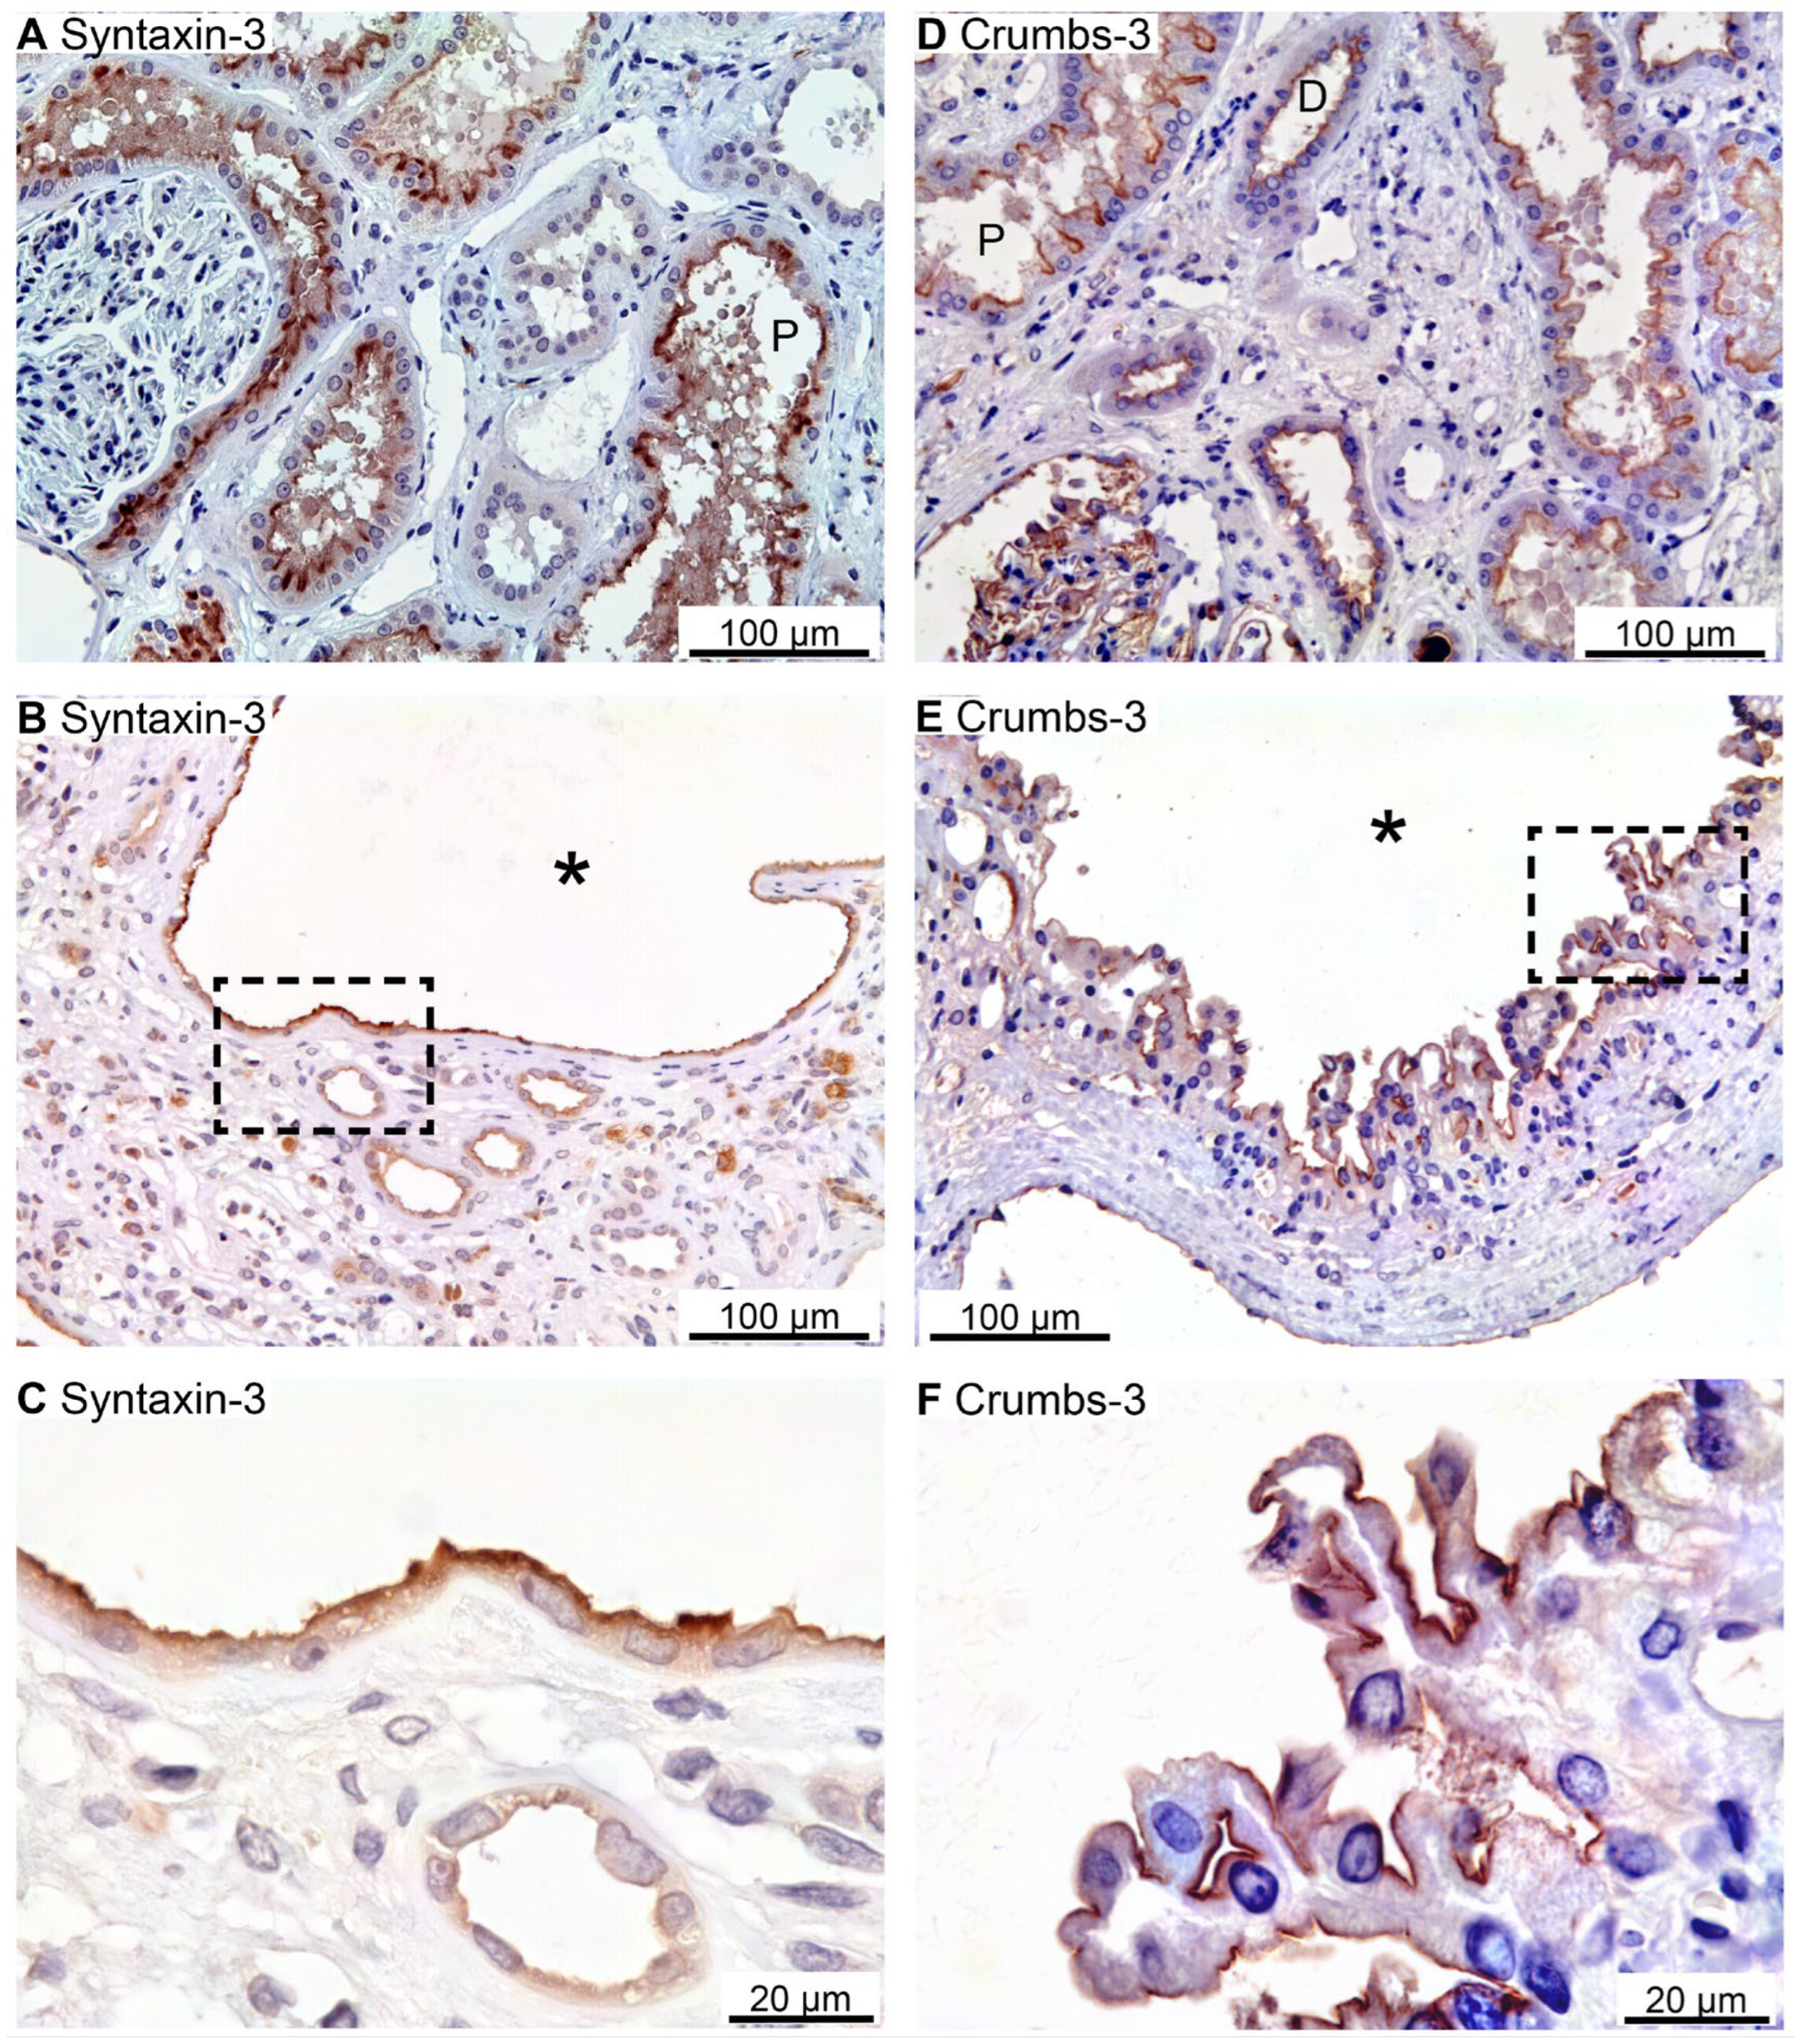
Immunoreactivity against the apical SNARE protein Syntaxin-3 [
24] was observed in the apical plasma membrane domain of mainly the proximal renal tubules as shown in
Figure 2A. Some cysts were also positive for apical Syntaxin-3 (
Figure 2B,C).
The Crumbs and Par complexes constitute the defining apical membrane domain protein complexes [
6,
11].
Figure 2D illustrates apical membrane immunoreactivity for Crumbs-3 in proximal and distal renal tubules. Apical Crumbs-3 staining was observed in all immunoreactive cysts (
Figure 2E,F).
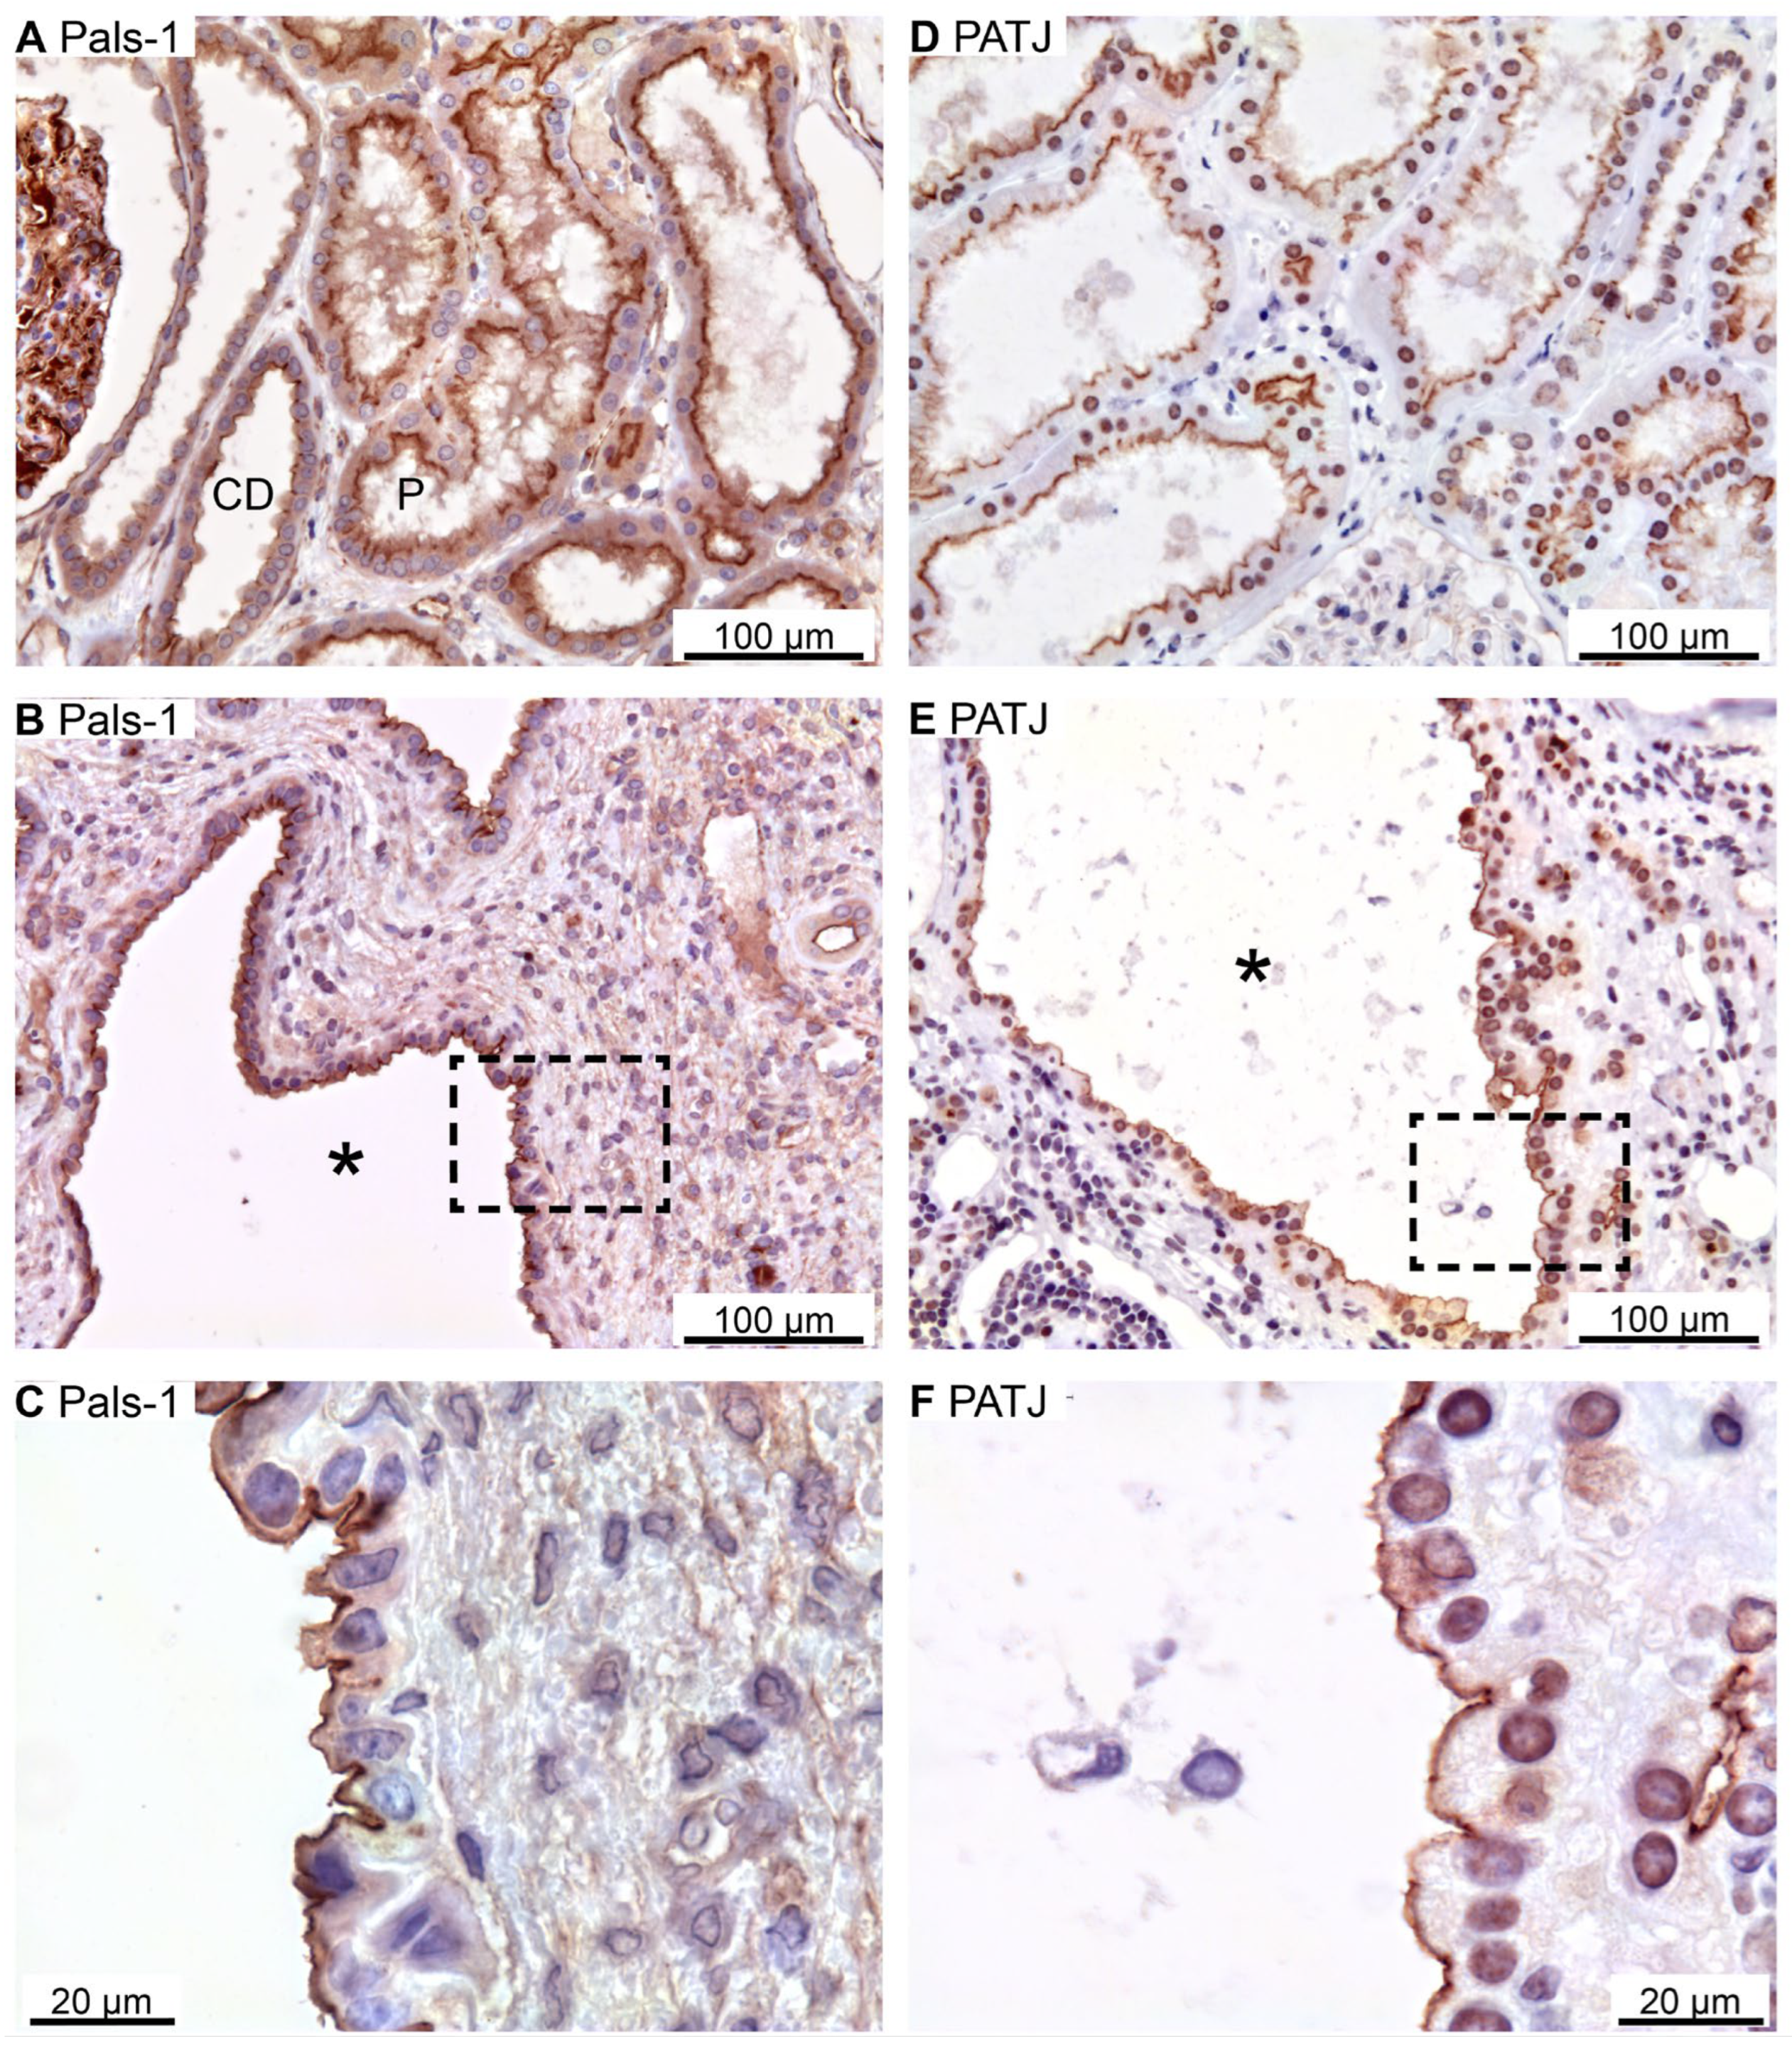
Apical immunostaining for the other Crumbs complex proteins Pals-1 (majority of cysts) and PATJ was also observed in renal tubules as well as in all immunoreactive cysts (
Figure 3A–C and
Figure 3D–F, respectively).
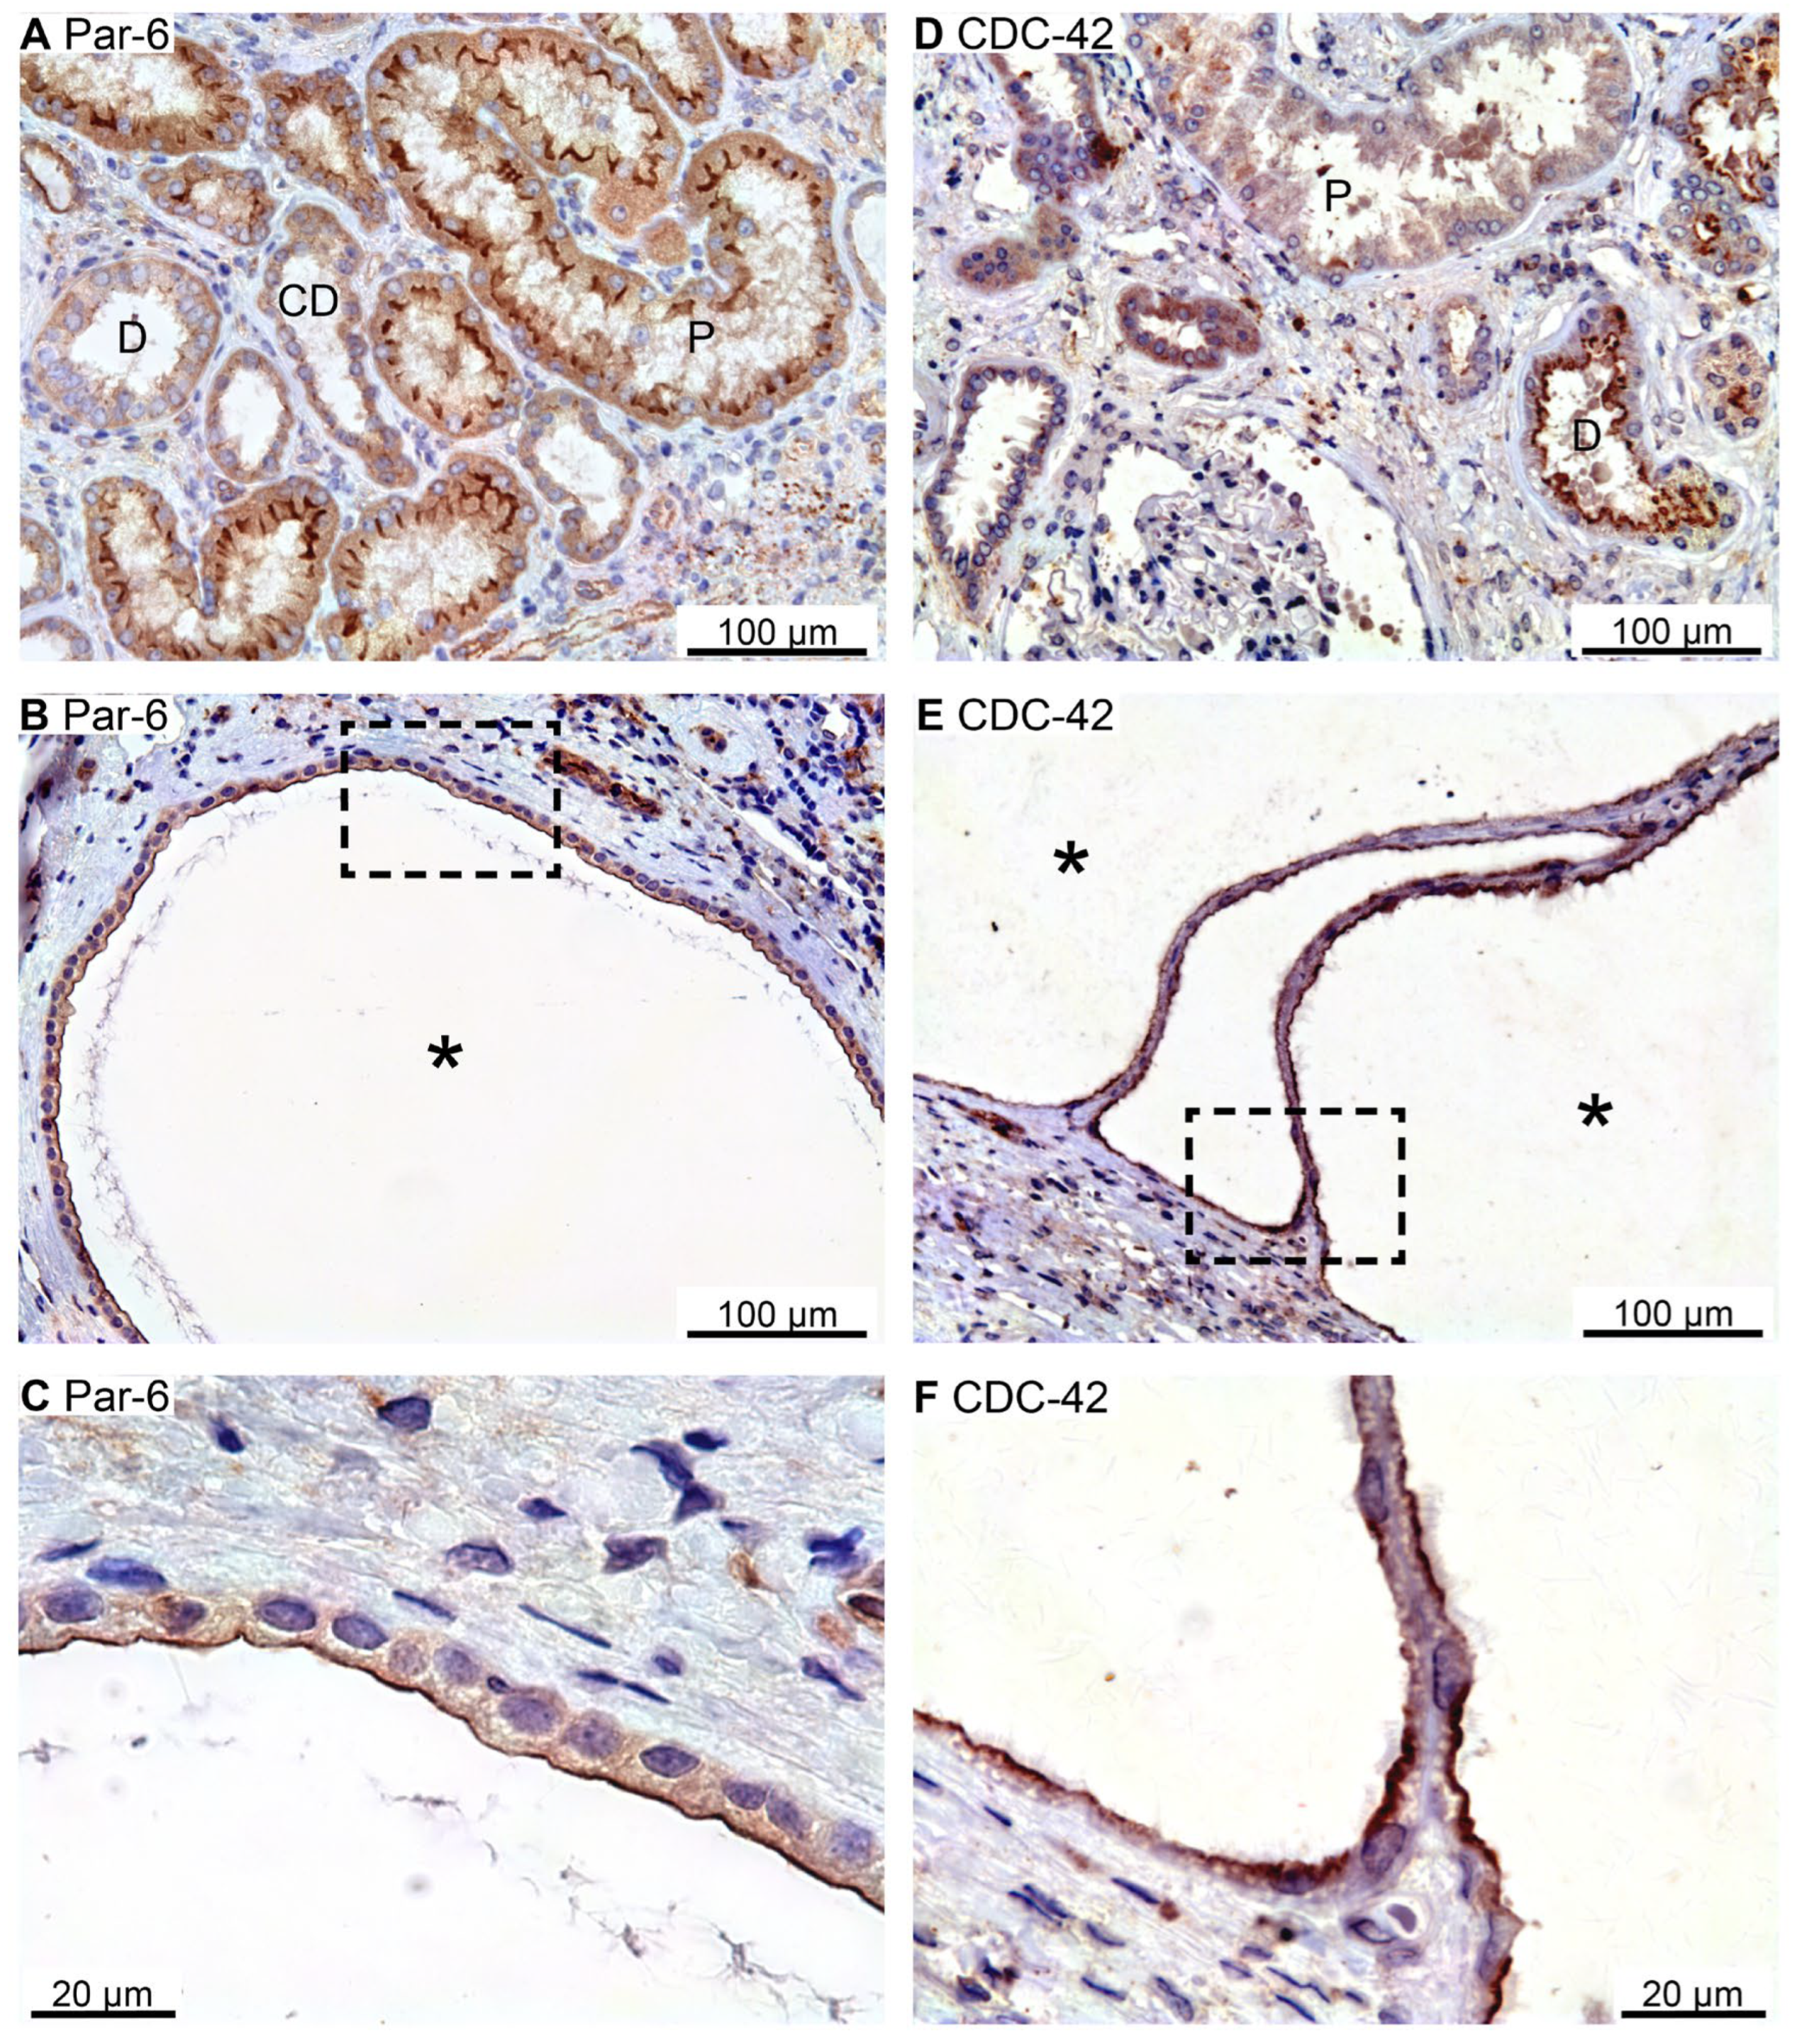
The Par complex is also an apical and tight junctional protein complex typically consisting of Par-3, Par-6, and CDC-42 [
13,
25,
26]. Only the Par-6 and CDC-42 antibodies revealed immunostaining in human kidney biopsies.
Figure 4A illustrates apical membrane domain Par-6 immunoreactivity in proximal tubules and, less convincingly, in distal renal tubules and collecting ducts. The Par-6 positive cyst epithelium also exhibited exclusive apical membrane labelling (
Figure 4B,C). Thin-walled cysts occasionally displayed basal membrane Par-6 immunostaining (not shown). CDC-42 immunoreactivity was observed in renal tubules corresponding to the apical plasma membrane domain (
Figure 4D). A similar labelling pattern was observed in all immunoreactive renal cysts (
Figure 4E,F). We note that the proximal tubule did not exhibit staining for CDC-42, while the thick ascending limb (TAL) did not show immunoreactivity for Par-6 nor CDC-42. Neither did we detect any CDC-42 signal from the cortical collecting ducts. Taken together, all detected apical membrane determinant proteins were expressed in the apical membrane of renal cyst epithelial cells.
2.3. Scribble Complex Components Are Expressed in the Basolateral Domain of Renal Cysts
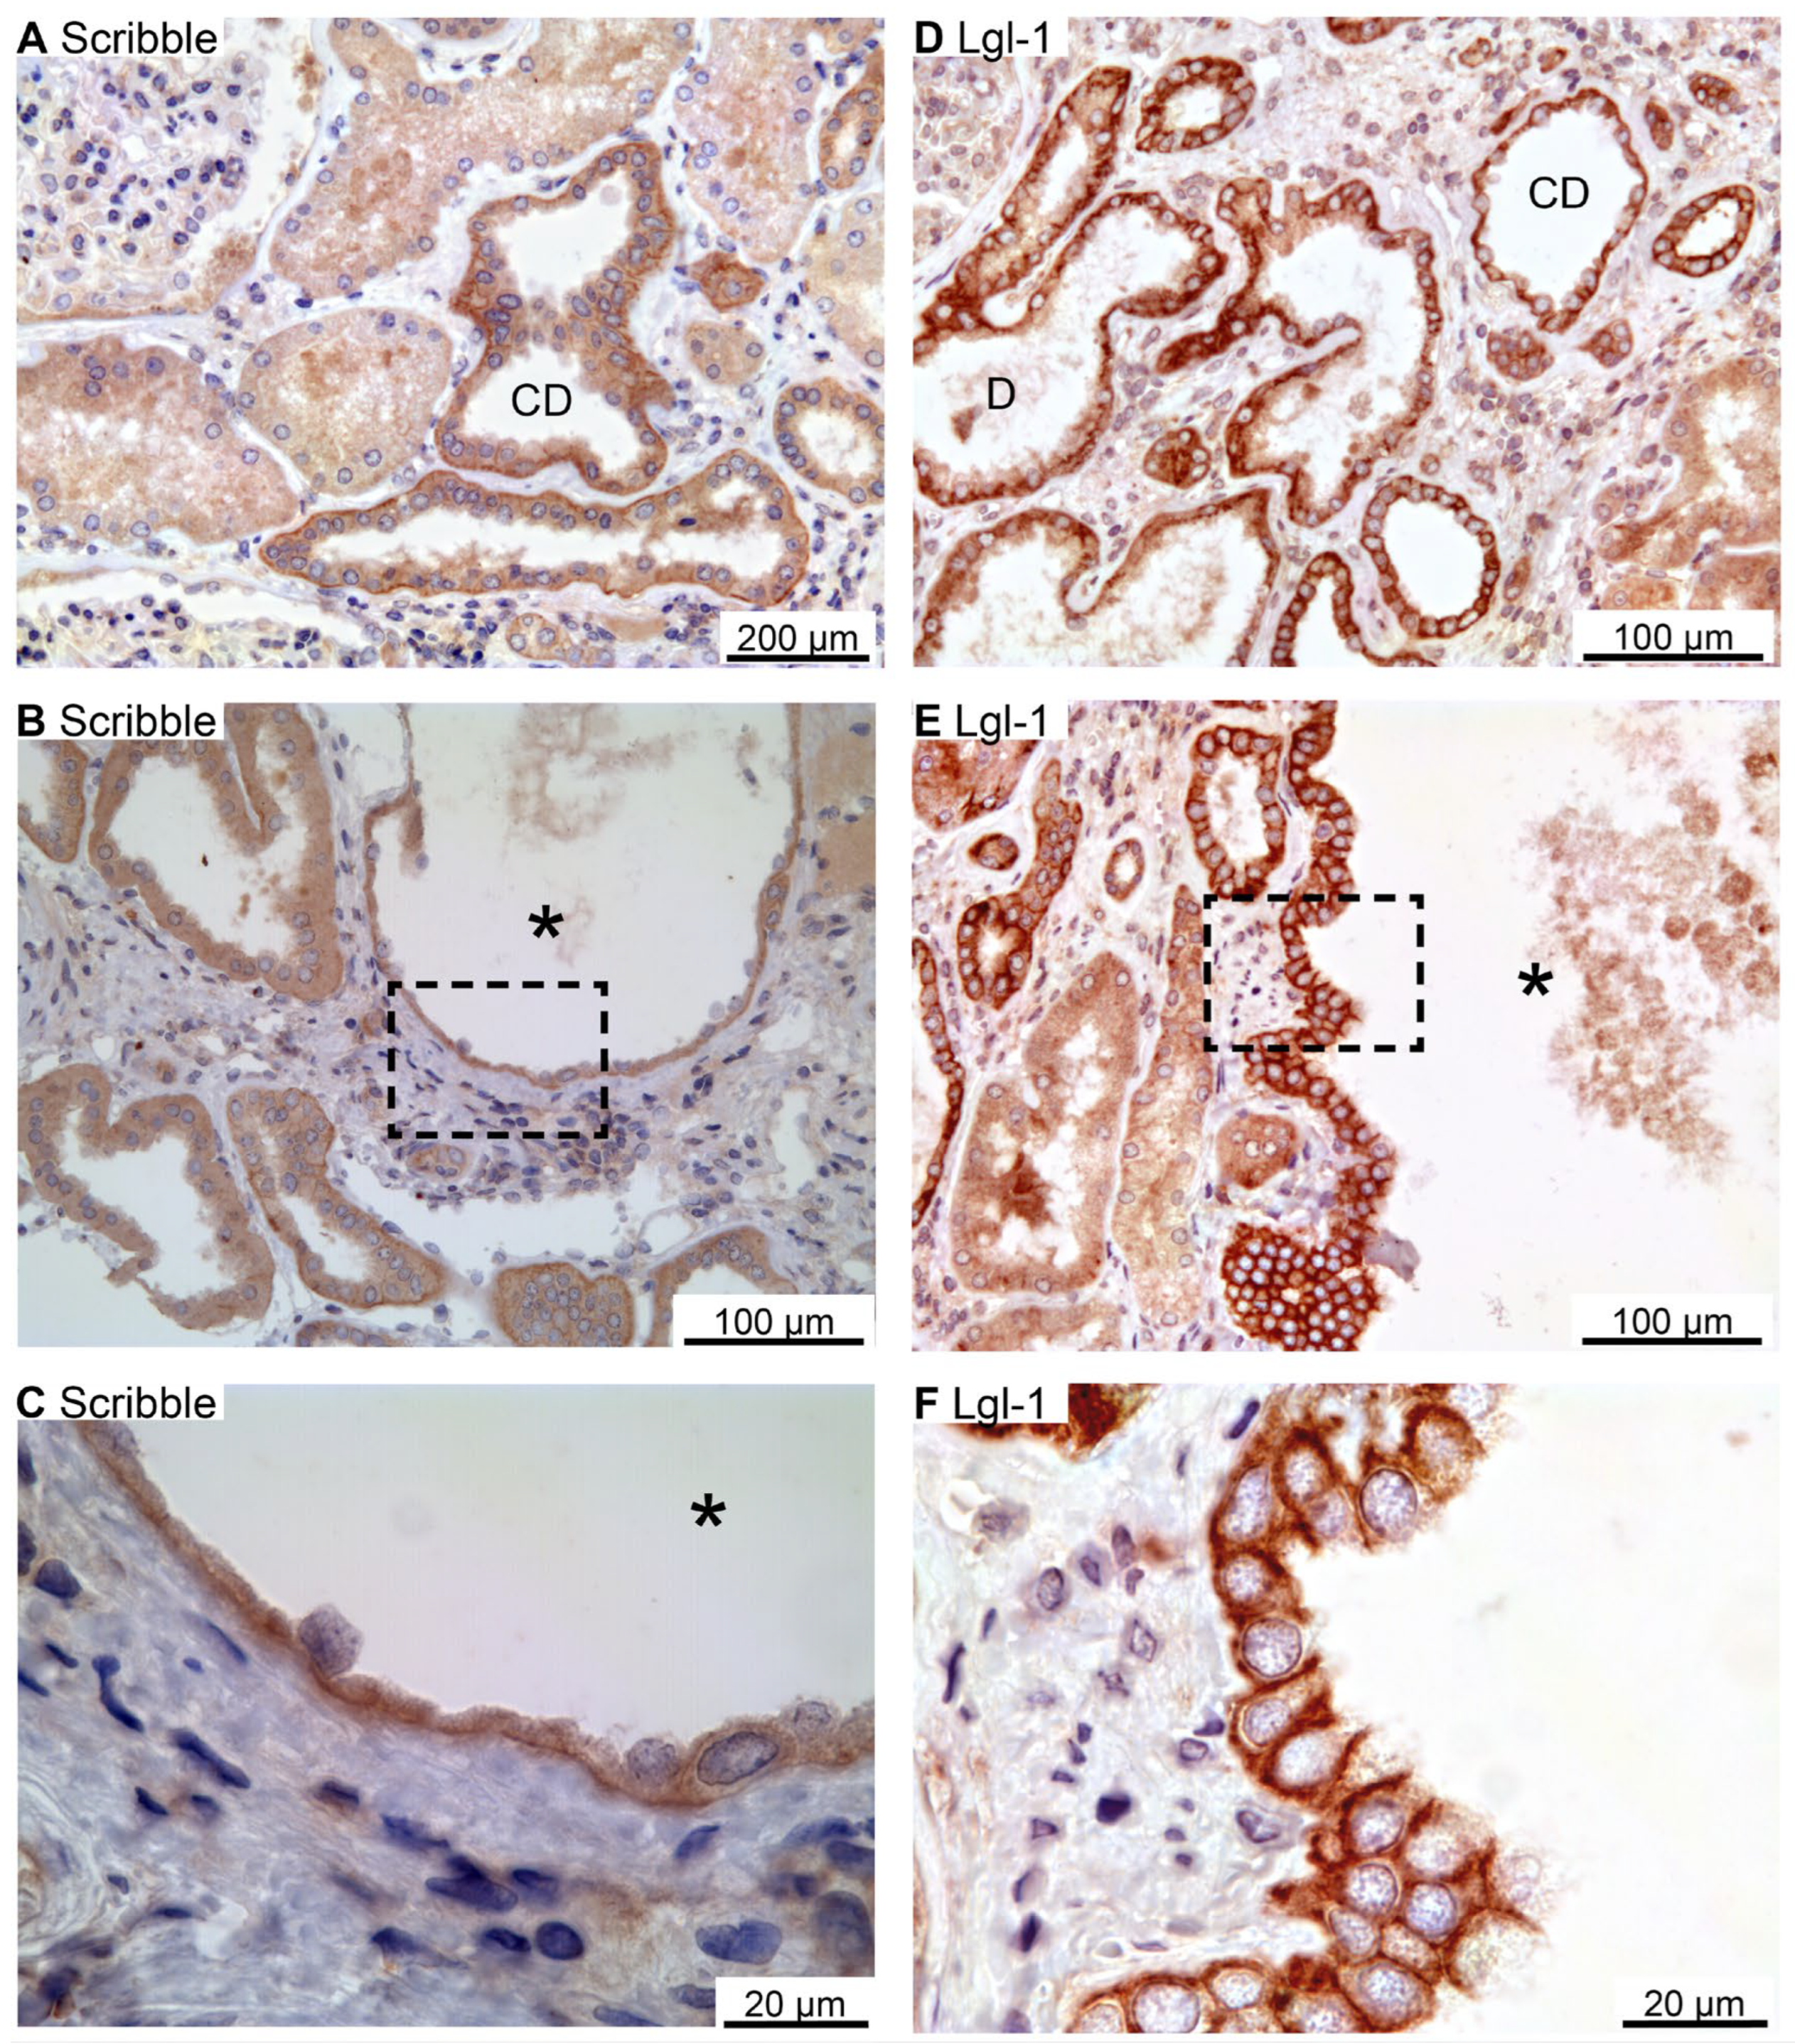
Scribble, Lgl-1, and Dlg-1 belong to the basolateral domain Scribble complex [
27]. Scribble immunoreactivity was observed in the basolateral membrane domain of distal renal tubules and collecting ducts (
Figure 5A).
Figure 5B,C show similar basolateral domain labelling for Scribble in cysts. Immunolabelling for Lgl-1 also yielded a basolateral domain staining pattern in distal renal tubules and collecting ducts (
Figure 5D), which was likewise observed in the immunoreactive cysts (
Figure 5E–G). Tubular Dlg-1 immunolabelling was not obtained. Accordingly, we did not find evidence to support reversal of epithelial cell polarity in human renal cysts. We note that proximal tubules and thick ascending limbs were devoid of staining signal of Scribble and Lgl-1.
2.4. Renal Cysts Origin from More Tubular Segments
Renal cysts can arise from virtually all parts of the renal tubular system [
28,
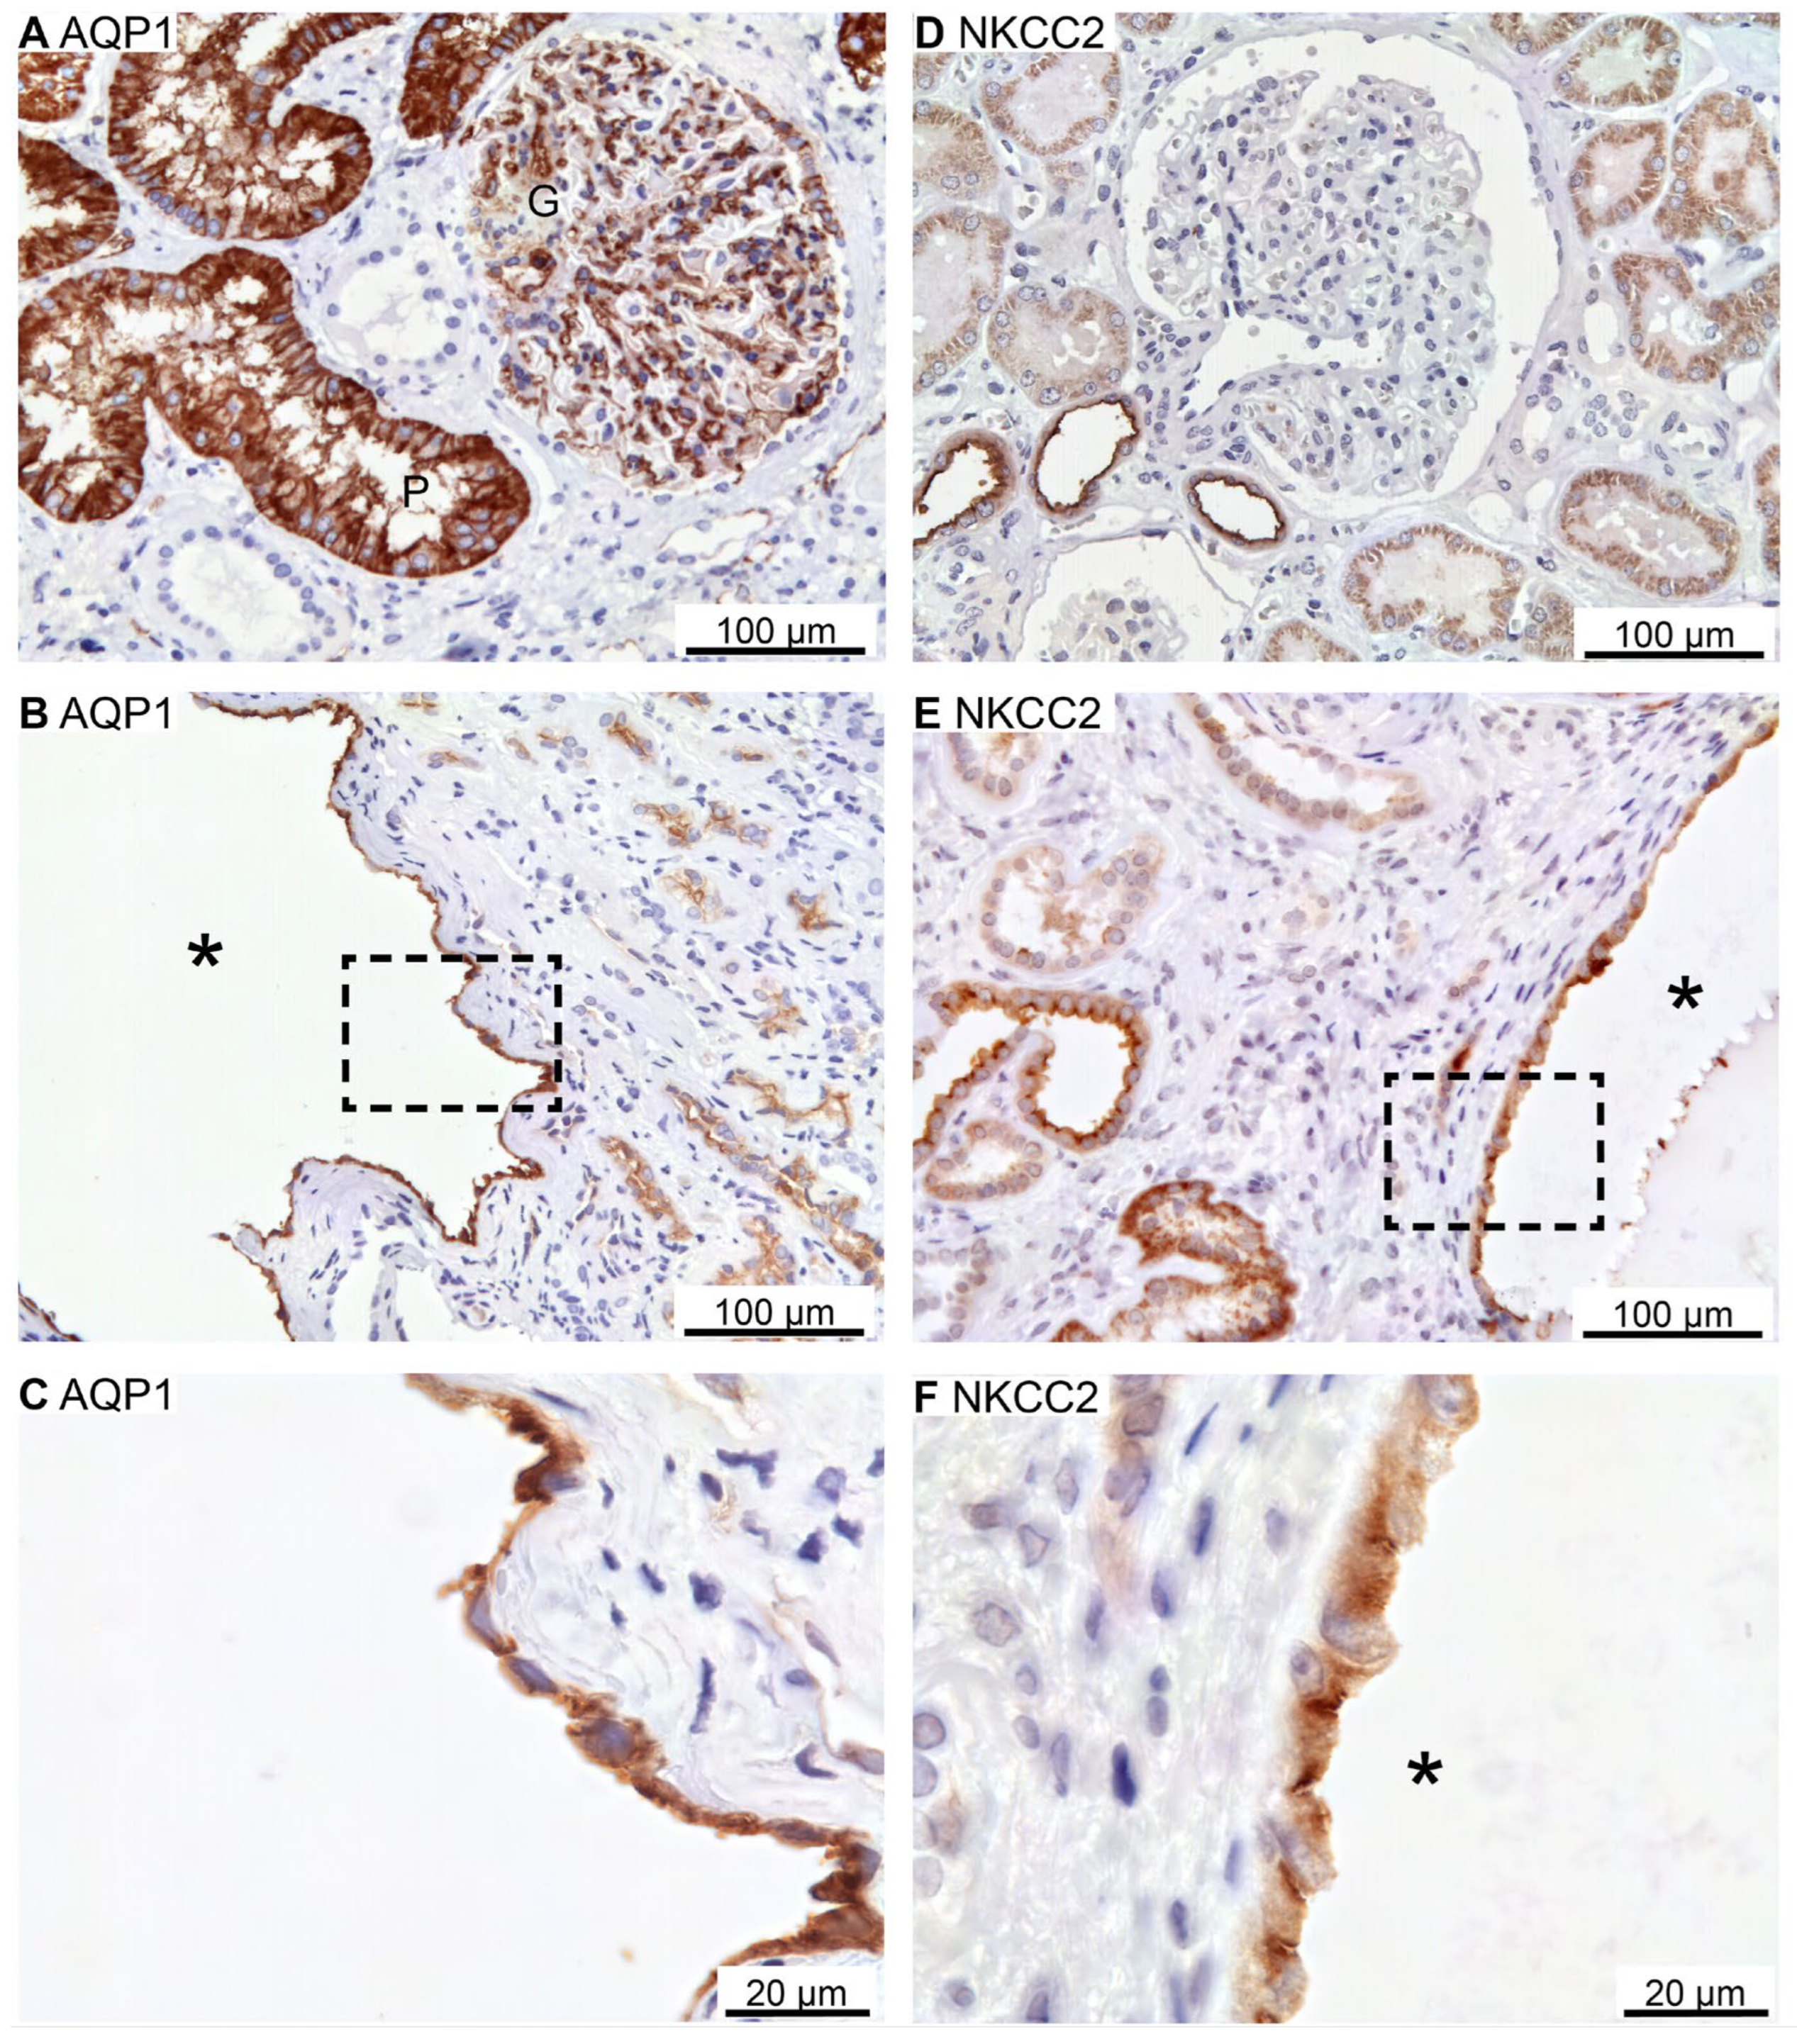
29]. To assess the origin of cysts in the 6 biopsies, antibodies were applied to identify cysts with the proximal tubule marker: the water channel AQP1 (as only renal cortex is present), the thick ascending limb marker: NKCC2, the distal tubule markers: the Na
+ and Cl
- cotransporter, NCC, and parvalbumin, as well as the collecting duct marker: the water channel AQP2. As illustrated in
Figure 6A, AQP1 is expressed in proximal tubules with staining mainly in the basolateral domain. Robust labelling was also observed in capillary endothelia. Cysts were rarely identified with AQP1 immunoreactivity, but positive cysts displayed both apical and basolateral membrane labelling (
Figure 6B,C). NKCC2 immunoreactivity was observed in the apical membrane domain of cortical tubules (
Figure 6D) as well as in NKCC2-immunoreactive cysts (
Figure 6E,F).
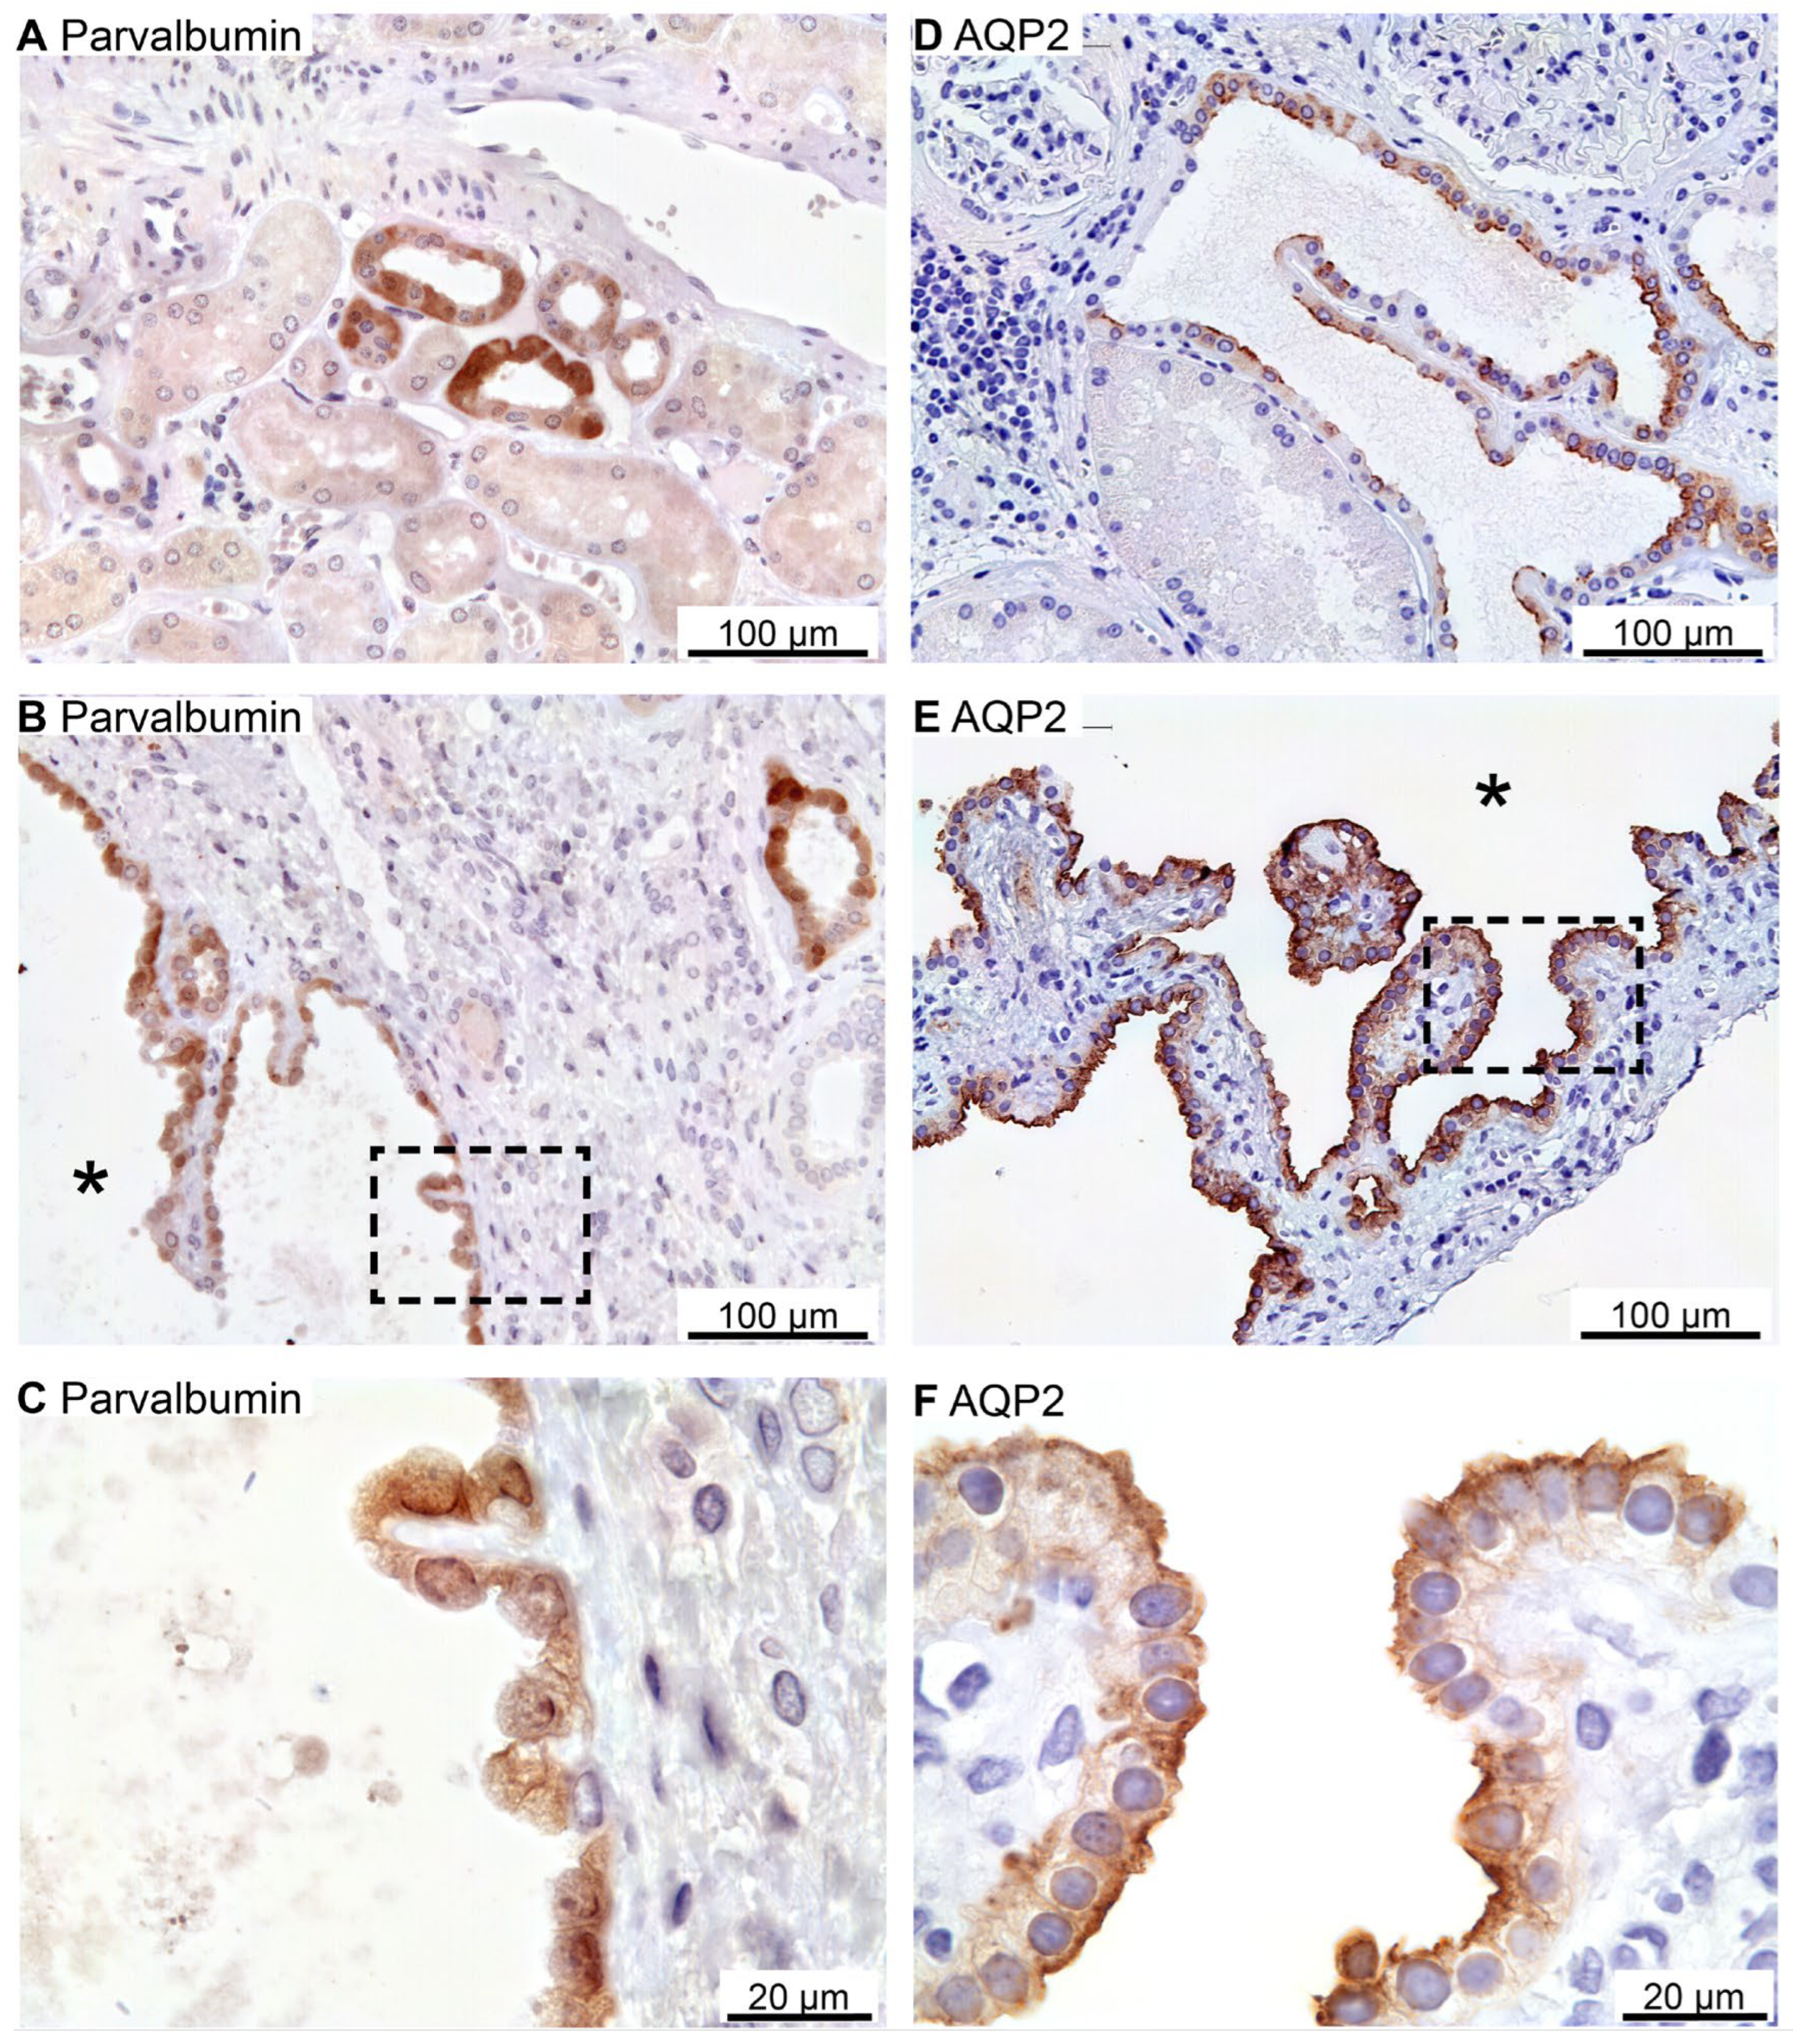
Tubular NCC immunoreactivity was found exclusively at the apical domain of immunoreactive distal renal tubules (not shown). NCC immunoreactivity was observed in rare cysts apparently with staining of the underlying basement membrane and therefore considered unspecific staining (not shown). Parvalbumin was also expressed in distal renal tubules in the expected cytosolic pattern (
Figure 7A). Rare parvalbumin-positive cysts also displayed cytosolic staining (
Figure 7B,C). AQP2 immunoreactivity was observed in collecting ducts with the main reaction corresponding to the apical membrane domain (
Figure 7D). Renal cysts also displayed apical membrane domain labelling for AQP2 (
Figure 7E,F). Thus, except for flat cyst epithelia, renal cysts expressed markers for at least one of the markers for proximal tubules, thick ascending limbs, distal convoluted tubules or collecting ducts. Double fluorescence immunolabelling did not reveal cysts that were positive for more than one tubule marker (not shown).
2.5. Preserved Cell Polarity in Cysts Derived from Different Segments
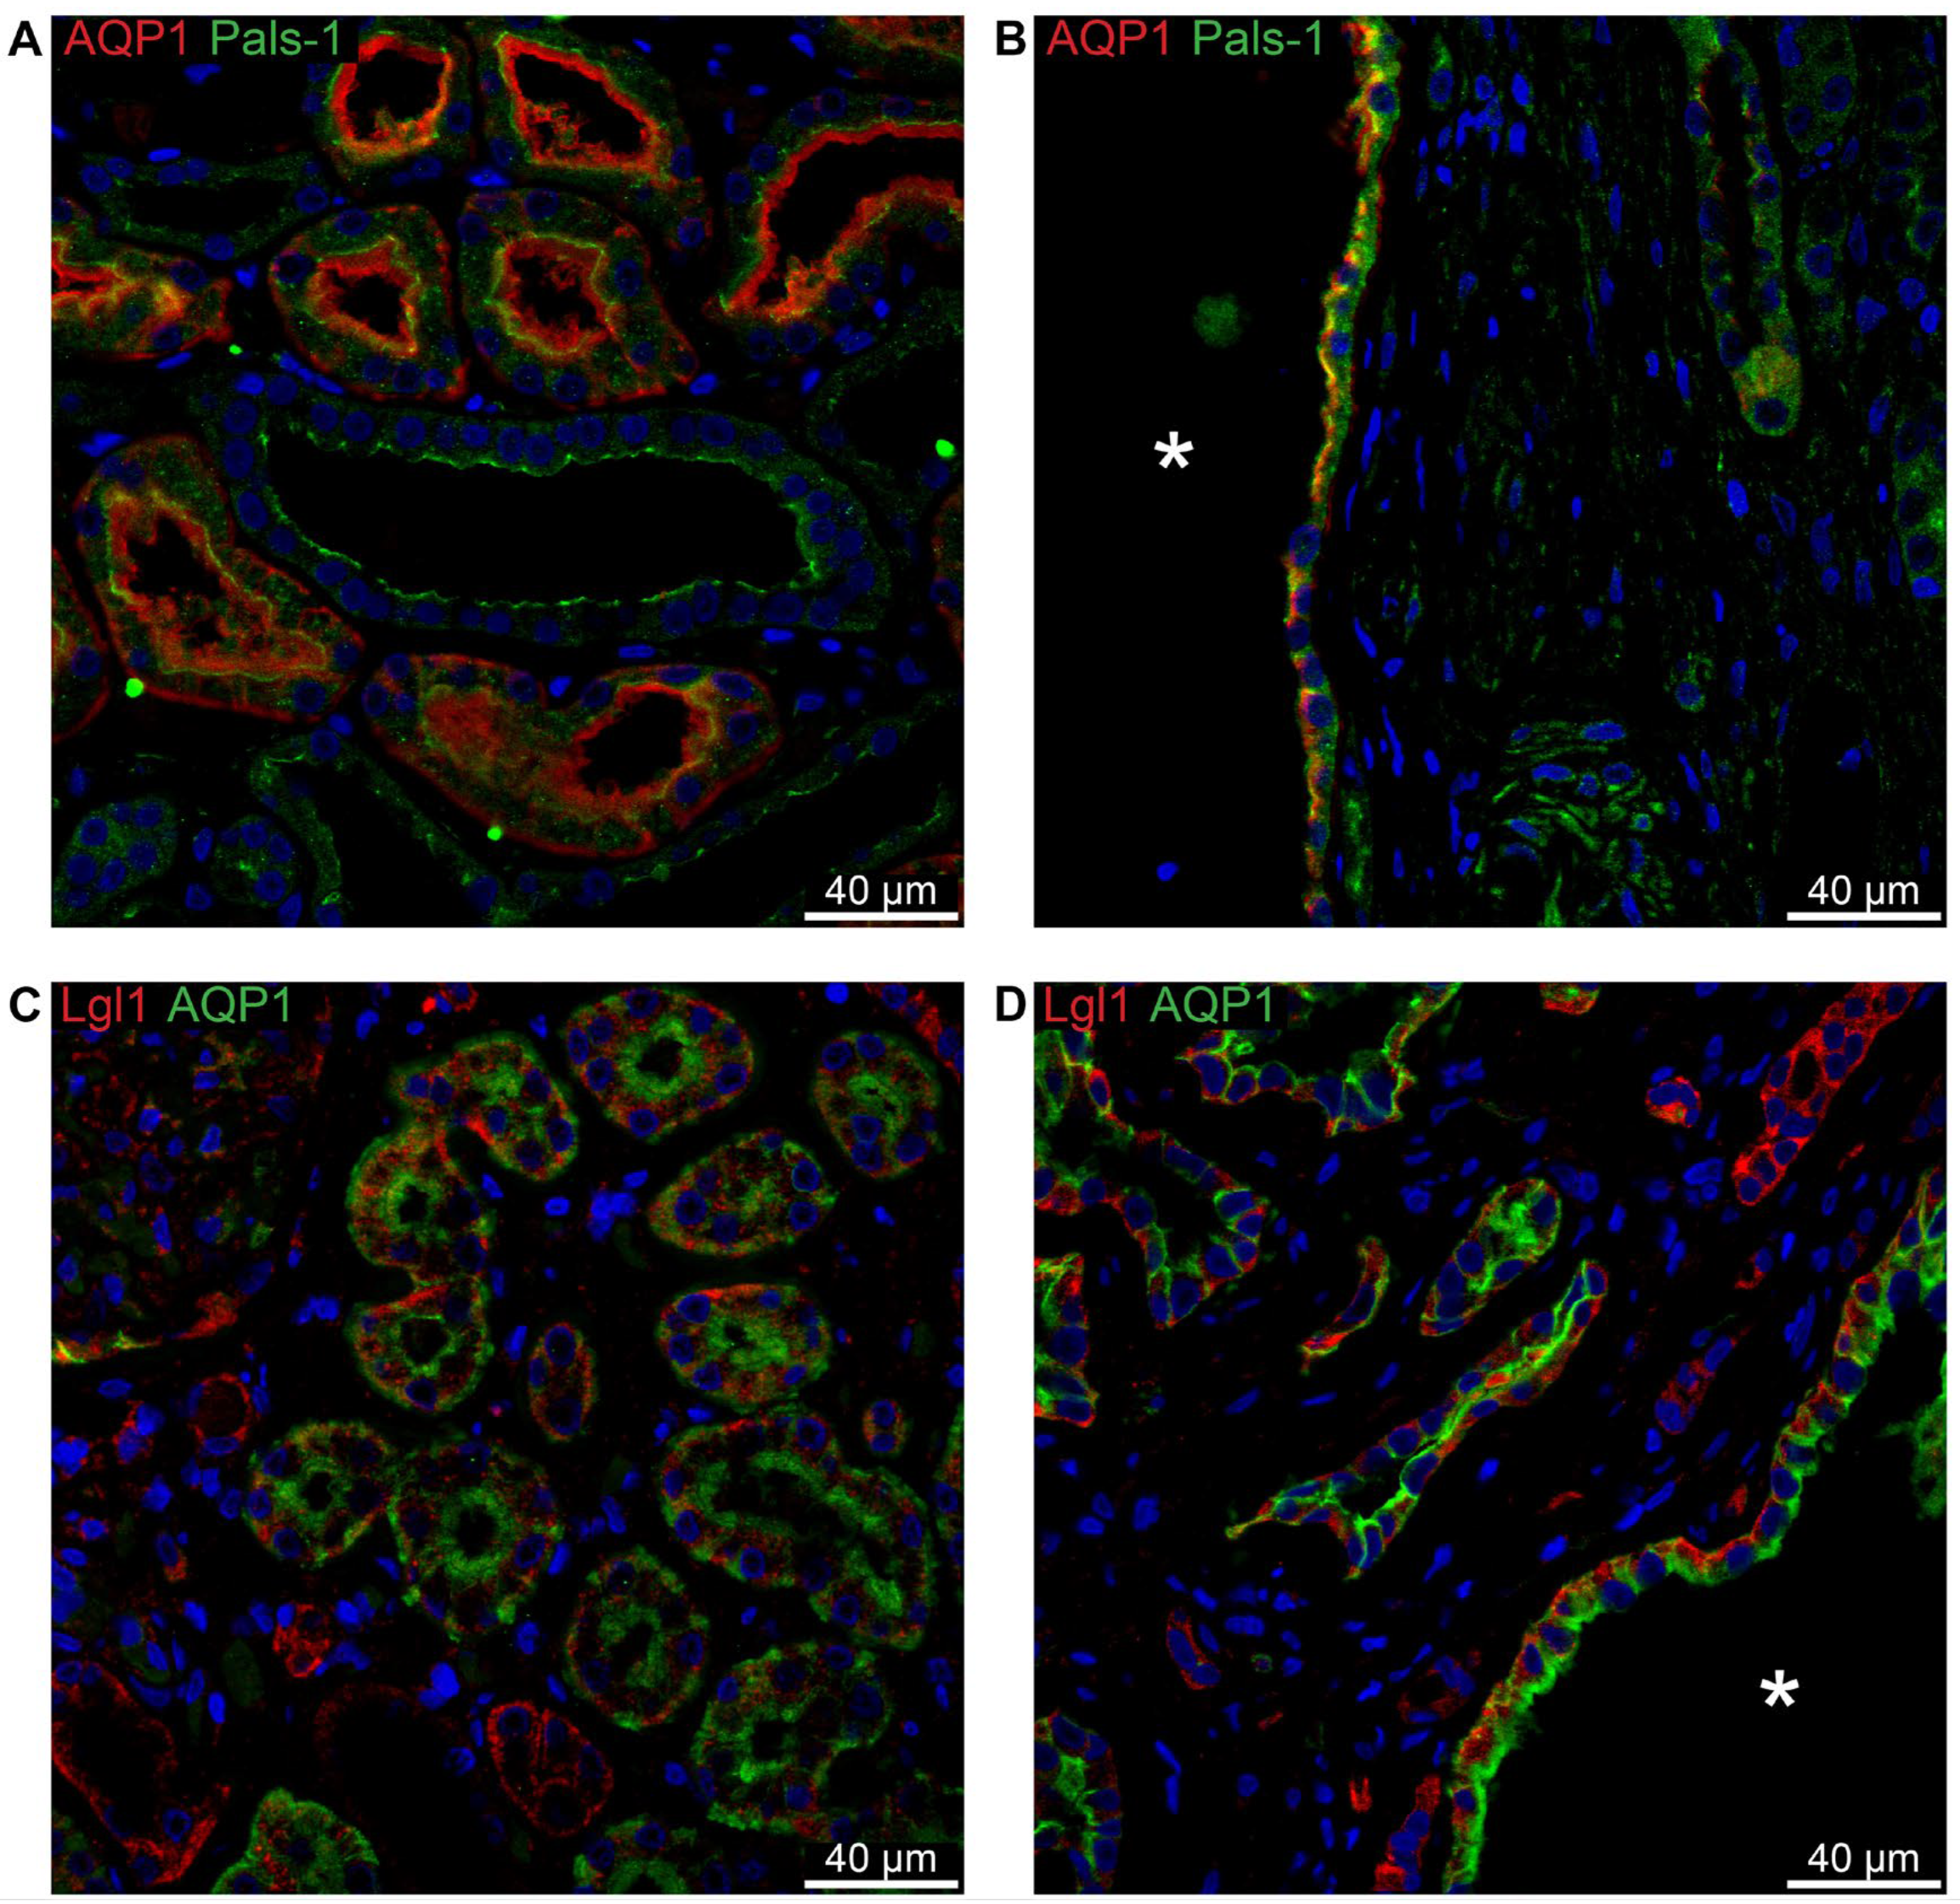
To determine whether cell polarity was conserved in cysts of all origins, double immunofluorescent labelling was employed.
Figure 8A shows the normal apical localization of Crumbs complex component Pals-1 in proximal tubules stained for AQP1. The same staining pattern is evident in the cyst in
Figure 8B. Lgl-1 of the Scribble complex is shown in
Figure 8C to be basolaterally localized in normal human proximal tubule. This pattern is reproduced in cysts positive for AQP1 (
Figure 8D).
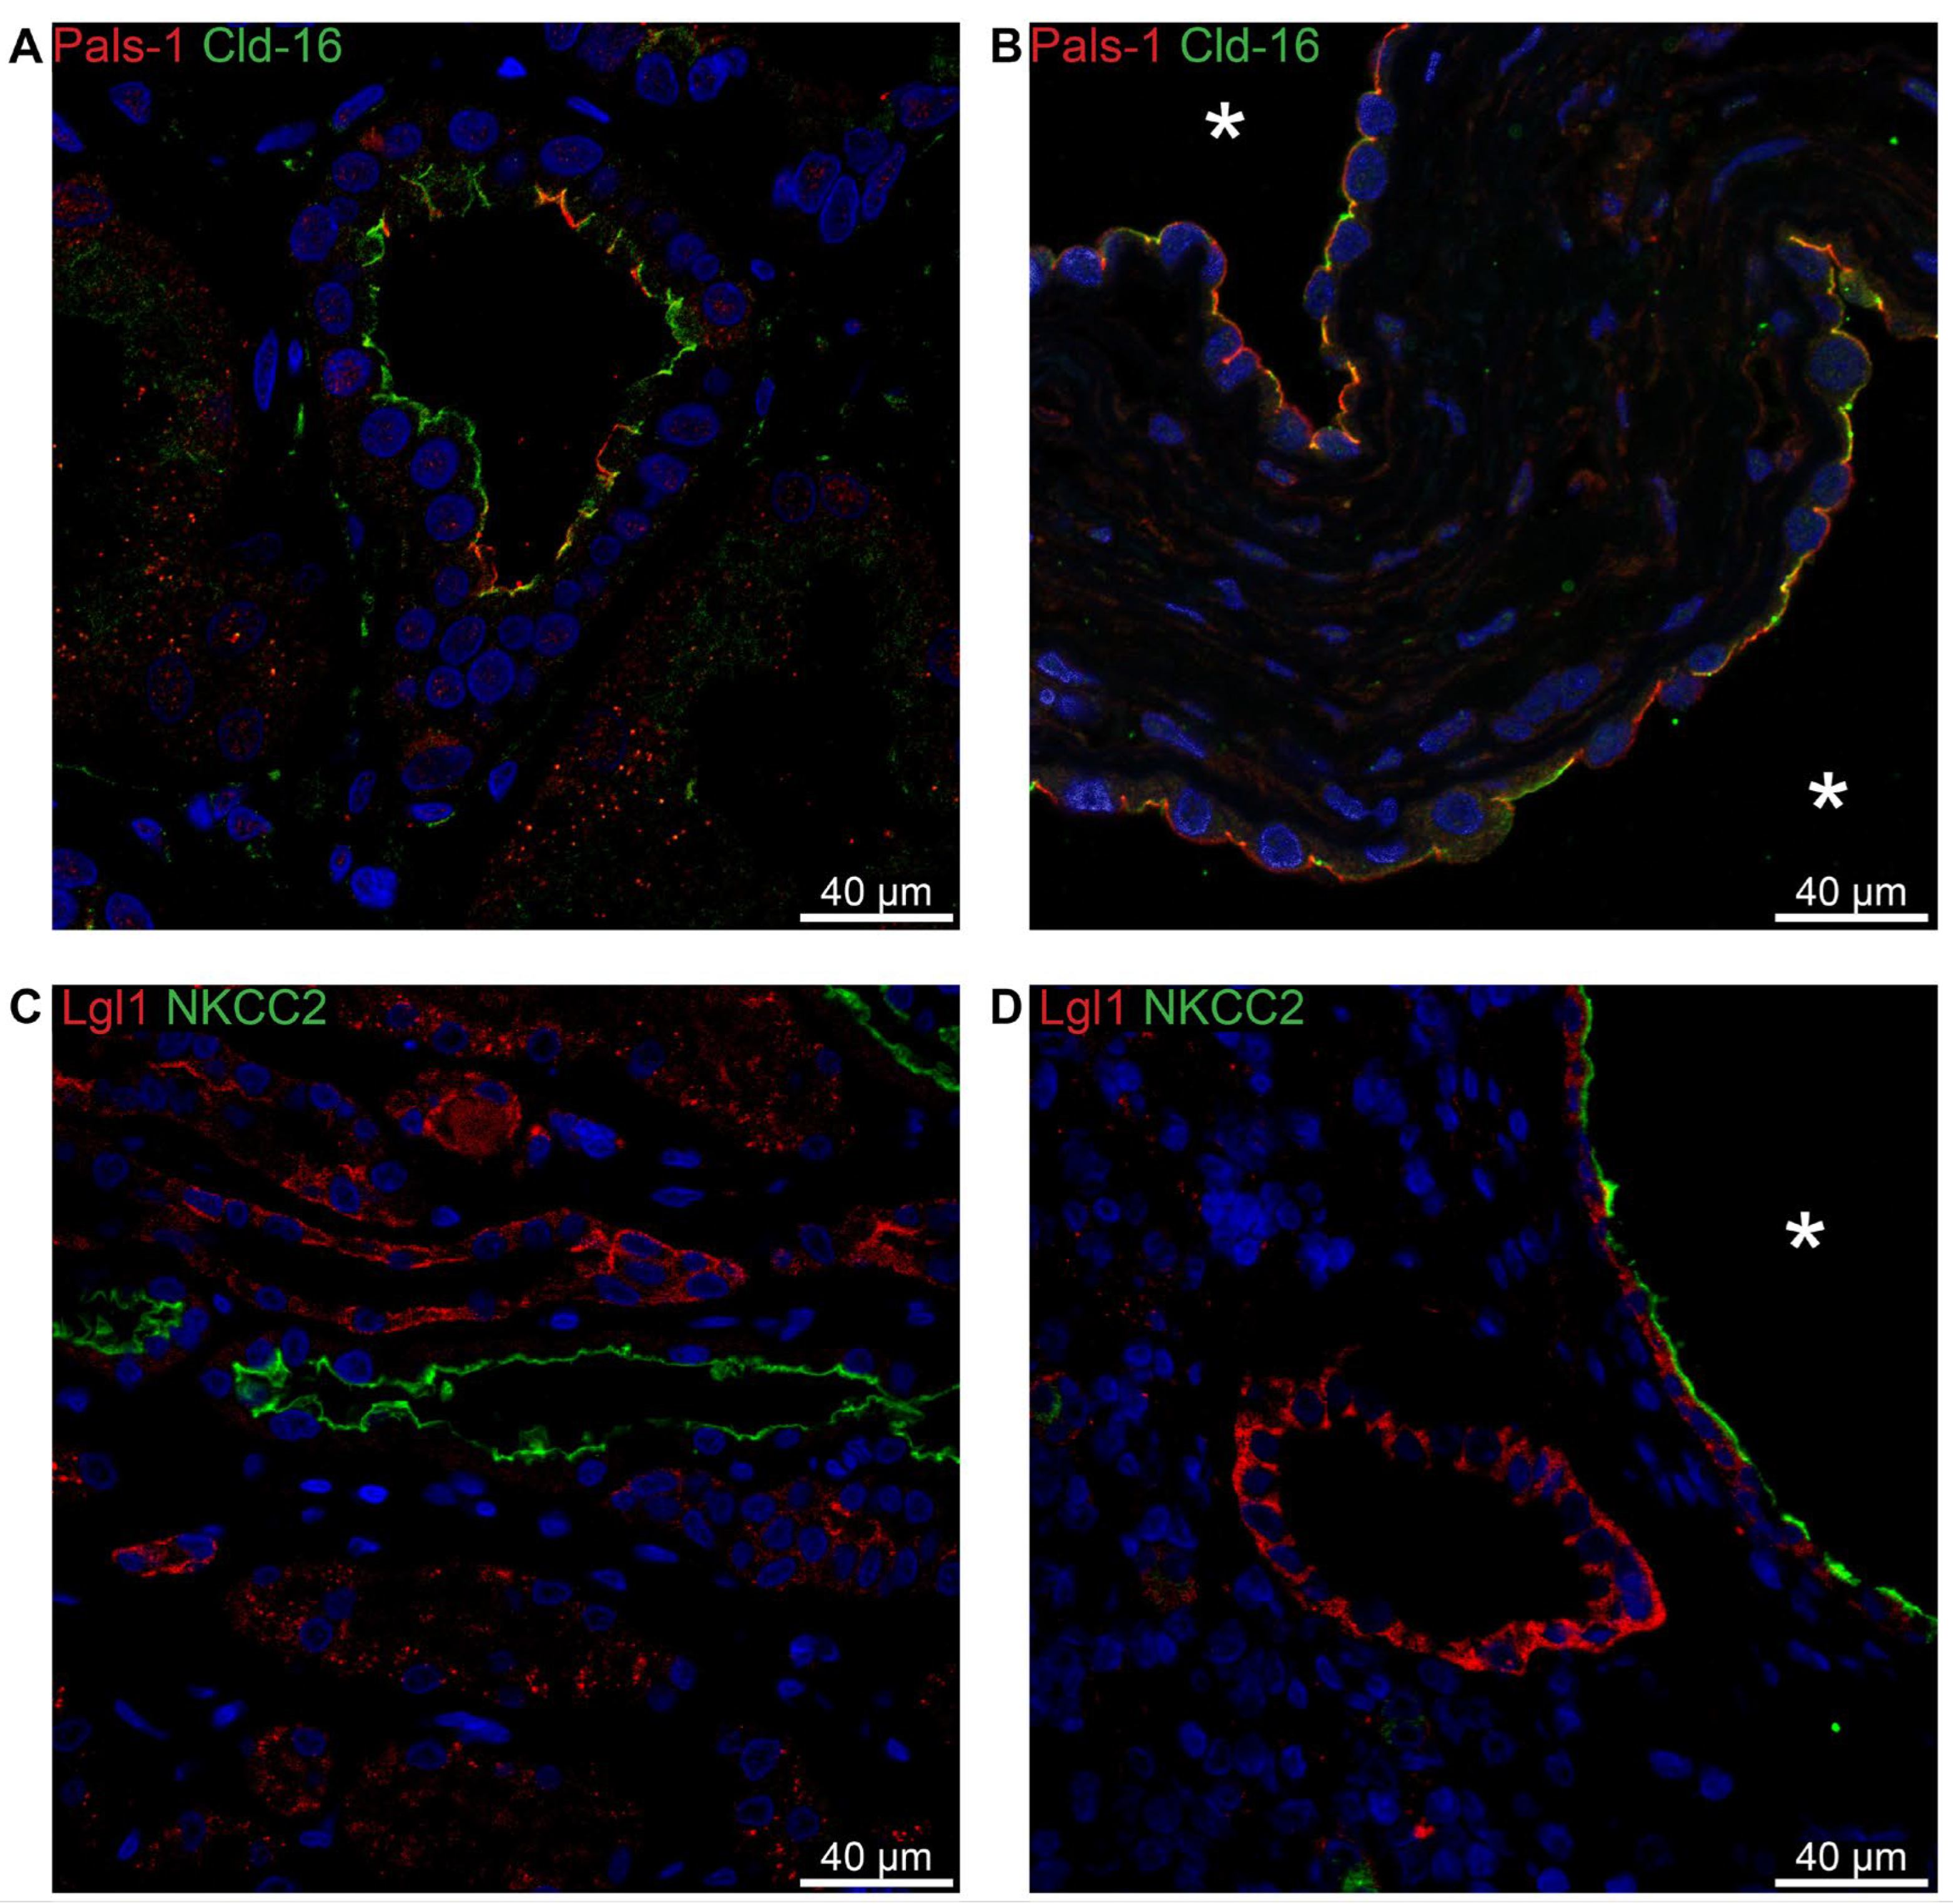
Due to difficulties in obtaining satisfactory double-labelling, we employed another marker for the thick ascending limb, claudin-16. In normal human thick ascending limb, the Crumbs complex component Pals-1 is apically immunolocalized (
Figure 9A). The same localization is apparent in the Claudin-16-positive cysts (
Figure 9B). Lgl-1 localizes to the basolateral domain in both normal human tubules and in the TAL-derived cysts (
Figure 9C,D). We note that there is no signal for Lgl-1 in the normal TAL (
Figure 9C), while a clear basolateral signal is evident in the NKCC2-positive cyst (
Figure 9D).
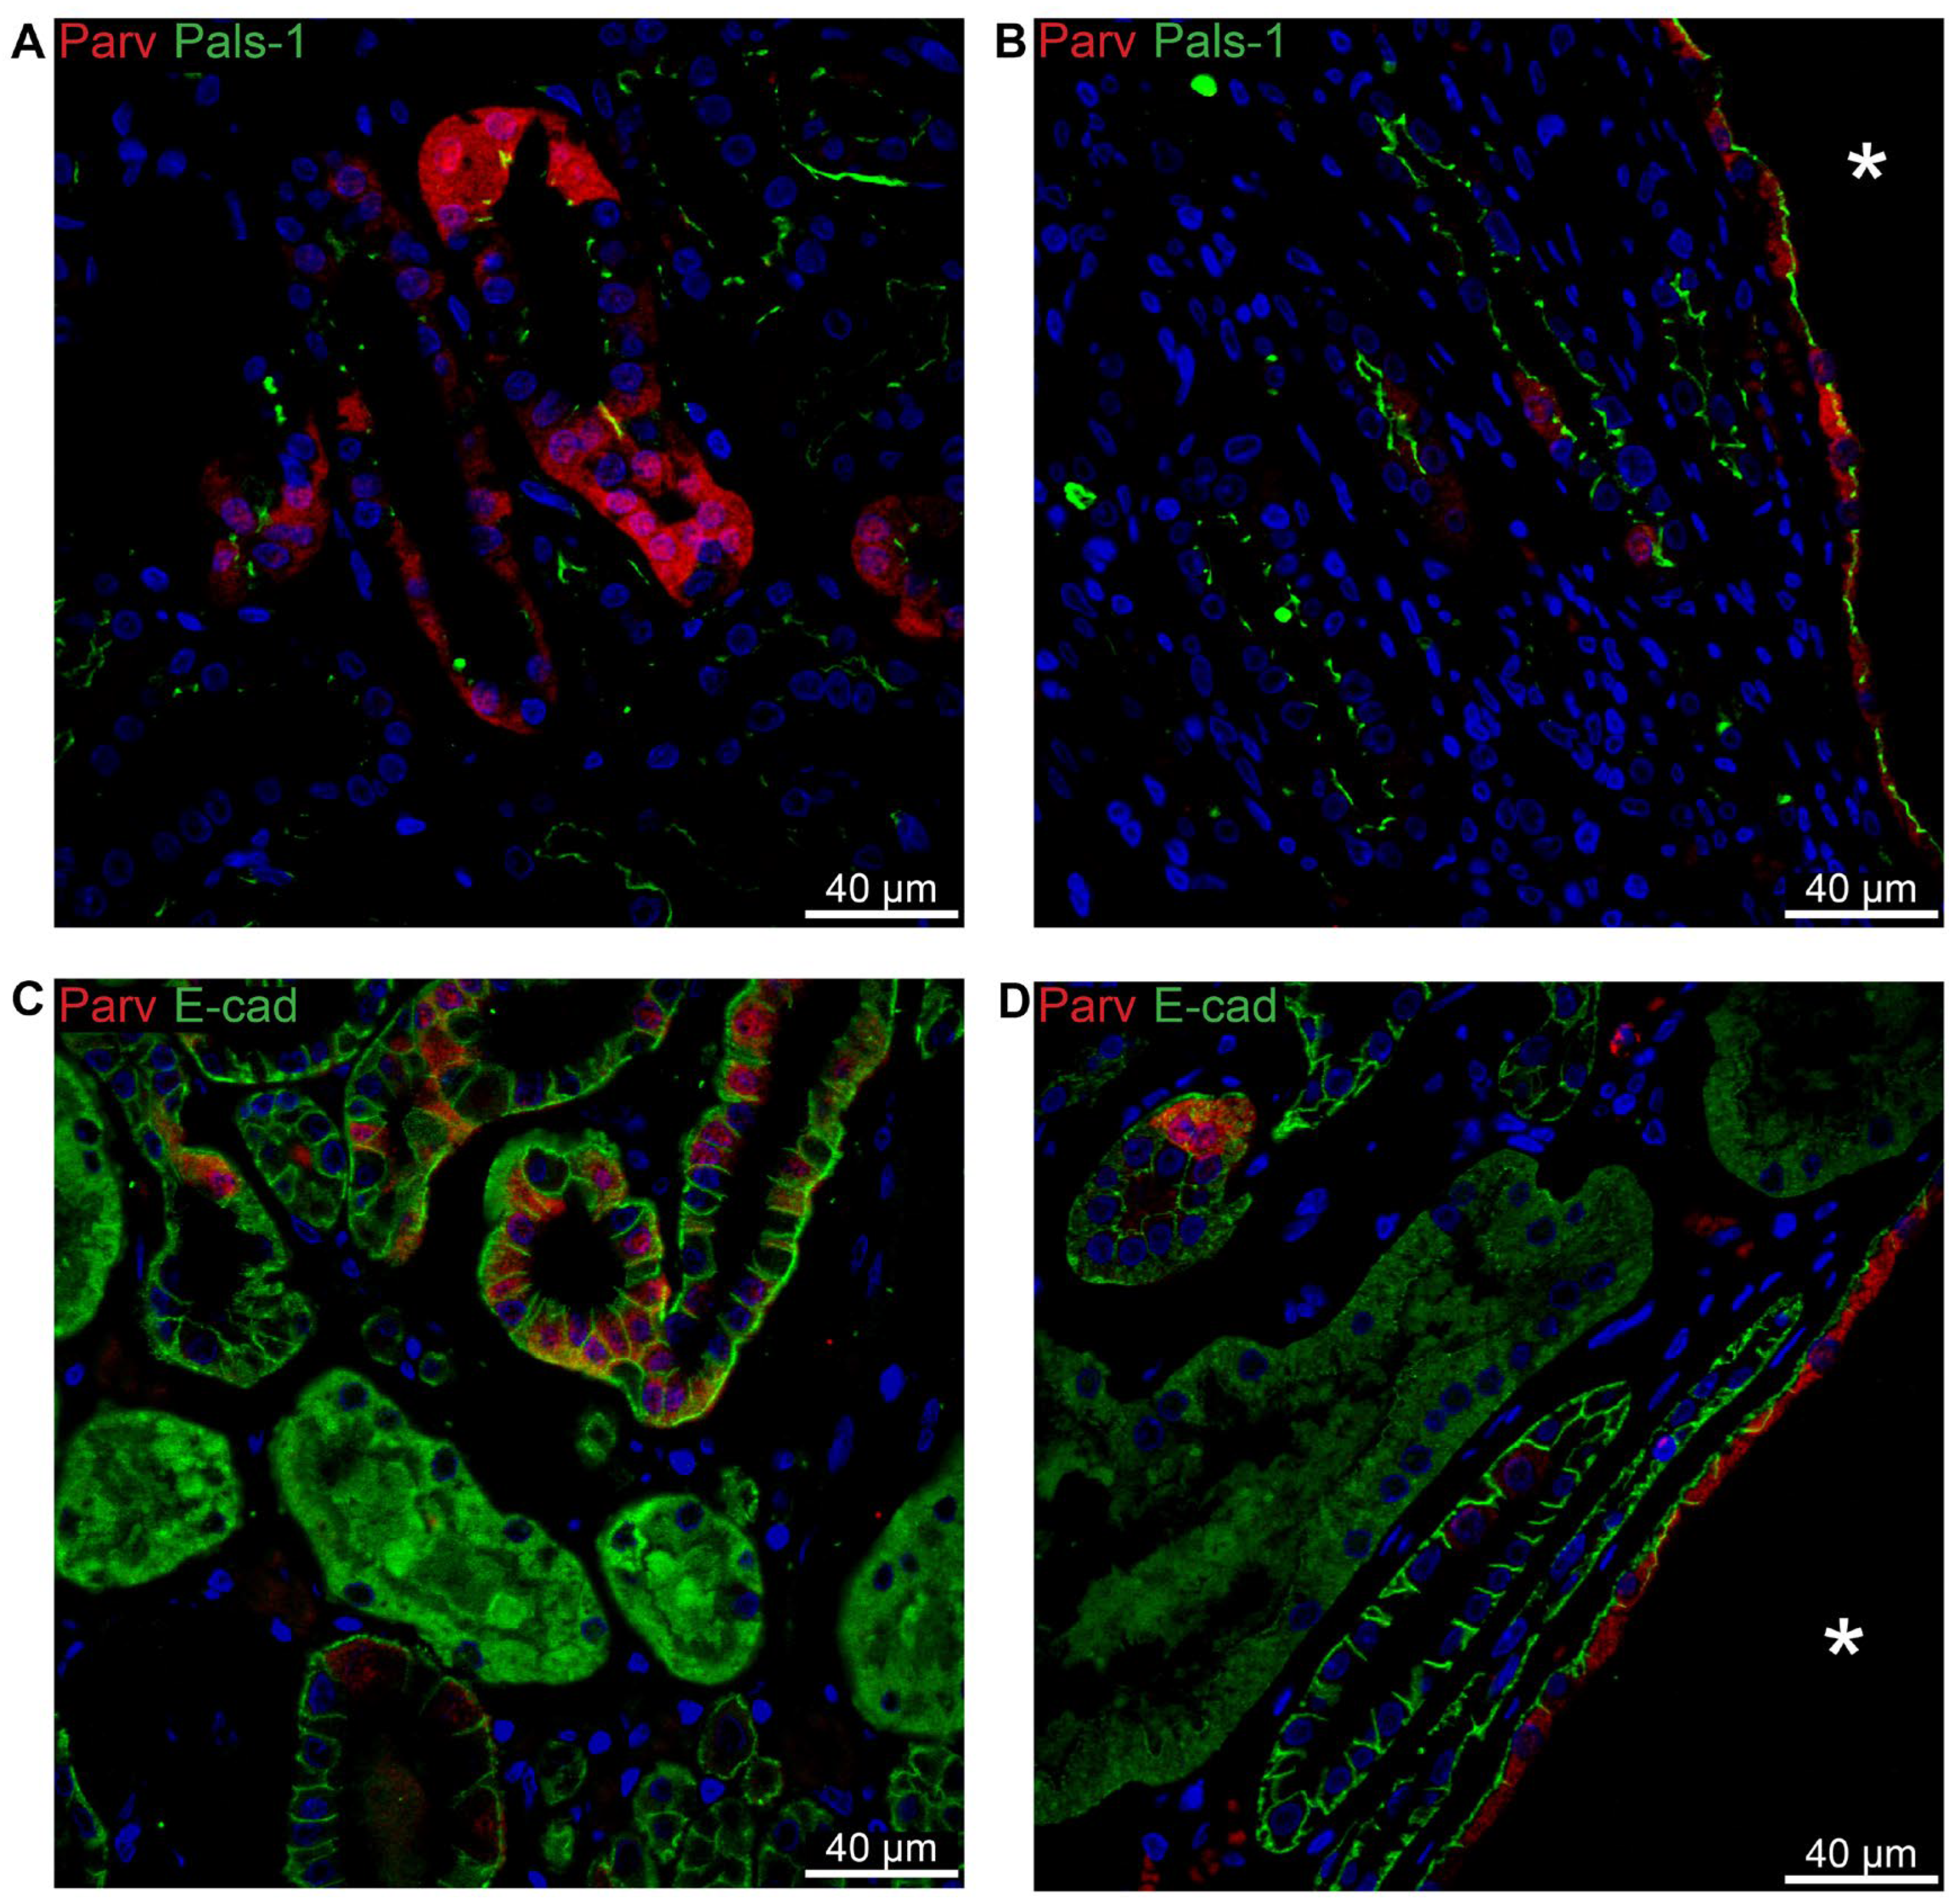
In the normal human distal tubule, a mosaic pattern of parvalbumin is observed alongside apical localization of Crumbs complex component Pals-1 (
Figure 10A). A similar pattern is found in cysts assumed to originate from the distal tubule (
Figure 10B). In normal human distal tubule, staining for E-cadherin reveals a basolateral pattern (
Figure 10C). This same pattern is seen in parvalbumin-positive cysts (
Figure 10D).
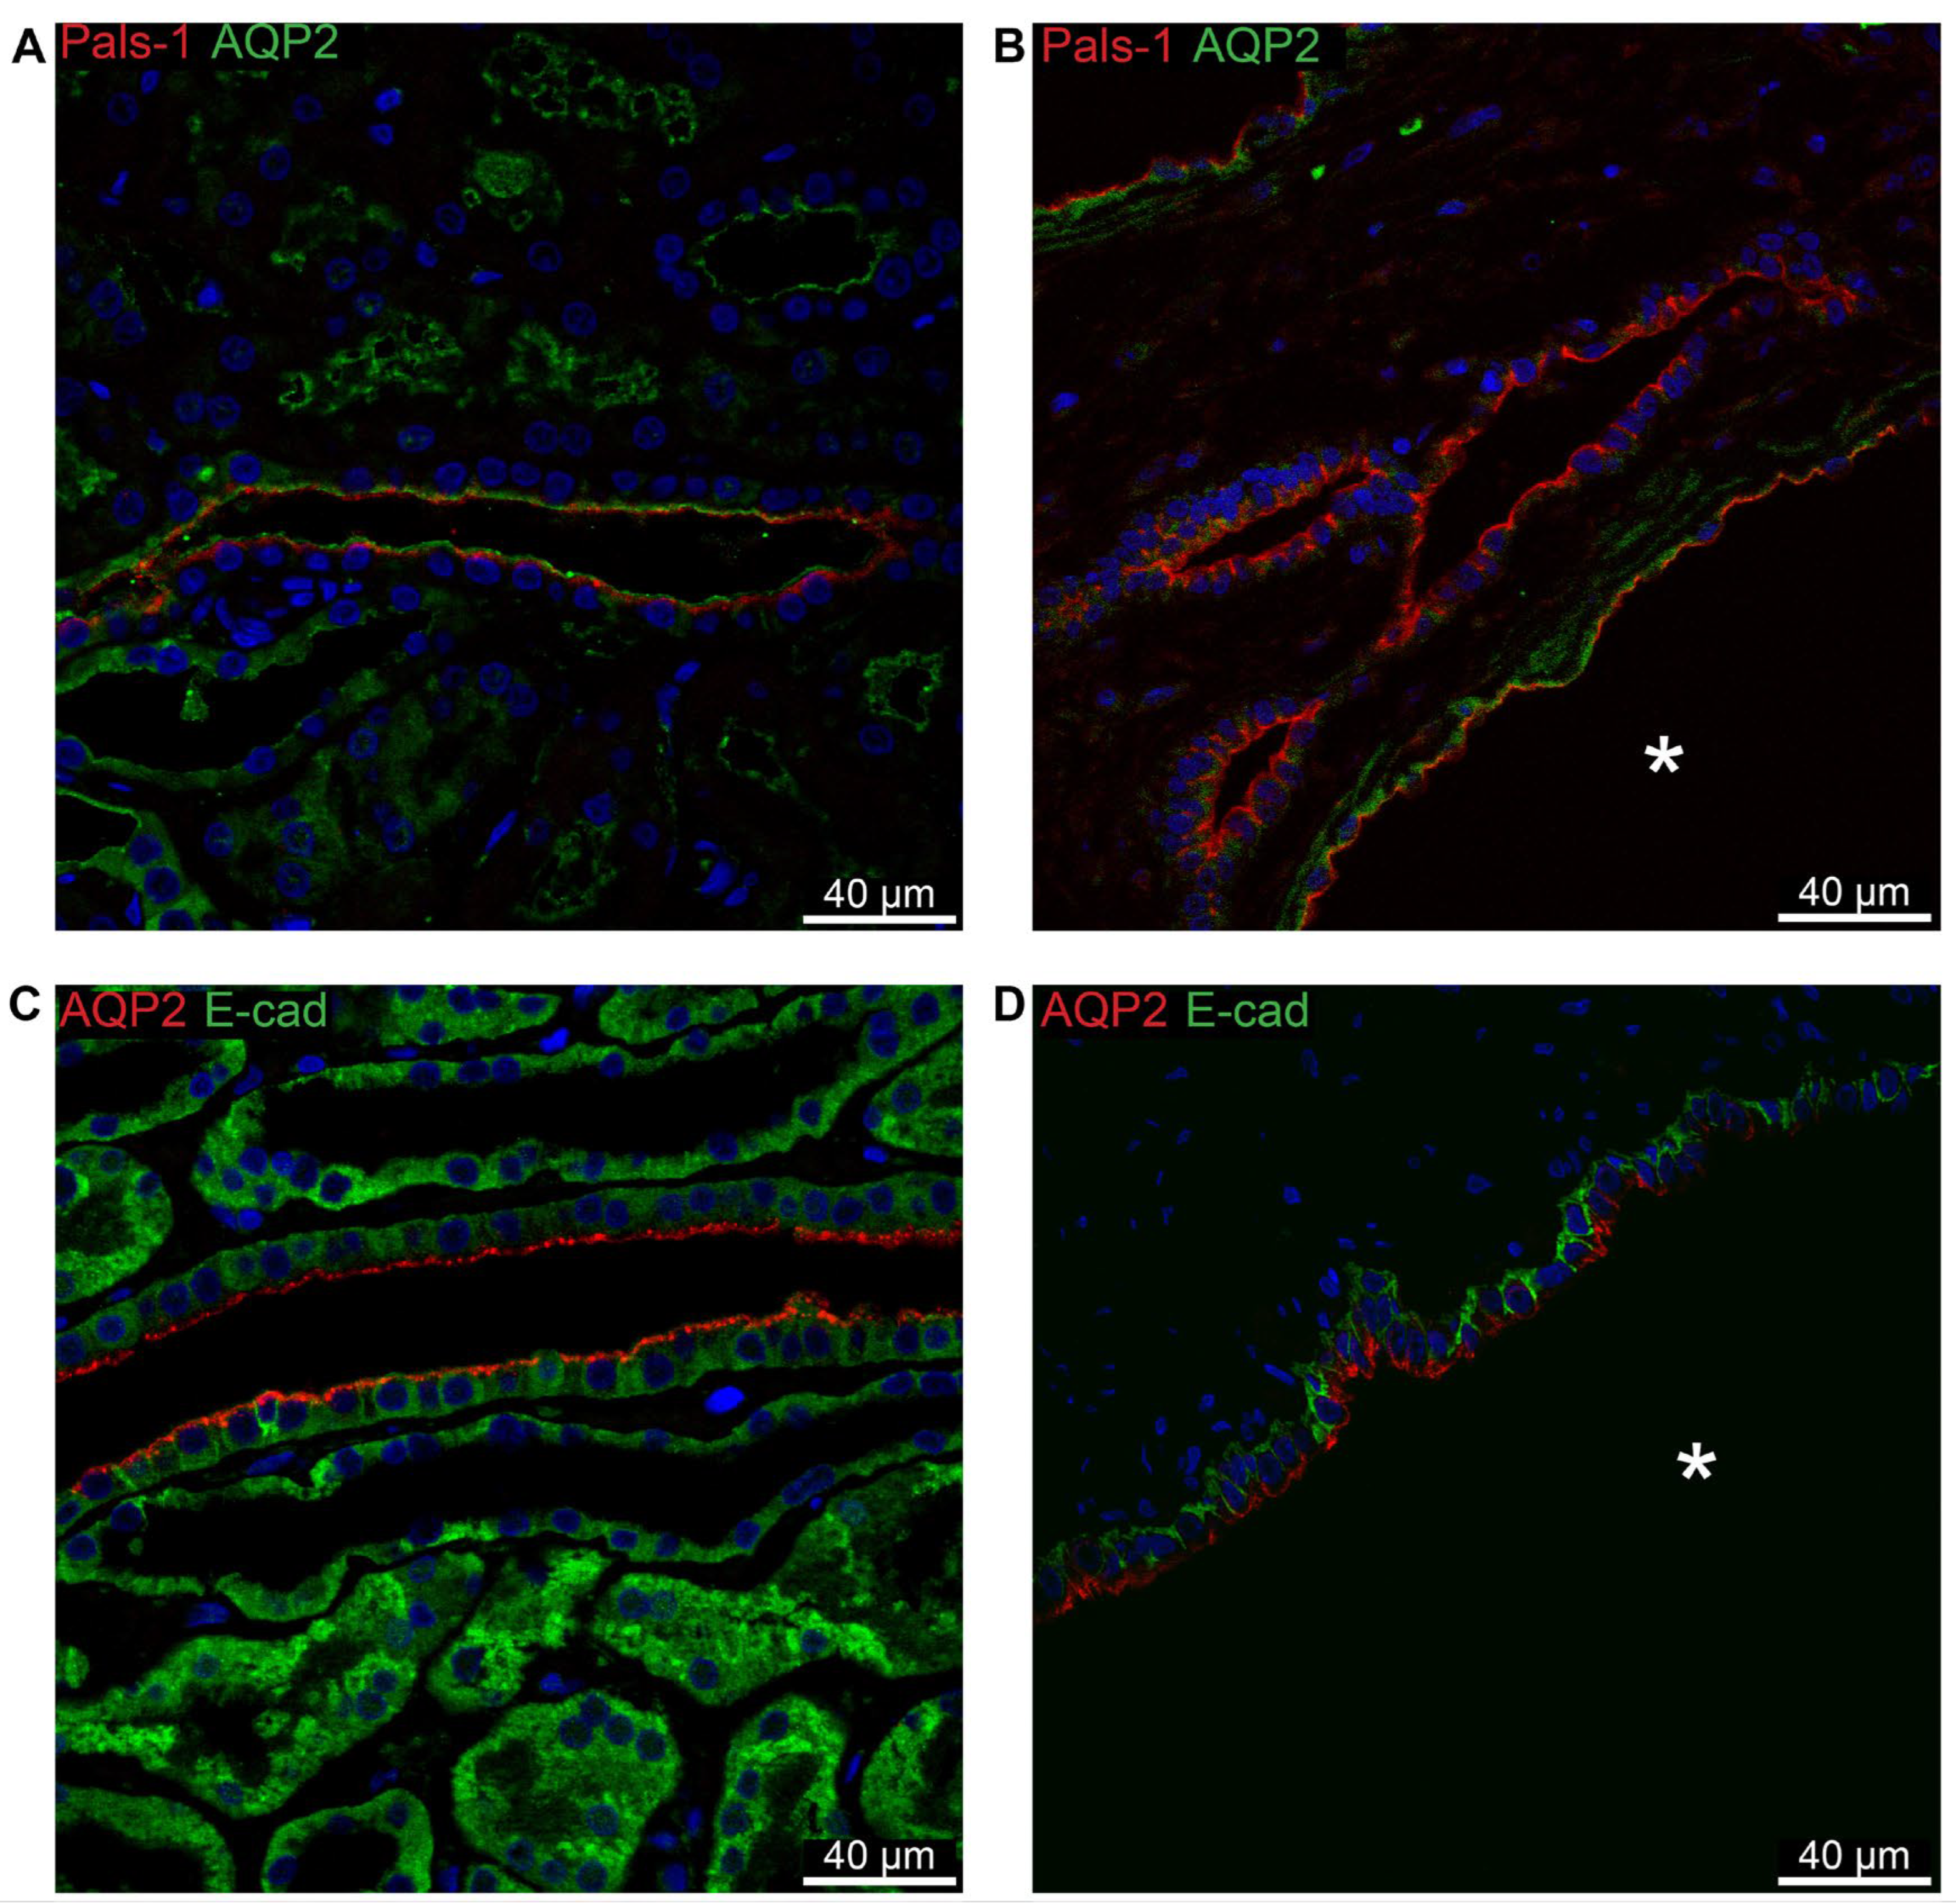
With AQP2 acting as a marker for the collecting duct, the expected apical localization of Pals-1 is confirmed in this segment in normal human tissue (
Figure 11A) as well as in AQP2-positive cysts (
Figure 11B).
Figure 11C shows the basolateral localization of E-cadherin in normal human collecting duct. This pattern is repeated in cysts derived from this segment (
Figure 11D).
3. Discussion
It is widely accepted that cysts develop from virtually any segment of the nephron as well as the collecting duct, however, most often from the distal parts, which is consistent with our finding that AQP1-positive cysts were rare [
29]. According to the current paradigm, most cysts will detach from their tubule of origin and fluid will accumulate in the cyst lumen [
21]. This accumulation is attributed to secretion of ions from the cyst epithelium with concurrent water transport to the lumen. Some researchers have found an apical mislocation of the Na, K-ATPase in cyst lining epithelia, which was suggested to be responsible for Na
+-secretion with resultant water accumulation in the cysts [
3,
22,
30]. Other groups report no such apical localization of the Na, K-ATPase in neither human PKD kidneys nor in animal models [
31,
32,
33,
34]. The results of the present study are in accordance with the latter in that we find no apical staining for Na, K-ATPase α1 subunit in normal tubules or cyst epithelia. Thus, our findings suggest a different secretion mechanism. It has been proposed that the key secreted ion is chloride instead of sodium – the argument being that dysfunctional polycystin 2 (PC2) leads to lower [Ca
2+]
i. This, in turn, presumably leads to a rise in intracellular cAMP through lacking inhibition of calcium inhibited adenylate cyclase isoforms 5 and 6 (AC-5/6) [
35,
36]. The cAMP then stimulates the activity of the chloride channel CFTR, through which chloride will be transported to the cyst lumen followed by Na
+ and water paracellularly [
37,
38]. Our findings do not exclude this secretion of Cl
- but argue against the proposed active secretion of Na
+. This cAMP-dependent secretion is, however, confined to the segments distal to the loop of Henle. Thus, the accumulation of fluid in cysts derived from proximal tubule or TAL remains elusive.
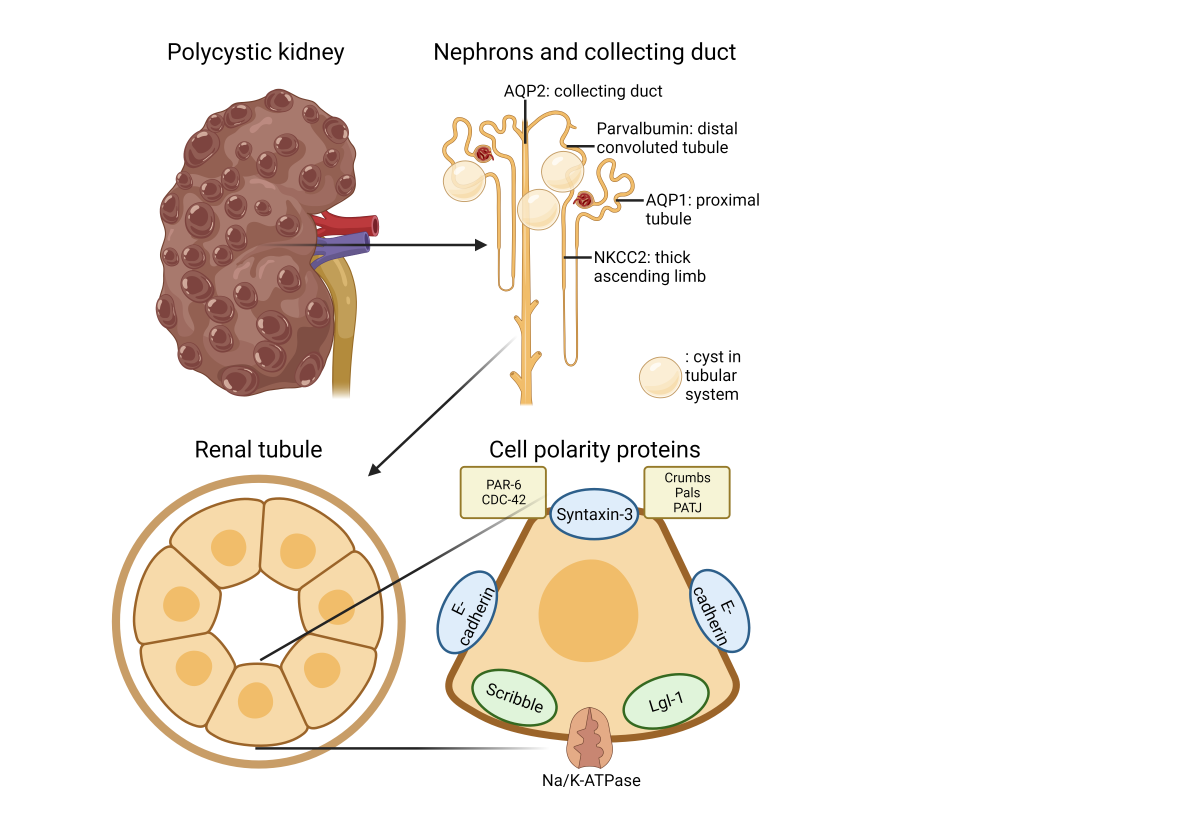
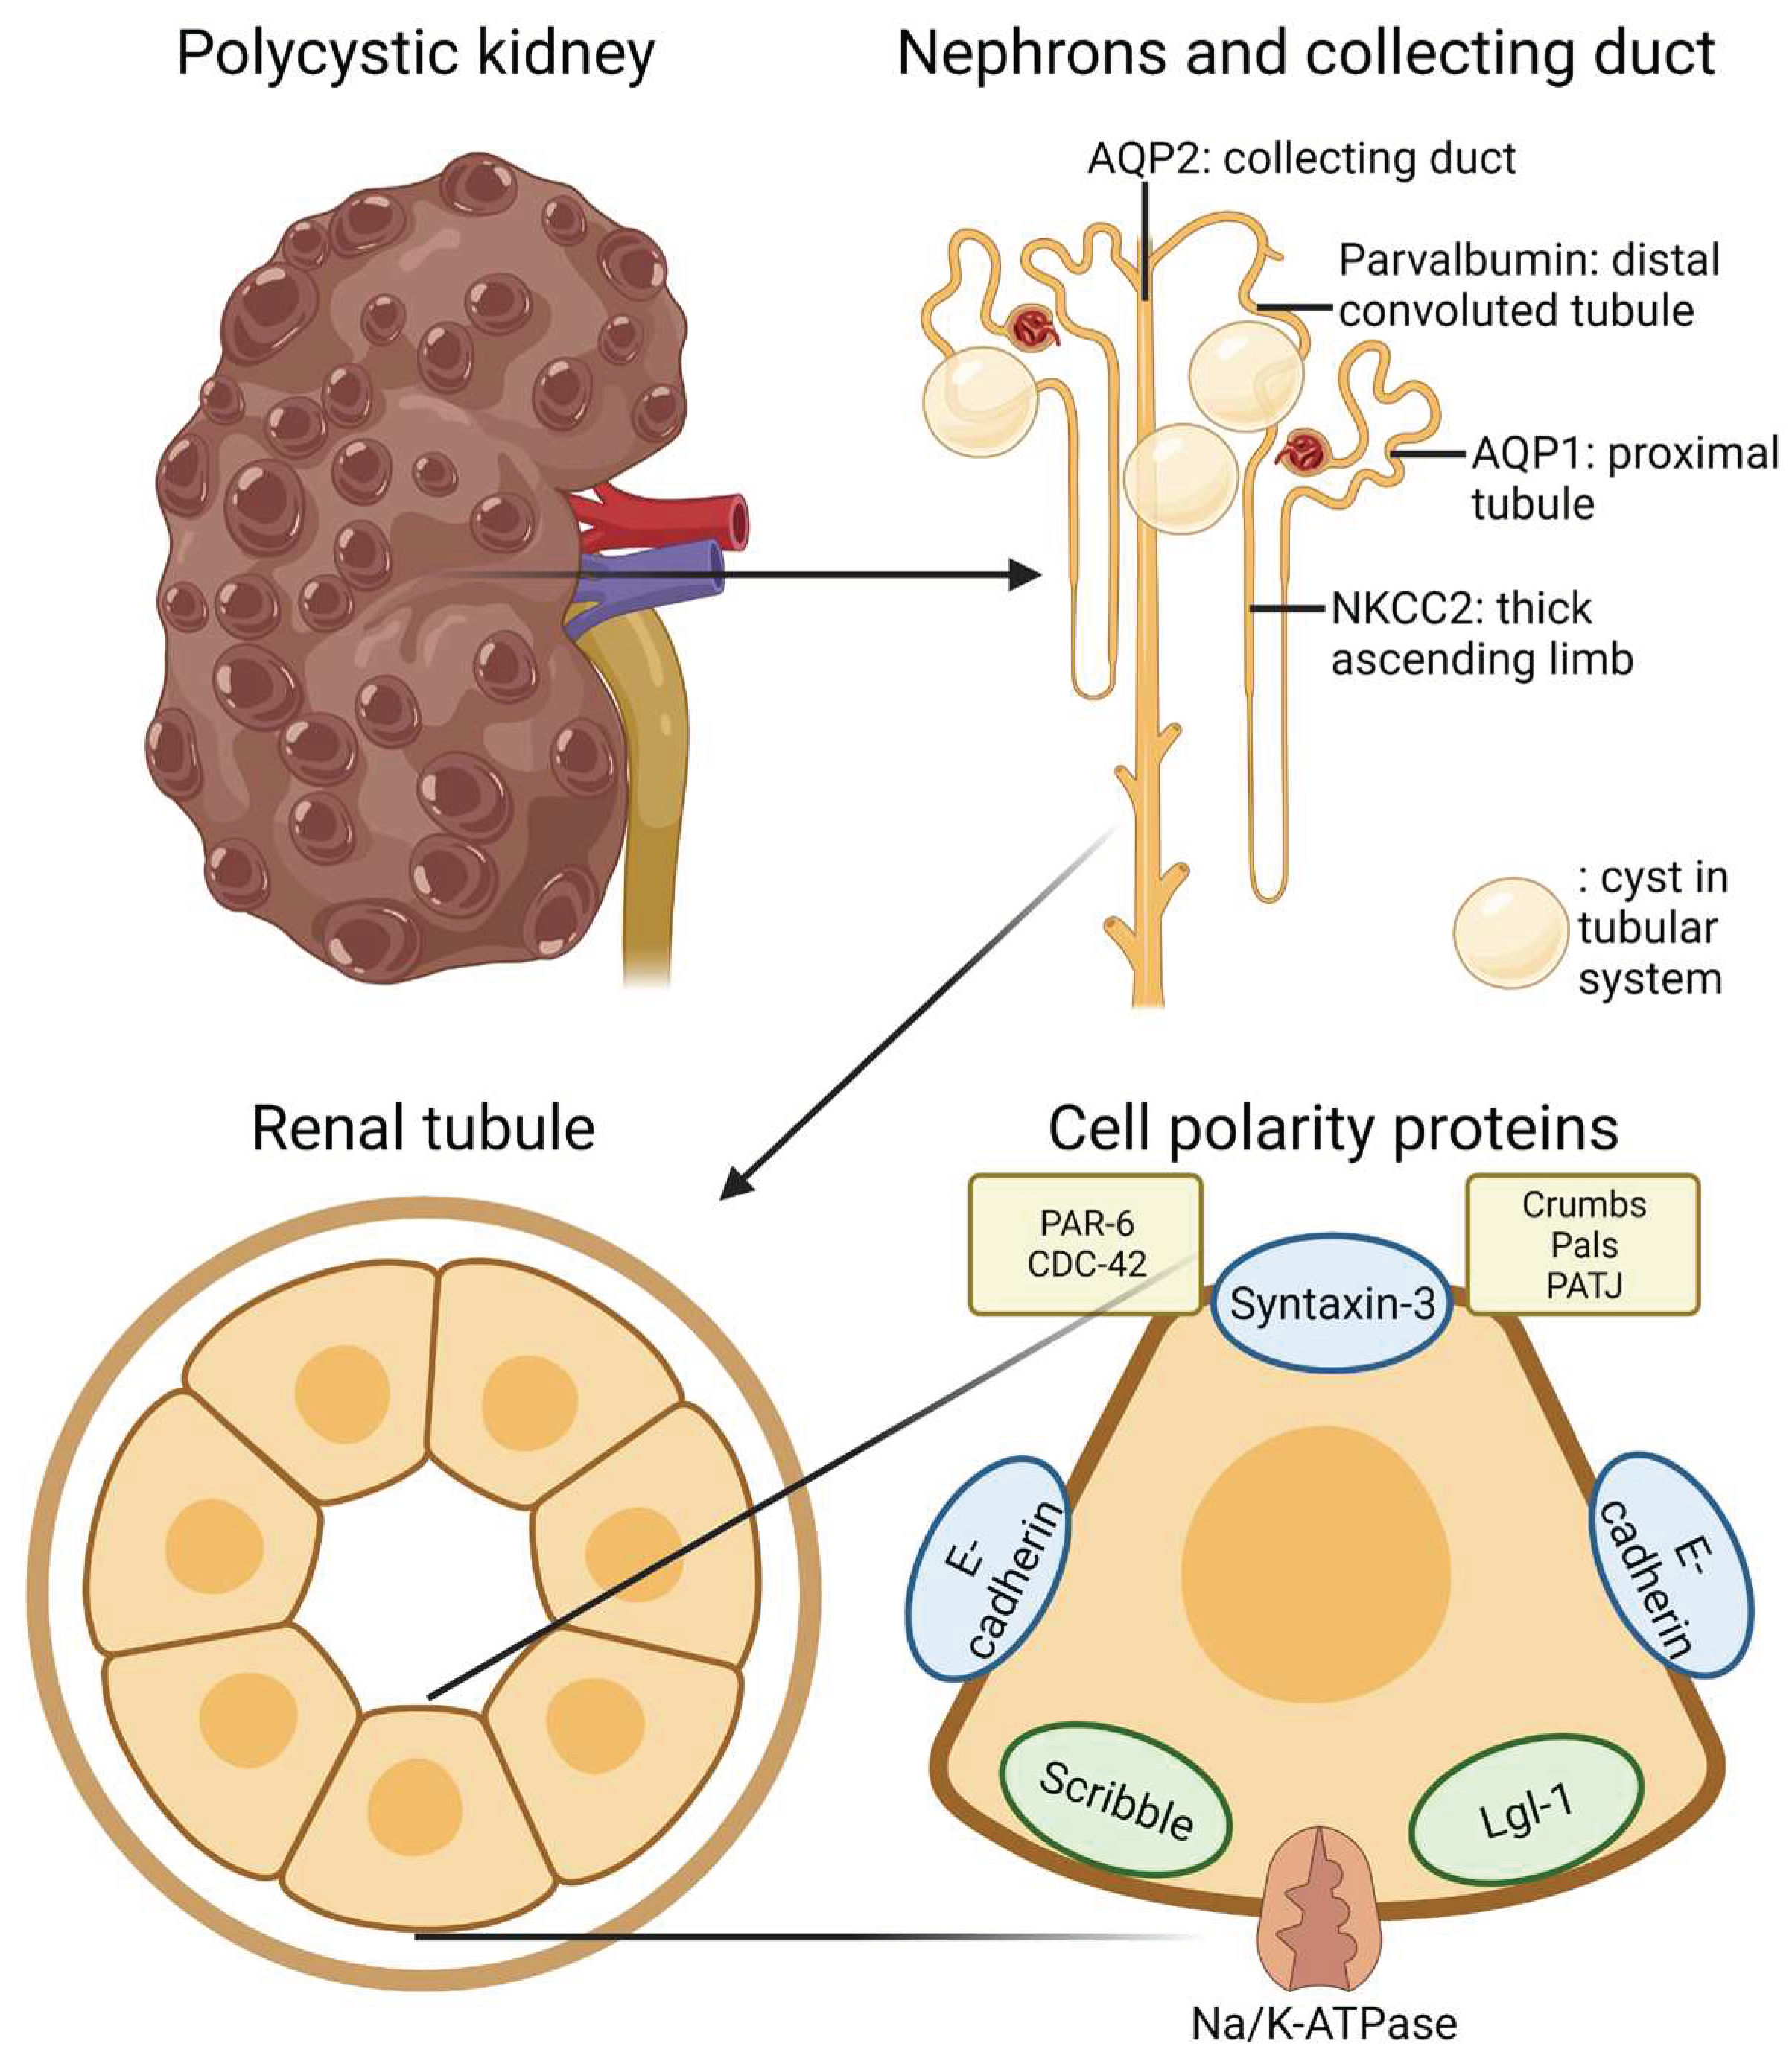
To determine whether the change in transport direction of the cyst lining epithelium results from a simple reversal of the basic cell polarity, we investigated the expression of the crucial polarity proteins in these cells. The zonula adherens molecule E-cadherin was shown to be correctly situated on the basolateral side of the cyst-lining epithelium. Apical markers such as the SNARE-protein Syntaxin-3 as well as the Crumbs and Par complexes were also found to be correctly localized in cyst epithelia. The basolateral Scribble complex was also found in the expected location in cysts. Taken together, we find no evidence of any polarity switch as a part of cystogenesis in hPKD (
Figure 12).
In accordance with the literature, we found cysts to originate from virtually every tubule segment [
28,
29]. It is worth noting, however, that we could not achieve any satisfactory staining for the apical distal tubule transporter NCC in cysts. On rare occasions, staining was observed beneath the basement membrane, and was therefore regarded as unspecific staining. Instead, we used parvalbumin as a marker for the distal tubule, which was also present in cysts. No cysts were positive for multiple segment markers, indicating a singular segmental origin. Cysts originating from proximal tubule, TAL, distal tubule and collecting ducts were all found to have preserved planar polarity.
Not all tubule segments express all polarity proteins. The proximal tubule did not exhibit staining for the basolateral markers E-cadherin, Scribble or Lgl-1 by means of immunoperoxidase. The proximal tubule also did not stain for apical CDC-42, while Syntaxin-3 was only observed in this segment (
Table 1).
The absence of E-cadherin from the proximal tubule is not surprising, since N-cadherin is expressed in the proximal tubule, while E-cadherin is present in the distal parts of tubule system [
39]. This is without consequence to the interpretation of our data since the cysts arising from the proximal tubule are shown to have conventional polarity with regards to Pals-1 and Lgl-1. Strikingly, Lgl-1 was observable by means of immunofluorescence.
The presence of Syntaxin-3 only in the proximal tubule is surprising seeing as syntaxin-3 has previously been described to only be present in the basolateral membrane of intercalated cells of the collecting duct [
40]. The same group later found Syntaxin-3 to be expressed in the basolateral membrane in all segments
except the proximal tubule [
41]. Since we found Syntaxin-3 to be apically localized in both normal human tubules and cyst epithelium, this discrepancy does not alter the interpretation of our results.
Lgl-1 was not detected in the thick ascending limb, but, surprisingly, was present in NKCC2-positive cysts. We interpret this as cysts originating from TAL but losing their phenotype. Importantly, Lgl-1 was basolaterally expressed as expected. Thus, this finding aids us in determining the preserved polarity of the NKCC2-positive cyst.
As mentioned in the results section, we were only able to achieve detectable immunohistochemical staining from cysts lined with a relatively tall epithelium. The thin-walled cysts exhibited no immunoreactivity, which hindered our assessment of the polarity and tubular origin of these cysts. It is possible that this tapering of the epithelium represents a gradual de-differentiation from the original tubular phenotype [
21]. As such, we are unable to comment on whether this proposed de-differentiation also results in aberrant polarization or apical expression of Na, K-ATPase. We would argue, however, that the thinning of the cyst lining epithelium more likely signifies a lower functional state with regards to reabsorption than it represents a switch of cell polarity.
Since it has been shown that complete loss of the primary cilium leads to cyst development [
42], it might be valuable to investigate whether there is a connection between cyst origin and cilium loss. In the present study, we find no evidence of a polarity reversal in the cyst epithelium, and as such, the fluid accumulation in cysts cannot be explained by this. Therefore, it would be interesting to see if the cysts all express CFTR in the apical membrane domain and NKCC1 in the basolateral membrane with preserved polarity as suggested by the hypothesis of cyst fluid secretion [
37,
43].
4. Materials and Methods
4.1. Preparation of Patient Material
Renal surgical biopsies of approximately 0.5x1x1 cm from 6 anonymous polycystic kidney disease patients (3 males and 3 females ageing 39-65 years) were immersion fixed with 4% paraformaldehyde in PBS overnight. Biopsies were dehydrated in graded ethanol (70%, 96%, and 99%) for 2 hours each and left overnight in xylene. The tissue was embedded in paraffin wax, cut into 2 μm thick sections on a rotary microtome (Leica), and placed on Super Frost slides.
4.2. Immunohistochemistry
Sections were dewaxed in xylene and rehydrated in graded ethanol. Endogenous peroxidase was blocked after 96% ethanol in 33% H2O2 in methanol. To retrieve antigens, sections were boiled in a microwave oven in TEG-buffer, pH 9, with 10 mM Tris and 0.5 mM EGTA. Aldehydes were quenched in 50 mM NH4Cl in PBS, and the sections were blocked in 0.1% bovine serum albumin (BSA), 0.2% gelatine, 0.05% saponin in PBS. Finally, sections were incubated overnight at 4°C with primary antibody (
Table 2) in PBS with 0.1% BSA and 0.3% Triton X-100 in, and rinsed in 0.1% BSA, 0.2% gelatine, and 0.05% saponin.
For brightfield microscopy, sections were incubated 1 hour with horseradish peroxidase conjugated secondary antibody in 0.1% BSA, 0.3% Triton X 100 in PBS and washed in 0.1% BSA, 0.2% gelatine, and 0.05% saponin in PBS before visualization with diaminobenzidine in 33% H2O2 for 10 minutes. Finally, the sections were counterstained with Meyers hematoxylin and rinsed in running tap water before dehydration in graded ethanol and xylene and mounting with coverslips using Eukitt (CellPath). For immunofluorescence staining, the blocking of peroxidase was omitted, and fluorophore tagged secondary antibodies (Alexa 488 and Alexa 555) was applied. Nuclei were stained with Topro3 (Invitrogen). Coverslips were mounted with a hydrophilic mounting medium containing antifading reagent (DAKO, glycergel).
4.3. Microscopy and Image Processing
Brightfield microscopy was performed on a Leica DM2500 equipped with a Leica MC170 HD camera, PL Fluotar 25x/0.75 N/A and PL Apo 63x/1.32 NA oil immersion objectives. Fluorescence imaging was performed using a DM IRE2 inverted laser scanning confocal microscope (Leica Microsystems) equipped with an HCX PC APO CS 63x/1.32 NA oil immersion objective or an inverted 710 laser scanning confocal microscope (Zeiss) equipped with a Plan-Apochromat 63x/1.4 NA oil immersion objective. Images were acquired with 8-bit image depth, 1,024 × 1,024 pixel resolution, with an image averaging of 3-4 frames and processed in Image-J software (NIH).
5. Conclusions
In conclusion, we confirm the principle that renal cysts can arise from the entire tubular system – but only express membrane transport markers of a single segment. All cysts with cuboidal epithelial cells are polarized by the conventional lateral membrane domain cadherin expression, apical Par-6, syntaxin-3, and Crumbs complexes, as well as basolateral Scribble complex. Furthermore, the Na,K-ATPase expression was confined to the basolateral membrane of all the cuboidal cyst lining epithelia. Thus, this study cannot support a model of secretory cyst epithelium relying on reversed cell polarity and apical mislocation of the Na,K-ATPase.
Author Contributions
Conceptualization, J.P. and H.B.; methodology, S.L.S, A.R., J.P., H.H.D, and H.B.; software, S.L.S, A.R., and J.P.; validation, S.L.S, A.R., and J.P.; formal analysis, S.L.S, A.R., and J.P.; investigation, S.L.S, A.R., J.P., H.H.D, and H.B.; resources, J.P. H.H.D, and H.B.; data curation, S.L.S, and A.R.; writing—original draft preparation, S.L.S., A.R., and J.P.; writing—review and editing, S.L.S, A.R., J.P., H.H.D, and H.B.; visualization, S.L.S, A.R., and J.P.; supervision, J.P.; project administration, J.P.; funding acquisition, J.P. All authors have read and agreed to the published version of the manuscript.
Funding
This study was supported by Aarhus University Research Foundation (AUFF) AU-Ideas, the InterPrET (Interactions of Proteins in Epithelial Transport) Center, and the Danish Council for Independent Research–Medical Sciences.
Institutional Review Board Statement
The study was conducted on surgical biopsies from anonymous polycystic kidney disease patients undergoing nephrectomy. No licenses were therefore necessary according to the Danish National Center for Ethics.
Informed Consent Statement
Patient consent was waived due to the anonymity of the surgical biopsies.
Data Availability Statement
All raw data are available upon request.
Acknowledgments
We wish the express our gratitude for tissue collection and initiation of the study by Inga Baasch Christensen and for expert technical assistance by Inger Merete S Paulsen.
Conflicts of Interest
The authors declare no conflicts of interest.
References
- Torres VE, Harris PC, Pirson Y. Autosomal dominant polycystic kidney disease. The Lancet 2007, 369, 1287–1301. [Google Scholar] [CrossRef] [PubMed]
- Bergmann C, Guay-Woodford LM, Harris PC, Horie S, Peters DJM, Torres VE. Polycystic kidney disease. Nature Reviews Disease Primers 2018, 4, 50. [Google Scholar] [CrossRef] [PubMed]
- Wilson PD, Sherwood AC, Palla K, Du J, Watson R, Norman JT. Reversed polarity of Na(+) -K(+) -ATPase: mislocation to apical plasma membranes in polycystic kidney disease epithelia. Am J Physiol 1991, 260, F420–F430. [Google Scholar] [CrossRef]
- Patel V, Li L, Cobo-Stark P, Shao X, Somlo S, Lin F, Igarashi P. Acute kidney injury and aberrant planar cell polarity induce cyst formation in mice lacking renal cilia. Hum Mol Genet 2008, 17, 1578–1590. [Google Scholar] [CrossRef] [PubMed]
- Fischer E, Legue E, Doyen A, Nato F, Nicolas J-F, Torres V, Yaniv M, Pontoglio M. Defective planar cell polarity in polycystic kidney disease. Nature Genetics 2006, 38, 21–23. [Google Scholar] [CrossRef] [PubMed]
- Mellman I, Nelson WJ. Coordinated protein sorting, targeting and distribution in polarized cells. Nature reviews Molecular cell biology 2008, 9, 833–845. [Google Scholar] [CrossRef] [PubMed]
- Stoops EH, Caplan MJ. Trafficking to the apical and basolateral membranes in polarized epithelial cells. J Am Soc Nephrol 2014, 25, 1375–1386. [Google Scholar] [CrossRef]
- Sharma N, Low SH, Misra S, Pallavi B, Weimbs T. Apical targeting of syntaxin 3 is essential for epithelial cell polarity. The Journal of cell biology 2006, 173, 937–948. [Google Scholar] [CrossRef] [PubMed]
- ter Beest MB, Chapin SJ, Avrahami D, Mostov KE. The role of syntaxins in the specificity of vesicle targeting in polarized epithelial cells. Molecular biology of the cell 2005, 16, 5784–5792. [Google Scholar] [CrossRef] [PubMed]
- Di Paolo G, De Camilli P. Phosphoinositides in cell regulation and membrane dynamics. Nature 2006, 443, 651–657. [Google Scholar] [CrossRef]
- Roignot J, Peng X, Mostov K. Polarity in mammalian epithelial morphogenesis. Cold Spring Harb Perspect Biol 2013, 5. [Google Scholar]
- Buckley CE, St Johnston D. Apical-basal polarity and the control of epithelial form and function. Nat Rev Mol Cell Biol 2022, 23, 559–577. [Google Scholar] [CrossRef] [PubMed]
- Goehring, NW. PAR polarity: from complexity to design principles. Experimental cell research 2014, 328, 258–266. [Google Scholar] [CrossRef]
- Graybill C, Wee B, Atwood SX, Prehoda KE. Partitioning-defective protein 6 (Par-6) activates atypical protein kinase C (aPKC) by pseudosubstrate displacement. J Biol Chem 2012, 287, 21003–21011. [Google Scholar] [CrossRef]
- Whitney DS, Peterson FC, Kittell AW, Egner JM, Prehoda KE, Volkman BF. Binding of Crumbs to the Par-6 CRIB-PDZ Module Is Regulated by Cdc42. Biochemistry 2016, 55, 1455–1461. [Google Scholar] [CrossRef] [PubMed]
- Plant PJ, Fawcett JP, Lin DC, Holdorf AD, Binns K, Kulkarni S, Pawson T. A polarity complex of mPar-6 and atypical PKC binds, phosphorylates and regulates mammalian Lgl. Nat Cell Biol 2003, 5, 301–308. [Google Scholar] [CrossRef]
- Hurov JB, Watkins JL, Piwnica-Worms H. Atypical PKC phosphorylates PAR-1 kinases to regulate localization and activity. Current biology : CB 2004, 14, 736–741. [Google Scholar] [CrossRef]
- Cereijido M, Valdés J, Shoshani L, Contreras RG. Role of tight junctions in establishing and maintaining cell polarity. Annu Rev Physiol 1998, 60, 161–177. [Google Scholar] [CrossRef]
- Nejsum LN, Nelson WJ. A molecular mechanism directly linking E-cadherin adhesion to initiation of epithelial cell surface polarity. J Cell Biol 2007, 178, 323–335. [Google Scholar] [CrossRef]
- O'Brien LE, Jou TS, Pollack AL, Zhang Q, Hansen SH, Yurchenco P, Mostov KE. Rac1 orientates epithelial apical polarity through effects on basolateral laminin assembly. Nat Cell Biol 2001, 3, 831–838. [Google Scholar] [CrossRef]
- Grantham JJ, Geiser JL, Evan AP. Cyst formation and growth in autosomal dominant polycystic kidney disease. Kidney International 1987, 31, 1145–1152. [Google Scholar] [CrossRef] [PubMed]
- Wilson PD, Devuyst O, Li X, Gatti L, Falkenstein D, Robinson S, Fambrough D, Burrow CR. Apical Plasma Membrane Mispolarization of NaK-ATPase in Polycystic Kidney Disease Epithelia Is Associated with Aberrant Expression of the β2 Isoform. The American Journal of Pathology 2000, 156, 253–268. [Google Scholar] [CrossRef] [PubMed]
- van Roy F, Berx G. The cell-cell adhesion molecule E-cadherin. Cell Mol Life Sci 2008, 65, 3756–3788. [Google Scholar] [CrossRef]
- Li X, Low SH, Miura M, Weimbs T. SNARE expression and localization in renal epithelial cells suggest mechanism for variability of trafficking phenotypes. American journal of physiology Renal physiology 2002, 283, F1111–F1122. [Google Scholar] [CrossRef] [PubMed]
- Horikoshi Y, Suzuki A, Yamanaka T, Sasaki K, Mizuno K, Sawada H, Yonemura S, Ohno S. Interaction between PAR-3 and the aPKC-PAR-6 complex is indispensable for apical domain development of epithelial cells. Journal of cell science 2009, 122, 1595–1606. [Google Scholar] [CrossRef]
- Zihni C, Mills C, Matter K, Balda MS. Tight junctions: from simple barriers to multifunctional molecular gates. Nature Reviews Molecular Cell Biology 2016, 17, 564–580. [Google Scholar] [CrossRef] [PubMed]
- Rodriguez-Boulan E, Macara IG. Organization and execution of the epithelial polarity programme. Nature reviews Molecular cell biology 2014, 15, 225–242. [Google Scholar] [CrossRef]
- Leeuwen ISL-v, Dauwerse JG, Baelde HJ, Leonhard WN, van de Wal A, Ward CJ, Verbeek S, DeRuiter MC, Breuning MH, de Heer E, Peters DJM. Lowering of Pkd1 expression is sufficient to cause polycystic kidney disease. Human Molecular Genetics 2004, 13, 3069–3077. [Google Scholar] [CrossRef]
- Jiang ST, Chiou YY, Wang E, Lin HK, Lin YT, Chi YC, Wang CK, Tang MJ, Li H. Defining a link with autosomal-dominant polycystic kidney disease in mice with congenitally low expression of Pkd1. Am J Pathol 2006, 168, 205–220. [Google Scholar] [CrossRef]
- Wilson PD, Schrier RW, Breckon RD, Gabow PA. A new method for studying human polycystic kidney disease epithelia in culture. Kidney Int 1986, 30, 371–378. [Google Scholar] [CrossRef]
- Brill SR, Ross KE, Davidow CJ, Ye M, Grantham JJ, Caplan MJ. Immunolocalization of ion transport proteins in human autosomal dominant polycystic kidney epithelial cells. Proc Natl Acad Sci USA 1996, 93, 10206–10211. [Google Scholar] [CrossRef] [PubMed]
- Carone FA, Nakamura S, Caputo M, Bacallao R, Nelson WJ, Kanwar YS. Cell polarity in human renal cystic disease. Lab Invest 1994, 70, 648–655. [Google Scholar]
- Kawa G, Nagao S, Yamamoto A, Omori K, Komatz Y, Takahashi H, Tashiro Y. Sodium pump distribution is not reversed in the DBA/2FG-pcy, polycystic kidney disease model mouse. J Am Soc Nephrol 1994, 4, 2040–2049. [Google Scholar] [CrossRef] [PubMed]
- Takahashi M, Tsuchiya K, Komatsu Y, Nihei H. A role for Na/K adenosine triphosphatase in the pathogenesis of cyst formation in experimental polycystic kidney disease. Journal of Laboratory and Clinical Medicine 1997, 129, 517–526. [Google Scholar] [CrossRef] [PubMed]
- Wang X, Ward CJ, Harris PC, Torres VE. Cyclic nucleotide signaling in polycystic kidney disease. Kidney International 2010, 77, 129–140. [Google Scholar] [CrossRef]
- Gattone VH, Wang X, Harris PC, Torres VE. Inhibition of renal cystic disease development and progression by a vasopressin V2 receptor antagonist. Nature Medicine 2003, 9, 1323–1326. [Google Scholar] [CrossRef] [PubMed]
- Wallace DP, Rome LA, Sullivan LP, Grantham JJ. cAMP-dependent fluid secretion in rat inner medullary collecting ducts. American Journal of Physiology-Renal Physiology 2001, 280, F1019–F1029. [Google Scholar] [CrossRef]
- Hanaoka K, Devuyst O, Schwiebert EM, Wilson PD, Guggino WB. A role for CFTR in human autosomal dominant polycystic kidney disease. Am J Physiol 1996, 270, C389–C399. [Google Scholar] [CrossRef] [PubMed]
- Prozialeck WC, Lamar PC, Appelt DM. Differential expression of E-cadherin, N-cadherin and beta-catenin in proximal and distal segments of the rat nephron. BMC Physiol 2004, 4, 10. [Google Scholar] [CrossRef]
- Mandon B, Nielsen S, Kishore BK, Knepper MA. Expression of syntaxins in rat kidney. American Journal of Physiology-Renal Physiology 1997, 273, F718–F730. [Google Scholar] [CrossRef]
- Breton S, Inoue T, Knepper MA, Brown D. Antigen retrieval reveals widespread basolateral expression of syntaxin 3 in renal epithelia. American Journal of Physiology-Renal Physiology 2002, 282, F523–F529. [Google Scholar] [CrossRef] [PubMed]
- Lin F, Hiesberger T, Cordes K, Sinclair AM, Goldstein LSB, Somlo S, Igarashi P. Kidney-specific inactivation of the KIF3A subunit of kinesin-II inhibits renal ciliogenesis and produces polycystic kidney disease. Proceedings of the National Academy of Sciences 2003, 100, 5286–5291. [Google Scholar] [CrossRef] [PubMed]
- Lebeau C, Hanaoka K, Moore-Hoon ML, Guggino WB, Beauwens R, Devuyst O. Basolateral chloride transporters in autosomal dominant polycystic kidney disease. Pflugers Arch 2002, 444, 722–731. [Google Scholar] [CrossRef] [PubMed]
- Jensen AM, Nørregaard R, Topcu SO, Frøkiær J, Pedersen M. Oxygen tension correlates with regional blood flow in obstructed rat kidney. Journal of Experimental Biology 2009, 212, 3156–3163. [Google Scholar] [CrossRef] [PubMed]
- Ecelbarger CA, Terris J, Hoyer JR, Nielsen S, Wade JB, Knepper MA. Localization and regulation of the rat renal Na(+)-K(+)-2Cl- cotransporter, BSC-1. Am. J. Physiol. Ren. Physiol. 1996, 271, F619–F628. [Google Scholar] [CrossRef]
- Nielsen J, Kwon TH, Praetorius J, Frøkiaer J, Knepper MA, Nielsen S. Aldosterone increases urine production and decreases apical AQP2 expression in rats with diabetes insipidus. Am J Physiol Renal Physiol 2006, 290, F438–F449. [Google Scholar] [CrossRef]
Figure 1.
Immunohistochemical analysis of renal Na,K-ATPase α1 and E-cadherin expression in normal human kidney and hPKD tissue. A: Immunoperoxidase overview image of normal tubules. B: Image of hPKD kidney tissue showing a cyst (asterisk). C: Magnification of the window marked in panel C showing the basolateral distribution of Na, K-ATPase α1 in the cyst epithelium. D: Staining of normal tubules showing basolateral localization of E-cadherin. E: Image of hPKD kidney tissue showing a cyst (asterisk). F: Magnification of the window marked in panel B. E-cadherin is also basolaterally localized in the cyst lining epithelium.
Figure 2.
Immunolocalization of Syntaxin-3 and Crumbs-3 in normal human kidney and hPKD tissue. A: Immunolocalization of Syntaxin-3 in normal tubules. B: Image of hPKD kidney tissue showing a cyst (asterisk). C: Magnification of the window in B showing apical localization of Syntaxin-3 in the cyst-lining epithelium. D: Immunolocalization of Crumbs-3 in normal tubules. E: Image of hPKD tissue showing a cyst (asterisk). F: Magnification of the window in E showing apical localization of Crumbs-3 in the cyst epithelium.
Figure 3.
Immunolocalization of Crumbs-complex components Pals-1 and PATJ. A: Staining of normal human tubules showing apical Pals-1 immunoreactivity. B: Image of hPKD tissue stained for Pals-1 showing a cyst (asterisk). C: Magnification of window marked in panel B showing apical localization of Pals-1 in the cyst epithelium. D: Image of normal human tubules immunostained for apical PATJ. E: Image of hPKD tissue stained for PATJ exemplifying a cyst (asterisk). F: Magnification of the window marked in panel E showing apical localization of PATJ in the cyst-lining epithelium.
Figure 4.
Immunolocalization of renal PAR complex components Par-6 and CDC-42. A: Normal human kidney tubules immunostained for apical Par-6. B: Image of hPKD kidney stained for Par-6 showing a cyst (asterisk). C: Magnification of the window marked in panel B showing apical distribution of Par-6 in the cyst. D: Normal human kidney tubules stained for apical CDC-42. E: Image of hPKD kidney stained for CDC-42 showing two adjacent cysts (asterisks). F: Magnification of the window marked in panel E displaying apical immunolocalization of CDC-42 in the cyst epithelium.
Figure 5.
Immunolocalization of renal Scribble complex components Scribble and Lgl-1. A: Overview image of normal human kidney tubules immunostained for Scribble. B: Image of hPKD kidney stained for Scribble showing a cyst (asterisk). C: Higher magnification of cyst-lining epithelium showing basolateral staining. D: Image of normal human kidney tubules stained for basolateral Lgl-1. E: Image of hPKD kidney stained for Lgl-1 displaying a cyst (asterisk). F: Higher magnification of the window marked in panel E showing basolateral localization of Lgl-1 in the cyst-lining epithelium.
Figure 6.
Renal staining for the proximal tubular water channel AQP1 and the thick ascending limb co-transporter NKCC2. A: Image of normal human kidney tissue immunostained for AQP1. B: Overview images of hPKD kidney stained for AQP1 showing a cyst (asterisk). C: Magnification of the window in B showing both apical and basolateral localization of AQP1 in the cyst-lining epithelium. D: Image of normal human kidney tissue immunostained for apical NKCC2. E: Image of renal hPKD tissue stained for NKCC2 showing a cyst (asterisk). F: Magnification of the window in E showing apical staining for NKCC2 in the cyst-lining epithelium.
Figure 7.
Renal staining for distal convoluted tubule parvalbumin and the collecting duct water channel AQP2. A: Image of normal human kidney immunostained for cytosolic parvalbumin. B: Image of hPKD kidney stained for parvalbumin showing a cyst (asterisk). C: Magnification of the window marked in panel B showing cytosolic localization of parvalbumin in the cyst-lining epithelium. D: Image of normal human kidney stained for mainly apical AQP2. E: Image of hPKD tissue stained for AQP2 showing a cyst (asterisk). F: Magnification of the window marked in panel E showing apical localization of AQP2 in the cyst-lining epithelium.
Figure 8.
Double immunofluorescence labelling for proximal tubular AQP1 and cell polarity proteins. A: Labelling of AQP1 (red) and Pals-1 (green) in normal human kidney tissue with tubular and cellular colocalization. B: Labelling of AQP1 (red) and Pals-1 (green) in hPKD tissue showing a cyst (asterisk) with similar cellular colocalization. C: Labelling of Lgl-1 (red) and AQP1 (green) in normal human kidney tissue with tubular and cellular colocalization. D: Labelling of Lgl-1 (red) and AQP1 (green) in hPKD tissue showing a cyst (asterisk) with similar cellular colocalization.
Figure 9.
Double immunofluorescence labelling for thick ascending limb NKCC2, Claudin-16, and cell polarity proteins. A: Labelling for Pals-1 (red) and Claudin-16 (green) in normal human kidney tubules. B: Labelling for Pals-1 (red) and Claudin-16 (green) in hPKD kidney showing a cyst (asterisk) with apical localization of both proteins consistent with normal tubular localization. C: Labelling of Lgl-1 (red) and NKCC2 (green) in normal human kidney tissue. D: Labelling of Lgl-1 (red) and NKCC2 (green) in hPKD kidney showing a cyst (asterisk) with apical staining for NKCC2 and basolateral staining for Lgl-1.
Figure 10.
Double immunofluorescence labelling for distal convoluted tubule Parvalbumin and cell polarity proteins. A: Labelling for parvalbumin (Parv, red) and Pals-1 (green) in normal human kidney tissue with tubular and cellular colocalization. B: Labelling for parvalbumin (red) and Pals-1 (green) in hPKD kidney showing a cyst (asterisk) with similar cellular colocalization. C: Labelling for parvalbumin (red) and E-cadherin (E-cad, green) in normal human kidney with tubular and cellular colocalization. D: Labelling for parvalbumin (red) and E-cadherin (green) in hPKD kidney displaying a cyst (asterisk) with similar cellular colocalization.
Figure 11.
Double immunofluorescence for collecting duct AQP2 and cell polarity proteins. A: Labelling for Pals-1 (red) and AQP2 (green) in normal human kidney with tubular and cellular colocalization. B: Labelling for Pals-1 (red) and AQP2 (green) in hPKD kidney showing a cyst (asterisk) with similar cellular colocalization. C: Labelling for AQP2 (red) and E-cadherin (green) in normal human kidney with tubular and cellular colocalization. D: Labelling for APQ2 (red) and E-cadherin (green) in hPKD kidney showing a cyst (asterisk) with similar cellular colocalization.
Figure 12.
Schematic representation of the gross and microscopic morphology of the cystic kidney and cell polarity proteins.
Figure 12.
Schematic representation of the gross and microscopic morphology of the cystic kidney and cell polarity proteins.
Table 1.
Reactivity of tubule segments by immunoperoxidase. PT: proximal tubule, TAL: thick ascending limb of Henle, DCT: distal convoluted tubule, CCD: cortical collecting duct.
Table 1.
Reactivity of tubule segments by immunoperoxidase. PT: proximal tubule, TAL: thick ascending limb of Henle, DCT: distal convoluted tubule, CCD: cortical collecting duct.
| Segment |
Syntaxin-3 |
E-cadherin |
Crumbs-3 |
Pals-1 |
PATJ |
Par-6 |
CDC-42 |
Scribble |
Lgl-1 |
| PT |
x |
|
x |
x |
x |
x |
|
|
|
| TAL |
|
x |
x |
x |
x |
|
|
|
|
| DCT |
|
x |
x |
x |
x |
x |
x |
x |
x |
| CCD |
|
x |
x |
x |
x |
x |
|
x |
x |
| PT |
x |
|
x |
x |
x |
x |
|
|
|
Table 2.
Antibodies used in the study.
Table 2.
Antibodies used in the study.
| Segment |
Syntaxin-3 |
E-cadherin |
Crumbs-3 |
Pals-1 |
| Na/K-ATPase |
3B-0/56-0 |
1:5.000 |
Mouse |
Forbush B IIIrd |
| E-cadherin |
LS-B12414-300 |
1:1.000 |
Goat |
LS Bio |
| Syntaxin-3 |
sc-47437 |
1:25 |
Goat |
Santa Cruz Biotech |
| Crumbs3a |
crumbs 3a |
1:200 |
Rat |
Massey-Harroche, Le Bivic |
| Pals-1 |
17710-AP |
1:200 |
Rabbit |
Proteintech |
| PATJ |
Anti-Patj |
1:125 |
Rabbit |
Massey-Harroche, Le Bivic |
| Par-6 |
sc-166405 |
1:100 |
Mouse |
Santa Cruz Biotech |
| CDC-42 |
sc-34314 |
1:50 |
Goat |
Santa Cruz Biotech |
| Scribble |
sc-11048 |
1:10 |
Goat |
Santa Cruz Biotech |
| Lgl-1 |
UNC 17-35 |
1:25 |
Mouse |
Patrick Humbert |
| AQP1 |
NB6000-749 |
1:2.000 |
Rabbit |
Novus Bio |
| NKCC2 |
1495ap |
1:200 |
Rabbit |
[44,45] |
| NCC |
SPC-402D |
1:10.000 |
Rabbit |
StressMarq Biosciences |
| Parvalbumin |
PV235 |
1:400 |
Mouse |
Swant |
| AQP2 |
H7661 |
1:2.000 |
Rabbit |
[46] |
| AQP2 |
sc-9882 |
1:250 |
Goat |
Santa Cruz Biotech |
|
Disclaimer/Publisher’s Note: The statements, opinions and data contained in all publications are solely those of the individual author(s) and contributor(s) and not of MDPI and/or the editor(s). MDPI and/or the editor(s) disclaim responsibility for any injury to people or property resulting from any ideas, methods, instructions or products referred to in the content. |
© 2023 by the authors. Licensee MDPI, Basel, Switzerland. This article is an open access article distributed under the terms and conditions of the Creative Commons Attribution (CC BY) license (http://creativecommons.org/licenses/by/4.0/).
