Preprint
Article

Economic Value of Peatland Ecosystem Services and People-Peatland Landscape Interplay: A Case Study from Sumatra, Indonesia

Altmetrics

Downloads

229

Views

109

Comments

0

Submitted:

28 December 2023

Posted:

29 December 2023

You are already at the latest version

Alerts
Abstract
Through a variety of unique ecosystem services, peatlands provide critical support to society and play a significant part in the global environmental system. Unfortunately, anthropogenic activities pose a hazard to these peatlands. This study estimated a total economic value (TEV) of peatland ecosystem services and examined relationships between the TEV and landscape characteristics in Riau province, Indonesia. A comprehensive economic valuation questionnaire, covering household socioeconomic conditions, ecological information and landscape characteristics, perception of peatland importance, peatland product collection data, and villagers' willingness to pay (WTP) for habitat and biodiversity protection, was administered to 200 household representatives (92% confidence) from five villages distributing across distinct landscapes. The survey took place from May to June 2023. The respondents derived numerous advantages from the peatlands, culminating in an average TEV of USD 3,174.31 per household per year. This value predominantly reflects a use value, accounting for 80.85% of the TEV. Notably, the use value emanates primarily from the provisioning of food through fishing, soil fertility, wild plants, and animals. However, to a lesser extent, there exists a marginal presence of a non-use value, encompassing the habitats provided to endemic or endangered species, the preservation of biodiversity for future generations, and the sanctity associated with forests deemed sacred. The observed variance in landscape characteristics appears to wield an influence on amounts of benefits derived from the peatlands. This phenomenon can be attributed to prevailing land use conditions and geographical distances.
Keywords: 
Subject: Biology and Life Sciences  -   Forestry

1. Introduction

Peatlands are distinctive ecosystems that contribute significantly to the global carbon cycle and offer a range of social and economic benefits, including provisioning, regulating, cultural, and supporting services in which our livelihoods depend upon [1,2,3]. Indonesia encompasses 13.43 million hectares of peatlands of which 43.58% are located in Sumatra Island [4]. Riau province in Sumatra obtains the largest extent in Indonesia, covering approximately 3.57 million hectares or 26.58% of the total peatlands [4]. Peatland utilization in Riau spans a significant historical timeline, evolving from subsistence agriculture to expansive plantations, particularly those dedicated to oil palm cultivation [5,6]. This progression reflects a dynamic nature of peatland management and underlies economic importance of peatland ecosystem services (ES) in supporting livelihoods and contributing to the region's development.
However, peatlands are now in great danger due to a number of factors. Logging, agriculture, peat extraction, and infrastructure development are among the biggest threats on a global scale [7,8], leading to soil erosion, peatland degradation [9], and greenhouse gas emissions [10,11]. Indonesia's peatlands are also encountering substantial pressures from anthropogenic activities and their consequences, including habitat conversion, pollution, overexploitation, and water drainage [12,13,14,15]. The peat forests and their ES are undergoing significant transformations from such activities as oil palm plantations, infrastructure construction, and rural development. The rate of loss was estimated at 2.6% per year in Sumatra and Kalimantan during 2007-2015 [16]. In 2015, enormous peat fires occurred in Indonesia; damaged over 2.6 million hectares of peatland [17]; emitted 0.884 Gt CO2 [18]; and caused air pollution across several countries in Southeast Asia [19,20,21]. Moreover, socioeconomic development – a key underlying driver, accelerates peatland depletion. Increasing demands for commercial crops such as palm oil and timber incentivize farmers to expand their plantations to meet market needs. Peatland conversion is inevitable when economic returns are highly expected.
Effective peatland management is needed more imperatively than ever. Several policies and approaches have been implemented, including landscape-based management e.g., establishment of peatland hydrological units [22], peatland restoration projects [23], agroforestry [24], and paludiculture [25]. These initiatives reveal positive outcomes but challenges remain, especially from low community participation for long-term engagement in management activities [26,27]. Villagers prioritize household well-being over the protection of peatlands since such priority is more rational with evident short-term impacts. Without clear and prominent benefits, a decision to change practices and invest time and effort in management activities is unlikely [27]. Furthermore, multifaceted landscapes and dynamic livelihoods add to the intricacies of peatland management [28]. Villagers from various landscapes may perceive ES differently, shaped by their interactions with the local environment. Enforcement of restrictive rules and regulations in protected area obstructs villagers' access to the resources, so diminishing accrued benefits and eventually weakening connections between people and nature – the ecosystem's significance on local livelihoods [29]. Meanwhile, easy access to a community peatland and oil palm plantations for peatland and forest product collection illuminates strong dependency and connection. Different perceptions stemming from diverse experiences within landscape environments influence people's choices between taking action or doing nothing. Therefore, effective natural resource management requires activities compatible with local biophysical and socioeconomic contexts [30,31,32,33].
Economic value is an estimate of willingness to give up on one thing to obtain a certain good and service [34]. The magnitude of economic value depends on users’ experiences with nature, their preferences, and amounts of benefits gained from ES. Economic value reflects how important the ES is to people, which subsequently determines their perception and action. This study examined the economic value of peatland ES in Riau province, Indonesia. It accentuated a total economic value (TEV), which serves as a monetary metric for gauging economic benefits that individuals obtained from use and non-use interactions with the ES, referred to as a “use” and “non-use” value, respectively. Furthermore, the study investigated relationships between the TEV and landscape characteristics under different ecological and socio-economic settings, including a protected area, peat swamp forests, fire-damaged zones, peatland restoration sites, and oil palm plantations. This assessment enables the identification of factors facilitating effective peatland management through a comprehensive understanding of people-landscape interactions.

2. Materials and Methods

2.1. Study Area

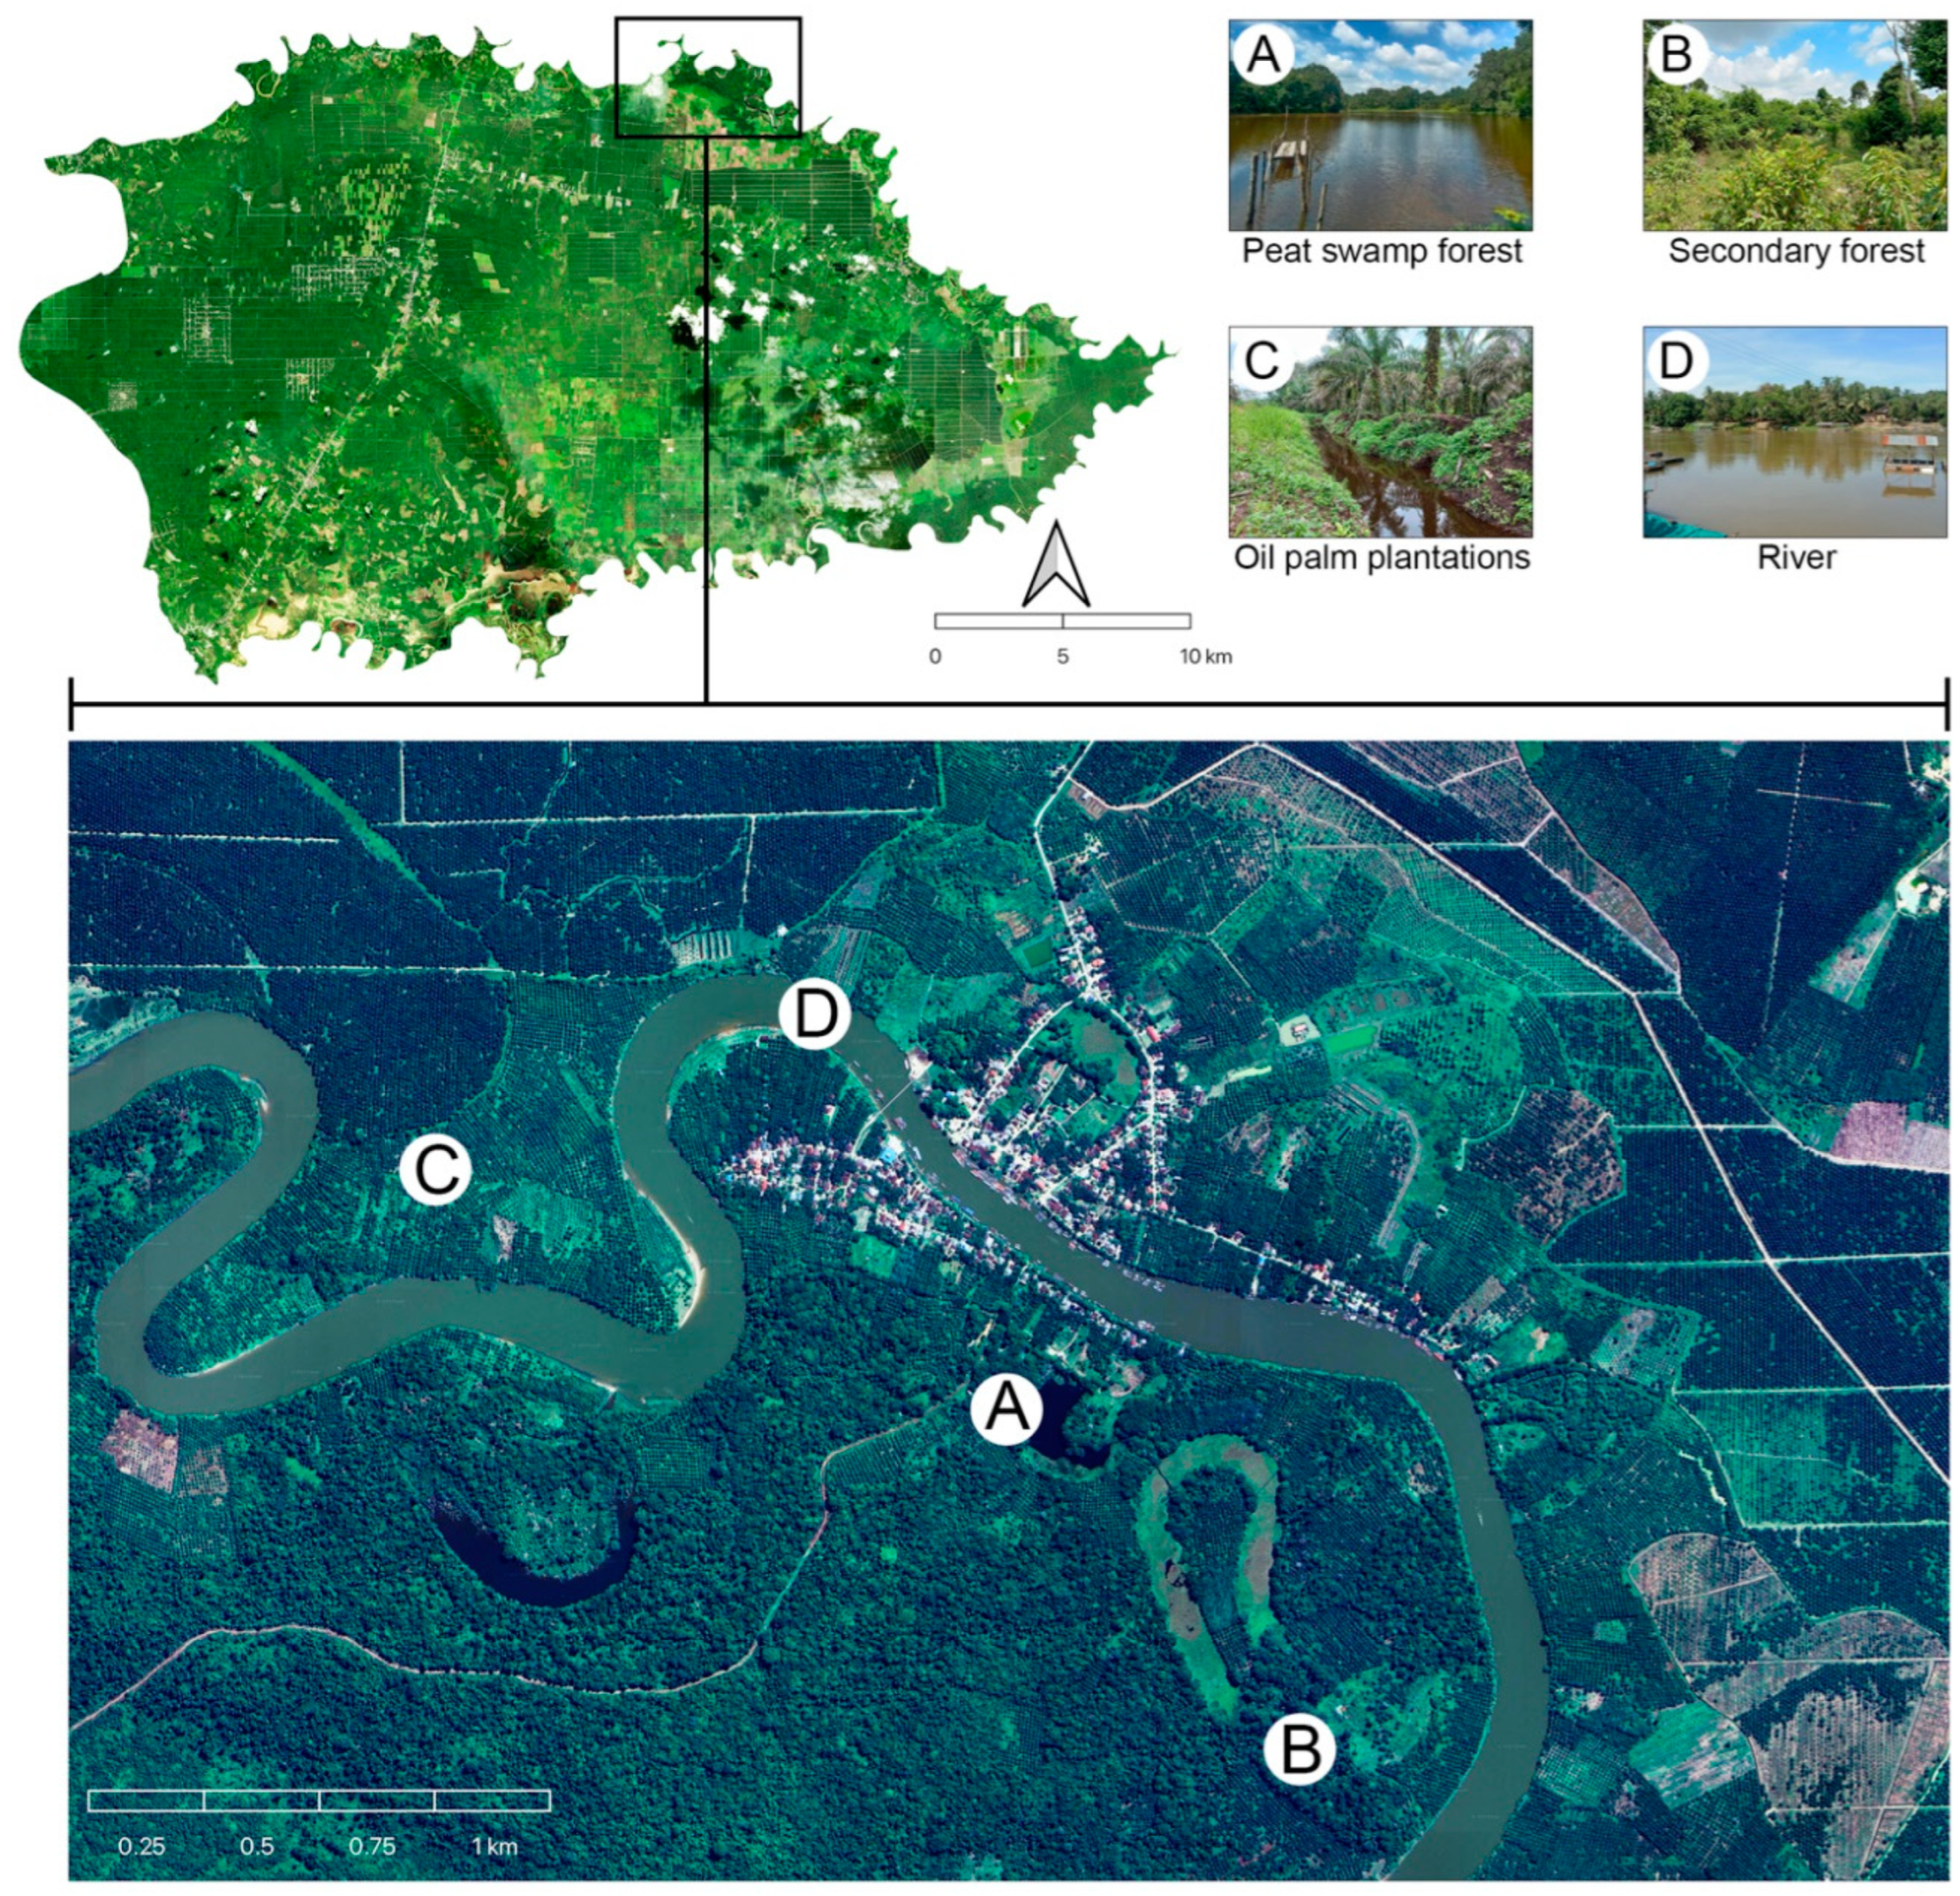
This study took place in the Sungai Kiyap - Sungai Kampar Kiri Peatland Hydrological Unit (SKKI PHU) in the Kampar Regency, Riau Province, Sumatra Island, Indonesia. The SKKI PHU extends approximately 72,747 hectares of which 27,161 hectares are classified as peatlands. They consist of commercial farmlands, peat swamp forests, oxbow lakes, and two main rivers i.e., the Kampar Kanan and Kampar Kiri River. Located in the tropical moist climate, the average temperature is 28°C with about 78% relative humidity, and amounts of annual rainfall between 2,000 to 3,000 mm [35]. Within the SKKI PHU lies the Buluh Cina Nature Recreation Park (BCNRP), spanning about 963 hectares. The BCNRP is a popular tourist destination in Riau, especially for city citizens from Pekanbaru, the capital city of Riau [36,37]. This popularity is due to its close proximity to the city (approximately 20 km) and excellent accessibility via well-maintained roads. The main attraction is captivating landscape views of the lowland rainforest, complemented by a variety of activities such as river and lake boat tours, fishing, wildlife photography, animal watching, and cultural tourism. Meanwhile, the BCNRP functions as a nature reserve for peatland ecosystems nourishing great biodiversity, including protected wildlife such as Rangkong badak (Buceros rhinoceros) and Belida (Chitala chitala) [38,39,40,41]. Local villagers residing in the vicinity access the BCNRP for collecting peatland products, particularly fish, fuelwood, medicinal plants, honey, wild animals, rattan, and fruits [42,43].
The SKKI PHU reveals several advantages and challenges for effective peatland management, including 1) substantial pressures from fires, water drainage, and peatland degradation, 2) potential development of multi-stakeholder partnerships among government authorities, private sectors, and community entities, and 3) some existing intervention programs introduced by various actors such as universities, private companies, and government [23,44,45]. Moreover, a total population of 77,064 [23,35] live inside the SKKI PHU, adding significant pressures on the peatlands due to increasing demands for lands and resources, especially water. Approximately 57% of the SKKI PHU is used as farmlands, particularly for oil palm plantations [46]. This land use pattern is expanding due to global demands for palm oil, putting agriculture and conservation at loggerheads. The study was conducted in five villages namely Buluh Cina, Gading Permai, Kepau Jaya, Pangkalan Serik, and Sungai Bunga, located from north to south of the SKKI PHU along the Kampar Kanan and Kampar Kiri River (Figure 1). Extensive peatlands fall within composite property rights regimes, ranging from private plantations to community forests, the protected area, peatland restoration sites, and public lands where local villagers accessed for peatland product collection.
Peat swamp forests in the SKKI PHU are part of the Sumatran lowland rainforests [46]. The BCNRP represents lush patches of the old-growth rainforest, riparian, secondary forests, and black water lakes (Figure 2A), intermixed with smallholder farmlands, specifically oil palm plantations, scattering throughout the park. Secondary forests, mainly from abandoned farmlands and clear-cut logging, can be observed inside and outside the BCNRP near water bodies. They created a mosaic vegetative landscape comprising mature and young trees, shrubs, and vines (Figure 2B). Moreover, oil palm plantations are the most extensive and prominent land use (Figure 2C), consisting of large-scale and smallholder operations. One national cooperative is managing massive palm oil production under a long-term concession in the SKKI PHU. Its approximate planting areas extend over 4,500 hectares with well-constructed infrastructure such as canals, transporting routes, housing, and a crude palm oil (CPO) mill [47]. Meanwhile, smallholder farmers own and/or lease an average of 1.5 hectares per household for oil palm plantations. Farmers usually sell oil palm fruits at a village co-operative or a private collecting site where all the fruits are supplied to the CPO production. Moreover, the river illustrates a complex wetland ecosystem network including numerous tributaries, oxbow lakes, and riparian vegetation (Figure 2D).

2.2. Scope of the Study

Low participation from relevant stakeholders hinders effective peatland management. Stakeholders do not fully comprehend intrinsic value of the peatland and direct impacts on their livelihoods from losing it, instead taking it for granted. Thus, they do not perceive the urgency of taking any action. Moreover, different ecological, social, and economic settings complicate people-landscape interplays [48,49]. Landscape characteristics such as land use/land cover [50,51], vegetation types [52], landscape history [53], sociocultural processes [54], and spatial arrangement [55] play a crucial role in determining the availability and functionality of the ES. In this study, we focused on key landscape characteristics within various ecological and socio-economic settings. They illustrate a spectrum of property rights regimes from private to state properties, common-pool resources, and open access. The majority of oil palm plantations are privately owned, while some are granted with usufruct rights for a specific time period, including smallholder and large-scale farmlands. Peat drainage systems are predominantly found in oil palm plantations, usually under private ownership. Common-pool resources exist intermixing within the protected area – the state property, such as peat swamp forests, peatland restoration sites, and peat domes. Enforcement of rules and regulations occurs to a certain extent to control access. Meanwhile, open-access or public lands such as fire-damaged zones, rivers, and patches of secondary forests allow free entrance to the resources without any rules and regulations. These diverse landscape components exert varying influences on ES provisions. For instance, the peat swamp forests are likely to provide high biodiversity and carbon sequestration services, compared to fire-damaged vegetation and oil palm plantations. Yet, oil palm plantations may offer substantial amounts of peatland products to local communities due to their accessibility.
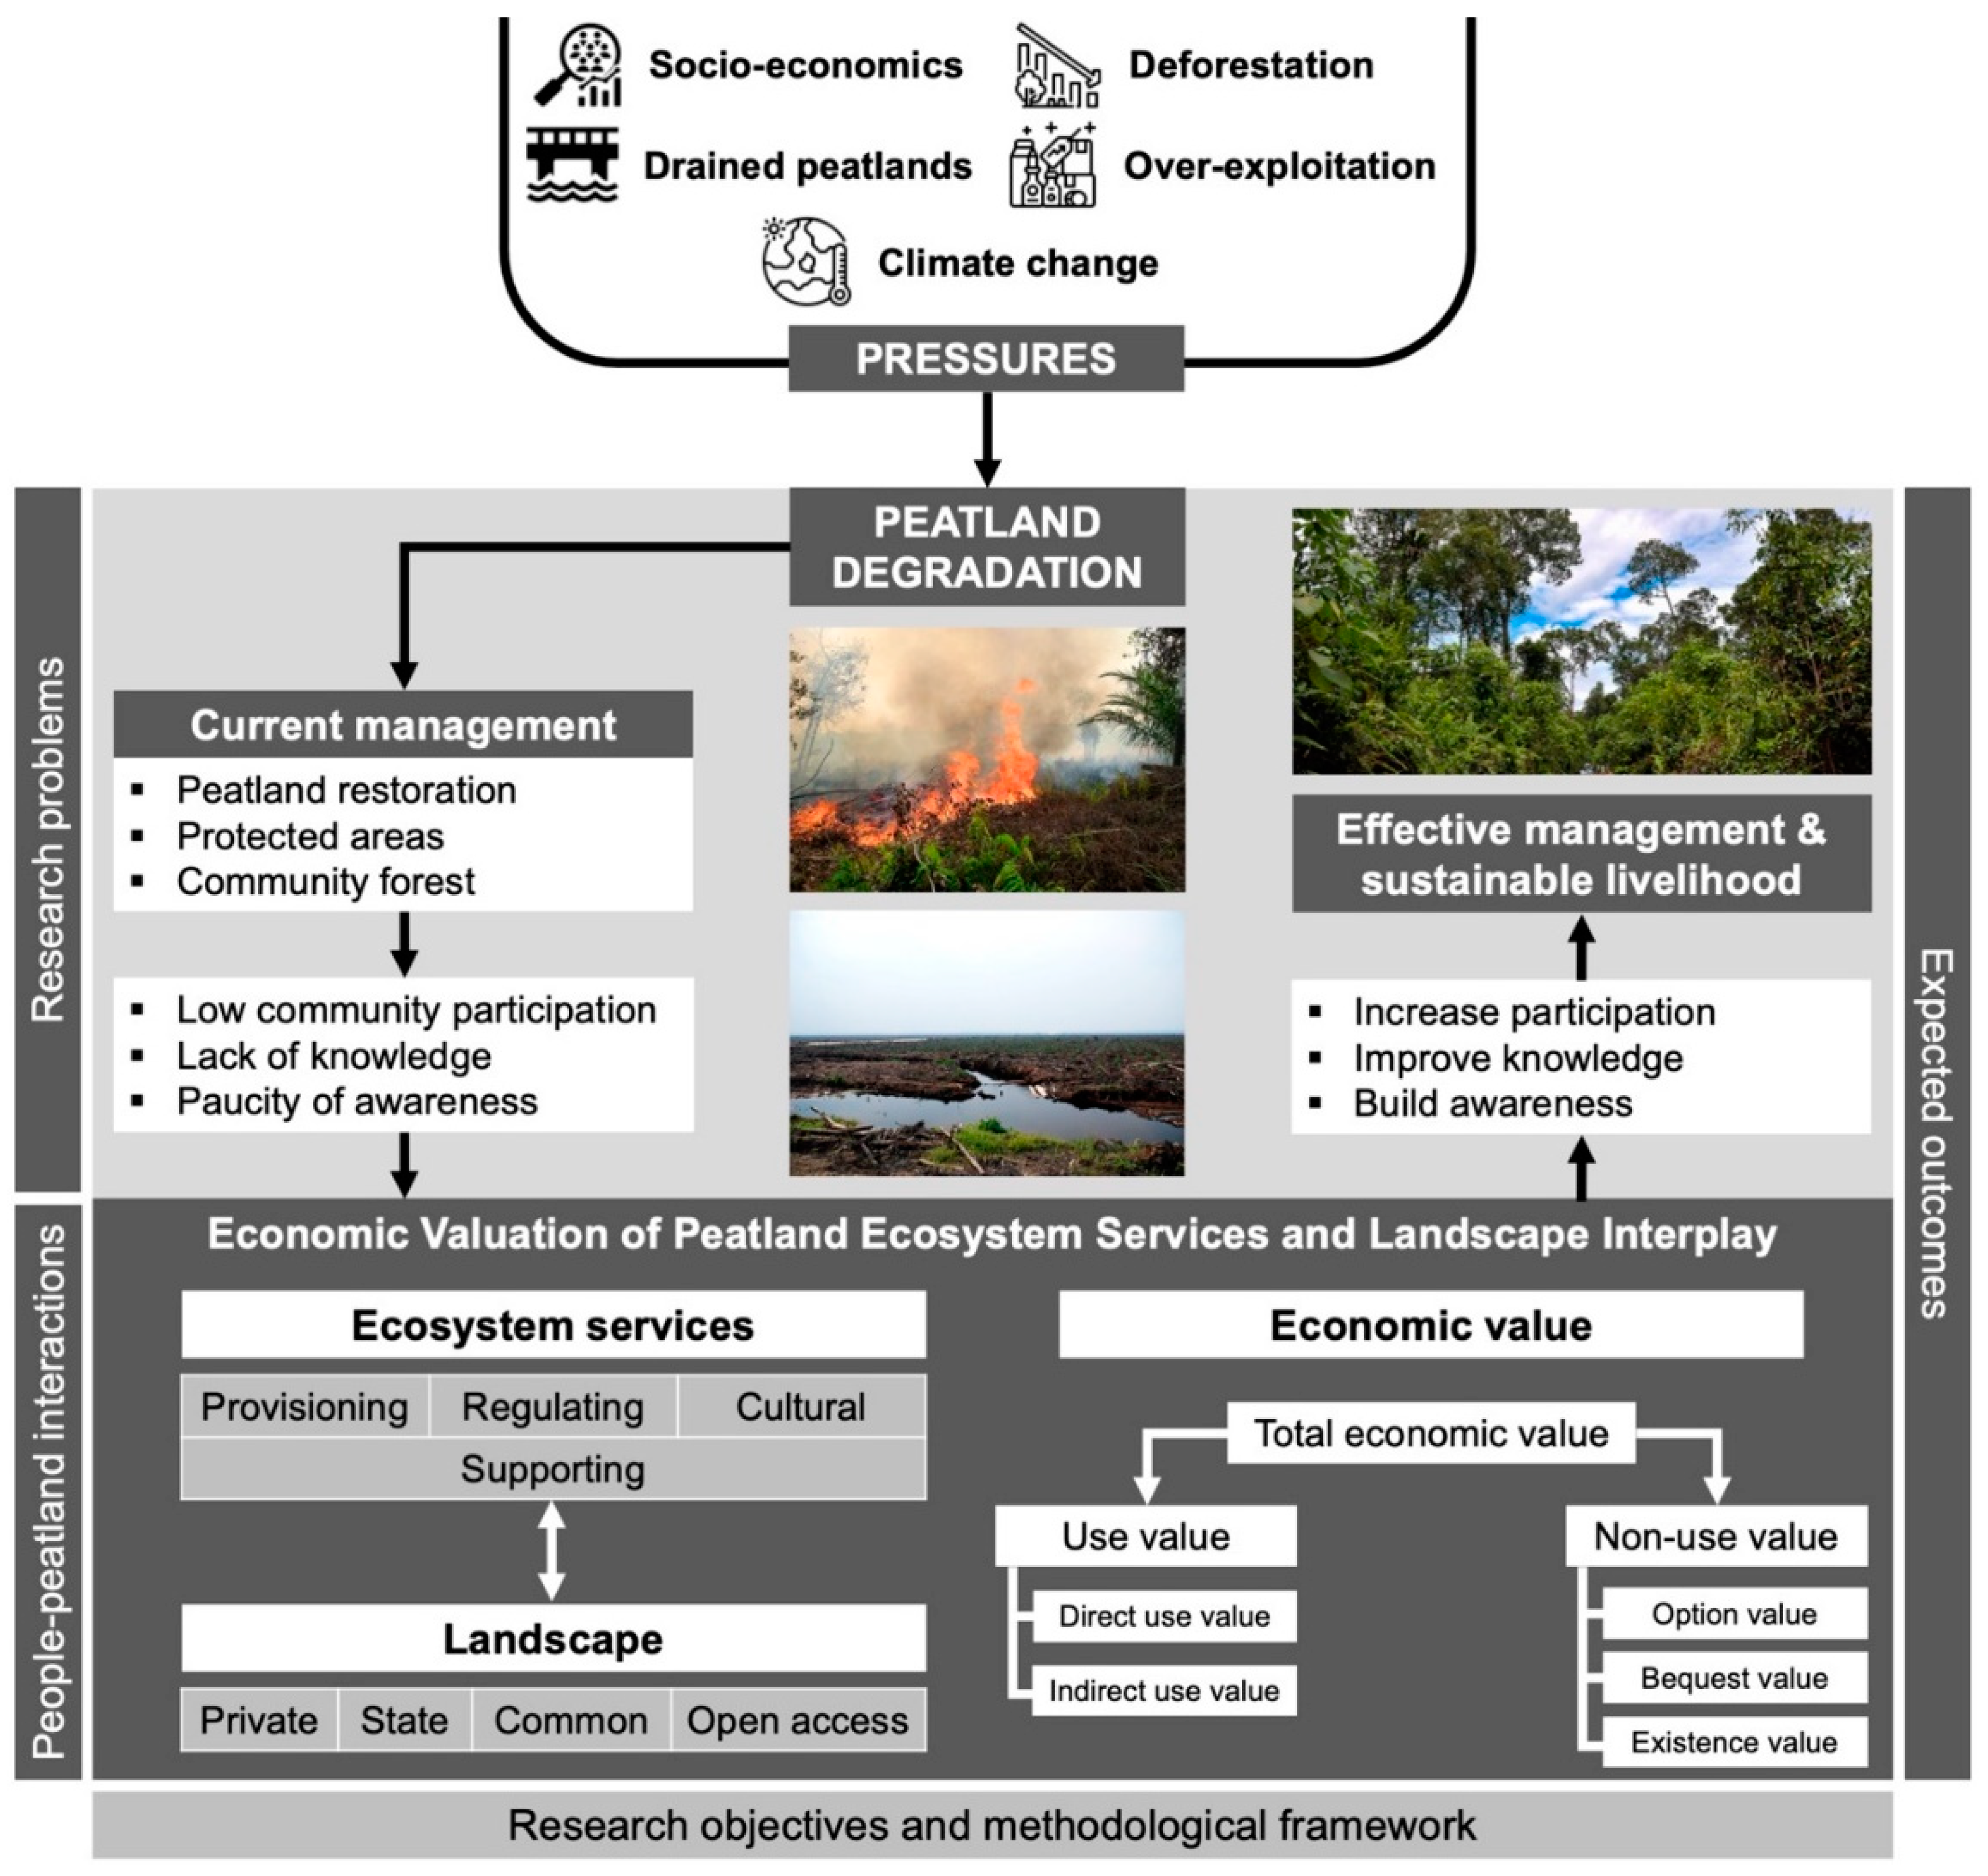
Figure 3 depicts the scope of the study, including research problems, objectives, methodological framework, and expected outcomes. We identified key peatland ES following the Millennium Ecosystem Assessment classification from various landscapes [34]. The TEV consists of use and non-use values of the peatland. The use value illustrates benefits people obtained from using ecosystem goods and services, including (a) direct use value representing consumptive use and non-consumptive benefits; and (b) indirect use value derived from ES that supports or protect an economic activity, rather than directly providing services or products to people. Meanwhile, the non-use value refers to benefits obtained without direct or indirect use of the resources, including (a) option value, illustrating a possible use of the resource in the future both directly and indirectly; (b) bequest value, illustrating the value people perceived to protect an ecosystem for future generations; and (c) existence value, derived from the existence importance of a particular ecosystem or species. The estimated TEV allows stakeholders to better recognize the ES value against other commodities and actions. Thus, it will help improve public knowledge, awareness, and willingness to participate in peatland management more actively.

2.3. Data Collection

The study consists of two main parts, namely 1) a comprehensive questionnaire of economic valuation, together with key informant interviews i.e., village leaders and local administration officers, and onsite observations; and 2) secondary data acquisition from relevant authorities and agencies e.g., the Ministry of Environment and Forestry, Nature Conservation Agency, Indonesia’s Central Bureau of Statistics, NGOs, the Kampar Regency Government, village administration offices, and universities. Both published and unpublished documents, including organizational reports, maps, research articles, regional statistics, and online databases were reviewed for data extraction. Simultaneously, the questionnaire and personal interviews were conducted in May and June 2023. With a total of 2,755 households in the five villages, the minimum sample size was determined as 96 up to 349 households, following Yamane’s formula [56] at 10% to 5% degree of error, respectively. Additionally, a recommended appropriate sample size for TEV measurement ranges between 200-2,500 [57]. We finalized the minimum sample size of 200 households (92% confidence) according to time, workforce, and budget availability. Subsequently, the number of samples from each of the five villages was determined by multiplying the proportion of the village’s number of households over the total number of households with 200.
The economic valuation questionnaire covers five parts: (1) Respondent’s household socioeconomic conditions, including personal information and household profile; (2) Ecological information and landscape characteristics near respondents’ premises, including land use types and distances to key peatland locations (Table 1); (3) Respondent’s perception on peatland importance by asking them to rate the peatland ES contributing to their household livelihoods on a Likert’s scale from 1 (slightly important) to 5 (very important); (4) Peatland product collection, including access frequency, amounts of harvest, and price of peatland products, and (5) Villager’s willingness to pay (WTP) for habitat and biodiversity protection. The questionnaire was approved by the Center for Ethic in Human Research Khon Kaen University with Record No.4.3.03:24/2566 and Reference No. HE663206. Amounts of economic values were computed according to monetary valuation methods presented in Table 2, and summed up to the TEV. Personal interviews of village leaders and local administrative officers were conducted to gather baseline data and crosscheck questionnaire data.

2.4. Measurement of the Total Economic Value of Peatland Ecosystem Services

Table 2 summarizes 14 peatland ES with different monetary valuation methods, including a market price, avoided cost, benefit transfer, and contingent valuation method. The market price method was employed to measure the direct use value of peatland goods and services including fish, wild plants and animals, fibers, medicines, soil fertility, and water usage based on existing market prices, multiplied by amounts of the ES utilized. Water price for household use was based on provincial regulations, and amounts of water required per person were calculated following the National Standardization Agency of Indonesia (m3/person/year). Meanwhile, water for agriculture was estimated from an irrigation water price in Petapahan Village, where a provincial irrigation project exists. We focused on water use for oil palm, coconut, rubber, and rice plantations since these were the most important agricultural products in the Kampar Regency [35]. The avoided cost method measured an indirect use value from fire prevention and an existence value of the peatland as spiritual and sacred forests. Pricing calculation was employed to simulate the value of the sacred forest if it were converted into an oil palm plantation. An average selling price of oil palm plantations was derived from household representatives’ responses. Subsequently, the price was multiplied by an average productive lifespan of oil palms i.e., 25 years.
Moreover, carbon sequestration was quantified using the benefit transfer method based on available data i.e., carbon credit prices, amounts of peatlands, and a number of carbon stocks at provincial, national, and regional levels. Amounts of carbon stock from each of the land use types were converted to tCO2 by multiplying it with a factor of 44/12 [58]. Table 3 presents detailed information on prices, quantities, assumptions, and data sources needed to estimate economic values of water usage, carbon sequestration, and sacred forest protection. Lastly, the contingent valuation method was used to measure non-use values by asking respondents’ amounts of WTP for peatland habitat protection and biodiversity conservation. Household representatives were provided with information on current status of the peatlands and ES, including threats, management challenges, and hypothetical conditions in which the peatlands were to be converted to other land use types, so habitat protection and biodiversity conservation projects were needed. Respondents expressed their WTP to support these programs from a list of offers, starting from USD 0.5 up to USD 5 per month, and a blank if they wanted to specify their own amounts of WTP.

2.5. Statistical Data Analysis

Descriptive statistics were calculated to summarize household socioeconomic conditions, perception, and peatland product collection practices. A range of variables were statistically tested to examine relationships between ES economic value and landscape characteristics. Two numerical values (1 for "no" and 2 for "yes") were assigned to determine landscape conditions in proximity to the respondents' premises, exemplified by inquiries like "Is the household situated within a protected area?". In order to classify the distance to different locations from the respondent's household, three distinct values were utilized: "1 = near" "2 = intermediate," and "3 = far" (Table 1). Independent t-tests were used to compare means of economic values between two groups of different land use conditions. Meanwhile, one-way analyses of variance examined different amounts of economic values across household-peatland distance categories. All the statistical analyses were run on SPSS version 28 [70].

3. Results

3.1. Household Socio-Economic Conditions and Livelihoods

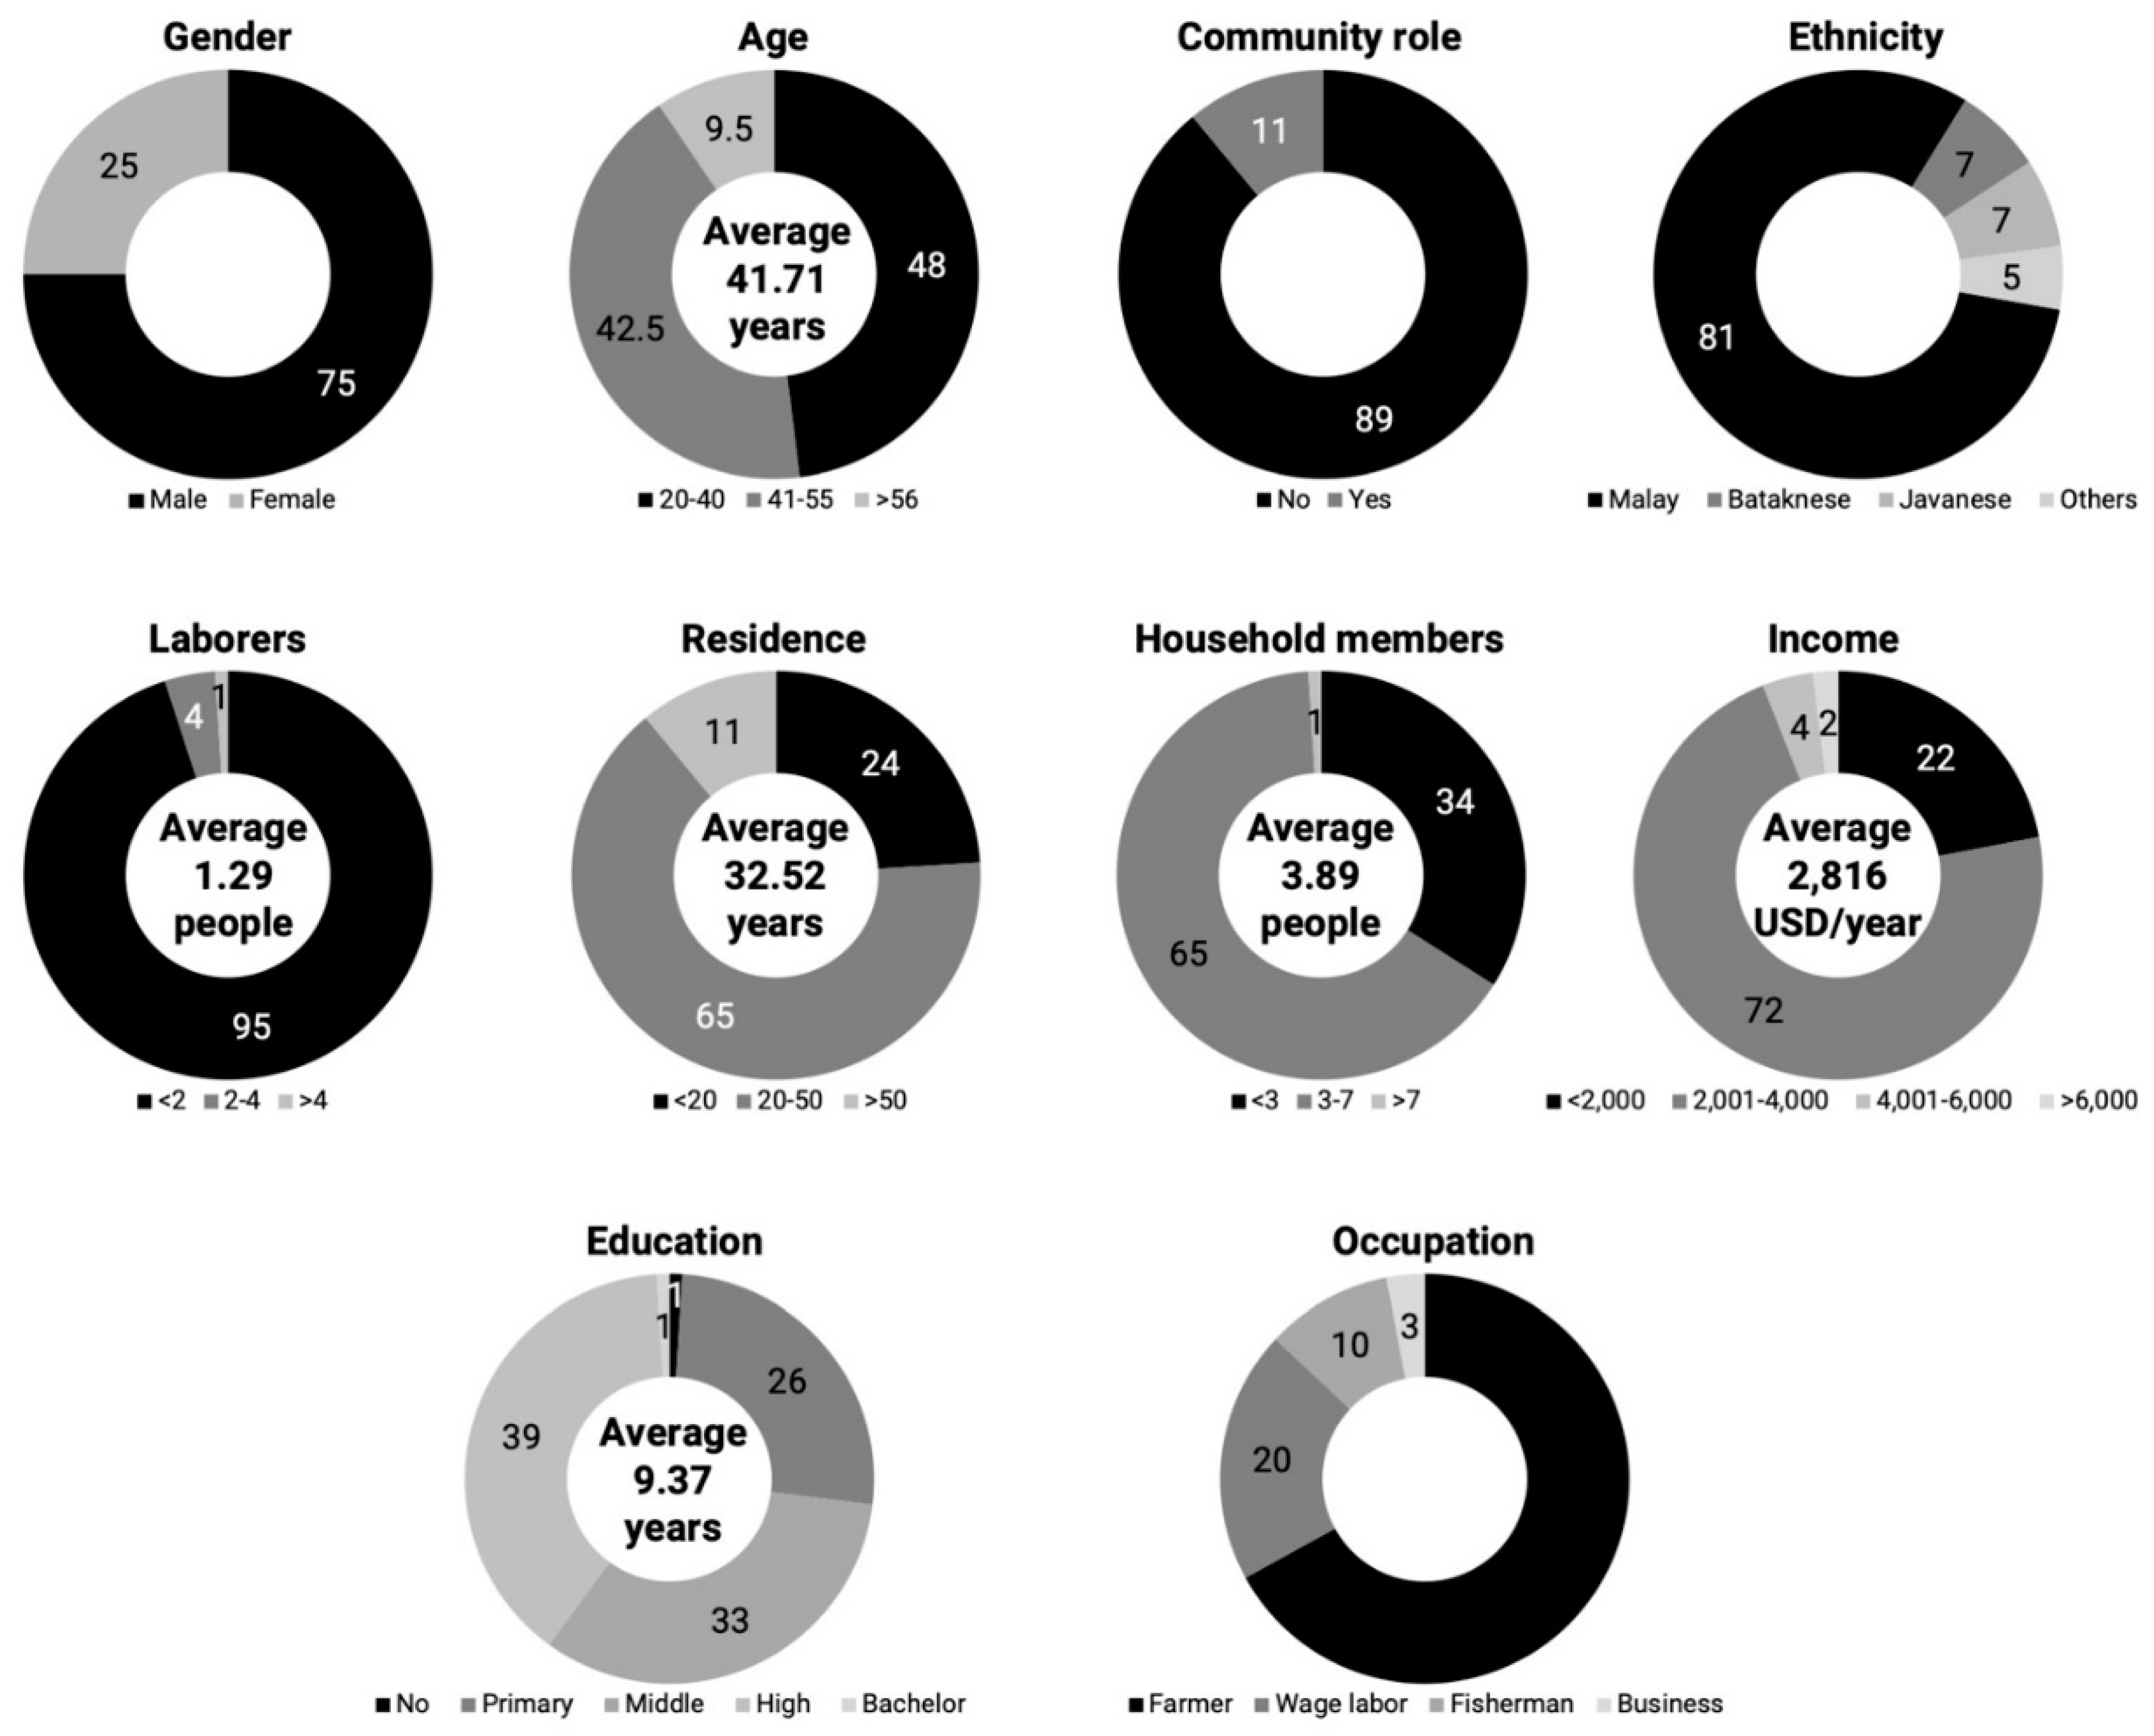
A total of 200 households described diverse socio-economic profiles. Respondents’ average age is 41.71 years old implying an active labor, capable of engaging in the workforce and contributing to various economic activities. Gender distribution illustrates traditional societal roles where men dominated the community and certain household activities such as agriculture, labor-intensive work, and household voice representation, made up 75% of the survey participants. Meanwhile, women usually dedicate more time to housekeeping and childcare with less expression outside their household. The majority of respondents have resided in this area for generations in which approximately 81% identified themselves as a local, specifically a Malay tribe. Some villagers moved in from nearby villages and provinces, including migrant workers in oil palm companies.
Villager’s education includes high school (39%), followed by middle school (33%), and primary school (26%). Higher education is not common in the area since younger generations, pursuing higher educational opportunities, often migrate to urban cities such as Bangkinang and Pekanbaru in search of better income and stable jobs outside agriculture, leaving behind their family on a farm. The average household members are 3.89 of which one to two were considered active laborers responsible for income generation. This illustrates a single or nucleus type of family rather than extended as used to be in the past. However, the primary occupation is still based on agriculture (67% of the respondents), especially oil palm and rubber plantations. Agriculture holds such prominence due to well-established social networks and communal support systems such as farmer co-operatives and labor-sharing traditions, molding local farming livelihoods and practices. Yet, subsistence agriculture has evolved toward commercial-based farming and agroindustry, especially oil palm and rubber plantations, creating new job opportunities in the area including migrant workers.
Average household income was USD 2,816 per year, falling much below provincial and national averages (i.e., USD 5,283.33 per year [71] and USD 4,798.12 per year [72], respectively). This income disparity suggests economic challenges, including low crop productivity, market price fluctuation, and high production costs, imposed on local villagers, especially farmers. Generally, the respondents are village members, while a small number served as village heads, religious leaders, local politicians, village health volunteers, and/or members of community initiatives such as farmer’s groups and customary institutions. These people gain better access to information, knowledge, and funding sources from outside agencies. Figure 4 summarizes respondents’ socio-economic profiles.
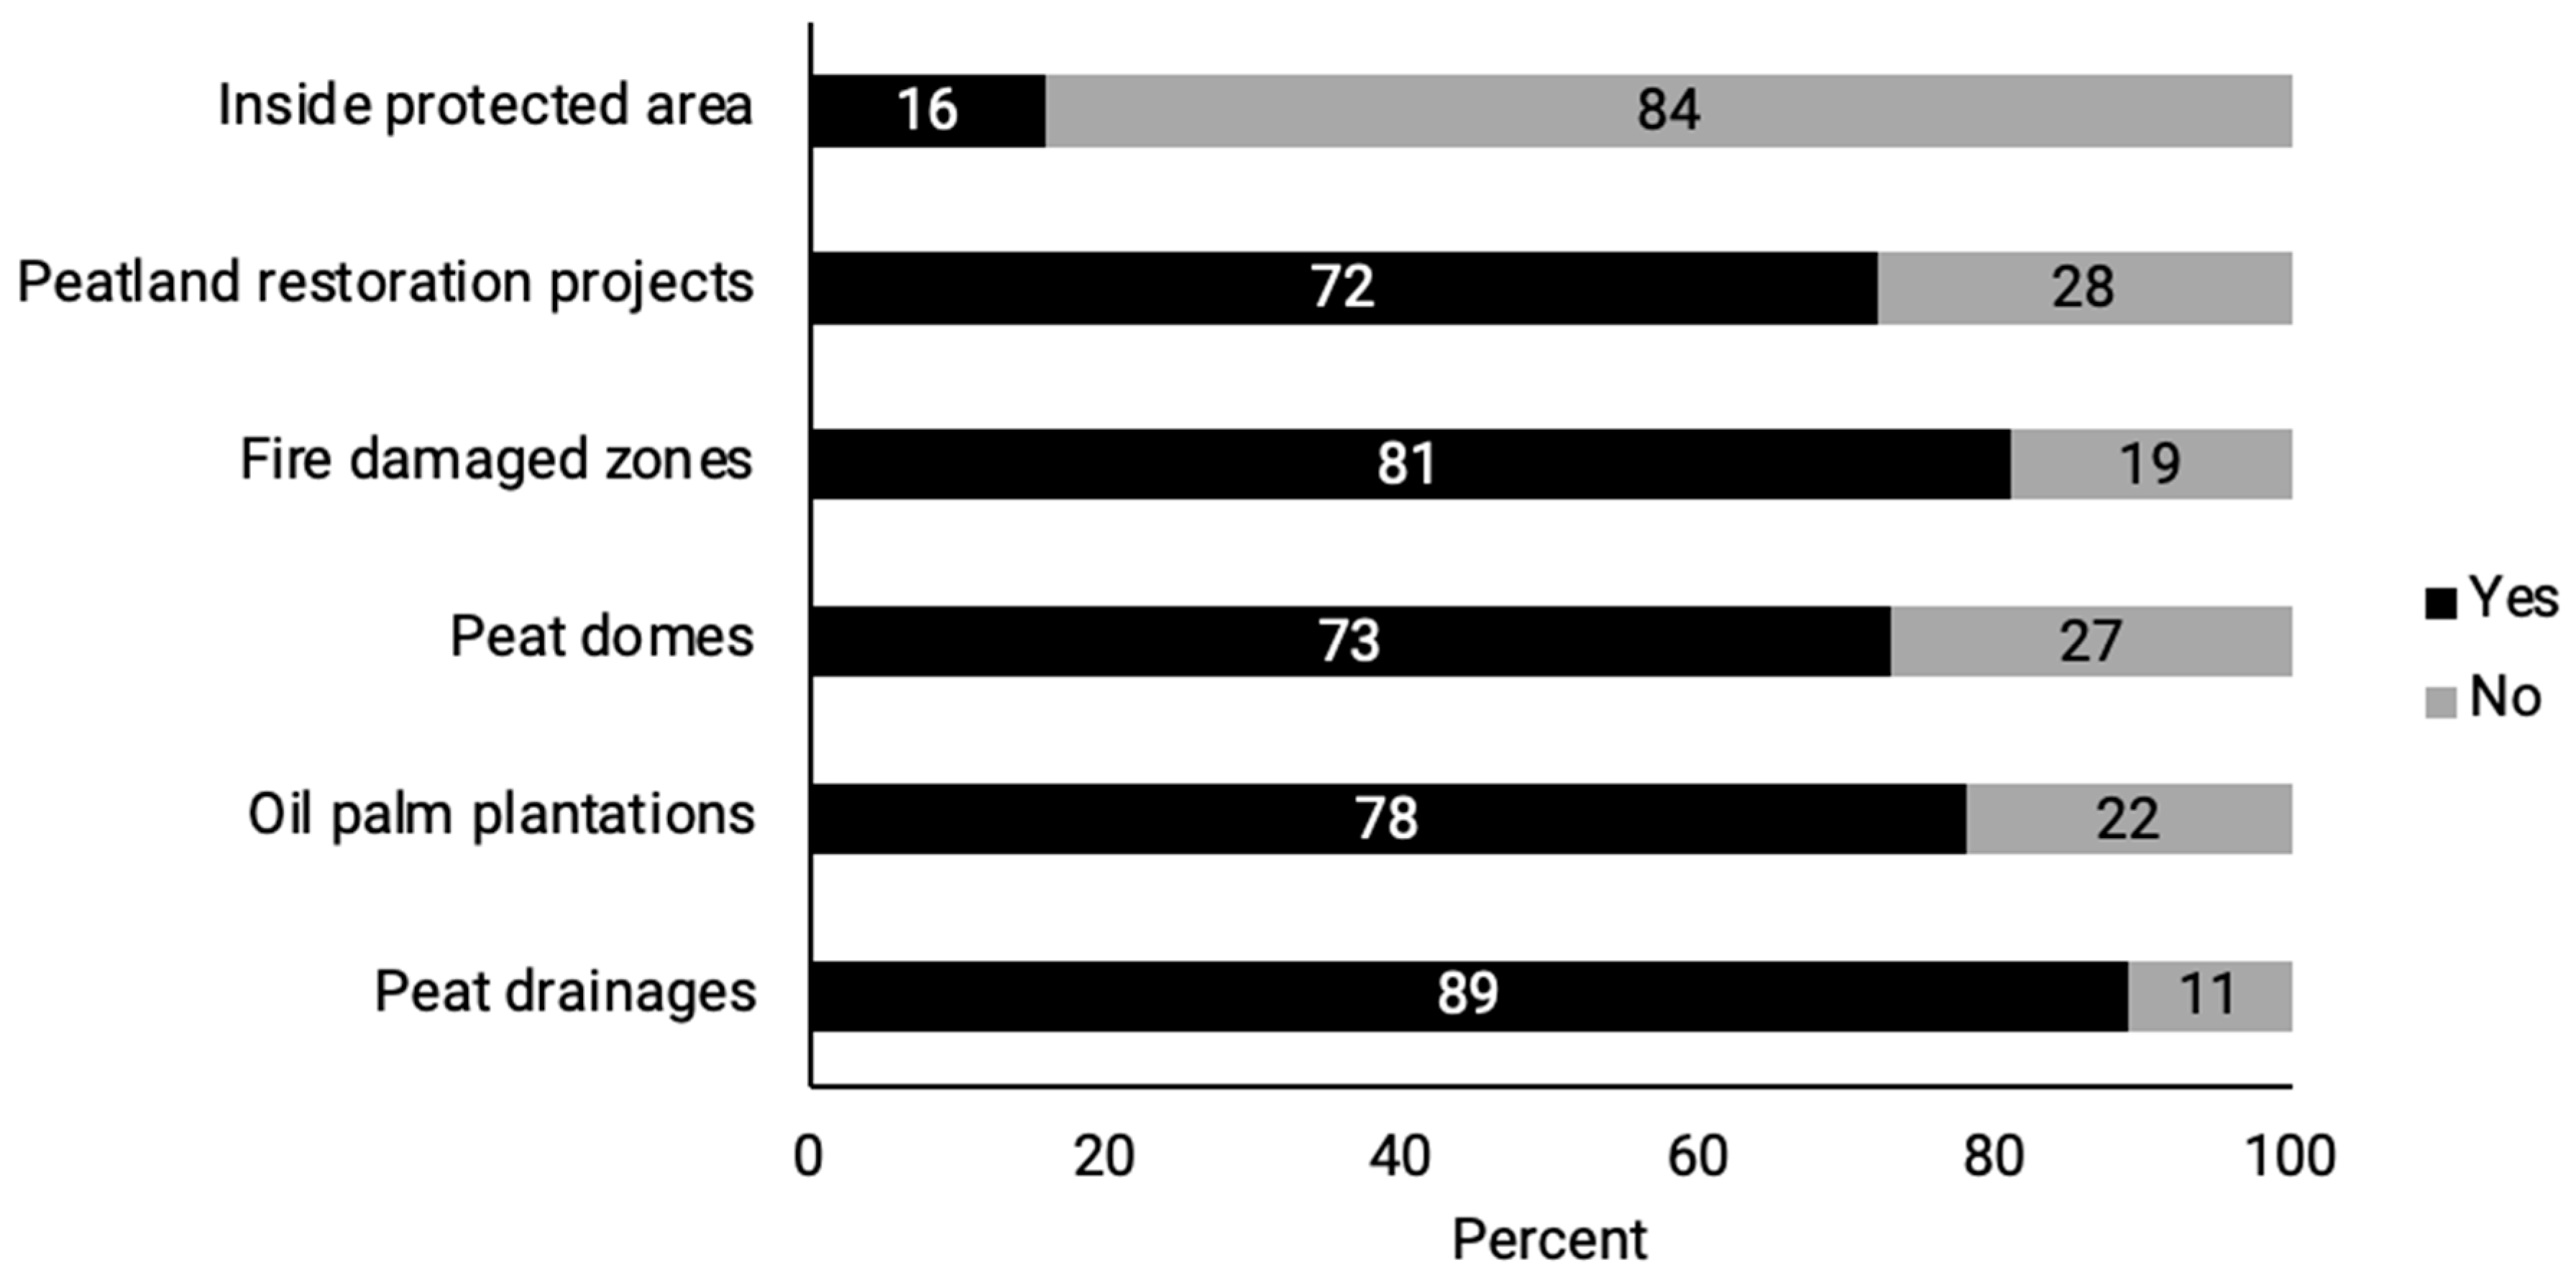
Approximately, two-third of the respondents held legal ownership: a title deed, over their lands. Meanwhile, 35% obtained a certificate of exploitation with granted usufruct rights without secure ownership, and 2% rented lands for farming activities. The average farm size is 1.57 hectares per household, and farmlands are usually located in peripheral areas of a residential zone. Some respondents lived inside the BCRNP, all of them from the Buluh Cina village. Establishment of the BCRNP requires them to follow certain rules and regulations, such as the Conservation Act No. 5 of 1990 and Forestry Act No. 41 of 1999, which prohibit them from engaging in activities inside the park. Although access to the protected area is limited, villagers can still access nearby secondary forests and oxbow lakes for fishing and collecting peatland products, such as seasonal fruits, fuelwood, medicinal plants, honey, mushrooms, and rattan. Approximately, 89% of the households were located near peat drainages (avg. 0.2 km distance), including canals and ditches built as part of a village irrigation system to drain water outside, making such areas possible for plantations. Moreover, 81% were located in close vicinities of fire-damaged zones. Wildfires occurred in 2015 and 2019, and affected nearly 129 hectares of peatlands. Subsequently, a peatland restoration project was introduced by the Ministry of Environmental and Forestry through the Natural Resource Conservation Agency (BBKSDA) – the main governmental authority responsible for the BCRNP management in collaborations with several agencies and community groups with special purposes (KHDTK) Kepau Jaya. The project aimed to restore fire-damaged peat swamp forests by planting multiple native trees such as balangeran (Shorea balangeran), geronggang (Cratoxylum arborescens), and gelam (Melaleuca cajuputi). These native vegetations are now recovering. Approximately 72% of the respondents said they lived near the restoration sites.
Nearly 78% of the respondents lived in or around oil palm plantations of different stages, including newly established plantations (within 1-4 years), mature and productive palms (> 4 years), and abandoned unproductive patches (> 25 years). This mosaic landscape depicts oil palm farm-based livelihoods. Local communities actively engage in various components of palm oil production including planting, harvesting fruits, processing, transporting palm oil products, and replanting the palms. These land use activities have shaped land cover, landscape conditions, and ES provisioning in the area. Lastly, approximately 73% lived near peat domes, located throughout the SKI PHU with average peat layer thickness of 1-3 m, less vegetation coverage, and limited access permission. Large peat domes are located near Buluh Cina, Kepau Jaya, and Sungai Bunga covering 10,866.24 hectares. Figure 5 illustrates different land use conditions near the respondents’ homestead.

3.2. Access to the Peatland and Product Collection

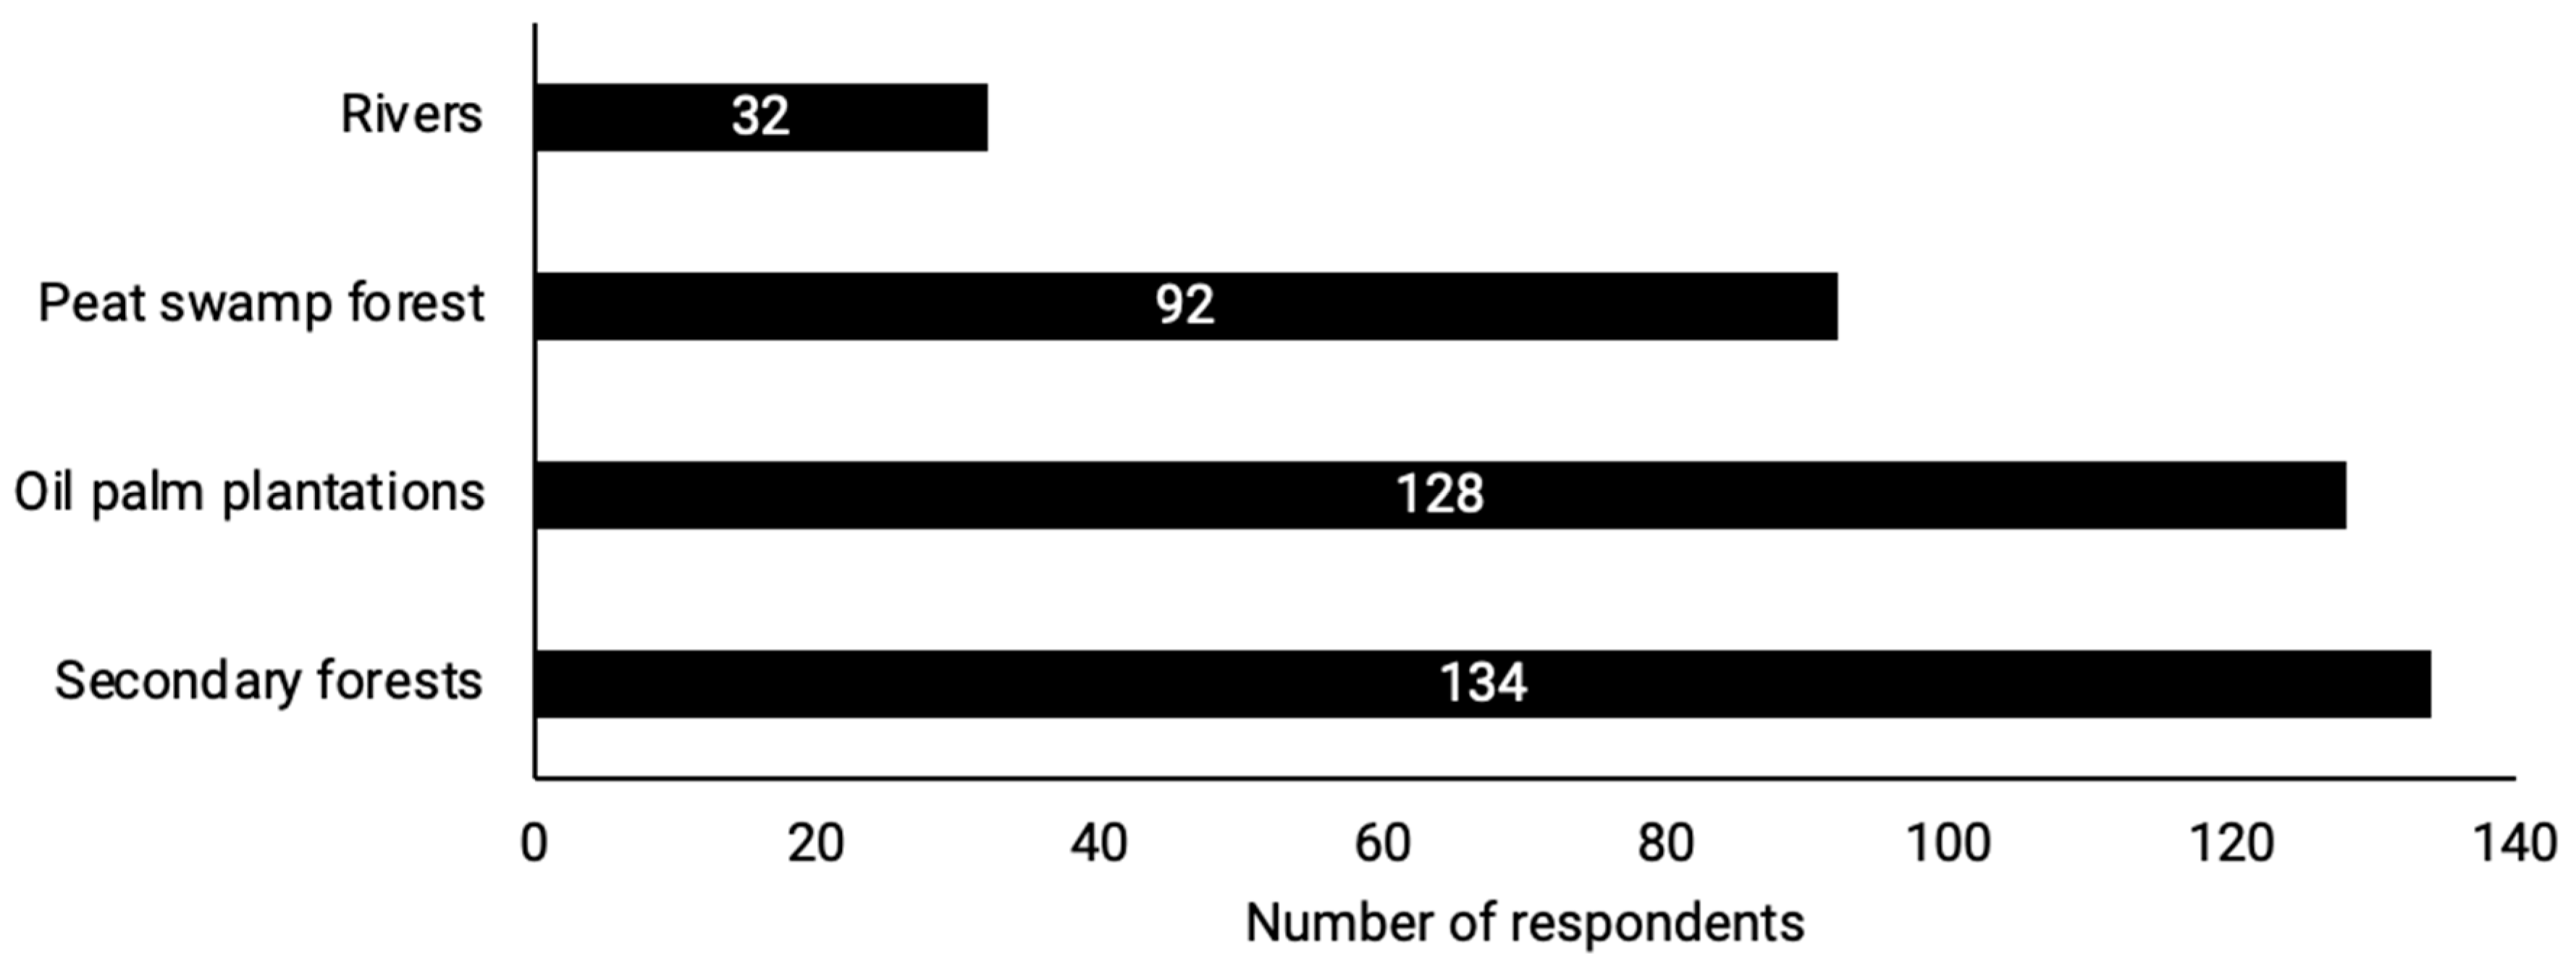
Accessing peatlands for product collection constitutes an integral part of community livelihoods in villages across the SKKI PHU. The majority of respondents (43%) engaged in this practice for household consumption, 38% for commercial purposes, and 19% for both household consumption and income generation. Secondary forests and oil palm plantations are the first two locations frequently visited by villagers for peatland product harvesting (Figure 6) since they are distributed throughout the area with easy access, available products, and minimal enforcement of rules and regulations when compared to the protected area. Although the river is open to everyone, it is infrequently accessed. Basically, a group of villagers living nearby used it for fishing, domestic water use, irrigation, and transportation. Meanwhile, access to peat swamp forests located in specific areas, especially ones inside the BCNRP, is limited due to enforcement of rules and regulations and long distance for villagers from other villages, except the Buluh Cina village.
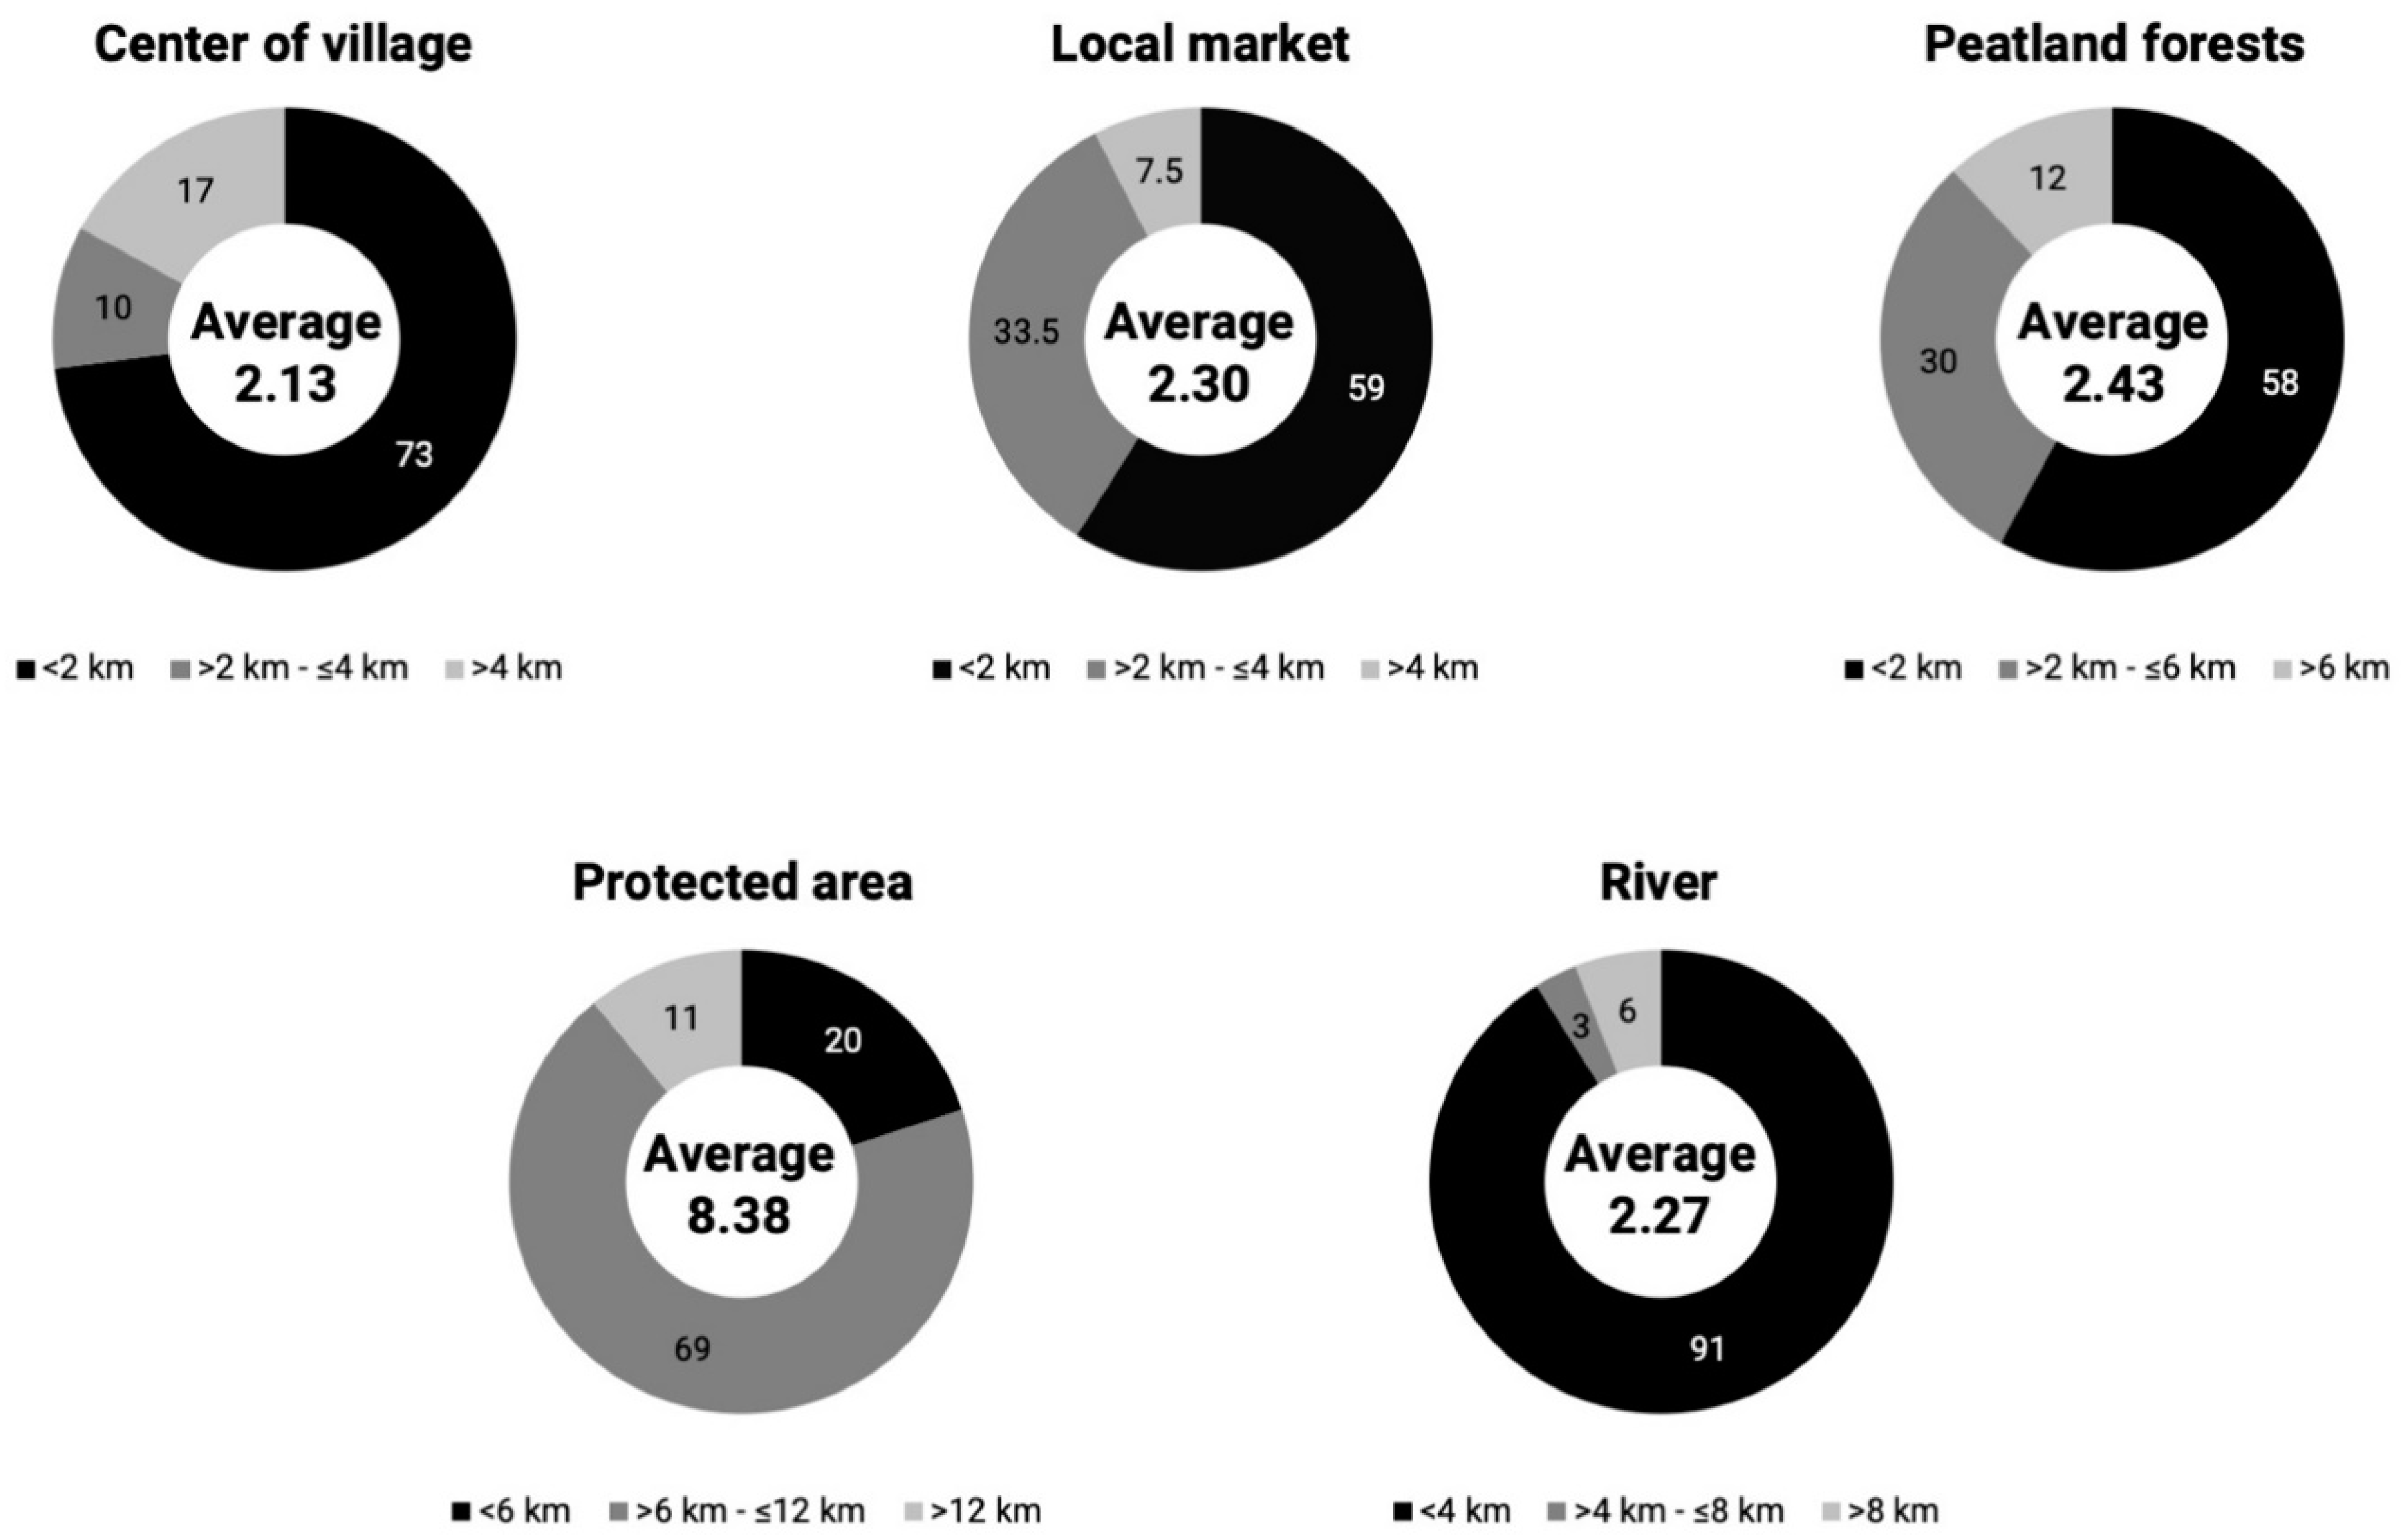
Figure 7 depicts distances from respondents’ households to main locations in a village within averages of 2.0 km, except a distance to the protected area. A close distance to the village center allows villagers to conveniently access educational facilities, healthcare services, transportation, government centers, and communal spaces. Similarly, a close proximity to local markets helps villagers to have easy access to market goods and services either as a seller or buyers. Over half of the respondents (59%) reported living near a local market, including a daily market with permanent structures and a weekly market with extended open spaces for temporary stalls. These markets draw not only local residents but also people from neighboring villages. Many villagers sell their peatland products, including fish, wild plants, wild animals, honey, and various seasonal fruits here.

3.3. Total Economic Value of Peatland Ecosystem Services

Table 4 exhibits a list of peatland ES and its economic value. Approximately, 80.85% of the TEV illustrate use value, including direct and indirect benefits obtained by households. This finding shows a similar picture with prior research studies conducted in Indonesian peatlands, underlying the importance of use value, especially from fisheries and oil palm plantations [73,74]. Fish accounted for the highest amount of the use value and TEV with average USD 807.56 per household per year, or nearly 30% of the household’s annual income. This emphasizes the crucial role of peatlands in providing ecosystem goods and services, especially fish and other aquatic plants and animals, that subsequently support local livelihoods. Fishing activities usually take place in riverside villages i.e., Buluh Cina, Kepau Jaya, and Sungai Bunga, with the majority of Malay descendants and deep fishermen root and culture [75]. Each year nearly 50 tons of fish are locally traded, generating essential cash income for households through direct sales or fish processing (e.g., dried fish, fish crackers, and fish shredded), while saving large amounts of household spending from fish consumption. Common fish species captured include baung (Mystus nemurus), baung pisang (Mystus micracanthus), ingir-ingir (Mystus nigriceps), baung geso (Mystus wyckii), sengarat (Belodontichthys dinema), selais (Krytopterus palembangensis), selais budak/Lais padi (Krytopterus schilbeides), and tapah (Wallago leeri).
Furthermore, soil fertility, specifically for oil palm, rubber, coconut, and rice cultivations, was estimated the second highest amount of the TEV with average USD 708.96 per household per year, approximately 36% of the total use value. Oil palm plantations were estimated around 41,414 hectares of which 30,332 hectares were part of industrial oil palm plantations and 11,082 hectares of smallholder oil palm plantations [46]. These accounted for 57% of the SKKI PHU’s total area, the largest proportion among other cash-crop plantations. Growing global demands for oil palm products drive farmers to increase their productivity, and farmland expansion into nearby peatlands is inevitable. Conversely, collection of mushrooms and wild plants (e.g., fiddlehead ferns, cassava leaves, and taro) for food, ornamental and medicinal purposes, fibers, and other products contributed only minor proportions to the TEV. A similar pattern was observed in wildlife hunting, including birds, wild boar, jungle fowl, and honey. Decreases in game hunting may result from wildlife population reduction due to habitat conversion and deforestation. Meanwhile, water provisions for agriculture and household use were estimated at USD 63.77 and USD 57.82 per household per year, respectively.
Indirect use value of the peatlands involves fire prevention and carbon sequestration. Fire prevention exhibits a natural mechanism curbing outbreaks and fire escalation, thereby safeguarding not only the peatland but also surrounding environments. The waterlogged nature of peatlands establishes a built-in barrier against fires [76]. The government's budget allocation on peatland protection and fire damage compensation is one measure of its economic value. Averaged amounts of USD 69.85 per household per year (12.06% of the indirect use value) imply a financial commitment to averting fire-related crises and consequential losses villagers encountered. Moreover, the peatlands’ carbon sequestration was estimated at USD 509.49 per household per year, accounting for 87.94% of the indirect use value, underlying its importance in climate change mitigation. Finally, non-use value accounted for 19.15% of the TEV of which an existence value associated with spiritual, sacred, and religious significance of the peatlands was measured at USD 604.48 per household per year or nearly 100% of the non-use value. It demonstrates cultural and emotional connections between people and the peatlands. Meanwhile, bequest values, estimated by measuring villagers’ WTP for biodiversity conservation for future generations, were accounted for less than 1%. Amounts of WTP depend on villagers' preferences and socioeconomic backgrounds [77]. Although villagers may perceive clearly the peatland's importance as biodiversity reserves for future generations, when comes to actual payment villagers made decisions based on their current conditions, especially under an income constraint. This reveals a time preference action when short-term benefits outweighed uncertain returns in the long run.

3.4. People – Peatland Landscape Interplay: Ecological and Socio-Economic Settings Determining Amounts and Economic Value of Ecosystem Services

Peatlands provide varieties of ES with substantial amounts of economic value. The estimated TEV of USD 3,174.31 per household per year is nearly 1.5 times larger than the average annual income (USD 2,816 per household per year). The direct use value alone generated 70.44% of the household income and added up 12.27% to it from saving household expenditure. However, these collective amounts of benefits are likely overlooked, making peatland protection a priority after other land use activities such as agricultural expansion, infrastructure construction, and land development. Deforestation and peatland degradation can be expected, which in return exacerbate peatland ES provisions and local livelihoods. In this section, we reveal people and peatland landscape interplays reflecting on how ecological and socio-economic settings influenced amounts and economic value of the ES.
Independent t-tests compared the means of TEV obtained by households between those were located inside/near vs. outside/far from different ecological landscape settings namely 1) the protected area, 2) peatland restoration sites, 3) fire-damaged zones, 4) peat domes, 5) oil palm plantations, and 6) peat drainage canals and ditches. These ecological settings superimpose upon a range of property rights regimes that to a certain degree determine user perceptions and actions. The average TEV obtained by households located inside or near the protected area was significantly higher than what benefited those living outside (Table 6). The BCNRP is protected in which certain activities i.e., logging and large-scale agriculture, are strictly prohibited. However, villagers can access nearby secondary forests and oxbow lakes for fishing and collecting peatland products, such as seasonal fruits, fuelwood, medicinal plants, honey, mushrooms, and rattan, generating large amounts of use value. A similar pattern was observed between a group of villagers who lived near vs. far away from fire-damaged zones. Succession is taking place where certain fire-resistant species such as mushrooms and fiddlehead ferns reoccupied the fire-damaged areas extensively, providing great sources of food and fibers. Access to the fire-damaged zones is also open to everyone. Moreover, households inside or near fire-damaged zones received damage compensation from the government, which added up to the TEV.
On the other hand, respondents who lived near peatland restoration sites, peat domes, and peat drainages gained smaller amounts of the TEV than those who lived farther away. Restoration efforts such as rewetting and revegetating temporarily prohibit certain activities, especially peatland product collection and farming, limit villager’s access, and subsequently reduce economic benefits. Meanwhile, peat domes are prone to wildfires, resulting in strict enforcement of rules and regulations, which lessens villager’s access for peatland product harvesting and farming activities. Lastly, peat drainage infrastructure construction i.e., canals and ditches altered hydrological and ecological conditions in the area and its vicinities, directly affecting ES provisions, especially fishery and water resources.
Table 5. Comparison of averaged total economic value from different peatland landscape conditions near the respondent's households.
No. Landscape condition Main PPRs No, I didn’t live inside/near Yes, l lived inside/near t p-value
Mean SD Mean SD
1 Protected area S 2,549.43 2,965.07 6,454.91 2,378.79 -8.158 <0.001
2 Restoration site S, C 4,333.70 2,765.48 2,723.44 3,269.31 3.259 0.001
3 Fire damaged-zones O 2,214.21 2,639.55 3,399.52 3,299.34 -2.064 0.040
4 Peat domes S, C 4,452.89 3,386.90 2,701.41 3,022.59 3.520 <0.001
5 Oil palm plantations P 3,637.95 4,711.55 3,043.54 2,648.13 0.802 0.426
6 Peat drainages P 4,938.32 2,329.73 2,956.29 3,244.05 2.776 0.006
Note: PPRs = property rights regimes, P = private land, C = common property, S = state property, O = public land/open access.
In addition to t-tests, we ran one-way analyses of variance (one-way ANOVA) and Games-Howell post hoc tests to investigate how different distances from a household to certain locations influenced the TEV (Table 7). Distances to a village center, to peatland forests, and to the protected area affected amounts of ES obtained by households, demonstrating significant differences in the TEV. Households located near a village center accumulated higher amounts of the TEV than those located farther away. The village center usually serves as a hub for social interactions and community networks, fostering knowledge-sharing, cooperation, and collective resource management. As residents became more informed, cooperative, and engaged in resource management, they hold a better position to utilize and conserve ES effectively. Well-developed basic infrastructure and facilities, encompassing education, transportation, and information, in proximity to the village center, promote economic activities, especially trading. Roads and bridges allow easy access to the peatlands and markets, triggering resource exploitation. They are considered the key basic infrastructure for palm oil production and other agricultural activities, allowing quick and easy transporting of products from production sites/farms to markets and customers. Meanwhile, access to information helps villagers make better decisions and act accordingly. Receiving information on fishing peak season and environmental conditions (weather and river water level) allows fishermen to better decide whether to go out fishing or stay. Furthermore, access to market information, especially demands and prices, is very helpful for fishermen to plan their catches and supplies to the market.
The TEV obtained by villagers residing near peatland forests e.g., peat swamps and secondary forests, was significantly higher than those living farther away. Peatland forests, especially swamp forests, provide great habitats for various aquatic and terrestrial species. The waterlogged nature creates diverse aquatic habitats for fish and other aquatic animals. Many fish species depend on peat swamp forests for their spawning and hatching. Moreover, many plants such as bamboo (Bambusa sp), rattan (Calamus sp), pandan (Pandanus sp), and rengas (Gluta sp) grow in peat swamps, serving as sources of food, fiber, medicine, and construction materials. Villagers living near peat swamp forests usually possess traditional knowledge to harvest them. One-way ANOVA confirmed residents situated near the protected area obtained greater amounts of the TEV than those residing far away. Although access to pristine forests inside the protected area is limited, villagers still go to secondary forests or oxbow lakes for fishing and peatland product collection. Furthermore, living near the park enables villagers to uphold robust connections with their ancestral land and heritage, thereby preserving their culture and traditions, and fostering a sense of belonging. Respondents living in/near the park expressed greater amounts of the WTP compared to those residing in longer distances, resulting in higher TEV.
Table 6. Different amounts of TEV of peatland ecosystem services across different distance classes from various locations to the respondent’s household.
No. Variables TEV F p-value
Mean SD
1 Center of village
Near (0 – 2 km) 3,576.87a 3,541.00 4.433 0.013
Intermediate (>2 km <4 km) 1,925.55b 1,101.69
Far (> 4 km) 2,180.26b 1,938.53
2 Local market
Near (0 – 2 km) 3,201.59 3,288.55 0.012 0.988
Intermediate (>2 km <4 km) 3,125.18 3,348.17
Far (> 4 km) 3,179.18 1,855.47
3 Peatland forests
Near (0 – 2 km) 3,774.70a 3,855.34 5.040 0.007
Intermediate (2.1- 6 km) 2,300.69b 1,752.95
Far (> 6 km) 2,456.52b 1,655.47
4 Protected area
Near (0 – 6 km) 7,405.62a 4,038.62 76.442 <0.001
Intermediate (>6 km <12 km) 2,162.75b 1,875.79
Far (> 12 km) 1,826.30b 1,347.37
5 River
Near (0 – 4 km) 3,324.80 3,309.25 2.669 0.072
Intermediate (>4 km <8 km) 2,617.87 840.40
Far (> 8 km) 1,170.10 1,118.11
Note: Different superscripts (a and b) represent significant variations between groups at the 0.05 level based on Games-Howell post hoc paired comparisons.

4. Discussion

The study yields compelling evidence of peatland contributions to local livelihoods reflecting in substantial economic value. The findings align with previous research in various provinces in Indonesia, especially provisioning and regulating services i.e., food, freshwater, raw materials, timber, and carbon sequestration [73,78,79,80,81,82,83,84,85,86]. Provisioning services provide basic necessities for a good life; while regulating services check and balance the entire ecosystem from local up to global scales, constituting to good life, security, and health [34,87,88]. Peatland is one of the global ecosystems that largely sequesters carbon, estimated approximately 0.37 GtCO2 yearly, regulating the global climate [89]. Degradation of peatlands signalizes deterioration of such provisioning and regulating services, posting direct impacts on our wellbeing. Our research exhibits the amount of economic value each household (USD/household/year) gained from the peatlands, depicting importance of peatland ecosystem services that support the livelihoods of local communities.
The proximity to different peatland locations with various ecological and socio-economic characteristics influences the economic value of peatland ES. Certain ecological and socio-economic settings enhance and/or limit economic benefits due to site accessibility and resource availability. A study in Indonesia's Giam Siak Kecil-Bukit Batu Biosphere Reserve revealed different economic values between forest-dwelling communities in core and buffer zones. Smaller amounts of economic value generated from the core zone were based on valuable non-timber forest products (NTFPs), whereas benefits from the buffer zone basically came from fisheries and logging. Communities near the Merang Kepayang peat swamp in South Sumatra obtained higher benefits from water resources for household consumption and transportation than villages located farther away [90].
Understanding comprehensive interplays between people and peatland landscapes requires consideration of ecological and socio-economic contexts on a broader scale. While previous studies usually focused on specific landscapes e.g., fire-damaged areas, protected areas, and plantations [77,91,92,93], or particular types of ES e.g., carbon storage [86] and collection of oil palm fruits, rubber latex, and NTFPs [74,74,84,85,93,94], our study included the extensive array of landscape characteristics with different land use conditions, property right regimes, and geographical distances from user households to the source and key community locations. We observed interchangeable influences among ecological and social economic settings. Ecological conditions primarily determine resource abundance and availability, but accessibility either a physical distance or property rights regimes finalizes amounts of accrued benefits. A short distance to peat swamp forests and protected area makes nearby communities easy and regular access to ecosystem goods and services, because villagers spend less time and effort obtaining resources. Household dependence on the resources decreases with increasing distances from the resource base to households [95,96,97]. Although protected area relatively contains pristine ecosystems and high biodiversity, implying plentiful resources, strict enforcement of rules and regulations limits user access so lessening amounts of benefits. However, our study reveals otherwise due to implementation of community-based protected area management where villager access for farming, NTFP collection and fishing is permitted inside the park. Rules and regulations are flexible to match local conditions and prevent land use conflicts. This practice compromises between ecosystem protection and livelihood maintenance, incurring both tangible and intangible profits to the locals.
Substantial benefits from the protected area – the compound of peatland ecosystems, including peat swamp forests, oxbow lakes, and forest-farm interfaces, under the protected area co-management, constituted the greatest TEV. Nonetheless, we observed concerning evidences of illegal logging, land encroachment, and agricultural expansion, specifically oil palm plantations inside the park. Thus, clear spatial demarcation, land use zoning and robust enforcement measures to safeguard ecological integrity are needed [98]. Pristine habitats require rigorous protection with limited access, especially for direct exploitation such as farming, grazing, and harvesting of peatland products – the core zone boundary. Meanwhile, adjacent areas can be designated as a buffer – the buffer zone, where community activities are allowed to reduce tension for land use and resource needs but with integration of sustainable agriculture and agroforestry.
Active engagement of local communities in peatland conservation and protection is also of paramount importance. Local communities are expected to work with local and national governments to ensure better management and sustainable use of natural resources since they are familiar with the area and know what they need with local wisdom and knowledge. Participatory-based management empowers residents in decision-making in land use management as evidenced in several community forestry programs [99]. However, adequate support from relevant authorities is needed, especially capacity building and benefit-sharing arrangements such as community workshops, outreach programs, and integration of local ecological knowledge, to incentivize community participation in peatland stewardship, including [27,100]. The substantial economic importance of peatlands presents itself for the exploration of economic diversification. This encompasses the promotion of alternative livelihoods, including ecotourism, aquaculture, and sustainable agriculture, aiming to reduce household’s dependence on peatland resource extraction.
Finally, given the significant value from carbon sequestration revealed in our findings, it is important to integrate economic valuation of peatlands into broader climate change mitigation and adaptation strategies. Effective peatland protection can help reduce enormous greenhouse gas emissions. Quantified economic value of provisioning services, carbon sequestration and others can inform policy makers to make long-term commitment on peatland conservation and protection, against short-term benefits from land development [101,102]. Additionally, knowledge exchange through research dissemination and capacity-building programs is a key to empowering local communities and stakeholders to make decisions that support peatland conservation. Initiatives to integrate scientific findings with indigenous knowledge systems through participatory approaches have shown promise in fostering sustainable peatland management [103]. By elucidating tangible long-term benefits provided by the peatlands, we can prevent taking them for granted and motivate urgent efforts from all stakeholders to ensure their sustainable functions amidst growing pressures.

5. Conclusions

Our study reveals substantial economic benefits provided by peatland ecosystems in Riau, Sumatra, Indonesia. The total economic value was estimated USD 3,174.31 per household per year, approximately 1.5 times higher than the average household income. Provisioning services, especially fisheries, constituted the bulk of use value that directly support local livelihoods. This quantifiable reliance signifies vital connections between people and peatlands. Proximity to intact peat swamp forests further enables more efficient capture of provisioning services. However, degradation can disrupt this relationship and the flow of benefits. Therefore, effective management is crucial through key strategies namely spatial zoning and protected area co-management to balance conservation and livelihood maintenance by fostering local stewardship. Illuminating the tremendous economic values at stake, this study underscores the needs to preserve precious peatland ecosystems before their services that sustain communities are jeopardized.
To better understand the full economic value of peatland ES, further research studies are needed. Investigating economic benefits of regulating services such as flood mitigation, pollination, erosion protection, and water purification is suggested. Many of these services are not marketed and their connections to ecosystem functions are poorly understood. Quantifying their value can provide a more comprehensive perspective. It is also important to integrate cultural, spiritual, and aesthetic values into economic valuation of the peatland ES. Capturing these intangible values can foster stronger community stewardship because they encourage a sense of belonging and responsibility. Moreover, long-term monitoring of ecosystem services and economic value is important to discerning drivers of change, assessing resilience, and evaluating policy effectiveness for optimized management. Comparative analyses across diverse peatland types such as coastal, brackish, and freshwater peatlands can reveal distinct ecological and socio-economic factors that determine economic value. This can delineate general patterns versus context-specific determinants to inform tailored management strategies adaptable across settings.

Author Contributions

Conceptualization, M.Y. and A.P.; methodology, M.Y. and A.P.; software, M.Y.; validation, M.Y. and A.P.; formal analysis, M.Y.; investigation, M.Y.; resources, M.Y.; data curation, M.Y.; writing—original draft preparation, M.Y.; writing—review and editing, A.P. and H.B.; visualization, M.Y.; supervision, A.P. and H.B.; project administration, M.Y.; funding acquisition, M.Y., A.P. and H.B All authors have read and agreed to the published version of the manuscript.

Funding

This work was supported by Khon Kaen University (KKU) through the KKU Scholarship for ASEAN and GMS Countries’ Personnel for the Academic Year 2022, Khon Kaen, Thailand, and the APC was funded by the International Tropical Timber Organization (ITTO) through ITTO Fellowship 2023.

Data Availability Statement

The authors confirm that the data supporting the findings of this study are available within the article.

Acknowledgments

This paper is part of a MSc. thesis. We extend our appreciation to all the individuals who participated in our study, especially to village leaders and villagers at Buluh Cina, Gading Permai, Kepau Jaya, Pangkalan Serik, and Sungai Bunga. Their willingness to share their experiences and insights was essential for our data collection and analysis. We also thank our colleagues and collaborators, including the Integrated Land and Water Resource Management Research and Development Center in Northeast Thailand, Khon Kaen University, for their constructive discussions, critical reviews, and collaborative efforts, all of which significantly contributed to the development of our research.

Conflicts of Interest

The authors declare no conflict of interest.

References

  1. Bonn, A.; Allott, T.; Evans, M.; Joosten, H.; Stoneman, R. Peatland Restoration and Ecosystem Services: An Introduction. In Peatland Restoration and Ecosystem Services: Science, Policy and Practice; Bonn, A., Joosten, H., Evans, M., Stoneman, R., Allott, T., Eds.; Cambridge University Press: Cambridge, 2016; pp. 1–16. ISBN 978-1-107-61970-8. [Google Scholar]
  2. Joosten, H.; Clarke, D. Wise Use of Mires and Peatlands: Background and Principles Including a Framework for Decision-Making; International Mire Conservation Group and International Peat Society: Saarijärvi, Finland, 2002; ISBN 951-97744-8-3. [Google Scholar]
  3. Wichmann, S.; Brander, L.; Schäfer, A.; Schaafsma, M.; Van Beukering, P.; Tinch, D.; Bonn, A. Valuing Peatland Ecosystem Services. In Peatland Restoration and Ecosystem Services: Science, Policy and Practice; Cambridge University Press, 2016; pp. 314–338. ISBN 978-1-139-17778-8. [Google Scholar]
  4. Anda, M.; Ritung, S.; Suryani, E.; Sukarman; Hikmat, M.; Yatno, E.; Mulyani, A.; Subandiono, R.E.; Suratman; Husnain. Revisiting Tropical Peatlands in Indonesia: Semi-Detailed Mapping, Extent and Depth Distribution Assessment. Geoderma 2021, 402, 115235–115235. [Google Scholar] [CrossRef]
  5. Gunawan, H. Indonesian Peatland Functions: Initiated Peatland Restoration and Responsible Management of Peatland for the Benefit of Local Community, Case Study in Riau and West Kalimantan Provinces. In Asia in Transition; Springer, 2018; Vol. 7, pp. 117–138. [CrossRef]
  6. Syahza, A.; Suwondo; Bakce, D. ; Nasrul, B.; Mustofa, R. Utilization of Peatlands Based on Local Wisdom and Community Welfare in Riau Province, Indonesia. Int. J. Sustain. Dev. Plan. 2020, 15, 1119–1126. [Google Scholar] [CrossRef]
  7. Nieminen, M.; Sarkkola, S.; Laurén, A. Impacts of Forest Harvesting on Nutrient, Sediment and Dissolved Organic Carbon Exports from Drained Peatlands: A Literature Review, Synthesis and Suggestions for the Future. For. Ecol. Manag. 2017, 392, 13–20. [Google Scholar] [CrossRef]
  8. Parish, F.; Sirin, A.; Charman, D.; Joosten, H.; Minayeva, T.; Silvius, M.; Stringer, L. Assessment on Peatlands, Biodiversity, and Climate Change: Main Report; Global Environment Centre and Wetlands International: Kuala Lumpur and Wageningen, 2008. ISBN 978-983-43751-0-2.
  9. Li, C.; Grayson, R.; Holden, J.; Li, P. Erosion in Peatlands: Recent Research Progress and Future Directions. Earth-Sci. Rev. 2018, 185, 870–886. [Google Scholar] [CrossRef]
  10. Hatano, R. Impact of Land Use Change on Greenhouse Gases Emissions in Peatland: A Review. Int. Agrophysics 2019, 33, 167–173. [Google Scholar] [CrossRef] [PubMed]
  11. Tan, L.; Ge, Z.; Zhou, X.; Li, S.; Li, X.; Tang, J. Conversion of Coastal Wetlands, Riparian Wetlands, and Peatlands Increases Greenhouse Gas Emissions: A Global Meta-Analysis. Glob. Change Biol. 2020, 26, 1638–1653. [Google Scholar] [CrossRef]
  12. Dohong, A.; Aziz, A.A.; Dargusch, P. A Review of the Drivers of Tropical Peatland Degradation in South-East Asia. Land Use Policy 2017, 69, 349–360. [Google Scholar] [CrossRef]
  13. Medrilzam, M.; Dargusch, P.; Herbohn, J.; Smith, C. The Socio-Ecological Drivers of Forest Degradation in Part of the Tropical Peatlands of Central Kalimantan, Indonesia. For. Int. J. For. Res. 2014, 87, 335–345. [Google Scholar] [CrossRef]
  14. Medrilzam, M.; Smith, C.; Aziz, A.A.; Herbohn, J.; Dargusch, P. Smallholder Farmers and the Dynamics of Degradation of Peatland Ecosystems in Central Kalimantan, Indonesia. Ecol. Econ. 2017, 136, 101–113. [Google Scholar] [CrossRef]
  15. Mizuno, K.; Masuda, K.; Syahza, A. Peatland Degradation, Timber Plantations, and Land Titles in Sumatra. In Vulnerability and Transformation of Indonesian Peatlands; Mizuno, K., Kozan, O., Gunawan, H., Eds.; Springer Nature Singapore Pte Ltd: Gateway East, Singapore, 2023; Vol. 1, pp. 17–49. [Google Scholar]
  16. Miettinen, J.; Shi, C.; Liew, S.C. Land Cover Distribution in the Peatlands of Peninsular Malaysia, Sumatra and Borneo in 2015 with Changes since 1990. Glob. Ecol. Conserv. 2016, 6, 67–78. [Google Scholar] [CrossRef]
  17. Ministry of Environmental and Forestry Republic of Indonesia Luas Karhutla. SiPongi Karhutla Monit. Syst. 2023.
  18. Huijnen, V.; Wooster, M.J.; Kaiser, J.W.; Gaveau, D.L.A.; Flemming, J.; Parrington, M.; Inness, A.; Murdiyarso, D.; Main, B.; van Weele, M. Fire Carbon Emissions over Maritime Southeast Asia in 2015 Largest since 1997. Sci. Rep. 2016, 6, 26886. [Google Scholar] [CrossRef]
  19. Kiely, L.; Spracklen, D.V.; Wiedinmyer, C.; Conibear, L.; Reddington, C.L.; Arnold, S.R.; Knote, C.; Khan, M.F.; Latif, M.T.; Syaufina, L.; et al. Air Quality and Health Impacts of Vegetation and Peat Fires in Equatorial Asia during 2004–2015. Environ. Res. Lett. 2020, 15, 094054. [Google Scholar] [CrossRef]
  20. Hein, L.; Spadaro, J.V.; Ostro, B.; Hammer, M.; Sumarga, E.; Salmayenti, R.; Boer, R.; Tata, H.; Atmoko, D.; Castañeda, J.-P. The Health Impacts of Indonesian Peatland Fires. Environ. Health 2022, 21, 62–62. [Google Scholar] [CrossRef] [PubMed]
  21. Uda, S.K.; Hein, L.; Atmoko, D. Assessing the Health Impacts of Peatland Fires: A Case Study for Central Kalimantan, Indonesia. Environ. Sci. Pollut. Res. 2019, 26, 31315–31327. [Google Scholar] [CrossRef] [PubMed]
  22. Ministry of Environmental and Forestry Republic of Indonesia Protection and Management of Peat Ecosystems.
  23. Peatland and Mangrove Restoration Agency Laporan Kinerja 2021 (2021 Performance Report); Jakarta, 2022; pp. 1–88.
  24. Kristiadi Harun, M.; Tri, A.; Yuwati, W. Agroforesty System For Rehabilitation of Degraded Peatland in Central Kalimantan. J. Wetl. Environ. Manag. 2015, 3, 41–46. [Google Scholar]
  25. Budiman, I.; Bastoni; Sari, E. N.; Hadi, E.E.; Asmaliyah; Siahaan, H.; Januar, R.; Hapsari, R.D. Progress of Paludiculture Projects in Supporting Peatland Ecosystem Restoration in Indonesia. Glob. Ecol. Conserv. 2020, 23, e01084. [Google Scholar] [CrossRef]
  26. Gunawan, H.; Afriyanti, D.; Dewanto, H.A. Show Windows and Lessons Learned from Peatland Restoration in Indonesia. In Tropical Peatland Eco-management; Osaki Mitsuru and Tsuji, N. and F.N. and R.J., Ed.; Springer Singapore: Singapore, 2021; pp. 751–774. ISBN 978-981-334-654-3. [CrossRef]
  27. Ward, C.; Warren-Thomas, E.; Agus, F.; Crowson, M.; Hamer, K.; Hariyadi, B.; Kartika, W.D.; Lucey, J.; McClean, C.; Nurida, N.L.; et al. Smallholder Perceptions of Land Restoration Activities: Rewetting Tropical Peatland Oil Palm Areas in Sumatra, Indonesia. Reg. Environ. Change 2020, 21, 1–17. [Google Scholar] [CrossRef] [PubMed]
  28. Ward, C.; Stringer, L.C.; Warren-Thomas, E.; Agus, F.; Hamer, K.; Pettorelli, N.; Hariyadi, B.; Hodgson, J.; Kartika, W.D.; Lucey, J.; et al. Wading through the Swamp: What Does Tropical Peatland Restoration Mean to National-Level Stakeholders in Indonesia? Restor. Ecol. 2020, 28, 817–827. [Google Scholar] [CrossRef]
  29. Kristiansen, S.; Budiman, A.; Pudyatmoko, S. Ecosystem Guardians or Threats? Livelihood Security and Nature Conservation in Maluku, Indonesia. Bull. Indones. Econ. Stud. 2023, 59, 119–143. [Google Scholar] [CrossRef]
  30. Pagdee, A.; Kim, Y.; Daugherty, P.J. What Makes Community Forest Management Successful: A Meta-Study From Community Forests Throughout the World. Soc. Nat. Resour. 2006, 19, 33–52. [Google Scholar] [CrossRef]
  31. Shumba, T.; De Vos, A.; Biggs, R.; Esler, K.J.; Clements, H.S. The Influence of Biophysical and Socio-Economic Factors on the Effectiveness of Private Land Conservation Areas in Preventing Natural Land Cover Loss across South Africa. Glob. Ecol. Conserv. 2021, 28, e01670. [Google Scholar] [CrossRef]
  32. He, S.; Jiao, W. Conservation-Compatible Livelihoods: An Approach to Rural Development in Protected Areas of Developing Countries. Environ. Dev. 2023, 45, 100797. [Google Scholar] [CrossRef]
  33. Ostrom, E. A General Framework for Analyzing Sustainability of Social-Ecological Systems. Science 2009, 325, 419–422. [Google Scholar] [CrossRef] [PubMed]
  34. Millennium Ecosystem Assessment. A Report of the Millennium Ecosystem Assessment. Ecosystems and Human Well-Being; Island Press: Washington DC, 2005; p. 137. ISBN 1-59726-040-1. [Google Scholar]
  35. Central Bureau of Statistics of Kampar Regency Kampar Regency in Figures; Bangkinang, 2022; pp. 1–254.
  36. BBKSDA Riau Taman Wisata Buluh Cina. Available online: https://bbksdariau.id/index.php?r=post&id01=4&id02=23&id03=52&token=529721b182f5ef92394ea00539e3f745 (accessed on 25 August 2023).
  37. Sukma, D.; Hadinoto, H.; Suhesti, E. IDENTIFIKASI POTENSI DAN DAYA TARIK WISATA KHDTK BULUH CINA KABUPATEN KAMPAR PROVINSI RIAU. Wahana For. J. Kehutan. 2022, 17, 13–24. [Google Scholar] [CrossRef]
  38. Efizon, D.; Putra, R.M.; Kurnia, F.; Yani, A.H.; Fauzi, M. KEANEKARAGAMAN JENIS-JENIS IKAN DI OXBOW PINANG DALAM DESA BULUH CINAKABUPATEN KAMPAR, RIAU. In Proceedings of the Ekologi, Habitat Manusia dan Perubahan Persekitaran; Universiti Kebangsaan Malaysia: Kedah, 2015.
  39. Alpino; Yoza, D.; Mardhiansyah, M. Diversity and Potential of Rattan in Buluh Cina Nature Tourism Park Buluh Cina Village Kampar District. J. Ilmu-Ilmu Kehutan. 2020, 4, 7–12. [Google Scholar] [CrossRef]
  40. Istiqfar, S.; Yoza, D.; Sulaeman, R. KEANEKARAGAMAN JENIS TUMBUHAN OBAT DI HUTAN ADAT RIMBO TUJUH DANAU DESA BULUH CINA KABUPATEN KAMPAR PROVINSI RIAU. JOM Faperta 2017, 4, 1–8. [Google Scholar]
  41. Putri, M.Z.; Yoza, D.; Arlita, T. KEANEKARAGAMAN JENIS POHON DI HUTAN ADAT RIMBO TUJUH DANAU DESA BULUH CINA KABUPATEN KAMPAR PROVINSI RIAU. JOM Faperta 2017, 4, 1–7. [Google Scholar]
  42. Mukhamadun; Efrizal, T.; Suardi, T. Valuasi Ekonomi Hutan Ulayat Buluhcina Desa Buluhcina Kecamatan Siak Hulu Kabupaten Kampar. J. Ilmu Lingkung. 3, 55–73.
  43. Yulia, S.S.; Thamrin, T. ANALISIS AKTIFITAS SOSIAL EKONOMI TERHADAP KUALITAS PERAIRAN DANAU OXBOW DI DESA BULUH CINA KECAMATAN SIAK HULU KABUPATEN KAMPAR PROVINSI RIAU. J. Ilmu Lingkung. 2013, 7, 187–200. [Google Scholar]
  44. Larasanti, D. Restorasi Gambut Berbasis Pemberdayaan Masyarakat Melalui Pembinaan Kelompok Masyarakat. In Proceedings of the Tantangan & Peluang Menuju Ekosistem Gambut Berkelanjutan; Universitas Riau, Universitas Andalas, PT. Kilang Pertamina Internasional RU II Sungai Pakning: Pekanbaru, October 2022; pp. 258–261.
  45. Syafrizal; Resdati Restorasi Gambut Berbasis Pemberdayaan Masyarakat (Community Empowerment Based Peat Restoration).; LPPM Universitas Muhammadiyah Purwokerto: Purwokerta, January 2020; pp. 596–601.
  46. Nusantara Atlas Maps Area of Interest. Available online: https://map.nusantara-atlas.org/?aoi=f48468f5-264a-4c00-815b-875fcae3c736.
  47. Champa, E. G. Kebun Sawit PT Agro Abadi Tidak Memiliki HGU, Ini Kata Kadis LHK Provinsi Riau. Available online: https://riaunews.com/utama/27986/ (accessed on 12 September 2023).
  48. Assis, J.C.; Hohlenwerger, C.; Metzger, J.P.; Rhodes, J.R.; Duarte, G.T.; Silva, R.A. da; Boesing, A.L.; Prist, P.R.; Ribeiro, M.C. Linking Landscape Structure and Ecosystem Service Flow. Ecosyst. Serv. 2023, 62, 101535. [Google Scholar] [CrossRef]
  49. Mitchell, M.G.E.; Suarez-Castro, A.F.; Martinez-Harms, M.; Maron, M.; McAlpine, C.; Gaston, K.J.; Johansen, K.; Rhodes, J.R. Reframing Landscape Fragmentation’s Effects on Ecosystem Services. Trends Ecol. Evol. 2015, 30, 190–198. [Google Scholar] [CrossRef]
  50. Ran, P.; Hu, S.; Frazier, A.E.; Yang, S.; Song, X.; Qu, S. The Dynamic Relationships between Landscape Structure and Ecosystem Services: An Empirical Analysis from the Wuhan Metropolitan Area, China. J. Environ. Manage. 2023, 325, 116575. [Google Scholar] [CrossRef]
  51. Dede, M.; Sunardi, S.; Lam, K.C.; Withaningsih, S. Relationship between Landscape and River Ecosystem Services. Glob. J. Environ. Sci. Manag. 9, 637–652. [CrossRef]
  52. Liu, L.; Chen, X.; Chen, W.; Ye, X. Identifying the Impact of Landscape Pattern on Ecosystem Services in the Middle Reaches of the Yangtze River Urban Agglomerations, China. Int. J. Environ. Res. Public. Health 2020, 17, 5063. [Google Scholar] [CrossRef]
  53. Bürgi, M.; Silbernagel, J.; Wu, J.; Kienast, F. Linking Ecosystem Services with Landscape History. Landsc. Ecol. 2015, 30, 11–20. [Google Scholar] [CrossRef]
  54. Setten, G.; Stenseke, M.; Moen, J. Ecosystem Services and Landscape Management: Three Challenges and One Plea. Int. J. Biodivers. Sci. Ecosyst. Serv. Manag. 2012, 8, 305–312. [Google Scholar] [CrossRef]
  55. Chen, W.; Jiang, C.; Wang, Y.; Liu, X.; Dong, B.; Yang, J.; Huang, W. Landscape Patterns and Their Spatial Associations with Ecosystem Service Balance: Insights from a Rapidly Urbanizing Coastal Region of Southeastern China. Front. Environ. Sci. 2022, 10, 1002902. [Google Scholar] [CrossRef]
  56. Yamane, T. Statistics: An Introductory Analysis, 3rd ed.; Harper and Row: New York, 1973. [Google Scholar]
  57. Mitchell, R.C.; Carson, R.T. Using Surveys to Value Public Goods: The Contingent Valuation Method, 1st ed.; Resources for the Future: Washington D. C., 1989; Vol. 1. [Google Scholar]
  58. U.S. Department of Energy, E.I.A. Method for Calculating Carbon Sequestration by Trees in Urban and Suburban Settings; Washington, D.C., 1998; pp. 1–16.
  59. Riau Provincial Government Penetapan Tarif Batas Atas Dan Tarif Batas Bawah BUMD Air Minum Se Provinsi Riau Tahun 2022; Decree of the Governor; 2022.
  60. BSN Penyusunan Neraca Sumber Daya-Bagian 1: Sumber Daya Air Spasial (SNI 19-6728.1-2002) 2002.
  61. Mudjiatko Kajian Harga Air Irigasi Untuk Peningkatan Pendapatan Petani (Kajian Kasus Di Petapahan, Kabupaten Kampar, Riau).; Fakultas Teknik Universitas Riau: Pekanbaru, May 2010; pp. 1–11.
  62. Seewiseng, L.; Bhaktikul, K.; Aroonlertaree, C.; Suaedee, W. The Water Footprint of Oil Palm Crop in Phetchaburi Province. Int. J. Renew. Energy 2012, 7, 49–54. [Google Scholar]
  63. Surendran, U.; Sushanth, C.M.; Joseph, E.J.; Al-Ansari, N.; Yaseen, Z.M. FAO CROPWAT Model-Based Irrigation Requirements for Coconut to Improve Crop and Water Productivity in Kerala, India. Sustain. Switz. 2019, 11. [Google Scholar] [CrossRef]
  64. Mangmeechai, A. Effects of Rubber Plantation Policy on Water Resources and Landuse Change in the Northeastern Region of Thailand. Geogr. Environ. Sustain. 2020, 13, 73–83. [Google Scholar] [CrossRef]
  65. Fitriansyah; Widuri, E.S.; Ulmi, E.I. Analisa Kebutuhan Air Irigasi Untuk Tanaman Padi Dan Palawija Pada Daerah Irigasi Rawa (DIR) Danda Besar, Kabupaten Barito Kuala. Media Ilm. Tek. Sipil 2020, 8, 79–87. [Google Scholar] [CrossRef]
  66. Dewi, S.; Khasanah, N.; Rahayu, S.; Ekadinata, A.; van Noordwijk, M. Carbon Footprint of Indonesian Palm Oil Production: A Pilot Study; Bogor, 2009; pp. 1–8.
  67. Lestari, N.S.; Noor’An, R.F. Carbon Sequestration Potential of Rubber Plantation in East Kalimantan.; Institute of Physics, 2022; Vol. 1109.
  68. Verwer, C.C.; van der Meer, P.J. Carbon Pools in Tropical Peat Forest: Towards a Reference Value for Forest Biomass Carbon in Relatively Undisturbed Peat Swamp Forest in Southeast Asia; Wageningen, 2010; pp. 1–67.
  69. International Monetary Fund Indonesia’s Transition toward a Greener Economy - Carbon Pricing and Green Financing; Washington, D.C., 2022; pp. 52–61.
  70. IBM Corp IBM SPSS Statistics for macOS 2021.
  71. Central Bureau of Statistics Indonesia [Seri 2010] Produk Domestik Regional Bruto Per Kapita (Ribu Rupiah), 2020-2022. Prod. Domest. Reg. Bruto Lapangan Usaha 2023.
  72. International Monetary Fund Indonesia: Gross Domestic Product (GDP) per Capita in Current Prices from 1987 to 2028 (in U.S. Dollars). Statista 2023.
  73. The World Bank; BPS Pilot Ecosystem Account for Indonesian Peatlands Sumatera and Kalimantan Islands; World Bank: Washington DC., 2019.
  74. Uda, S.K.; Hein, L.; Sumarga, E. Towards Sustainable Management of Indonesian Tropical Peatlands. Wetl. Ecol. Manag. 2017, 25, 683–701. [Google Scholar] [CrossRef]
  75. Firzal, Y.; Faisal, G. Architecture and Socio-Cultural Life: Redefining Malay Settlement on the East Coast of Sumatera.; 2016; pp. 1–8.
  76. Taufik, M.; Haikal, M.; Widyastuti, M.T.; Arif, C.; Santikayasa, I.P. The Impact of Rewetting Peatland on Fire Hazard in Riau, Indonesia. Sustain. Switz. 2023, 15. [Google Scholar] [CrossRef]
  77. Prasetyawan, W. Willingness to Pay for Environmental Conservation of Peat and Aquatic Ecosystems in a Cash-Poor Community: A Riau Case Study. In Local Governance of Peatland Restoration in Riau, Indonesia; Okamoto, M., Osawa, T., Prasetyawan, W., Binawan, A., Eds.; Springer Nature Singapore Pte Ltd: Gateway East, Singapore, 2023; Vol. 1, pp. 193–209. [Google Scholar]
  78. Suwarno, A.; Hein, L.; Sumarga, E. Who Benefits from Ecosystem Services? A Case Study for Central Kalimantan, Indonesia. Environ. Manage. 2016, 57, 331–344. [Google Scholar] [CrossRef] [PubMed]
  79. Ulya, N.A.; Nurlia, A.; Kunarso, A.; Martin, E.; Waluyo, E.A. Valuation of Goods and Services Derived from Plantation Forest in Peat Swamp Forest Area: The Case of South Sumatra Province.; Institute of Physics Publishing, September 2019; Vol. 308. [CrossRef]
  80. Sumarga, E.; Hein, L. Mapping Ecosystem Services for Land Use Planning, the Case of Central Kalimantan. Environ. Manage. 2014, 54, 84–97. [Google Scholar] [CrossRef] [PubMed]
  81. Rossita, A.; Nurrochmat, D.R.; Boer, R.; Hein, L.; Riqqi, A. Assessing The Monetary Value Of Ecosystem Services Provided By Gaung – Batang Tuaka Peat Hydrological Unit (Khg), Riau Province. Heliyon 2021, 7. [Google Scholar] [CrossRef]
  82. Januar, R.; Sari, E.N.N.; Putra, S. Economic Case for Sustainable Peatland Management: A Case Study in Kahayan-Sebangau Peat Hydrological Unit, Central Kalimantan, Indonesia. Land Use Policy 2023, 131. [Google Scholar] [CrossRef]
  83. Tarigan, S.; Zamani, N.P.; Buchori, D.; Kinseng, R.; Suharnoto, Y.; Siregar, I.Z. Peatlands Are More Beneficial If Conserved and Restored than Drained for Monoculture Crops. Front. Environ. Sci. 2021, 9. [Google Scholar] [CrossRef]
  84. Aulia, A.F. Rural Livelihoods and Ecosystem Services in Oil Palm Landscapes in Riau, Sumatra, Indonesia. 2017, 1–197.
  85. Simangunsong, B.C.H.; Manurung, E.G.T.; Elias, E.; Hutagaol, M.P.; Tarigan, J.; Prabawa, S.B. Tangible Economic Value of Non-Timber Forest Products from Peat Swamp Forest in Kampar, Indonesia. Biodiversitas 2020, 21, 5954–5960. [Google Scholar] [CrossRef]
  86. Rochmayanto, Y.; Darusman, D.; Rusolono, T. The Change of Carbon Stock and It’s Economic Value on Peat Swamp Forest Conversion towards Pulpwood Industrial Plantation Forest. J. Penelit. Hutan Tanam. 2010, 7, 93–106. [Google Scholar] [CrossRef]
  87. Emerton, L. Economic Valuation of Wetlands: Total Economic Value. In The Wetland Book: I: Structure and Function, Management, and Methods; Springer Netherlands, 2018; pp. 2127–2132. ISBN 978-90-481-9659-3. [Google Scholar]
  88. Masiero, M.; Pettenella, D.; Boscolo, M.; Barua, S.K.; Animon, I.; Matta, R. Valuing Forest Ecosystem Services: A Training Manual for Planners and Project Developers. 2019.
  89. International Union for Conservation of Nature and Natural Resources Peatlands and Climate Change. Available online: https://www.iucn.org/resources/issues-brief/peatlands-and-climate-change#:~:text=Worldwide%2C%20the%20remaining%20area%20of,types%20including%20the%20world's%20forests (accessed on 19 November 2023).
  90. Ulya, N.A.; Warsito, S.P.; Andayani, W.; Gunawan, T. Economic Value of Water for Domestic and Transportation-Case Study in Villages Around Merang Kepayang Peat Swamp Forest, South Sumatera Province. J. Mns. Dan Lingkung. 2014, 21, 232–238. [Google Scholar]
  91. Putra, E.I.; Saharjo, B.H.; Wasis, B.; Hero, Y.; Puspaningsih, N. Economic Loss Value from Land and Forest Fires in Oil Palm Plantation in Jambi, Indonesia.; Institute of Physics Publishing, June 2020; Vol. 504. [CrossRef]
  92. Saharjo, B.H.; Wasis, B. Valuasi Ekonomi Kerusakan Lingkungan Akibat Kebakaran Gambut Di Desa Mak Teduh Provinsi Riau. J. Trop. Silvic. 2019, 10, 58–62. [Google Scholar] [CrossRef]
  93. Sharma, S.K.; Baral, H.; Laumonier, Y.; Okarda, B.; Purnomo, H.; Pacheco, P. Ecosystem Services under Future Oil Palm Expansion Scenarios in West Kalimantan, Indonesia. Ecosyst. Serv. 2019, 39. [Google Scholar] [CrossRef]
  94. Parlinah, N.; Djaenudin, D.; Iqbal, M.; Indartik; Suryandari, E.Y.; Salaka, F.J.; Kurniawan, A.S.; Effendi, R. Valuation of Rubber Farming Business in Support of Food Security: A Case Study in Pulang Pisau Regency.; IOP Publishing Ltd, November 2021; Vol. 917. [CrossRef]
  95. Bahuguna, V.K. Forests in the Economy of the Rural Poor: An Estimation of the Dependency Level. AMBIO J. Hum. Environ. 2000, 29, 126–129. [Google Scholar] [CrossRef]
  96. Mahapatra, A.K.; Albers, H.J.; Robinson, E.J.Z. The Impact of NTFP Sales on Rural Households’ Cash Income in India’s Dry Deciduous Forest. Environ. Manage. 2005, 35, 258–265. [Google Scholar] [CrossRef] [PubMed]
  97. Tieguhong, J.C.; Nkamgnia, E.M. Household Dependence on Forests around Lobeke Nationa l Park, Cameroon. Int. For. Rev. 2012, 14, 196–212. [Google Scholar] [CrossRef]
  98. Ponta, N.; Cornioley, T.; Waeber, P.O.; Dray, A.; Van Vliet, N.; Quiceno Mesa, M.P.; Garcia, C.A. Drivers of Transgression: What Pushes People to Enter Protected Areas. Biol. Conserv. 2021, 257, 109121. [Google Scholar] [CrossRef]
  99. Maryudi, A.; Devkota, R.R.; Schusser, C.; Yufanyi, C.; Salla, M.; Aurenhammer, H.; Rotchanaphatharawit, R.; Krott, M. Back to Basics: Considerations in Evaluating the Outcomes of Community Forestry. For. Policy Econ. 2012, 14, 1–5. [Google Scholar] [CrossRef]
  100. Robins, L.; van Kerkhoff, L.; Rochmayanto, Y.; Sakuntaladewi, N.; Agrawal, S. Knowledge Systems Approaches for Enhancing Project Impacts in Complex Settings: Community Fire Management and Peatland Restoration in Indonesia. Reg. Environ. Change 2022, 22, 100. [Google Scholar] [CrossRef] [PubMed]
  101. Strack, M.; Davidson, S.J.; Hirano, T.; Dunn, C. The Potential of Peatlands as Nature-Based Climate Solutions. Curr. Clim. Change Rep. 2022, 8, 71–82. [Google Scholar] [CrossRef]
  102. Pertiwi, N.; Tsusaka, T.W.; Nguyen, T.P.L.; Abe, I.; Sasaki, N. Nature-Based Carbon Pricing of Full Ecosystem Services for Peatland Conservation—A Case Study in Riau Province, Indonesia. Nat.-Based Solut. 2022, 2, 100023–100023. [Google Scholar] [CrossRef]
  103. Osawa, T. Rethinking the Local Wisdom Approach in Peatland Restoration through the Case of Rantau Baru: A Critical Inquiry to the Present-Day Concept of Kearifan Lokal. In Local Governance of Peatland Restoration in Riau, Indonesia: A Transdisciplinary Analysis; Okamoto, M., Osawa, T., Prasetyawan, W., Binawan, A., Eds.; Springer Nature Singapore: Singapore, 2023; pp. 119–145. ISBN 978-981-9909-02-5. [Google Scholar]
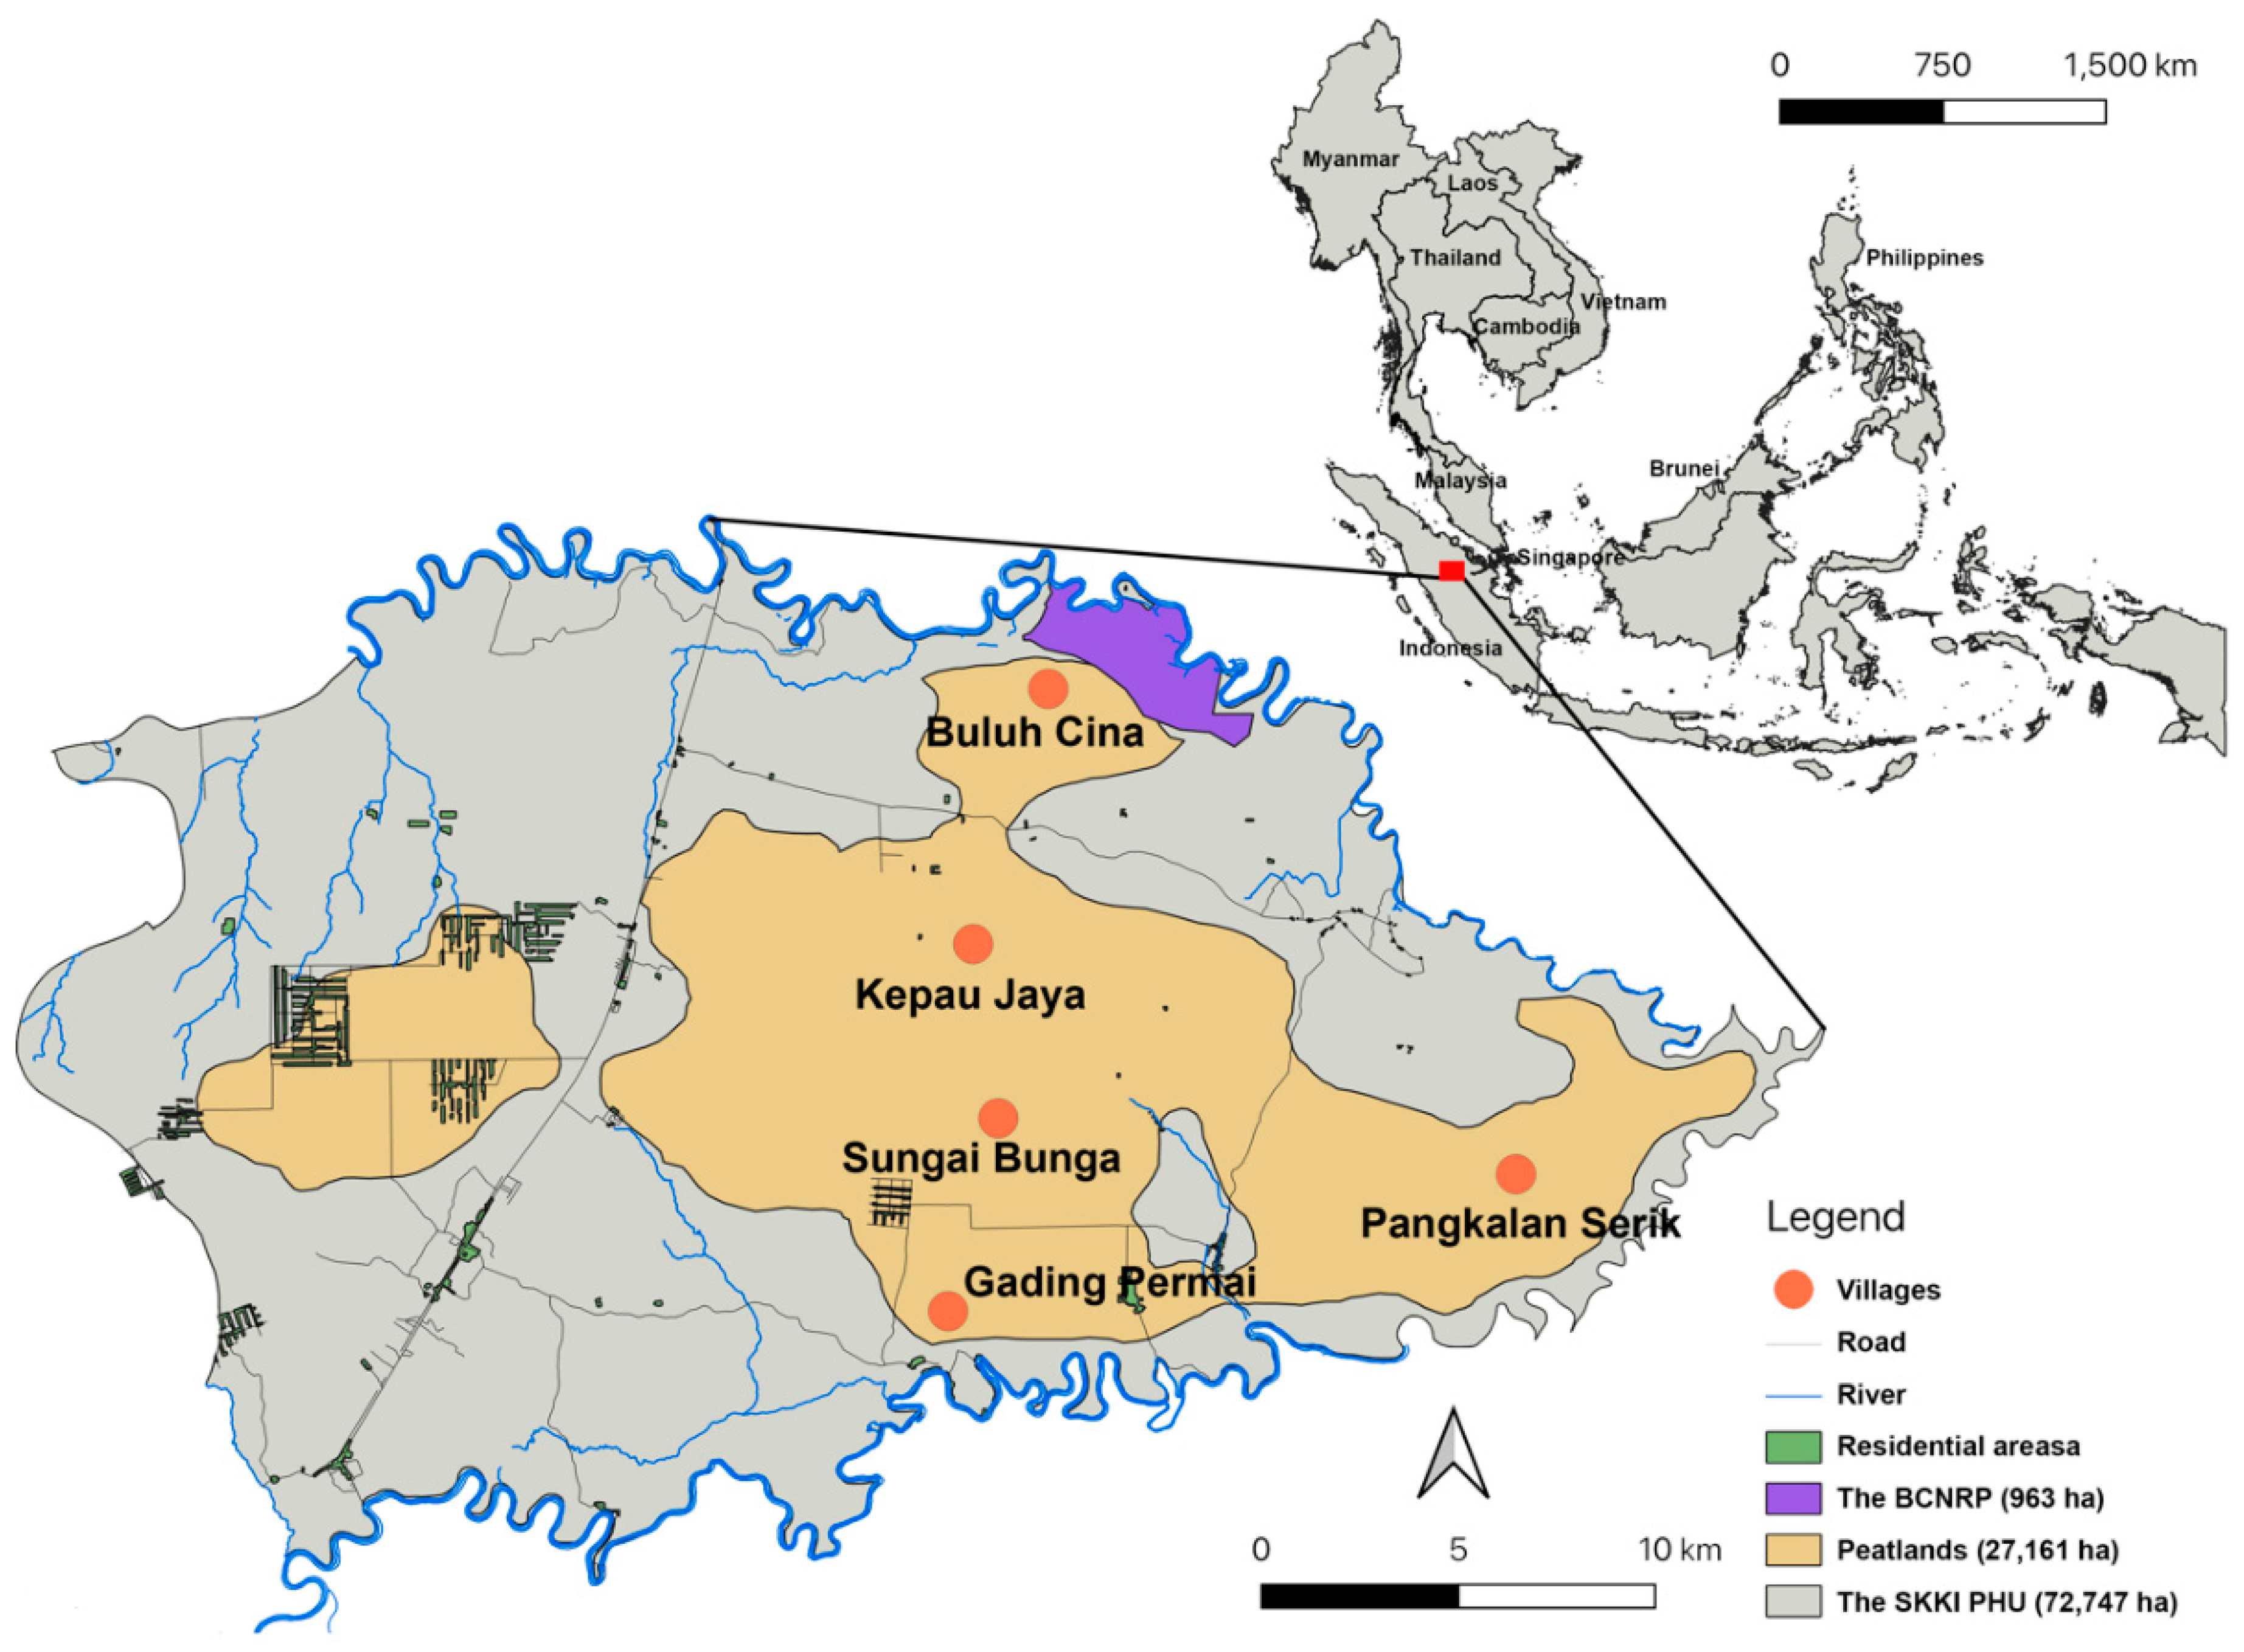
Figure 1. Study area and villages in the SKKI PHU, Riau Province, Indonesia.
Preprints 94777 g001
Figure 2. Common landscapes in the study area: A. the peat swamp forest, B. a patch of secondary forest, C. oil palm plantations, and 4. the Kampar Kanan River and a nearby village – Buluh Cina. The satellite image depicts parts of the BCNRP and its diverse land use patterns inside the protected area.
Preprints 94777 g002
Figure 3. Scope of the study – the research problems, objectives, methodological framework, and expected outcomes.
Preprints 94777 g003
Figure 4. Socio-economic conditions and livelihoods of survey respondents (% of responses).
Preprints 94777 g004
Figure 5. A list of land use conditions near the respondent's homestead.
Preprints 94777 g005
Figure 6. Frequently access locations for peatland product collection.
Preprints 94777 g006
Figure 7. Distribution of distances to various locations from the households.
Preprints 94777 g007
Table 1. Definition and description of the variables used for landscape characteristics.
No. Variable Description Type
A Landscape conditions
1 Protected area Whether the household is located in the protected area
  • No
  • Yes
2 Peatland restoration projects Whether the household is located in a peatland restoration site
  • No
  • Yes
3 Fire damaged-zones Whether the household is located in a fire damaged-zone
  • No
  • Yes
4 Peat domes Whether the household is located in an area with peat domes
  • No
  • Yes
5 Large scale oil palm plantations Whether the household is located in an area with large scale oil palm plantations
  • No
  • Yes
6 Peat drainages Whether the household is located in an area with peat drainages
  • No
  • Yes
B The distance
1 Center of village The distance from the household to the center of the village (km)
  • Near (0 – 2 km)
  • Intermediate (>2 km ≤ 4 km)
  • Far (> 4 km)
2 Local market The distance from the household to the local market (km)
  • Near (0 – 2 km)
  • Intermediate (>2 km ≤ 4 km)
  • Far (> 4 km)
3 Peatland forests The distance from the household to the peatland forests (km)
  • Near (0 – 2 km)
  • Intermediate (>2 km ≤ 6 km)
  • Far (> 6 km)
4 Protected area The distance from the household to the protected area (km)
  • Near (0 – 6 km)
  • Intermediate (>6 km ≤ 12 km)
  • Far (> 12 km)
5 River The distance from the household to the closest river (km)
  • Near (0 – 4 km)
  • Intermediate (>4 km ≤ 8 km)
  • Far (> 8 km)
Table 2. Peatland ecosystem services and calculation formulas for economic valuation.
No. Ecosystem services Calculation formulas Description
A Use value
i. Direct use value
Fishery V p r = j = 1 n i = 1 n P i   x   Q i Pi is the market price of product (USD/kg), Qi is the quantity of product (kg/year), and j is the household
Wild plants and their outputs as a food source
Wild animals and their outputs as a food source
Ornamental animals and plants
Fibers and other materials
Medicines and other materials from wild animals and wild plants
Water for households Q i = F m i   x   W t i
V w h = j = 1 n i = 1 n P i   x   Q i
Fmi is the number of family member, Wti is the water needed per people (m3/year)
Water for agriculture Q i = A r i   x   W t i   x   P l i
V w a = j = 1 n i = 1 n P i   x   Q i
Ari is the area of land for production (ha), Wti is the water needed per year (m3/ha), and Pli is the plant's intensity day per year
Soil fertility V s f = j = 1 n i = 1 n P i   x   Q i Pi is the market price of product (USD/kg), Qi is the quantity of product (kg/year), and j is the household
ii. Indirect use value
Fire prevention V f r = i = 1 n E c i   x   F r i Eci is the estimated cost of fire prevention (USD/incident), and Fri is the fire frequency.
Carbon sequestration V c s = P r i   x   C r i   x   A r i   x   F c i Pri is the carbon prices, Cri is the number of carbon stocks, Ari is the total area of peatlands, and Fci is the conversion factor.
iii. Option value
Habitats for endemic/endangered species W T P = i = 1 n W T P i / n WTP is the maximum willingness to pay expressed by individual households, and n is the number of observations.
B Non-use value
i. Bequest value
Biodiversity for future generation W T P = i = 1 n W T P i / n WTP is the maximum willingness to pay expressed by individual households, and n is the number of observations.
ii. Existence value
Spiritual, sacred and religious values V s f = i = 1 n A r i   x   P r i n Ari is the total area of the sacred forest, Pri is the price of land (oil palm plantation, USD/ha), and n is the number of total households as a population.
Table 3. Prices, quantities, assumptions, and data sources used for economic value measurement.
Ecosystem services Price Quantity Assumption Data sources
Water for household 0.80 USD/m3 21.90 m3/people/year Average annual water use per person [59] [60]
Water for agriculture 0.0019 USD/m3 Oil palm 21,296 m3/ha/year
Coconut 17,520 m3/ha/year
Rubber 14,221 m3/ha/year
Rice 391,495 m3/ha/year
Annual water use for specific crops per hectare [61] [62] [63] [64] [65]
Carbon sequestration 2 USD/tCO2 Oil palm 40 tC/ha
Rubber 75.71 tC/ha
Coconut 100 tC/ha
Carbon sequestration rate per hectare for specific crops [66,67,68] [69]
Sacred forest 8,643.61 USD/ha/year 963.33 ha Value of the forest if it were converted into an oil palm plantation Questionnaire data
Table 4. Total economic value of peatland ecosystem services.
No. Peatland ecosystem services Value (USD/hh/year) Percent
Use value 2,566.44 80.85
i Direct use value 1,983.83 77.30
1. Fishery 807.56 40.71
2. Wild plants and their outputs as a food source 104.48 5.27
3. Wild animals and their outputs as a food source 153.67 7.75
4. Ornamental animals and plants 36.28 1.83
5. Fibres and other materials 22.86 1.15
6. Medicines and other materials from wild animals and wild plants 28.44 1.43
7. Water for households 57.82 2.91
8. Water for agriculture 63.77 3.21
9. Soil fertility 708.96 35.74
ii Indirect use value 579.33 29.20
1. Fire prevention 69.85 12.06
2. Carbon sequestration 509.49 87.94
iii Option value
1. Habitats for endemic/endangered species 3.28 0.13
Non-use value 607.88 19.15
i Bequest value
1. Biodiversity for future generation 3.4 0.56
ii Existence value
1. Spiritual, sacred and religious values 604.48 99.44
Total economic value 3,174.32 100
Disclaimer/Publisher’s Note: The statements, opinions and data contained in all publications are solely those of the individual author(s) and contributor(s) and not of MDPI and/or the editor(s). MDPI and/or the editor(s) disclaim responsibility for any injury to people or property resulting from any ideas, methods, instructions or products referred to in the content.
Copyright: This open access article is published under a Creative Commons CC BY 4.0 license, which permit the free download, distribution, and reuse, provided that the author and preprint are cited in any reuse.
Prerpints.org logo

Preprints.org is a free preprint server supported by MDPI in Basel, Switzerland.

Subscribe

© 2024 MDPI (Basel, Switzerland) unless otherwise stated