Preprint
Article

Impact of the Citrus Industry on the Water Quality of the Filobobos River in Veracruz, Mexico

Altmetrics

Downloads

116

Views

55

Comments

0

A peer-reviewed article of this preprint also exists.

Submitted:

29 December 2023

Posted:

29 December 2023

You are already at the latest version

Alerts
Abstract
The state of Veracruz has ample water resources. However, due to population and industrial growth, there has been an increase in the discharge of wastewater into surface water bodies. To analyze the water quality in the Bobos River, Veracruz, and its sustainability, researchers collected nine samples from nine different points in the reservoir. They measured various parameters such as temperature, pH, dissolved oxygen, conductivity, total nitrogen, nitrate, chemical oxygen demand, total phosphorus, phosphate, dissolved solids, and fecal coliforms. The results showed that the river's water quality is at risk. The concentration of pollutants such as chemical oxygen demand and fecal coliforms is high. Conductivity values ranged from 0.26 to 3.81 mS. If preventive and corrective measures are not taken, the river's ability to purify pollutants will be severely compromised. This study evaluates the physical, chemical, and microbiological characteristics of the water in Bobos River. It specifically investigates the influence of the nearby citrus industry on the river's water quality. The study also aims to promote environmental sustainability.
Keywords: 
Subject: Chemistry and Materials Science  -   Other

1. Introduction

Urbanization, population growth, and industrial and agricultural development can have a significant impact on the quality of rivers [1]. Research has demonstrated a strong correlation between urbanization [2] and water quality. As cities expand, the presence of pollutants in water increases, including chemicals, heavy metals, and nutrients [3]. In many developing countries, natural resources such as water are not adequately protected by public policies.[4,5]. In numerous developing countries, there are inadequate public policies to protect natural resources like water. This is especially prevalent in rivers that receive untreated wastewater, which can decrease their capacity for dilution and self-purification. The consequences of river pollution not only have economic impacts on vulnerable sectors, such as fishing, livestock, and agriculture but also endanger the existence of organisms that live in these ecosystems and can even expose them to possible extinction. [6,7]. This is especially prevalent in rivers that receive untreated wastewater, which can decrease their capacity for dilution and self-purification. The consequences of river pollution not only have economic impacts on vulnerable sectors, such as fishing [8], livestock [9], and agriculture [10] but also endanger the existence of organisms that live in these ecosystems and can even expose them to possible extinction [11].
Along the banks of rivers in Mexico, major population centers are commonly found. This has resulted in over 70% of water bodies exhibiting some level of contamination, causing significant problems concerning availability and access to this resource [12]. Without any prior treatment, approximately 40% of wastewater generated (both industrial and domestic) is discharged into surface water bodies [13].
Veracruz State, located in Mexico, possesses a significant amount of water resources with its 17 hydrographic basins and 24 rivers. However, the rivers have been affected by wastewater from population centers and industries. It is unclear if these bodies of water have undergone any treatment process. Mexican standards NOM-001-SEMARNAT-1996, NOM-002-SEMARNAT-1996, and NOM-003-SEMARNAT-1997 set limits for wastewater discharges. All water, whether for public or industrial use, must be treated before reintroduction into the cycle. Unfortunately, Veracruz has only a few registered treatment plants, with 74 urban wastewater treatment plants found in 2002. These treatment plants only treat 30% of the wastewater. For the 212 municipalities of Veracruz, the number of existing treatment plants is insufficient, allowing only a small amount of urban wastewater to be treated. The treatment plants address only some parameters, such as solids, carbon, and coliforms, or are non-functional.
Access to clean drinking water is essential for both human health and sustainable development. Unfortunately, human activities are threatening water quality in various parts of the world, and the Bobos River basin in southeastern Mexico is no exception. In particular, the discharge of waste from the citrus industry is having a significant impact on the rivers water quality. Therefore, in this work a physicochemical and microbiological evaluation of water quality in the Bobos River, focusing on analyzing the impact generated by the citrus industry in the region. In addition, it seeks to address environmental sustainability concerning industry practices, proposing sustainable measures to mitigate the negative effects and contribute to protection and conservation of the Bobos River and other water bodies.

2. Materials and Methods

2.1. Description of the Bobos River Basin

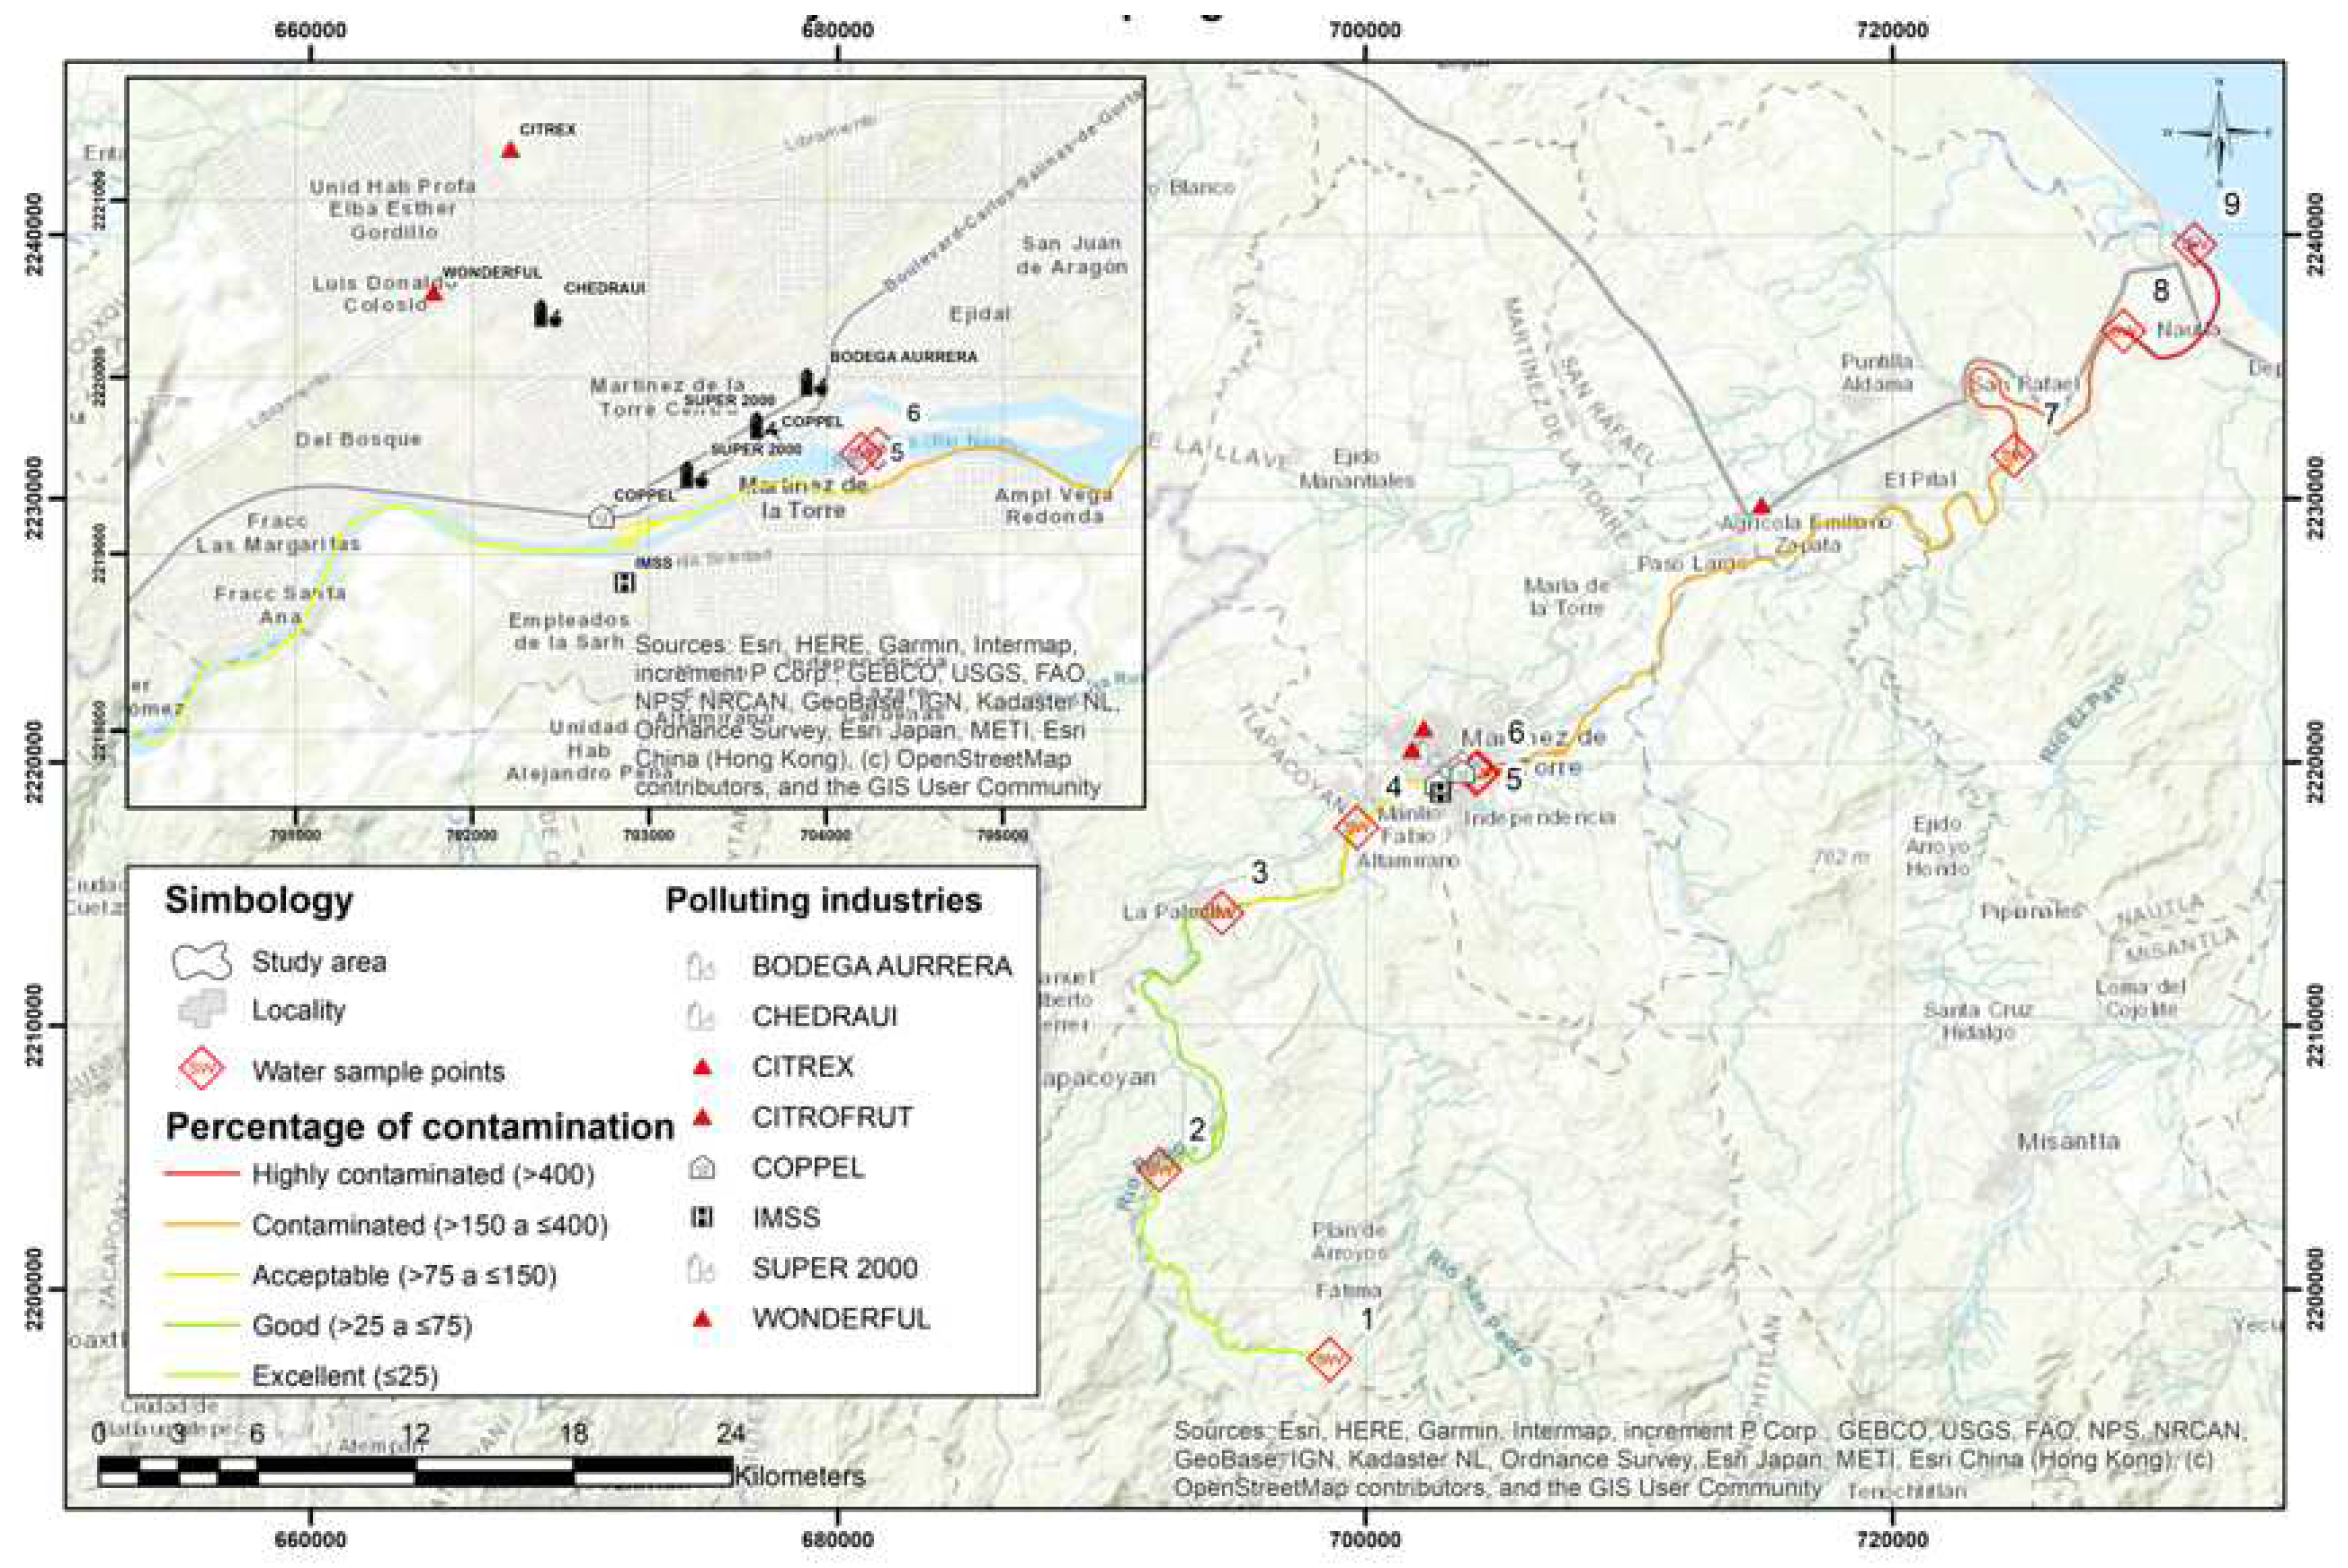
The study area corresponds to the Nautla River basin, which runs through the municipalities of Plan de Arroyos, Tlapacoyan, Martínez de la Torre, San Rafael, and Nautla, Veracruz, Mexico until it flows into the Gulf of Mexico. The basin has a maximum elevation of 3,299 meters and a minimum of 6 meters as well as an approximate length of 121 kilometers of main channel; it also has an average slope of 3.25% and a retention time of 520 minutes. This area has a population of 366,500 inhabitants and approximately 97,500 inhabited homes. It is important to highlight that approximately 92,500 homes have piped water and 3,400 do not; 90,500 have sewerage and 6,500 do not have towns near the Bobos River (Figure 1).

2.2. Sampling

2.2.1. Area of Study

The study area corresponds to the Nautla River basin, which is located in the states of Puebla and Veracruz, Mexico, and covers a total area of 3,544 km². The basin extends across several municipalities, including Puebla, Teziutlán, Martínez de la Torre, Misantla, and Nautla. With a length of 121 km, the Nautla River flows into the Gulf of Mexico. The relief of the basin is predominantly mountainous, with altitudes ranging from 50 to 3,299 meters above sea level. In terms of climate, the region is characterized by a warm and humid climate, with annual precipitation ranging from 1,000 to 3,500 mm [14].
The Bobos River basin, located in Veracruz, Mexico, covers an area of 1,417 km² and extends along 77 km, while the Bobos River has a length of 58 km and an average slope of 1.5%. With an average annual precipitation of 2,229 mm, 75% of the rainfall is concentrated during the June to October season. However, the intensification of agriculture and livestock, along with deforestation and urbanization, has increased the vulnerability of the basin to soil erosion and sedimentation [15].

2.2.2. Water Samples

Three water samples were collected at nine different points along the Bobos River (as shown in Figure 1), and the sampling points were numbered in ascending order as they flowed down the river, from SW1 to SW9. High-density polyethylene containers of 2 L capacity were used to collect the water samples, to which concentrated nitric acid was added to achieve a pH < 2. The containers were then labeled with their respective date, name, and location of the site, and placed in coolers for transportation under established guidelines [16,17].
The pH, electrical conductivity, temperature (HANNA instruments, HI98130), and dissolved oxygen (Milwaukee, model 600) were measured directly in the monitored water body with portable meters. Parameters such as Total Nitrogen, NO3, chemical oxygen demand (COD), Total Phosphorus (TP), PO4, and fecal coliforms were determined at the Wetlands and Environmental Sustainability Laboratory located at the Instituto Tecnológico Nacional de México Campus Misantla, Veracruz. Samples were preserved at 4°C until processing; the techniques used were taken from the Mexican Standards which are based on the standard methods for water and wastewater analysis [16].

2.2.3. Quantification of NaOH (%)

Place 0.5 g of a sample of sodium hydroxide of unknown concentration in a beaker. Add 2 drops of phenolphthalein. Add sulfuric acid 0.1 N dropwise until a color change of the indicator occurs. The % of NaOH is obtained from the following formula:
%NaOH = Volume of acid used * Acid normality * meq of NaOH (0.04) * 100 / Weight of the analyzed sodium sample.

2.3. Statistical Analysis

To investigate the relationship between water quality factors, correlation and principal component analysis (PCA) analyses were performed using Statistical Package for the Social Sciences software (SPSS, ver. 25.0; SPSS Inc., Chicago, IL, USA).

3. Results and Discussion

3.1. Temperature and Dissolved Oxygen

Temperature and dissolved oxygen (DO) are important parameters for assessing water quality in an aquatic system. In this study, we observed a wide variability in water temperature along the Bobos River basin, which was influenced by both geographic location and human activity (Table 1 and Figure 2). The lowest temperature values were found in the upper parts of the basin, while the highest values were observed in the lower areas where settlements are located.
The increase in water temperature along the river may result from the mixing of tributaries with higher temperatures and the reduction of water velocity as the river widens. In most cases, a significant increase in water temperature is due to the discharge of wastewater from industries [18]. It is important to note that, although the water temperature values in the Bobos River basin are within normal ranges, it is necessary to regularly monitor the temperature levels and other water quality variables to ensure the sustainability of the river ecosystem.
Dissolved oxygen (DO) is a critical parameter that determines water quality and the health of aquatic ecosystems [19]. Aquatic plants and animals, including fish, require oxygen to survive. For example, fish cannot survive for extended periods in water with dissolved oxygen levels below 5 mg L-1 [20]. Low levels of dissolved oxygen in water indicate contamination and are important factors in determining water quality, pollution control, and treatment processes [21].
The study demonstrated that the highest dissolved oxygen (DO) value in the river was 2.64 ± 0.05 mgL-1 (SW3). However, this value is considered low compared to water quality standards. In Table 1, the DO results at different study points are presented. The findings suggest that water quality may have decreased due to contamination and wastewater discharges. It is essential to note that DO levels can be affected by the presence of contaminants and water temperature [22].
The dissolved oxygen (DO), an indicator of water contamination, can vary between 0 and 18 mg L-1, although most rivers and streams require a minimum of 5-6 mg L-1 to support diverse aquatic life [23]. In Table 1, it is observed that the values found at the evaluated points are <6 mg L-1 (except SW3) for the presence of aquatic life in general. Another factor that influences DO levels is the turbulence of the current due to the air that favors its dissolution in the water. A body of water that has a level of dissolved oxygen ≤2 mg L-1 or ≤ 30% saturation is considered hypoxic [24]. The low oxygen content or oxygen depletion generally results from a combination of high biological productivity and reduced water exchange [25].
It has been found that water temperature can affect the amount of oxygen dissolved in water, especially under polluted conditions [26]. In this study, no relationship was found between these parameters. The same DO value was observed in samples SW1 and SW7 but at different temperatures.

3.2. pH and conductivity

pH is a critical factor affecting water quality and aquatic life. When pH falls outside the optimal range, it can have adverse effects on aquatic flora and fauna [27] and may also indicate the presence of contaminants. In this study, pH levels remained within the expected natural range for freshwater bodies, although they were slightly alkaline or acidic at some locations. Point SW3 had the highest pH and is located near the mouth of the river, suggesting that human activities may be affecting water quality at this location.
The majority of natural waters fall within a pH range of 6.5 to 8.0, which is primarily controlled by the carbonate system [25]. In this study, pH values were observed to vary from 6.40±0.71 in SW5, slightly acidic, to 8.65±0.07 in SW3, slightly alkaline. It is important to note that in nature there are aquatic organisms that cannot thrive in an acidic environment. In SW2 and SW3, the pH values were slightly above the optimal values and tended to be alkaline. The presence of human settlements in SW3 may contribute to this pH increase due to the discharge of wastewater with a higher pH than natural waters. Therefore, continuous monitoring of pH levels in the watershed is crucial to prevent adverse effects on aquatic life and aquatic ecosystems in general (Figure 2).
In contrast, pure water has low electrical conductivity due to the absence of ions in the solution. However, river water contains ions in solution, so its conductivity is proportional to the concentration of dissolved mineral salts and temperature, as explained in the article [28]. Table 2 shows the conductivity values measured in this study, showing significant variations between the different points evaluated. In particular, SW9 had the highest and significantly different value compared to the other points (p<0.05). It’s worth noting that river conductivity can vary due to various factors such as regional geology, industrial discharges, and human activities, as mentioned in the reference [29].
The main causes of increased electrical conductivity in natural water bodies are wastes from households and businesses and salts dissolved by natural runoff. A significant change in conductivity is an indication that a discharge or other source of pollution has occurred in the water body [30]. River conductivity typically varies between 50 and 1500 mhos cm-¹ [31]. In contrast, [32] evaluated the water quality of different Amazonian rivers (Tapajós, Incoloros streams, Cuparí, Jutaí, Tefé, and Juruá) and observed variable electrical conductivity, with values of 14.33, 15.12, 59.90, 8.71, 7.36 and 191.14 (μS cm-¹), respectively. These values are different from those obtained in the present study.

3.3. Total Nitrogen, N-NO3-, and Total Phosphorus, P-PO4-

Nitrate is a chemical substance formed by the combination of nitrogen and oxygen and may be found in small amounts in drinking water due to its natural occurrence. However, when elevated levels of nitrate are detected in surface waters, it may be an indicator of contamination due to the presence of industrial and municipal fertilizers in the water [33].
In this study, it was found that total nitrogen concentrations followed an increasing order from P1 to P9, with a significant difference (p<0.05) between sampling points P1 and P9. In addition, it was observed that both total nitrogen and nitrate (N-NO3-) concentrations as well as the NT/N-NO3- ratio were higher at sampling points P5 to P9. This suggests that the river bed did not have favorable conditions for the oxidation of nitrogen to nitrate, or that there was an additional source of nitrogen, such as the nearby population or industrial discharges, near the sampling sites.
The presence of high concentrations of nitrogen in surface waters can have negative effects on the aquatic ecosystem, including reduced dissolved oxygen and toxicity to aquatic species. In addition, increased agricultural, livestock, and industrial activities, as well as population growth and industrial centers in a watershed, can significantly alter nitrogen and phosphorus concentrations in water [34] (Figure 2). It is important to note that nitrate is also a contaminant that affects public health, and the permissible limit in the water standard for human consumption is 10 mg L-1 [35]. However, this limit was not exceeded in this study.
There are many sources of phosphorus, both natural and anthropogenic. These include soil and rocks, wastewater treatment plants, runoff from fertilized lawns and agricultural fields, failing septic systems, runoff from animal manure storage areas, disturbed land areas, drained wetlands, water treatment, and commercial cleaning products [36].
Sources of phosphorus in surface waters can include agricultural and urban runoff, soil erosion, wastewater treatment plant discharges, atmospheric deposition, and industrial activities, according to a 2021 report by the Minnesota Natural Resources Council. In addition, the report notes that phosphorus can also be released from sediments that accumulate at the bottom of water bodies and are reused by algae and other aquatic plants, which can contribute to increased algal blooms and decreased water quality [37].
Orthophosphate is the oxidized mineral form of phosphorus. Similar to total nitrogen, total phosphorus from SW1 to SW4 and from SW5 to P9 (Figure 1b) shows a similar pattern of development where optimal conditions for oxidation of phosphorus to orthophosphate are not observed.
Figure 3. a) Total Nitrogen and nitrate concentration, b) Total phosphorous in the river channel evaluated.
Preprints 94849 g003
The concentration of phosphorus in domestic wastewater ranges from approximately 4 to 50 mg L-1 [38]. In this study, values within this range were found, specifically 5.60±0.7, 7.40±0.14, 7.60±0.71, 7.95±0.92, and 8.65±0.35 mg L-1. These results suggest the possibility of wastewater discharges into the river due to the presence of human settlements near the banks of the water body, as observed in Figure 1.
Comparing the results obtained in this study with those obtained in studies conducted in rivers in the Manzini and Lubombo regions of Swaziland, it is observed that the average phosphate levels are higher than the recommended level of 2.0 mg L-1 set by the SWSC (Swaziland Water Service Corporation). Specifically, the values obtained in this study (0.55-8.65 mg L-1 P-PO4) are up to 23 times higher than those found by [39].This may be because material from higher elevations reaches this site and is eventually retained as it may have a flatter relief.
In addition, total nitrogen in water is observed to increase as the river flows, due to the amount of total nitrogen carried by the water from its source to its mouth. The EPA has established a recommended limit of 0.05 mg L-1 of total phosphate in lake inlets and 0.1 mg L-1 of total phosphorus in runoff. It is important to note that these limits are designed to ensure water quality and protect the environment.

3.4. Nitrogen/Phosphorus and conductivity/DS ratio
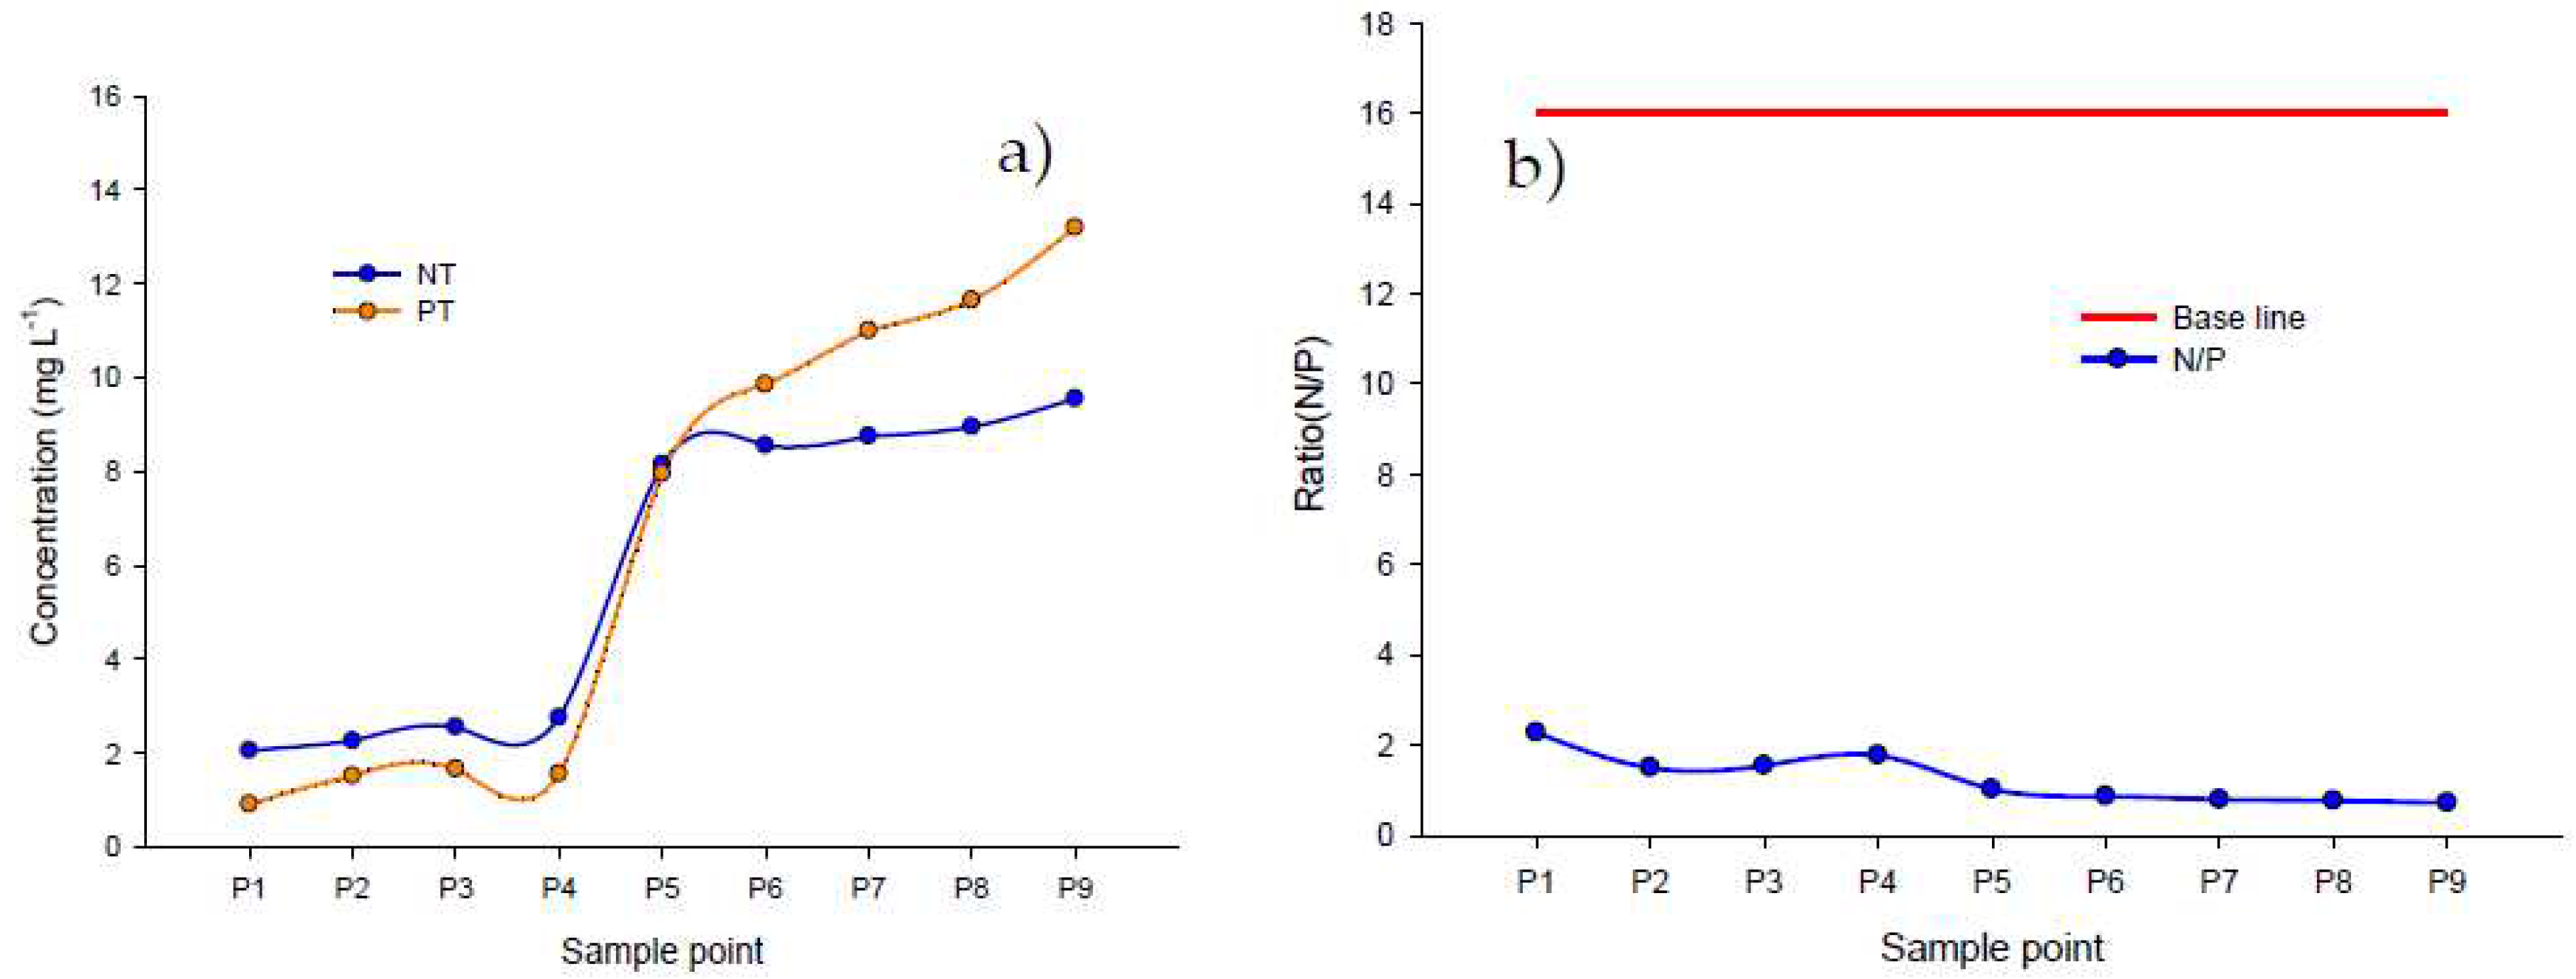
Figure 4. a) Ratio between NT and PT, b) N/P ratio.
Preprints 94849 g004
The nitrogen/phosphorus (N/P) ratio in river water is an important indicator of the health of the aquatic ecosystem and can affect the growth of aquatic organisms such as algae, plants, and phytoplankton. An unbalanced N/P ratio can lead to excessive growth of algae and aquatic plants, resulting in eutrophication and negatively affecting water quality and the organisms that depend on it. Generally, an N/P ratio of 16:1 is considered the ideal ratio for the growth of aquatic organisms in freshwater. However, N/P ratios can vary depending on geographical location and specific environmental conditions [40], as observed in Figure 5 of this study.

3.3. Chemical Oxygen Demand (COD) and Total Dissolved Solids (TDS)

Sources of COD include leaves and woody debris, dead plants and animals, animal manure, effluent from pulp and paper mills, wastewater treatment plants, feedlots, feed processing plants, failing septic systems, and urban stormwater runoff. Discharges of wastes with high COD levels can cause water quality problems such as severe dissolved oxygen depletion and fish kills in receiving waters [41].
High COD levels are not only a water quality issue, but can also be a public health concern. The degradation of organic matter in water can result in the formation of toxic organic compounds, such as trihalomethanes, which have been linked to an increased risk of cancer and other health problems. Therefore, COD is a critical parameter for measuring the presence of organic compounds in contaminated wastewater [42].
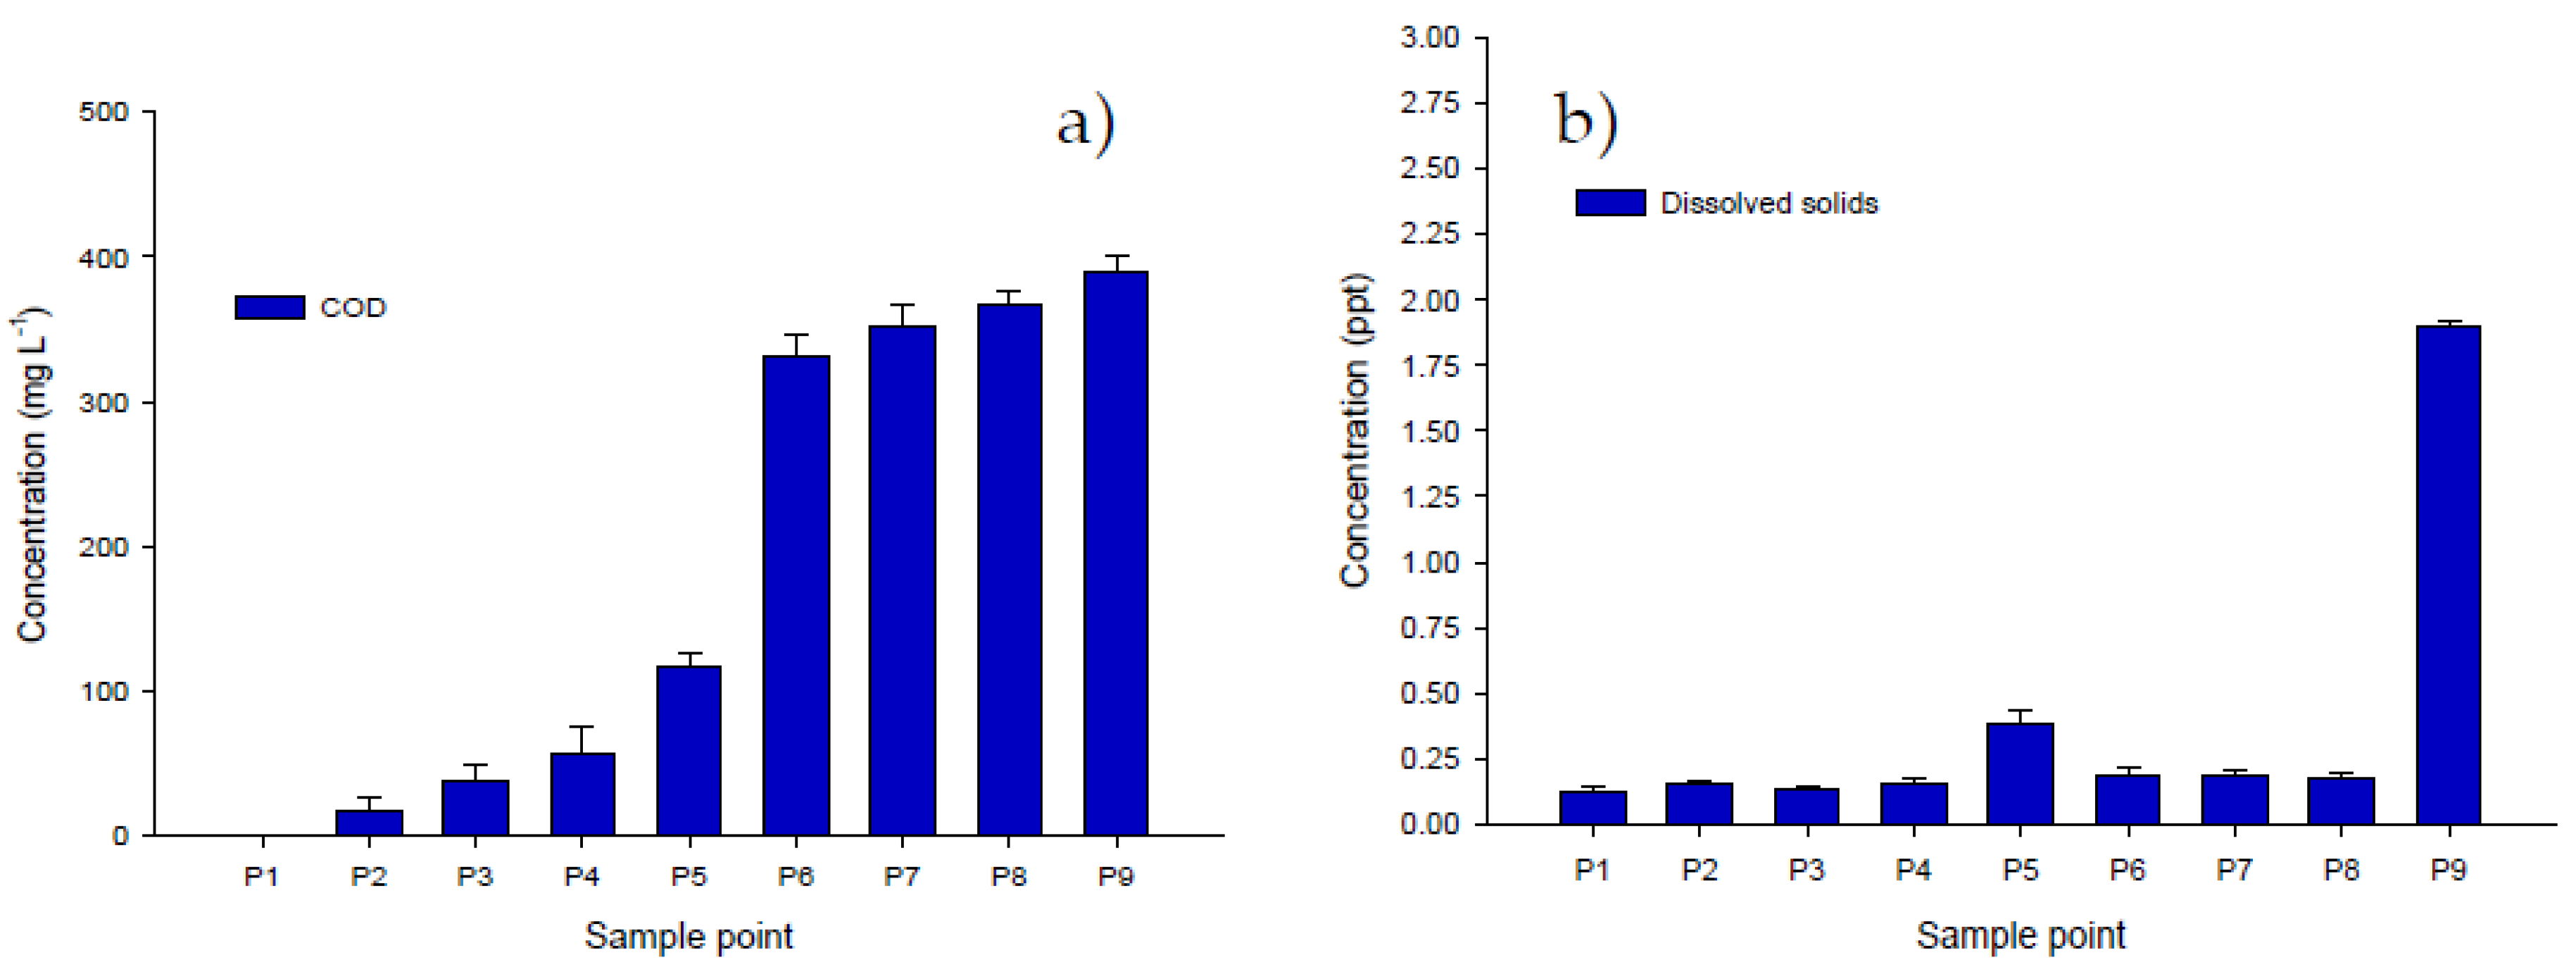
A study by [43] evaluated COD levels in four rivers in South Korea and found values ranging from 0.8 mg L-1 to 11.6 mg L-1. In comparison, in the current study, the values ranged from 0 mg/L to 381 mg/L, indicating higher contamination in the samples studied. A study by [44] evaluated the contamination of the Atoyac River in the metropolitan area of Puebla, Mexico, and found that the average COD values were 130.91 ± 39.52 mg L-1 in the wet season and 260.60 ± 75.32 mg L-1 in the dry season. In this study, the average value obtained was 185.06±169.23 mg L-1 (2a), indicating a high variability between sampling points.
The variation of dissolved solids was not significant, except for SW9 (Figure 6b). The composition of dissolved solids can include salts, metals, metalloids, and dissolved organic matter [45]. Processes that contribute to the presence of organic dissolved solids in streams include the release of organic molecules during biological growth (e.g., by plant roots and microbes) and the decomposition of organic matter within the stream or on its banks. A proportional increase in the amount, of dissolved solids in the water was also observed from SW to SW9, as the water carries more dissolved particles as it flows. There is a polygon along the studied water body that corresponds to industrial zones and areas with population presence that generate wastewater discharges (Figure 3).
Dissolved solids in water are a topic of interest in environmental research because they can affect water quality and human health. According to a study by [46], dissolved solids can include salts, metals, and dissolved organic matter, and can be generated by biological processes such as the decomposition of organic matter and the growth of plants and microbes.

3.6. Fecal coliforms (FC)

Estos estudios muestran la importancia del monitoreo de la contaminación fecal en aguas superficiales y la necesidad de implementar medidas de control para prevenir la propagación de enfermedades y proteger la salud pública y el medio ambiente. Es necesario continuar realizando estudios de monitoreo para evaluar la calidad del agua en diferentes regiones y tomar medidas adecuadas para minimizar la contaminación fecal en el agua.
According to the World Health Organization (WHO), coliform bacteria are a group of microorganisms found in large quantities in human and animal feces. Their presence in water may indicate fecal contamination and, consequently, the possible presence of other associated pathogens (OMS, 2011). Coliform bacteria can cause serious illnesses such as gastroenteritis or diarrhea through contaminated water from untreated sewage, septic tanks, etc. [48]. The fecal bacteria groups Escherichia coli (the most commonly isolated organism in the clinical laboratory [49], Klebsiella, and Enterobacter, which are found in the gastrointestinal tract of warm-blooded animals [50], are used as indicators of water quality because their presence is associated with some of the most difficult to detect pathogens, such as Salmonella, Shigella, and Vibrio, which cause gastroenteritis, dysentery, typhoid, and cholera.
Table 3 shows the distribution of fecal coliforms at the nine study sites in the Bobos River. There is an increase in the concentration of these microorganisms from SW1 (0 × 100±0 × 100) to SW9 (3.2 × 10⁵±3.707107 × 10⁴). According to Figure 3, this increase in coliform density is mainly due to the type of discharge present at each sampling point. This study found a significant variation (p<0.05) in CFU values between different sampling points, especially between SW1 and SW9. The monitoring of fecal contamination in water used for industrial and recreational purposes is crucial due to the economic and public health implications.
These studies highlight the importance of monitoring fecal contamination in surface waters and the need to implement control measures to prevent the spread of disease, thereby protecting public health and the environment. Continued monitoring studies are needed to assess water quality in different regions and to take appropriate measures to minimize fecal contamination in water.

3.7. Quantification of NaOH (%)

Sodium hydroxide (NaOH) is a caustic substance that commonly appears in wastewater from drain and oven cleaners, paint and varnish removers, degreasers, dishwasher detergents, and alkaline batteries. This chemical is used in the manufacturing of aluminum, rayon, and biodiesel, along with various organic synthesis procedures. It is a frequently occurring byproduct in the production of chlorine [51], and is also found in pharmaceuticals like Clintest® [52]. NaOH can alter water pH [53], and its occurrence in drinking water might mark contamination or system malfunctions. In wastewater, NaOH detections may pinpoint industrial discharges or cleaning product use.
Appropriate identification and control of NaOH are crucial to preserving water quality and averting any detrimental consequences to the environment and public health. However, NaOH was detected at points SW5, SW6, and SW7 of this study, with concentrations of 6.8%, 5.6%, and 3.9% respectively. These findings may be attributed to discharges originating from the settlements and even industries in the study area. The Mexican Official Standard NOM-001-SEMARNAT-2021 defines the acceptable levels of wastewater contaminants that can be released into national water bodies, but it does not specifically mention NaOH.
Concerns regarding the presence of contaminants are associated with the local population, who use these bodies of water for recreational and aquacultural purposes. As the level of contamination in the water is high, immersion in it may provoke health issues. Reports from residents suggest that contact with this tributary’s water can result in skin rashes, itching, diarrhea, and respiratory illnesses. To date, there is a dearth of research evaluating these conditions, highlighting the urgency to address this matter to safeguard the well-being of the community.

3.8. Statistical Analysis

3.8.1. Pearson correlation

Correlation analysis determines whether the relationship between two variables is present or absent, and that two variables are associated to a degree. Table 4 shows the correlation of the parameters evaluated, with the following correlations: Temperature/CF; Conductivity/DS; TN/ NO3, TP, PO4, COD, FC; NO3 /TP, PO4, COD, FC; PO4 /COD, FF; COD/FC, all these are positive correlations, i.e., if one parameter increases the other with which it correlates will also increase. This correlation becomes stronger when the given value is close to 1.

3.8.2. Principal Component Analysis (PCA)

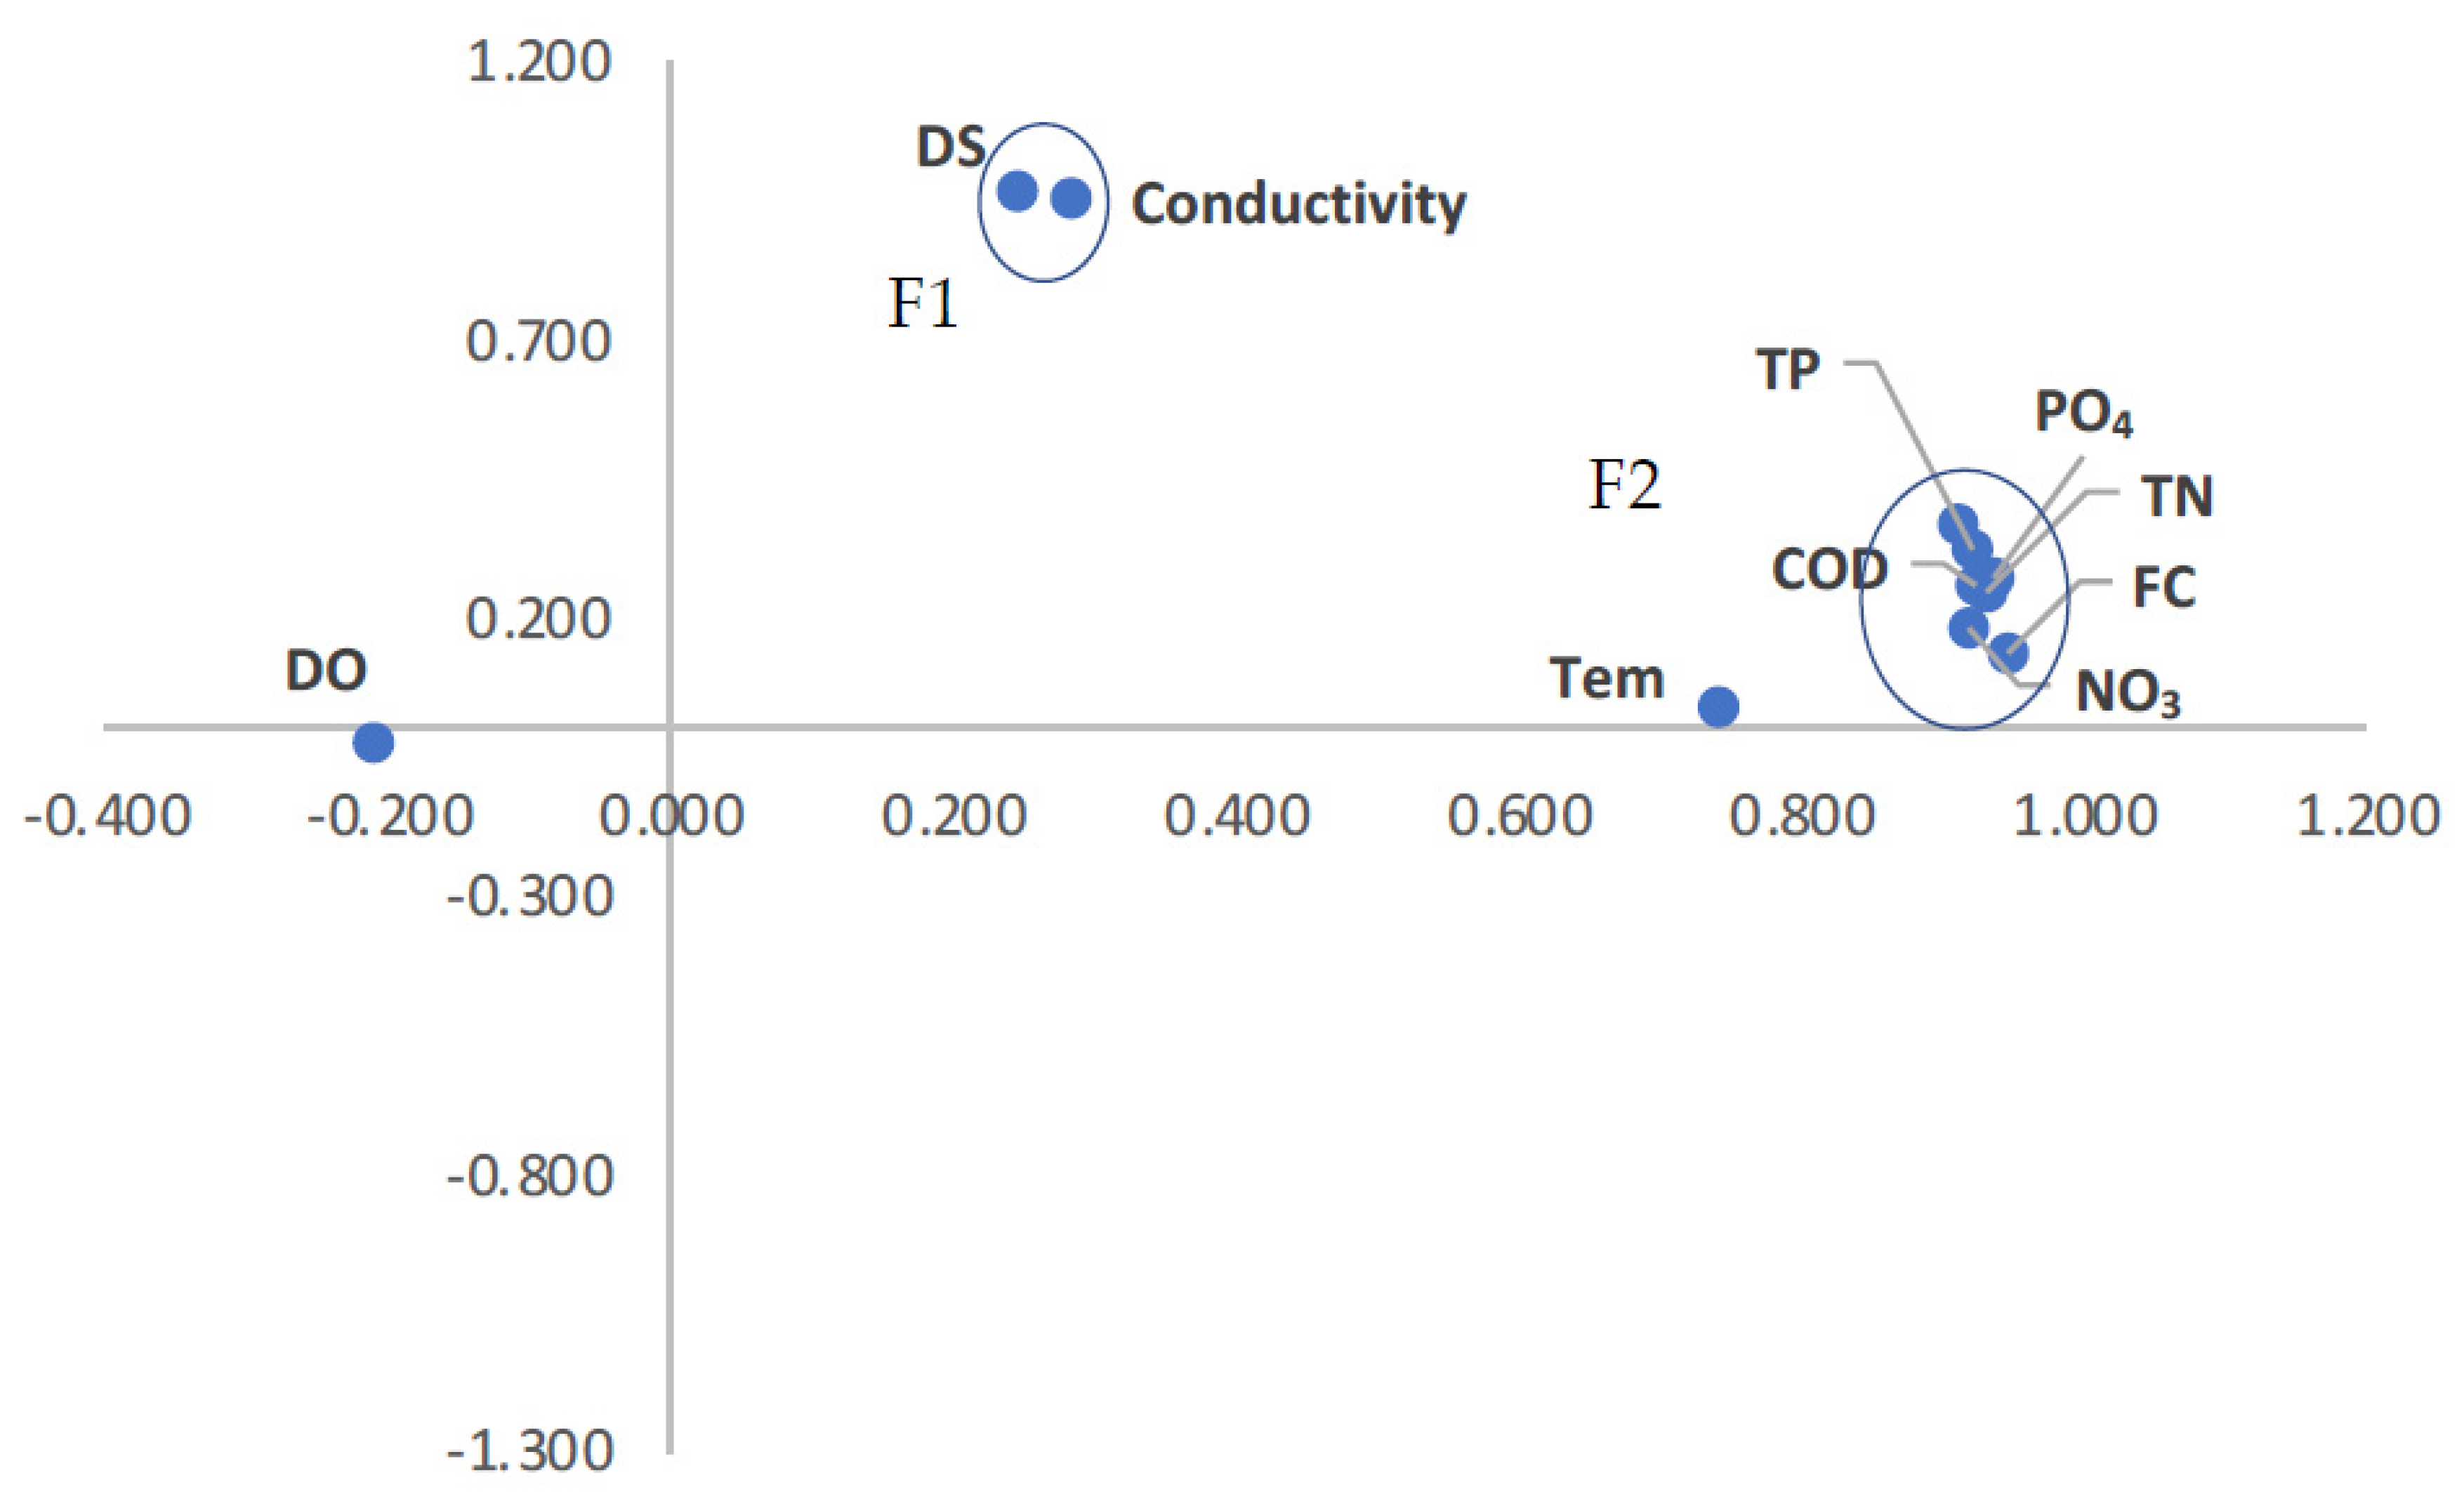
PCA is a statistical technique used in environmental analysis to reduce the number of variables needed to characterize an ecosystem [54]. Figure 7 shows that using the obtained coordinates (rotated components) and relating the first and second principal components, two well-defined groups can be identified. One is composed of TP, PO4, TN, FC, NO3, SP, and COD (F1), while the other is composed of DS and conductivity (F2). Conductivity (EC) and total dissolved solids (DS) are water quality parameters used to describe the level of salinity. The relationship between conductivity and DS is not linear and depends on the activity of specific dissolved ions, the average activity of all ions in the liquid, and the ionic strength [55]. Furthermore, in F1, a close correlation was found between parameters, including SP (sampling point), indicating that the sampling point influences the measured parameters.
Temperature is not a preponderant variable, as well as DO; however, [56] highlights the importance of these two parameters as they influence most of the life processes of organisms, as well as various abiotic factors in the ecosystem.
The presence of oxygen is critical for the transformation of nitrogen and phosphorus compounds in river water [57], which highlights the importance of monitoring the variability of oxygen concentration in water as a tool for recommending sustainable use of aquatic environments [42]. Although it was expected to find a correlation or clustering between temperature and the presence of FC in some components, this was not found in this study. Instead, temperature does not appear to be a relevant factor in the presence of FC, unlike the parameters that make up F1. This suggests that FC growth may be related to nutrients and water pH.

3.9. The environmental impact of Martinez de la Torre, Veracruz on the Bobos River

The demographic growth, urban development, and human activities in its surroundings have significantly impacted the environment, especially in the upper parts of watersheds, where industry, population, and rainfall directly affect urban areas. The world is urbanizing at a rapid pace, and it is essential to observe the interaction between urban centers, watersheds, rivers, and slope areas to prevent risks and ensure the water supply for human consumption, which is crucial for achieving sustainable development. An example of the effects of demographic and urban growth can be observed in Martínez de la Torre, Veracruz, where as early as 1970, there was a growing and cumulative housing problem due to population growth [58].
In warm climates such as Veracruz, a population of more than 150,000 inhabitants consumes approximately 350 L of water per day-1 and produces 262.50 L of wastewater per day-1. The main sources of pollution are the population living along the river (municipal wastewater) and the citrus industry in the municipality, whose wastewater is discharged into the studied water body. In 2020, the population of Martínez de la Torre will reach 108,842 inhabitants, while Tlapacoyan will have 61,337 inhabitants, San Rafael 30,351 inhabitants, and Nautla 10,130 inhabitants, a total of 210,660 inhabitants that will affect the study area [59]. These inhabitants generate wastewater and, in turn, use water from the basin and the studied water body, which can have a significant impact on water quality. Given a daily water consumption of 350 liters per person in a population of this size, it is estimated that approximately 38,069,700 liters of water are consumed per day, generating approximately 262.50 liters of wastewater per person per day in this region. Therefore, it is calculated that the population of Martínez de la Torre generates about 28,542,750 L of wastewater per day.
After China, Mexico is the second country in the world that uses the most wastewater in agricultural activities and is the Latin American country that irrigates the most hectares with untreated wastewater [60]. An example of this is Mexico City, where wastewater is discharged into the Tula River basin, providing water to an area that is scarce due to climatic conditions [61,62]. Despite providing economic benefits to farmers in the region, the same cannot be said for the study area, as wastewater discharged into the Bobos River basin flows into the open sea, and its effects have not yet been evaluated.
The results obtained show that there is an accumulative effect in this area since nature is not able to clean the existing pollutants in time and space. This phenomenon is visible in the points SW4-SWP9, where the highest concentration of pollutants is recorded downstream. According to the Water Quality Index (WQI) developed by [63], the presence of COD >200 mg L-1 in surface waters indicates that they have been heavily affected by both urban and non-urban wastewater discharges. In this study, values up to 389 mg L-1 were detected, indicating a situation of high pollution.
The alteration of river flows and the transport of sediment downstream are responsible for the most significant environmental impacts, endangering aquatic life and riparian ecosystems. This problem poses a threat to the survival of an entire watershed, as evidenced by various studies. Considering that the world’s population is expected to reach 9 billion by 2050, the demand for water, food, and energy is expected to increase significantly, with estimated increases of 55%, 60% and 80%, respectively. This situation puts tremendous pressure on natural water systems, making it imperative to reduce the use of water resources. One possible solution would be to limit water consumption to 150 liters per person per day, which would allow the generation of only 100 liters of wastewater per person per day. This approach would help prevent the depletion of water resources and reduce the continuous discharge of large volumes of wastewater into surface water bodies.
Martínez de la Torre is a city in Veracruz, Mexico, known for its citrus production, particularly lemons and oranges [64]. Despite being known for its citrus industry, it has negatively impacted the local environment, particularly water quality and public health. In addition to contamination during the citrus production chain, the industry has been responsible for contamination with organic waste from juice exporting companies such as Citrusper, Citrex, Citrofrut, and Sicar Farms. These companies have been discharging contaminated water into the Bobos River for many years [65]. However, it was not until 2014 and 2015 that PROFEPA [66] initiated administrative proceedings against Citrofrut, S.A. de C.V., and Cítricos Ex, S.A. de C.V., primarily for irregularities in wastewater discharges and the characterization of the sludge generated in the treatment plant.
So far, there is no additional information on the characterization of the Bobos River. However, it is known that the inhabitants of this community are economically dependent on aquaculture activities. They deplore this serious pollution, which is gradually reducing the fish population. The local population points out that the citrus companies located in this region are the main culprits for the death of crustaceans and fish because they dispose of polluting liquids in the tributary of the river [67]. The production of these companies generates wastes that harm the environment, especially the water body of the Bobos River, streams, and aquifers near the areas where they are disposed of. In addition, these wastes have a significant negative impact on the local flora and fauna, affecting fishermen and residents of the area. The pollution also has a significant impact on the air and soil quality in this industrial area and is not limited to the city’s waters. Para abordar estos problemas, se necesitan políticas y prácticas más sostenibles en la producción citrícola. Some solutions include the implementation of cleaner agricultural practices and the promotion of composting methods for the disposal of organic waste generated by the citrus industry.

3.9. Preventive measures to avoid contamination of the Bobos River and to maintain sustainable development in the region.

The Bobos River in Veracruz is an important water source for the region and it is essential to take preventive measures to avoid its contamination. Some of the measures that can be implemented are Promoting sustainable agricultural practices, which is a measure so that the water resource does not continue to be polluted, and since a large amount of pollution in the Bobos River comes from agriculture, action must be taken, so sustainable practices should be promoted to reduce the use of chemicals and pesticides used on crops. In this sense, crop rotation is also an option, since instead of growing the same crop in the same place year after year, crops can be rotated to reduce the accumulation of pests and diseases in the soil. Although this is an area where crops are perennial, there are still areas where it is possible to use these techniques.
Large citrus orchards can use cover crops during fallow periods to protect the soil from erosion and improve soil health. These crops can also act as natural nutrient reservoirs, reducing the need for chemical fertilizers. In addition, instead of relying solely on pesticides, integrated pest management practices can be implemented, which include the use of mechanical, biological, and cultural techniques to control pests more sustainably. Considering that organic agriculture is based on the use of natural and sustainable practices to grow food without the use of pesticides and chemical fertilizers. The adoption of organic farming techniques can significantly reduce the amount of chemicals used in agriculture and the pollution of the Bobos River.
Training employees in sustainable and responsible production and waste management practices, as well as raising awareness of the importance of protecting the environment and the Bobos River, are good industry practices. Control and monitoring are critical for ensuring compliance with environmental standards and avoiding river contamination. This could entail deploying environmental monitoring systems and performing regular audits to pinpoint areas for enhancement.
The competent authorities must establish regulations and restrictions for industries that use the Bobos River for their activities. Limits should be set on the amount of chemicals that can be discharged into the river, and sanctions should be imposed on companies that violate these regulations. Communities near the Bobos River should have sewage treatment systems to prevent contaminated water from entering the river. Encouraging citizen participation through local communities can help prevent pollution of the Bobos River through active participation in protecting and caring for the river. Cleaning and monitoring activities by the public should be encouraged.
Pollution of the Bobos River is a problem that affects not only the health of the people living in the region but also the sustainability of the local ecosystem. Therefore, the community needs to take preventive measures to avoid river pollution and promote sustainable development. Here are some actions that the community can take:
The community needs to refrain from littering the Bobos River. Litter can accumulate in the water and affect water quality and aquatic life. Therefore, appropriate waste disposal sites should be established. Chemicals such as pesticides and fertilizers can be harmful to the river and aquatic organisms. Therefore, people need to control the use of these chemicals in their homes and farmlands. Instead, more natural and ecological methods can be used to control pests and fertilize crops.
Reforestation is an important measure to maintain water quality and protect the Bobos River ecosystem. The community can promote reforestation by planting trees along the riverbanks and in nearby areas. Trees will help maintain water quality by absorbing nutrients and pollutants and providing habitat for aquatic organisms. Environmental education is another way to raise awareness about the importance of caring for the Bobos River and the environment in general. Environmental education programs should be established in schools and the community to raise awareness about the importance of protecting the river and the local ecosystem. In addition, river cleaning activities should be promoted to encourage community participation in the conservation of the Bobos River.
Wastewater treatment requires the implementation of wastewater treatment systems to reduce the amount of pollutants discharged into the river. This may involve the installation of filtration and purification systems to remove pollutants from wastewater before it is discharged into the river. Industries should adopt cleaner and more efficient technologies to reduce the emissions of greenhouse gases and other pollutants they produce. This may include the use of renewable energy, the implementation of more efficient production processes, the use of energy-efficient equipment and machinery, and water treatment systems such as constructed wetlands.

4. Conclusions

Based on the obtained results and existing regulations, it has been determined that the water quality of the Bobos River in the state of Veracruz is poor. The river receives wastewater discharges that greatly affect its quality, with COD levels exceeding 200 mg L-1, indicating severe contamination. It is imperative to take measures to control wastewater discharges to prevent further negative impacts and protect the river. However, further research is necessary to determine the appropriate measures that need to be taken, as there is insufficient information regarding the water quality of the Bobos River. Strict regulatory supervision and continuous environmental monitoring must be implemented during and after the execution of these measures. Policies and regulations should be established to ensure sustainable supply and fair distribution of water resources while maintaining their sustainability.

References

  1. M. Strokal et al., “Urbanization: an increasing source of multiple pollutants to rivers in the 21st century,” npj Urban Sustainability, vol. 1, no. 1, p. 24, Apr. 2021. [CrossRef]
  2. L. Jiang and B. C. O’Neill, “Global urbanization projections for the Shared Socioeconomic Pathways,” Global Environmental Change, vol. 42, pp. 193–199, Jan. 2017. [CrossRef]
  3. J. Diamond et al., “Use of prospective and retrospective risk assessment methods that simplify chemical mixtures associated with treated domestic wastewater discharges,” Environ Toxicol Chem, vol. 37, no. 3, pp. 690–702, Mar. 2018. [CrossRef]
  4. J. Singh, P. Yadav, A. K. Pal, and V. Mishra, “Water Pollutants: Origin and Status,” 2020, pp. 5–20. [CrossRef]
  5. S. T. Coelho, “Existing Barriers for WtE in Developing Countries and Policy Recommendations,” in Municipal Solid Waste Energy Conversion in Developing Countries, Elsevier, 2020, pp. 219–234. [CrossRef]
  6. M. C. M. Blettler, N. Garello, L. Ginon, E. Abrial, L. A. Espinola, and K. M. Wantzen, “Massive plastic pollution in a mega-river of a developing country: Sediment deposition and ingestion by fish (Prochilodus lineatus),” Environmental Pollution, vol. 255, p. 113348, Dec. 2019. [CrossRef]
  7. M. S. Islam, M. K. Ahmed, M. Raknuzzaman, M. Habibullah -Al- Mamun, and M. K. Islam, “Heavy metal pollution in surface water and sediment: A preliminary assessment of an urban river in a developing country,” Ecol Indic, vol. 48, pp. 282–291, Jan. 2015. [CrossRef]
  8. E. Calizza et al., “Isotopic biomonitoring of N pollution in rivers embedded in complex human landscapes,” Science of The Total Environment, vol. 706, p. 136081, Mar. 2020. [CrossRef]
  9. H. Ju, S. Li, Y. Xu, G. Zhang, and J. Zhang, “Intensive Livestock Production Causing Antibiotic Pollution in the Yinma River of Northeast China,” Water (Basel), vol. 11, no. 10, p. 2006, Sep. 2019. [CrossRef]
  10. J. Wu and J. Lu, “Landscape patterns regulate non-point source nutrient pollution in an agricultural watershed,” Science of The Total Environment, vol. 669, pp. 377–388, Jun. 2019. [CrossRef]
  11. M. del Refugio Castañeda-Chávez, F. Lango-Reynoso, and G. Navarrete-Rodríguez, “Study on Contamination by Heavy Metals in the Cotaxtla-Jamapa Basin with Influence in the Central Zone of the Gulf of Mexico,” Water Air Soil Pollut, vol. 231, no. 3, p. 99, Mar. 2020. [CrossRef]
  12. D. Chalchisa, M. Megersa, and A. Beyene, “Assessment of the quality of drinking water in storage tanks and its implication on the safety of urban water supply in developing countries,” Environmental Systems Research, vol. 6, no. 1, p. 12, Jan. 2018. [CrossRef]
  13. J. Xiao, L. Wang, L. Deng, and Z. Jin, “Characteristics, sources, water quality and health risk assessment of trace elements in river water and well water in the Chinese Loess Plateau,” Science of The Total Environment, vol. 650, pp. 2004–2012, Feb. 2019. [CrossRef]
  14. Gobierno del Estado de Veracruz, “Diagnóstico Cuenca del Río Nautla,” http://www.veracruz.gob.mx/proteccioncivil/wp-content/uploads/sites/5/2021/12/Diagn%C3%B3stico-Cuenca-del-rio-Nautla.pdf.
  15. Procuraduría Estatal de Protección al Medio Ambiente de Veracruz, “Programa de Ordenamiento Ecológico de la Cuenca del Río Bobos,” http://www.veracruz.gob.mx/medioambiente/poecrb/.
  16. APHA, “Standard methods for examination of water and wastewater. American Public Health Association, American Water Works Association, Water Pollution Control Federation.” Washington, EUA., p. 1035, 1995.
  17. USEPA, “Methods for chemical analysis of water and wastes,” Report No. EPA-600/4-79-020. Washington, EUA, p. 544, 1983.
  18. R. Abdi and T. Endreny, “A River Temperature Model to Assist Managers in Identifying Thermal Pollution Causes and Solutions,” Water (Basel), vol. 11, no. 5, p. 1060, May 2019. [CrossRef]
  19. A. T. Demetillo, M. V. Japitana, and E. B. Taboada, “A system for monitoring water quality in a large aquatic area using wireless sensor network technology,” Sustainable Environment Research, vol. 29, no. 1, p. 12, Dec. 2019. [CrossRef]
  20. O. Bozorg-Haddad, M. Delpasand, and H. A. Loáiciga, “Water quality, hygiene, and health,” in Economical, Political, and Social Issues in Water Resources, Elsevier, 2021, pp. 217–257. [CrossRef]
  21. K. Dębska, B. Rutkowska, W. Szulc, and D. Gozdowski, “Changes in Selected Water Quality Parameters in the Utrata River as a Function of Catchment Area Land Use,” Water (Basel), vol. 13, no. 21, p. 2989, Oct. 2021. [CrossRef]
  22. I. Giri, R. K.C., and U. R. Khadka, “Water quality status in Bagmati river of Kathmandu valley, Nepal,” in Ecological Significance of River Ecosystems, Elsevier, 2022, pp. 481–502. [CrossRef]
  23. N. Zhao, Z. Fan, and M. Zhao, “A New Approach for Estimating Dissolved Oxygen Based on a High-Accuracy Surface Modeling Method,” Sensors, vol. 21, no. 12, p. 3954, Jun. 2021. [CrossRef]
  24. E. Hazen, J. Craig, C. Good, and L. Crowder, “Vertical distribution of fish biomass in hypoxic waters on the Gulf of Mexico shelf,” Mar Ecol Prog Ser, vol. 375, pp. 195–207, Jan. 2009. [CrossRef]
  25. M. Dai et al., “Oxygen depletion in the upper reach of the Pearl River estuary during a winter drought,” Mar Chem, vol. 102, no. 1–2, pp. 159–169, Nov. 2006. [CrossRef]
  26. T. Rajendiran, C. Sabarathinam, B. Panda, and V. Elumalai, “Influence of Dissolved Oxygen, Water Level and Temperature on Dissolved Organic Carbon in Coastal Groundwater,” Hydrology, vol. 10, no. 4, p. 85, Apr. 2023. [CrossRef]
  27. F. Akhter, H. R. Siddiquei, M. E. E. Alahi, and S. C. Mukhopadhyay, “Recent Advancement of the Sensors for Monitoring the Water Quality Parameters in Smart Fisheries Farming,” Computers, vol. 10, no. 3, p. 26, Feb. 2021. [CrossRef]
  28. O. Mitryasova and V. Pohrebennyk, “Hydrochemical Indicators of Water System Analysis as Factors of the Environmental Quality State,” 2020, pp. 91–104. [CrossRef]
  29. M. P. Patel, B. Gami, A. Patel, P. Patel, and B. Patel, “Climatic and anthropogenic impact on groundwater quality of agriculture dominated areas of southern and central Gujarat, India,” Groundw Sustain Dev, vol. 10, p. 100306, Apr. 2020. [CrossRef]
  30. I. B. Koki and A. S. Bayero, “Assessment of Water Quality in Rivers and Lakes With Respect to Heavy Metals and General Water Quality Parameters: A Review.,” Int J Sci Res, vol. 4, 2016.
  31. A. Mathur, “Conductivity: Water Quality Assesment,” International Journal of Engineering Research & Technology (, vol. 3, no. 3, pp. 1–3, 2015.
  32. E. A. Ríos-Villamizar, M. T. F. Piedade, J. G. Da Costa, J. M. Adeney, and W. J. Junk, “Chemistry of different Amazonian water types for river classification: a preliminary review,” Sep. 2013, pp. 17–28. [CrossRef]
  33. S. R., Carpenter, N. F., Caraco, D. L., Correll, R. W., Howarth, A. N., Sharpley, and V. H. Smith, “Nonpoint pollution of surface waters with phosphorus and nitrogen,” Ecological applications, vol. 8, no. 3, pp. 559–568, 1998. [CrossRef]
  34. Z. Rivas et al., “Nitrógeno y fósforo totales de los ríos tributarios al sistema lago de Maracaibo, Venezuela,” Interciencia, vol. 34, no. 5, pp. 308–314, 2009.
  35. Secretaría de Salud y Asistencia, “Salud ambiental, agua para uso y consumo humano-Lí-mites permisibles de calidad y tratamientos a que debe someterse el agua para su potabilización.,” NOM-127-SSA1-1994. https://dof.gob.mx/nota_detalle.php?codigo=4866379&fecha=18/01/1996#gsc.tab=0.
  36. R. Bhateria and D. Jain, “Water quality assessment of lake water: a review,” Sustain Water Resour Manag, vol. 2, no. 2, pp. 161–173, Jun. 2016. [CrossRef]
  37. World Health Organization, “Guidelines for drinking-water quality,” World Health Organization, 2011.
  38. V. M. Arteaga-Cortez, A. Quevedo-Nolasco, D. H. del Valle-Paniagua, M. Castro-Popoca, Á. Bravo-Vinaja, and J. A. Ramírez-Zierold, “Estado del arte: una revisión actual a los mecanismos que realizan los humedales artificiales para la remoción de nitrógeno y fósforo,” Tecnología y ciencias del agua, vol. 10, no. 5, pp. 319–342, Sep. 2019. [CrossRef]
  39. A. O. Fadiran, S. C. Dlamini, and A. Mavuso, “A comparative study of the phosphate levels in some surface and ground water bodiesof Swaziland</b>,” Bull Chem Soc Ethiop, vol. 22, no. 2, Jul. 2008. [CrossRef]
  40. Y. Liu, Y. Zhu, X. Qiao, B. Zheng, S. Chang, and Q. Fu, “Investigation of nitrogen and phosphorus contents in water in the tributaries of Danjiangkou Reservoir,” R Soc Open Sci, vol. 5, no. 1, p. 170624, Jan. 2018. [CrossRef]
  41. R. M. Penn, J. J. Pauer, and R. J. Mihelcic, “Biochemical Oxygen Demand,” vol. II, 2017.
  42. A. Grzyb, A. Wolna-Maruwka, and A. Niewiadomska, “The Significance of Microbial Transformation of Nitrogen Compounds in the Light of Integrated Crop Management,” Agronomy, vol. 11, no. 7, p. 1415, Jul. 2021. [CrossRef]
  43. J. Lee, S. Lee, S. Yu, and D. Rhew, “Relationships between water quality parameters in rivers and lakes: BOD5, COD, NBOPs, and TOC,” Environ Monit Assess, vol. 188, no. 4, p. 252, Apr. 2016. [CrossRef]
  44. G. Pérez Castresana et al., “Atoyac River Pollution in the Metropolitan Area of Puebla, México,” Water (Basel), vol. 10, no. 3, p. 267, Mar. 2018. [CrossRef]
  45. G. E. Adjovu, H. Stephen, D. James, and S. Ahmad, “Measurement of Total Dissolved Solids and Total Suspended Solids in Water Systems: A Review of the Issues, Conventional, and Remote Sensing Techniques,” Remote Sens (Basel), vol. 15, no. 14, p. 3534, Jul. 2023. [CrossRef]
  46. F. E. Akpan, M. V. Akpan, and U. U. Inyang, “Geoelectrical Investigation Of Groundwater Quality Through Estimates Of Total Dissolved Solids And Electrical Conductivity In Parts Of Akwa Ibom State, Southern Nigeria,” Malaysian Journal of Geosciences, vol. 4, no. 1, pp. 32–37, Jul. 2020. [CrossRef]
  47. OMS (Organización Mundial de la Salusd, “Guías para la calidad del agua potable. Cuarta edición,” Ginebra: OMS, 2011.
  48. M. Seo, H. Lee, and Y. Kim, “Relationship between Coliform Bacteria and Water Quality Factors at Weir Stations in the Nakdong River, South Korea,” Water (Basel), vol. 11, no. 6, p. 1171, Jun. 2019. [CrossRef]
  49. M. N. Guentzel, “Escherichia, Klebsiella, Enterobacter, Serratia, Citrobacter, and Proteus.,” in In: Baron S, editor. Medical Microbiology. 4th edition. Galveston (TX): University of Texas Medical Branch at Galveston., 1996.
  50. M. Mishra, A. P. Arukha, A. K. Patel, N. Behera, T. K. Mohanta, and D. Yadav, “Multi-Drug Resistant Coliform: Water Sanitary Standards and Health Hazards,” Front Pharmacol, vol. 9, Jun. 2018. [CrossRef]
  51. C. P. Dillon, “Process Industries: Corrosion,” in Encyclopedia of Materials: Science and Technology, Elsevier, 2001, pp. 7856–7860. [CrossRef]
  52. S. E. Gad, “Lye,” in Encyclopedia of Toxicology, Elsevier, 2024, pp. 997–1001. [CrossRef]
  53. M. A. Naylor, H. Kaiser, and C. L. W. Jones, “The effect of dosing with sodium hydroxide (NaOH−) on water pH and growth of Haliotis midae in an abalone serial-use raceway,” Aquaculture International, Aug. 2012. [CrossRef]
  54. F. Janekovi and T. Novak, “PCA – A Powerful Method for Analyze Ecological Niches,” in Principal Component Analysis - Multidisciplinary Applications, InTech, 2012. [CrossRef]
  55. S. Choo-in, “The relationship between the total dissolved solids and the conductivity value of drinking water, surface water and wastewater,” in The 2019 International Academic Research Conference in Amsterdam, 2019, pp. 11–16.
  56. L. Riđanović, S. Riđanović, D. Jurica, and P. Spasojević, “Evaluation of Water Temperature and Dissolved Oxygen Regimes in River Neretva,” 2010.
  57. C. Kim, Y. Nishimura, and T. Nagata, “Role of dissolved organic matter in hypolimnetic mineralization of carbon and nitrogen in a large, monomictic lake,” Limnol Oceanogr, vol. 51, no. 1, pp. 70–78, Jan. 2006. [CrossRef]
  58. G. L. I. Silva, “The housing problem in Veracruz: The case of Martinez de la Torre,” Centro de Estudios Económicos y Sociales del Instituto de Investigaciones y Estudios Superiores Económicos y Sociales de la Universidad Veracruzana., pp. 281–306, 1995.
  59. INEGI, “Martínez de la Torre,” https://www.inegi.org.mx/app/ageeml/#datos_generales/30/30081.
  60. A. V. Garza, “Agricultural reuse of wastewater from Cd. Juarez, (Chih., Mexico).,” in In the Juarez Valley and its impact on public health., 2020, p. 10.
  61. E. M. García-Salazar, “Wastewater as a generator of agricultural activity space in the Mezquital Valley, Hidalgo, Mexico.,” Journal of contemporary food and regional development., vol. 29, no. 54, pp. 2–34, 2019.
  62. E. M. García-Salazar and M. E. Fuentes-Carrasco, “The wastewater dispute in Mexico as a paradoxical ecological-distributive conflicts.,” Regions & Cohesion, vol. 11, no. 3, pp. 54–79, 2021.
  63. SEMARNAT, “D3_R_AGUA05_01. Compendio de Información Ambiental.,” https://apps1.semarnat.gob.mx:8443/dgeia/compendio_2020/dgeiawf.semarnat.gob.mx_8080/approot/dgeia_mce/html/RECUADROS_INT_GLOS/D3_AGUA/D3_AGUA04/D3_R_AGUA05_01.htm.
  64. I. Caamal Cauich, V. G. Pat Fernández, F. Jerónimo Ascencio, L. E. Santoyo Rodríguez, and J. G. Ramos García, “Análisis de los costos de producción del limón persa en el municipio de Tlapacoyan, Veracruz,” Revista Biológico Agropecuaria Tuxpan, vol. 2, no. 1, pp. 10–18, Jul. 2014. [CrossRef]
  65. Heraldo de México, “Citrusper genera contaminación.,” https://elheraldodemartinez.com.mx/estado/martinez-de-la-torre/63638-citrusper-genera-contaminacion.html.
  66. PROFEPA, “Inspecciona PROFEMA a empresas ubicadas en Río Filobobos en Veracruz,” https://www.profepa.gob.mx/innovaportal/v/7181/1/mx.wap/inspecciona_profepa_a_empresas_ubicadas_en_rio_filobobos_en_veracruz.html.
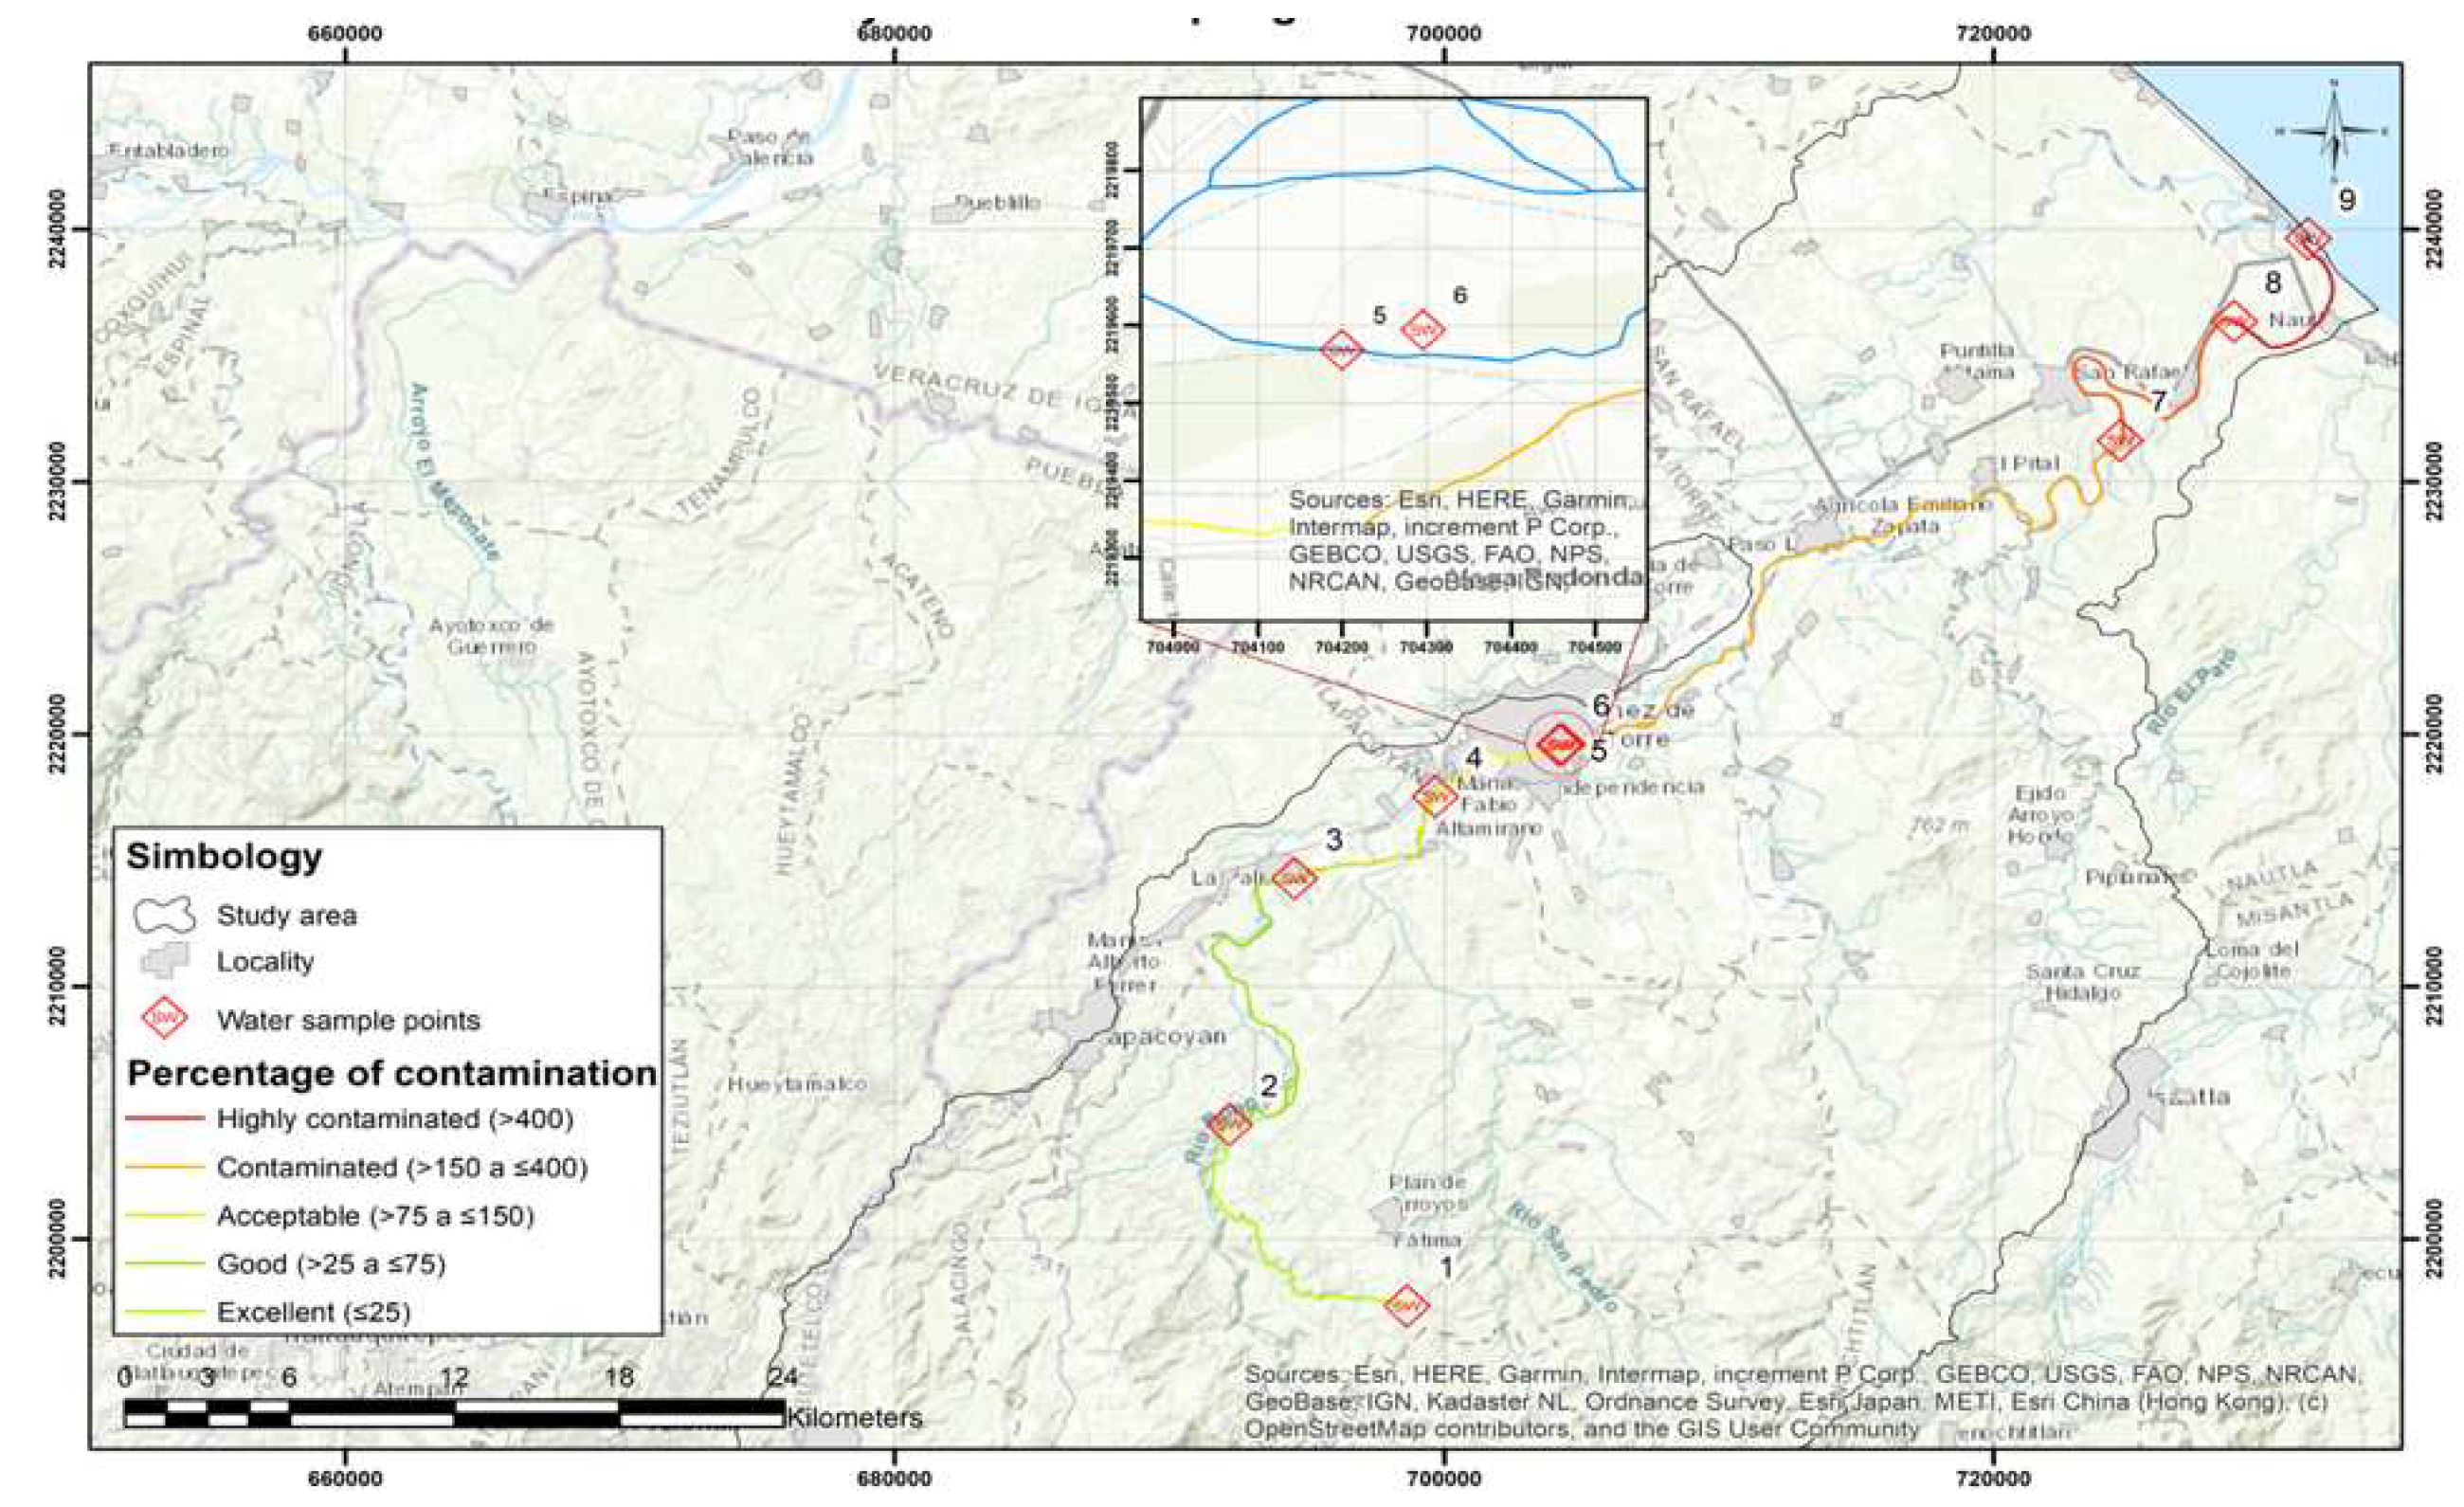
Figure 1. Location of the study area and sampling site in the Bobos River basin.
Preprints 94849 g001
Figure 2. Localization of the study area and industries.
Preprints 94849 g002
Figure 5. a) Concentration COD and, b) Concentration dissolved solids.
Preprints 94849 g005
Figure 6. Principal Component Analysis of Evaluated Variables.
Preprints 94849 g006
Table 1. Temperature and DO concentration.
Parameter SW1 SW2 SW3 SW4 SW5 SW6 SW7 SW8 SW9
Temperature (°C) 20.21±0.28 26.7±.014 29.60.71 30.25±0.64 29.80±0.4 29.40±0.42 30.50±0.57 30.30±0.14 30.35±0.21
DO (mg L-1 ) 0.15±0.7 0.25±0.07 6.45±1.06 0.30±0.14 2.64±0.05 0.25±0.021 0.15±0.07 0.35±0.21 0.60±0.14
OD: oxigeno disuelto; SW: Water sample point; ±: desviación estantar.
Table 2. pH and conductivity at the sampled points.
Sites
pH Conductivity
(mS )
SW1 7.85±0.02 0.30±0.14
SW2 8.60±0.14 0.27±0.01
SW3 8.65±0.07 0.27±0.01
SW4 7.50±0.14 0.26±0.03
SW5 6.40±0.71 0.72±0.03
SW6 8.25±0.21 0.34±0.04
SW7 7.75±0.04 0.75±0.02
SW8 7.78±0.05 0.37±0.02
SW9 7.87±0.09 3.81±0.04
OD: oxigeno disuelto; SW: Water sample point; ±: desviación estantar.
Table 3. FC concentration.
Sampling
points
FC (UFC 100 ml-1 )
SW1 0 × 100±0 × 100
SW2 7.255 × 10²±1.0677 × 10²
SW3 1.215 × 10³±1.3435 × 10²
SW4 8.16625 × 10⁴±7.425 × 101
SW5 8 × 10⁴±8.48528 × 10³
SW6 1.91 × 10⁵±5.65685 × 10³
SW7 2.2 × 10⁵±2.12132 × 10⁴
SW8 2.385 × 10⁵±3.53553 × 10³
SW9 3.2 × 10⁵±3.707107 × 10⁴
Table 4. Correlation matrix of physicochemical and bacteriologic parameters in Bobos River.
Parameter Temp pH DO Conductiv DS TN NO3 TP PO4 COD FC
Parameter 1
Temp 0.714* 1
pH -0.233 -0.161 1
DO -0.229 0.193 0.131 1
Conductiv 0.611 0.252 -0.098 -0.120 1
DS 0.580 0.244 -0.102 -0.096 .993** 1
TN .919** 0.579 -0.381 -0.250 0.496 0.462 1
NO3 .887** 0.512 -0.041 -0.348 0.435 0.404 .917** 1
TP .952** 0.563 -0.267 -0.286 0.569 0.530 .985** .940** 1
PO4 .937** 0.561 -0.266 -0.286 0.521 0.483 .990** .953** .997** 1
COD .946** 0.559 -0.074 -0.348 0.511 0.466 .921** .973** .964** .963** 1
FC .896** .876** -0.234 -0.071 0.396 0.375 .881** .821** .866** .872** .831** 1
Disclaimer/Publisher’s Note: The statements, opinions and data contained in all publications are solely those of the individual author(s) and contributor(s) and not of MDPI and/or the editor(s). MDPI and/or the editor(s) disclaim responsibility for any injury to people or property resulting from any ideas, methods, instructions or products referred to in the content.
Copyright: This open access article is published under a Creative Commons CC BY 4.0 license, which permit the free download, distribution, and reuse, provided that the author and preprint are cited in any reuse.
Prerpints.org logo

Preprints.org is a free preprint server supported by MDPI in Basel, Switzerland.

Subscribe

© 2024 MDPI (Basel, Switzerland) unless otherwise stated