Preprint
Article

Occurrence Characteristics of Gold in Crude Oil and Its Geological Significance

Altmetrics

Downloads

101

Views

36

Comments

0

Submitted:

29 December 2023

Posted:

29 December 2023

You are already at the latest version

Alerts
Abstract
Oil and petroleum are strategic resources of great importance to national security. Petroleum and hydrothermal gold deposits may form together, with similar evolutionary trends in their formation, migration, and enrichment. Petroleum reservoirs and gold deposits are closely coupled under certain geological conditions. The solubility of gold in crude oil and its forms of occurrence are important in determining the mechanisms of interaction between gold and petroleum and in facilitating the recovery of gold from gold-bearing petroleum. In this study, the occurrence of gold in crude oil from the Linnan Depression in the Bohai Bay Basin, China, was studied using inductively coupled plasma–mass spectrometry and X-ray photoelectron spectroscopy. Concentrations of gold in crude oil from the Linpan and Shanghe oilfields averaged 44.5 ppb, which is well above the minimum concentration required for hydrothermal gold mineralization. Gold has an affinity with carbon, oxygen, and sulfur, and its concentration in crude oil is positively correlated with total acid and sulfur contents. We speculate that gold may exist in crude oil as complexes with organic acids or thiols, with crude oil thus being a transport medium for gold.
Keywords: 
Subject: Environmental and Earth Sciences  -   Geochemistry and Petrology

1. Introduction

Petroleum and low-temperature hydrothermal Au deposits may form together and exhibit similar evolutionary trends in their formation, migration, and enrichment. Under certain circumstances, oil reservoirs and low-temperature hydrothermal Au deposits such as Carlin-type deposits exhibit a close coupling relationship on macro to micro scales [1,2,3,4,5,6] that may manifest in three ways, as follows. (1) Oil and gas reservoirs and Au deposits may have similar spatial distributions. For example, northeastern Nevada, USA, hosts abundant Carlin-type Au deposits and contains numerous oil and gas fields [7,8]; such deposits are also widely developed in the Youjiang Basin, China, together with numerous ancient and residual oil and gas reservoirs [9,10], and many low-temperature hydrothermal Hg, Sb, As, and Au deposits are distributed in the Tongren–Wanshan and Kaili–Majiang–Danzhai paleo-reservoir belts of eastern Guizhou Province, China [11]. (2) Hydrothermal Au deposits provide records of oil and gas activities. Carlin-type deposits are a type of low-temperature hydrothermal deposit containing ore-bearing rocks that are rich in organic matter, with evidence of organic components participating in mineralization [12]. Liquid-hydrocarbon inclusions have been found in Carlin-type Au deposits in Nevada, and temperature analyses have indicated that the capture temperature of oil-containing inclusions is below 150°C and within the oil-generation window (80°C–160°C) [7,13]. In the Shuiyindong Au mine in the Youjiang Basin, the ore is rich in organic matter and bitumen, and CH4, CO2, and N2 inclusions occur in ore-bearing quartz veins. The sources of these inclusions have been linked to decomposition of organic matter [14,15,16,17,18]. (3) Many types of organic matter are enriched in metals. For example, lower Paleozoic dark mudstones of eastern Guizhou, China, are rich in organic C and elements such as Au, V, Ni, and Mo, with metal contents often being positively correlated with total organic C contents. These mudstones are considered “double-source beds” with both mineral and hydrocarbon sources [19,20]. There are also examples of metal-rich bitumen of varying maturity [21]. For example, the Boss deposit in Nevada has a high Au content of 1.3 mg g−1 in bitumen within dolomitic limestone. Scanning electron microscopy studies have shown that Au is present in the bitumen in the form of an Hg alloy [(Pd81, Au13, Pt01) Hg] [22]. It is possible that metals can be transported in crude oil [23,24,25,26]. Contents of Au in the Shengli oilfield, China, are close to the industrial grade of 980 ppb [27], which is several orders of magnitude higher than the average abundance of Au in continental crust (5 ppb). However, there are few examples of the industrial recovery of Au from crude oil worldwide, and there have been no reports of the recovery of Au, Ag, and other precious metals in China because of the difficulty in their recovery.
Although many low-temperature hydrothermal Au deposits and oil and gas reservoirs are closely coupled, the mechanisms of ore-formation and oil-accumulation coupling in the interaction between Au and hydrocarbons are poorly understood. Currently many geologists have focused on the role of hydrocarbon fluid in the metallogenic process, ability of mobilization and transportation of metal elements and metallogenic mechanism of hydrocarbon fluid during basin evolution [3,4,26]. Noble metals such as gold are thought to play a catalytic role in the process of hydrocarbon generation to improve the efficiency of hydrocarbon generation [5]. Petroleum are considered to provide reduced sulfur directly or indirectly for sulfide precipitation during mineralization [1]. It remains unclear whether crude oil can directly participate in the formation of low-temperature hydrothermal Au deposits as a migration medium, but there have been relatively few studies of contents and forms of Au in crude oil worldwide. This study focused on the Linnan Sag in the Bohai Bay Basin to determine the Au content of crude oil and its form(s) of occurrence. Our results provide insights into the migration of Au in petroleum and its recovery from crude oil.

2. Geological Setting

The Linnan Sag is located in the southwest of Huimin Depression, Bohai Bay Basin, and contains Linpan oil-field, Shanghe oil-field, Jiangjiadian oil-field and Linan oil-field and so on [28]. The Linnan Sag is controlled by the Linshang and Xiakou Fault in northern and southern edge, respectively (Figure 1).
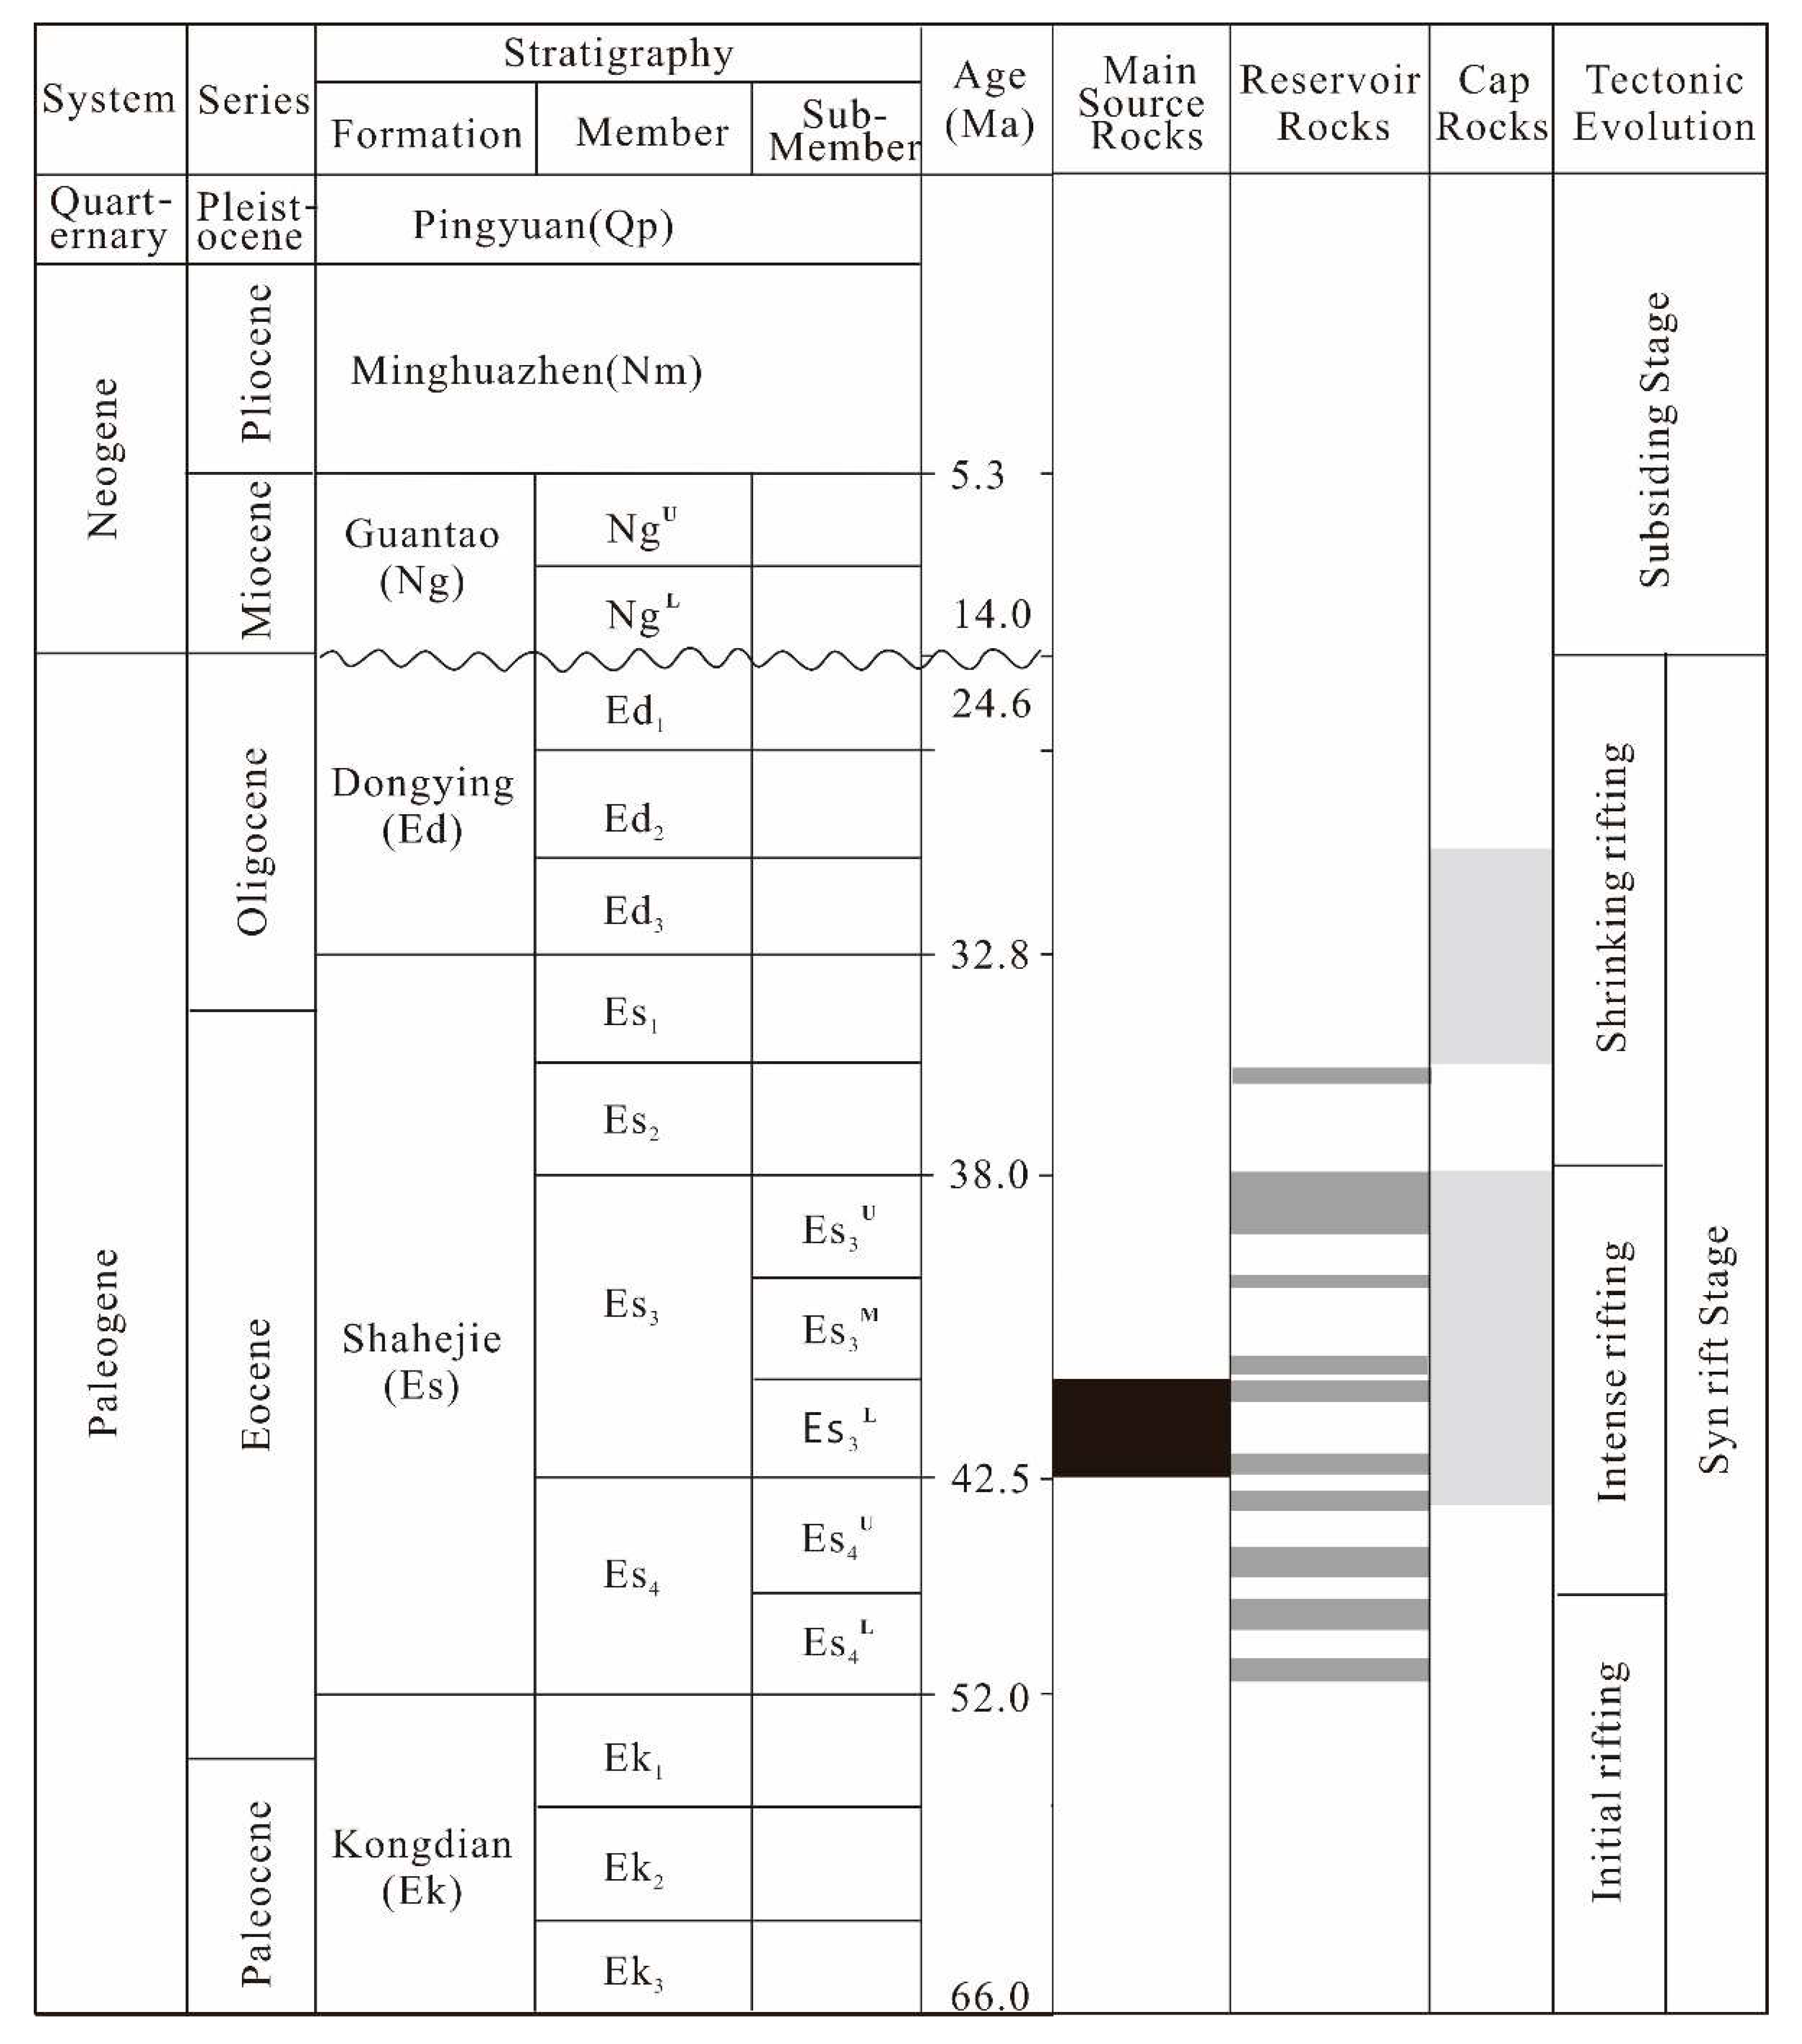
The Linnan Sag is the main source kitchen of the Huimin Depression, and the distributions of oil-field are mainly controlled by faults. The Cenozoic tectonic movements of this region include five stages: the initial rifting stage (66.0–46.0 Ma), the intense rifting stage (46.0–38.0 Ma), the shrinking rifting stage (38.0–24.6 Ma), the uplift stage (24.6-14.0 Ma), and the subsiding stage (14.0–0.0 Ma). There exist the unconformity between the Paleogene and Neogene sequences due to uplift during the Dongying movement (24.6–14.0 Ma). The Cenozoic strata in the Linnan Sag comprise the Paleogene Shahejie Formation (Es) and Dongying Formation (Ed), the Neogene Guantao Formation (Ng) and Minghuazhen Formation (Nm), and the Quaternary Pingyuan Formation (Qp) [29]. The Es formation is divided into four parts, which are labeled, respectively, as Es4, Es3, Es2, and Es1 from the bottom to top (Figure 2).
The widely distributed lacustrine mudstones and shales in the lower part of Es3 are the dominant source rocks with an average total organic carbon content (TOC) of 1.55%. The conglomerate and sandstone in the Es4, Es3, and Es2 are main reservoirs, and Paleogene mudstones are regional cap rocks [30]. It is worth noting that China's famous Jiaodong gold mining area is distributed in the eastern part of the study area (Figure 1).

3. Materials and Methods

Crude oil samples were collected from formations in the Linpan and Shanghe oilfields of the Linnan Sag. The main production beds of crude oil were the Paleogene Shahejie and Neogene Guantao formations. The samples were black solids or viscous semi-solids at room temperature with densities of >0.90 g cm3 (i.e., heavy oil).

3.1. Determination of Au Contents

The measurements of elemental analysis were performed at the Analytical Instrumentation Center of Peking University. Microwave digestion and inductively coupled plasma–mass spectrometry (ICP–MS) were employed to determine the Au contents of crude oil. An UltraWAVE ECR (Milestone, Italy) microwave digestion system was used: 50 mg of crude oil or its components was weighed into a dry digestion tank, 2% HNO3 was added (1.5 mL), and the sample was sealed and heated to 260°C for 20 min for microwave digestion. The sample was then cooled to below 50°C and transferred to a 30 mL volumetric flask for analysis.
A NexION 350X (PerkinElmer, USA) ICP–MS system was used for elemental analysis, with a three-cone interface (sampling, interceptor, over-interceptor cones), a triple four-pole ion deflector, and a universal cell technology with a wide linear range. Working parameters were set by automatic optimization, with a transmission power of 1250 W, carrier-gas flow rate of 0.82 L min−1, peristaltic pump speed of 20.0 rpm, scanning 20 times, and triplicate sample analyses. The standard-addition method was used with internal standards containing Ni, V, and other elements.

3.2. Au-Tube Thermal Simulation

The Au-tube thermal simulation equipment was developed by the State Key Laboratory of Oil and Gas Resources and Exploration, China University of Petroleum (CUP), Beijing, China. Au-tube thermal simulation treatments were undertaken at 420°C and 40 MPa with a reaction time of 72 h. The tube was 60 mm long with an inner diameter of 5.55 mm and wall thickness of 0.25 mm. A mudstone sample (15 mg of low-maturity source rock from the Bohai Bay Basin) and 160 mg deionized water were placed in the tube, which was sealed by welding in an Ar gas flow. The tube was opened after cooling.

3.3. XPS Analysis

Residual oil on Au-tube surfaces was analyzed by XPS (ThermoFisher, USA) at the CUP using Al K radiation, a spectral range of 0–1100 eV, 20 eV resolution, 0.1 eV step size, and a spot diameter of 300 m. The instrument etched the Au tube inner surfaces with X-rays for periods of 0, 30, and 60 s, and changes in carbon (C), oxygen (O), nitrogen (N), Sulfur (S) and gold (Au) concentrations with etching depth were recorded. ORIGIN software was used for graph plotting.

3.4. Determination of Total Acid Values of Crude Oil

The total acid values (TAN) of crude oil samples were determined by acid-base titration (GB/T 264, PRC National Standard) at the CUP. Crude oil samples (2 g) were dissolved in 25 mL neutral ethanol in a conical flask, and anhydrous ether (25 mL) was added. A blank sample containing 25 mL ethanol and 25 mL ether was also prepared. Phenolphthalide solution (1 mL) was added to each of the mixtures, titration with 0.1 mol L−1 KOH was undertaken until the pink endpoint, and the acid value was calculated by TAN = (V1 − V2) × C × 56.1, where V1 is the volume of KOH used in sample titration, V2 is the volume of the KOH solution used in the blank titration, and C is the concentration of the KOH solution.

4. Results

4.1. Crude oil Au, S, and Total Acid Contents

Twenty-five crude oil samples from the Shahejie and Guantao formations were selected for Au and S analysis; the results are shown in Table 1. Au contents ranged from 12.0 to 107.5 ppb with an average of 44.5 ppb. S contents ranged from 0.10 to 0.56 wt.% (average 0.32 wt.%). The TAN values ranged from 0.64 to 1.75 mg g−1 (average 1.17 mg g−1).

4.2. XPS Analyses

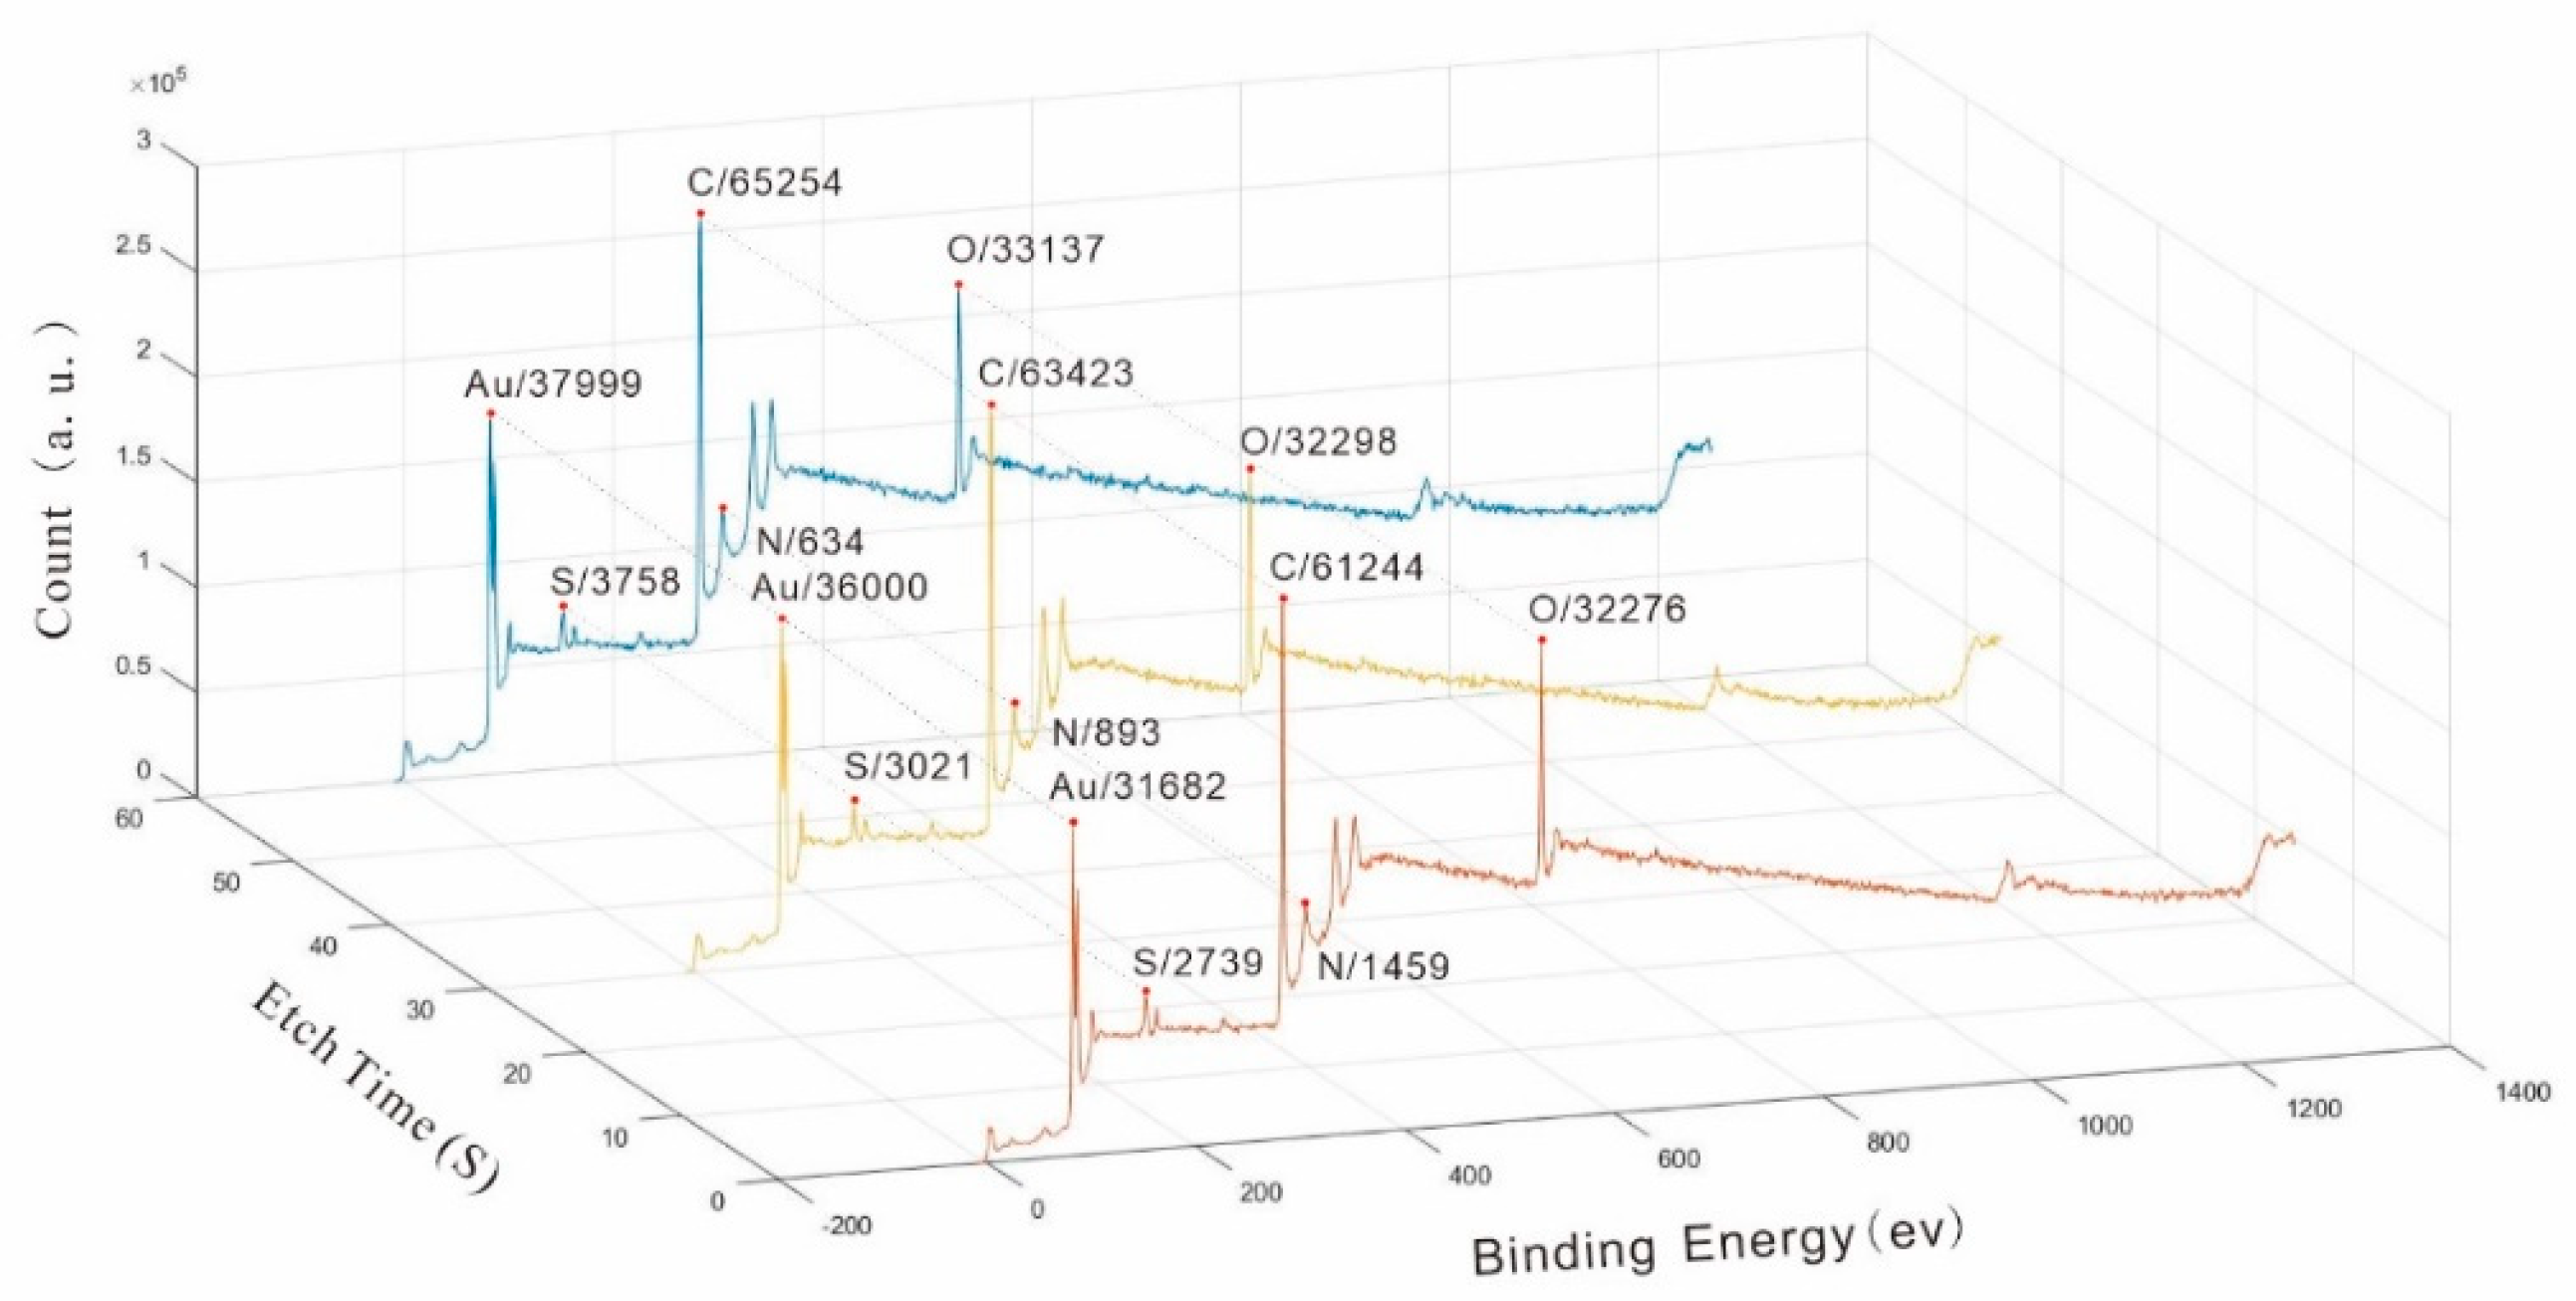
After the Au-tube thermal simulation, the tube was cut open to reveal the inner wall covered by generated crude oil. The tube with the most oil was analyzed by XPS, and spectra of Au, C, N, O, and S were recorded for etching times of 0, 30, and 60 s (Figure 3). The double peaks of Au (4f5/2 and 4f7/2) were clear, with corresponding binding energies of 82 and 86 eV, respectively. Carbon (1s), N (1s), O (1s), and S (4p3/2) had respective XPS peaks at 283, 398, 530, and 162 eV. Origin software was used to process the data, and the results indicate that peak areas of Au, C, and O increased with etching time, whereas that of N decreased (Figure 3, Table 2).

5. Discussion

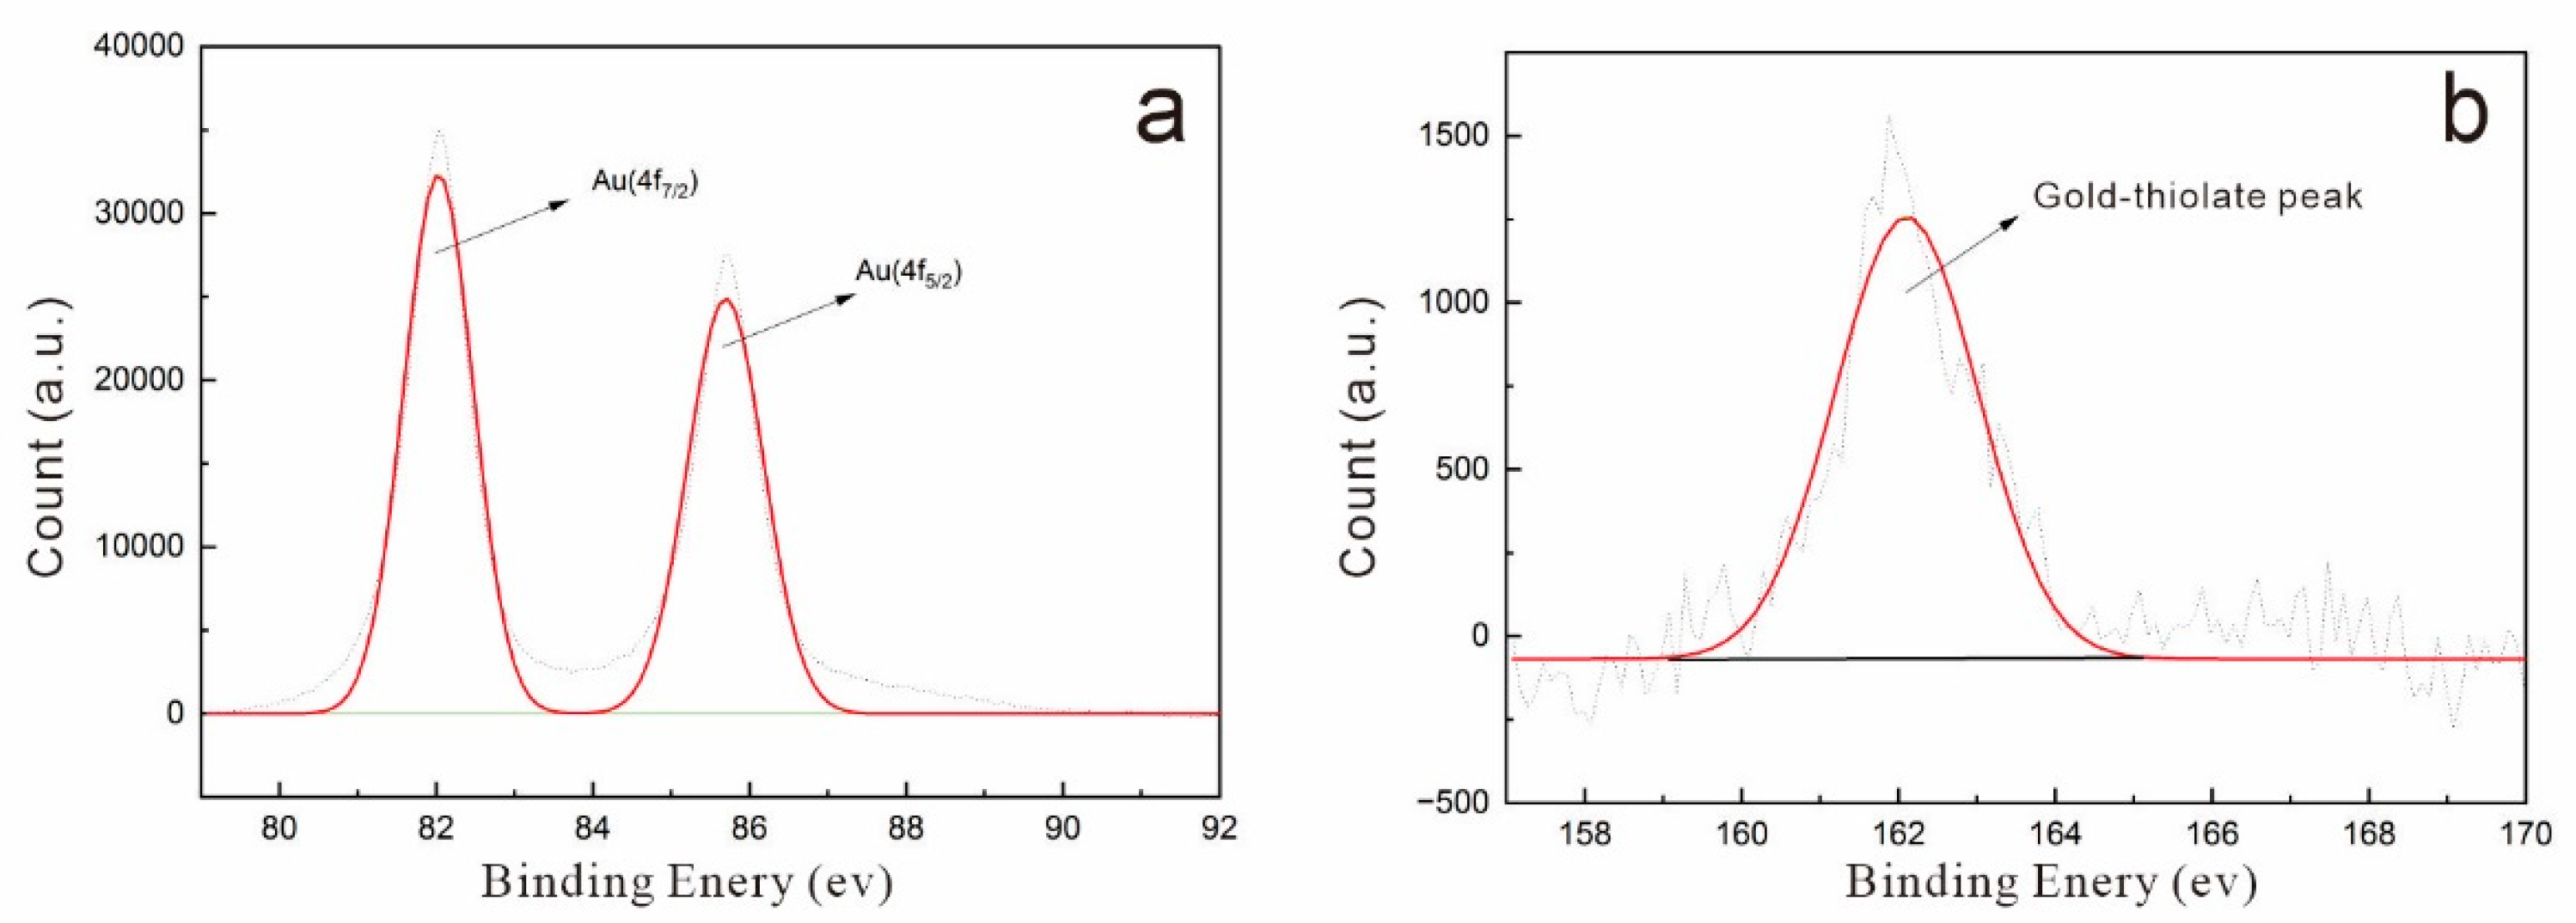
The average Au content of raw oil samples from the Linpan and Shanghe oilfields was 44.5 ppb. The industrial Au grade is typically 0.3–0.5 g tonne−1 (300–400 ppb). Although the average oil Au content is below industrial grade, it may have economic value if an appropriate recovery method is used. The Linpan and Shanghe oilfields are in the Linpan oil-production block, which has an oil-bearing area of 174.6 km2 with geological reserves of 283 million tons (Mt) and recoverable reserves of 84 Mt. Based on the average crude oil Au content, the total recoverable Au would be 84 × 106 × 44.5 × 10−9 = 3.74 tons, which is equivalent to a small Au mine. Soft/hard acid–base theory [31] implies that Au, as a soft acid, would tend to bind to soft bases such as organic acids and reduced S [32,33,34]. Previous studies have shown that there is strong correlation between contents of N, O, S, and other heteroatoms and metal elements in crude oil [35,36]. XPS peak areas represent relative contents, and our results (Figure 3) indicate that Au and C peak areas are positively correlated with etching time (i.e., depth), implying a close relationship between Au and organic matter in crude oil. The relative content of O also increased with etching depth, indicating a further correlation between Au and oxygen contents. Trends in Au, carbon, and oxygen contents were similar, indicating that Au has a strong affinity for C- and O-containing compounds in crude oil. Most O exists as carboxylic acids in crude oil [9]; therefore, Au contents may be closely related to carboxylic acid contents. The relative abundance of S increases with etching depth, and its binding energy corresponds to the XPS peak of Au–thiolate complexes (162.4 eV; Figure 4) [37,38], implying that at least some Au in crude oil may exist in the form of Au thiolate [39,40,41]. The relative abundance of N decreased with increasing etching depth (Figure 3), indicating no close relationship between Au and nitrogen compounds.
To further investigate the occurrence of Au in crude oil, a correlation analysis of Au contents, TAN values, and S contents of 25 crude oil samples was undertaken (Figure 5). When the TAN value was below 1.1, there was a positive correlation between Au content and TAN value; with values above 1.1, there was no obvious correlation. When the oil S content was below 0.35 wt.%, Au contents were positively correlated with S contents, but not at higher S contents. The most important determinant of the TAN value of crude oil is the content of organic acids such as carboxylic acid and naphthenic acid [42]. Organic acids are generally formed by biodegradation, as a by-product of bacterial metabolism [43,44]. Contents of N, O, S, and other heteroatoms increase as crude oil undergoes biodegradation [45,46]; therefore, we speculate that crude oil samples with higher TAN values (>1.1) and S contents (>0.35 wt.%) may have been affected by biodegradation, resulting in insignificant correlation between Au contents and TAN values or S contents. The TAN values and S contents would increase through biodegradation, whereas Au contents would not. This may be due to biodegraded crude oil having a stronger ability to complex Au through its high TAN value and S content, but it would fail to bind more Au owing to its low fluidity.

6. Conclusions

Crude oil may function as an effective ore-forming fluid for Au deposits, with Au existing as organic acid salts and thiolates. Oilfield brine rich in organic acids and organic S may also act as potential ore-forming fluids. Some black shales are rich in metal elements and although organic-rich shales (e.g., the Shahejie Formation) generate oil, the metal elements may migrate with crude oil to spaces favorable for enrichment, resulting in coupling between oil reservoirs and low-temperature hydrothermal Au deposits.

Author Contributions

Formal data analysis, Ni Z. Y., Zhang W., Liu J. Shi S. B., Wang X. and Su Y.; project administration, Ni Z. Y.; writing original draft, Ni Z. Y. All authors have read and agreed to the published version of the manuscript.

Funding

This research was funded by National Natural Science Foundation of China (Grant No. 42273069).

Data Availability Statement

The data presented in this study are available on request from the corresponding author. The data are not publicly available due to privacy.

Acknowledgments

The help from Dr. Wu Jia, Fang Peng and Liang Yun of CUP and Dr. Liu Jiahui of Peking University in experiments were acknowledged.

Conflicts of Interest

The authors declare no conflict of interest.

References

  1. Gu, X.X.; Zhang, Y.M.; Li, B.H.; Xue, C.J.; Dong, S.Y.; Fu, S.H.; Cheng, W.B.; Liu, L.; Wu, C.Y. The coupling relationship between metallization and hydrocarbon accumulation in sedimentary basins. Earth Sci. Front. 2010, 17, 83–105. [Google Scholar]
  2. Clark, J.R.; Williams-Jones, A.E. Analogues of epithermal gold–silver deposition in geothermal well scales. Nature 1990, 346, 644–645. [Google Scholar] [CrossRef]
  3. Williams-Jones, A.E.; Migdisov, A.A. An experimental study of the solubility of gold in crude oil: Implications for ore genesis. Geochim. Et Cosmochim. Acta 2006, 70, A703. [Google Scholar] [CrossRef]
  4. Emsbo, P.; Williams-Jones, A.; Koenig, A.E.; Wilson, S.A. Petroleum as an agent of metal transport: metallogenic and exploration implications. Proceding Tenth Bienn. SGA Meet. Townsv. 2009, 99–101. [Google Scholar]
  5. Hu, S.-Y.; Plet, C. Introduction to a special issue on organic- and microbe-metal interactions in mineral systems. Ore Geol. Rev. 2022, 146. [Google Scholar] [CrossRef]
  6. Gu, X.X.; Zhang, Y.M.; Li, B.H.; Dong, S.Y.; Xue, C.J.; Fu, S.H. Hydrocarbon- and ore-bearing basinal fluids: a possible link between gold mineralization and hydrocarbon accumulation in the Youjiang basin, South China. Miner. Depos. 2012, 47, 663–682. [Google Scholar] [CrossRef]
  7. Hulen, J.B.; Collister, J.W.; Stout, B.; Curtiss, D.K.; Dahdah, N.F. The exhumed “Carlin-type” fossil oil reservoir at Yankee Basin. JOM 1998, 50, 30–34. [Google Scholar] [CrossRef]
  8. Collister, J.W.; Hulen, J.B. The oil-bearing, carlin-type gold deposits of Yankee Basin, Alligator Ridge District, Nevada. Econ. Geol. 1999, 94, 1029–1049. [Google Scholar]
  9. Wang, G.Z.; Hu, R.Z.; Su, W.C.; Zhu, L.M. Fluid and mineralization of Youjiang Basin in the Yunnan-Guizhou-Guangxi area, China. Sci. China (Ser. D: Earth Sci. ) 2002, 46, 99–109. [Google Scholar]
  10. Hu, Y.; Liu, W.; Wang, J.; Zhang, G.; Zhou, Z.; Han, R. Basin-scale structure control of Carlin-style gold deposits in central Southwestern Guizhou, China: Insights from seismic reflection profiles and gravity data. Ore Geol. Rev. 2017, 91, 444–462. [Google Scholar] [CrossRef]
  11. Hu, Y.Z.; Han, R.S.; Mao, X.X. Relationship between metal mineralization and accumulation oil and gas in the eastern Guizhou. Geol. Prospect. 2007, 43, 51–56. [Google Scholar]
  12. Arehart, G.B. Characteristics and origin of sediment-hosted disseminated gold deposits: A review. Ore Geol. Rev. 1996, 11, 383–403. [Google Scholar] [CrossRef]
  13. Peters, K.E.; Walters, C.C.; Moldowan, J.M. The biomarker guide: Volume 2, Biomarkers and isotopes in petroleum systems and earth history. Cambridge University Press, 2007. [Google Scholar]
  14. Su, W.C. Geochemistry of the Ore-Forming Fluids of the Carlin-Type Gold Deposits in the southwestern Margin of theYangtze Block: Institute of Geochemistry. Chinese Academy of Scicnces, Guiyang, China, 2002; pp. 1–120. [Google Scholar]
  15. Xia, Y.; Chen, Q.N.; Zhou, W.C. The simulating experiments of gold mineralization in low temperature and open system. J. Nanjing Univ. (Nat. Sci.) 1996, 32, 634–639. [Google Scholar]
  16. Liu, J.Z. Ore characteristics and gold occurrence of the Shuiyindong gold deposit, guizhou. Guizhou Geol. 2003, 20, 30–34. [Google Scholar]
  17. Liu, J.Z.; Deng, Y.M.; Liu, C.Q.; Zhang, X.C.; Xia, Y. Metallogenic conditions and model of the superlarge Shuiyindong stratabound gold deposit in Zhenfeng County, Guizhou Province. Geol. China 2006, 33, 169–177. [Google Scholar]
  18. Liu, J.Z.; Xia, Y.; Zhang, X.C.; Deng, Y.M.; Su, W.C.; Tao, Y. Model of strata Karlin-type gold deposit: the Shuiyindong super-scale gold deposit. Gold Sci. Technol. 2008, 16, 1–15. [Google Scholar]
  19. Tu, G.Z. Gechemisty of strata-bound Deposits in China (Volume III). Science Press: Beijing, 1988. [Google Scholar]
  20. Fu, J.M.; Peng, P.A.; Lin, Q.; Liu, D.H.; Jia, R.F.; Shi, J.X.; Lu, J.L. Several problems in the study of organic gechemisty of strata-bound Deposits. Prog. Earth Sci. 1990, 5, 43. [Google Scholar]
  21. Parnell, J. Metal enrichments in solid bitumens: A review. Miner. Depos. 1988, 23, 191–199. [Google Scholar] [CrossRef]
  22. Jedwab, J.; Badaut, D.; Beaunier, P. Discovery of a palladium-platinum-gold-mercury bitumen in the Boss Mine, Clark County, Nevada. Econ. Geol. 1999, 94, 1163–1172. [Google Scholar] [CrossRef]
  23. Baker, W.E. The role of humic acid in the transport of gold. Geochim. Et Cosmochim. Acta 1978, 42, 645–649. [Google Scholar] [CrossRef]
  24. Liu, J.Z.; Fu, J.M.; Lu, J.L. Experimental study on the role of organic matter in the mineralization of Sedimentary-reformed gold deposits. Sci. China (Ser. B) 1993, 9, 993–1000. [Google Scholar]
  25. Zhang, J.R.; Lu, J.J.; Yang, F.; Wu, J.W.; Zhu, F.H. An experimental study on gold solubility in amino acid solution and its geological signifcance. Geochimica 1996, 25, 190–195. [Google Scholar]
  26. Crede, L.-S.; Liu, W.; Evans, K.; Rempel, K.; Testemale, D.; Brugger, J. , Crude oils as ore fluids: An experimental in-situ XAS study of gold partitioning between brine and organic fluid from 25 to 250 °C. Geochim. Et Cosmochim. Acta 2019, 244, 352–365. [Google Scholar] [CrossRef]
  27. Xu, Z.H.; Zhan, Y.L.; Zhu, J.H.; Li, X. The research progress in the utilization of metal resources in crude oils. Multipurp. Util. Miner. Resour. 1998, 3, 22–26. [Google Scholar]
  28. Wang, D.; Wu, Z.P.; Yang, L.L.; Liu, H.; Zhang, Y. Growth and linkage of the Xiakou fault in the Linnan Sag, Jiyang Depression, Eastern China: Formation mechanism and sedimentation response. Mar. Pet. Geol. 2020, 116, 104319. [Google Scholar] [CrossRef]
  29. Li, C.; Zhang, L.K.; Luo, X.R.; Wang, B.; Lei, Y.H.; Cheng, M.; Luo, H.M.; Wang, C.J.; Yu, L. Modeling of overpressure generation-evolution of the Paleogene source rock and implications for the Linnan Sag, Eastern China. Front. Earth Sci. 2022, 10, 829322. [Google Scholar] [CrossRef]
  30. Guo, X.L.; Xiong, M.; Zhou, Q.; Tian, H.; Xiao, X.M. Petroleum generation and expulsion kinetics: A sase study of the Shahejie Formation source rocks from Linnan Sag of Huimin Depression. ACTA Sedmentologica SINICA 2009, 27, 723–731. [Google Scholar]
  31. Pearson, R.G. Hard and Soft Acids and Bases. J. Am. Chem. Soc. 1963, 85, 3533–3539. [Google Scholar] [CrossRef]
  32. Seward, T.M. Thio complexes of gold and the transport of gold in hydrothermal ore solutions. Geochim. Et Cosmochim. Acta 1973, 37, 379–399. [Google Scholar] [CrossRef]
  33. Giordano, T.H. Evaluation of Organic Ligands and Metal-Organic Complexing in Mississippi Valley-Type Ore Solutions. Econ. Geol. 1985, 80, 96–106. [Google Scholar] [CrossRef]
  34. Vlassopoulos, D.; Wood, S.A.; Mucci, A. , Gold speciation in natural waters : II. The importance of organic complexing- Experiments with some simple model ligands. Geochim. Et Cosmochim. Acta 1990, 54, 1575–1586. [Google Scholar] [CrossRef]
  35. Sanz-Robinson, J.; Williams-Jones, A.E. The solubility of Nickel (Ni) in crude oil at 150, 200 and 250°C and its application to ore genesis. Chem. Geol. 2020, 533, 119443. [Google Scholar] [CrossRef]
  36. Hughey, C.A.; Rodgers, R.P.; Marshall, A.G.; Walters, C.C.; Qian, K.; Mankiewicz, P. Acidic and neutral polar NSO compounds in Smackover oils of different thermal maturity revealed by electrospray high field Fourier transform ion cyclotron resonance mass spectrometry. Org. Geochem. 2004, 35, 863–880. [Google Scholar] [CrossRef]
  37. Castner, D.G.; Hinds, K.; Grainger, D.W. X-ray Photoelectron Spectroscopy Sulfur 2p Study of Organic Thiol and Disulfide Binding Interactions with Gold Surfaces. Langmuir 1996, 12, 5083–5086. [Google Scholar] [CrossRef]
  38. Sanz-Robinson, J.; Sugiyama, I.; Williams-Jones, A.E. The solubility of palladium (Pd) in crude oil at 150, 200 and 250°C and its application to ore genesis. Chem. Geol. 2020, 531, 119320. [Google Scholar] [CrossRef]
  39. Lewan, M.D. Factors controlling the proportionality of vanadium to nickel in crude oils. Geochim. Et Cosmochim. Acta 1984, 48, 2231–2238. [Google Scholar] [CrossRef]
  40. Giordano, T.H. Metal Transport in Ore Fluids by Organic Ligand Complexation. In Organic Acids in Geological Processes; Pittman, E.D., Lewan, M.D., Eds. Springer Berlin Heidelberg: Berlin/Heidelberg, Germany, 1994; pp. 319–354. [Google Scholar]
  41. Speight, J.G. Handbook of Petroleum Analysis; John Wiley & Sons Inc: Hoboken, NJ, USA, 2001. [Google Scholar]
  42. Park, L.K.E.; Liu, J.; Yiacoumi, S.; Borole, A.P.; Tsouris, C. Contribution of acidic components to the total acid number (TAN) of bio-oil. Fuel 2017, 200, 171–181. [Google Scholar] [CrossRef]
  43. Kawamurat, K.; Tannenbaum, E.L.I.; Huizinga, B.J.; Kaplan, I.R. Long-chain carboxylic acids in pyrolysates of Green River kerogen. Adv. Org. Geochem. 1986, 10, 1059–1065. [Google Scholar] [CrossRef]
  44. Shock, E.L. Organic acid metastability in sedimentary basins. Geology 1988, 16, 886–890. [Google Scholar] [CrossRef]
  45. Head, I.M.; Jones, D.M.; Larter, S.R. Biological activity in the deep subsurface and the origin of heavy oil. Nature 2003, 426, 344–352. [Google Scholar] [CrossRef]
  46. Wenger, L.M.; Davis, C.L.; Isaksen, G.H. Multiple Controls on Petroleum Biodegradation and Impact on Oil Quality. SPE Reserv. Eval. Eng. 2002, 5, 375–383. [Google Scholar] [CrossRef]
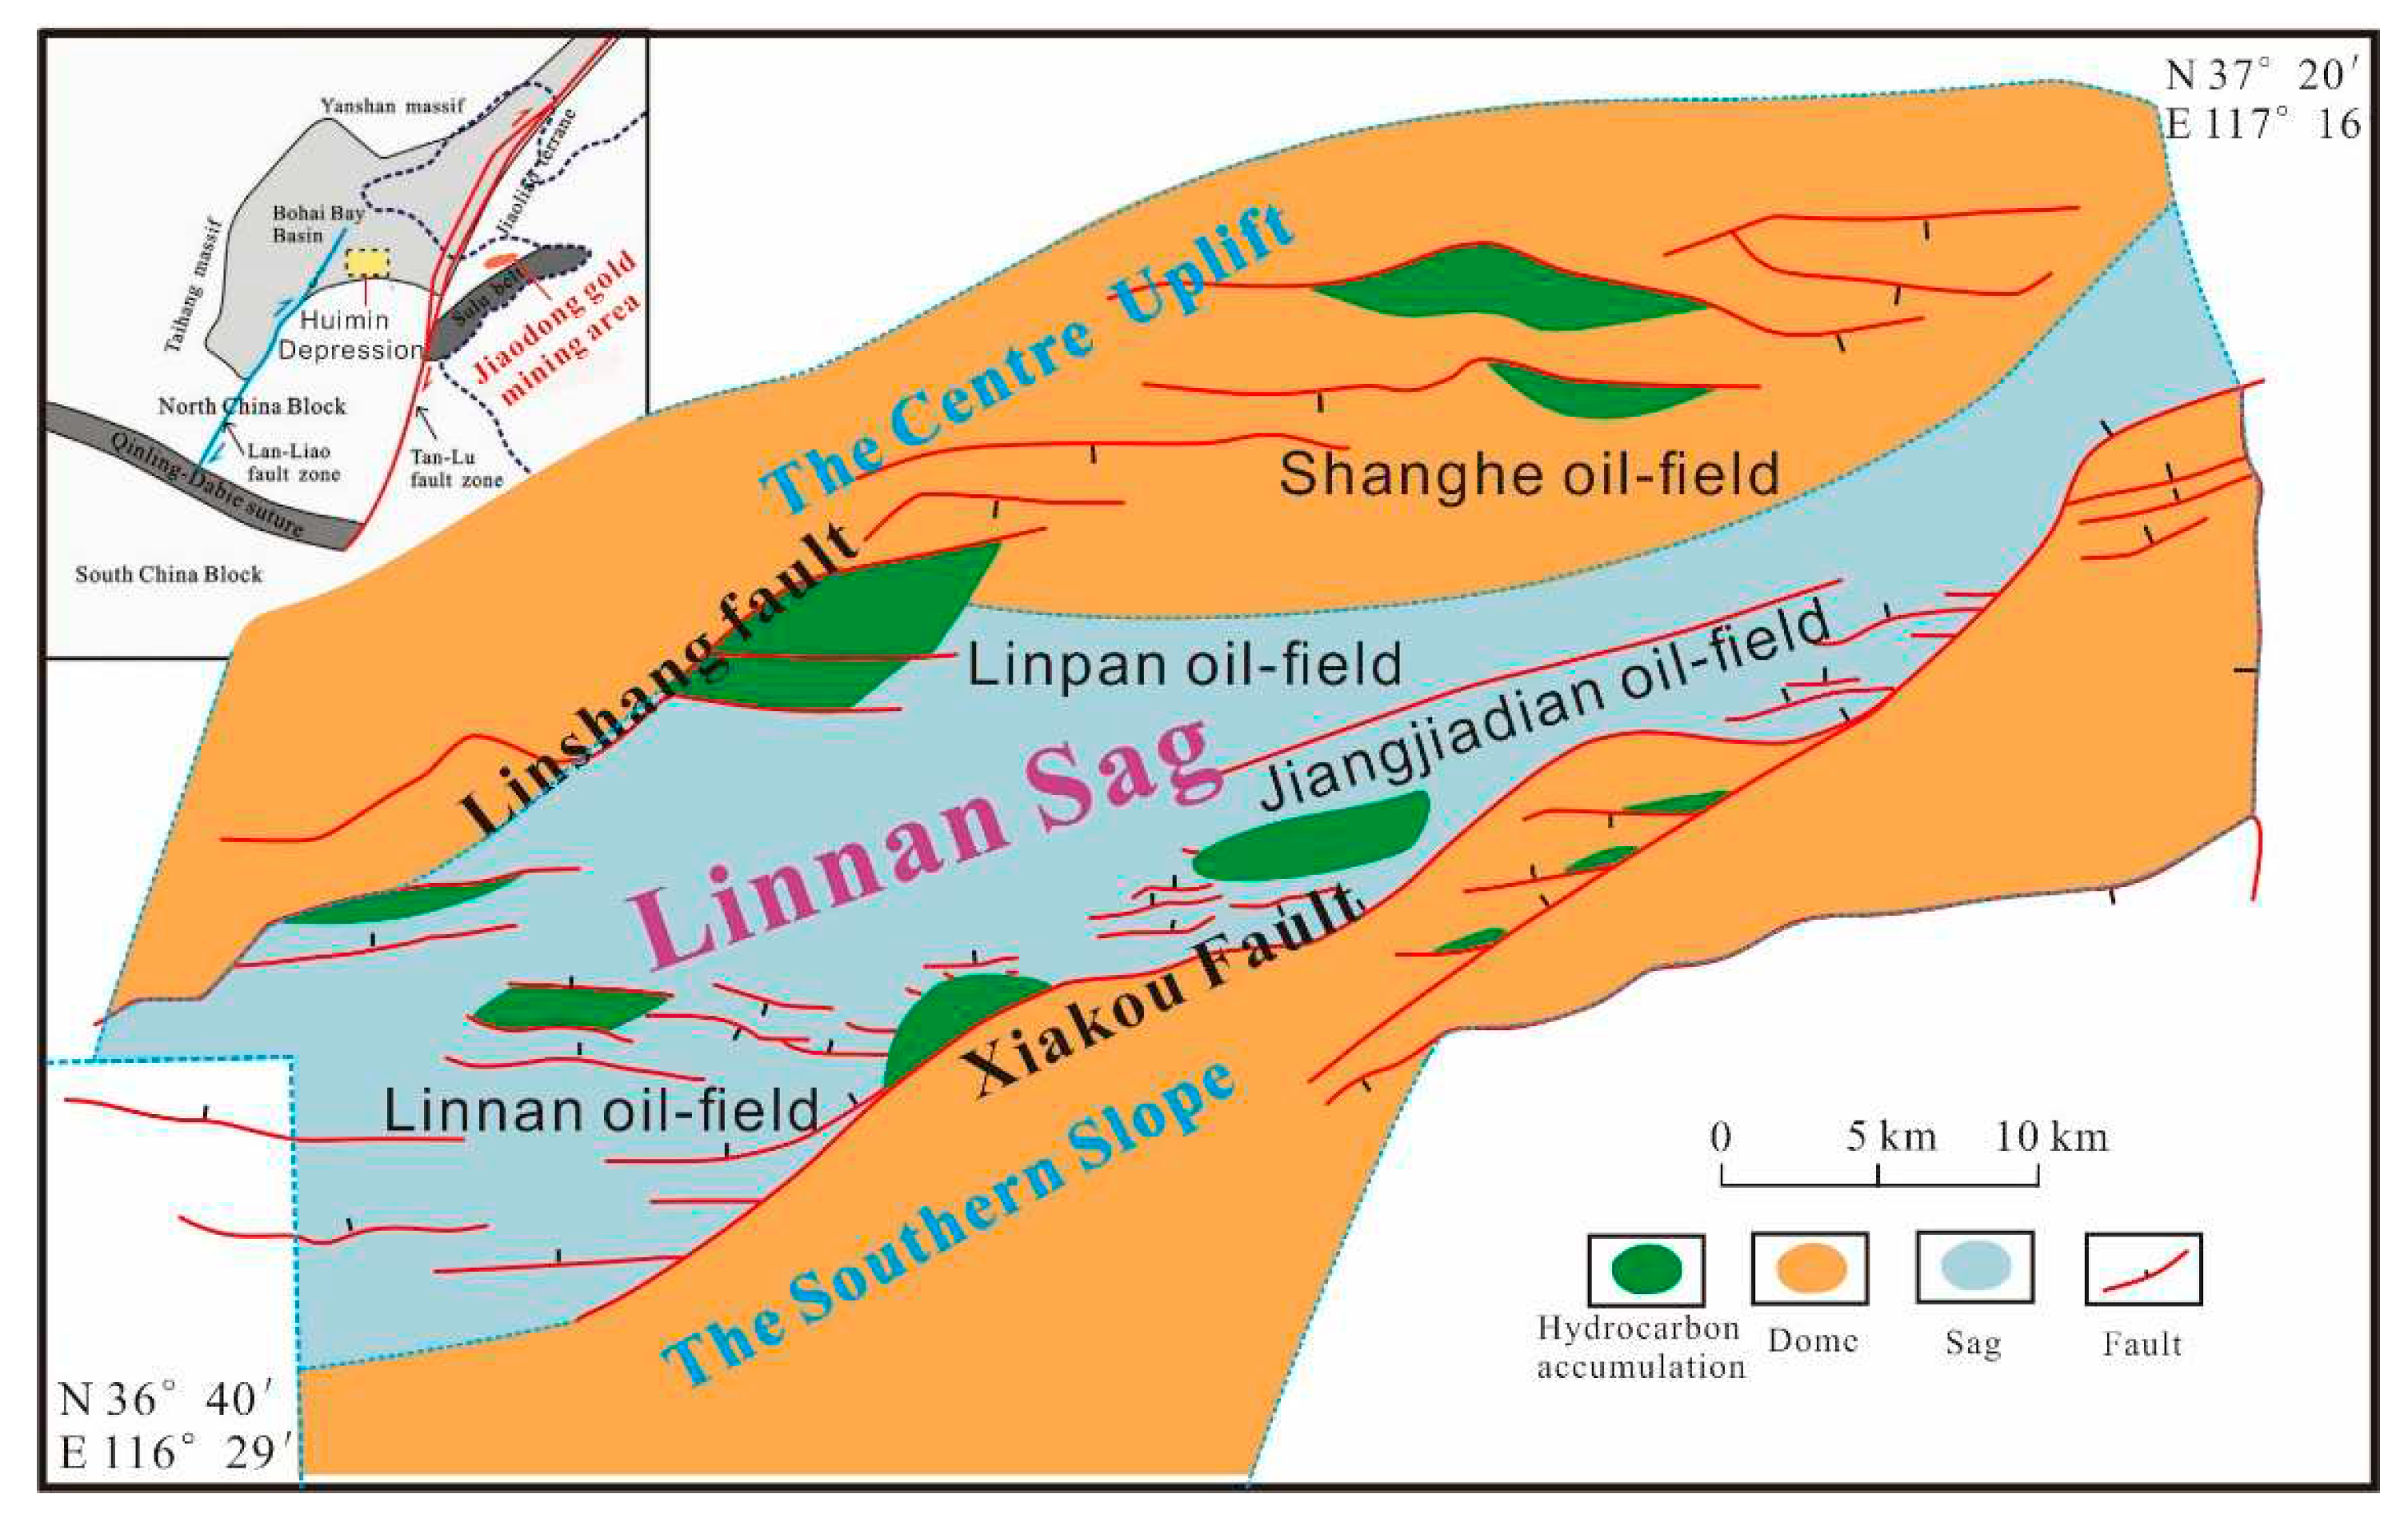
Figure 1. Simplified structural map of the Bohai Bay Basin, sketch map of Linnan Sag and the main oil fields (modified by reference [28]).
Preprints 94908 g001
Figure 2. Schematic Cenozoic stratigraphy and tectonic evolution of the Linnan Sag.
Preprints 94908 g002
Figure 3. XPS peak areas of Au, C, N, O, and S at etching times of 0, 30, and 60 s.
Preprints 94908 g003
Figure 4. XPS spectra of Au and thiolate.
Preprints 94908 g004
Figure 5. Relationships between crude oil Au contents and (a) total acid (TAN) values and (b) S contents.
Preprints 94908 g005
Table 1. Contents of Au and S and total acid values of crude oil samples.
Oilfield Well Fm. Depth (m) Density (g/cm3) Viscosity (mpa.s) S (%) TAN (mg/g) Au (ppb)
Linpan L2-x201 G2 1414.4-1423.6 0.945 377.75 0.51 1.63 13.4
Linpan L23-11 G3 1642.2-1645.0 0.923 90.90 0.37 0.95 105.3
Linpan L55 S3 2626.6-2992.8 0.866 11.07 0.12 0.92 90.7
Linpan L7-x28 S2 1799.2-1823.6 0.909 27.46 0.10 0.64 12.0
Linpan L75-17 S3 1859.2-1909.0 0.918 138.00 0.35 1.11 24.4
Linpan L75-x30 S4 2474.0-2512.6 0.895 18.00 0.35 1.09 16.0
Linpan L76-3 S4 2069.0-2094.0 0.893 41.00 0.10 0.82 32.4
Linpan P14-6 S4 1588.6-1594.4 0.986 5951.00 0.50 1.39 36.6
Linpan P18-x3 S3 1597.1-1630.3 0.935 119.00 0.42 1.21 38.1
Linpan P20-6 S1 1556.0-1599.4 0.936 352.30 0.25 1.36 63.1
Linpan P2-504 S3 1576.0-1606.4 0.965 921.00 0.56 1.21 23.2
Linpan P40-12 G 1337.6-1354.0 0.960 384.00 0.41 1.49 47.9
Linpan P40-17 G 1345.4-1350.4 0.951 324.00 0.38 1.33 31.4
Shanghe S23-70 S2 1710.0-1734.2 0.897 48.94 0.25 0.9 57.2
Shanghe S25-11 S4 2044.2-2126.8 0.899 48.84 0.14 1.28 18.9
Shanghe S25-40 S4 1969.6-2267.8 0.897 58.23 0.44 1.21 107.5
Shanghe S42-2 S2 1655.2-1675.4 0.932 140.30 0.44 0.7 27.3
Shanghe S70-x5 S2 2348.5-2374.0 0.863 11.26 0.25 1.22 17.5
Shanghe S73-13 S2 2275.8-2334.2 0.892 40.10 0.37 1.75 34.3
Shanghe S8-29 S2 1854.2-1859.4 0.887 21.49 0.36 1.52 29.0
Shanghe S8-300 S2 1776.0-1833.0 0.900 27.90 0.24 0.74 69.0
Shanghe S8-33 S1 1653.0-1675.0 0.946 322.10 0.50 1.14 83.9
Shanghe S84-4 S1 1899.0-1903.6 0.872 24.27 0.25 1.31 -
Shanghe S847 S1 1884.6-1890.4 0.883 29.89 0.17 1.18 41.1
Shanghe S8-52 S2 1846.0-1861.0 0.897 37.84 0.11 1.15 26.2
Table 2. Elemental XPS spectral characteristics.
Elements Spectral Line Etch Time (s) Peak Area Peak Center (ev) Elements Spectral Line Etch Time (s) Peak Area Peak Center (ev)
Au 4f5/2 0 31682 82 N 1s 0 1459 398
Au 4f5/2 30 36000 82 N 1s 30 893 398
Au 4f5/2 60 38000 82 N 1s 60 634 398
Au 4f7/2 0 26368 86 O 1s 0 32276 530
Au 4f7/2 30 30378 86 O 1s 30 32299 530
Au 4f7/2 60 32330 86 O 1s 60 33137 530
C 1s 0 61244 283 S 4p3/2 0 2739 162
C 2s 30 63423 283 S 4p3/2 30 3021 162
C 3s 60 65254 283 S 4p3/2 60 3758 162
Disclaimer/Publisher’s Note: The statements, opinions and data contained in all publications are solely those of the individual author(s) and contributor(s) and not of MDPI and/or the editor(s). MDPI and/or the editor(s) disclaim responsibility for any injury to people or property resulting from any ideas, methods, instructions or products referred to in the content.
Copyright: This open access article is published under a Creative Commons CC BY 4.0 license, which permit the free download, distribution, and reuse, provided that the author and preprint are cited in any reuse.
Prerpints.org logo

Preprints.org is a free preprint server supported by MDPI in Basel, Switzerland.

Subscribe

© 2024 MDPI (Basel, Switzerland) unless otherwise stated