1. Introduction
The Greenhouse Effect has been growing along the last decades, due to the ascending of power generation by combustion of fossil fuels, such as coal, natural gas an oil. Between the greenhouse gases, the one who has the most contribution is carbon dioxide (CO
2), which contributes around 55 percent for the effects of the global warming [
1,
2]. Consequently, a large amount of research has been developed to study new technologies for carbon capture and storage (CCS), in order to mitigate the amount of CO
2 emissions into the atmosphere. Post-combustion carbon capture processes are mature, effective, and currently the basis for CCS developments [
3], as they offer some advantages if compared to others, such as retrofitting facility [
4]. From these processes, the CO
2 chemical absorption in alkanolamines leads the market of carbon capture [
5,
6,
7].
The mentioned process uses conventional equipment such as absorption columns, which although have been leading the research for carbon capture, still present some disadvantages, such as the large amount of energy consumption, liquid losses, and foaming [
5,
8,
9,
10,
11]. To overcome these disadvantages some modifications are proposed. A potential alternative the membrane separation process, in what [
4] has separated in two different categories: membrane-based separation and membrane gas absorption (MGA). The first one is related to the separation processes where the membranes provide the selectivity themselves, and the mass transport is given purely by Knudsen diffusion and driven by the partial pressure gradient [
12]; whereas in the last one, the membranes may provide or not an additional selectivity, acting as gas-liquid contacting devices. MGA is also known as membrane contactor technology, which is widely carried out in units called Hollow Fiber Membrane Contactors (HFMC) for CO
2 absorption [
7]. Many advantages of this equipment are listed in relation to conventional technologies used for liquid-gas and liquid-liquid separations, such as constant interfacial area, no emulsion formation, facility in scaling-up and substantially higher efficiency [
13]. Also, the smaller energy consumption can be added to the list [
14,
15].
HFMCs can be modeled and designed through many ways, being operated in a counter-current, cross or co-current flows, and using one, two or three-dimensional modeling approaches [
16,
17], and several, experimental and theoretical works, have been published. In the experimental field the chemical absorption of CO
2 in HFMCs using different types of absorbents, such as water, monoethanolamine, diethanolamine and trifluoro-acetylacetone were investigated [
7,
18]. On theoretical issues, [
19] proposed a generic one-dimensional model under isothermal conditions, which was compared to bidimensional approach by [
20]. An HFMC model in adiabatic and one-dimensional condition was evaluated by [
21,
22].
With respect to the transient approach, [
23] analyzed the transient results of a membrane contactor operating in parallel flux against some disturbances in properties that cannot be controlled in transient conditions. [
24] studies a model for membrane contactors concentrated only on time and compares the unit approach with a cell-based approach. Another cell approach is proposed by [
25], where the absorption of CO
2 is compared using different solvents: water, 2-amino-2-methyl-1-propanol (AMP) and dimethylamine (DEA). A recent work developed by [
26] analyzes the dynamic performance of a membrane module for CO
2 separation using a gas-gas system, by step changes in the operating conditions. In another recent work, a non-isothermal dynamic model for capture CO
2 from natural gas is presented by [
27], despite carrying out robust modeling, the work lacks analysis of responses to important disturbances in the process.
With the growing development of membrane systems in either laboratory or pilot scales, and further industrial applications, it is necessary to study the dynamic behavior of this units to start applying subsequent control strategies to these processes. Previous research focused on simple rate-based or Computational fluid dynamics (CFD) modeling (which requires a great computational effort), even when one-dimensional approaches can give satisfactory results, and using relatively robust solutions for accurate design results, but cannot be used to easy apply control algorithms. Therefore, this paper aims to propose a dynamic, one-dimensional, and isothermal model of a hollow fiber membrane contactor unit for post-combustion CO2 capture and analyze the dynamic behavior of the model and its capability to coherently predict the effects against some disturbances applied to several input variables. Also, this manuscript discusses about the possible explanations that may lead to many different dynamic profiles in the system at various conditions and inputs changes.
2. System features
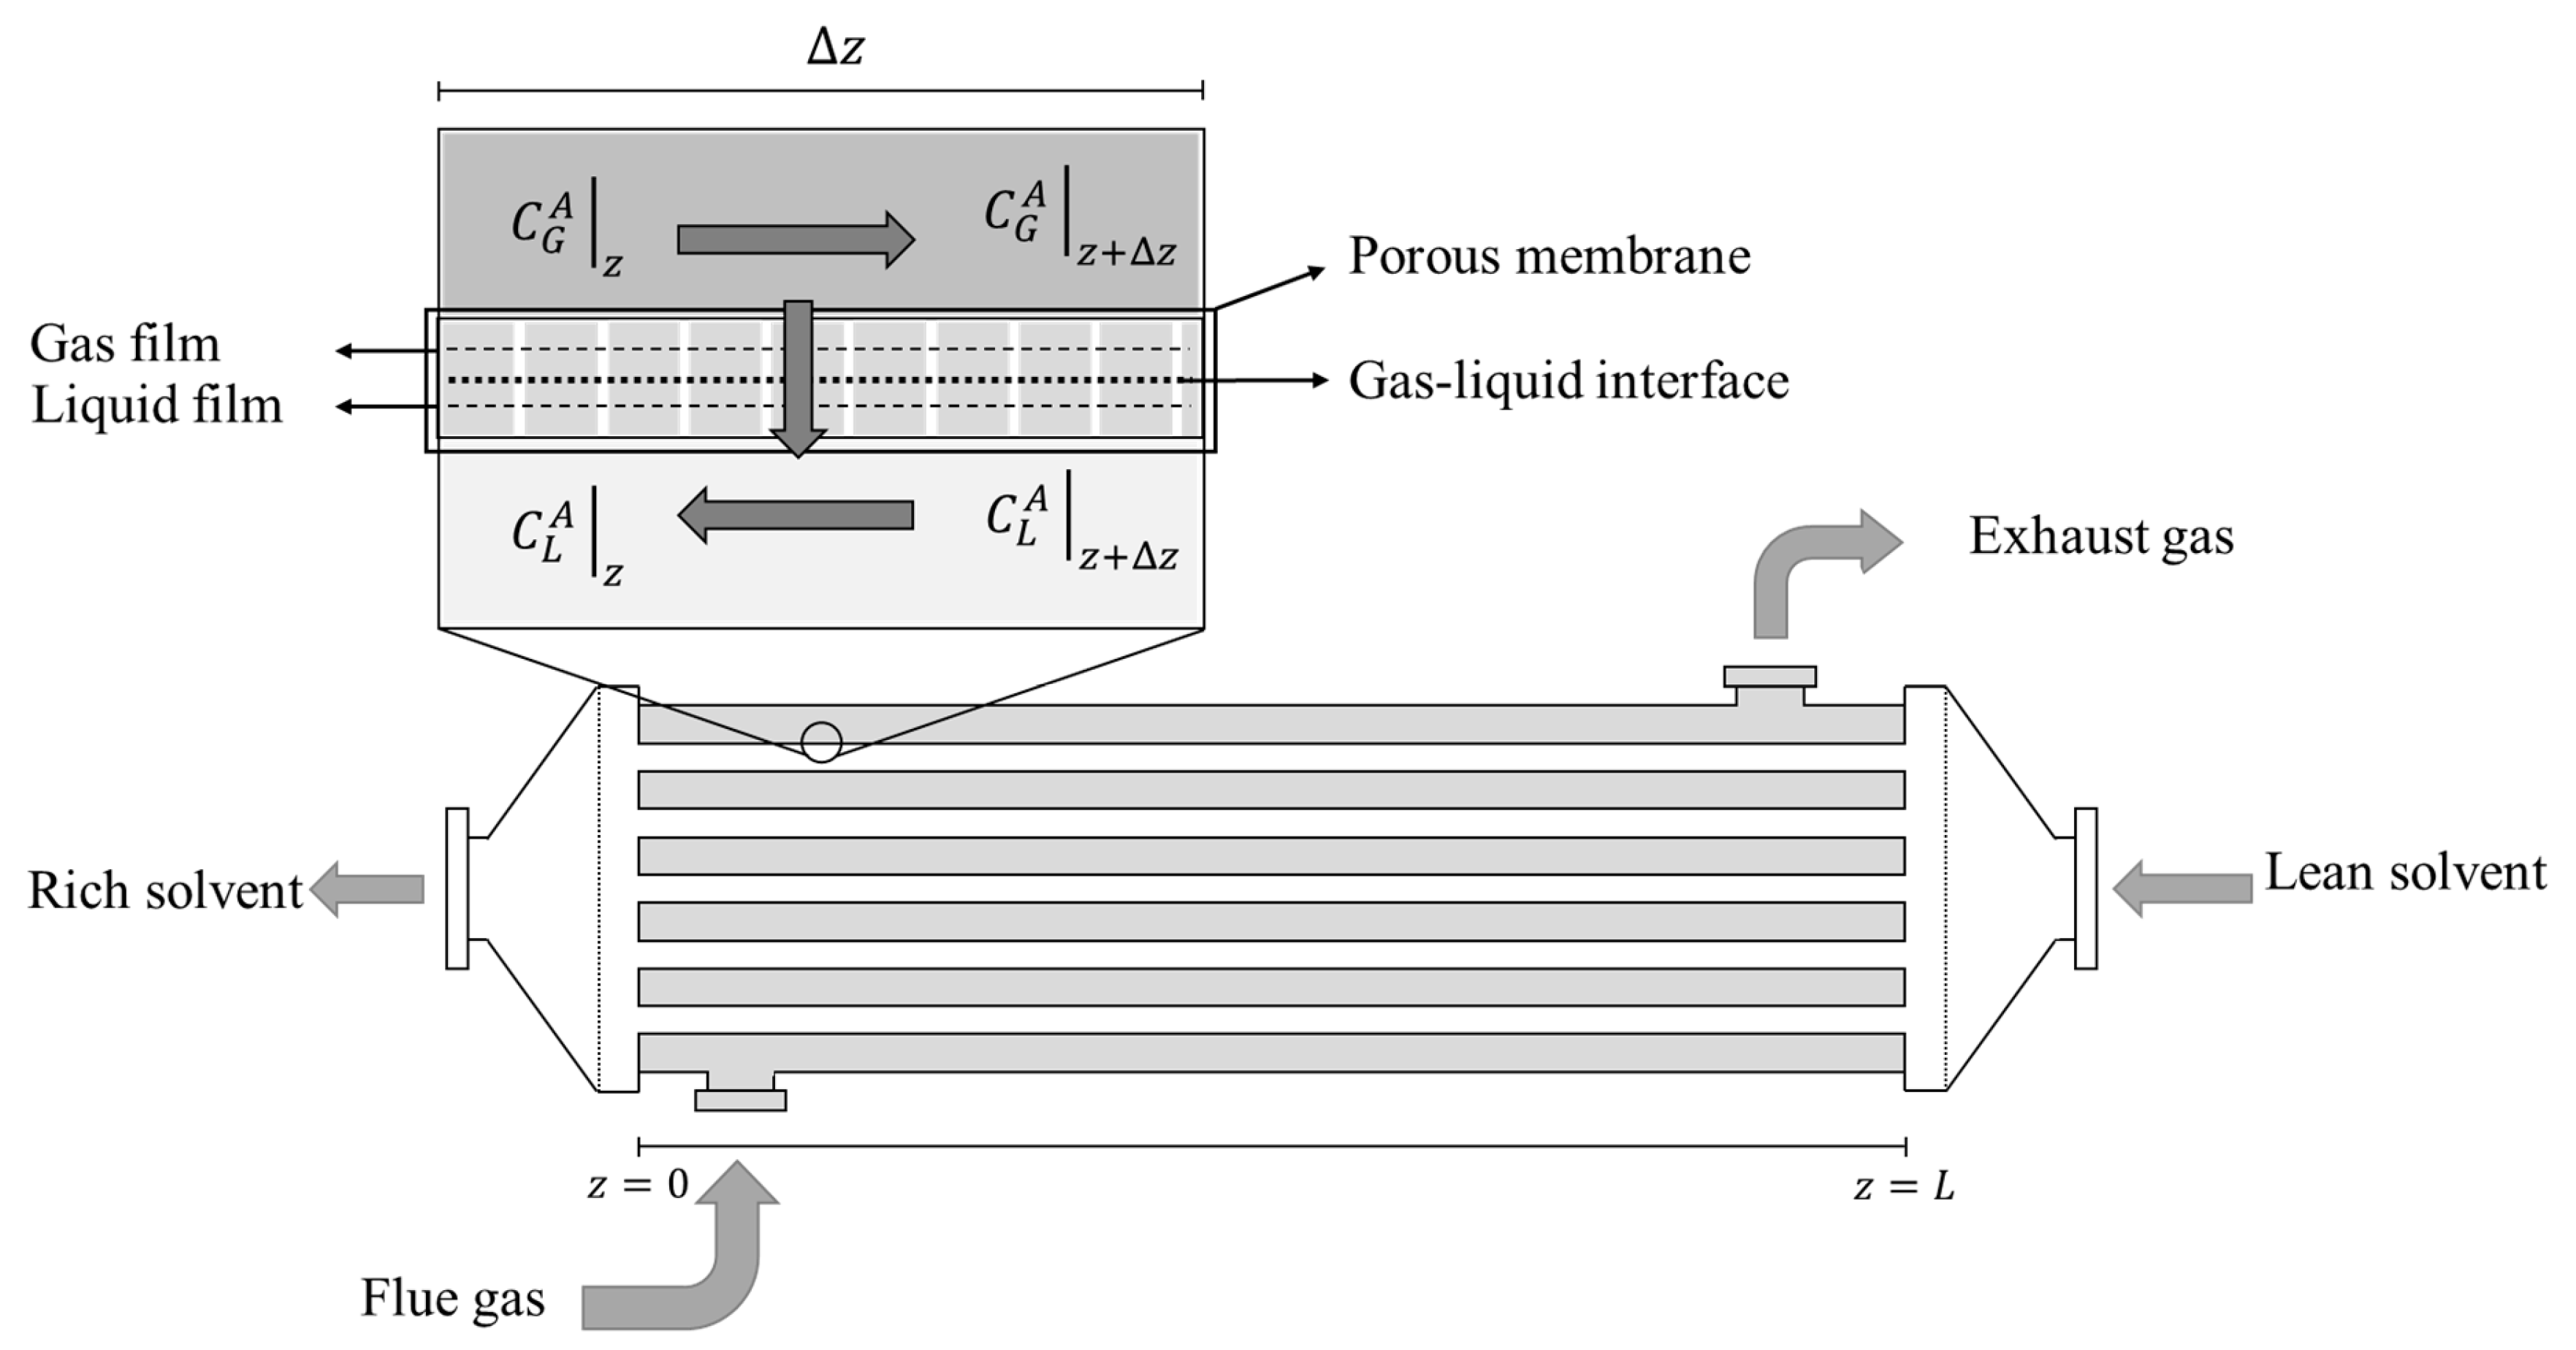
The system consists in a hollow fiber membrane contactor (HFMC), which can be de-scribed as a bundle of long and narrow hollow tubular fibers inside a shell [
17], such as a conventional shell and tube heat exchanger, as illustrated on
Figure 1. The gaseous stream (flue gas flow rate), which is entering on the shell side of the HFMC, is a mixture of carbon dioxide (CO
2), nitrogen (N
2), oxygen (O
2) and water vapor (H
2O), as it commonly describes a post-combustion stream composition [
7,
28,
29,
30]. The liquid stream is leaking on the lumen side and consists in an aqueous solution of monoethanolamine (MEA) 30% (w/w). This solvent has high a CO
2 uptake due to its affinity and the chemical conversion with MEA in the liquid phase [
4,
17].
2.1. Geometry and flow
Capillary fibers present high area-volume ratios exhibiting large areas that improves the mass transfer processes. The pilot plant and the laboratory unit studied by [
31,
32] were used for the simulation - dynamic analysis and the validation purpose. Thus, the fiber volume fraction (or packing fraction) of the HFMC was fixed (around φ=0.6), as it is typically used in conventional contactors for lab or pilot scale [
4,
7,
19,
20,
22,
32,
33,
34]. Both the internal and external membrane radii (
and
, respectively) were fixed. The radii difference defines the membrane thickness (
) and the relative membrane thickness as the ratio between the membrane thickness to the external radio (
). With the previous parameters defined, the shell radius (
) was calculated using Happel’s free surface model [
7,
20,
35].
Hydraulic diameters were used to describe the flow in the lumen and in the shell side, since the sections are circular. The total flow section areas for the gas and liquid phases were calculated using the module packing fraction, the membrane radius, and the number of fibers. Given the gas and liquid volumetric flow rates and the respective flow areas, the inlet velocities could be calculated.
Table 1 shows the expressions used to estimate the parameters used.
2.2. Main model hypothesis
Important model assumptions (flow, system, membrane characteristics, thermodynamics, mass transfer and kinetics) are summarized in
Table 2.
With the conditions and descriptions in
Table 1, the system operates in a counter-current flow, with constant temperature and negligible pressure drop [
19,
20,
23,
24,
36,
37,
38]. CO
2 concentration changes in gas and liquid currents does not affect their properties, keeping the flow rate constant along the process. It was assumed that the membrane tubes are microporous, given the need to allow greater selectivity in relation to CO
2 [
4]. [
39,
40] analyzed the effect of pore wetting, and they concluded that, depending on the liquid pressure, this phase liquid could enter the pores, increasing the resistance to mass transfer, even in a very small percentage of wetting. In this paper, the membrane wetting was set in 5%, which showed to fit in this system. Considering the high affinity of the solvent with CO
2, the solubility of N
2 was neglected [
33].
3. Model development
This section will present the main equations used to construct the dynamic model of the hollow fiber membrane contactor, which include concentrations, mass transfer, and chemical reaction conditions.
3.1. Component mas balance equations
For the mixture, the molar continuity equation for a species
i is given by Eq. (1).
where
is the molar concentration of
(mol.m
-3),
is the molar flux vector of
(mol.m
-2s
-1) and
is the reaction rate for
(mol.m
-3s
-1). Considering only the axial velocity (cylindrical coordinates), describing the molar flux by the overall mass transfer coefficient, and neglecting the reaction rate, the molar balance for CO
2 on the gas phase is given by Eq. (2).
where
is the molar concentration of the component (mol/m
3), the superscript
represents de solute (CO
2),
stands for the overall mass transfer coefficient (m.s
-1), the term
is the specific interfacial area (m
2/m
3),
is the enhancement factor,
is the volumetric partition coefficient,
is the velocity of the fluid (m/s), and the subscripts
and
indicates the gas and liquid phases, respectively.
Henry’s law was applied to describe the equilibrium at the gas-liquid interface, and the concentration of CO
2 at the internal surface of the fibers is a function of the liquid-gas volumetric partition coefficient (
), which is defined by the inverse of the dimensionless Henry constant for CO
2 on MEA solution as follows.
For the liquid phase, the molar balance is like the previous one, however, the reaction term is not neglected, and the CO
2 molar flux is positive. Thus, considering a counter-current flow, the equation can be expressed by:
where
represents the consumption rate of CO2 by chemical reaction on the liquid phase.
The consumes of CO
2 by the chemical reaction depends also on the concentration of MEA on de liquid. So, an equation to define the concentration of the second reactant is required, and it can be expressed as follows:
where B denotes the free MEA on the aqueous solution.
3.2. Component mas balance equations
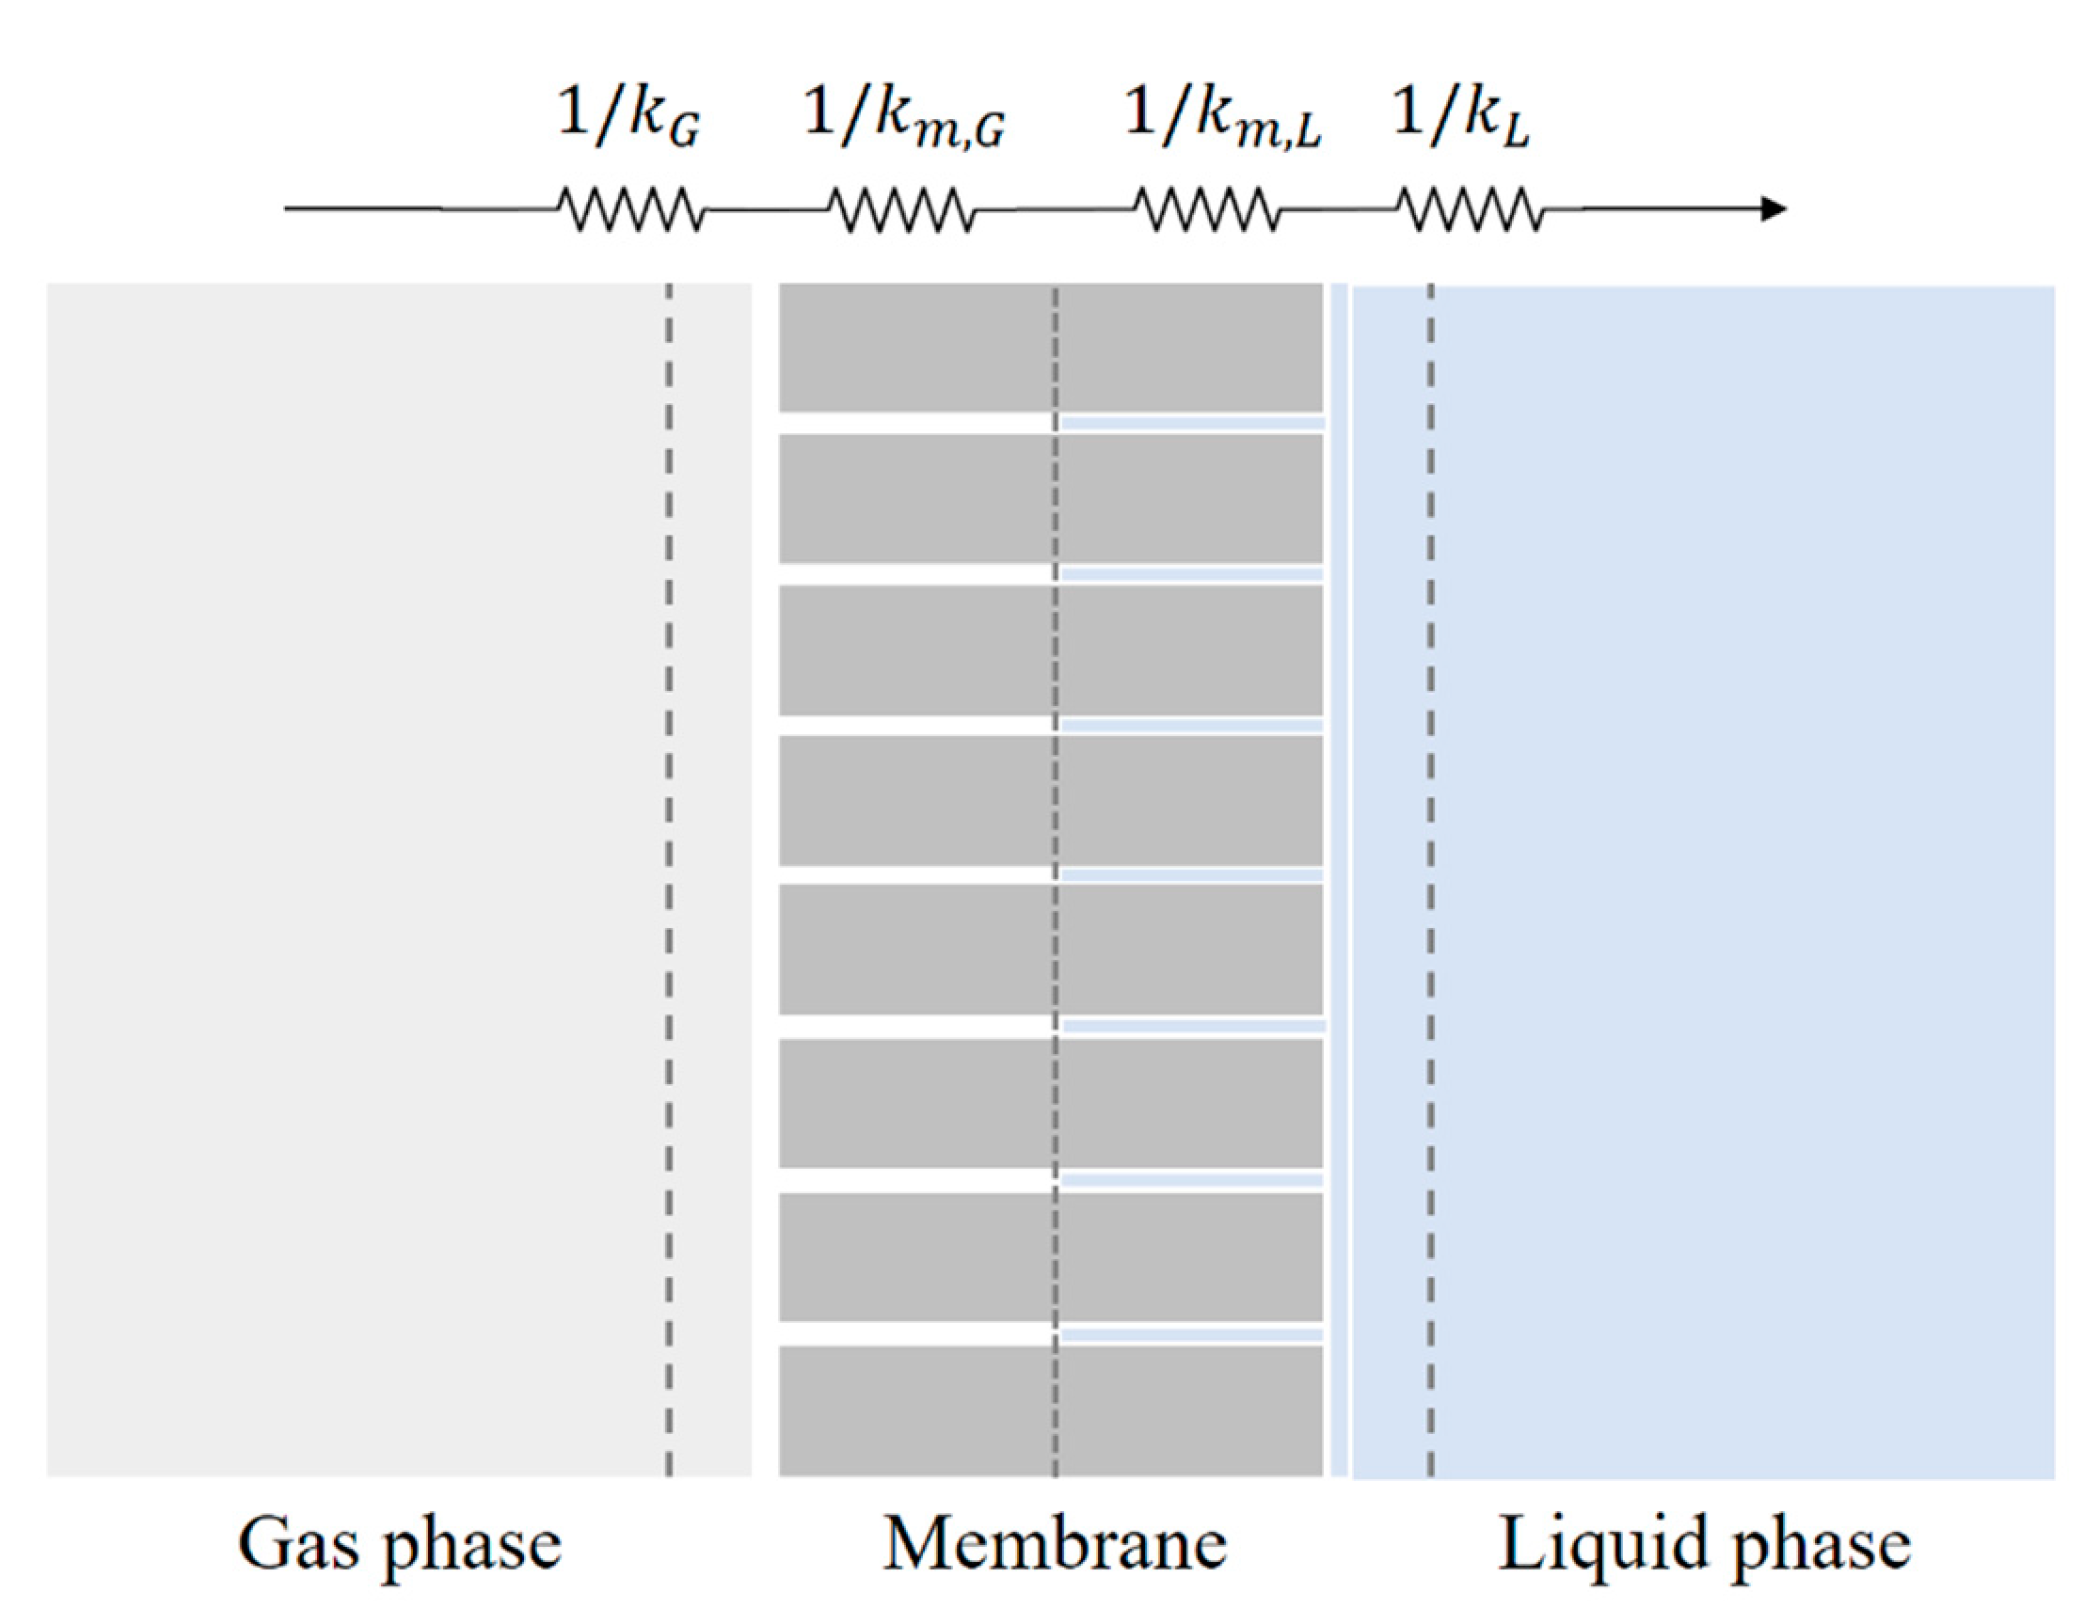
The two-film theory in equilibrium with the gas-liquid interface is assumed, as shown in
Figure 2. The mass transfer is described by the concept of resistances in series, and the overall mass transfer coefficient is given as [
17,
27,
41]:
where
is the wetting ratio (the fraction of wetted volume in the pores) and
k stands for the mass transfer coefficient at each phase.
Therefore, the mass transfer coefficients for the phases were calculated using the Sherwood number given from different approaches of Graetz equation [
13,
33,
42,
43,
44,
45]. This approach was also applied by [
19,
20,
33,
34] to estimate the local Sherwood number through the pack of cylinders, and consequently, the local mass transfer coefficient for the gas, and concludes that it is also suitable, considering laminar flow, fully developed profiles for and a uniform flux through the membrane.
The Sherwood (
) and Graetz (
) number for a species
i in gas and liquid phases are correlated by Eqs. (7, 8), respectively, and defined by Eqs. (9, 10) for a fluid
F.
The Eq. (11) is used to calculate the membrane mass transfer coefficient for a component i in fluid F (gas or liquid). In the membrane, the coefficients were estimated using the concept proposed by [
46] and the approach for partial wetted mode, using the wetting ratio in the overall resistance (Eq. 6) by [
41].
where
, is the diffusivity coefficient of
in a fluid,
is the membrane thickness,
is the membrane porosity and
is the membrane tortuosity.
To monitor the CO
2 absorbed, the percentual capture ratio (Θ) was defined as the ratio of the solute uptake in the absorber to the solute input. In terms of the inlet and outlet gas mol fractions of the solute according to Eq. (12).
The amount of CO
2 in the liquid phase is often described by the loading in solvent, which can be estimated, using the reaction stoichiometric [
19] by Eq. (13)
3.3. Kinetics
Since the kinetics between CO
2 and alkanolamines are often kinetically controlled, the overall reaction kinetics are considered being irreversible and having second order characteristics [
47,
48]. Thus, occurring in the liquid phase, the expression and kinetics are given by Eqs. (14, 15).
where
is the kinetic constant (m
3s
-1mol
-1).
According to the stoichiometric, the rate of the consumption of free MEA is:
The Hatta number (Ha) and the asymptotic enhancement factor were used to define the chemical reaction regime in the system and are calculated by Eq. (17) and (18), respectively [
49,
50].
where
and
are the diffusion coefficient for the CO
2 and MEA, respectively, in the aqueous solution. The regime types and their relationship to the mentioned dimensionless numbers are shown on
Table 3.
Therefore, the enhancement factor E can be calculated, following the [
51] correlation, by Eqs. (19,20).
4. Numerical solution and validation parameters
The method of lines (MOL) was applied to solve the distributed-parameter model, which is represented by the partial differential equations (PDEs) Eqs. (2), (4), and (5). The PDEs were approximated to a set of ordinary differential equations (ODEs), where the spatial terms were discretized using backward finite differences for the gas and forward differences for the liquid phase. The ODEs system was implemented in the Python software and solved by the internal function
odeint, a tool from
scipy.integrate package.
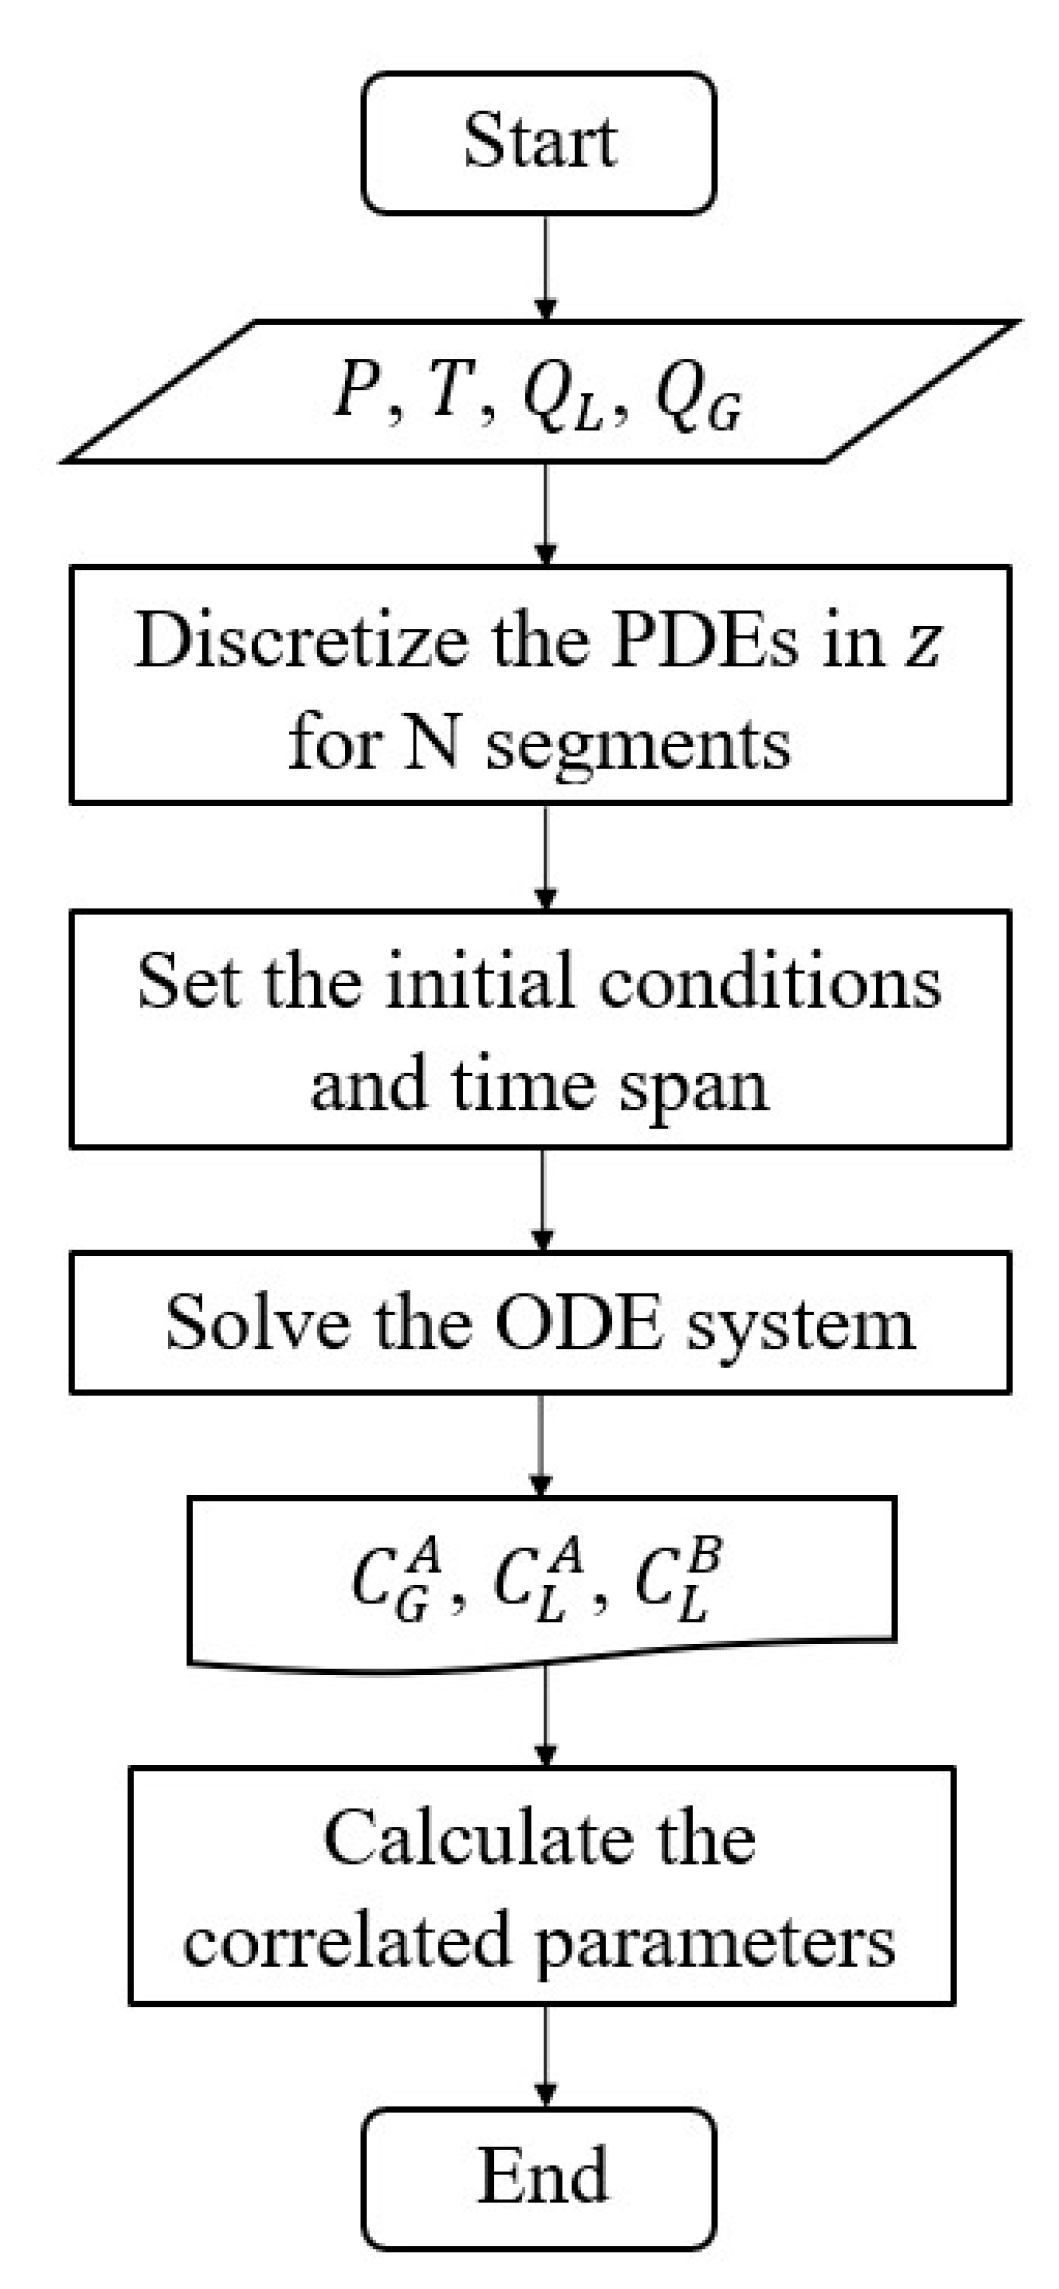
Figure 3 shows the computational flow chart used to solve the set of equations., and the boundary and initial conditions are defined on
Table 4.
The concentrations of the gaseous and liquid phases at the HFMC inlet or in the initial condition are indicated in
Table 4 by the subscript 0 (zero).
Several works in the literature, using different approaches, solvents and configurations were already validated with experimental data [
22,
33,
39,
51,
52]. These studies do not deal model validation with process dynamics data, due to the lack of pilot-scale or even laboratory-scale dynamic data in the literature.
Although this manuscript also does not validate the dynamic behavior, a steady-state validation was performed using the laboratory-scale data from [
32], for a post-combustion CO
2 capture system by MEA solution. Also, pilot-plant specifications from a unit studied by [
31,
32] were used to perform the simulations and analyze the transient behavior. Both lab and pilot-scale specifications are summarized in
Table 5.
The parameters correlations used in the simulations are summarized on
Table 6.
5. Simulation results
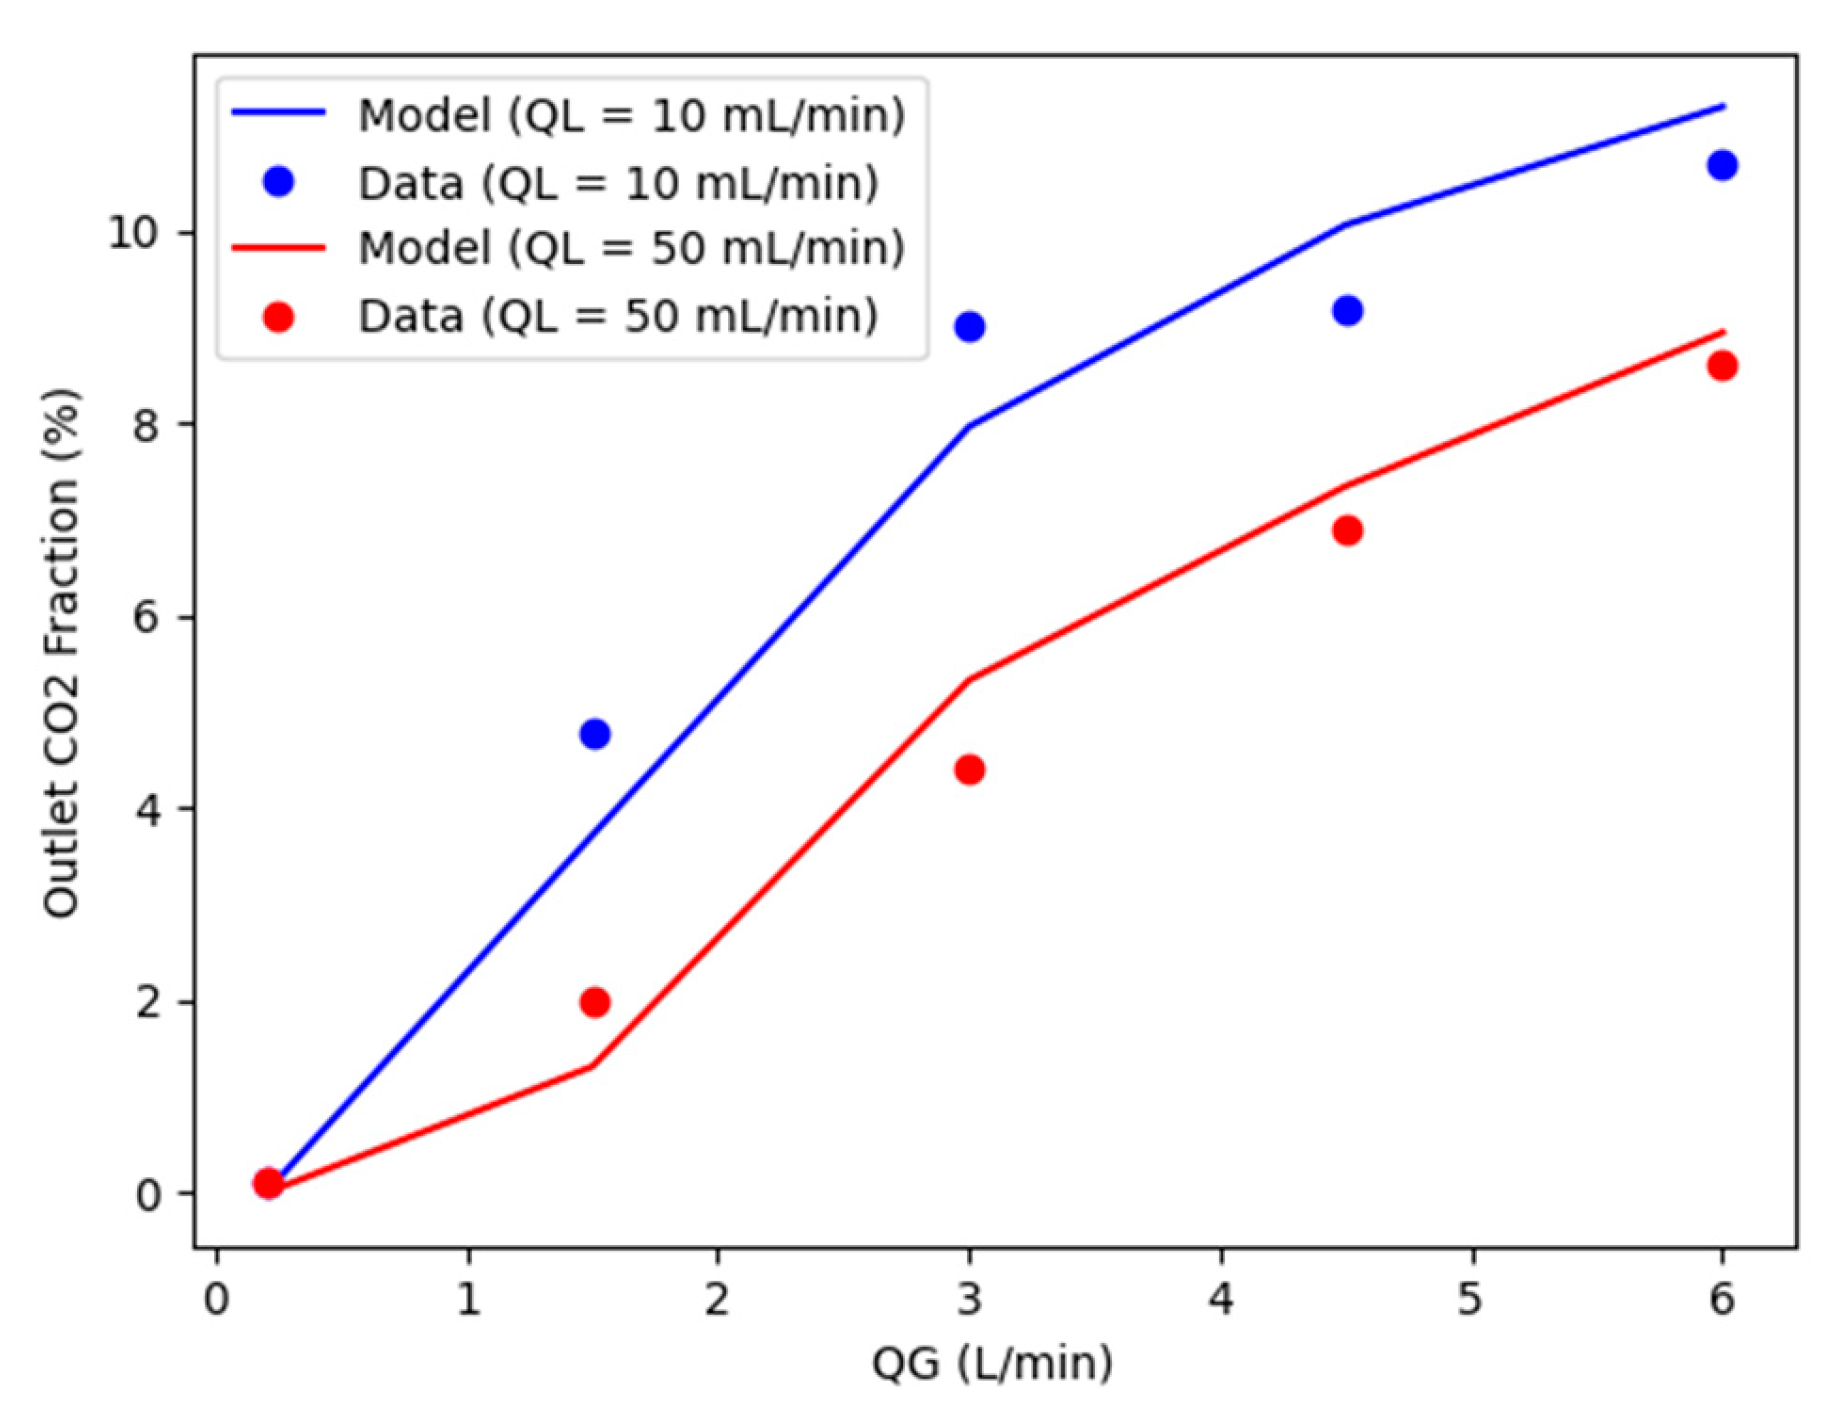
The steady-state model is obtained by equating the terms on the left side of the equality in Eqs. (2), (4) and (5) to zero, this model was validated using laboratory scale data provided by [
32] and the specifications in Table (5). The comparison was evaluated using the outlet CO
2 fraction (% CO
2) in the gas at different gas flow rates (
) for two different liquid flow rates (
).
Figure 4 compares the values for both cases. The profiles in
Figure 4 shows a good agreement between the simulation results and the experimental data used, presenting a correlation coefficient R
2 > 0,95 for both cases. The simulation behavior of CO
2% as the
changes follows the experimental pattern, as expected, for both QL values. The model proved to predict the absorption of post-combustion CO
2 in MEA solution using a HFMC, therefore validated for being used for intended analyses in this work.
5.1. System behavior
Following, the dynamics of the carbon capture plant is studied. The model is submitted to disturbances in the load and the changes in the operating conditions coming from the up-stream power plant. The initial conditions are given in
Table 7, and the steady state reached in these conditions was further used as the base case to analyze the plant dynamics.
The transient behavior of the membrane contactor for the given initial conditions (
Table 4) is shown on
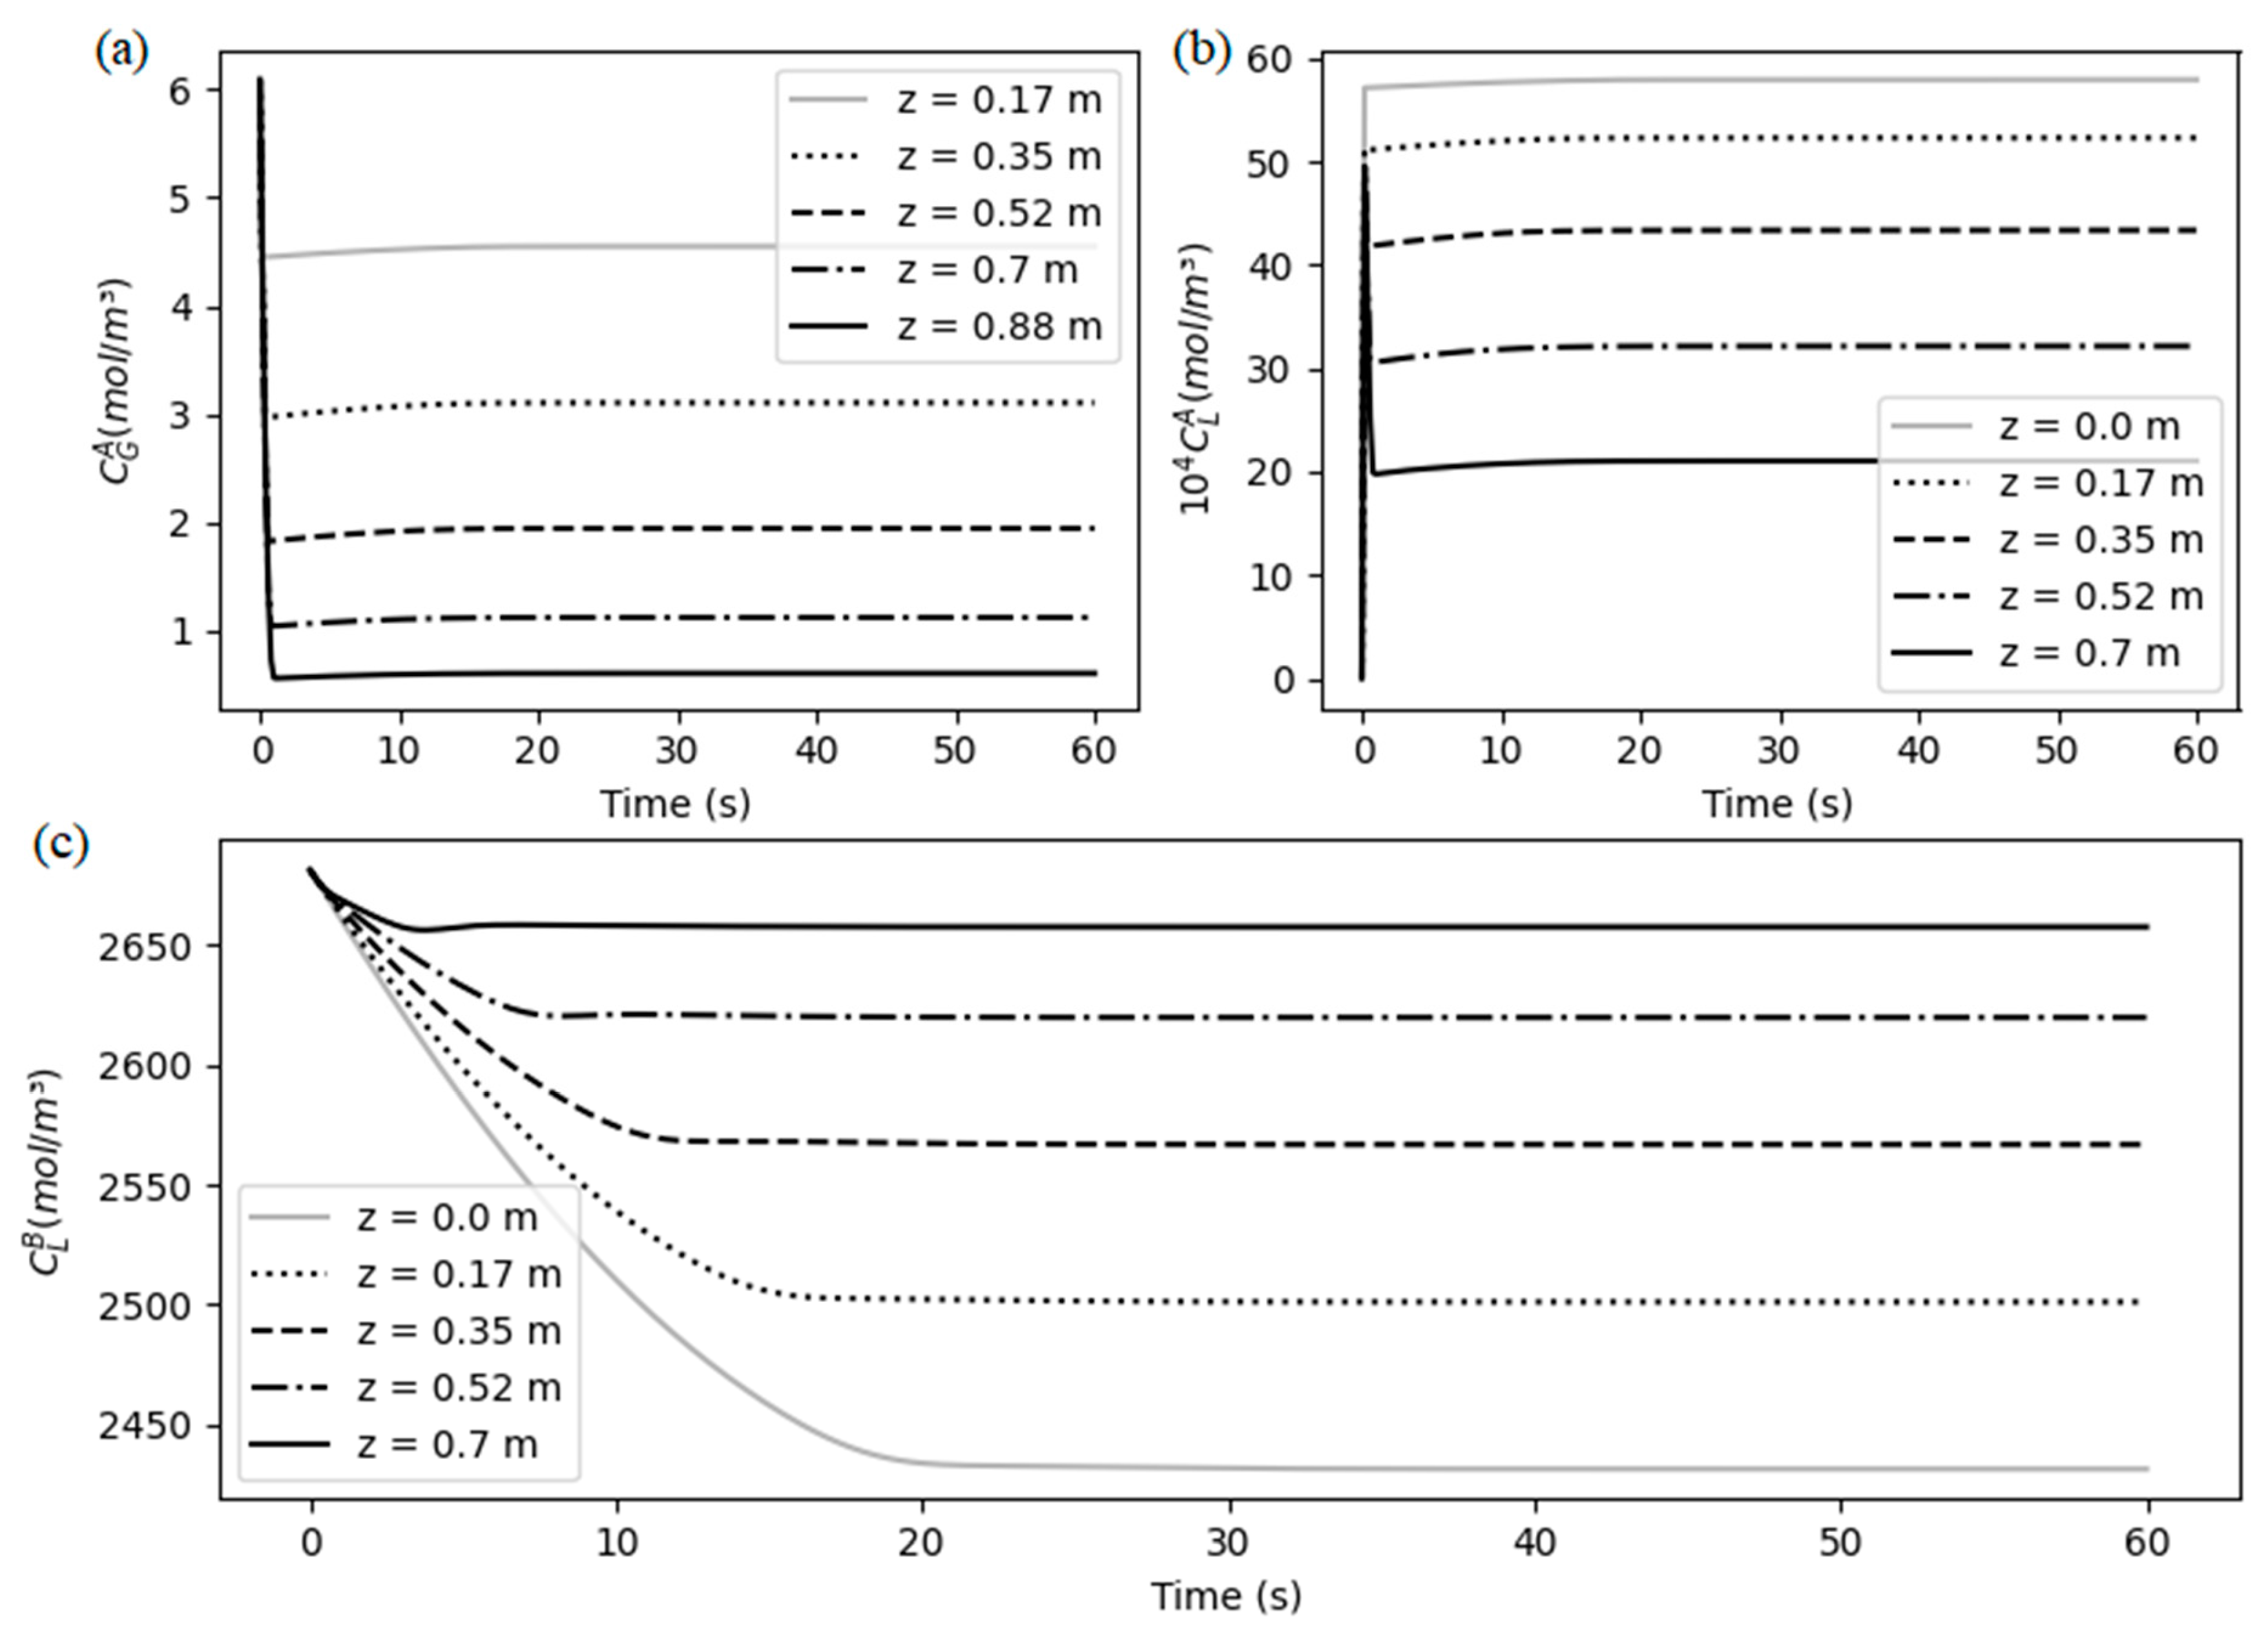
Figure 5, as the solution of the equations, where five points from the discretized space were selected for visualization. It can be seen that the system reaches steady-state around 30 seconds. Furthermore,
Figure 5(a) and (b) show the behavior of the so-lute in the gas and liquid phases, respectively, where they present a similar mirror trend: they both initially suffer an abrupt change, which represents a peak in CO
2 molar flux, followed by a smooth increase, until reach the steady-state. As the amount of CO
2 in gas phase migrates instantaneously to de liquid phase, the chemical reaction starts do consume both free CO
2 and free MEA in liquid, and this decrease in free MEA concentration, showed in
Figure 5 (c) provides a decrease also in the overall CO
2 molar flux. This reduction explains the smooth growth in the CO
2 concentration profiles and makes clear that the chemical reaction is also controlling the process.
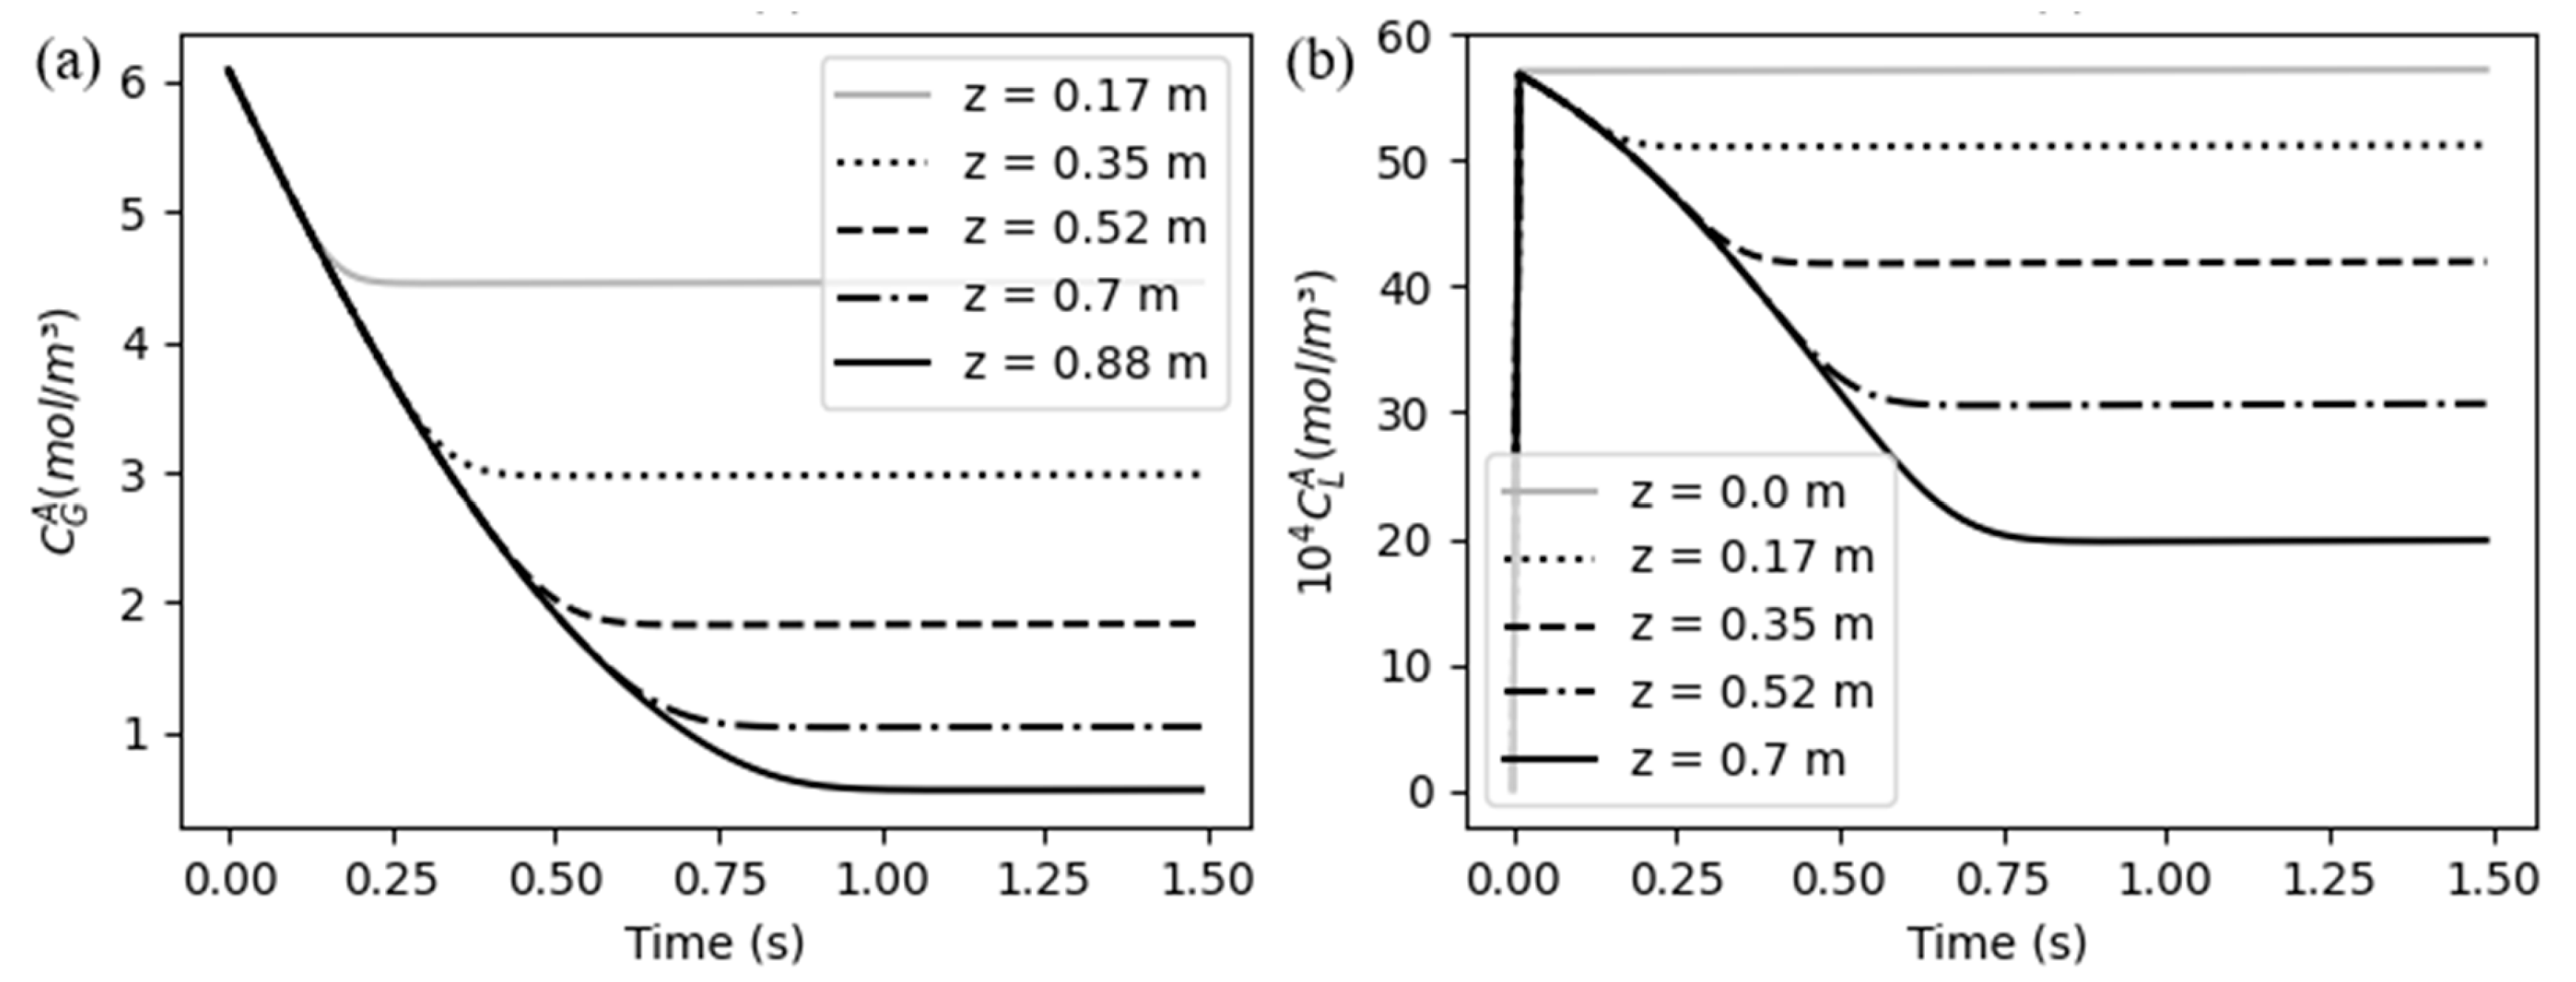
An approximation of the CO
2 profiles at the first instants can be seen in Figu. 5. The concentration profiles in the gas phase, showed in
Figure 6(a), follows an expected pattern, decreasing uniformly at each point of space, while the concentration in liquid, showed in
Figure 6(b), suffers an immediately growth, as it was considered to be initially zero and the fast mass transfer process makes a small amount of solute appear at the liquid phase. A part of that CO
2 in liquid begins to be instantaneously consumed by the chemical reaction.
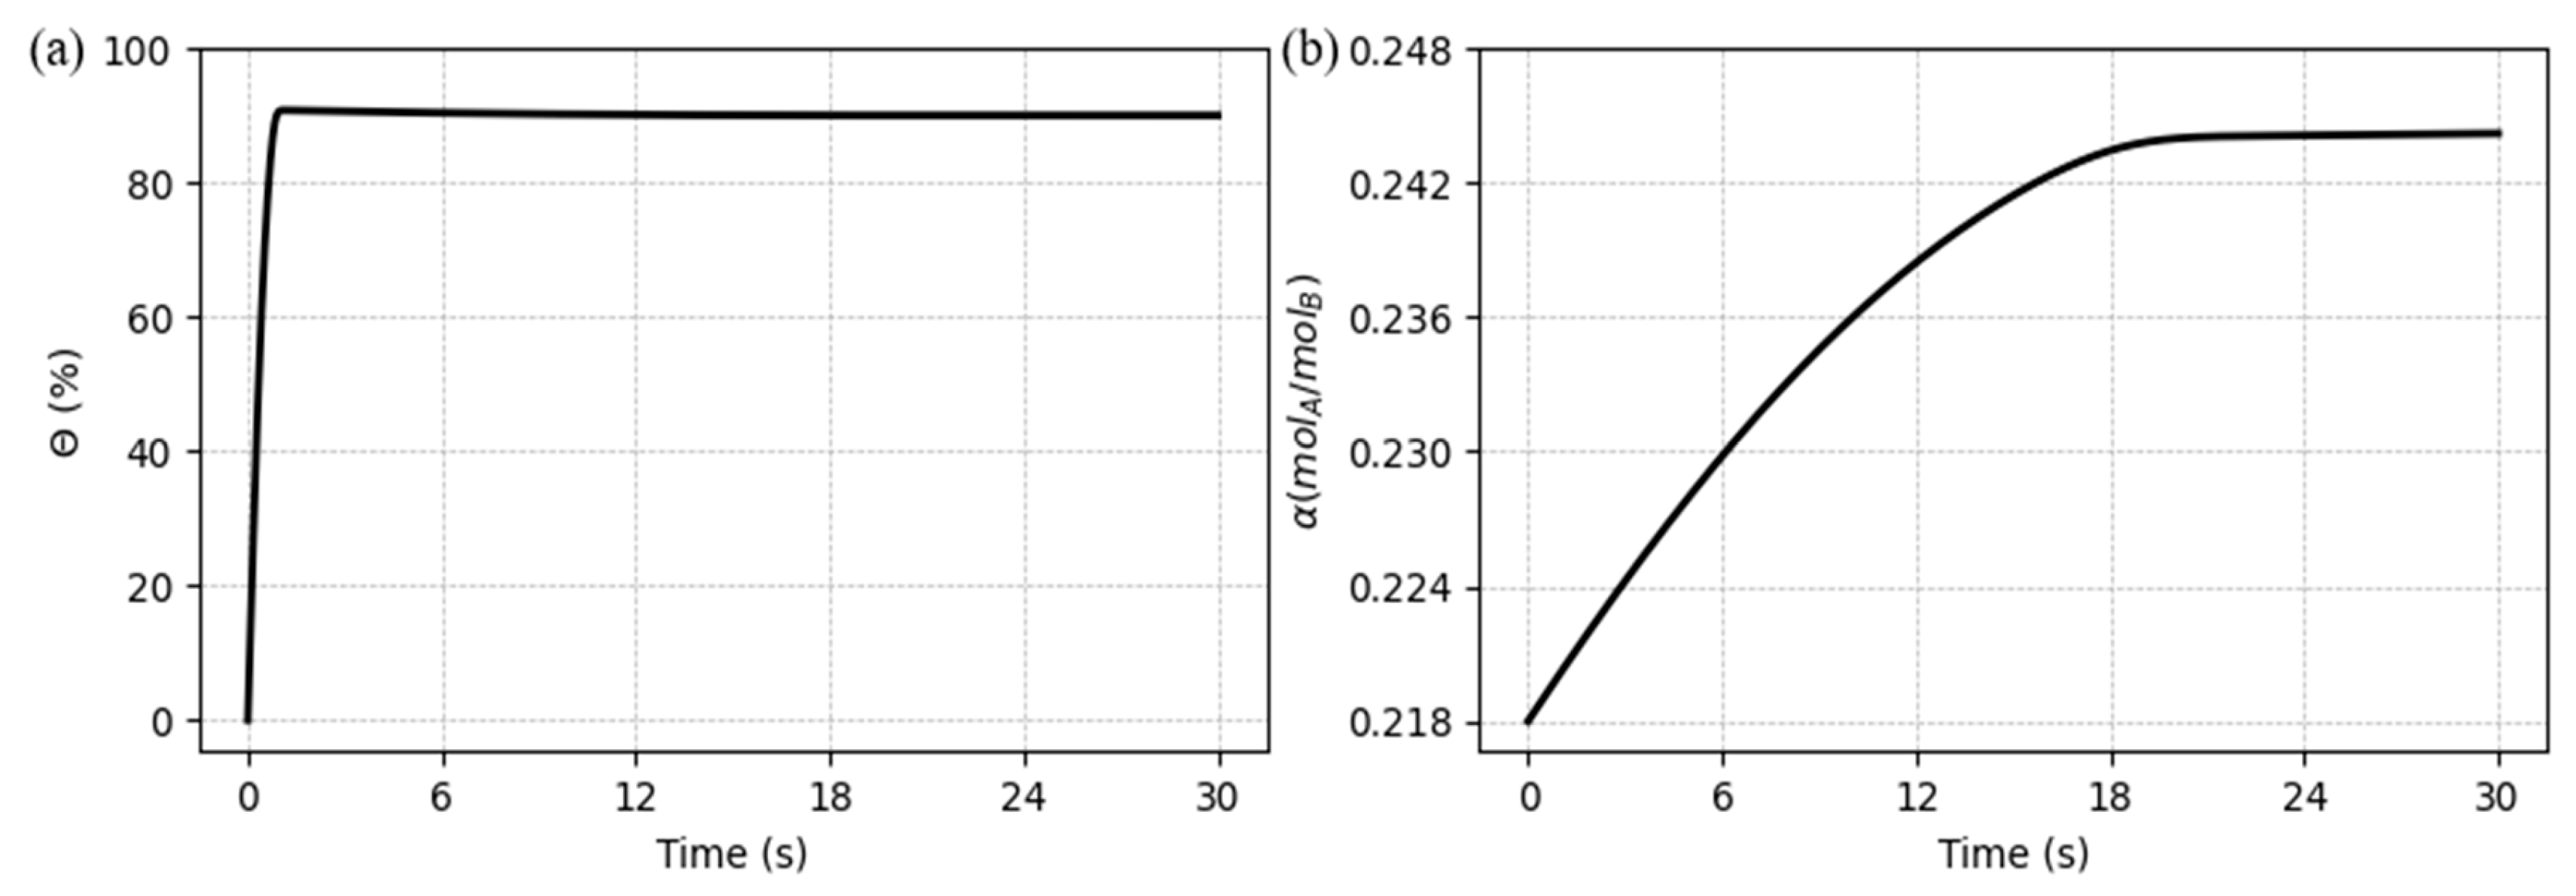
Through the results it was also possible to obtain the CO
2 capture ratio and rich loading, as shown in
Figure 7 (a) and (b), respectively. It can be seen that the capture ratio has a pattern very similar to the concentration in the gas phase (on inverted way), rinsing fast and suffering a smooth decrease after a peak, until get stable. It happens because the concentration gradient is greater at the initial instants, making the CO
2 flux reach a maximum point and decrease due the performance of the chemical reaction. On the other hand, the CO
2 rich loading performs in a smoothly pattern, just like the free MEA concentration behavior, but also on a mirror trend.
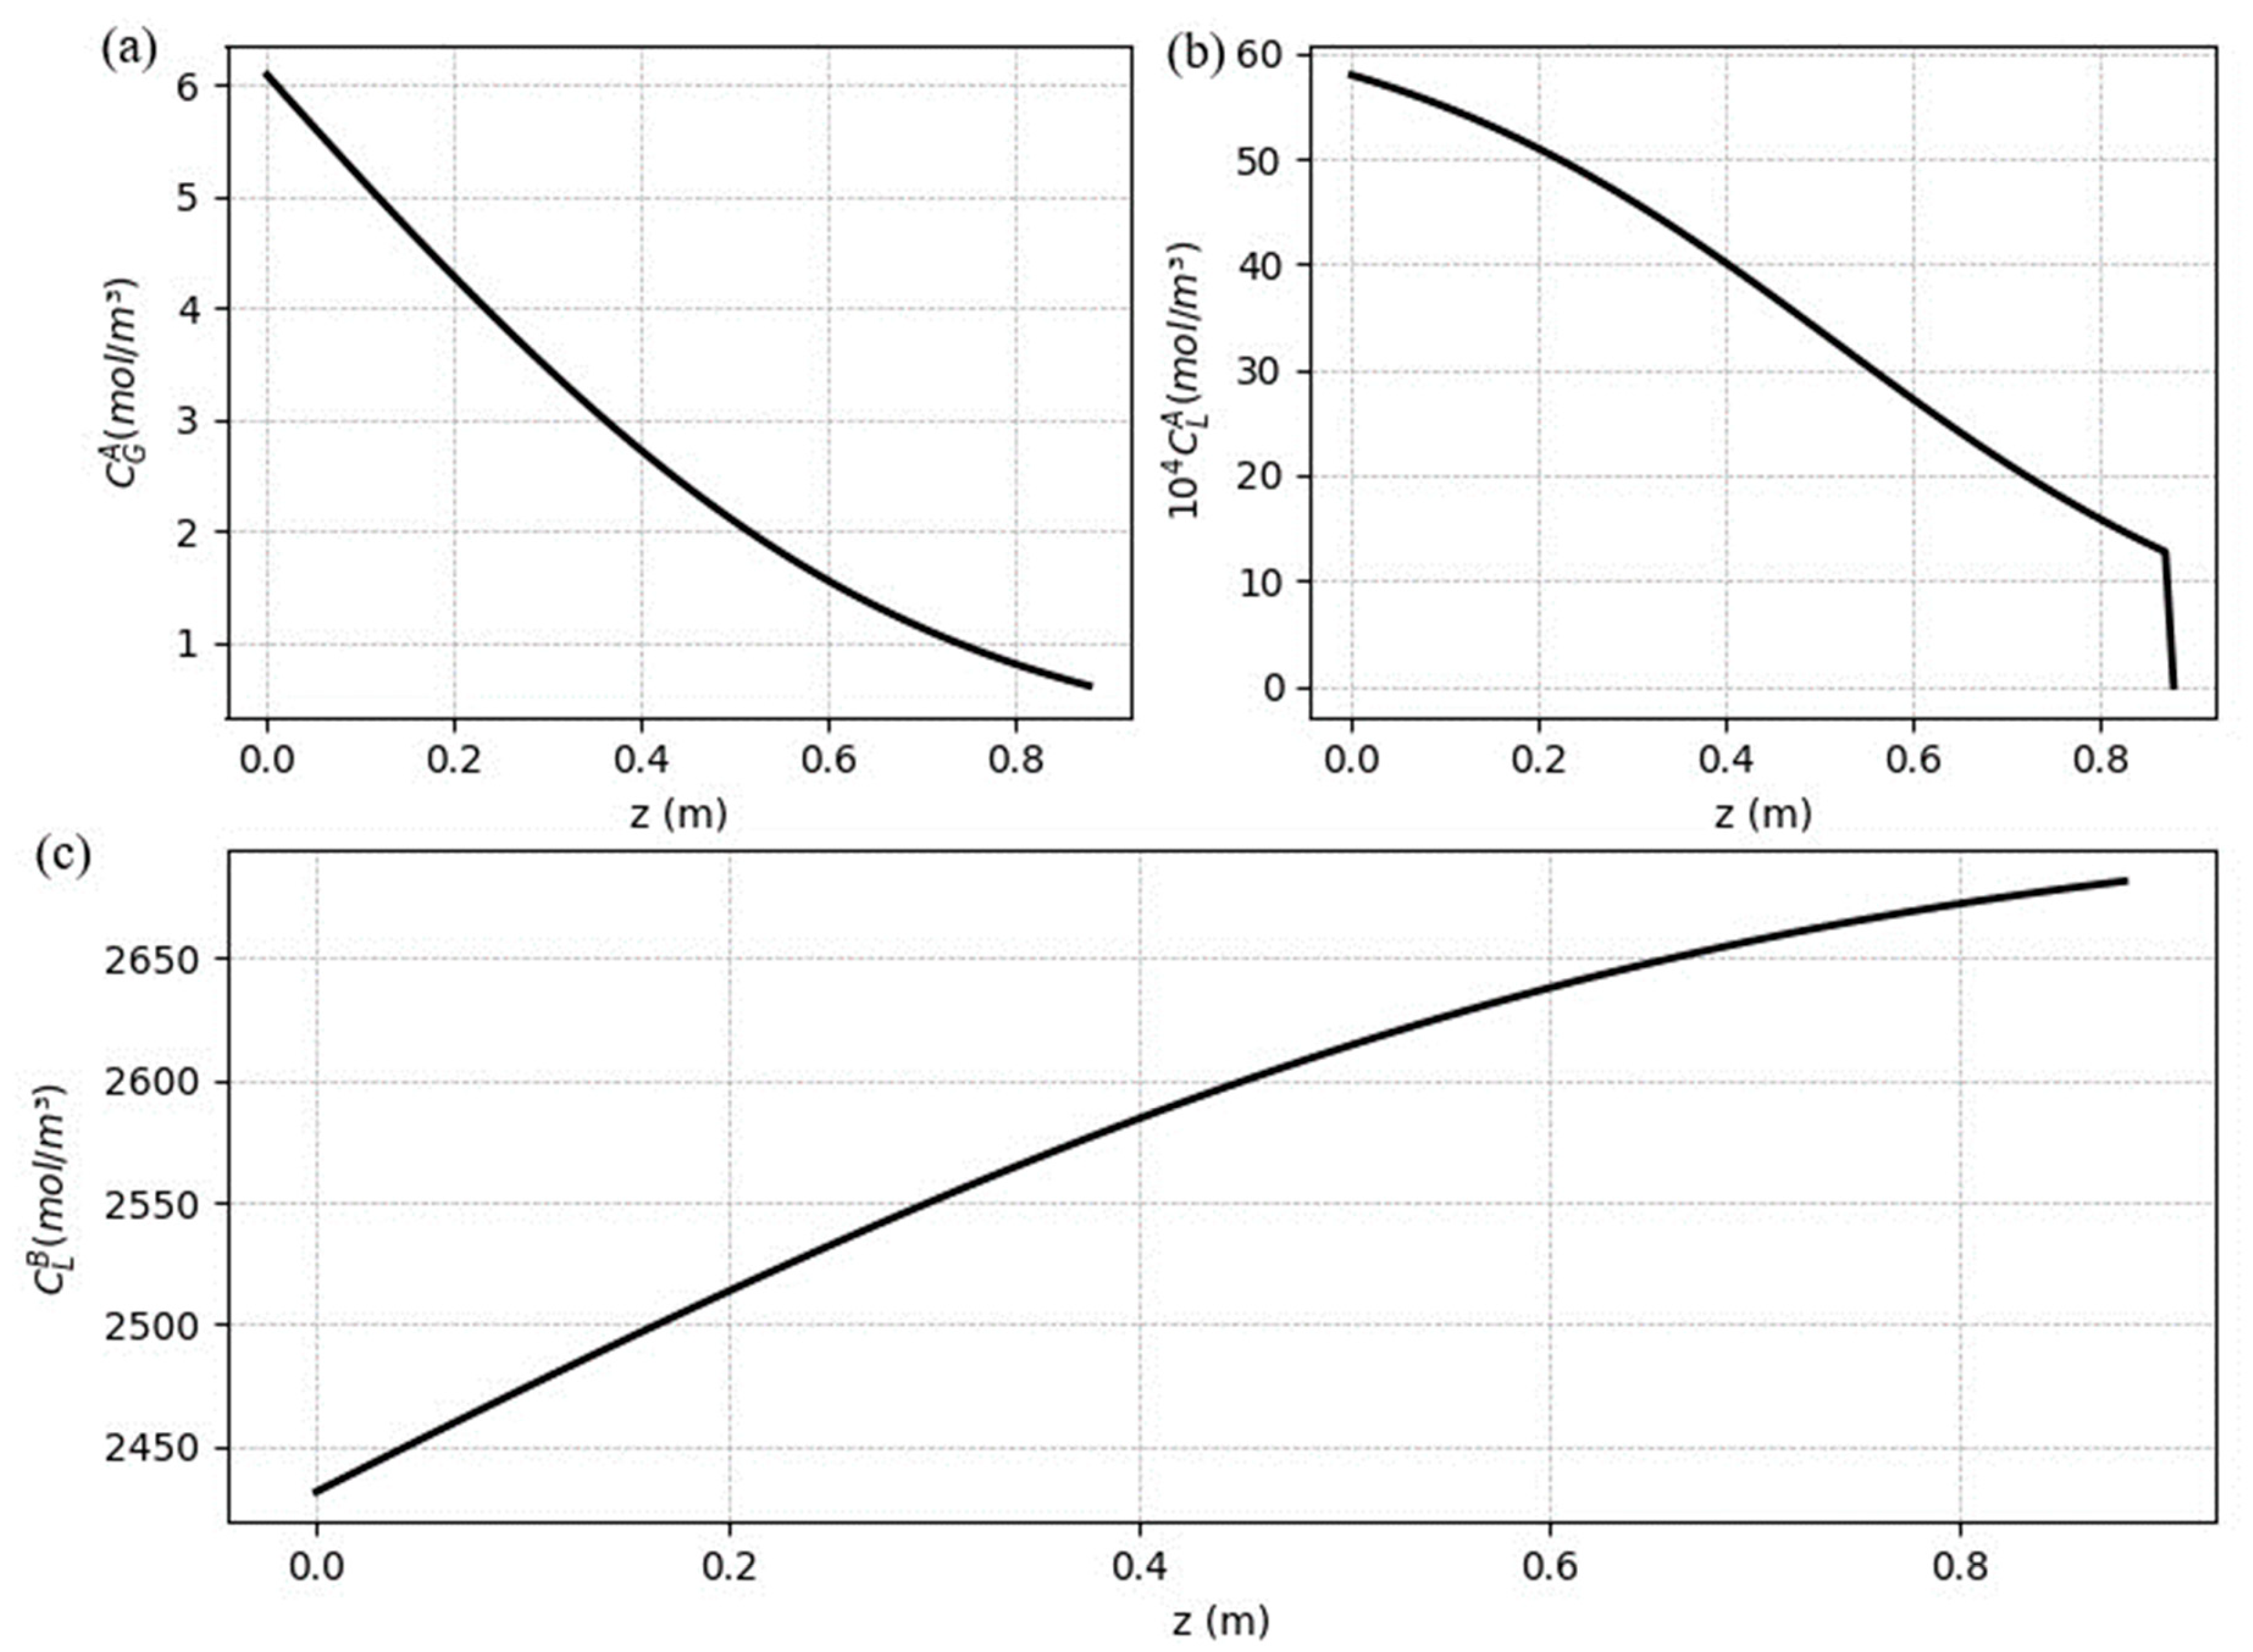
5.2. Steady-state results
The steady-state profiles area necessary to understand to where the process goes and what is happening along the fibers. Therefore, the profiles along the fibers are shown in
Figure 8 for CO
2 concentration in the gas (a) and liquid (b) phase, and the concentration of free MEA in the liquid (c). The profile for the gas is expected to decrease from its inlet side (
), as the CO
2 migrates from the gas to the liquid. As the solvent stream enters the system without free CO
2, the solute concentration increases quickly, and grows along the z (from
), although the free MEA concentration begins to decrease from
, due the chemical reaction.
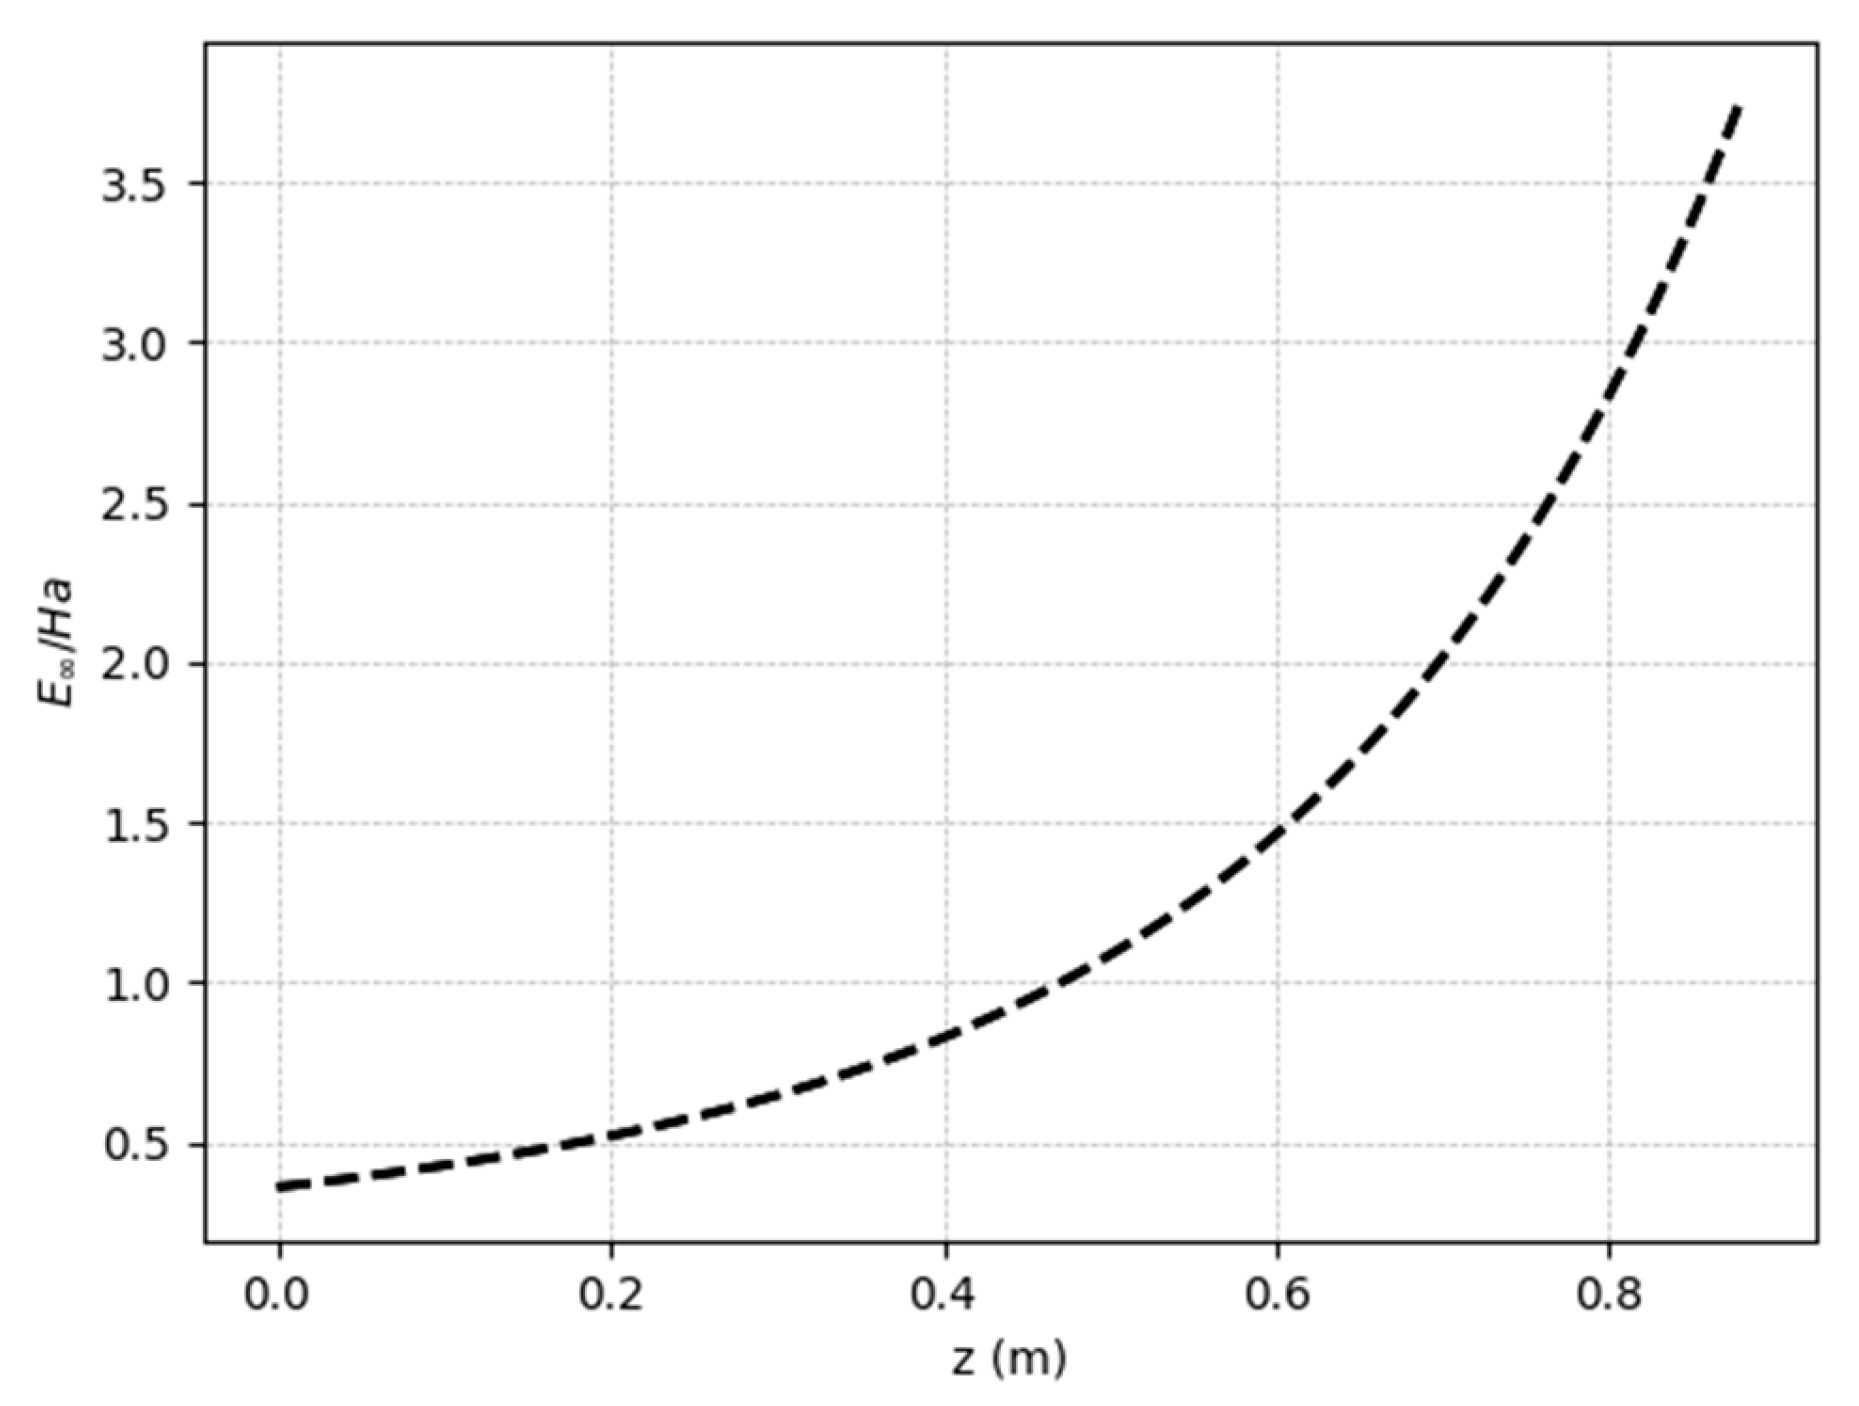
The fast reaction regime can be confirmed by the profile of the ratio between the Hatta number (
) and the asymptotic enhancement factor (
) along the membrane’s length (steady state regime), as shown in
Figure 9. Because the values are between 0.2 and 5, we can conclude, according to
Table 3, that the reaction is characterized as fast and second order, where both the mass transfer and the
In order to verify the effectiveness of the dynamic model, a step response and pulse response experiments were designed, considering the steady state values reached in the previous section as the base case. The chosen input variables are distributed in four distinct cases: disturbances in the liquid flow rate (case 1); disturbances in the gas flow rate (case 2); disturbances in the inlet CO2 composition (case 3); disturbances in the CO2 lean loading (case 4).
5.3. Dynamic response to process disturbances
In order to verify the effectiveness of the dynamic model, a step response and pulse response experiments were designed, considering the steady state values reached in the previous section as the base case. The chosen input variables are distributed in four distinct cases: disturbances in the liquid flow rate (case 1); disturbances in the gas flow rate (case 2); disturbances in the inlet CO2 composition (case 3); disturbances in the CO2 lean loading (case 4).
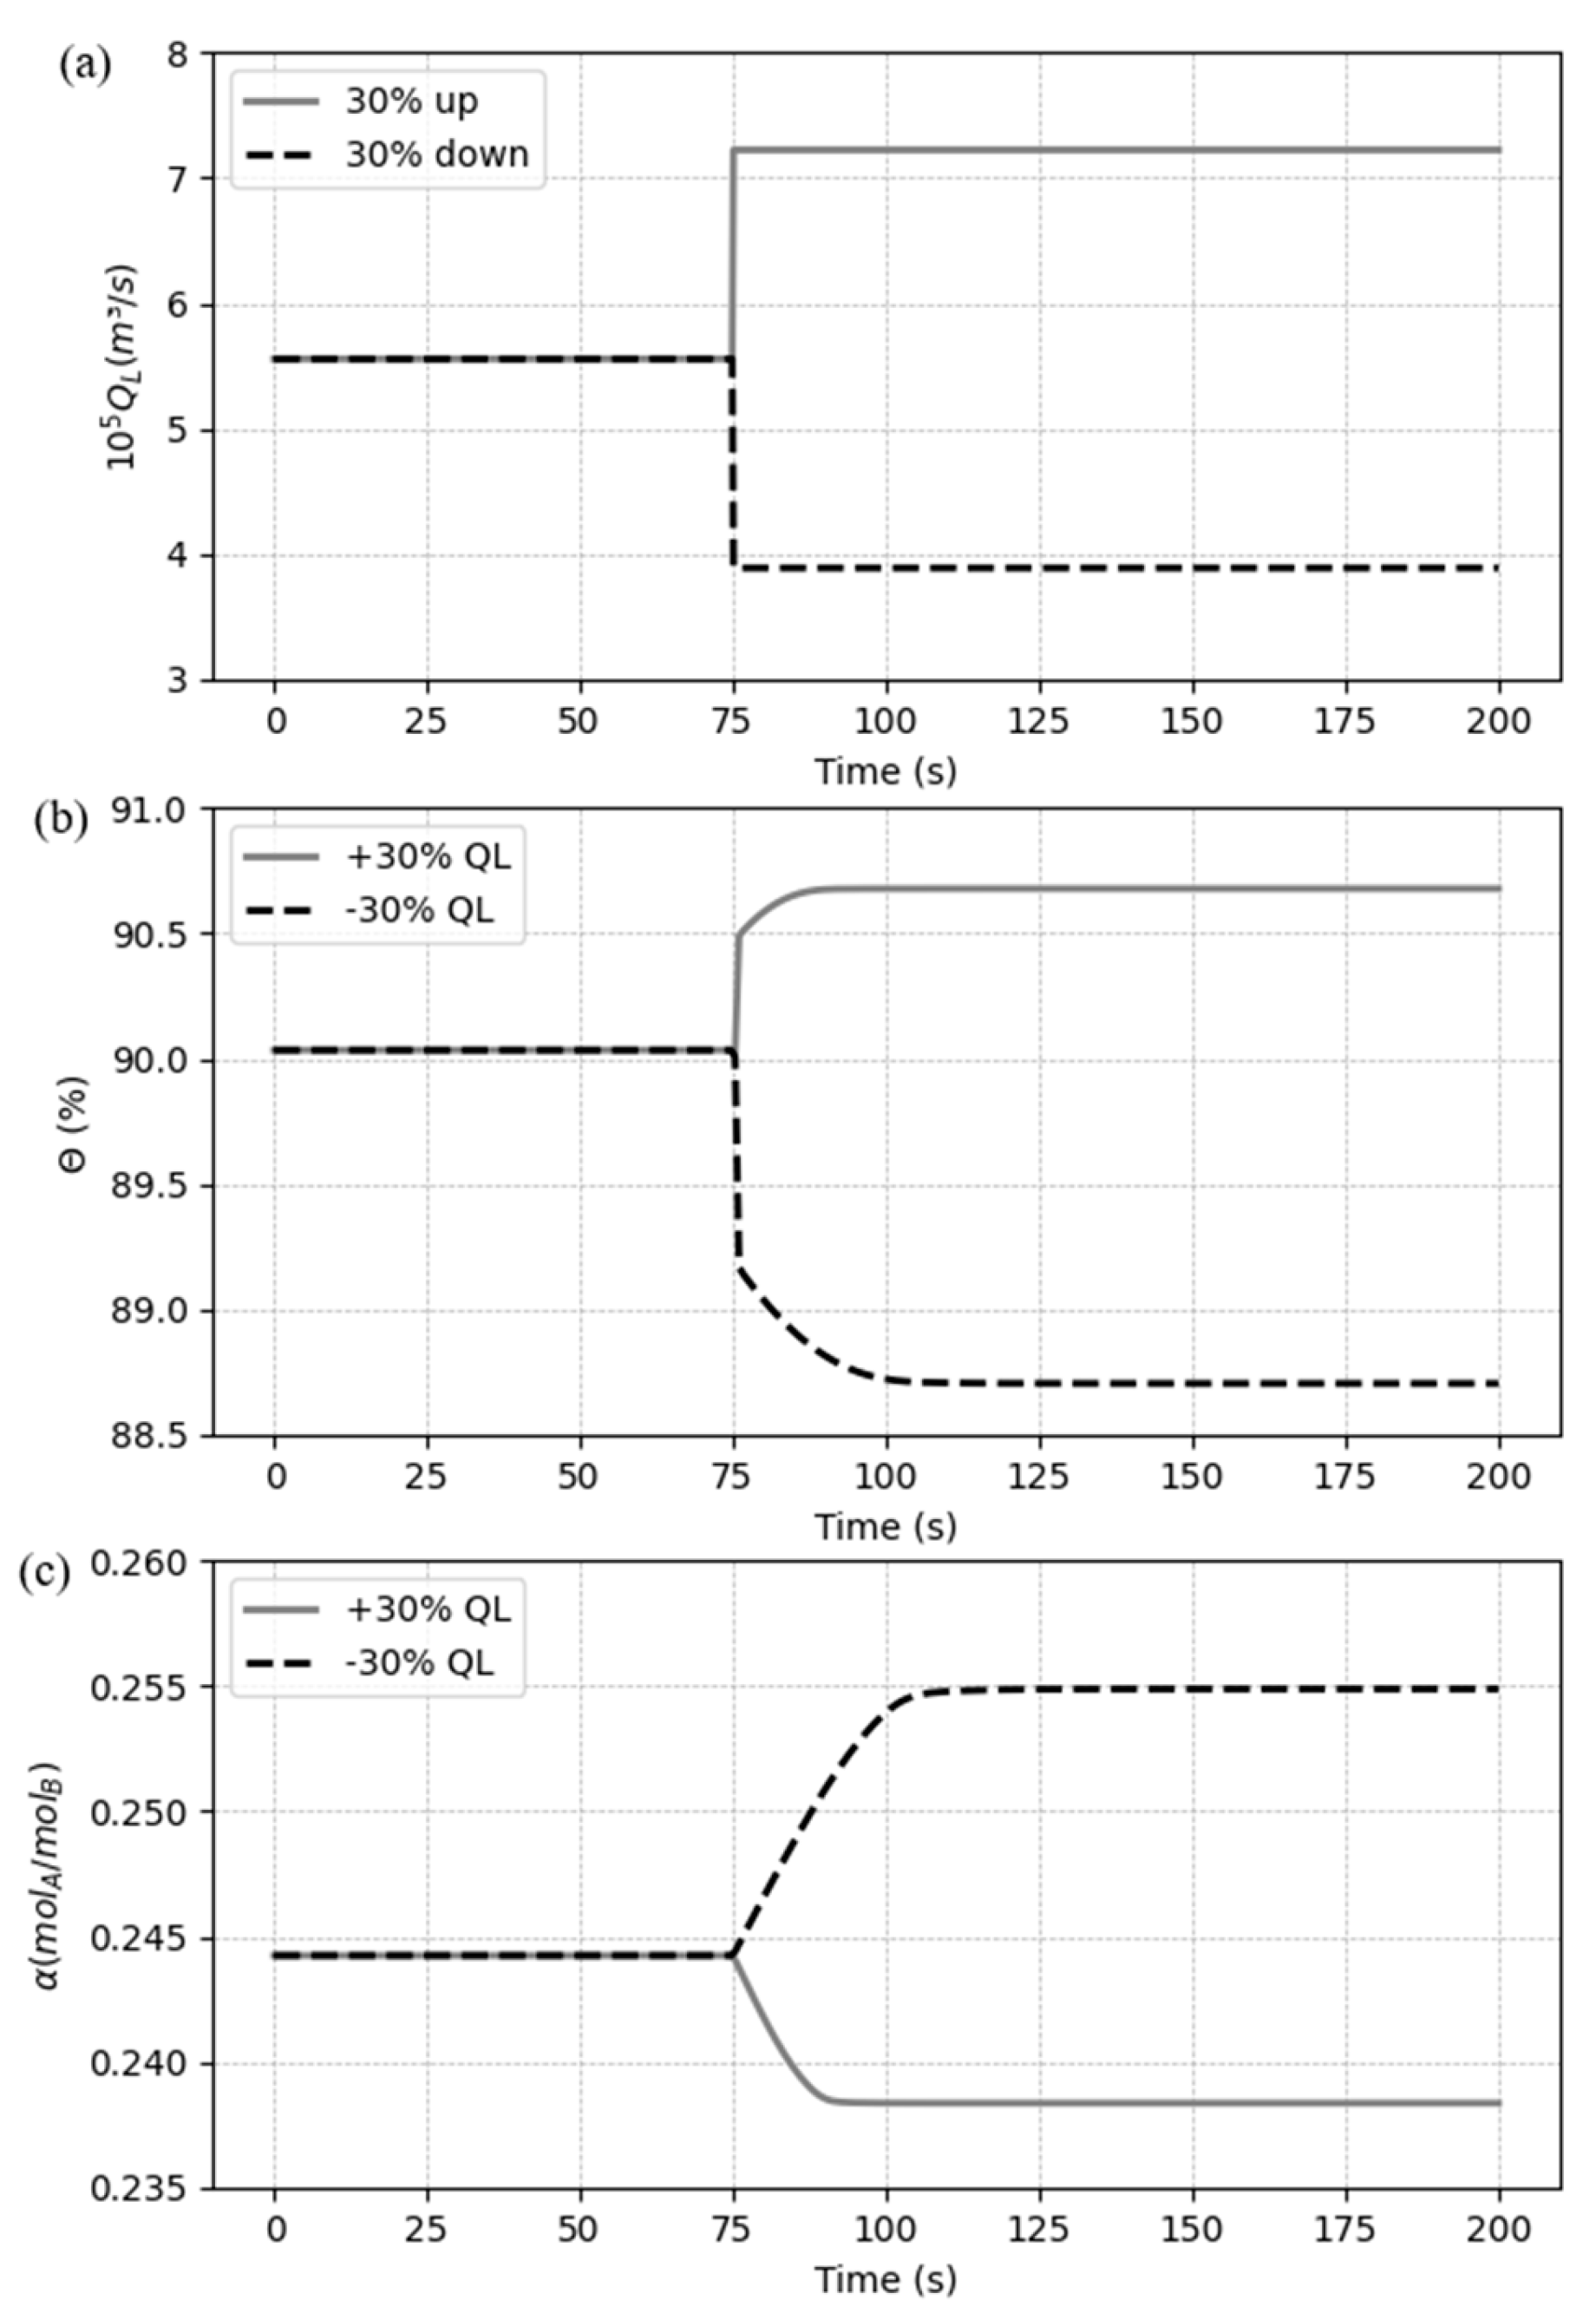
5.3.1. Case 1: Disturbances in the liquid flow rate
In the Case 1, a disturbance of a ± 30% step liquid flow rate, referred to the value in
Table 7, weas performed and the dynamic responses analyzed. The dynamic test results for these changes are shown in
Figure 10(b) and (c).
From
Figure 9, we can see that, when the liquid flow rate (
) increases +30%, the CO
2 capture ratio also grows instantaneously before a smooth curve, while the CO
2 loading decreases until get stable. The increment in
is due to solvent (MEA) addition and consequently more CO
2 uptake available and a larger amount of MEA in the solvent makes the rich loading get smaller. When the liquid flow rate is reduced by 30 percent, a similar trend is observed in opposite direction, but in a higher proportion compared to the first change. It can be concluded that the decrease in solvent flow affects the system more significantly than the increase, from the same condition.
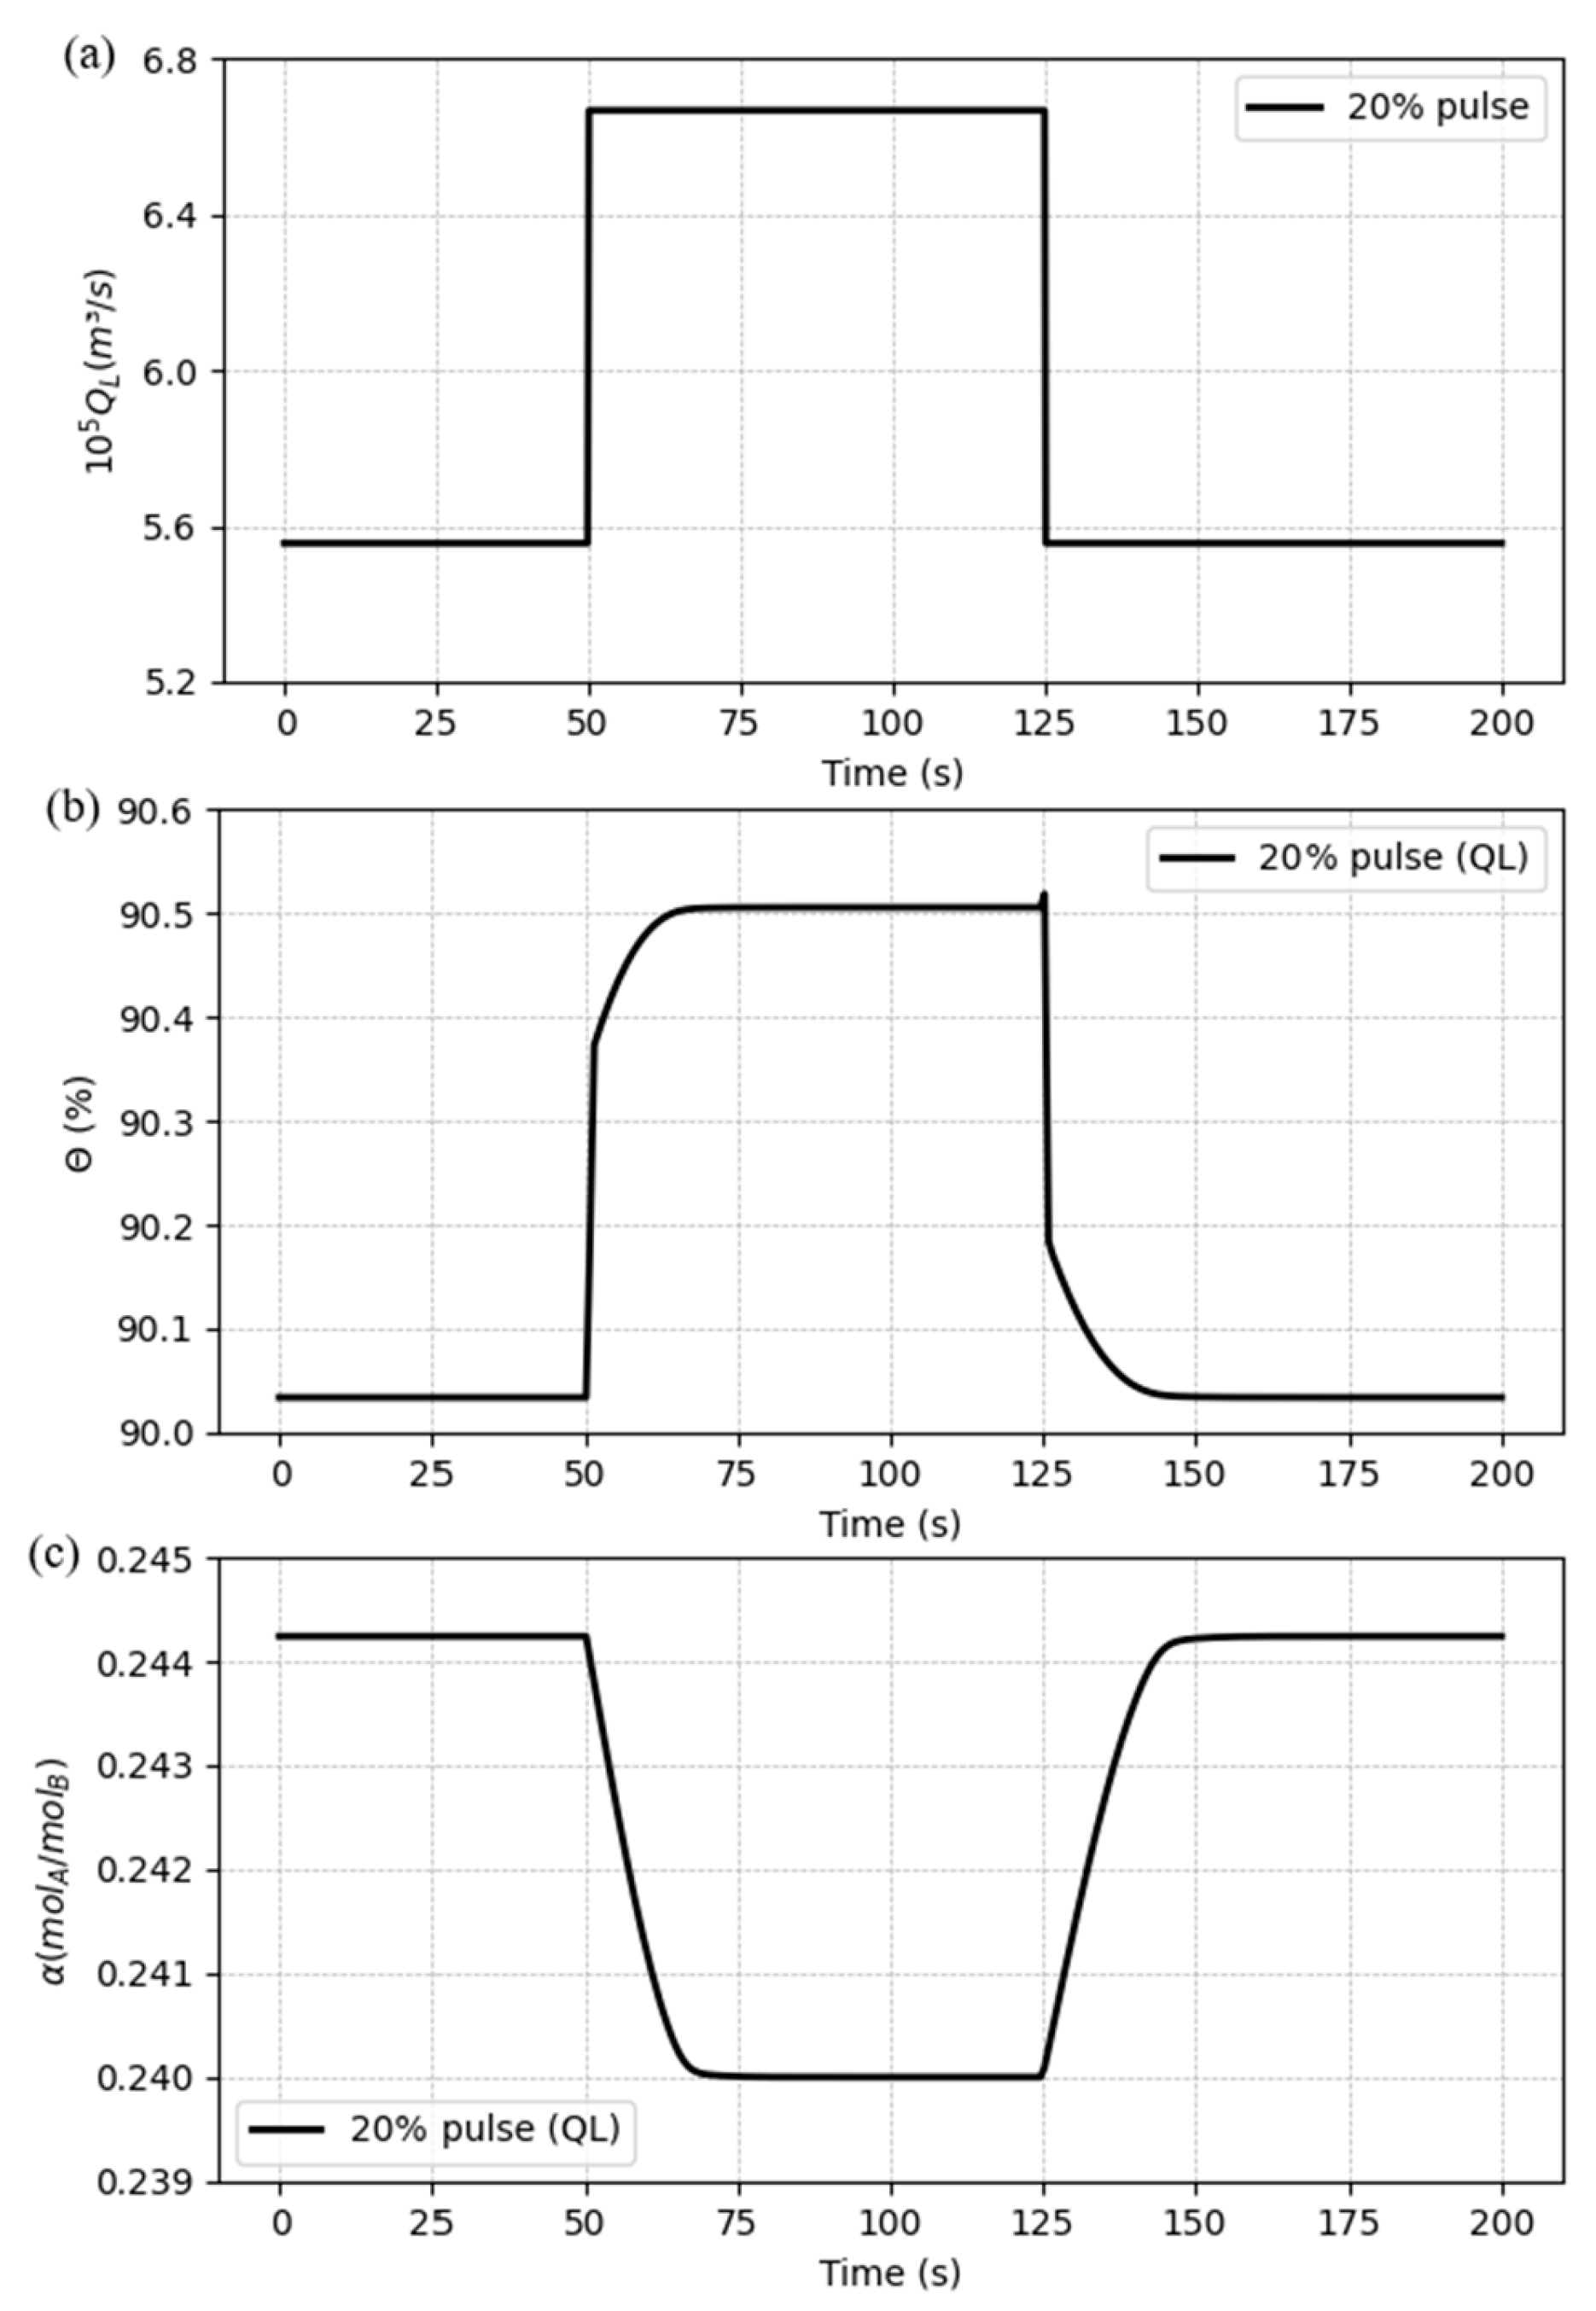
To verify how
QL would present a transient change in the amplitude of a signal from a baseline value to a higher or lower value, followed by a rapid return to the baseline value, a pulse signal was implemented. The pulse signal has been set with a period of 75 seconds and an amplitude of 20% of the initial value. The pulse and responses they are shown in
Figure 11.
According to
Figure 11, the model shows stable as the variables reach a stationary point and come back to the previous steady-state after the pulse. The behavior of the curves follows the expected pattern seen in the step changes for both variables.
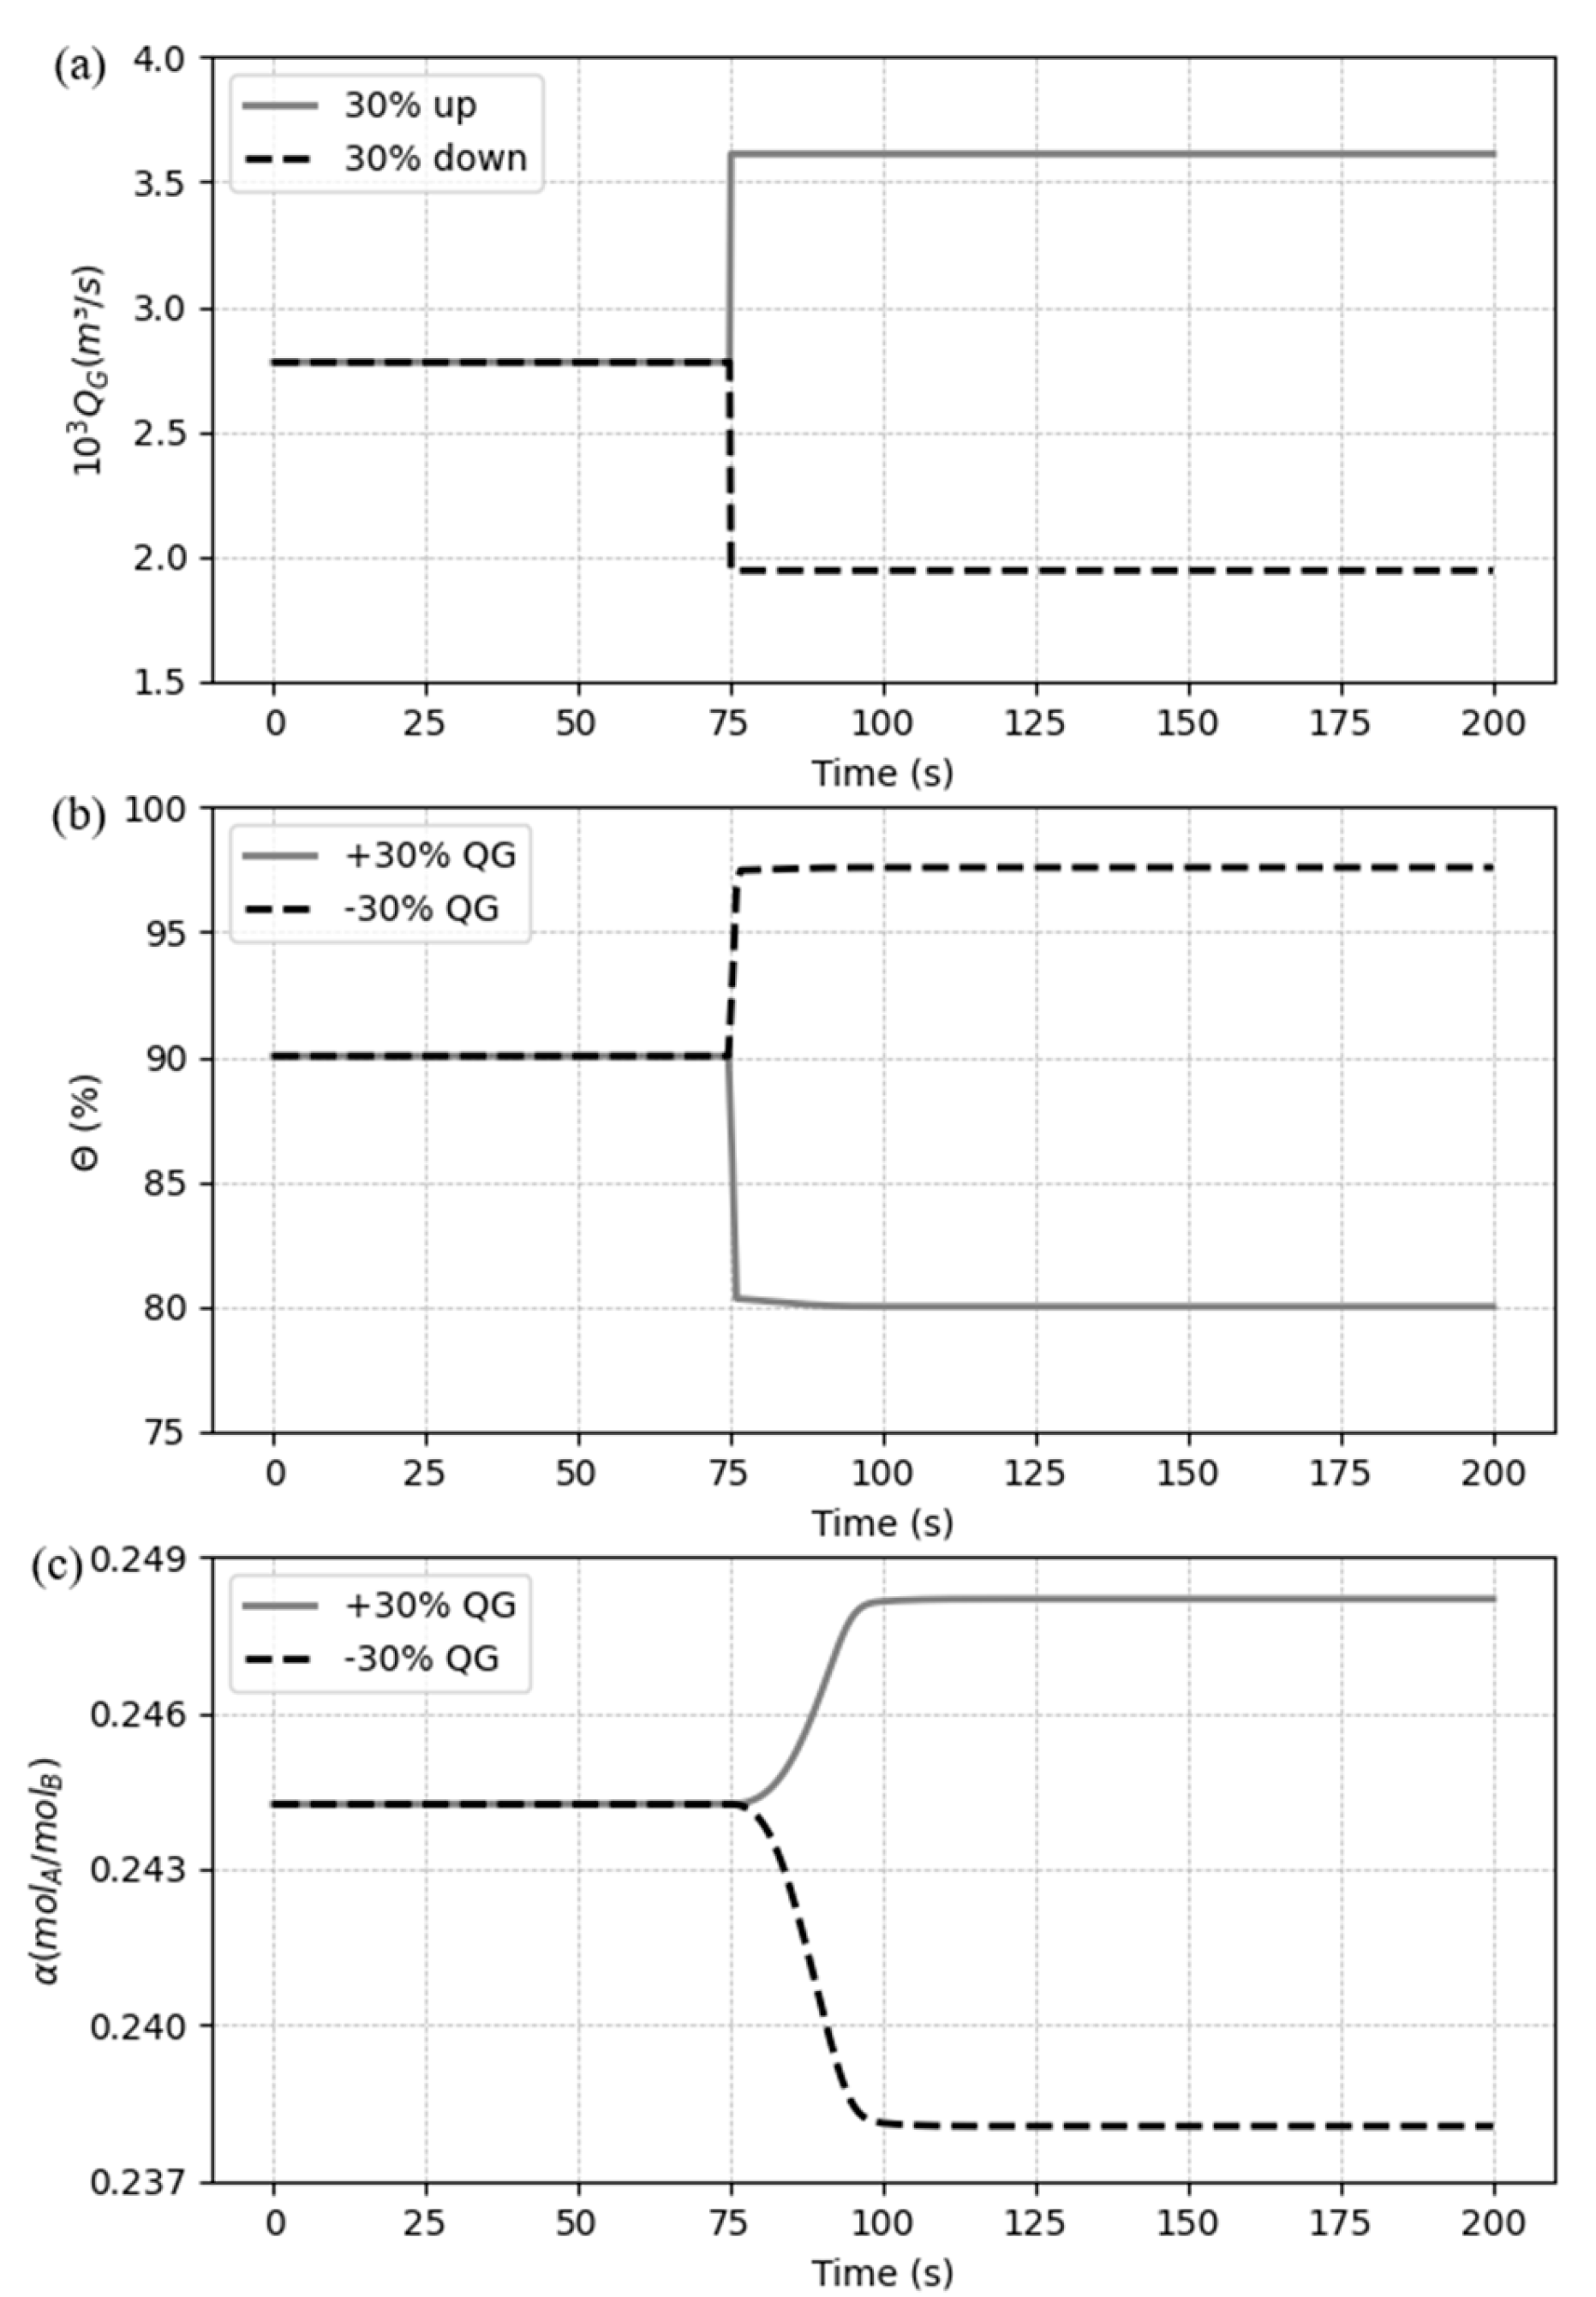
5.3.2. Case 2: Disturbances in the gas flow rate
Similarly, to the previous case, a step response (± 30%) for the flue gas flow rate is designed and the dynamic behavior of the system is analyzed. The dynamic performances responses for Case 2 are shown in
Figure 12.
As shown in
Figure 12, CO
2 capture ratio has a quicker response compared to the CO
2 loading, and after a sharp curve, it reaches the steady state. Nevertheless, the loading only starts to change significantly right after that sharp change in capture ratio and follows smoothly to the stationary point. As the step change is applied to the gas stream and the CO
2 capture ratio is computed concentration in the gas phase, it is expected that this variable suffers the variation firstly, but only gets stable when the liquid phase reaches the permanent state.
Figure 12(b) shows that, when increasing the gas flow rate, the capture ratio suffers a negative variation, and I can be explained because of the amount of gas, and consequently the amount of CO
2, rises in the system, which one has the same quantity of solvent to treat the new gas stream, reducing the capacity of the system to capture the solute. The reverse occurs when the rate is decreased, and the capture ration grows. For the CO
2, it rises as soon as more CO
2 enters the system and decrease when the gas is reduced. This behavior occurs because, although the capacity of the system to capture the same proportion of CO
2 as before is affected, the increment in the gas rate allows a greater amount of solute migrating to the liquid, and a decrement do the reverse trend. It also can be observed that, different from the case 1, the variation in the gas flow rate affects the variables in distinct proportions: when increasing, the capture ration is more affected than the loading, and the reverse happens when the input is decreased.
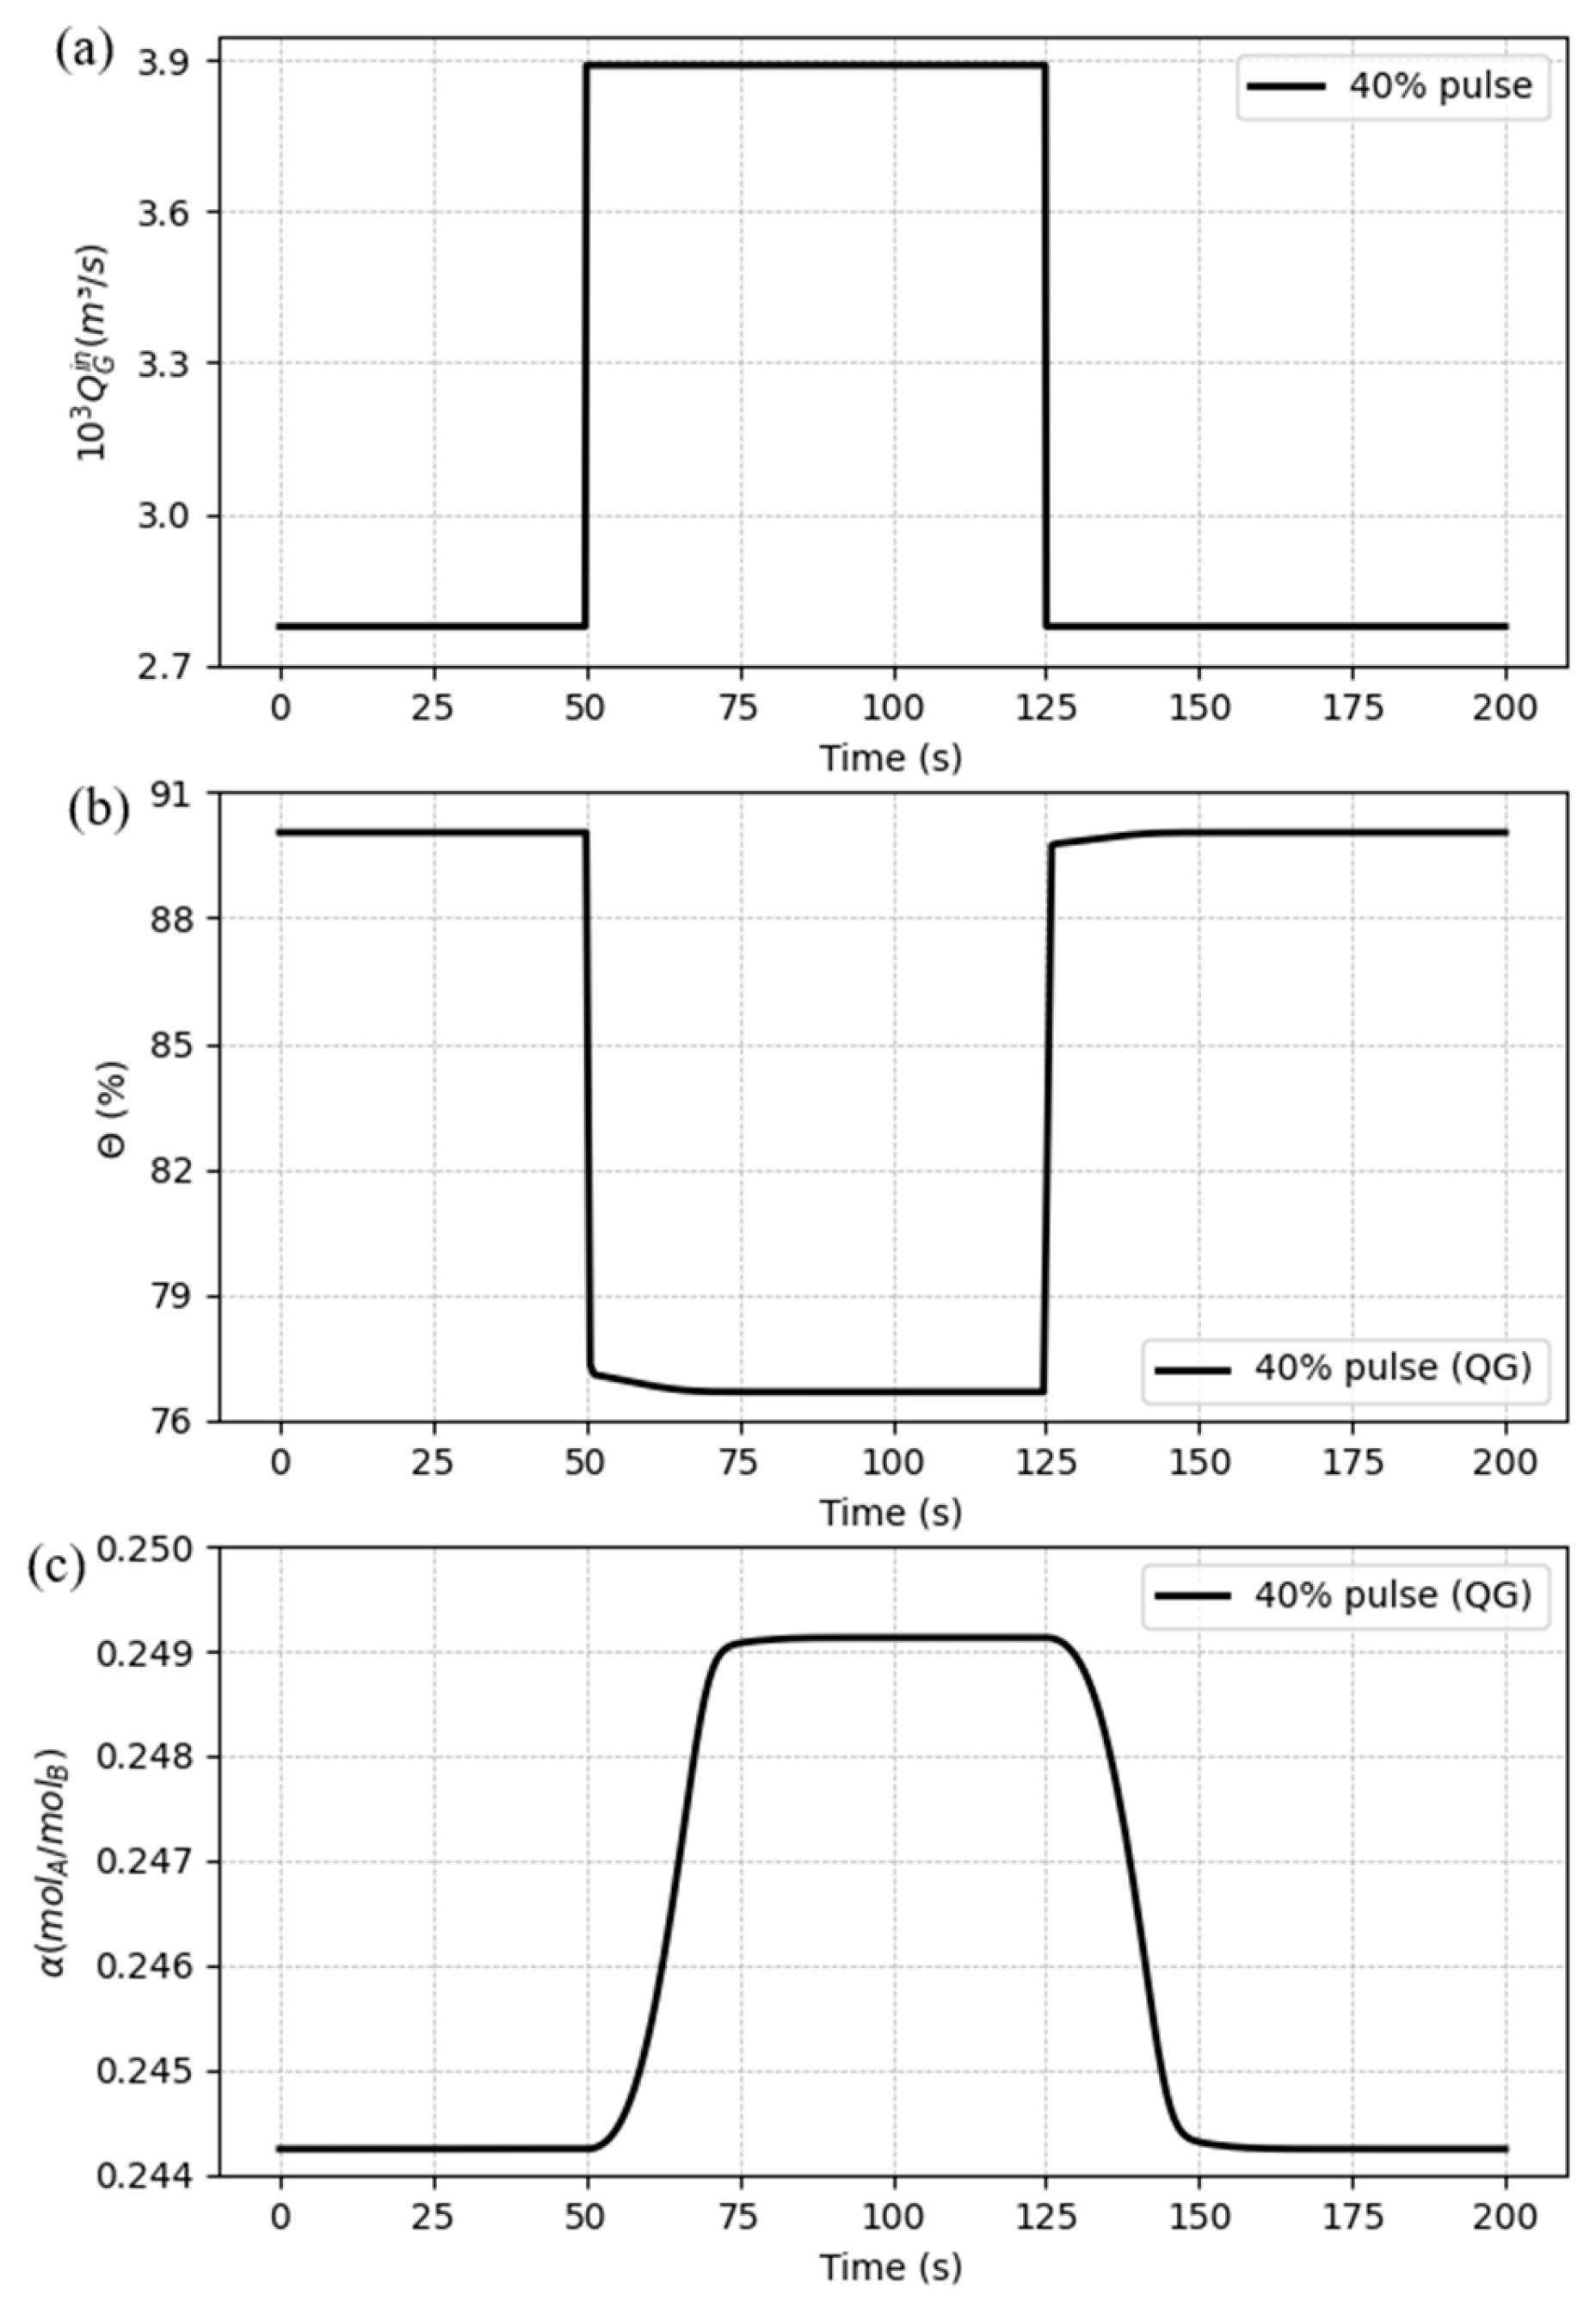
Also, a pulse signal was set for this case, considering an amplitude of 40% and a period time of 75 seconds, starting at the instant of 50 seconds. The pulse profile and the responses on the process variables are shown in
Figure 13(a), (b) and (c).
The results patterns follow the behavior from the step changes, where the capture ratio has a sharper change (
Figure 13(b)), if compared to the loading (
Figure 13 (c)), who has a smooth change against the disturbances, despite that the first one takes a greater time to get stabilized. The model showed to be stable against the variation of the gas flow rate.
5.3.3. Case 3: Disturbances in the inlet CO2 composition
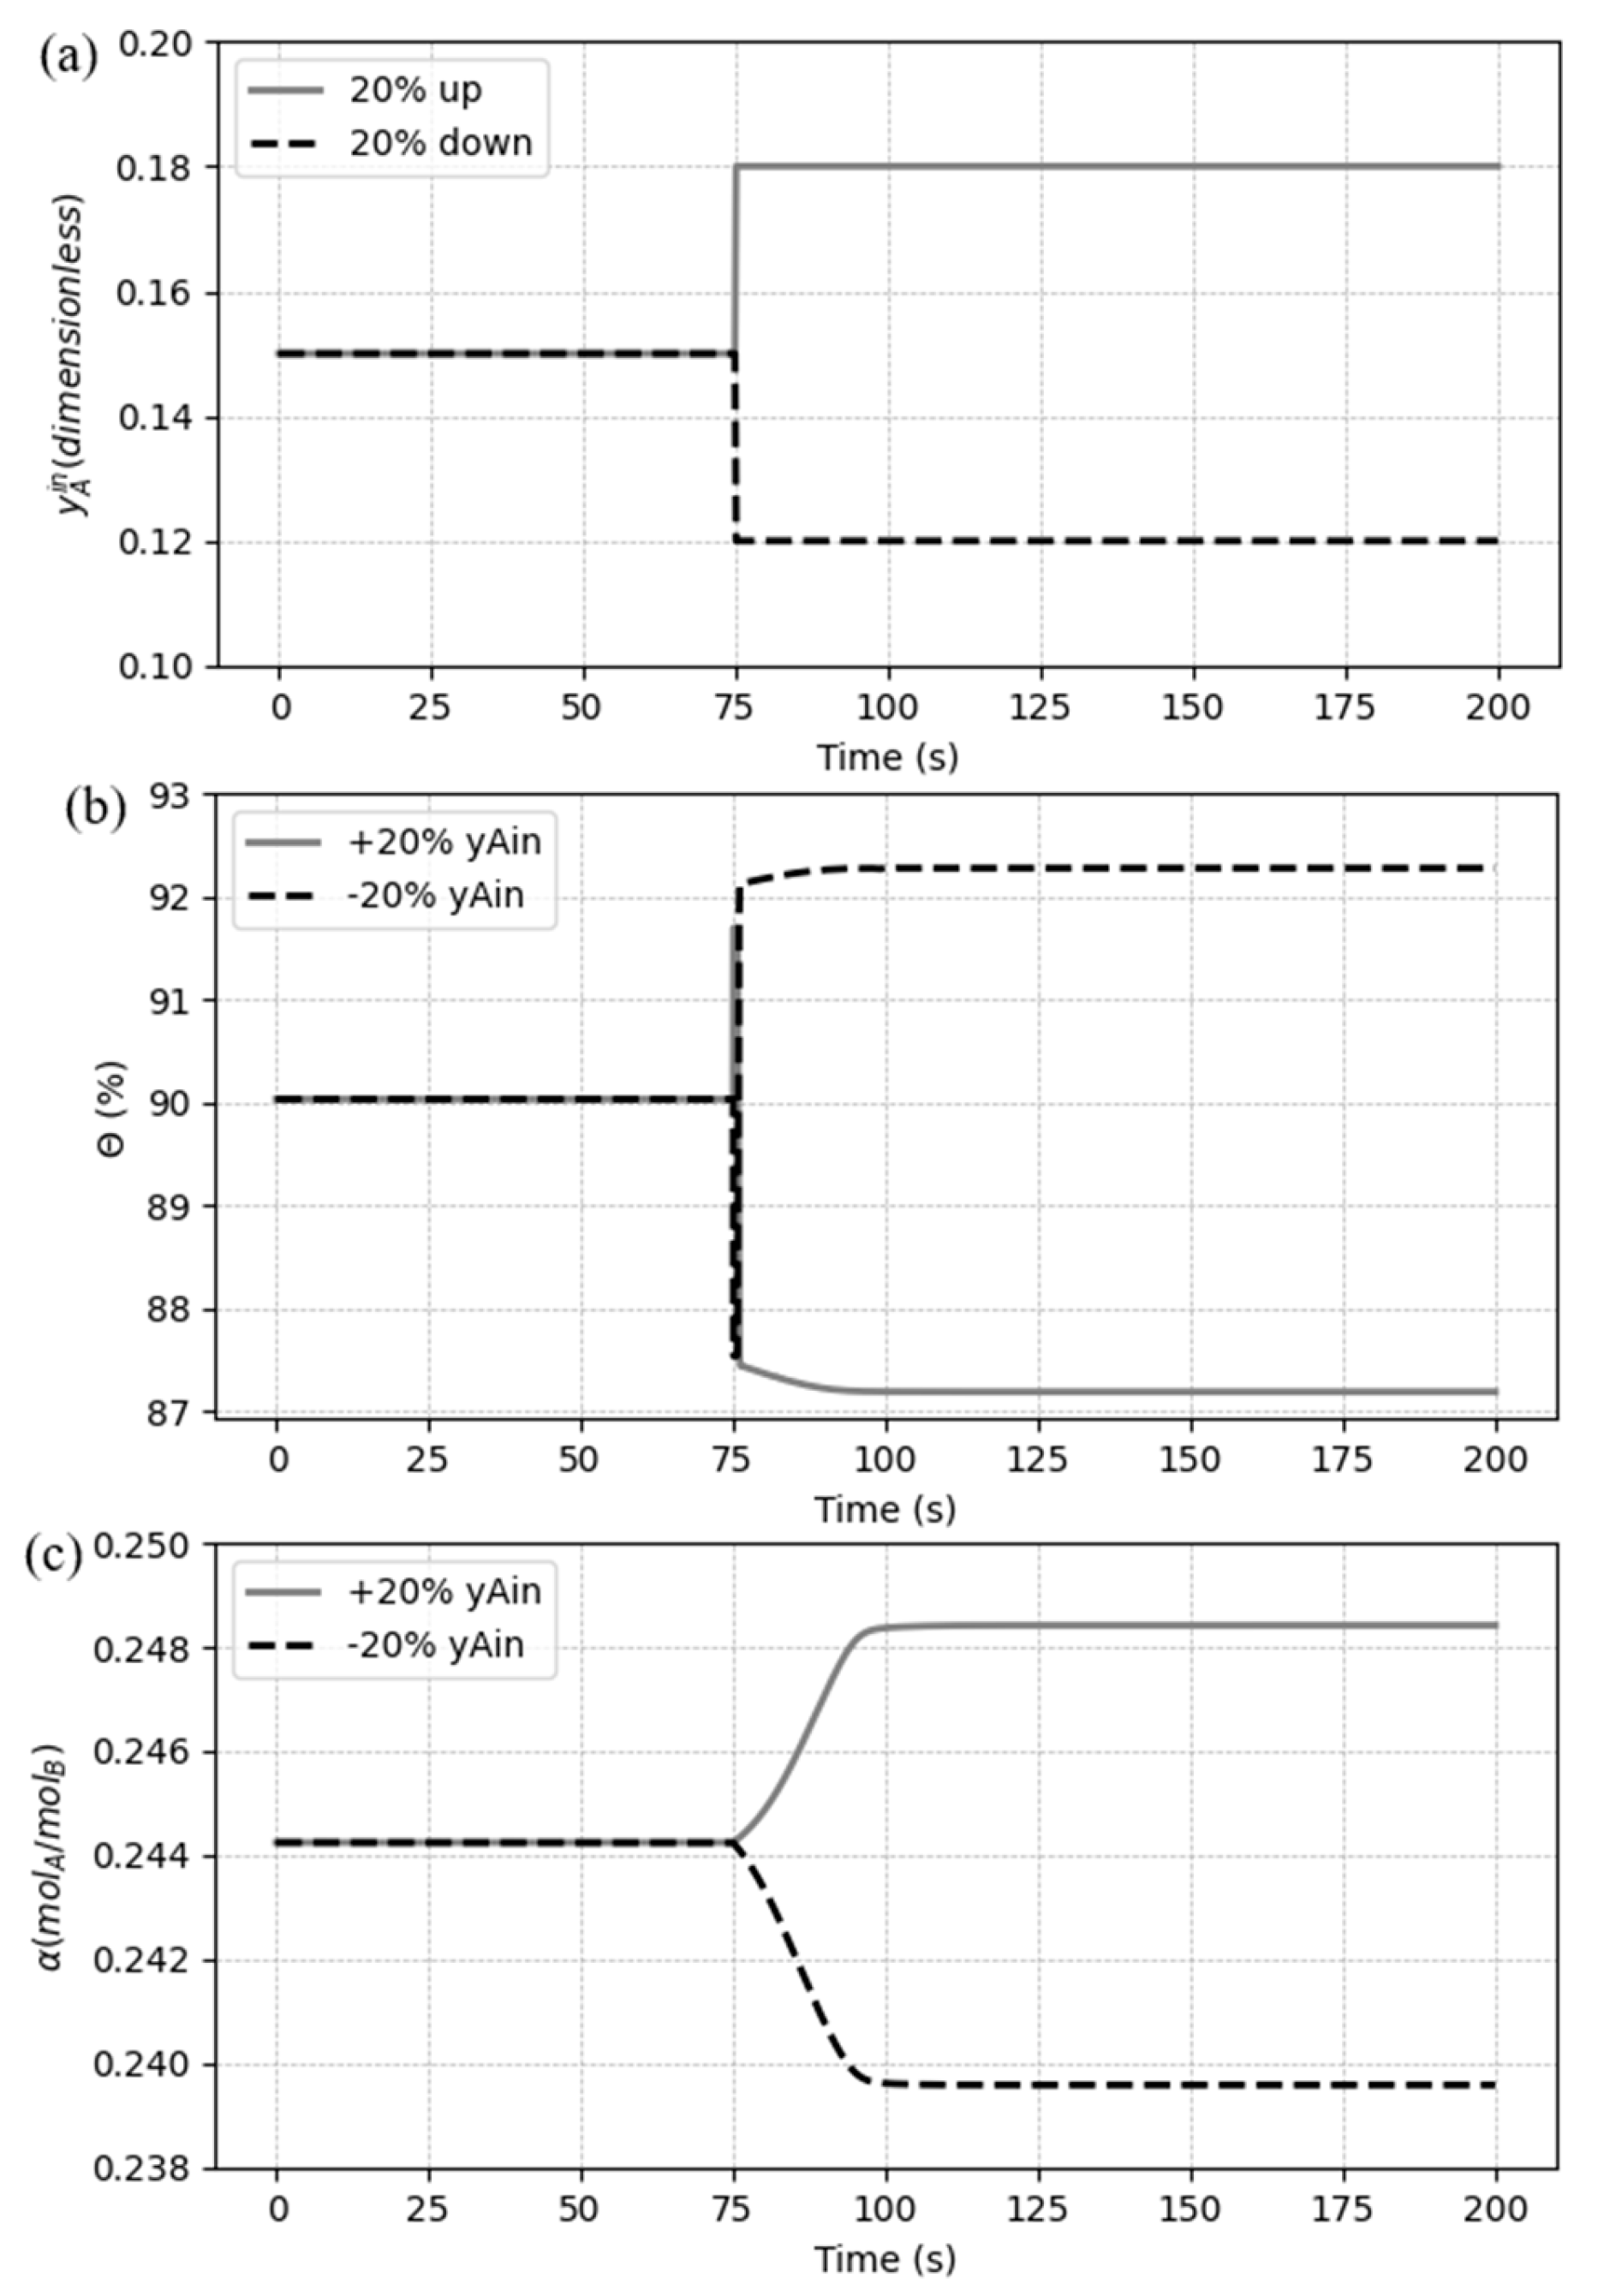
The third case simulates a disturbance on the molar composition of CO2 on the flue gas (
). A step change of +20% of the initial value is compared with a -20% step change, as shown in
Figure 14(a). The dynamic responses for
and
can be observed in
Figure 14(b) and (c), respectively.
The CO
2 loading response has a well-defined response to both changes, getting stable after a smooth change, increasing with the more amount of solute in the system and decreasing with the less (
Figure 14(c)). On the other hand, disturbing
makes the CO
2 capture ratio suffers an immediately change (Eq. 12), and then keeps variating with the outlet composition of the solute (
). This behavior is confirmed in
Figure 14(b) for both disturbances (± 20%), where
also presents an inverse response characteristic, initially responding in the opposite direction from the final response.
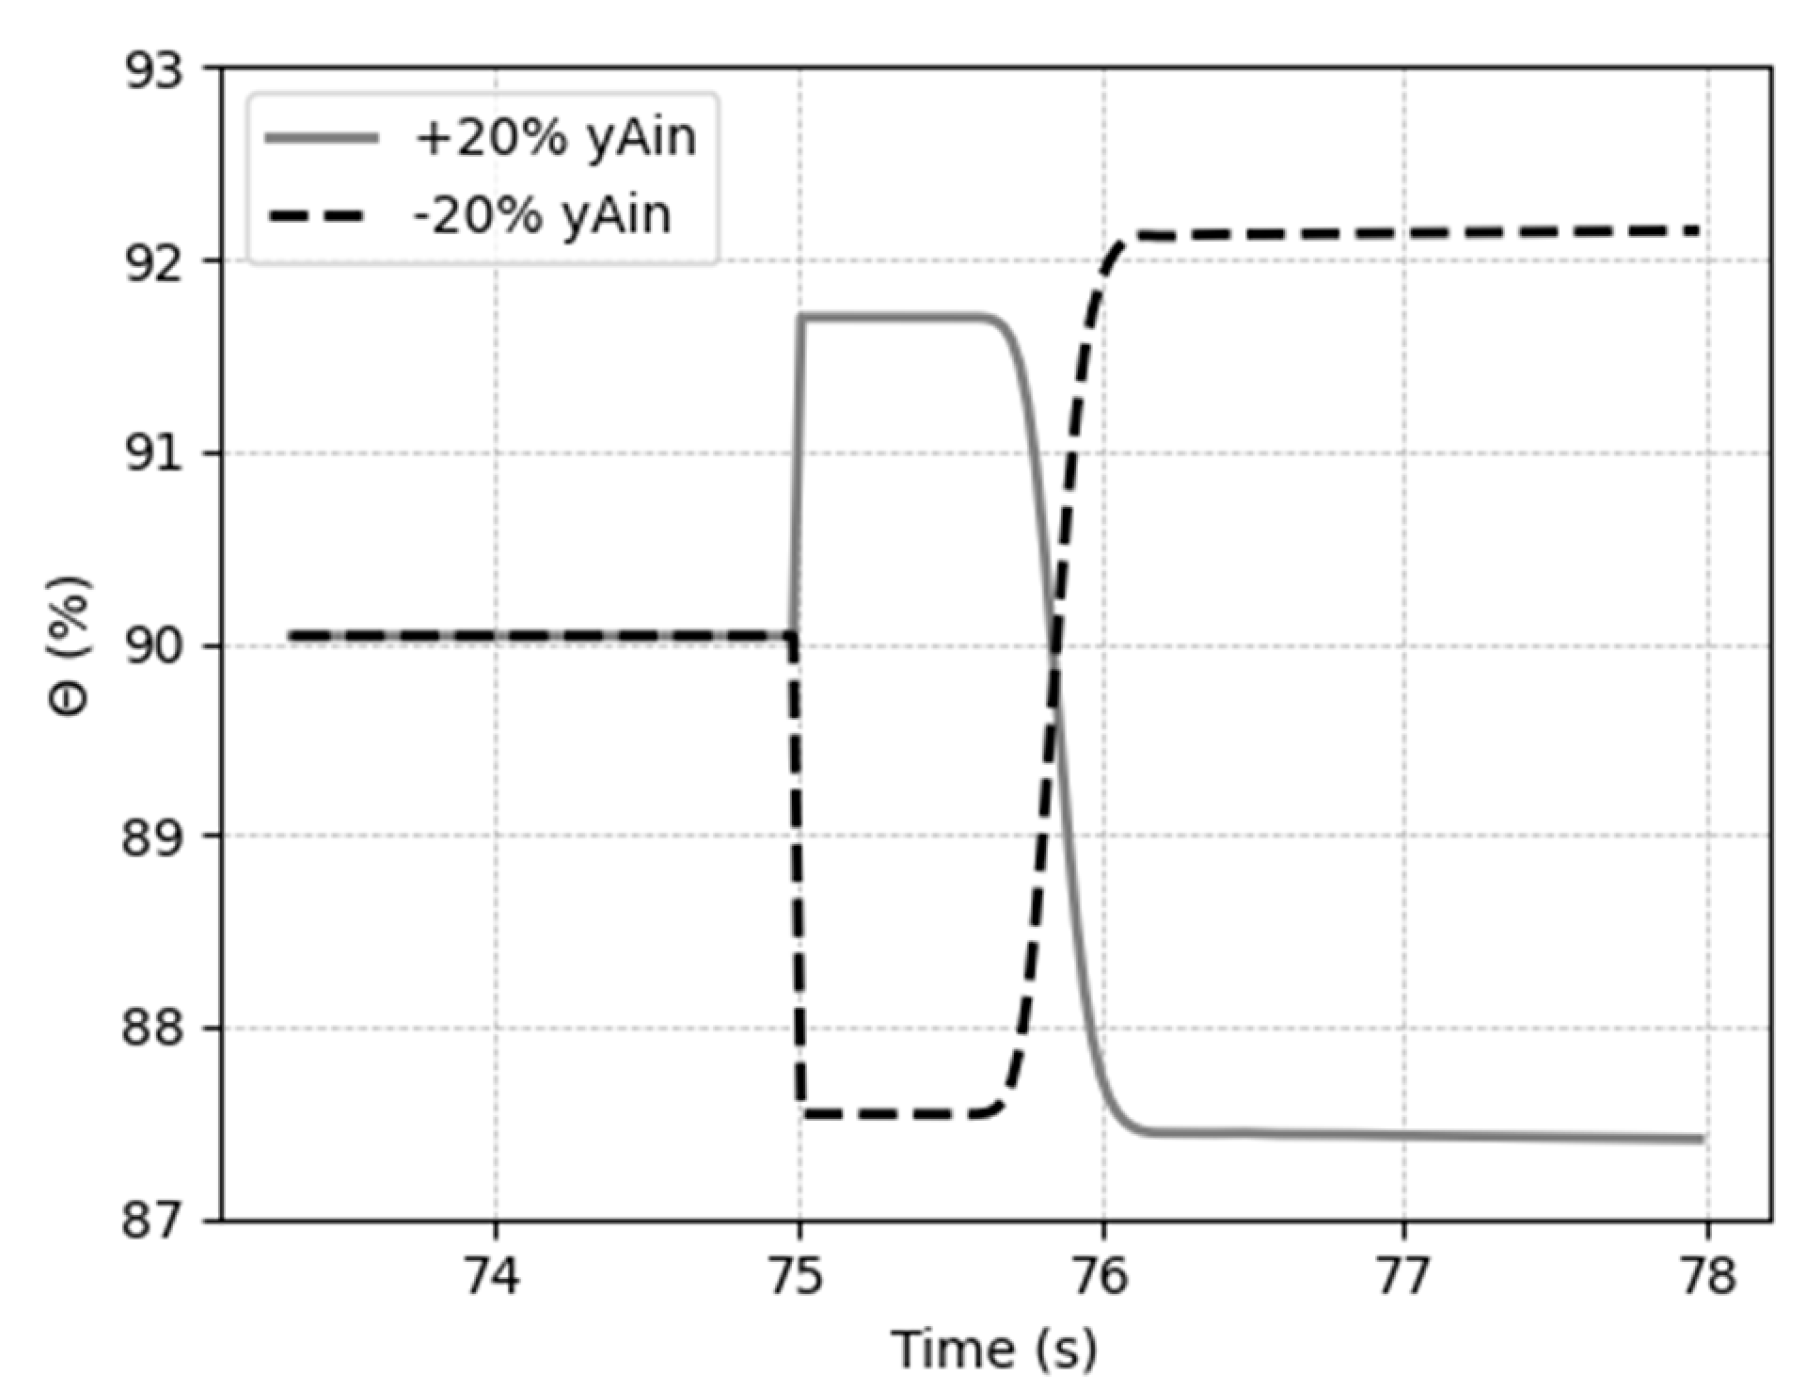
Figure 15 shows what happens at the instant of the disturbance occurs.
The generated overshoot can be visualized in
Figure 15, and an explanation for this behavior is the fact that changes in the composition of gas affects the concentration gradient, making a fast change in the molar flux of solute in the same direction of the step change; however, the solvent quantity to arrest the amount CO
2 does not change, leading the system to a new and opposite steady state. After reach the real direction, the capture ration keeps varying in a smoothly way until the liquid phase get stable.
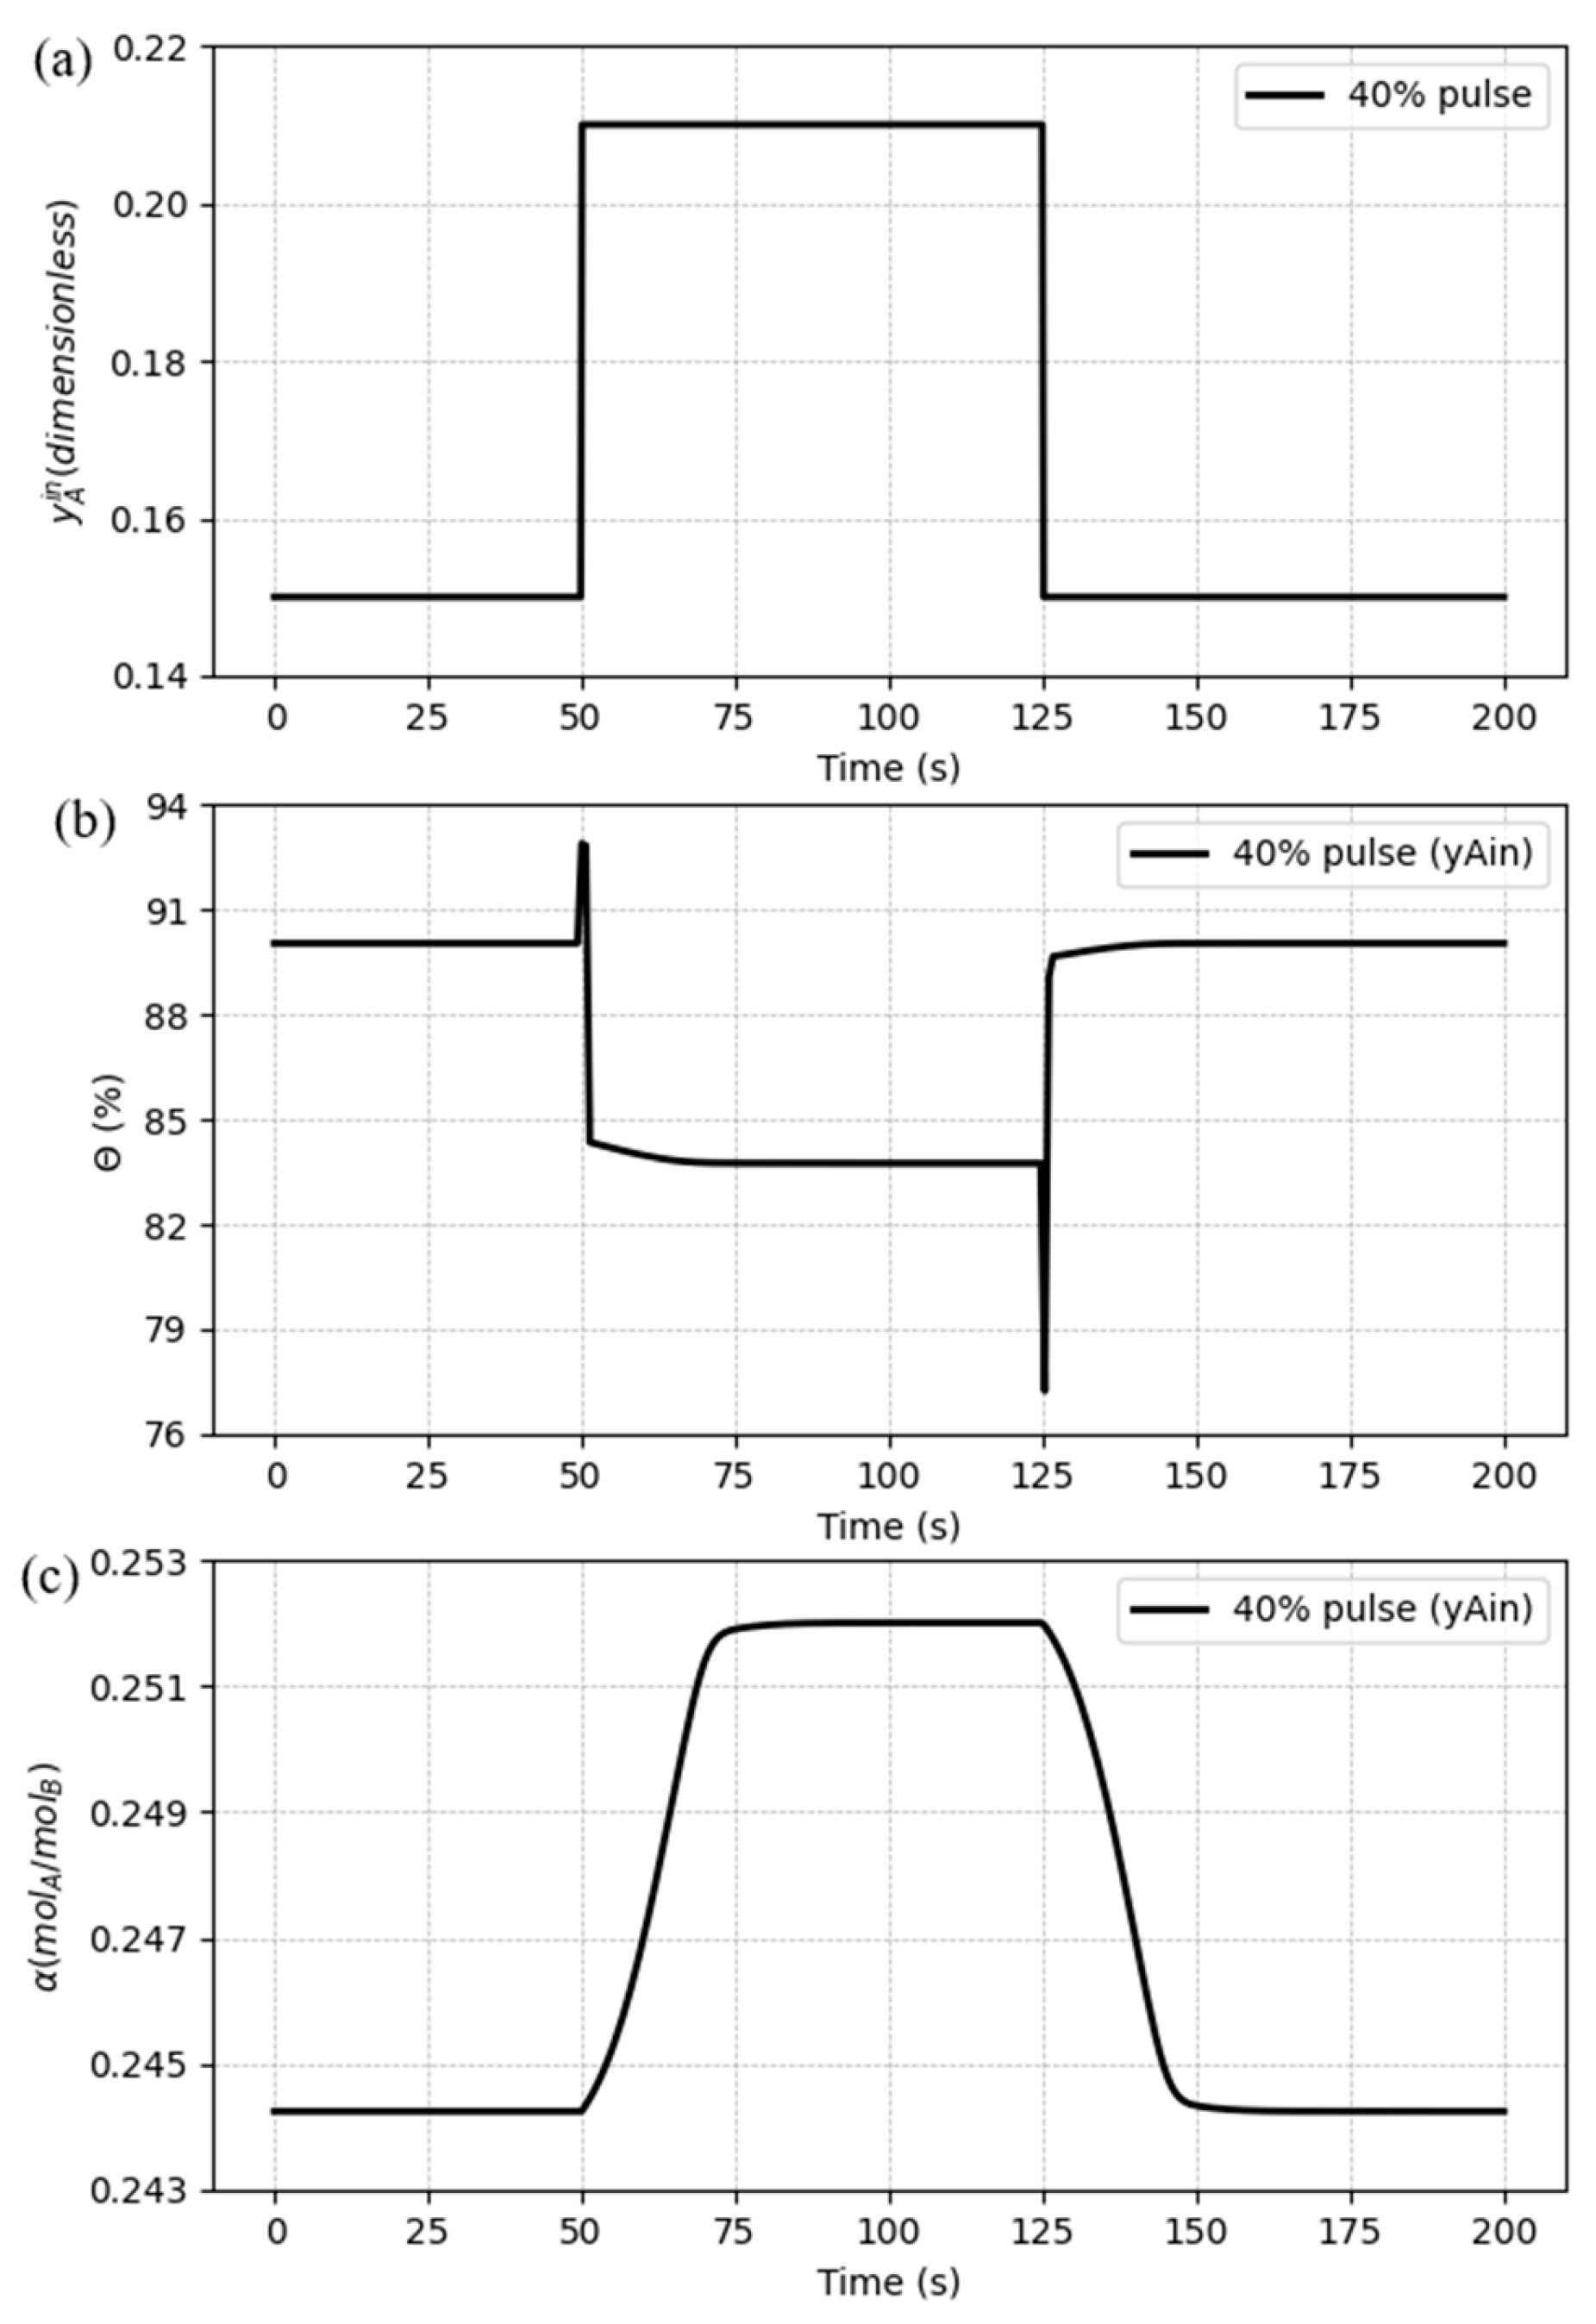
A pulse disturbance was also designed for the CO
2 inlet composition in the gas, having an amplitude of 40% from the previous value and a period of 75 seconds, as shown in
Figure 16(a). The CO
2 capture ratio behavior against the pulse disturbance follows a similar trend from the step changes, including the inverse response, which has a bigger overshoot when the input variable decreases to the previous value, compared to the beginning of the pulse signal. It can be seen in
Figure 16(b) that after the pulse period, it stabilizes at the same value form the beginning.
Figure 16(c) shows that α also reaches back to the initial state after the pulse, showing the expected pattern.
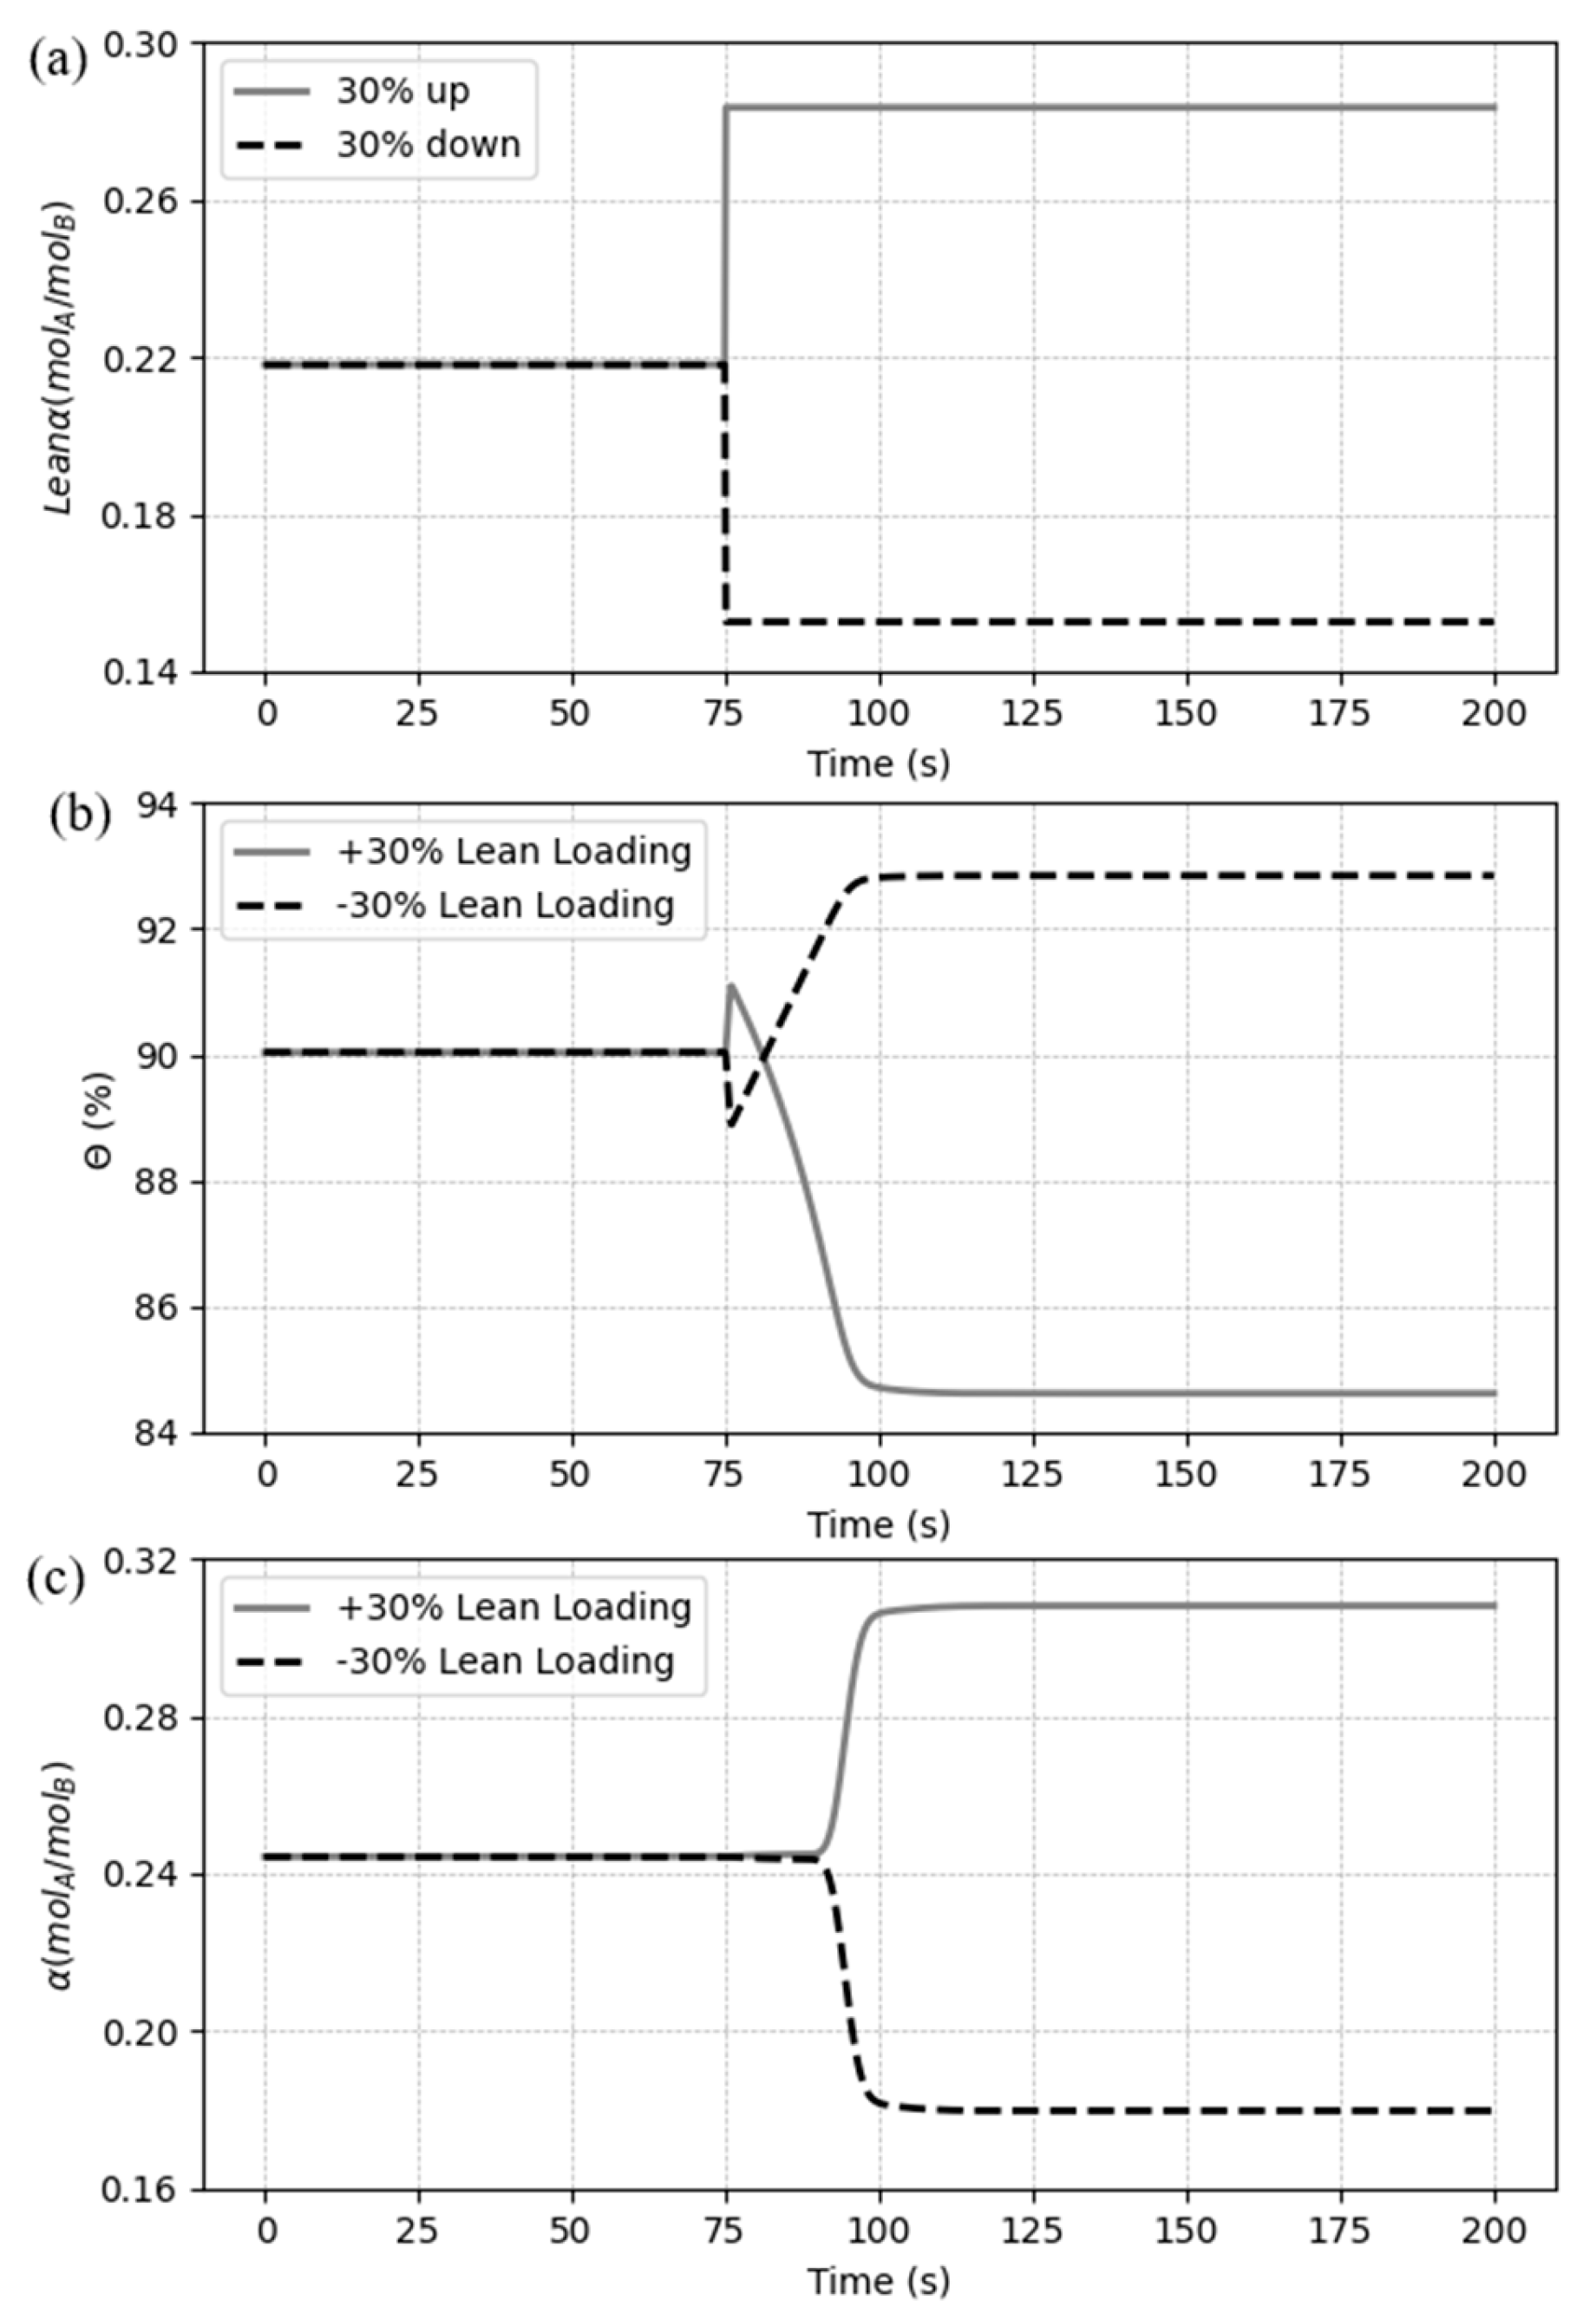
5.3.4. Case 4: Disturbances in the CO2 lean loading
The last case makes a variation in CO
2 loading at the inlet side of the HFMC. As in the previous cases, a set of step changes was defined with a ± 30% variation in relation to the base case.
Figure 17 demonstrates the disturbance and shows the dynamic responses of the CO
2 capture ratio and CO
2 rich loading.
An inverse response in the capture ratio can also be seen by varying the lean loading of CO
2 in
Figure 17(b). A change in the inlet loading of CO
2 in the liquid means a change in the concentration of free MEA in the solution. As the free MEA concentration is reduced, by increasing the lean loading of CO
2, the system is less influenced by the chemical reaction at first, which makes de outlet concentration of CO
2 in the gas also be reduced by the physical absorption, letting the capture ratio rise for a moment. However, the system’s capacity to uptake the solute is reduced by the drop in the amount of MEA, so
decreases to a lower value compared to the base case (the opposite occurs by reducing the input variable).
Figure 17(c) shows a delay in the response of the rich loading, which one follows the same direction of the variation signal. The initial variation in
is minimal because the concentration of CO
2 along the gas phase be still processing the disturbance. Nonetheless, as soon as the gas phase follows to the proper direction, the loading begins quickly chasing the new values. As the amount of CO
2 in the solvent is changed when varying the lean loading, the quantity of solute at the outlet side is also modified, getting greater when increasing the input variable and being reduced when decreasing the same input. Yet, it can be inferred from the results that the decrease of the lean loading affects the process in a greater proportion, if compared to the increase change.
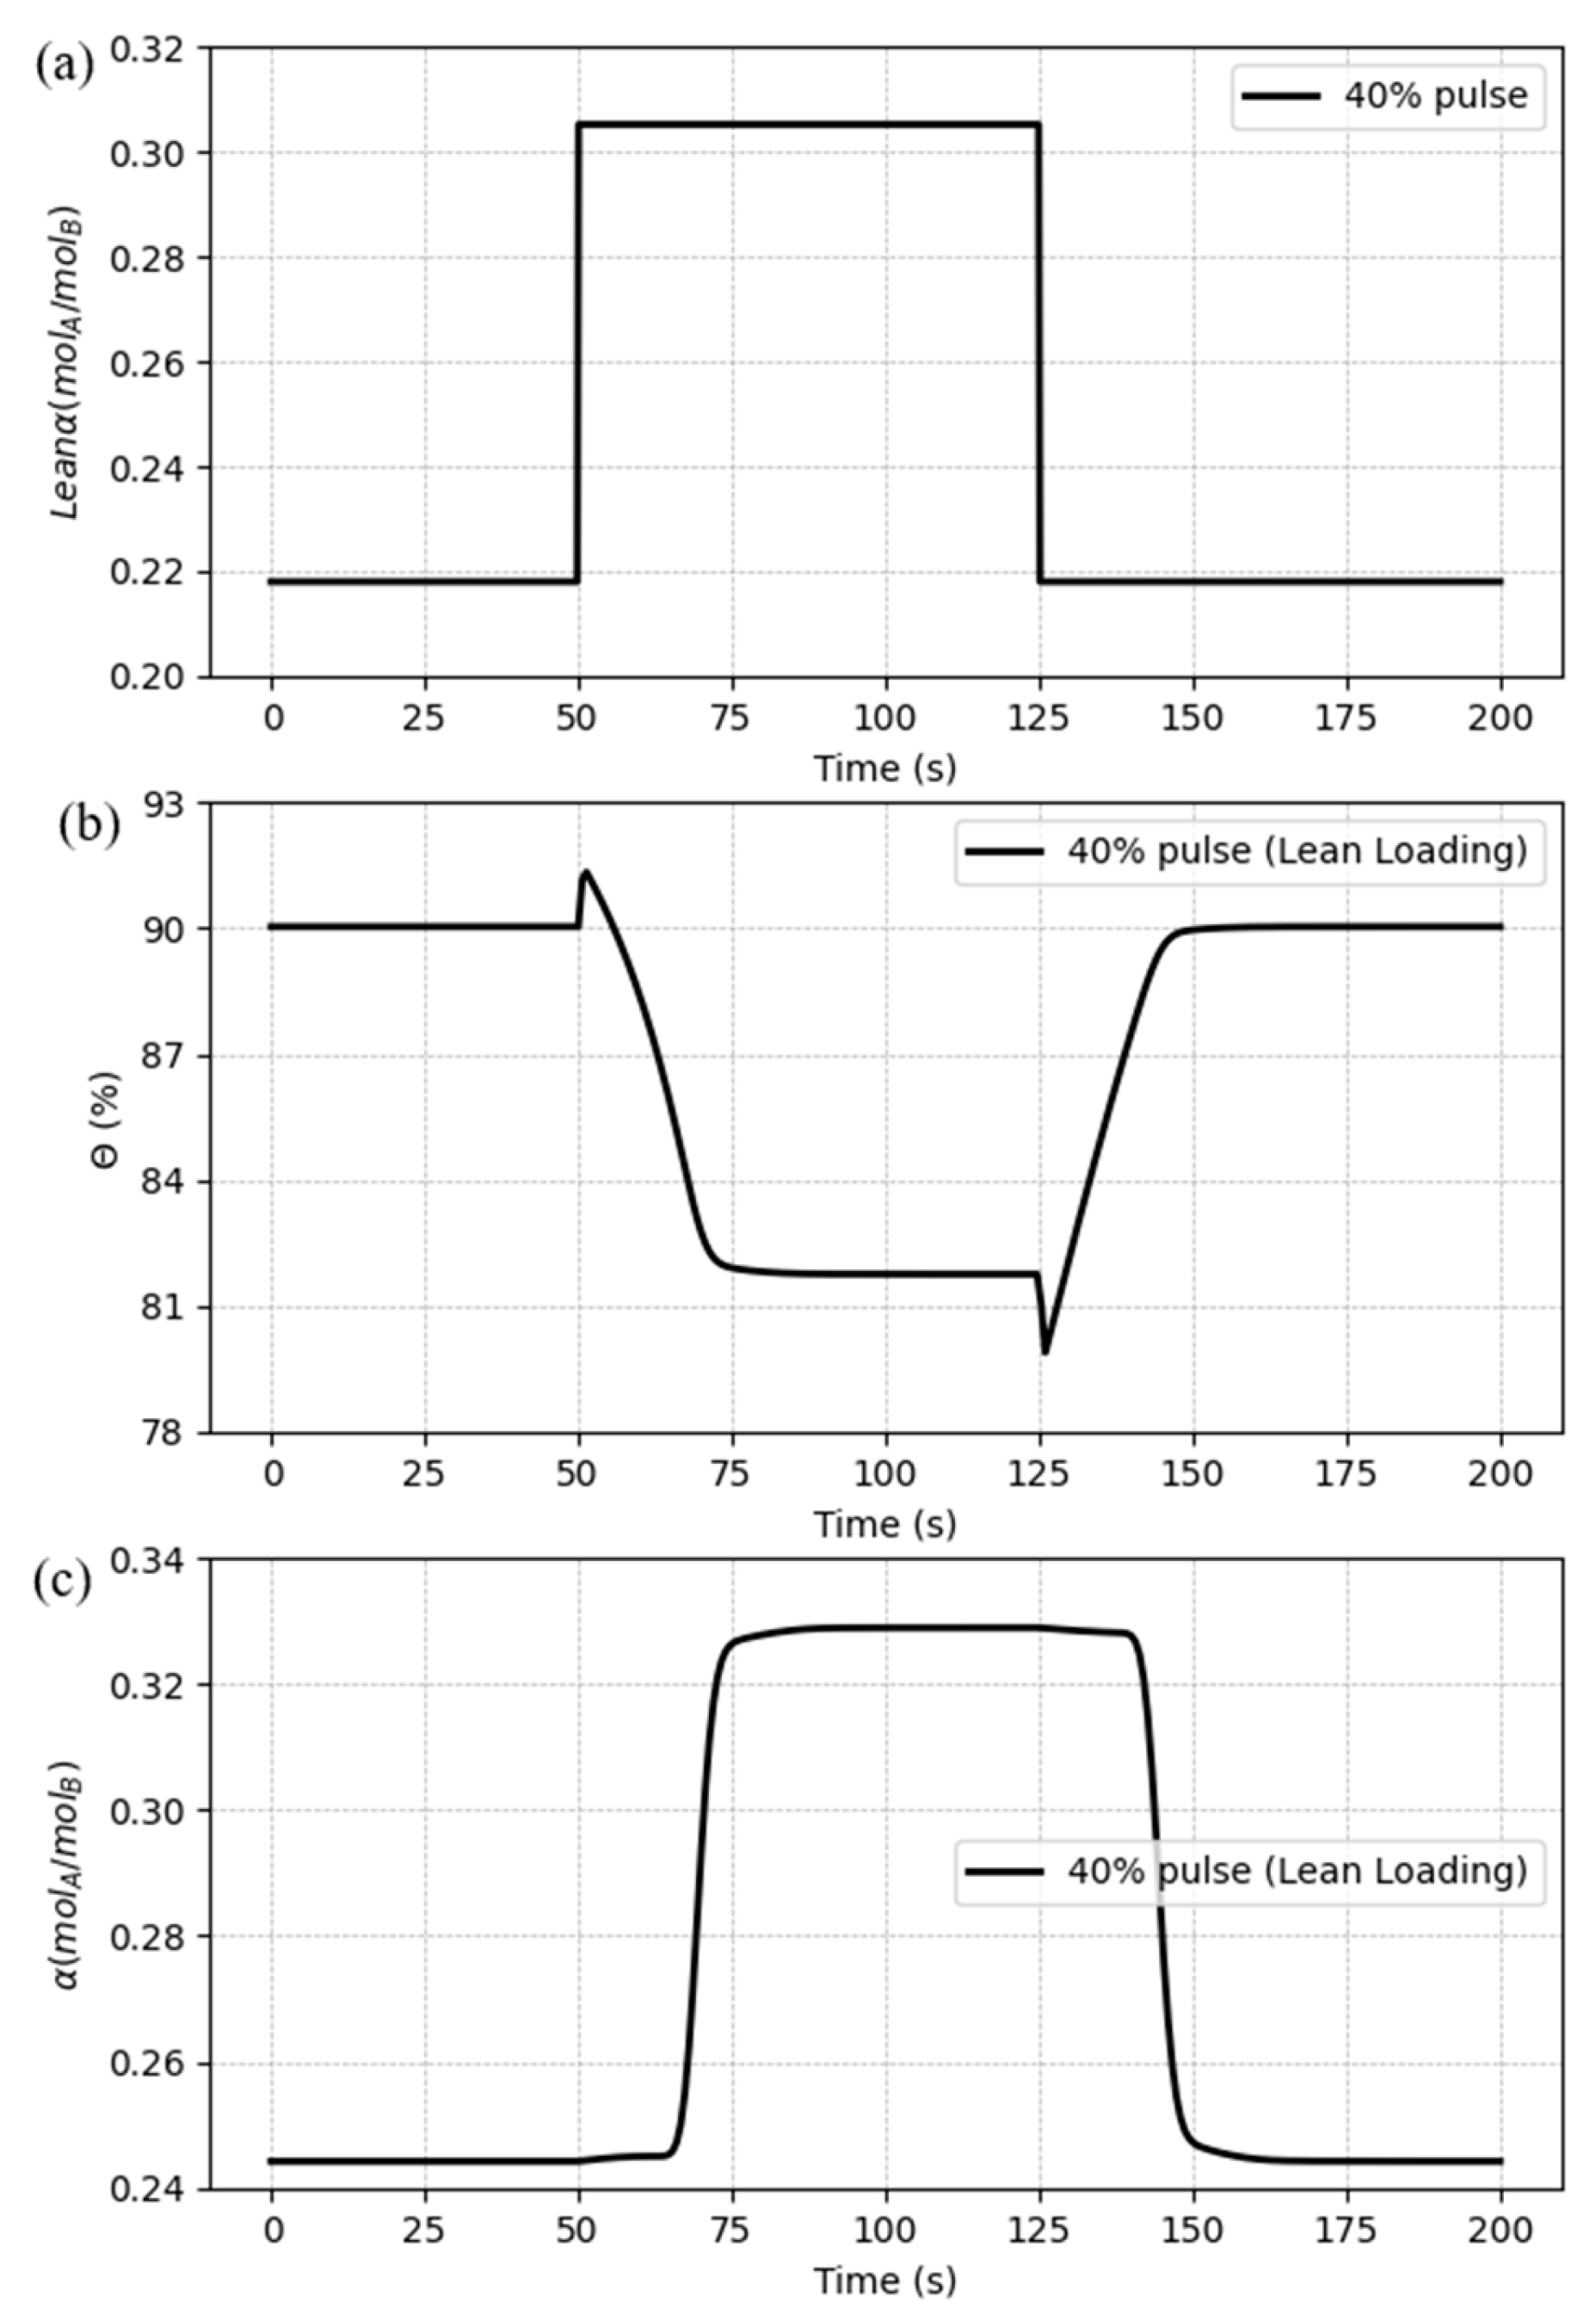
Also, a pulse variation was settled to analyze if the system can be changed and still turn back to the initial state. The disturbance designed has a period of 75 seconds and a magnitude of 40% of the initial value. The results can be seen in
Figure 18.
For the pulse variation, the model shows to be stable, assuming the values from the base case after the disturbance ends, despite the overshoots presented by the CO2 capture ratio and the delay in the response of the CO2 rich loading.
6. Conclusions
This section is not mandatory but may be added if there are patents resulting from the work reported in this manuscript. This manuscript reported on a one-dimensional dynamic modeling and simulation study of CO2 removal from a flue gas employing chemical absorption carried out in a hollow fiber membrane contactor (HFMC). For this purpose, with important model assumptions, the dynamic model responses proved to be coherently with the expected physic behavior, matching very well with the experimental data used in the validation stage.
With the results of the dynamic simulations, it was possible to evaluate the effect of some disturbances on important process variables, such as the CO2 capture rate and CO2 rich loading, in order to analyze the stability and capacity of the model to predict the plant behavior. The responses obtained from the step changes and pulse disturbances showed to be very distinct from one input variable to another. Regarding the settling time of responses, the gas phase showed to be faster than the liquid phase. Although, from the analyzed results, each response can be explained according to the given input variations. It was observed that the model reaches states that are coherent with the theoretically expected for all step changes and stay stable against the various pulse variations proposed. Also, as discussed, the way and proportion in which each change affects the system resulted in important information for applying future control strategies to this process.
The development of more efficient capture processes can lead to a substantial reduction in CO2 emissions. Thus, this dynamic study motivates HFMC to reach technology readiness level on an industrial scale. Even though the literature lacks available experimental dynamic data to validate the transient behavior of the process, once the system dynamics got satisfactory results for a wide range of operation fluctuations, different control strategies can be considered, such as advanced model predictive control (MPC). Additionally, State Observers (OS), for example, Un-scented Kalman Filter (UKF), can be applied when the model gets identified by available dynamic data from a HFMC unit for carbon capture.
Author Contributions
Conceptualization, W.P. and A.J.; methodology, W.P., A.J and L.R.; software, W.P.; validation, W.P. and J.F.; writing—original draft preparation, W.P and J.F.; writing—review and editing, W.P., A.J. and L.R.; project administration, A.J. All authors have read and agreed to the published version of the manuscript.
Funding
This research was financed by CAPES.
Institutional Review Board Statement
Not applicable.
Data Availability Statement
The data are contained within the article.
Acknowledgments
The authors are very thankful to PPGEQ, UFPB and the LABMCIP.
Conflicts of Interest
The authors declare no conflicts of interest.
References
- Ghobadi, J.; Ramirez, D.; Khoramfar, S.; Kabir, M.M.; Jerman, R.; Saeed, M. Mathematical modeling of CO2 separation using different diameter hollow fiber membranes. Int. J. Greenh. Gas Control 2021, 104, 103204. [Google Scholar] [CrossRef]
- Leung, D.Y.; Caramanna, G.; Maroto-Valer, M.M. An overview of current status of carbon dioxide capture and storage technologies. Ren. Sus. Energy Reviews 2014, 39, 426–443. [Google Scholar] [CrossRef]
- Chao, C.; Deng, Y.; Dewil., R.; Baeyens, J.; Fan, X. Post-combustion carbon capture. Renew. Sus. Energy Reviews, 1104. [Google Scholar]
- Wang, M.; Lawal, A.; Stephenson, P.; Sidders, J.; Ramshaw, C. Post-combustion CO2 capture with chemical absorption: A state-of-the-art review. Chem. Eng. Res. Des. 2011, 89, 1609–1624. [Google Scholar] [CrossRef]
- Yan, S.P.; Fang, M.X.; Zhang, W.F.; Wang, S.Y.; Xu, Z.K.; Luo, Z.Y.; Cen, K.F. Experimental study on the separation of CO2 from flue gas using hollow fiber membrane contactors without wetting. Fuel Process. Tech. 2007, 88, 501–511. [Google Scholar] [CrossRef]
- Younas, M.; Druon-Bocquet, S.; Sanchez, J. Experimental and theoretical mass transfer transient analysis of copper extraction using hollow fiber membrane contactors. J. Mem. Sci. 2011, 382, 70–81. [Google Scholar] [CrossRef]
- Zhao, S.; Feron, P.H.; Deng, L.; Favre, E.; Chabanon, E.; Yan, S.; Hou, J.; Chen, V.; Qi, H. Status and progress of membrane contactors in post-combustion carbon capture: A state-of-the-art review of new developments. J. Mem. Sci. 2016, 511, 180–206. [Google Scholar] [CrossRef]
- Feron, P.H.M.; Jansen, A.E. Capture of carbon dioxide using membrane gas absorption and reuse in the horticultural industry. E. Conv. Man. 1995, 36, 411–414. [Google Scholar] [CrossRef]
- deMontigny, D.; Tontiwachwuthikul, P.; Chakma, A. Using polypropylene and polytetrafluoroethylene membranes in a membrane contactor for CO2 absorption. J. Mem. Sci. 2006, 277, 99–107. [Google Scholar] [CrossRef]
- Ma'mun, S.; Dindore, V.Y.; Svendsen, H.F. Kinetics of the reaction of carbon dioxide with aqueous solutions of 2-((2-aminoethyl) amino) ethanol. Ind. Eng. Chem. Res. 2007, 46, 385–394. [Google Scholar] [CrossRef]
- Atchariyawut, S.; Jiraratananon, R.; Wang, R. Mass transfer study and modeling of gas–liquid membrane contacting process by multistage cascade model for CO2 absorption. Sep. Purif. Tech. 2008, 63, 15–22. [Google Scholar] [CrossRef]
- Theo, W.L.; Lim, J.S.; Hashim, H.; Mustaffa, A.A.; Ho, W.S. Review of pre-combustion capture and ionic liquid in carbon capture and storage. App. Energy 2016, 183, 1633–1663. [Google Scholar] [CrossRef]
- Gabelman, A.; Hwang, S.T. Hollow fiber membrane contactors. J. Mem. Sci 1999, 159, 61–106. [Google Scholar] [CrossRef]
- Li, J.L.; Chen, B.H. Review of CO2 absorption using chemical solvents in hollow fiber membrane contactors. Sep. Purif. Tech. 2005, 41, 109–122. [Google Scholar] [CrossRef]
- Simons, K.; Nijmeijer, K.; Wessling, M. Gas–liquid membrane contactors for CO2 removal. J. Mem. Sci.
- Cui, Z.; deMontigny, D. Part 7: A Review of CO2 Capture Using Hollow Fiber Membrane Contactors. Carbon Manag. 2013, 4, 69–89. [Google Scholar] [CrossRef]
- Rivero, J.R.; Panagakos, G.; Lieber, A.; Hornbostel, K. Hollow fiber membrane contactors for post-combustion carbon capture: A review of modeling approaches. Mem. 2020, 10, 382. [Google Scholar] [CrossRef]
- Mansourizadeh, A. Experimental study of CO2 absorption/stripping via PVDF hollow fiber membrane contactor. Chem. Eng. Res. Des. 2012, 90, 555–562. [Google Scholar] [CrossRef]
- Rode, S.; Nguyen, P.T.; Roizard, D.; Bounaceur, R.; Castel, C.; Favre, E. Evaluating the intensification potential of membrane contactors for gas absorption in a chemical solvent: A generic one-dimensional methodology and its application to CO2 absorption in monoethanolamine. J. Mem. Sci. 2012, 389, 1–16. [Google Scholar] [CrossRef]
- Zaidiza, D.A.; Billaud, J.; Belaissaoui, B.; Rode, S.; Roizard, D.; Favre, E. Modeling of CO2 post-combustion capture using membrane contactors, comparison between one-and two-dimensional approaches. J. Mem. Sci. 2014, 455, 64–74. [Google Scholar] [CrossRef]
- Khaisri, S.; deMontigny, D.; Tontiwachwuthikul, P.; Jiraratananon, R. A mathematical model for gas absorption membrane contactors that studies the effect of partially wetted membranes. J. Mem. Sci. 2010, 347, 228–239. [Google Scholar] [CrossRef]
- Zaidiza, D.A.; Belaissaoui, B.; Rode, S.; Neveux, T.; Makhloufi, C.; Castel, C.; Roizard, D.; Favre, E. Adiabatic modelling of CO2 capture by amine solvents using membrane contactors. J. Mem. Sci. 2015, 493, 106–119. [Google Scholar] [CrossRef]
- Porcheron, F.; Drozdz, S. Hollow fiber membrane contactor transient experiments for the characterization of gas/liquid thermodynamics and mass transfer properties. Chem. Eng. Sci. 2009, 64, 265–275. [Google Scholar] [CrossRef]
- Pakšiová, D.; Fikar, M.; Skogestad, S. Modeling of carbon dioxide removal using membrane contactors. In 2016 Cybernetics & Informatics (K&I), Levoca, Slovakia, 2016, (pp. 1-6).
- Rosli, A.; Shoparwe, N.F.; Ahmad, A.L.; Low, S.C.; Lim, J.K. Dynamic modelling and experimental validation of CO2 removal using hydrophobic membrane contactor with different types of absorbent. Sep. Purif. Tech. 2019, 219, 230–240. [Google Scholar] [CrossRef]
- Asadi, J.; Kazempoor, P. Dynamic response and flexibility analyses of a membrane-based CO2 separation module. International J. Greenh. Gas Control 2022, 116, 103634. [Google Scholar] [CrossRef]
- Bozonc, A.C.; Cormos, A.M.; Dragan, S.; Dinca, C.; Cormos, C.C. Dynamic Modeling of CO2 Absorption Process Using Hollow-Fiber Membrane Contactor in MEA Solution. Energies 2022, 15, 7241. [Google Scholar] [CrossRef]
- Wattanaphan, P.; Sema, T.; Idem, R.; Liang, Z.; Tontiwachwuthikul, P. Effects of flue gas composition on carbon steel (1020) corrosion in MEA-based CO2 capture process. Int. J. Greenh. Gas Control 2013, 19, 340–349. [Google Scholar] [CrossRef]
- D'Alessandro, D.M.; Smit, B.; Long, J.R. Carbon dioxide capture: prospects for new materials. Angewandte Chemie International Edition 2010, 49, 6058–6082. [Google Scholar] [CrossRef] [PubMed]
- Scholes, C.A.; Ho, M.T.; Wiley, D.E. Membrane-cryogenic post-combustion carbon capture of flue gases from NGCC. Tech. 2016, 4, 14. [Google Scholar] [CrossRef]
- Chabanon, E.; Kimball, E.; Favre, E.; Lorain, O.; Goetheer, E.; Ferre, D.; Gomez, A.; Broutin, P. Hollow fiber membrane contactors for post-combustion CO2 capture: A scale-up study from laboratory to pilot plant. Oil & Gas Sci. Tech.–Revue d’IFP Energies nouvelles 2014, 69, 1035–1045. [Google Scholar]
- Kimball, E.; Al-Azki, A.; Gomez, A.; Goetheer, E.; Booth, N.; Adams, D.; Ferre, D. Hollow fiber membrane contactors for CO2 capture: modeling and up-scaling to CO2 capture for an 800 MWe coal power station. Oil & Gas Sci. Tech.–Revue d’IFP Energies nouvelles 2014, 69, 1047–1058. [Google Scholar]
- Zaidiza, D.A.; Wilson, S.G.; Belaissaoui, B.; Rode, S.; Castel, C.; Roizard, D.; Favre, E. Rigorous modelling of adiabatic multicomponent CO2 post-combustion capture using hollow fiber membrane contactors. Chem. Eng. Sci. 2016, 145, 45–58. [Google Scholar] [CrossRef]
- Zaidiza, D.A.; Belaissaoui, B.; Rode, S.; Favre, E. Intensification potential of hollow fiber membrane contactors for CO2 chemical absorption and stripping using monoethanolamine solutions. Sep. Purif. Tech. 2017, 188, 38–51. [Google Scholar] [CrossRef]
- Happel, J. Viscous flow relative to arrays of cylinders. AIChE Journal 1959, 5, 174–177. [Google Scholar] [CrossRef]
- Boucif, N.; Corriou, J.P.; Roizard, D.; Favre, E. Carbon dioxide absorption by monoethanolamine in hollow fiber membrane contactors: A parametric investigation. AIChE journal 2011, 58, 2843–2855. [Google Scholar] [CrossRef]
- Farjami, M.; Moghadassi, A.; Vatanpour, V. Modeling and simulation of CO2 removal in a polyvinylidene fluoride hollow fiber membrane contactor with computational fluid dynamics. Chem. Eng. Processing: Process Intens. 2015, 98, 41–51. [Google Scholar] [CrossRef]
- Nakhjiri, A.T.; Heydarinasab, A.; Bakhtiari, O.; Mohammadi, T. Modeling and simulation of CO2 separation from CO2/CH4 gaseous mixture using potassium glycinate, potassium argininate and sodium hydroxide liquid absorbents in the hollow fiber membrane contactor. J. Env. Chem. Eng. 2018, 6, 1500–1511. [Google Scholar] [CrossRef]
- Wang, R.; Zhang, H.Y.; Feron, P.H.M.; Liang, D.T. Influence of membrane wetting on CO2 capture in microporous hollow fiber membrane contactors. Sep. Purif. Tech. 2005, 46, 33–40. [Google Scholar] [CrossRef]
- Keshavarz, P.; Fathikalajahi, J.; Ayatollahi, S. Analysis of CO2 separation and simulation of a partially wetted hollow fiber membrane contactor. J. Haz. Mat. 2008, 152, 1237–1247. [Google Scholar] [CrossRef] [PubMed]
- Mavroudi, M.; Kaldis, S.P.; Sakellaropoulos, G.P. A study of mass transfer resistance in membrane gas–liquid contacting processes. J. Mem. Sci. 2006, 272, 103–115. [Google Scholar] [CrossRef]
- Skelland, A.H.P. Diffusional Mass Transfer 1974.
- Miyatake, O.; Iwashita, H. Laminar-flow heat transfer to a fluid flowing axially between cylinders with a uniform wall heat flux. Int. J. Heat Mass Transf. 1991, 34, 322–327. [Google Scholar] [CrossRef]
- Bao, L.; Lipscomb, G.G. Mass transfer in axial flows through randomly packed fiber bundles with constant wall concentration. J. Mem. Sci. 2002, 204, 207–220. [Google Scholar] [CrossRef]
- Bao, L.; Lipscomb, G.G. Well-developed mass transfer in axial flows through randomly packed fiber bundles with constant wall flux. Chem. Eng. Sci. 2002, 57, 125–132. [Google Scholar] [CrossRef]
- Kreulen, H.; Smolders, C.A.; Versteeg, G. F.; Van Swaaij, W.P.M. Determination of mass transfer rates in wetted and non-wetted microporous membranes. Chem. Eng. Sci. 1993, 48, 2093–2102. [Google Scholar] [CrossRef]
- Hikita, H.; Asai, S.; Ishikawa, H.; Honda, M. The kinetics of reactions of carbon dioxide with monoethanolamine, diethanolamine and triethanolamine by a rapid mixing method. The Chem. Eng. J. 1977, 13, 7–12. [Google Scholar] [CrossRef]
- Danckwerts, P.V. The reaction of CO2 with ethanolamines. Chem. Eng. Sci. 1979, 34, 443–446. [Google Scholar] [CrossRef]
- Beek, W.J.; Muttzall, K.M.K.; van Heuven, J.M. Transport Phenomena, 2nd ed.; John Wiley & Sons: London, England, 1999. [Google Scholar]
- Levenspiel, O. Chemical Engineering Reaction, 3rd ed.; John Wiley & Sons: New York, USA, 1999. [Google Scholar]
- Zhang, H.Y.; Wang, R.; Liang, D.T.; Tay, J.H. Modeling and experimental study of CO2 absorption in a hollow fiber membrane contactor. J. Mem. Sci. 2006, 279, 301–310. [Google Scholar] [CrossRef]
- Sohaib, Q.; Muhammad, A.; Younas, M.; Rezakazemi, M. Modeling pre-combustion CO2 capture with tubular membrane contactor using ionic liquids at elevated temperatures. Sep. Purif. Tech. 2020, 241, 116677. [Google Scholar] [CrossRef]
- Ma’mun, S.; Svendsen, H.F. Solubility of N2O in aqueous monoethanolamine and 2-(2-Aminoethyl-amino)ethanol solutions from 298 to 343 K. Energy Procedia 2009, 1, 837–843. [Google Scholar] [CrossRef]
- Poling, B.E.; Prausnitz, J.M.; O’Connell, J.P. The Properties of Gases and Liquids, 5th ed.; McGraw-Hill: New York, USA, 2001. [Google Scholar]
- Weiland, R.H.; Dingman, J.C.; Cronin, D.B.; Browning, G.J. Density and viscosity of some partially carbonated aqueous alkanolamine solutions and their blends. J. Chem. Eng. Data 1998, 43, 378–382. [Google Scholar] [CrossRef]
- Maceiras, R.; Álvarez, E.; Cancela, M.A. Effect of temperature on carbon dioxide absorption in monoethanolamine solutions. Chem. Eng. J. 2008, 138, 295–300. [Google Scholar] [CrossRef]
- Versteeg, G.F.; Van Swaaij, W.P. Solubility and diffusivity of acid gases (carbon dioxide, nitrous oxide) in aqueous alkanolamine solutions. J. Chem. Eng. Data 1988, 33, 29–34. [Google Scholar] [CrossRef]
- Snijder, E.D.; te Riele, M.J.; Versteeg, G.F.; Van Swaaij, W.P.M. Diffusion coefficients of several aqueous alkanolamine solutions. J. Chem. Eng. Data 1993, 38, 475–480. [Google Scholar] [CrossRef]
- Versteeg, G.F.; Van Dijck, L.A.J.; van Swaaij, W.P.M. On the kinetics between CO2 and alkanolamines both in aqueous and non-aqueous solutions. An overview. Chem. Eng. Communi. 1996, 144, 113–158. [Google Scholar] [CrossRef]
Figure 1.
Schematic representation of a Hollow fiber membrane contactor illustration.
Figure 1.
Schematic representation of a Hollow fiber membrane contactor illustration.
Figure 2.
Gas, liquid, and membrane resistances in mass transfer.
Figure 2.
Gas, liquid, and membrane resistances in mass transfer.
Figure 3.
Computational flowchart.
Figure 3.
Computational flowchart.
Figure 4.
Comparison of simulated and experimental results in lab scale for gas flow range from 0.2 to 6.0 L/min and liquid flow rates of 10 (in blue) and 50 mL/min (in red).
Figure 4.
Comparison of simulated and experimental results in lab scale for gas flow range from 0.2 to 6.0 L/min and liquid flow rates of 10 (in blue) and 50 mL/min (in red).
Figure 5.
Solution for the CO2 concentrations in at (a) the shell (gas phase), (b) the lumen (liquid phase) and (c) the concentration of free MEA in liquid.
Figure 5.
Solution for the CO2 concentrations in at (a) the shell (gas phase), (b) the lumen (liquid phase) and (c) the concentration of free MEA in liquid.
Figure 6.
Initial profiles of CO2 concentration in (a) the gas phase and (b) liquid phase.
Figure 6.
Initial profiles of CO2 concentration in (a) the gas phase and (b) liquid phase.
Figure 7.
Initial profiles of CO2 concentration in (a) the gas phase and (b) liquid phase.
Figure 7.
Initial profiles of CO2 concentration in (a) the gas phase and (b) liquid phase.
Figure 8.
Steady-state profiles for CO2 concentrations in at (a) the shell (gas phase), (b) the lumen (liquid phase) and (c) the concentration of free MEA in liquid.
Figure 8.
Steady-state profiles for CO2 concentrations in at (a) the shell (gas phase), (b) the lumen (liquid phase) and (c) the concentration of free MEA in liquid.
Figure 9.
Reaction regime profile.
Figure 9.
Reaction regime profile.
Figure 10.
Step changes on liquid inlet volumetric flow rate (a) and responses in (b) CO2 capture ratio and (c) CO2 loading.
Figure 10.
Step changes on liquid inlet volumetric flow rate (a) and responses in (b) CO2 capture ratio and (c) CO2 loading.
Figure 11.
Pulse disturbance in liquid inlet volumetric flow rate (a) and responses in (b) CO2 capture ratio and (c) CO2 loading.
Figure 11.
Pulse disturbance in liquid inlet volumetric flow rate (a) and responses in (b) CO2 capture ratio and (c) CO2 loading.
Figure 12.
Step changes in inlet gas volumetric flow rate (a) and responses for (b) CO2 capture ratio and (c) CO2 loading.
Figure 12.
Step changes in inlet gas volumetric flow rate (a) and responses for (b) CO2 capture ratio and (c) CO2 loading.
Figure 13.
Pulse disturbance in gas inlet volumetric flow rate (a) and responses in (b) CO2 capture ratio and (c) CO2 loading.
Figure 13.
Pulse disturbance in gas inlet volumetric flow rate (a) and responses in (b) CO2 capture ratio and (c) CO2 loading.
Figure 14.
Step changes in inlet molar fraction of CO2 on gas (a) and responses for (b) CO2 capture ratio and (c) CO2 loading.
Figure 14.
Step changes in inlet molar fraction of CO2 on gas (a) and responses for (b) CO2 capture ratio and (c) CO2 loading.
Figure 15.
Zoomed response of CO2 capture ratio against the step changes in CO2 molar fraction.
Figure 15.
Zoomed response of CO2 capture ratio against the step changes in CO2 molar fraction.
Figure 16.
Pulse disturbance in the inlet gas CO2 composition (a) and responses in (b) CO2 capture ratio and (c) CO2 loading.
Figure 16.
Pulse disturbance in the inlet gas CO2 composition (a) and responses in (b) CO2 capture ratio and (c) CO2 loading.
Figure 17.
Step changes in lean loading of CO2 on liquid (a) and responses for (b) CO2 capture ratio and (c) CO2 lean loading.
Figure 17.
Step changes in lean loading of CO2 on liquid (a) and responses for (b) CO2 capture ratio and (c) CO2 lean loading.
Figure 18.
Pulse disturbance in the lean loading of CO2 (a) and responses in (b) CO2 capture ratio and (c) CO2 rich loading.
Figure 18.
Pulse disturbance in the lean loading of CO2 (a) and responses in (b) CO2 capture ratio and (c) CO2 rich loading.
Table 1.
Expressions for geometrical characteristics of the system.
Table 1.
Expressions for geometrical characteristics of the system.
| Parameter |
Expression |
Units |
References |
| Shell radius |
|
n |
[36] |
| Gas flow sectional area |
|
m² |
- |
| Total liquid flow sectional area |
|
m² |
- |
| External hydraulic diameter |
|
m |
[20] |
| Internal hydraulic diameter |
|
m |
[20] |
Table 2.
General model assumptions.
Table 2.
General model assumptions.
| Condition |
Description |
| Flow |
|
- 2.
Gas flows in the shell and liquid in the lumen. |
| System constraints |
- 3.
The regime is in unsteady state |
- 4.
Pressure drop is neglected for both phases. |
- 5.
Isothermal conditions are prevailed |
- 6.
The solvent evaporation and gas condensation were neglected |
| Membranes |
- 7.
Hydrophobic membrane pores with partial wetting operation. |
| Thermodynamics |
- 8.
Henry’s Law is applicable at the interface gas-liquid (located at internal surface). |
- 9.
N2 solubility neglected |
| Mass transfer |
- 10.
Uniform wall flux along the fibers |
| Chemical reaction |
- 11.
Irreversible, bimolecular, and second-order kinetics. |
Table 3.
Definition of reaction regime.
Table 3.
Definition of reaction regime.
| Reaction regime |
Relationship |
| Pseudo first-order reaction by the gas-liquid interface (reaction is limiting the process) |
|
| Fast second order reaction (mass transfer is partially limiting the process) |
|
| Instantaneous reaction at the film (mass transfer is limiting the process) |
|
Table 4.
Boundary and initial conditions.
Table 4.
Boundary and initial conditions.
| Parameter |
Expression |
Units |
|
|
|
|
|
|
|
|
|
|
|
Table 5.
Units’ specification.
Table 5.
Units’ specification.
| |
Parameter |
Lab-scale |
Pilot-scale |
| Module |
Inner radius (m) |
|
|
| Effective length (m) |
|
|
| Number of fibers (-) |
|
|
| Packing ration (-) |
|
|
| Specific interfacial area (m²/m³) |
|
|
| Fiber |
Inner radius (m) |
|
| Outer radius (m) |
|
| Porosity (-) |
|
| Material (-) |
|
Table 6.
Parameter correlations and relations.
Table 6.
Parameter correlations and relations.
| Parameter |
Expression |
Units |
References |
| Henry constant for CO2 in MEA solution |
: CO2, N2
: water, MEA 30% (mass) |
Pa.m3mol-1
|
[53] |
| Diffusion coefficient of CO2 on gas mixture |
: N2, O2, H2O |
m2s-1
|
[54] |
| Density of MEA solution |
: MEA, H2O, CO2
|
10-3 kg.m-3
|
[55] |
| Initial concentration of MEA |
|
mol.m-3
|
- |
| Viscosity of MEA solution |
|
Pa.s |
[56] |
| Diffusion coefficient of CO2 in MEA solution |
|
m2s-1
|
[57] |
| Diffusion coefficient of MEA in MEA solution |
|
m2s-1
|
[58] |
| Kinetic constant |
|
m3mol-1s-1
|
[59] |
Table 7.
Simulation parameters.
Table 7.
Simulation parameters.
| Parameter |
Value or expression |
Units |
| Operation pressure |
|
Pa |
| Operation temperature |
|
K |
| Inlet volumetric rate of gas |
|
m3s-1
|
| Overall volumetric rate of liquid |
|
m3s-1
|
| Inlet molar fraction of CO2 on gas |
|
- |
| Inlet molar fraction of N2 on gas |
|
|
| Inlet concentration of CO2 on gas |
|
mol.m-3
|
| Inlet concentration of free CO2 on liquid |
|
mol.m-3
|
| Mass fraction of MEA |
|
- |
| Inlet concentration of free MEA on liquid |
|
mol.m-3
|
| Lean loading of CO2
|
|
molCO2.molMEA-1
|
| Number of segments on discretized space |
|
- |
| Membrane tortuosity |
|
- |
| Wetting fraction |
|
- |
|
Disclaimer/Publisher’s Note: The statements, opinions and data contained in all publications are solely those of the individual author(s) and contributor(s) and not of MDPI and/or the editor(s). MDPI and/or the editor(s) disclaim responsibility for any injury to people or property resulting from any ideas, methods, instructions or products referred to in the content. |
© 2023 by the authors. Licensee MDPI, Basel, Switzerland. This article is an open access article distributed under the terms and conditions of the Creative Commons Attribution (CC BY) license (http://creativecommons.org/licenses/by/4.0/).
