1. Introduction
To obtain clear image, spacecraft and aircraft are equipped with electro-optics systems (EO) [
1,
2]. Generally, EO mainly includes electronic units, opto-mechanical structure, and imaging sensors, which are mounted inside the cabin. For large EO, the opto-mechanical structure is often designed as a reflective type, and the main optical components include primary mirror and secondary mirror [
3,
4].
To improve the ability to clearly image distant targets, it is necessary to have a larger aperture for the primary mirror and secondary mirror, while ensuring minimal wavefront error (WFE) on the reflective surface [
5]. WFE is impacted by manufacturing and assembly technology, and also varies with environmental factors [
6,
7]. Among various environmental factors, the influence of temperature is enormous. When the temperature changes, the curvatures of primary mirror and secondary mirror deviate from the design values due to the thermal expansion or contraction. More importantly, due to the non-uniform temperature distribution of the mirror, the displacement caused by temperature changes at each point is also different. Therefore, in addition to uniform expansion or contraction, irregular deformation occurs. The complex deformation brings optical aberrations which are difficult to eliminate, thereby reducing image quality.
Optical aberrations analysis can be completed by fitting the distorted surface using Zernike polynomials. Reference [
8] analyzed the aberration and image quality under given temperature conditions. Based on the simulation results, the temperature level and allowable temperature differences that the opto-mechanical structure need to maintain were provided. In practice, the temperature distribution is influenced by various heat transfer modes, making it difficult to pre determine [
9]. In addition, simulation techniques need to be improved to comprehensively and accurately evaluate aberrations and image quality [
10,
11]. Therefore, in product design, it is common practice, to directly prescribe the working temperature of the opto-mechanical structure, based on task requirements and the difficulty of thermal control, and considering previous experience, including the average temperature of primary mirror and secondary mirror, the temperature difference between them, and their own temperature uniformity. Based on the temperature distribution, the performance of the opto-mechanical structure and the image quality of the EO can be guaranteed. For the spacecraft opto-mechanical structure, temperature uniformity is easily satisfied since the heat transfer modes are conduction and radiation only. For aerial opto-mechanical structure, however, temperature is also affected by complex convection, which makes uniformity more difficult. Therefore, the axial/radial temperature differences within the mirrors, as well as the temperature difference between primary mirror and secondary mirror, are generally limited to 5℃, while the average temperature fluctuates slightly around 20℃ [
2,
12].
Due to the significant temperature changes in the environment where the EO operates, thermal control design must be carried out to ensure that the opto-mechanical structure, especially primary mirror and secondary mirror, meets the temperature prescriptions during the working cycle. When the mirror is made of silicon carbide (SiC), due to its large thermal conductivity, temperature uniformity is easily satisfied, and therefore a large heating power can be used to ensure the average temperature of the mirror. The fused silica mirror, while offering great merits, such as matured and low-cost manufacturing and hence wide usage, presents also great challenge: a small thermal conductivity, which makes temperature uniformity difficult. It is necessary to reduce the heating power to ensure temperature uniformity, but this will reduce the temperature rise ability.
To guarantee the temperature uniformity of the fused silica mirror, this article analyze the relationship between conventional heating method and axial/radial temperature differences, and an optimized thermal control design based on temperature negative feedback variable power zonal heating is proposed. Through this thermal control technology, the axial/radial temperature differences can be controlled within 5℃; At the same time, it keeps a balance between heating power and heat losses, ensuring that the temperature is at an appropriate level during the working cycle, thereby guaranteeing good image quality of EO.
2. Typical Aerial Opto-Mechanical Structure and Its Heat Transfer
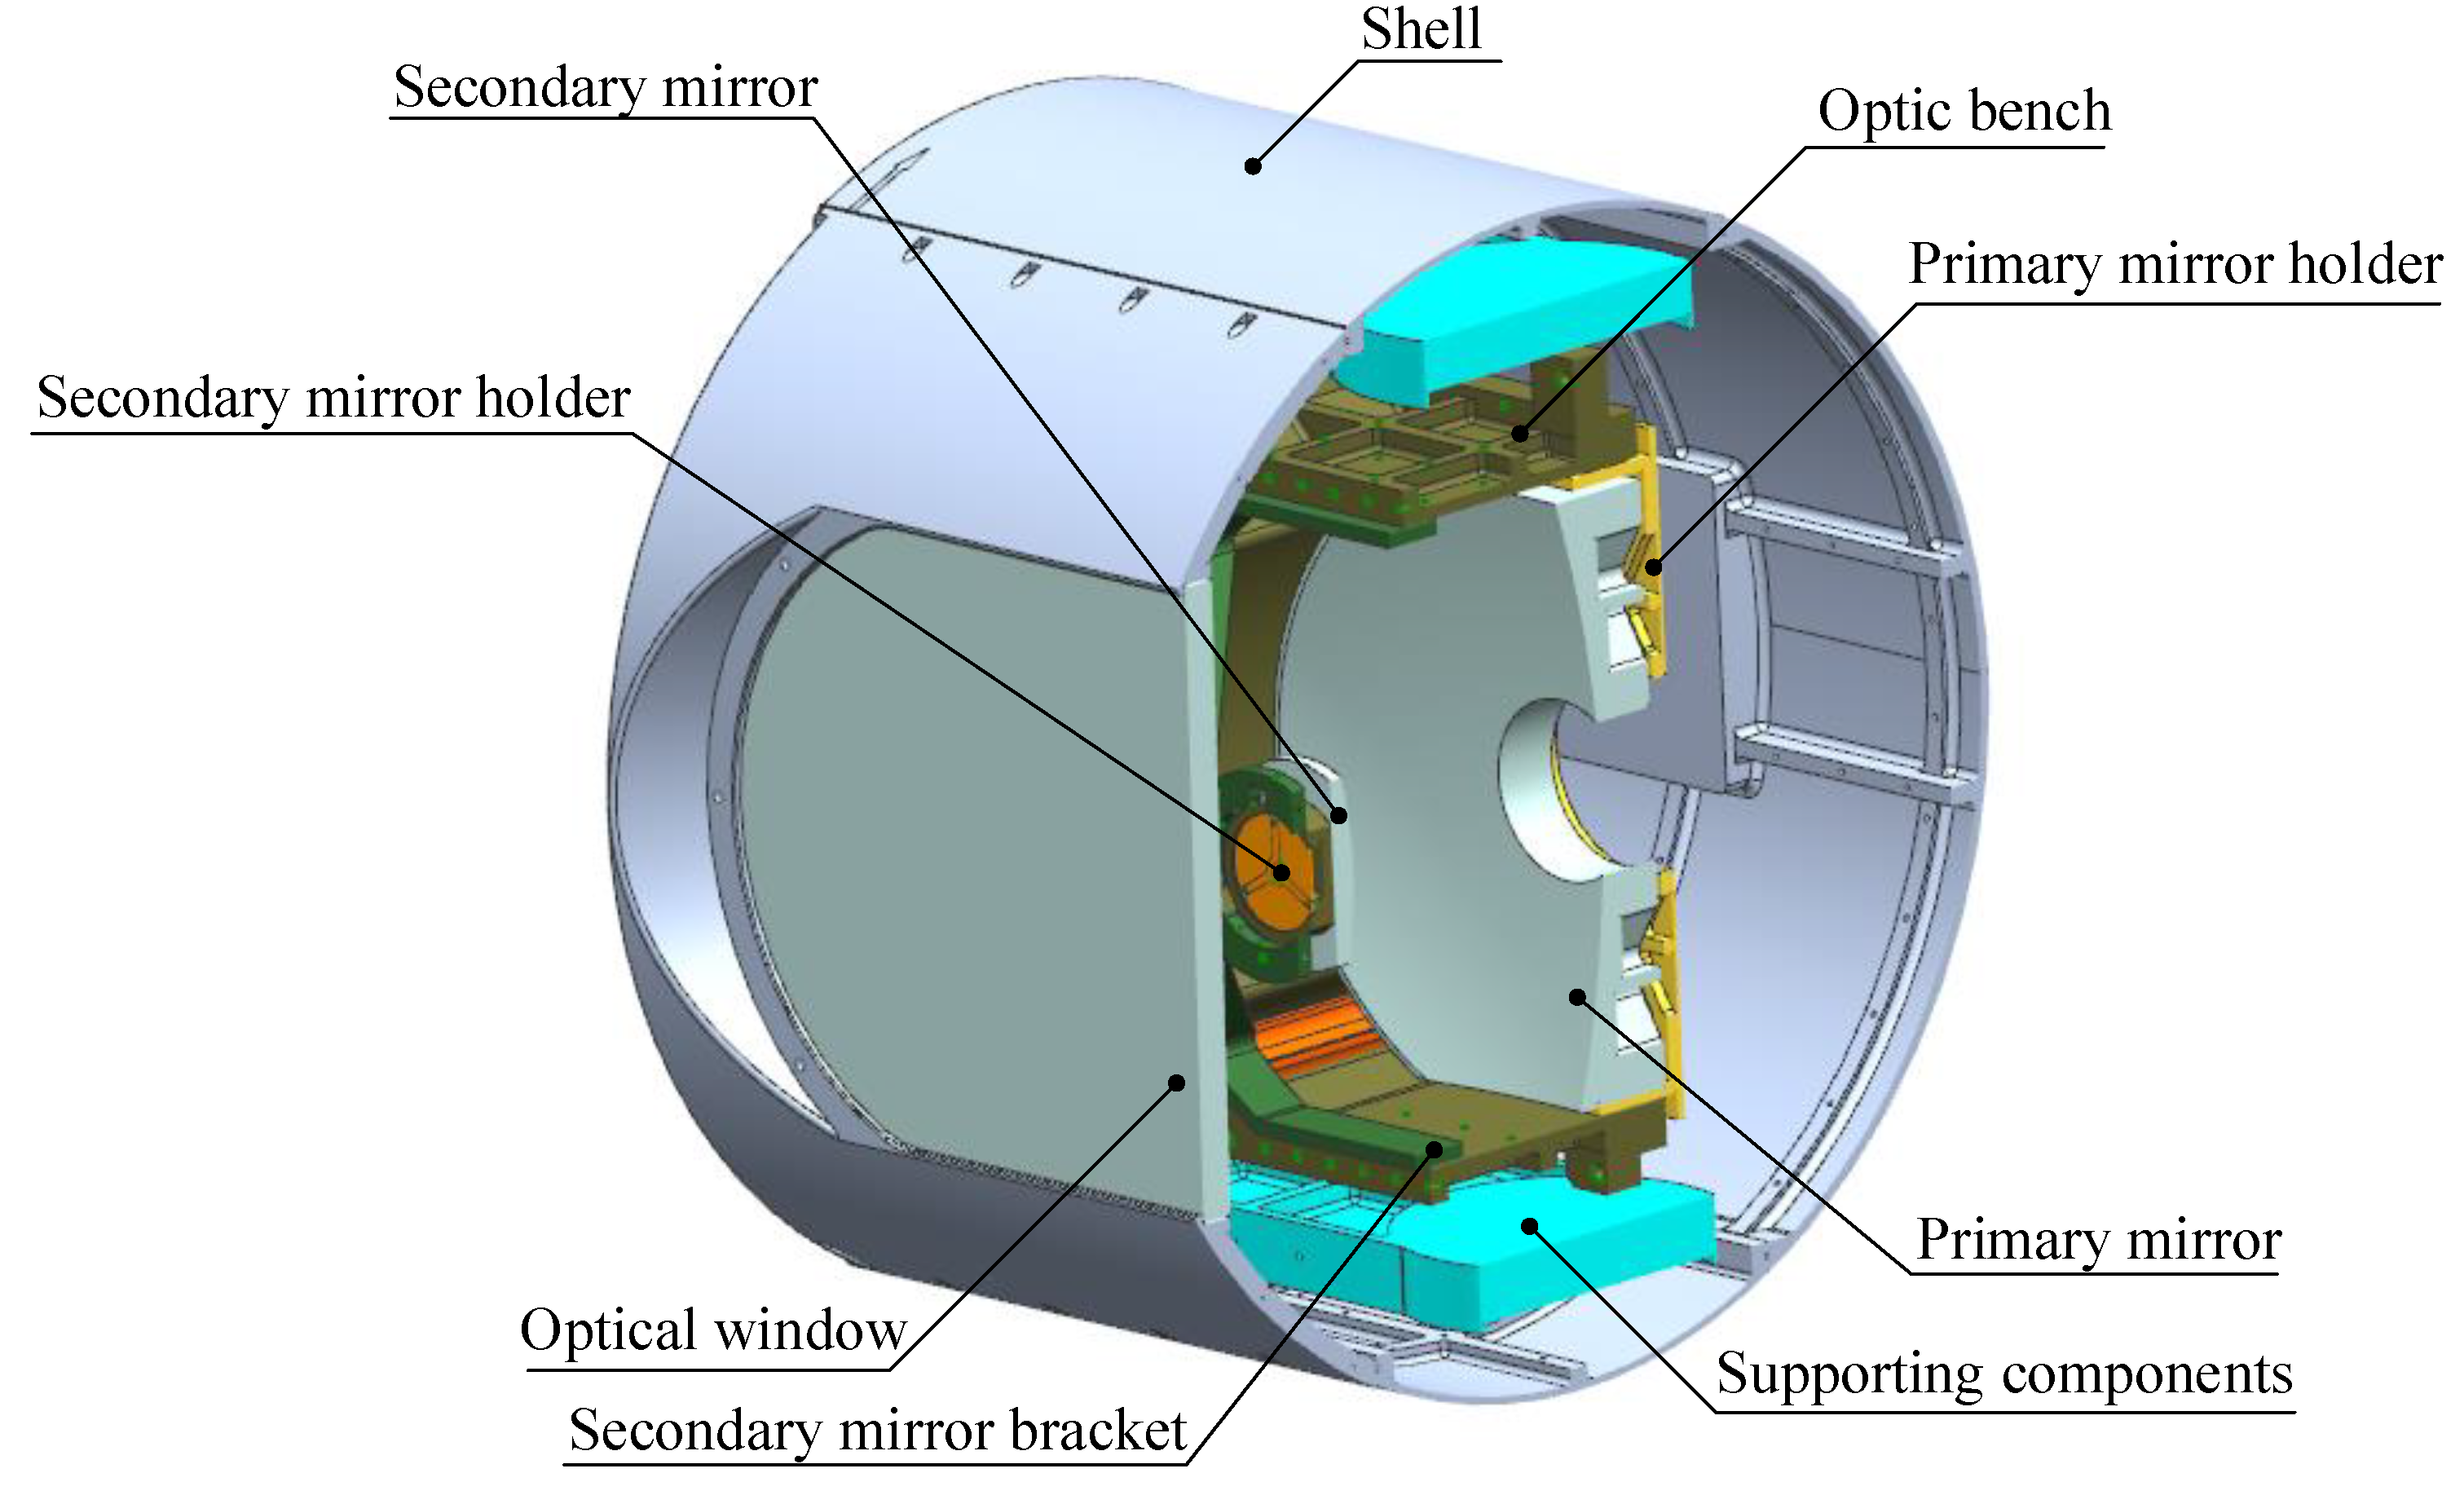
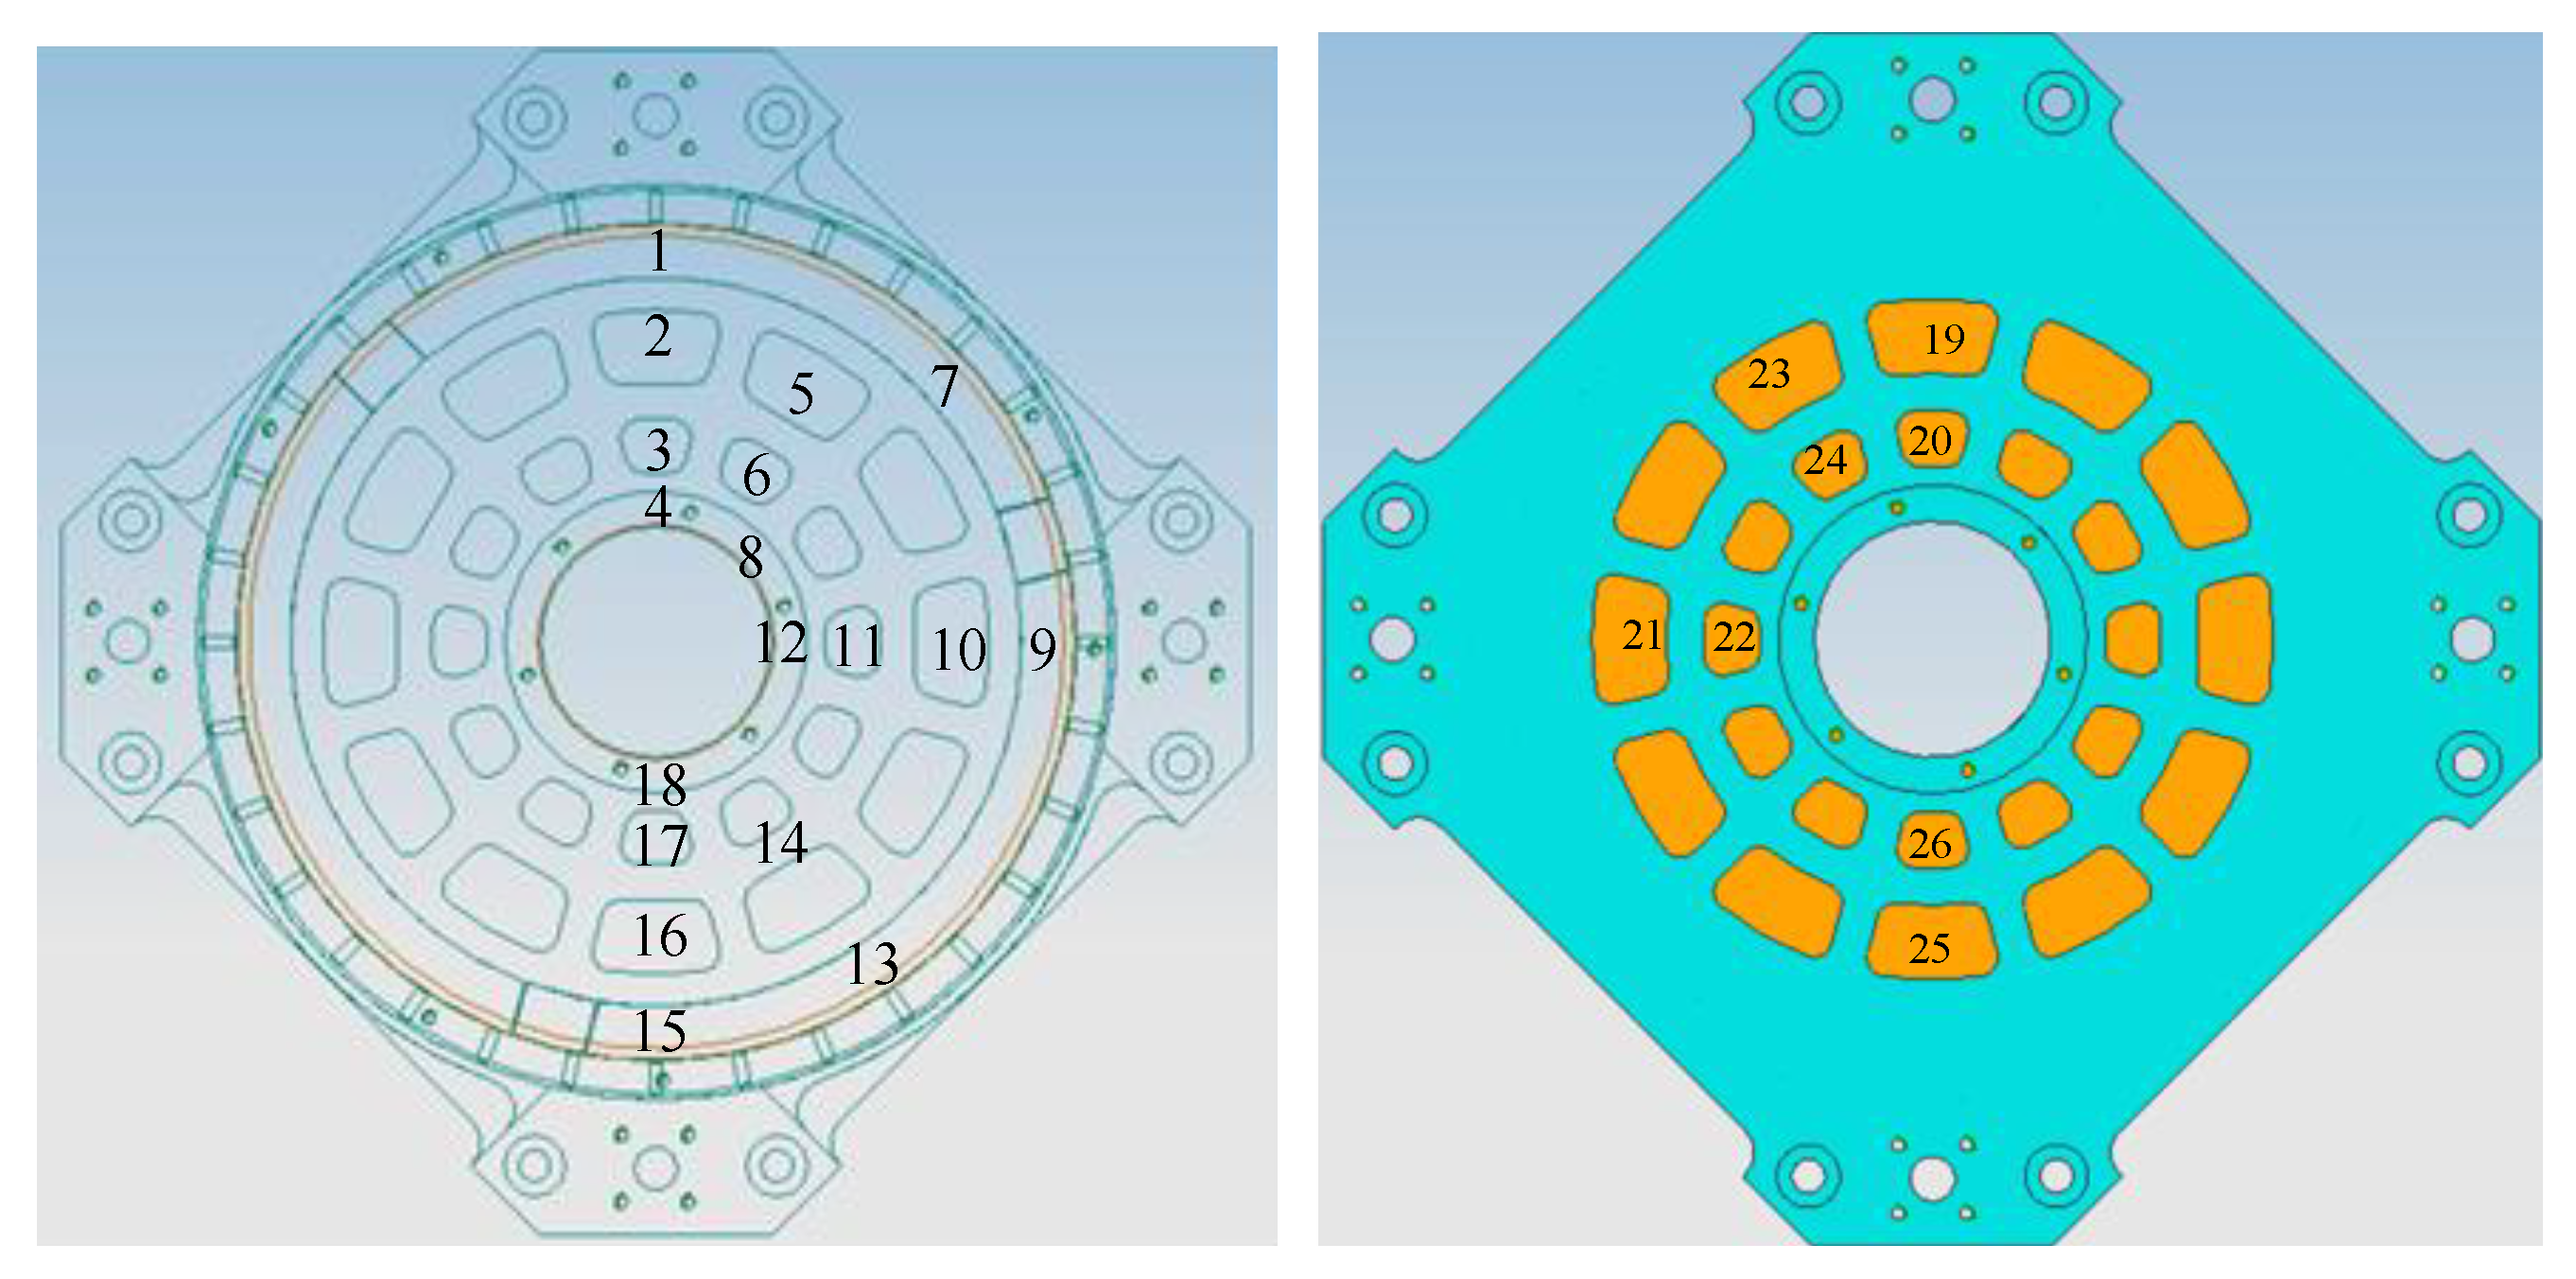
A typical aerial opto-mechanical structure is shown in
Figure 1. The primary mirror and secondary mirror are mounted on the primary mirror holder and secondary mirror holder respectively, and they are connected through the optic bench and secondary mirror bracket to form the main body of the reflective opto-mechanical structure. The opto-mechanical structure is connected to the shell of the EO through supporting components, and is surrounded by a cabin formed by the shell and the optical window, which is usually cylindrical or spherical.
As the flight altitude and endurance of the aircraft increase, the opto-mechanical structure will undergo long-term heat exchange with low-temperature environments, resulting in a decrease in its own temperature. Firstly, conduction occurs between the opto-mechanical structure and the supporting components, and the heat is ultimately transmitted to the shell. The primary mirror and secondary mirror are bonded to the primary mirror holder and secondary mirror holder through silicone rubber, which is insulative and has a small bonding area. Therefore, the heat losses of primary mirror and secondary mirror by conduction are very small. For optic bench and support components with contact surface temperatures of Tob and Tsc, the heat rate by conduction is calculated according to formula (1):
In formula (1), Aca is the contact area between the two, and Rcont is the contact thermal resistance. Generally, Aca is small while Rcont is large.
Secondly, the cabin is filled with air and undergoes heat exchange with the opto- mechanical structure through convection, transferring heat to the shell and the optical window, and ultimately diffusing to the external environment. Taking a typical aerial primary mirror as an example, the reflective surface is approximated as a plane, and the normal direction is perpendicular to the direction of gravity. The characteristic size (usually aperture) is L=300mm, the temperature of the reflective surface Tpm=293K, and the temperature of the air Ta=213K. That is, after working for a period of time, the temperature of the interior air of the cabin is consistent with the external environment temperature (this phenomenon is consistent with reality). The air flow inside the cabin is in free convection, with Raleigh number Rax:

In formula (2), the acceleration of gravity
g=9.8m/s
2,
the Prandtl number of air
Pr=0.7, and its kinematic viscosity
ν calculated
according to the (
Tpm+
Ta)/2 condition, it
is 11.71×10
-6m
2/s. Formula (2) calculates
Rax≤
RaL=4.3×10
8 ≤ 10
9, meaning that
the Raleigh number at any position on the reflective surface does not exceed
the critical value, therefore it is laminar free convection [
13]. Correspondingly, calculate the average
convection coefficient
of the
reflective surface according to formula (3)
Where k is the thermal conductivity of the air at a temperature of (Tpm+Ta)/2, which is 22.54×10⁻³W/(m·K); f (Pr) is a function of the Prandtl number:
By combining formulas (3) and (4), of the reflective
surface can be calculated to be approximately 5.57W/(m2·K). It
should be pointed out that there are other criteria for deciding whether the
heat transfer is laminar or turbulence. There are also different
calculation methods for ,
but the results are not significantly different.
The third heat transfer mode of opto-mechanical structure
is radiation. Assuming that all surfaces are diffuse gray surfaces in the
analysis, their emissivity
ε equals to absorptivity
α.
ε is
directionally independent, and can be regarded as a constant within the
operating temperature range of EO. For the opto-mechanical structure, it is
located within the envelope formed by the shell and the optical window, its emissivity is
εos. The absolute temperature of the
opto-mechanical structure and envelope are
Tos and
Ten
respectively. Denote the
radiation area of the opto-mechanical structure is
Aos, then
the radiation power
from the
opto-mechanical structure to the envelope can be estimated as [
14]:

In formula (5), σ=5.67×10⁻⁸W (m2·K4)
is the Stefan-Boltzmann constant. Obviously, the higher the value of Ten,
the less heat the opto-mechanical structure loses through radiation; When Tos < Ten, , it means that the
opto-mechanical structure is heated. In order to obtain accurate results, the
radiation of components such as the primary mirror, secondary mirror, and optic
bench must be calculated more elaborately, often using numerical methods.
However, formula (5) can be used to qualitatively analyze the trend of
radiation heat transfer.
3. Analysis of Temperature Uniformity and Optimization of Thermal Control
The analysis in the second section shows that the heat losses of the opto-mechanical structure is mainly through convection and radiation. Although electronic units and imaging sensors generate heat during operation, it is not sufficient to compensate for the heat losses of the opto-mechanical structure. Without additional heat input, the temperature of the opto-mechanical structure will ultimately match the ambient temperature. By then, the image quality may become very poor.
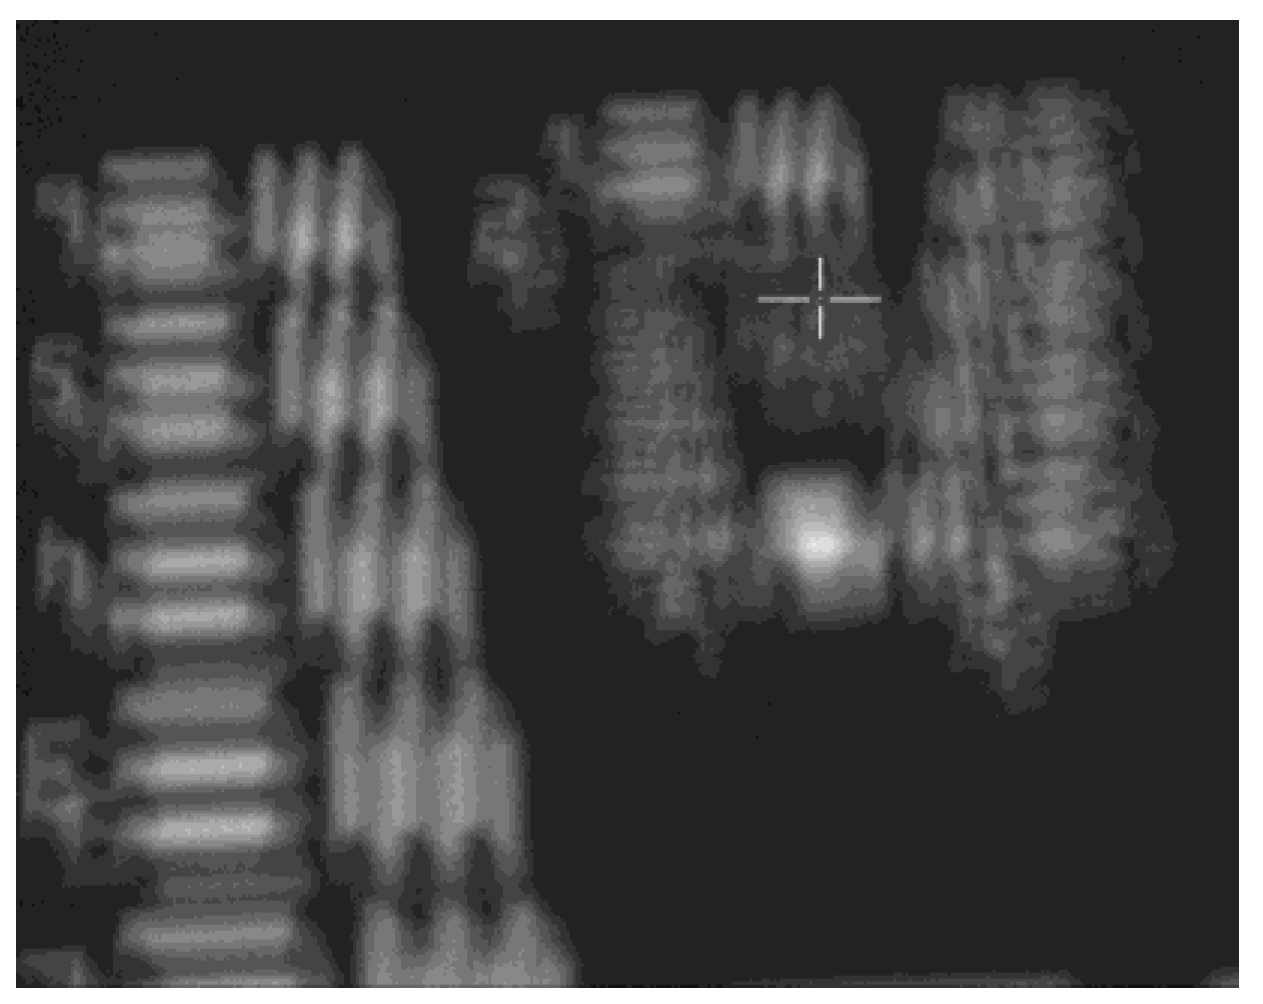
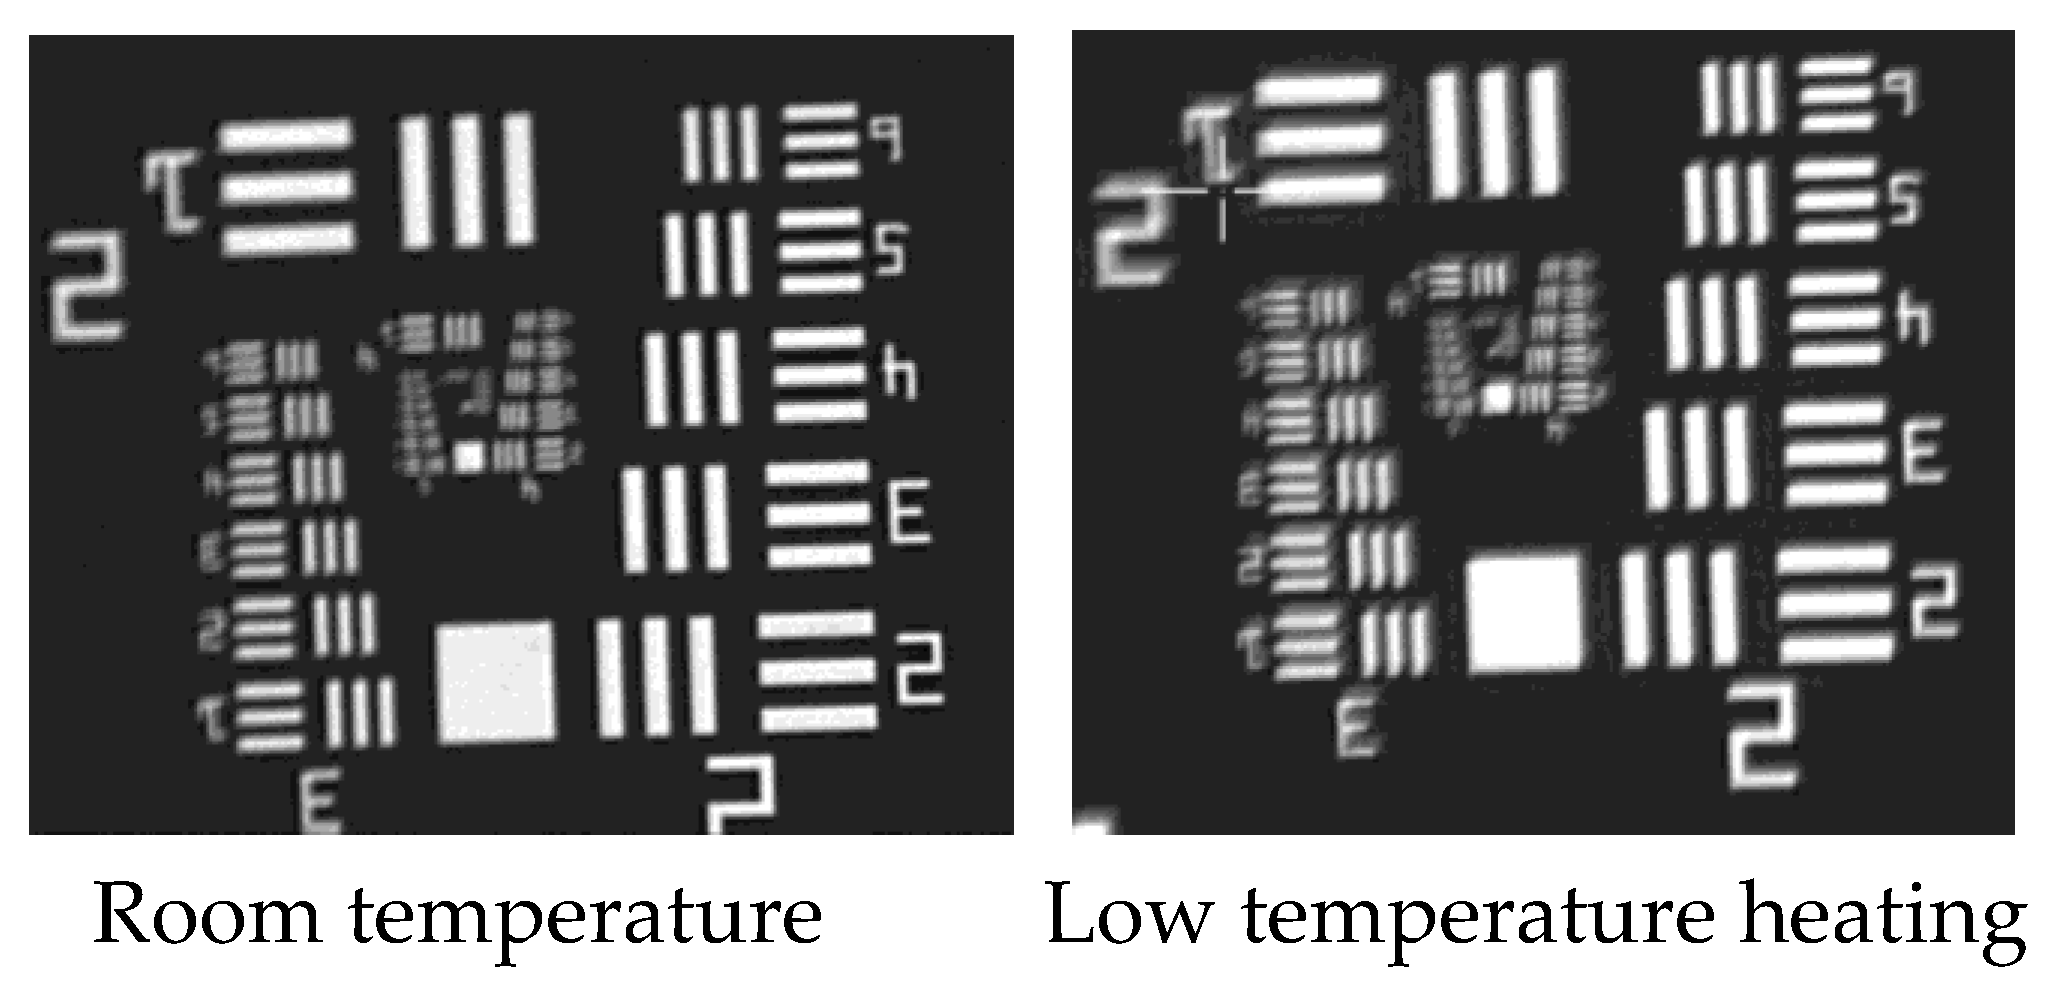
Figure 2 shows the image of observing the resolution test chart of a certain EO after being stored at -40℃ for 6 hours. At this point, the temperature of the opto-mechanical structure is about -35℃, and clear imaging is impossible. Therefore, it is necessary to heat up the opto-mechanical structure, especially the primary mirror and secondary mirror, to ensure the image quality of EO.
The conventional heating method for the primary mirror is to arrange a heating zone on its back [16]. The heat starts from the primary mirror holder and reaches the back of the primary mirror through radiation and conduction, and continues to transmit axially to the reflective surface. This brings about axial/radial temperature differences. The following analyzes the relationship between temperature uniformity and heating power for reflective faces of different shapes and materials, and proposes an optimized thermal control with the goal of reducing temperature gradient.
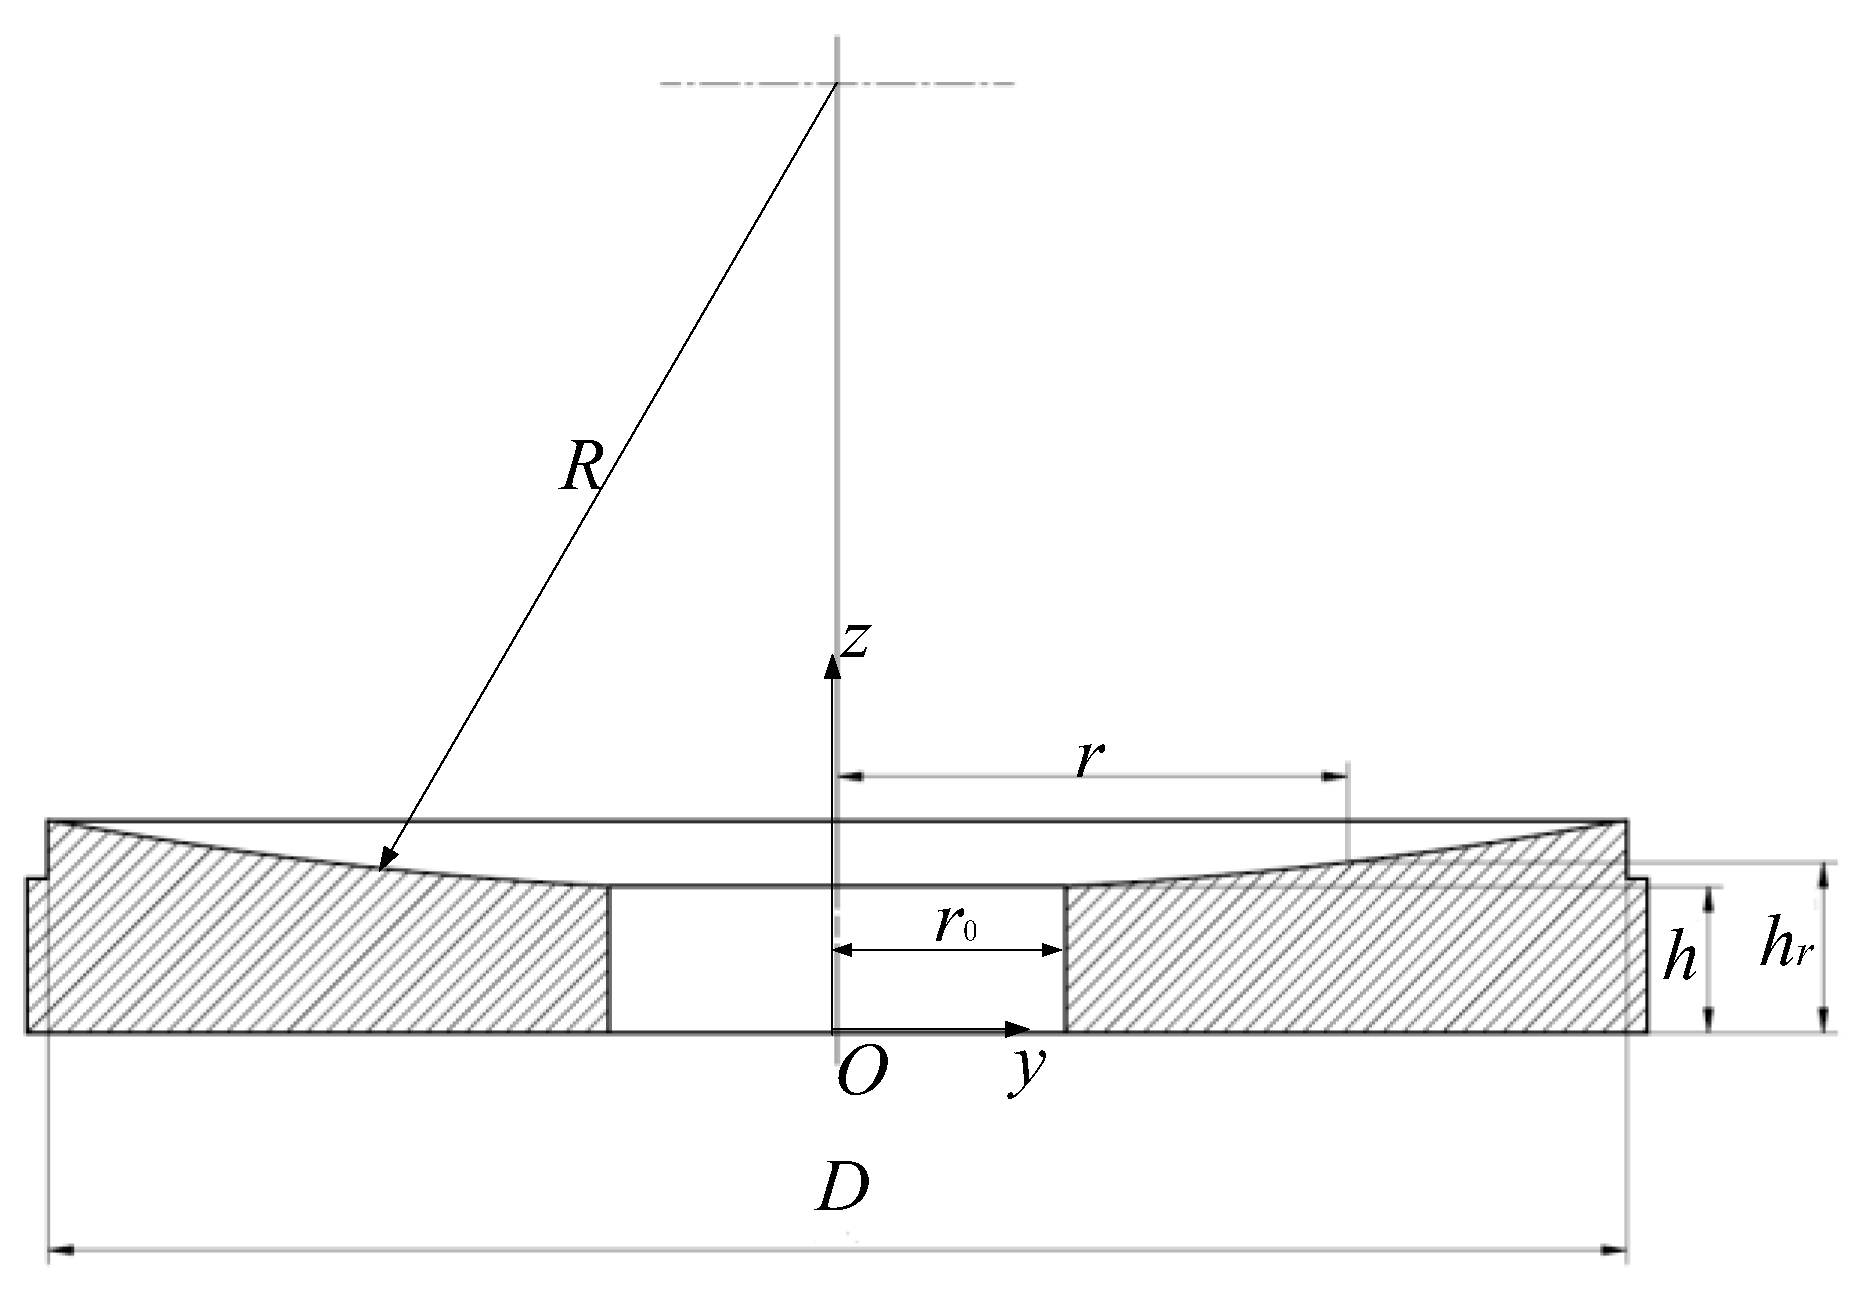
Take a spherical reflective face as an example, as shown in
Figure 3. Denote the curvature radius as
R, the aperture
D, the center thickness
h, and there is a hole with a radius of
r0 in the center of the mirror. The thermal conductivity of the mirror is
k.
Obviously, on the reflective surface, at a radial coordinate r(0≤r≤D/2), the distance hr from the back is:
When the back of the mirror is heated, the vast majority of heat is transferred from the back to the reflective surface through conduction. The heat transfer rate qcond per unit area is shown in formula (7):
Assuming a uniform temperature distribution Tb on the back, under steady-state conditions, the temperature Tr of the reflective surface at the radial coordinate r can be calculated using formula (6) and formula (7):
Therefore, the maximum axial temperature difference ΔTax appears at the outer edge of the reflective surface:
The maximum radial temperature difference ΔTrad caused by conduction can also be obtained through formula (8):
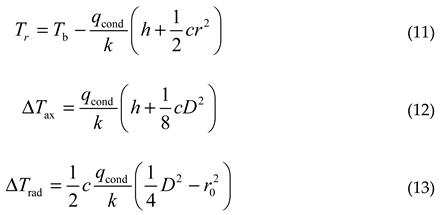
Therefore, based on the temperature difference threshold, combined with formulas (9) and (10), the maximum allowable heating power can be estimated. Similarly, when the reflective surface is parabolic, Tr, ΔTax, ΔTrad are respectively:
In formulas (11) to (13), c represents the curvature at the center of the reflective surface, and the meanings of other symbols are consistent with those of spherical mirrors. Similarly, the temperature distribution of other types of reflective surfaces can be analyzed.
From formulas (9), (10), (12), and (13), it can be inferred that, under the premise of consistent geometric size and temperature uniformity requirements, the larger the value of k, the greater the allowable heating power. For mirrors made of SiC material, kSiC exceeds 100W/(m·K), so a large amount of power can be applied to the back for heating, allowing the mirror to have sufficient temperature rise capacity, while the temperature gradient is controlled within the specified range. For fused silica mirrors, kfs is barely 1/100 of kSiC, so the back heating power must be well controlled to avoid large temperature gradient. In addition, it is necessary to consider the convection of the reflective surface in reality, and it is difficult to ensure uniform distribution of qcond on the entire back surface. These factors will increase the temperature gradient on the mirror. Therefore, in reality, the allowable maximum heating power is smaller than the estimated value.
Consider a fused silica primary mirror with a spherical reflective surface,
kfs=1.37 W/(m·K) (see Table 3.12 of reference [
15]),
R=600mm,
D=220mm,
h=20mm,
r0=35mm. When the maximum allowable axial/radial temperature differences are 5℃,
qcond=227 W/m
2, a maximum heating power of approximately 7.8W on the back can be applied. As a comparison, calculate the maximum allowable heating power of the SiC mirror.
kSiC is about 150W/(m·K) (see Table 3.13 of reference [
15]), and the corresponding back heating power can be increased to 849W; Even if the axial/radial temperature differences are limited to 0.5℃, the back heating power can still maintain 85W. On the other hand, according to formula (3), when the mirror and air temperatures are 20℃ and -60℃ respectively, the rate of heat loss is about 16.4W. This means that when EO operates at low temperatures for a long time, in order to maintain the temperature level while ensuring temperature uniformity, mirrors of SiC material need heating on the back only [
4,16]; For fused silica mirrors, however, in addition to back heating, more optimized heating measures must also be introduced to maintain temperature level.
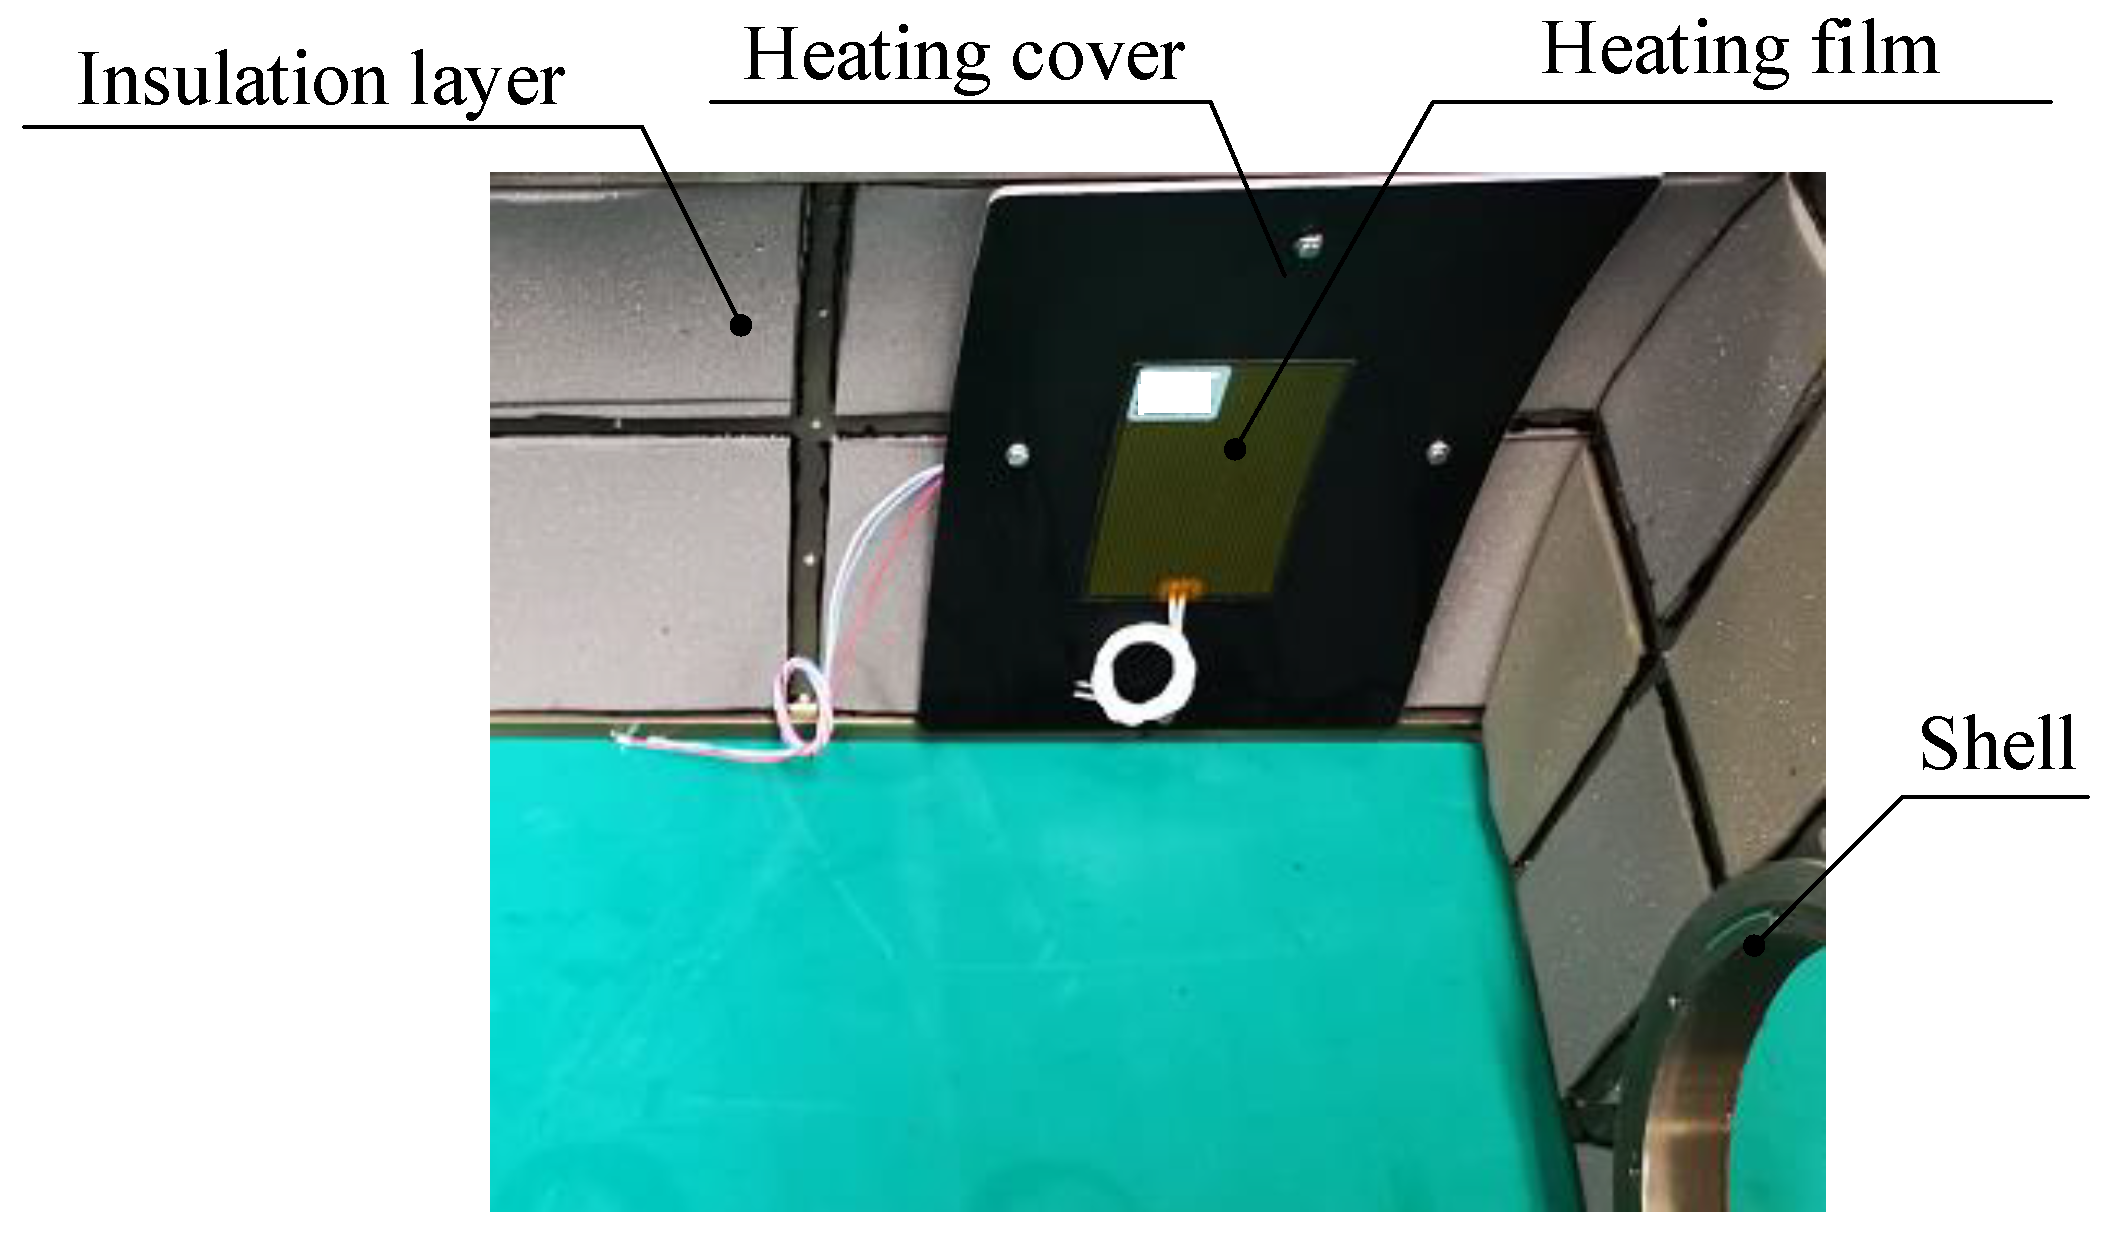
One optimization measure is to arrange thermal control devices on the shell, including passive insulation and active heating, as shown in
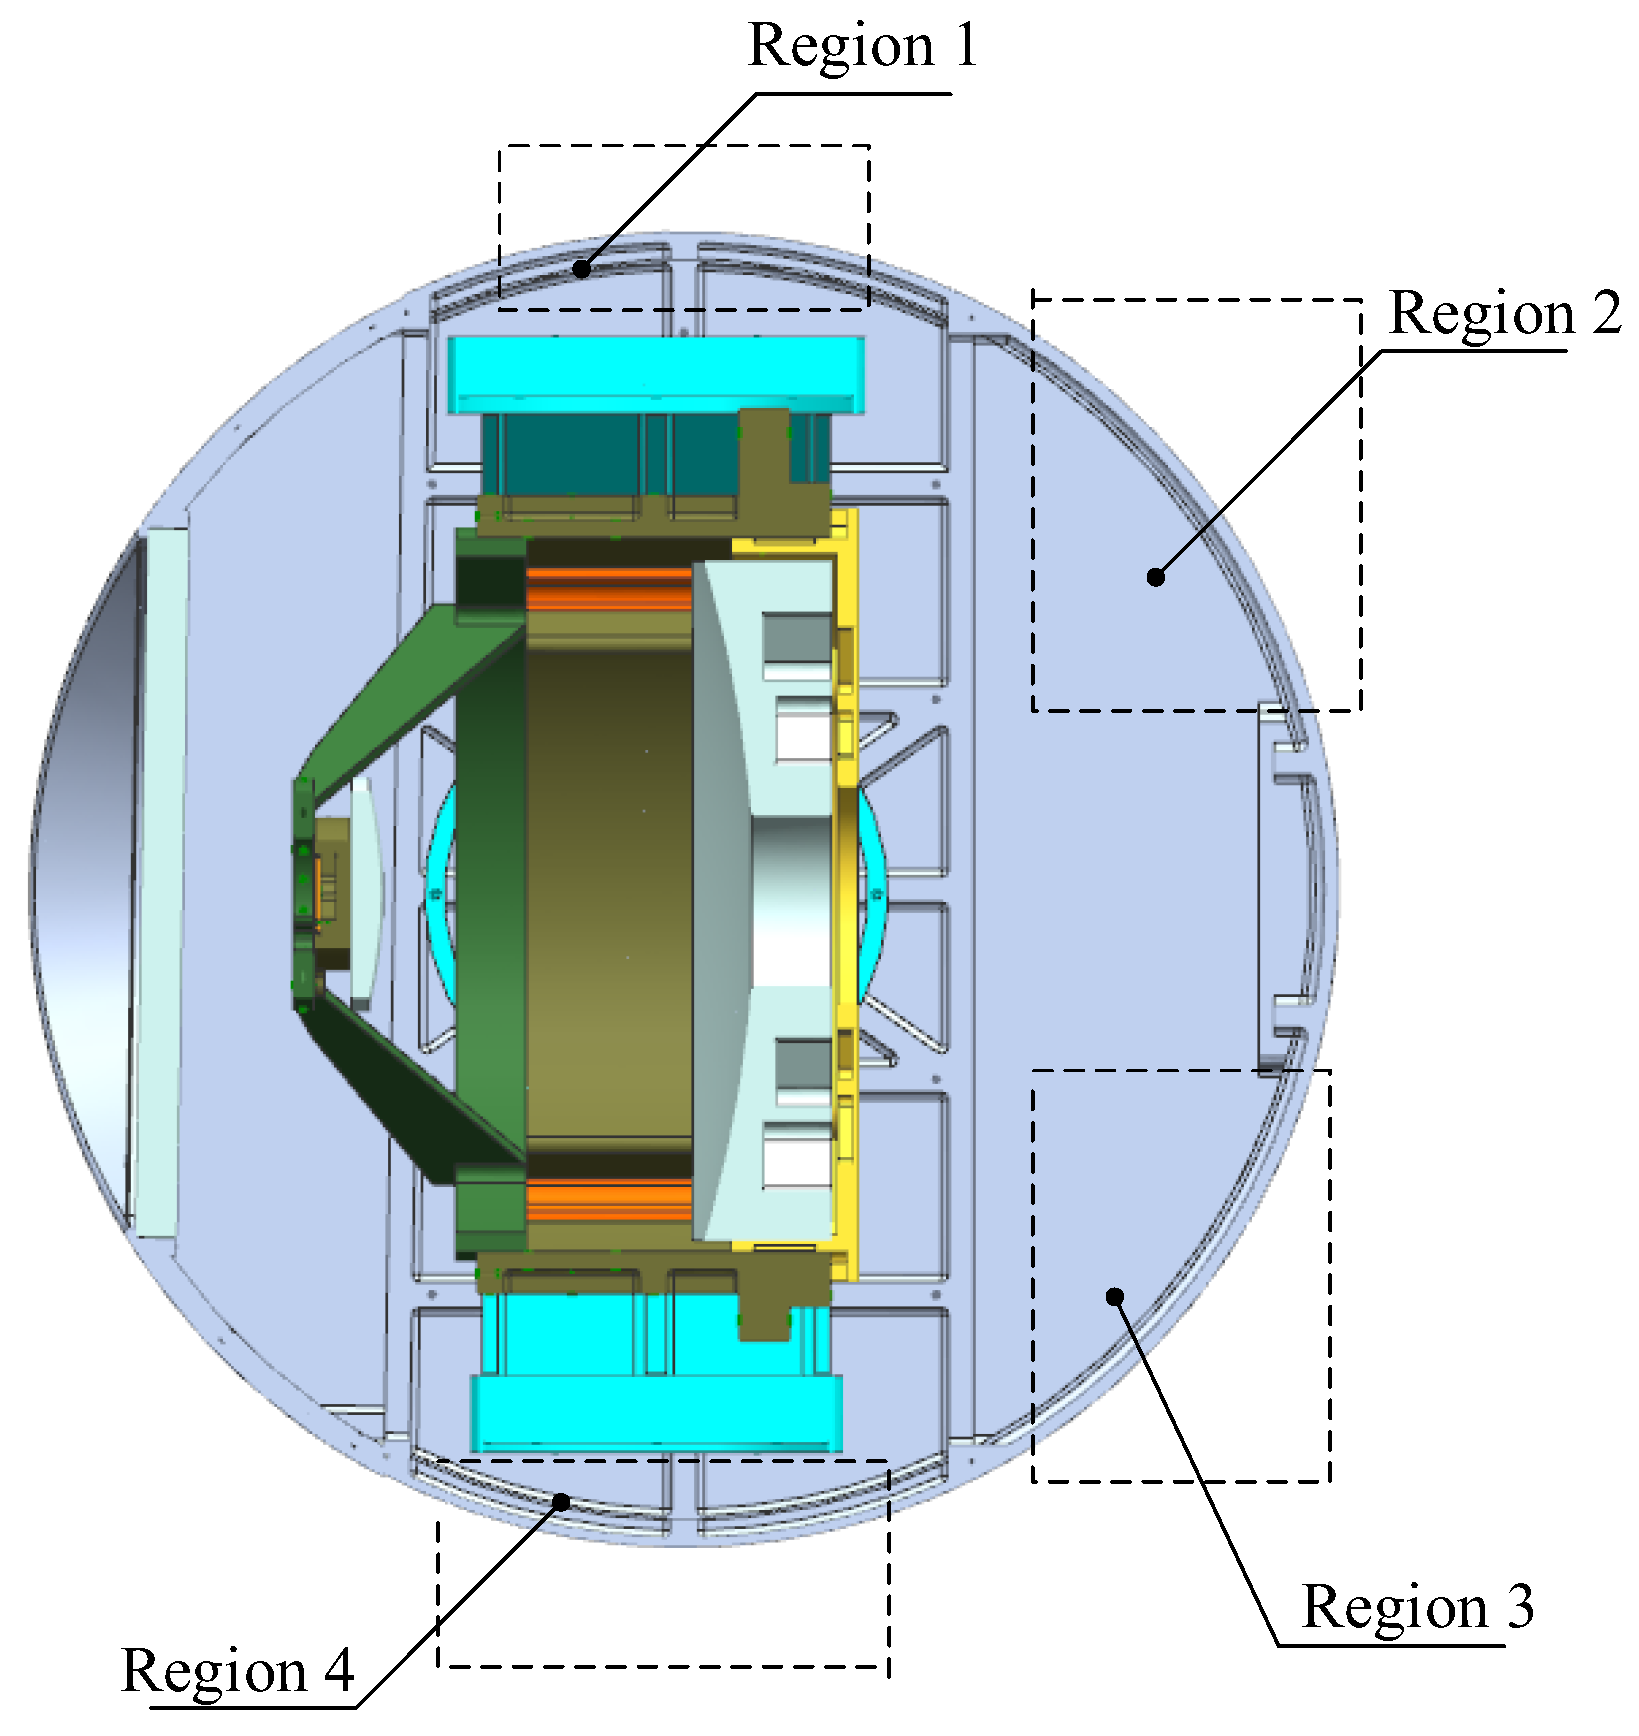
Figure 4. The insulation layer with a small thermal conductivity is bonded on the interior surface of the shell, reducing the rate of heat loss from the inside of EO to the external environment; The heating cover, a metal sheet made of large thermal conductivity, is connected to the shell. The heating cover is attached with a heating film, and the heat generated by the latter is evenly distributed on the heating cover, heating the opto-mechanical structure in a radiative manner. The temperature sensor is bonded on the back of the heating cover. In addition, considering that convection inside the cabin leads to high temperatures in the upper part and low temperatures in the lower part, active heating is divided into multiple zones, each zone having independent power control, as shown in
Figure 5. The heating power of Region 1 and Region 2 is lower than that of Region 3 and Region 4. When the cabin rotates, Region 1 and Region 2 will turn down, and Region 3 and Region 4 will turn up, the heating power of the corresponding area will be increased or decreased accordingly.
From
Figure 5, it can be observed that the view factor of the shell with respect to the primary mirror and secondary mirror is relatively small, indicating that the ratio of the radiation energy leaving shell that is intercepted by the primary mirror and secondary mirror is small. If a heating zone is set in front of the primary mirror (such as the front part of the shell, or the front part of the optic bench [
8,
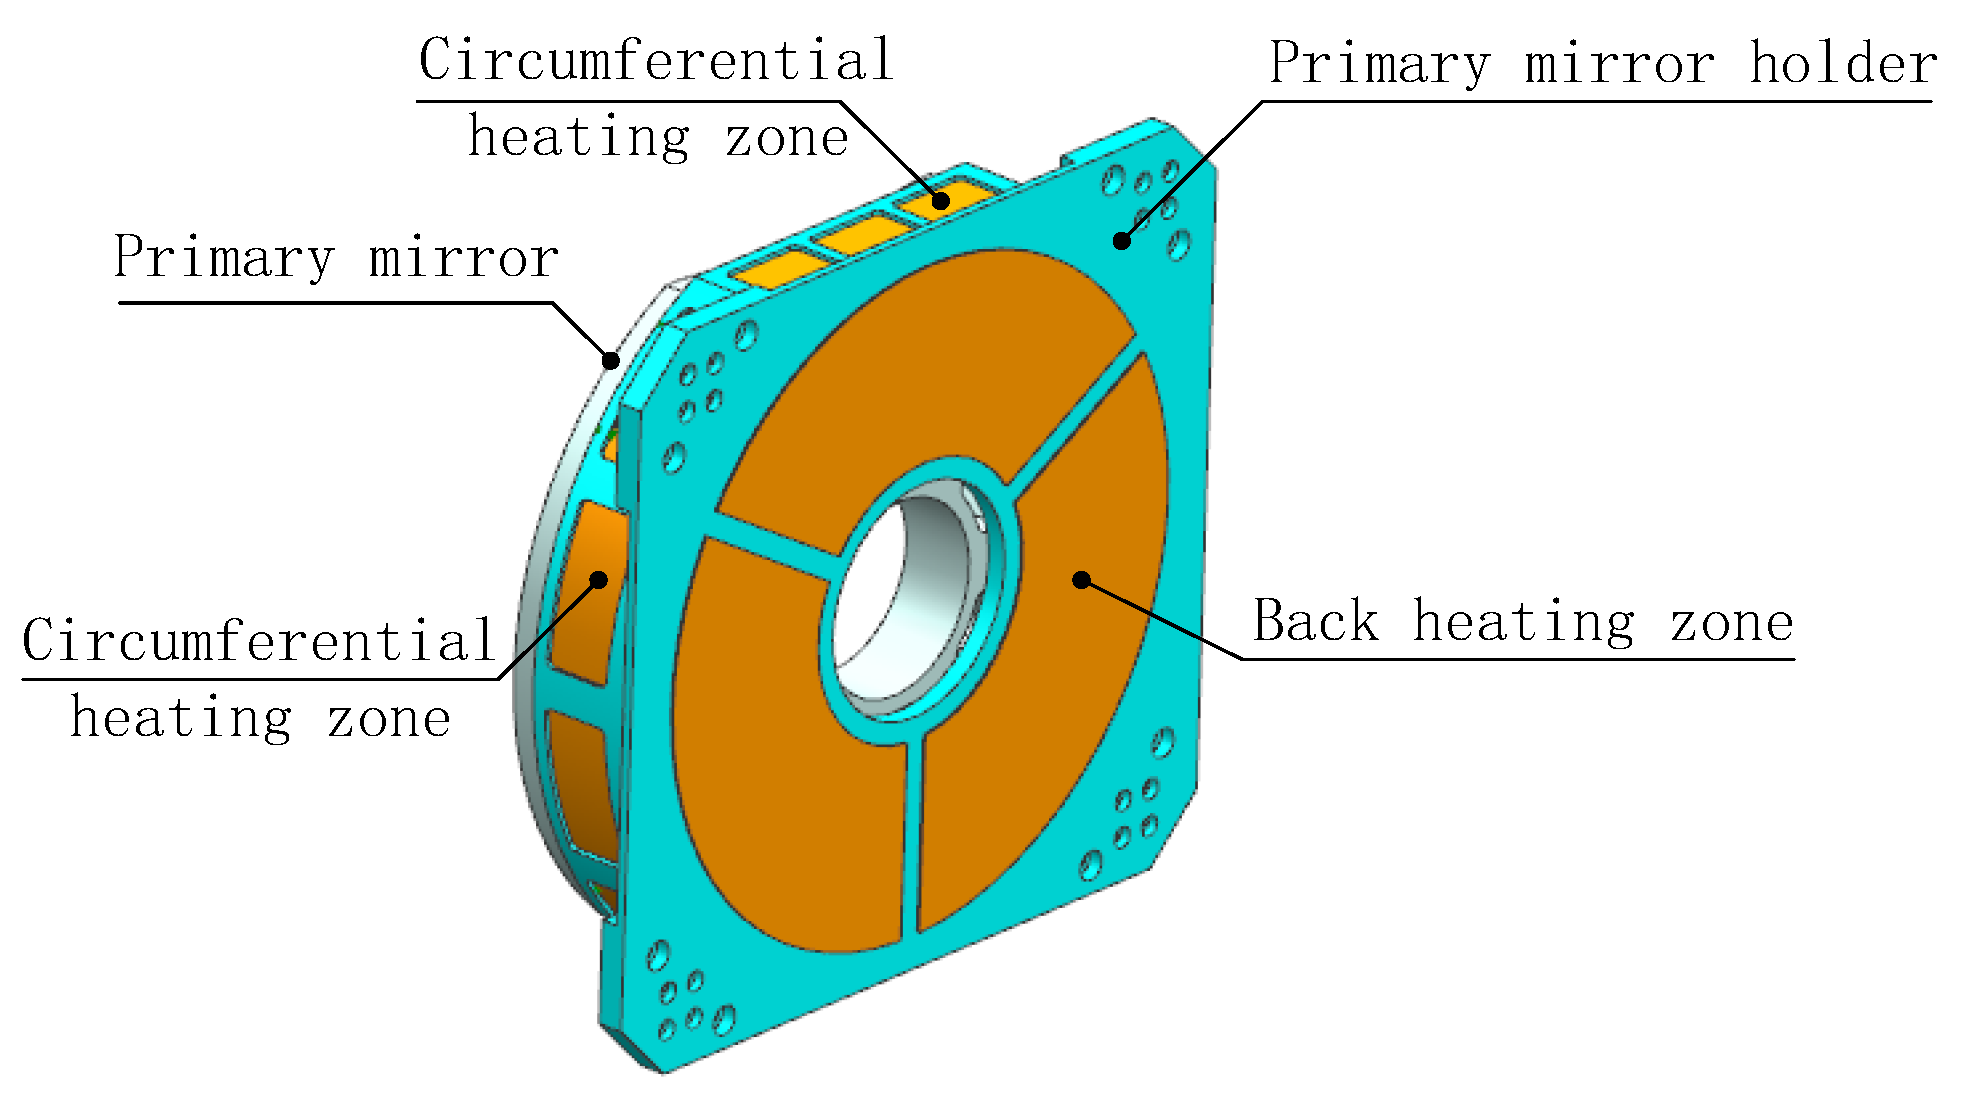
16]), although the view factor can be increased, it will cause uneven air temperature in front of the primary mirror, leading to fluctuations of the index of refraction and reducing image quality. To improve heating efficiency and ensure image quality, heating films are arranged in the circumference of the primary mirror holder, not protruding beyond the front edge of the primary mirror along the axis direction, as shown in
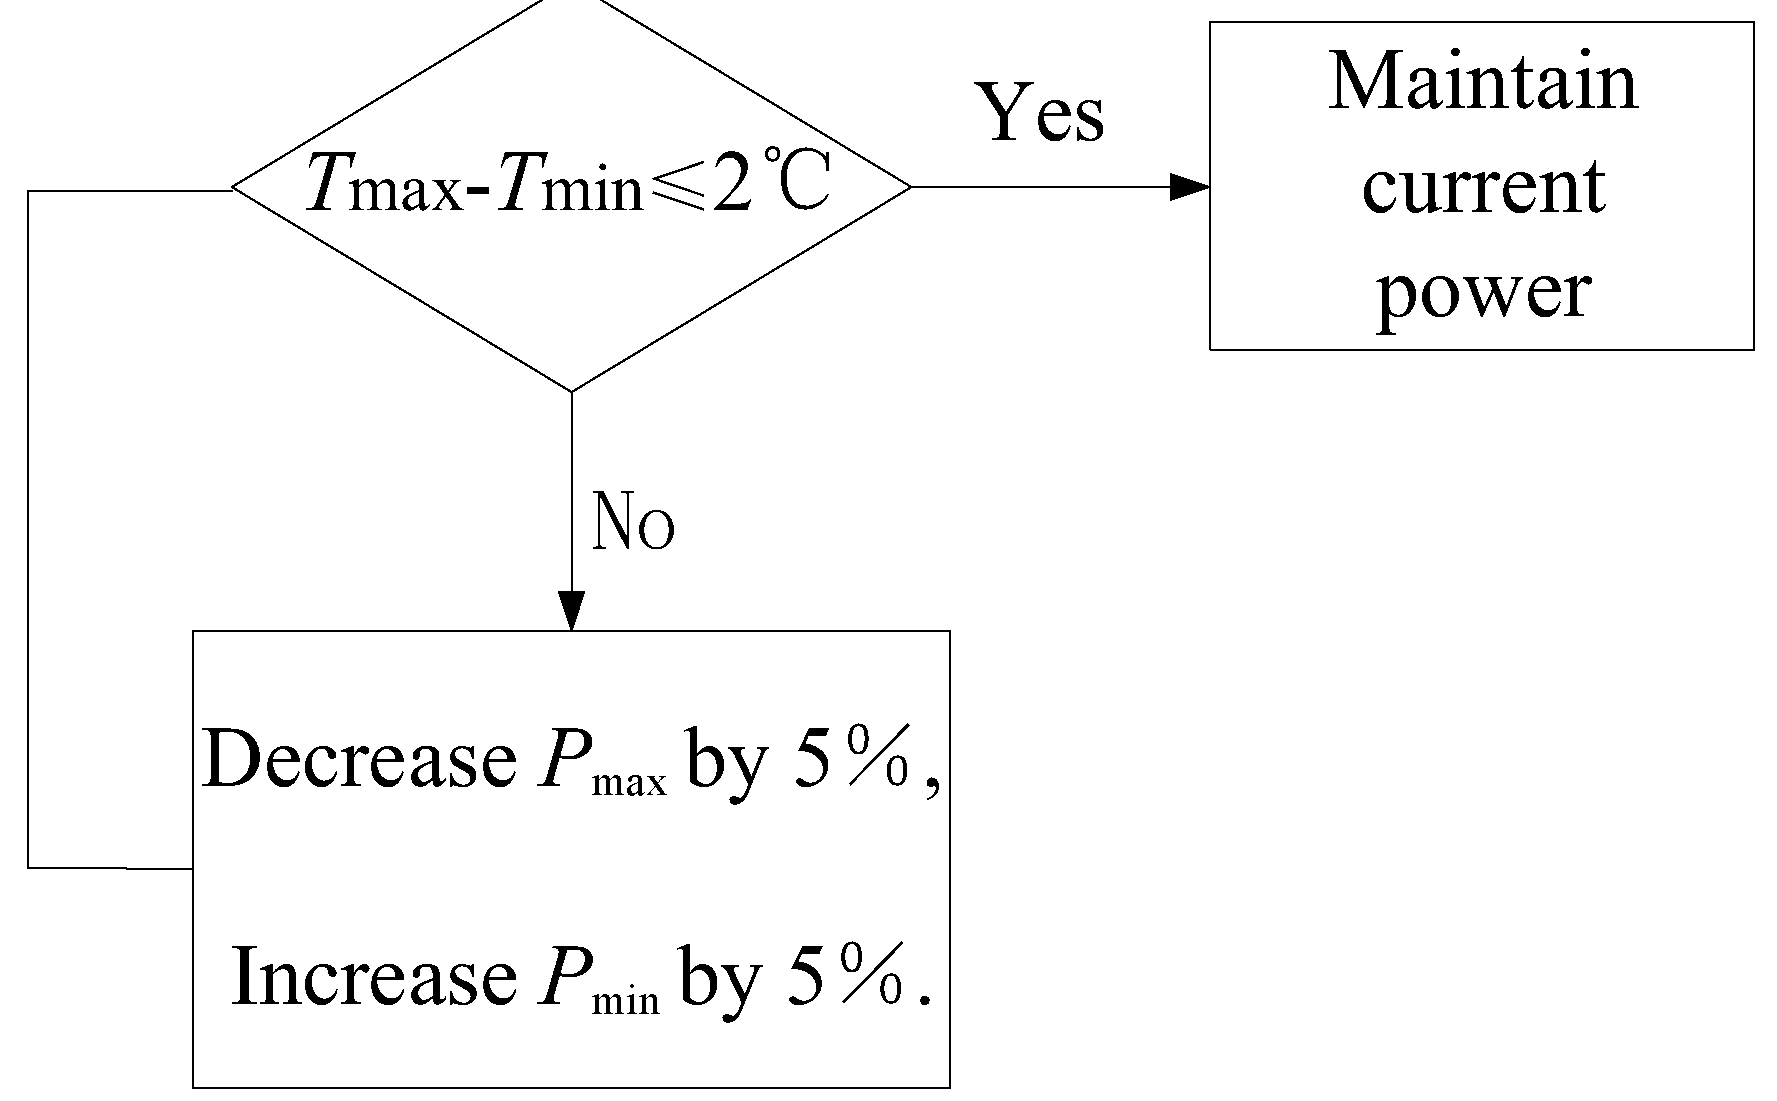
Figure 6. Like shell heating, the circumferential heating of the primary mirror holder is also divided into multiple zones, and sensors are arranged on the back and outer edge of the mirror to measure temperature. Considering the wide range of environmental temperature changes in practical use, the heating power of each zone is independently controlled through temperature negative feedback to obtain dynamic temperature adjustment and meet the thermal control needs within the working cycle. The maximum value of the measured temperature is
Tmax, the minimum value is
Tmin, and the corresponding zonal heating powers are
Pmax and
Pmin, respectively. Considering thermal inertia, when
Tmax-
Tmin≥2℃, adjust the heating power. After 30 seconds, measure, judge, and adjust the heating power again. The thermal control scheme is shown in
Figure 7.
By conducting the same analysis on the secondary mirror,
it was found that due to its smaller size, the convective heat transfer rate
on the reflective
surface is smaller. Under the same temperature uniformity requirements, the
allowable heating power
Psm is larger, which is equivalent to
. Therefore, heating
and temperature measurement are set on the back of the secondary mirror only.
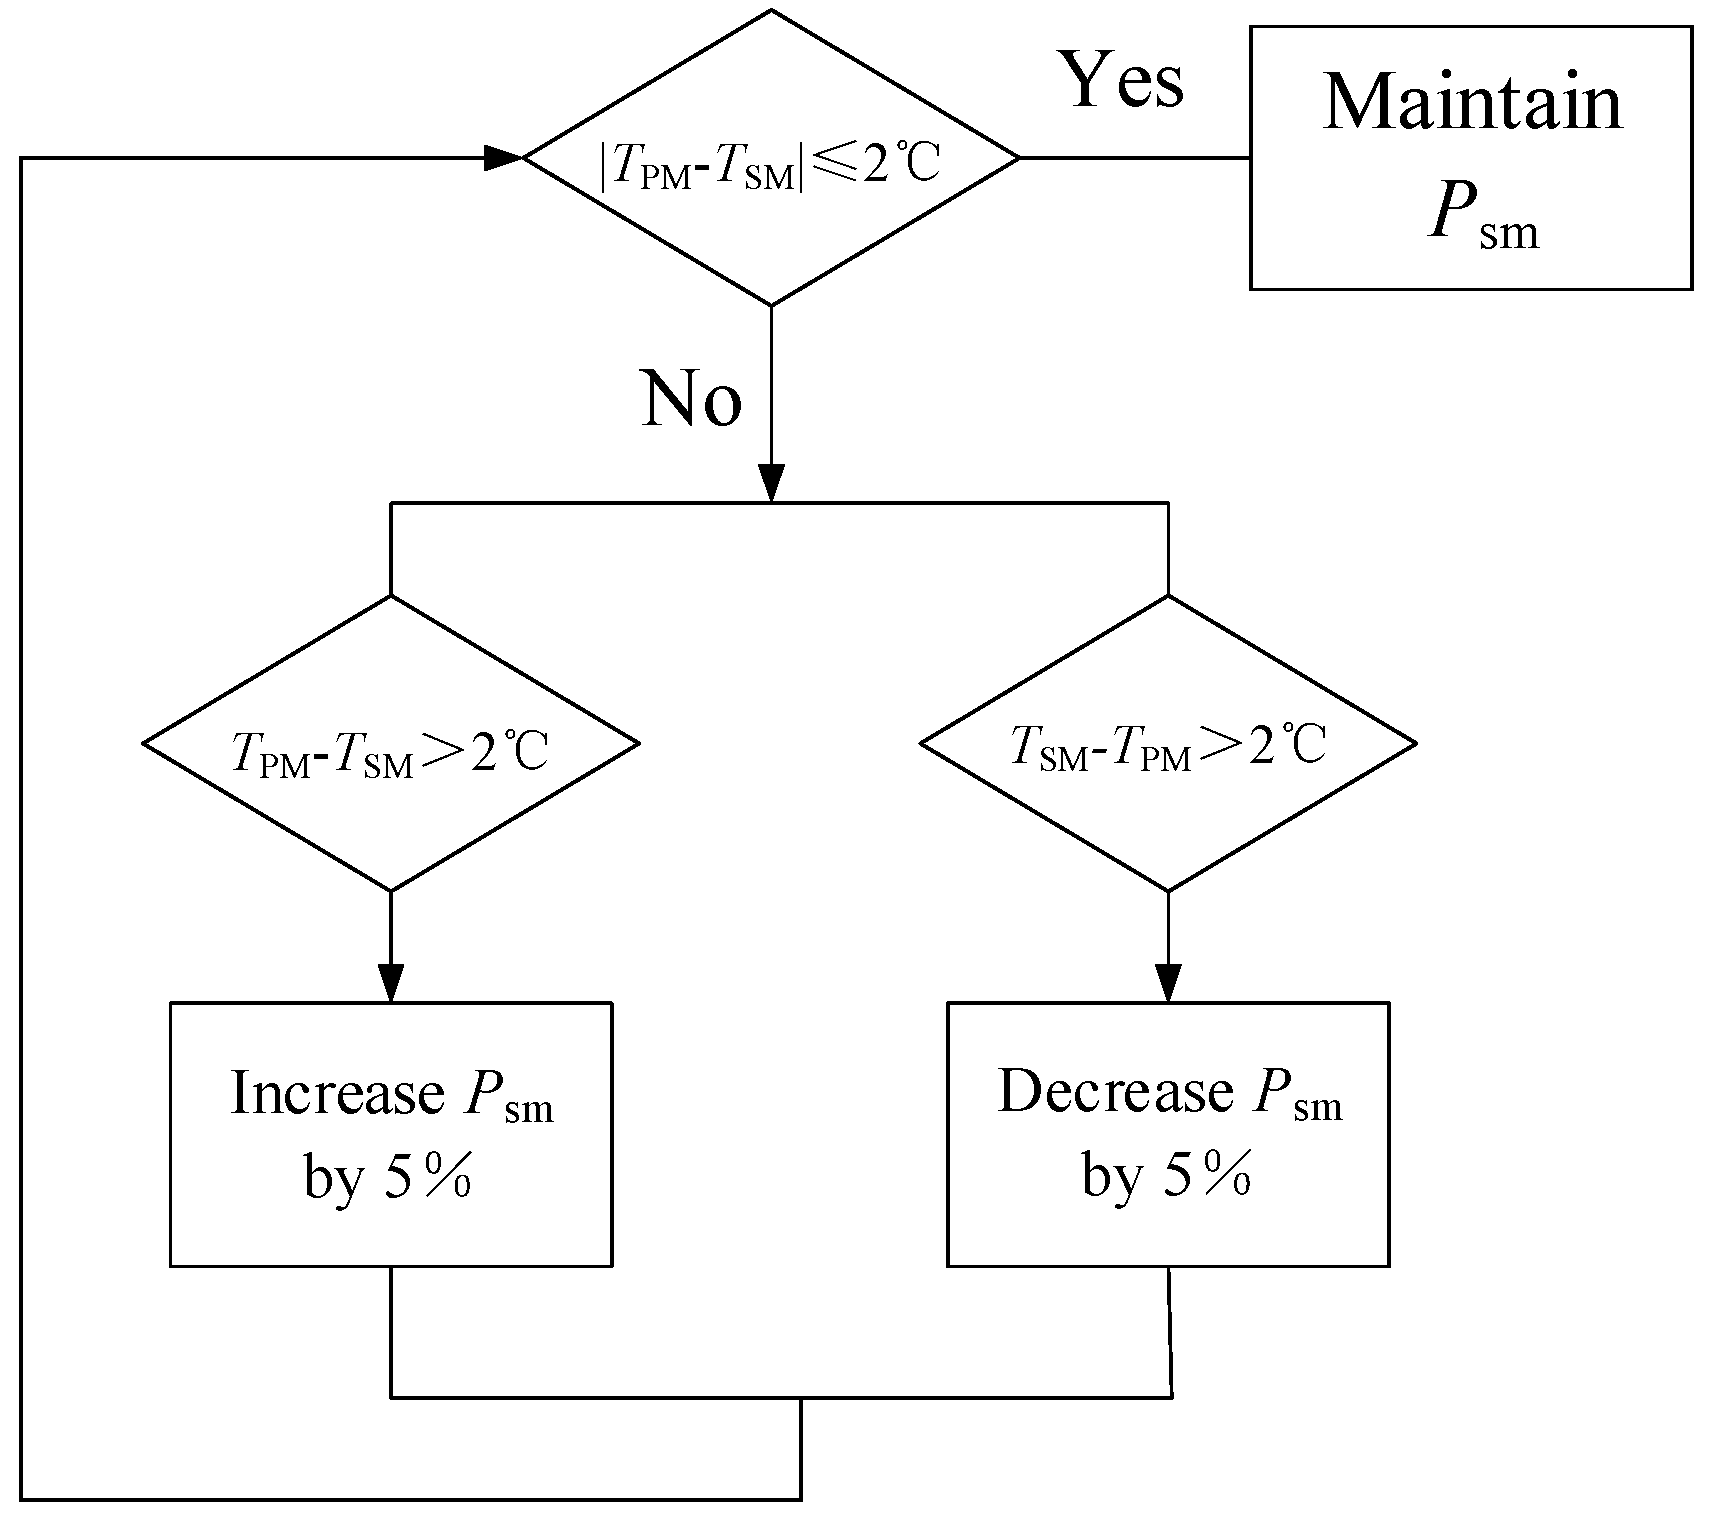
To control the temperature difference between the primary mirror and the
secondary mirror, a thermal control scheme as shown in
Figure 8 is adopted: first, the temperature
measured by the primary mirror is averaged as the temperature level
Tpm;
Secondly, compare the difference between the secondary mirror temperature
Tsm
and
Tpm, and adjust
Psm when |
Tsm-
Tpm|≥2℃; Measure the
temperature, judge, and adjust
Psm again after 30 seconds.


