3.1. Annual and long-term changes in SST
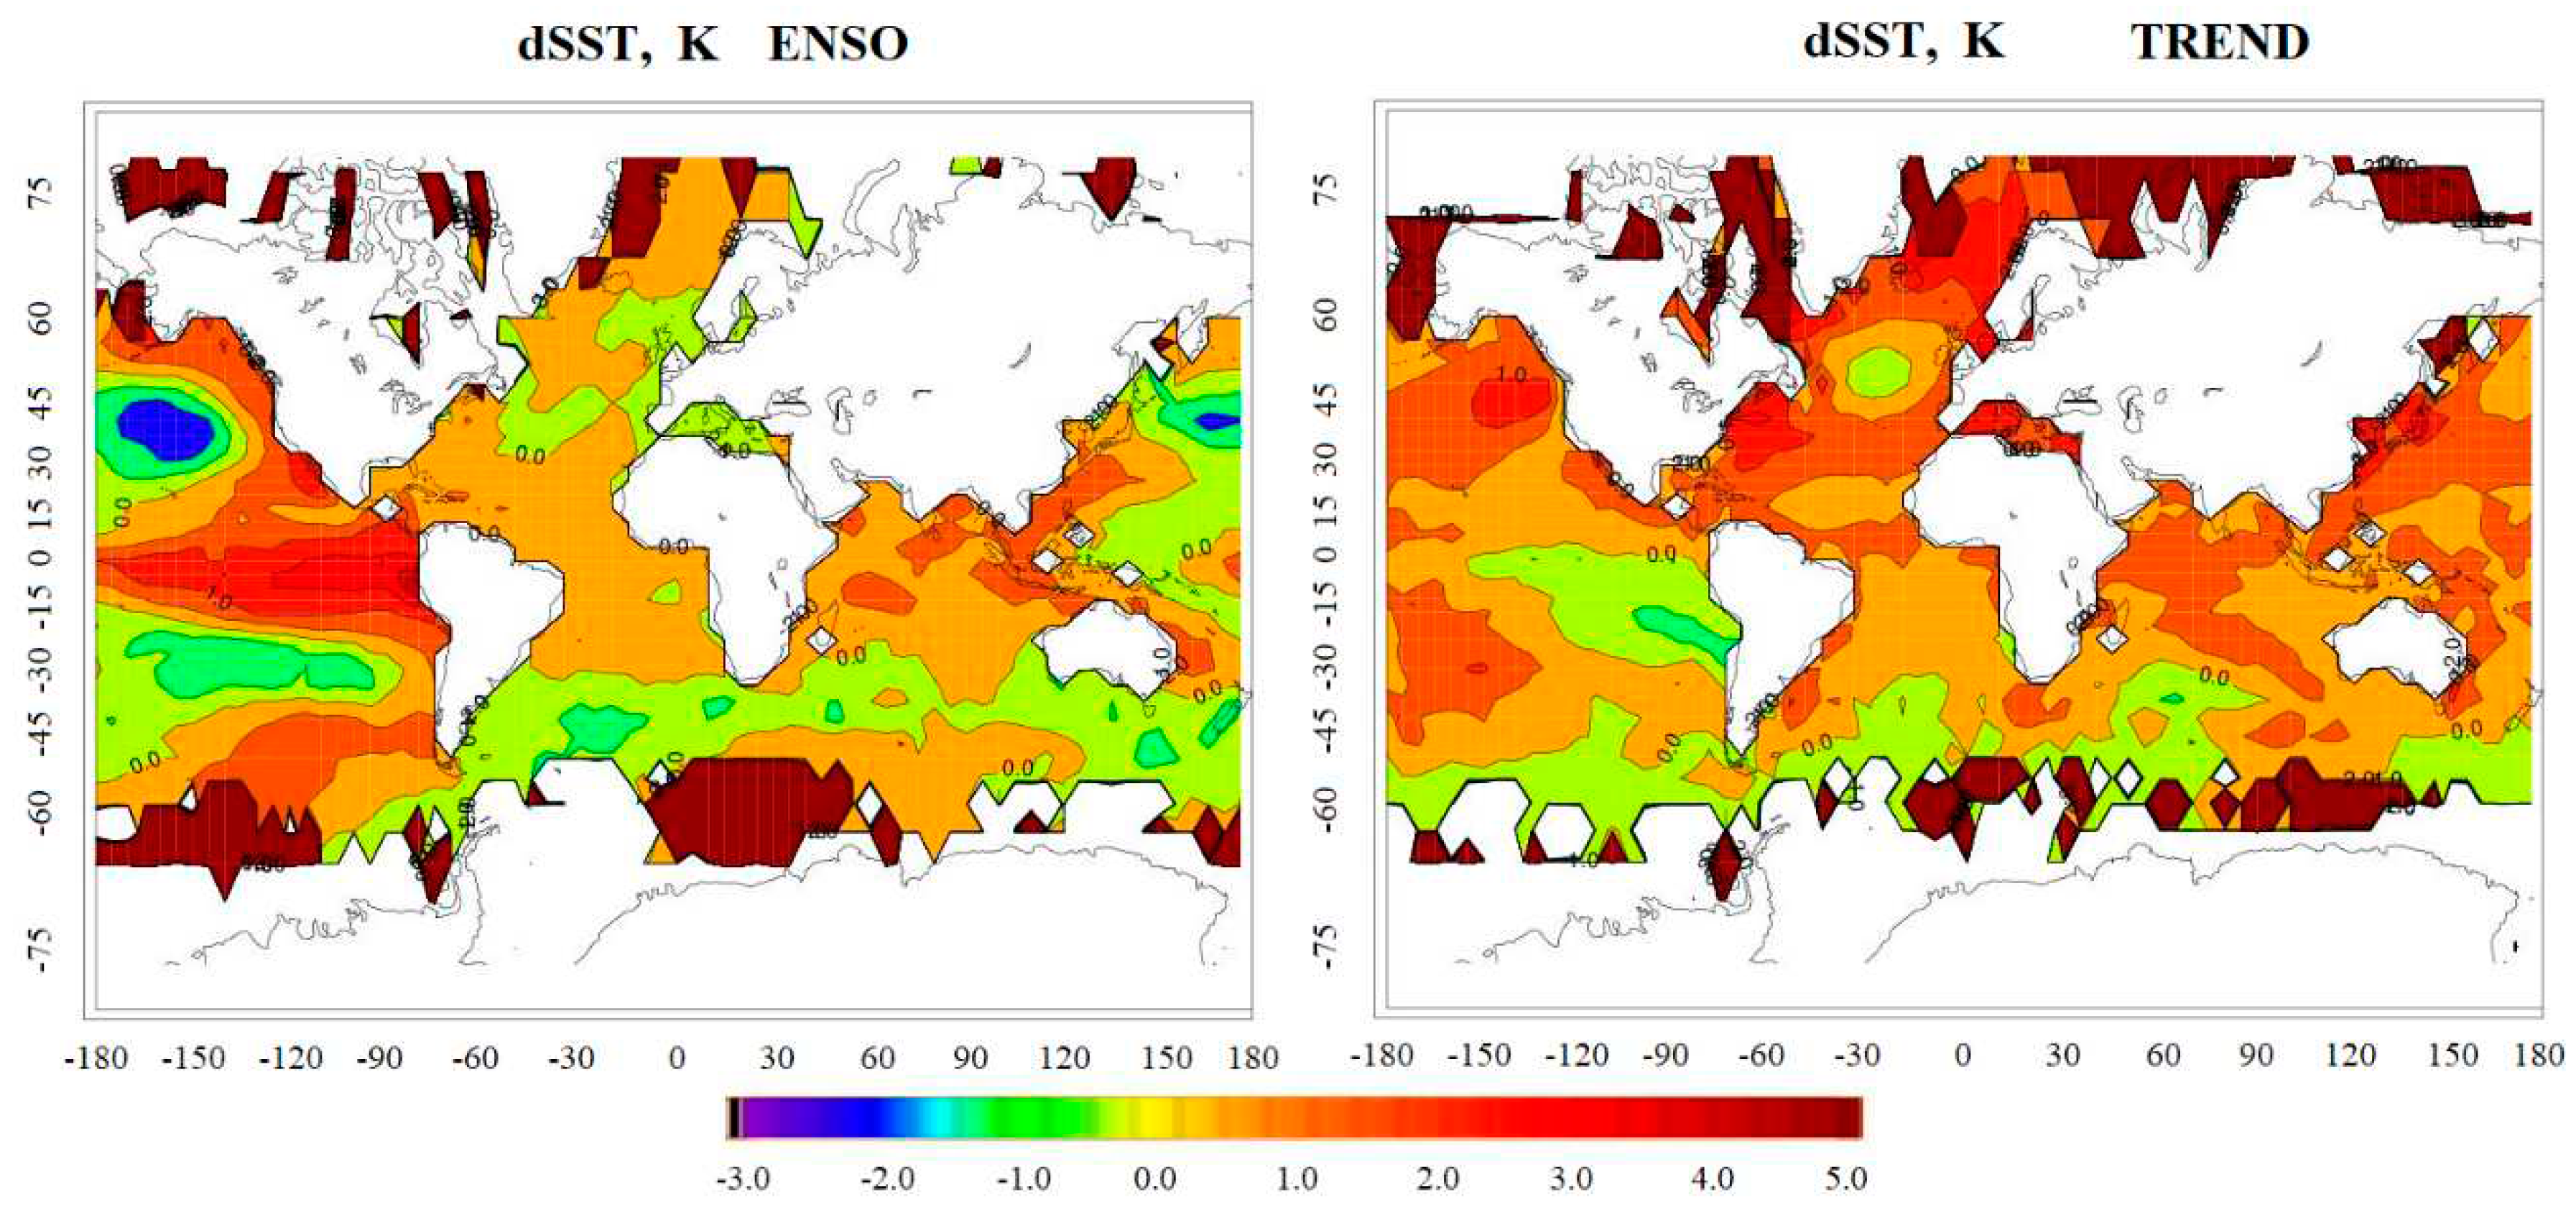
Figure 1 (left) shows the difference in SST between the three years with the most pronounced El Niño and La Niña phases according to Met Office data. As expected, the maximum difference between the ENSO phases is observed in the tropical and subtropical parts of the Pacific Ocean. Moreover, while in the tropics there is a significant excess of up to 4 degrees for the El Niño phase compared to the La Niña phase, in the subtropics, on the contrary, the SST during the El Niño phase is up to 2 degrees lower than during the La Niña phase. Such temperature differences have the potential to influence both sea currents and SST changes in other regions, as well as atmospheric circulation through changes in vertical temperature gradients.
Figure 1 (right) shows the Met Office SST differences between the end and beginning of the 1980-2020 climate period. As can be seen, at the end of the period the global average SST is 0.5-1.0 degrees Celsius higher than at the beginning of the period, which is most likely due to an increase in greenhouse gases. The exception is the area of the Pacific Ocean near South America, where a 1.0 degree decrease in SST is observed, indicating ocean cooling in the ENSO zone over the last 40 years. Also a decrease of SST by the end of the period is observed near the Antarctic. This decrease in SST may be related to the melting of Antarctic ice, which brings cold fresh water into the ocean. Also the decreased SST in some areas (especially in the tropics near Africa and Indonesia) can be connected with the increased cyclonic activity and increased cloudiness and precipitation in these areas In addition, areas of strong increase in SST in the polar zones attract attention both when comparing ENSO phases and when comparing the end and beginning of the climatic period. These areas of strong SST difference can be related to the difference in the area of sea ice coverage, since only the SST in cells with free water in at least half of the cell area was taken into account.
Comparison of the SST differences for different ENSO phases, as well as for the end and beginning of the considered climatic period, shows that due to changes in both the horizontal and vertical air temperature gradients due to the influence of the underlying sea surface, the heat and mass fluxes between the ocean and the atmosphere may change to different degrees in different regions of the Earth. This can affect heat and mass transport both between neighboring regions and in the vertical direction. In addition, changes in the regional circulation also affect the general atmospheric circulation, creating the potential for remote effects. In the present work, special attention is paid to the influence of SST variability, which, as can be seen from Fig. 1, is maximal in tropical and subtropical regions, if we ignore artifactual changes in polar regions due to different ice coverage, on processes in polar regions.
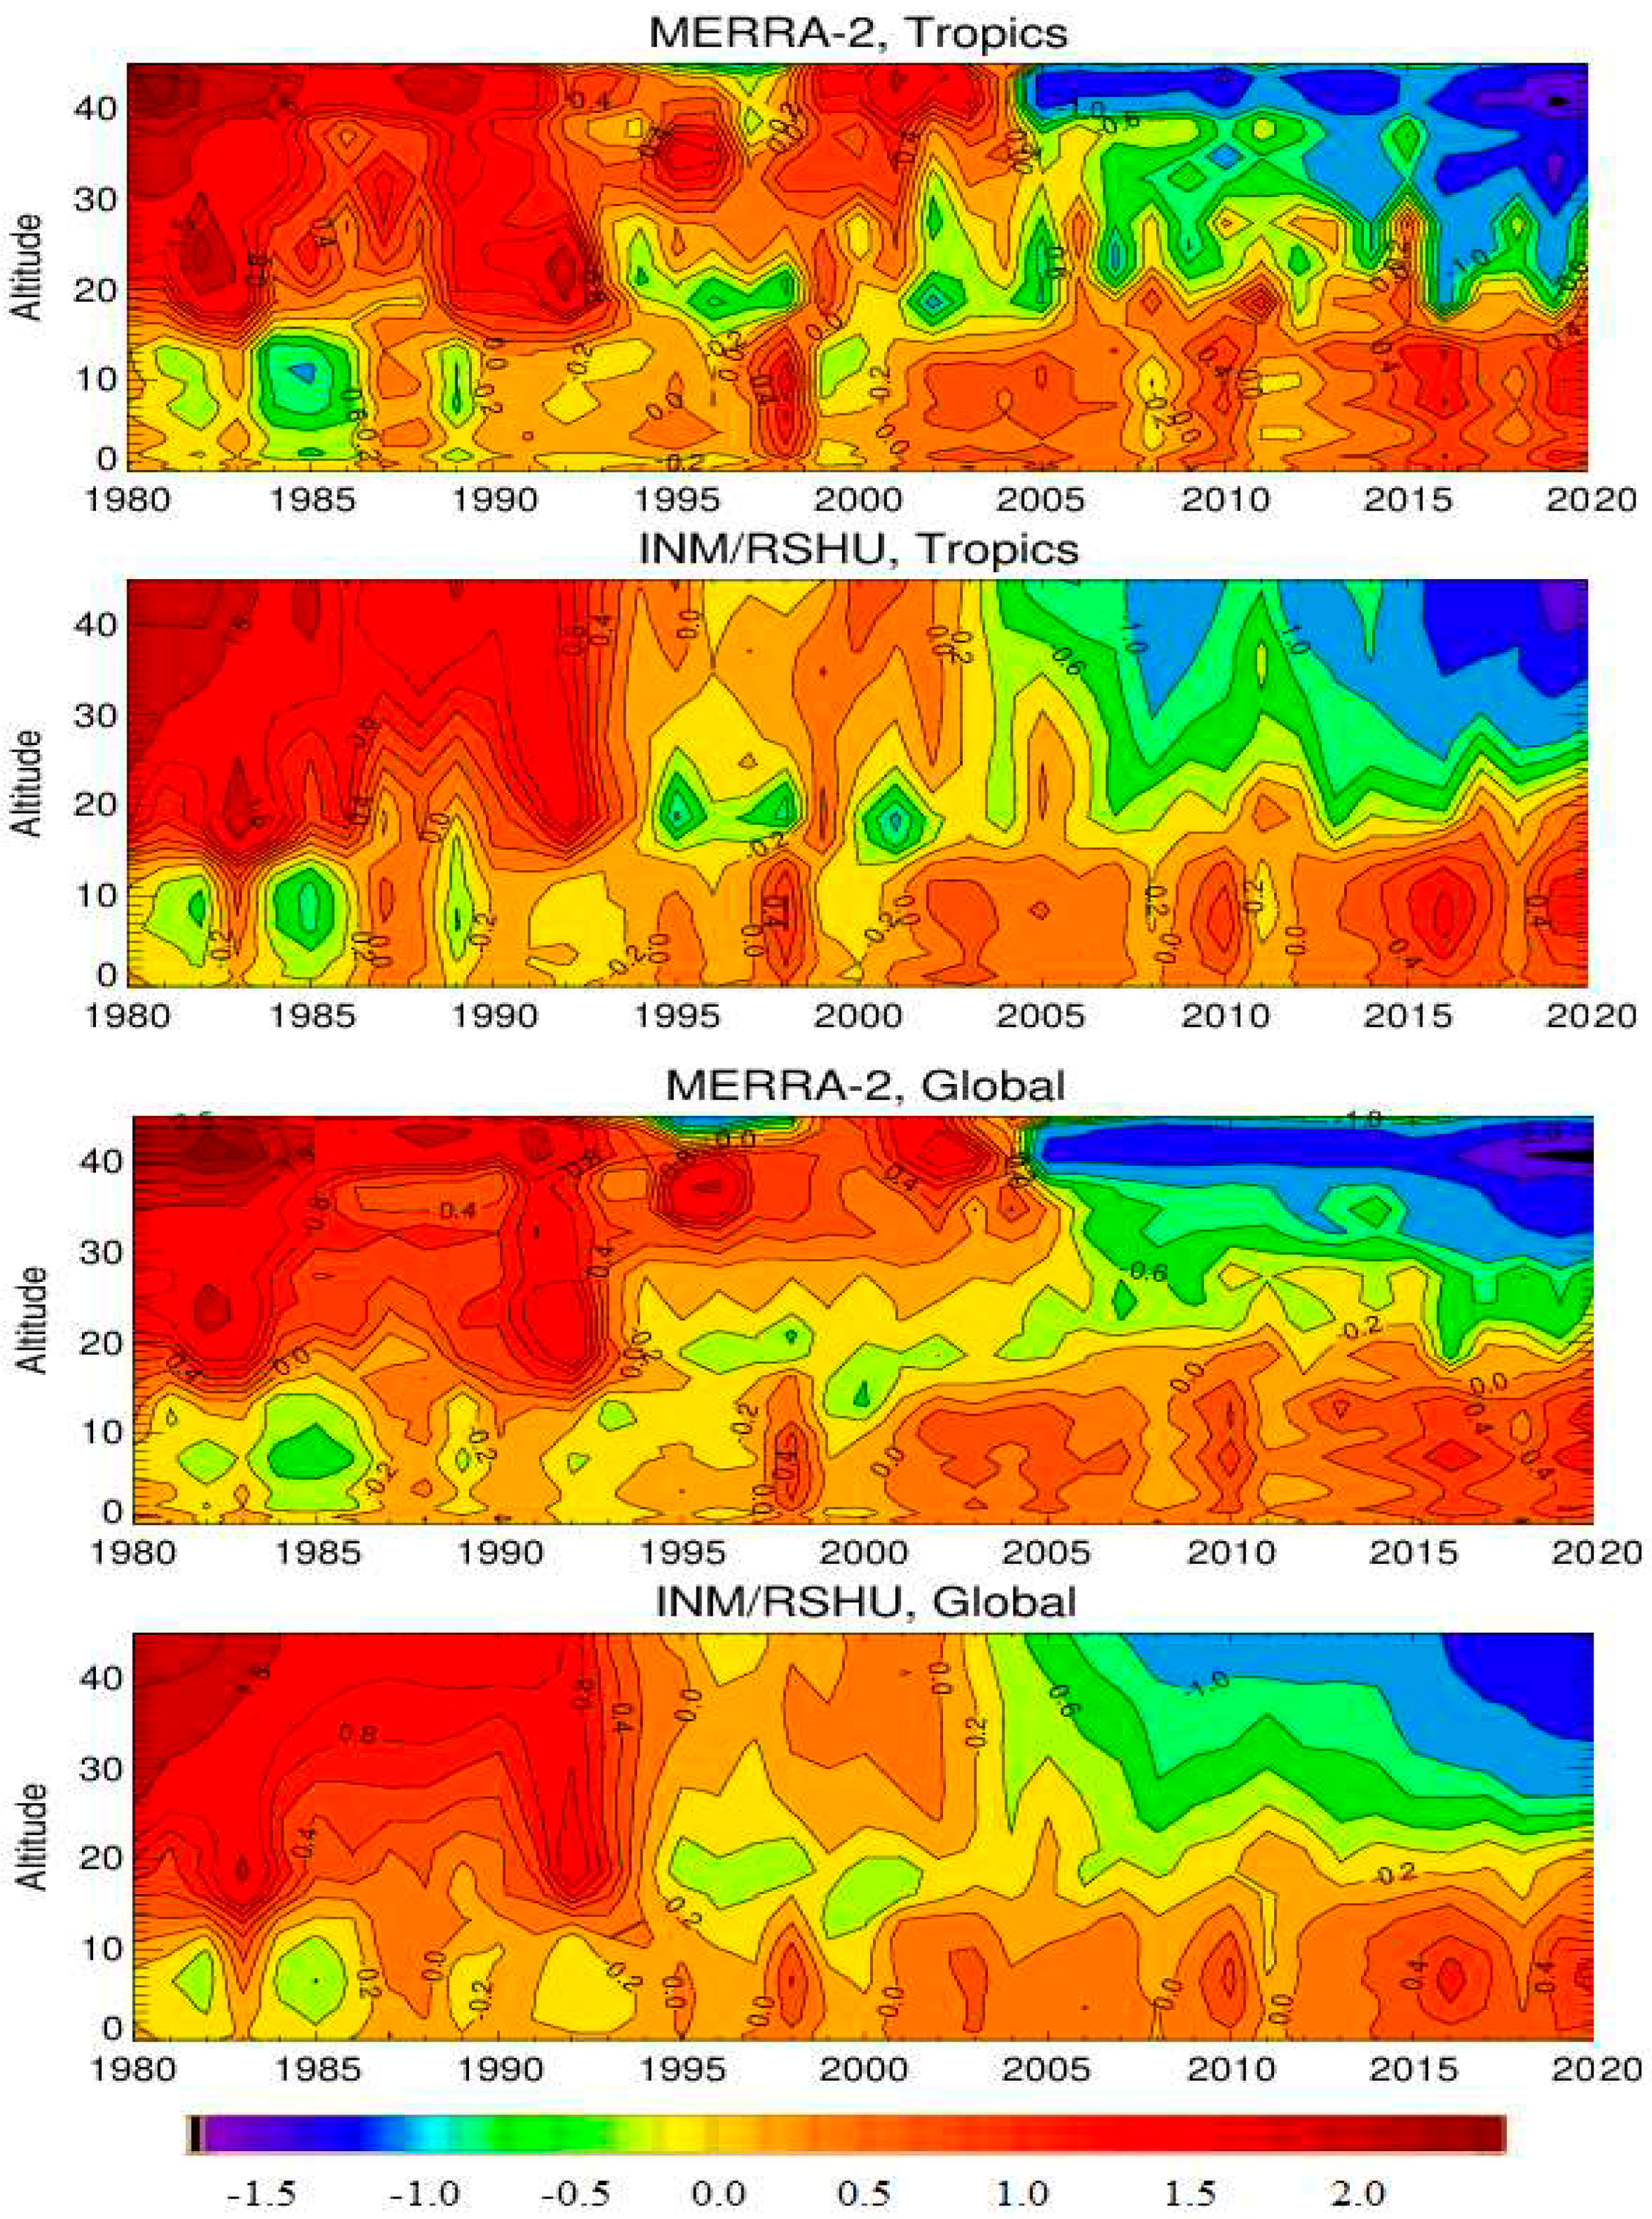
Figure 2 presents the altitudinal variability of atmospheric temperature anomalies compared to the average values for the period 1980-2020. Fig. 2a and 2c present the MERRA-2 reanalysis data for the tropics and global scale, respectively, and Fig. 2b and 2d present similar results obtained from calculations using the INM RAS-RSHU CCM. The modeling results, in general, agree quite well with the reanalysis data both in the tropical zone and on a global scale. Both reanalysis and CCM data show warming during the study period up to tropopause heights (temperature increase by 0.5-1.0 degrees Celsius from 1980 to 2020 at heights up to 15-17 km), and stratospheric cooling (temperature decrease by 1.0-1.5 degrees Celsius above the tropopause). Against the background of the general trend, one can also observe temperature anomalies in the 0-20 km layer associated with ENSO, which are more pronounced in the tropical zone (
Figure 1 and
Figure 2), but they are also visible on a global scale (
Figure 3 and
Figure 4). It can be seen that both the positive anomalies of atmospheric temperature associated with the El Niño phase and its negative anomalies associated with the La Niña phase are more strongly manifested not near the surface, where heat exchange with the sea takes place, but at heights of about 10 km. This effect is noticeable not only in the tropics, where it can be explained by the developed convective motions, but also in the extratropical latitudes, which once again emphasizes the role of the circulation processes affecting long-range communications in the atmosphere.
The noted different changes in the SST in different latitude and longitude belts can influence the changes in the general atmospheric circulation, heat and mass transport, and, consequently, the temperature and gas composition of the atmosphere, which confirms the previous studies [
12,
57,
58], also the air temperature data are in full agreement with the reanalysis data, which is also shown in [
12,
57,
58]. To analyze the sensitivity of atmospheric parameters to short- and long-term changes in the SST, the following sections present the CCM-calculated changes in temperature, ozone content, and dynamical parameters affecting heat and mass transport and the polar vortex.
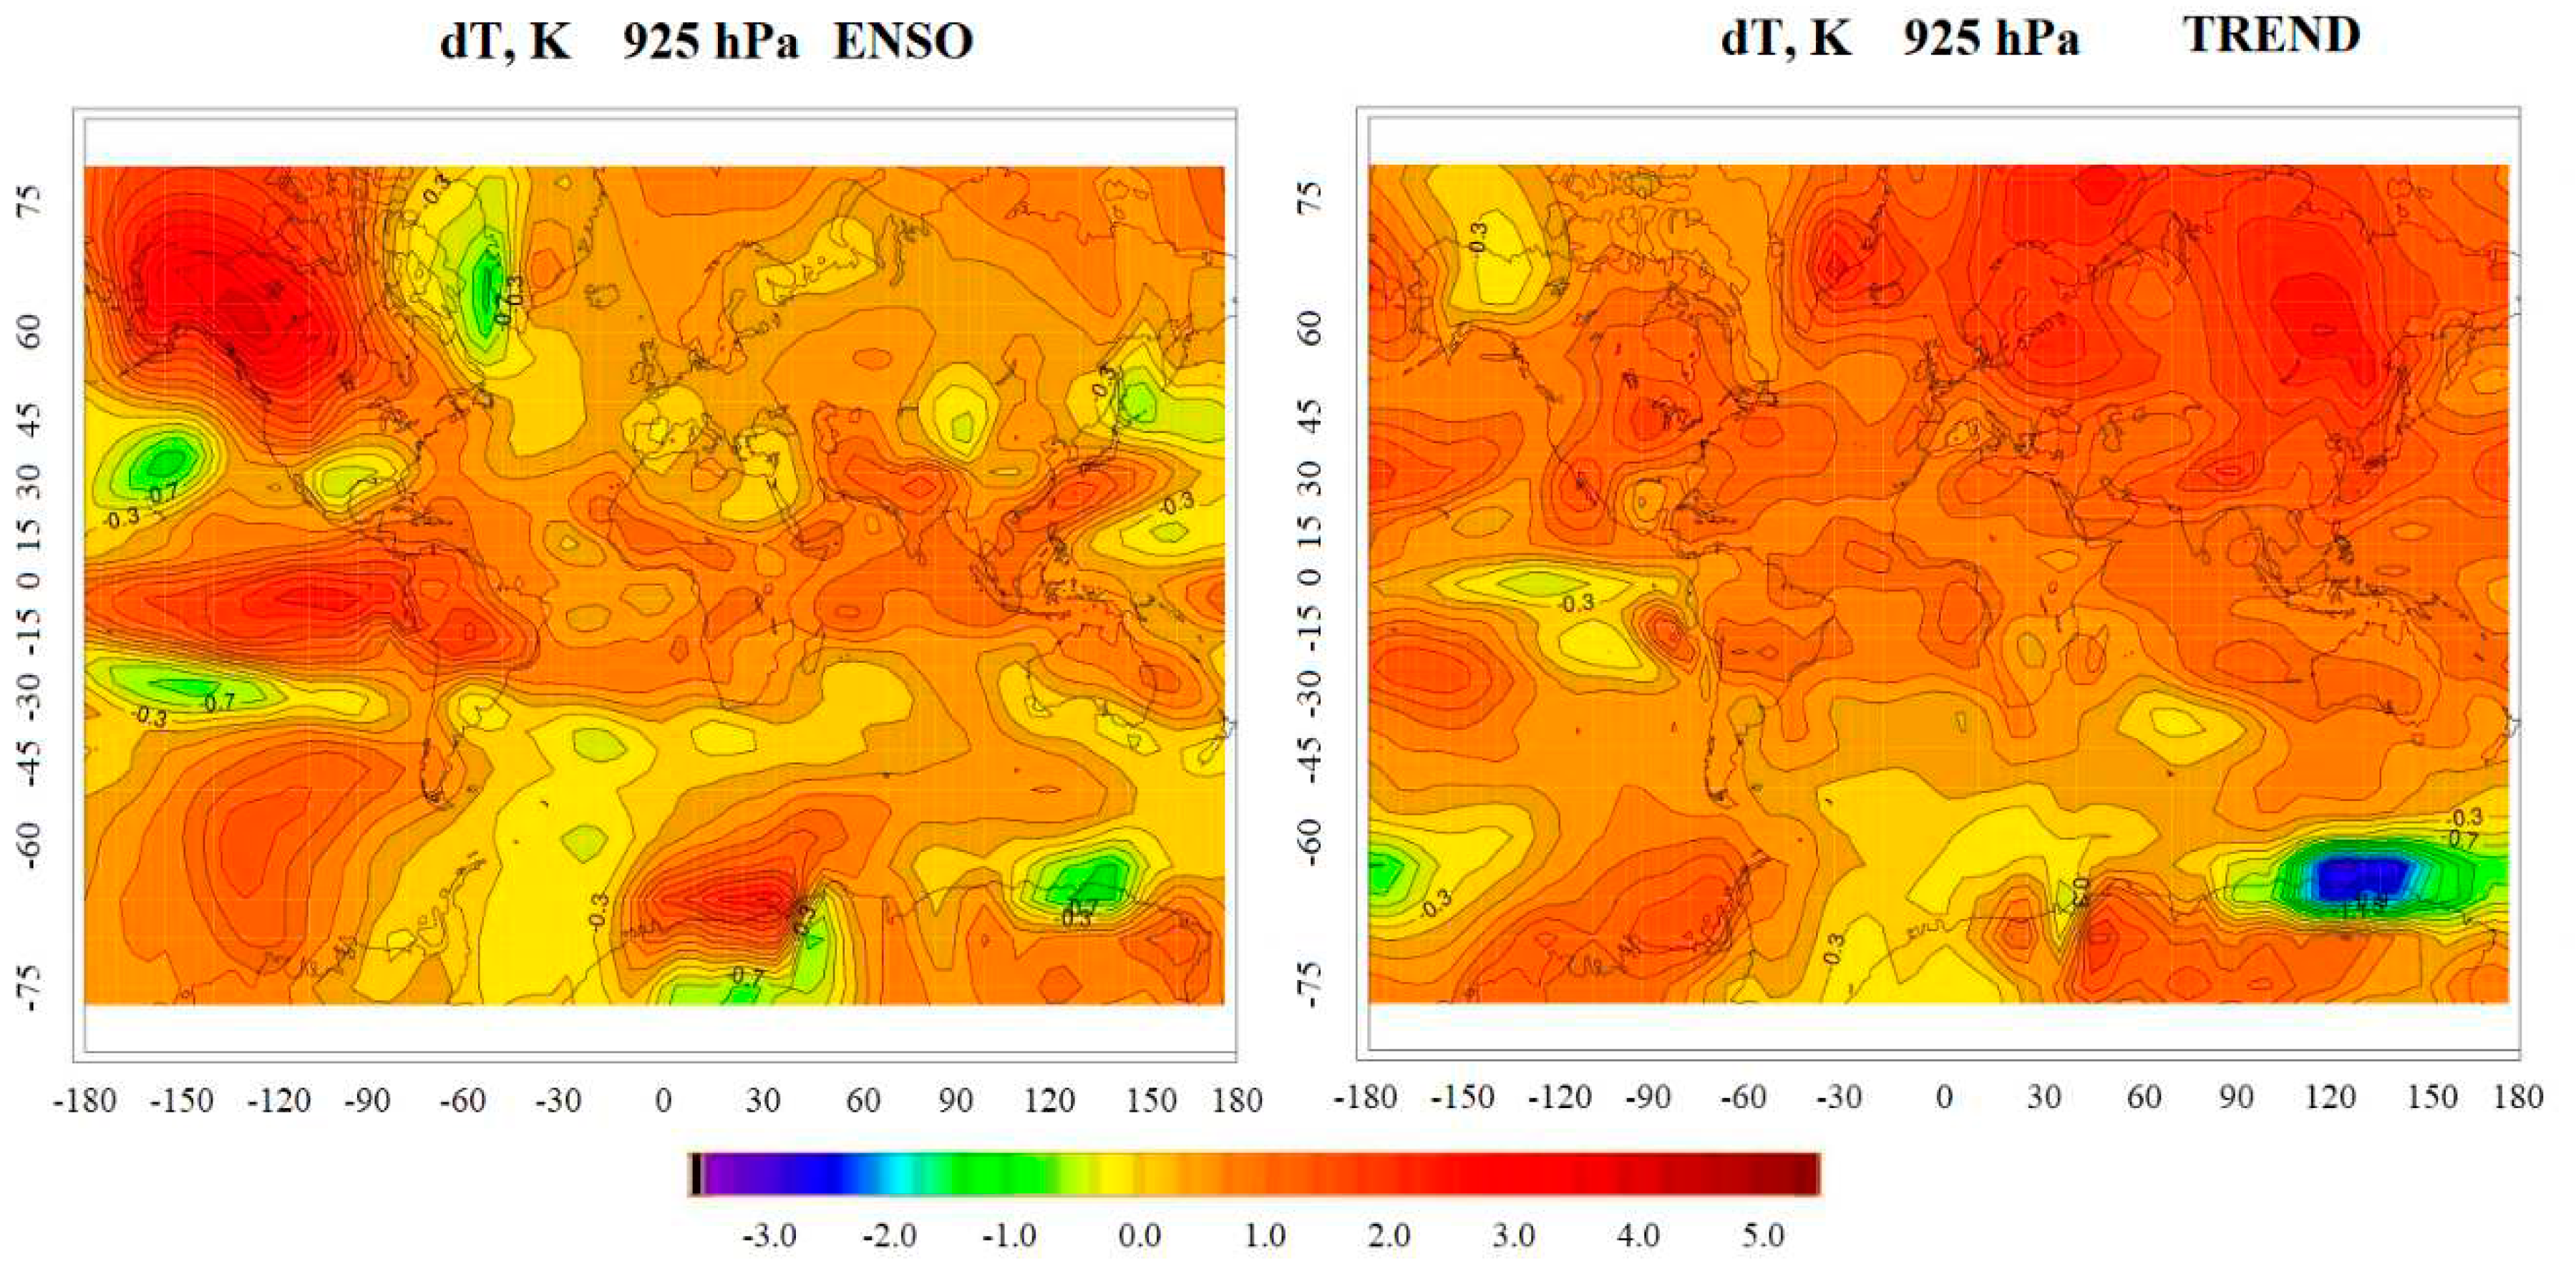
Figure 3 (left) presents air temperature differences in the lower troposphere based on modeling results for scenarios with El Niño and La Niña phases. As can be seen, there is a 2-3 degree increase in air temperature in the equatorial Pacific Ocean, and a 0.6-1 degree decrease at 20-45 latitudes in the Pacific Ocean during El Niño. There is also a powerful 3 degree increase over Alaska, and a 1 degree excess over the Pacific Ocean near Antarctica. This means that during El Niño there is a strong atmospheric heat flux in the equatorial Pacific and over the Arctic, and a weaker one over Antarctica. This may indicate a deepening of the Aleutian Minimum in the Northern Hemisphere due to El Niño, as well as an enhanced heat flux to the Arctic stratosphere. The warming of the troposphere during El Niño leads to the intensification of temperature contrasts between the tropics and polar latitudes, which contributes to the intensification of cyclonic activity in the middle latitudes of the Pacific Ocean. The heat trapped in the upper troposphere by cyclones can penetrate into the lower stratosphere and contribute to HSP. It can also be seen that the air temperature decreases by 0.6 degrees in the Atlantic near Greenland, and by 0.5 degrees in the Atlantic near Antarctica, and by 1.0 between Australia and Antarctica.
Figure 3 (right) shows the differences of air temperature in the troposphere based on the modeling results for the end and beginning of the trend scenarios. As can be seen, an increase in air temperature of 0.6-1 degrees Celsius is observed over most of the planet. However, in the area of Antarctica and to the west of South America there are centers of air temperature decrease by 0.6-1 degrees Celsius, as well as near Antarctica in the area of Australia (by 2 degrees Celsius). This means that, on average on the planet, there is warming in the troposphere. The strongest increase in air temperature (by 1.5-2 degrees) is observed in the Arctic, which indicates the so-called "Arctic amplification" [
46,
47]. [
46,
47]. In general, tropospheric air temperature correlates well with SST, (
Figure 2, top) the correlation coefficient is 0.9. This indicates that changes in SST play a key role in changes in tropospheric air temperature - as SST increases, the troposphere warms. This is due to the fact that an increase in SST contributes to increased heat fluxes into the atmosphere and convection, resulting in climate warming.
Figure 3.
Lower tropospheric temperature between 3 years of El Niño (1983, 1998 and 2016) and 3 years of La Niña (1989, 2000 and 2011) (left) and between 3 years with ENSO neutral phase at the end of the climate period (2014, 2017 and 2020) and 3 years at the beginning of the period (1981, 1982 and 1986) from CCM simulations (right).
3.2. Impact of ENSO on stratospheric processes
This chapter presents the results of numerical experiments using the INM RAS-RSHU CCM. In these experiments, the SST data for the years El Niño and La Niña were used, and the differences of the mean values for El Niño and La Niña were calculated. The other factors (solar activity, changes in the gas composition of the atmosphere due to emissions and absorptions, etc.) were fixed at the 2020 level. This makes it possible to conduct a pure experiment allowing us to evaluate the influence of ENSO on the stratospheric processes.
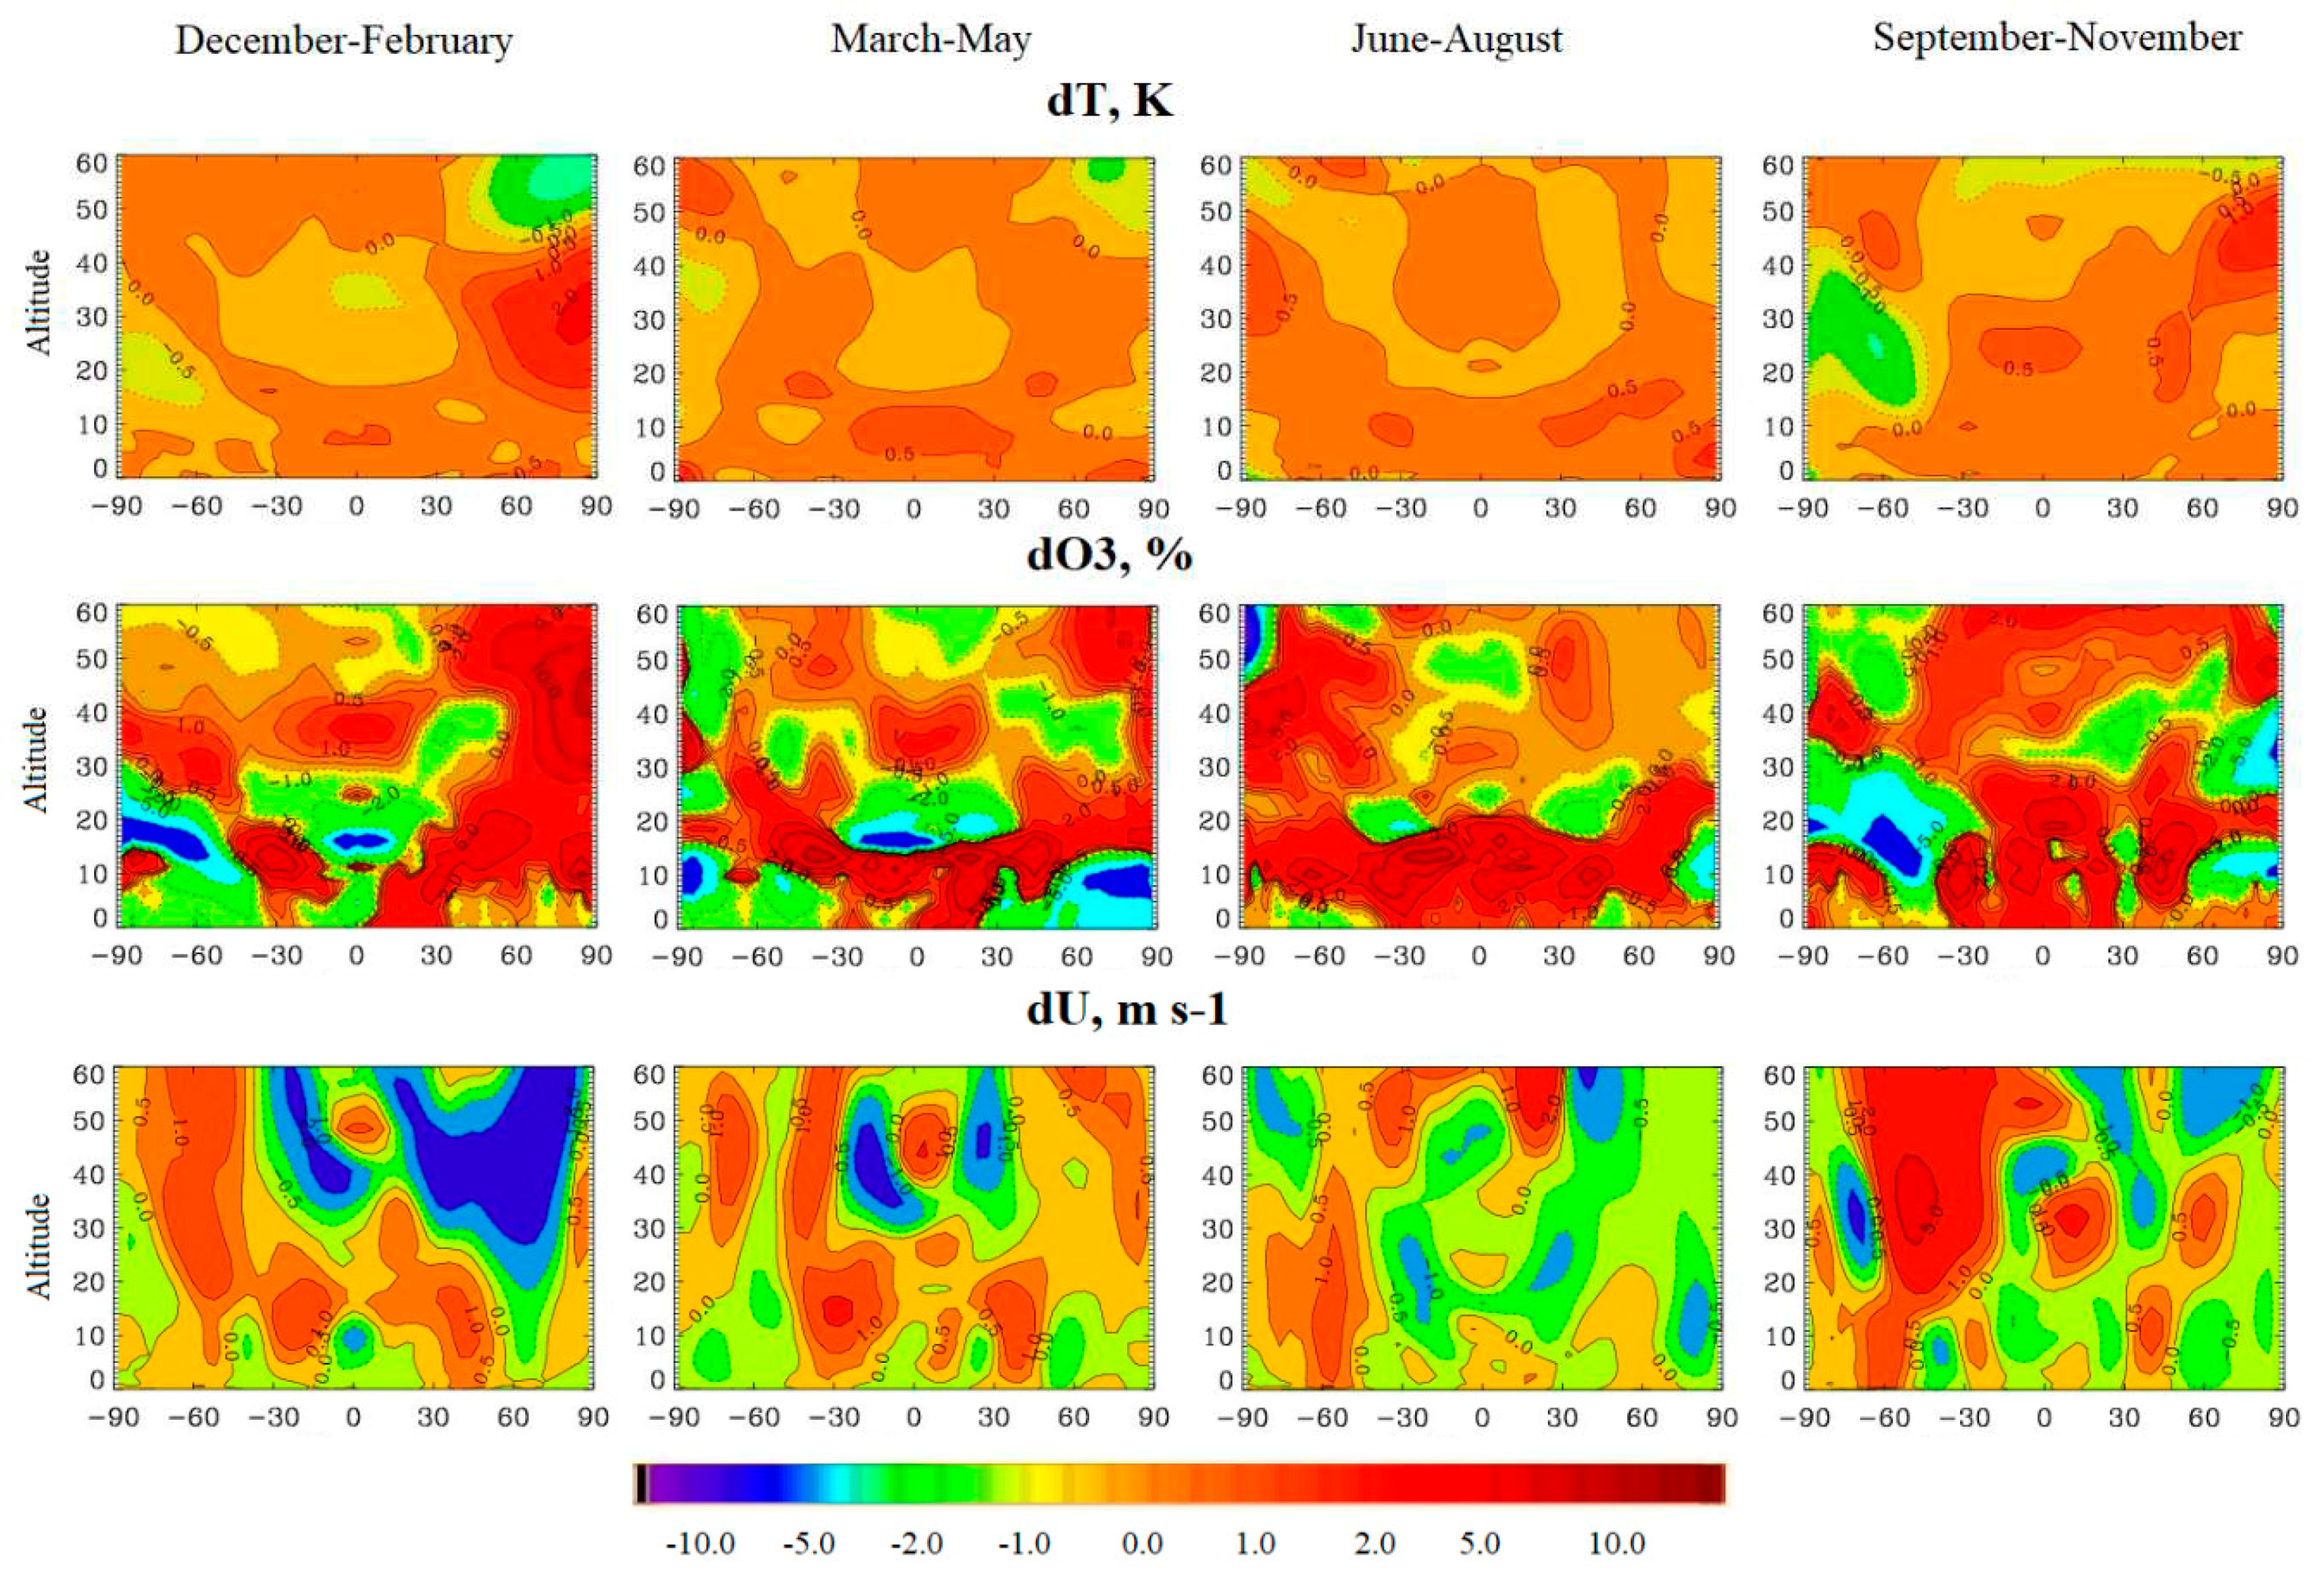
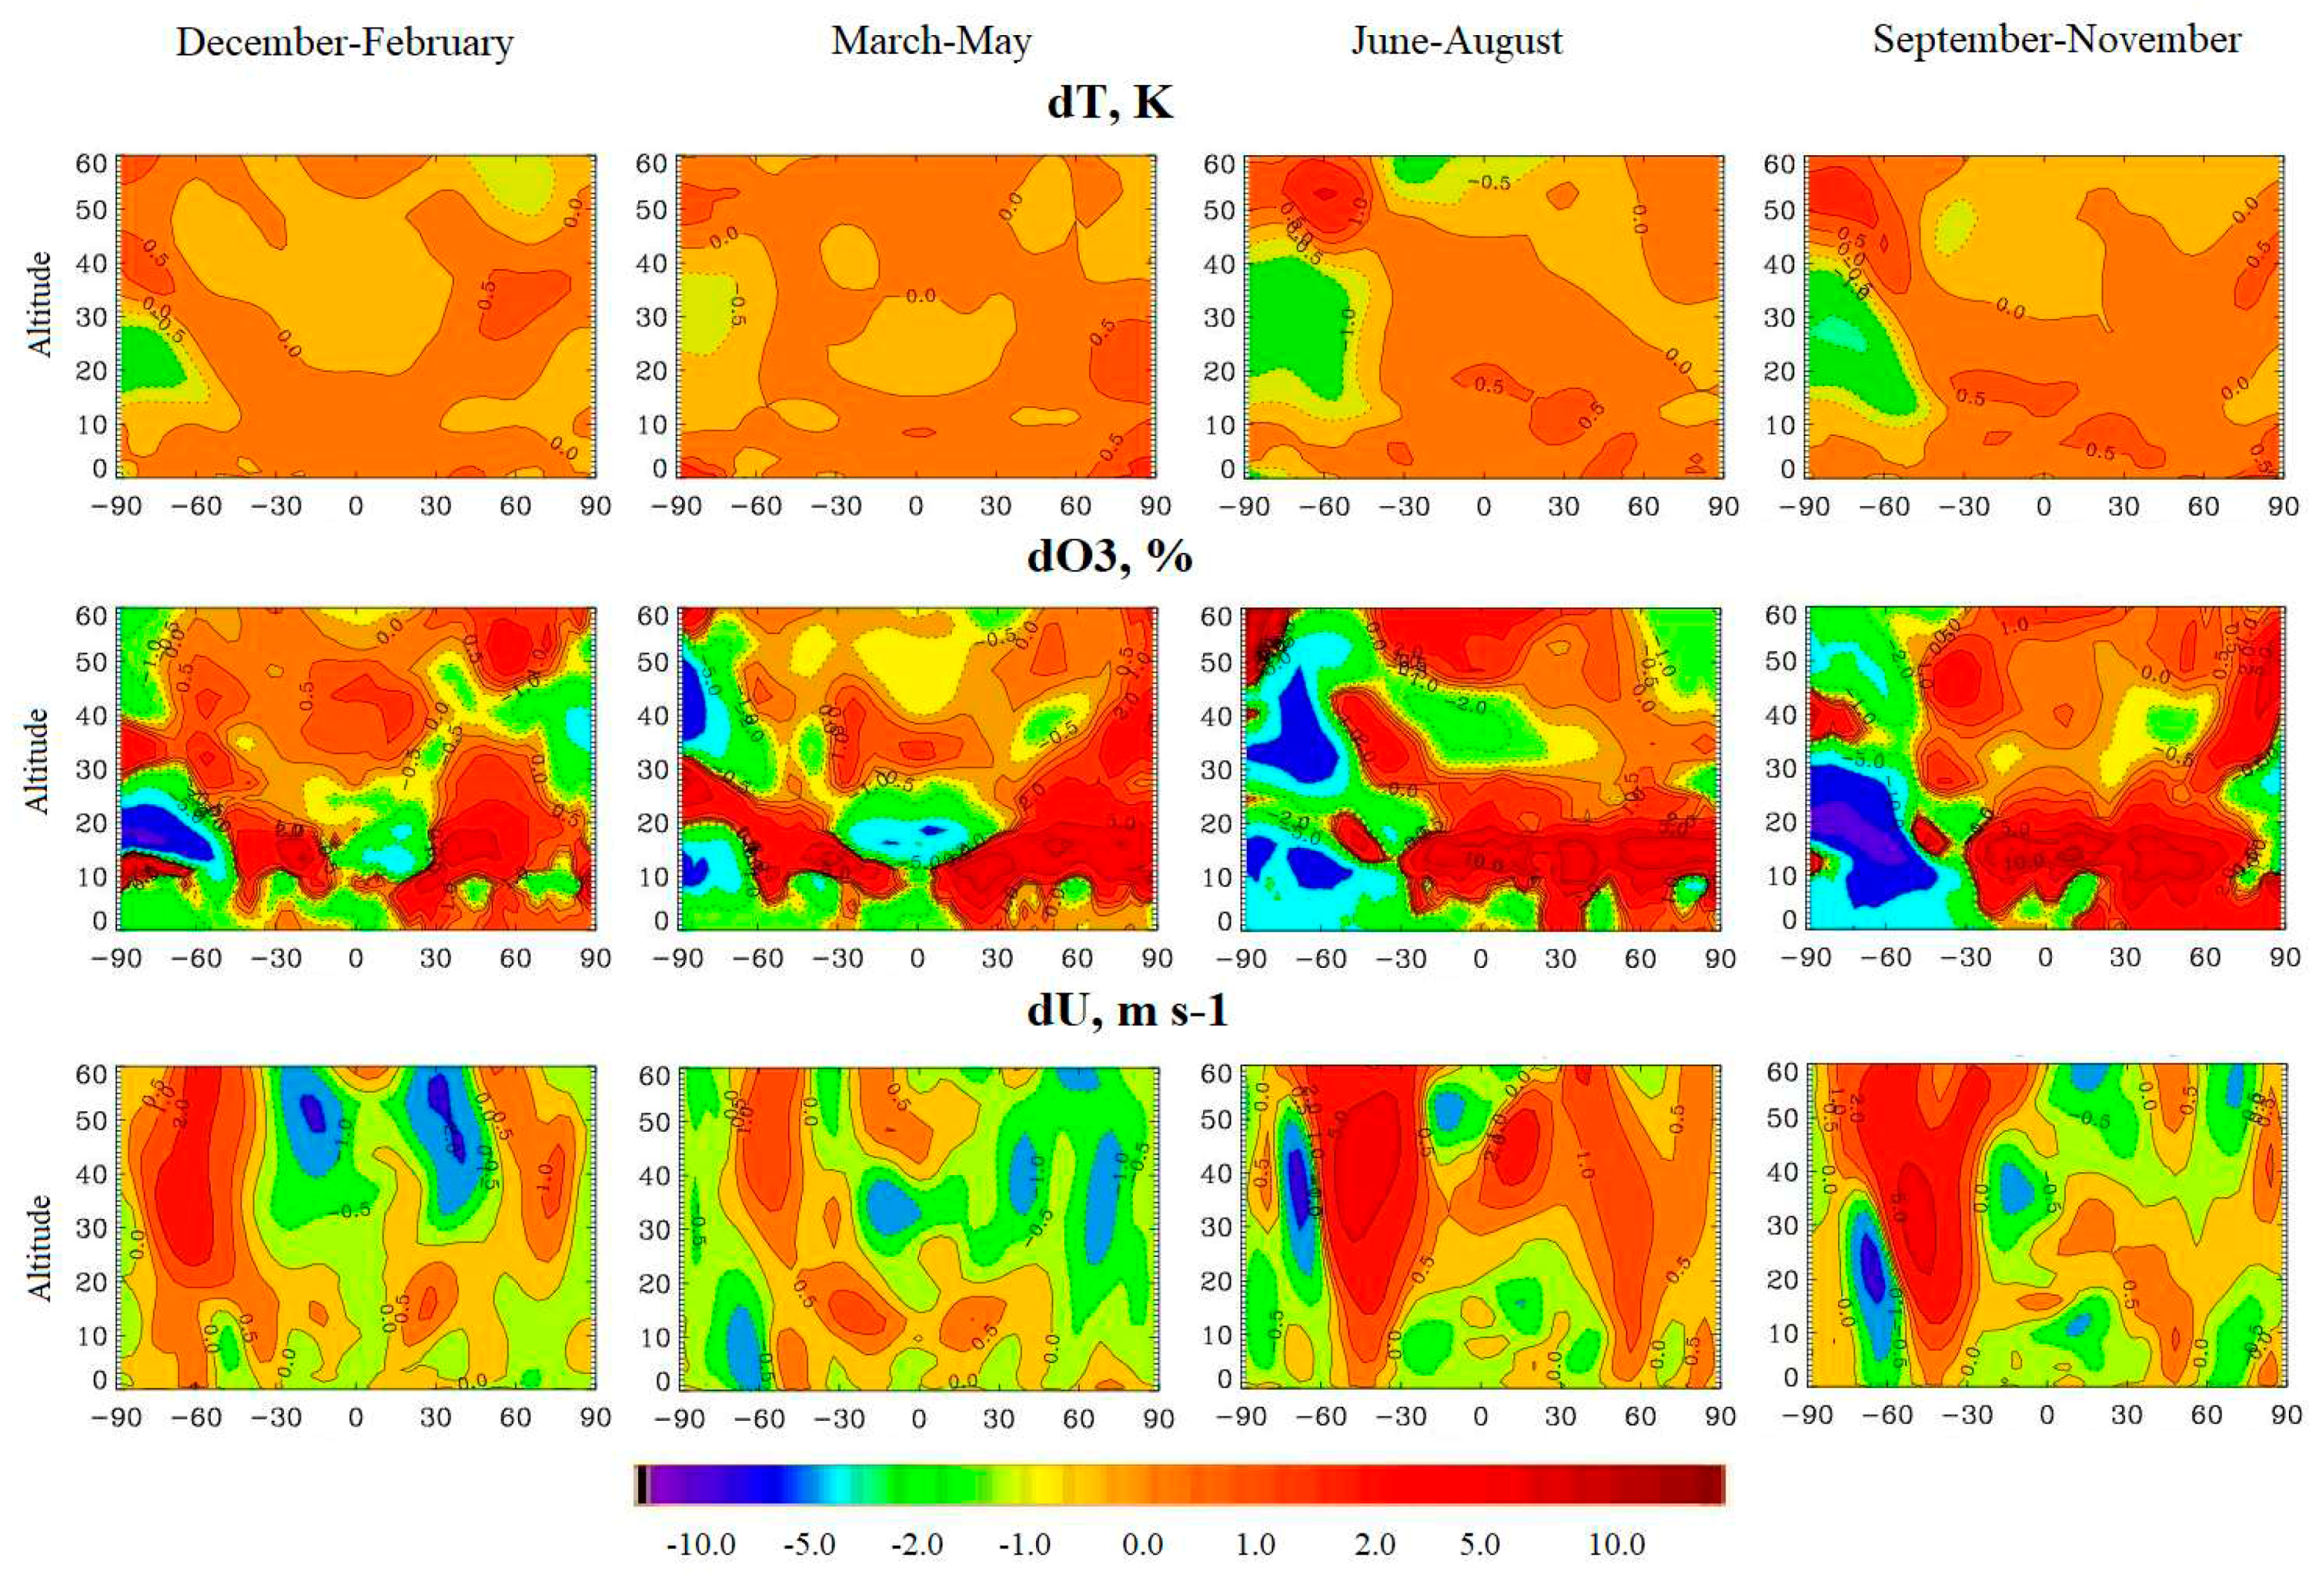
Figure 4 (row 1) presents vertical profiles of air temperature differences based on modeling results for scenarios with the El Niño phase and the La Niña phase. As can be seen, all year over the tropical region there is an increase in temperature by 5 degrees at altitudes up to 15 km, then at altitudes from 10 to 20 km - a decrease by 0.5 degrees. These regions change little throughout the year, which is due to the constant heat flux from the ocean to the atmosphere in the tropical region during the El Niño phase of the year, whereas this flux is strongly attenuated during La Niña years. In the Arctic stratosphere (60-90 latitudes) during the winter months there is an increase of 1-2 degrees at altitudes of 10-40 km, and a decrease in temperature of 1 degree at altitudes of 50-60 km. This is due to the fact that during the El Niño phase, the heat flux into the stratosphere increases, resulting in an increase in meridional transport from the equator to the North Pole and a deepening of the Aleutian Minimum due to an increase in the temperature contrast between the tropics and the Arctic, which affects the zonal wind and contributes to an increase in the heat flux into the Arctic stratosphere and the SSW [
41]. As a result of these processes, air temperature decreases in the tropical stratosphere while it increases in the Arctic stratosphere. These heat fluxes weaken zonal transport and contribute to the instability of the SPV.
Figure 4.
Vertical zonal average profiles of differences in air temperature (1st row), ozone concentration (2nd row) and zonal wind speed in m/s (3rd row) based on modeling results for scenarios with El Niño and La Niña phases.
Figure 4.
Vertical zonal average profiles of differences in air temperature (1st row), ozone concentration (2nd row) and zonal wind speed in m/s (3rd row) based on modeling results for scenarios with El Niño and La Niña phases.
During spring, the area of temperature increase over the Arctic reduces. At altitudes of 10-20 km at this time, the air temperature decreases by 0.2 degrees. Also during the spring months there appears a similar temperature decrease in the Southern Hemisphere by 0.2 degrees at the altitudes of 20-40 km. In the summer months, one can observe the temperature increase by 0.5 degrees above the Antarctic at the altitudes of 25-45 km and decrease by 0.2 degrees at the altitudes of 50-60 km, with the area of temperature increase being smaller in area than in the Northern Hemisphere, indicating a weaker stratospheric heating in the Southern Hemisphere compared to the Northern Hemisphere during the El Niño phase. In the Southern Hemisphere, zonal transport and SPV are much stronger than in the Northern Hemisphere, which is related to the geography of Antarctica, and therefore the stratospheric heat fluxes associated with El Niño are less likely to reach the Antarctic stratosphere and contribute to weaker SPV and a slight weakening of zonal transport. In the autumn months, there are temperature changes similar to the spring ones, only from the Southern Hemisphere to the Northern Hemisphere, with a temperature excess of 1 degree above the Arctic at the altitudes of 30-50 km. This means that during the El Niño phase, the most powerful heat inflow goes to the Arctic stratosphere, which contributes to stratospheric heating, HSP and instability of the SPV, while in the Southern Hemisphere the SPV is usually very stable, and stratospheric heating there is much weaker than in the Northern Hemisphere.
Figure 4 (row 2) presents vertical profiles of ozone concentration differences based on modeling results for the El Niño and La Niña scenarios. As can be seen, ozone concentration agrees with air temperature - over the tropical region there is a decrease in ozone concentration by more than 2% at altitudes of 10-30 km throughout the year. Also a decrease by 1% is observed at 30-60 latitudes at altitudes of 30-50 km. In the Arctic stratosphere during the El Niño phase, ozone concentration is 5% higher than during the La Niña phase, with the difference decreasing to 1-2% in spring, while at 30 km altitude there is a 1% decrease in concentration. This indicates that the heat flux into the stratosphere due to El Niño contributes to enhanced meridional transport, which weakens the zonal wind and contributes to weakening the SPV. As a result, the Brewer-Dobson circulation is enhanced, which contributes to the transport of air temperature and ozone from the tropics to the Arctic stratosphere. As a result, the ozone concentration decreases in the tropical region, while it increases over the Arctic. In the Southern Hemisphere, ozone concentration increases by 2% in the spring months and 5% in the summer months, with the area of increase in ozone concentration in the Southern Hemisphere being smaller than in the Northern Hemisphere. This means that ozone holes are more pronounced in the Southern Hemisphere and during the La Niña phase than in the Northern Hemisphere. At the same time, they exist longer in the Southern Hemisphere. It can also be seen that during the El Niño phase there is an increase in ozone transport from the tropical stratosphere to the Arctic and Antarctic through the Brewer-Dobson circulation, and the ozone transport in the Northern Hemisphere is stronger than in the Southern Hemisphere, where the SPV is more stable.
Figure 4 (row 3) presents the vertical profiles of zonal wind speed differences from the modeling results for the El Niño and La Niña phase scenarios. As can be seen, there is a strong decrease in zonal wind speed by 2 m/s in the Northern Hemisphere at 40-90 latitudes across the stratosphere during the winter months. This indicates that during the La Niña phase the SPV is quite stable and the zonal flow is quite strong, whereas during the El Niño phase the SPV is less stable. In spring months in the Northern Hemisphere at 60-90 latitudes and altitudes of 15-40 km, the zonal wind speed increases by 0.5-1 m/s, indicating that the zonal flow during the El Niño phase is stronger in spring months. The heat fluxes into the stratosphere caused by El Niño phenomena lead to increased temperature contrasts between the tropics and polar regions and between the Pacific Ocean and other regions of the Earth, and strong heating of the tropical troposphere. This contributes to enhanced ordered stratospheric heat transport, stronger meridional fluxes, and a deepening of the Aleutian Minimum, which promotes heat and mass transport from the tropics to the Arctic and warming of the Arctic stratosphere and HSP, resulting in an effect on the zonal flow, contributing to weakening of the zonal wind and SPV [
41]. In the autumn months at the altitudes of 20-60 km and 30-50 latitudes in the Northern Hemisphere the zonal wind decreases by 1 m/s, while above the North Pole at the altitudes of 20-40 km the zonal wind speed increases by 0.5 m/s. In the Southern Hemisphere in the area of latitude 60 in the autumn months there is a decrease in wind speed by 0.5 m/s, but the zonal wind near the South Pole does not change much, which indicates that the SPV in the Southern Hemisphere is more stable than in the Northern Hemisphere, and that the impact on the zonal wind in the Southern Hemisphere during El Niño is weaker than in the Northern Hemisphere. As can be seen, the El Niño event and the associated stratospheric heat flux has a strong impact on the zonal wind in the Northern Hemisphere, contributing to the instability of the SPV, while in the Southern Hemisphere the SPV remains stable due to a weaker impact.
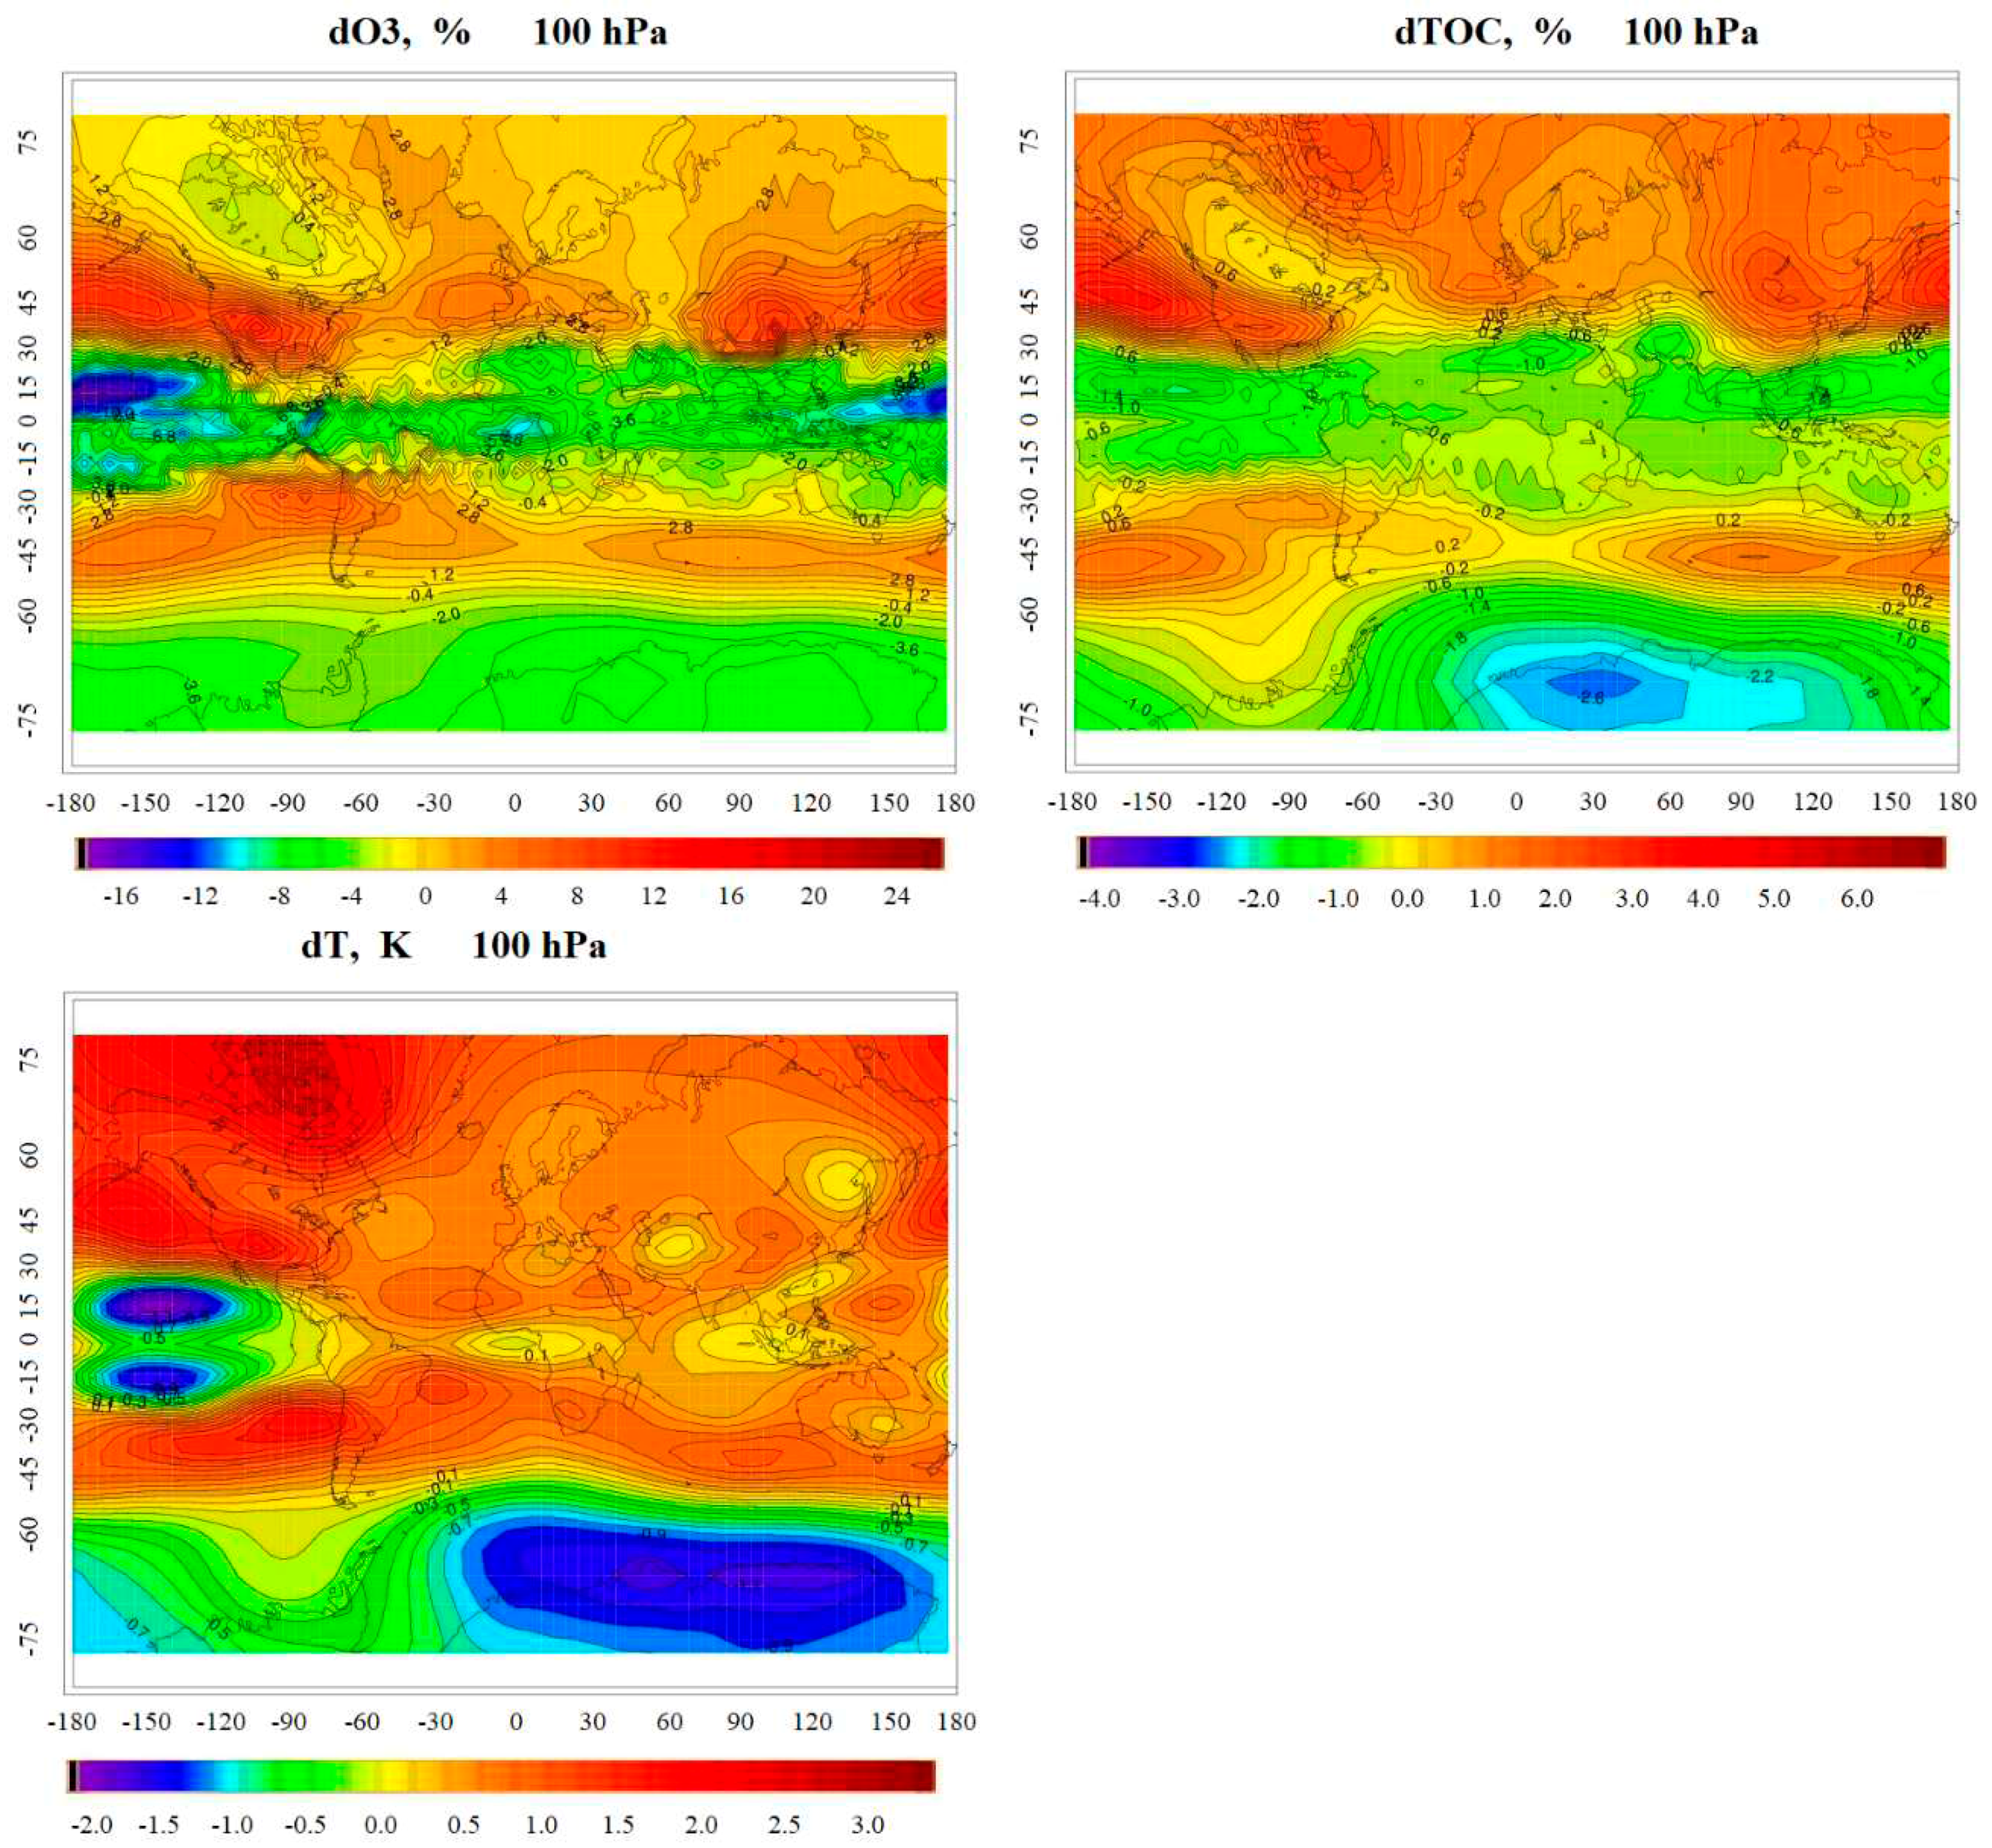
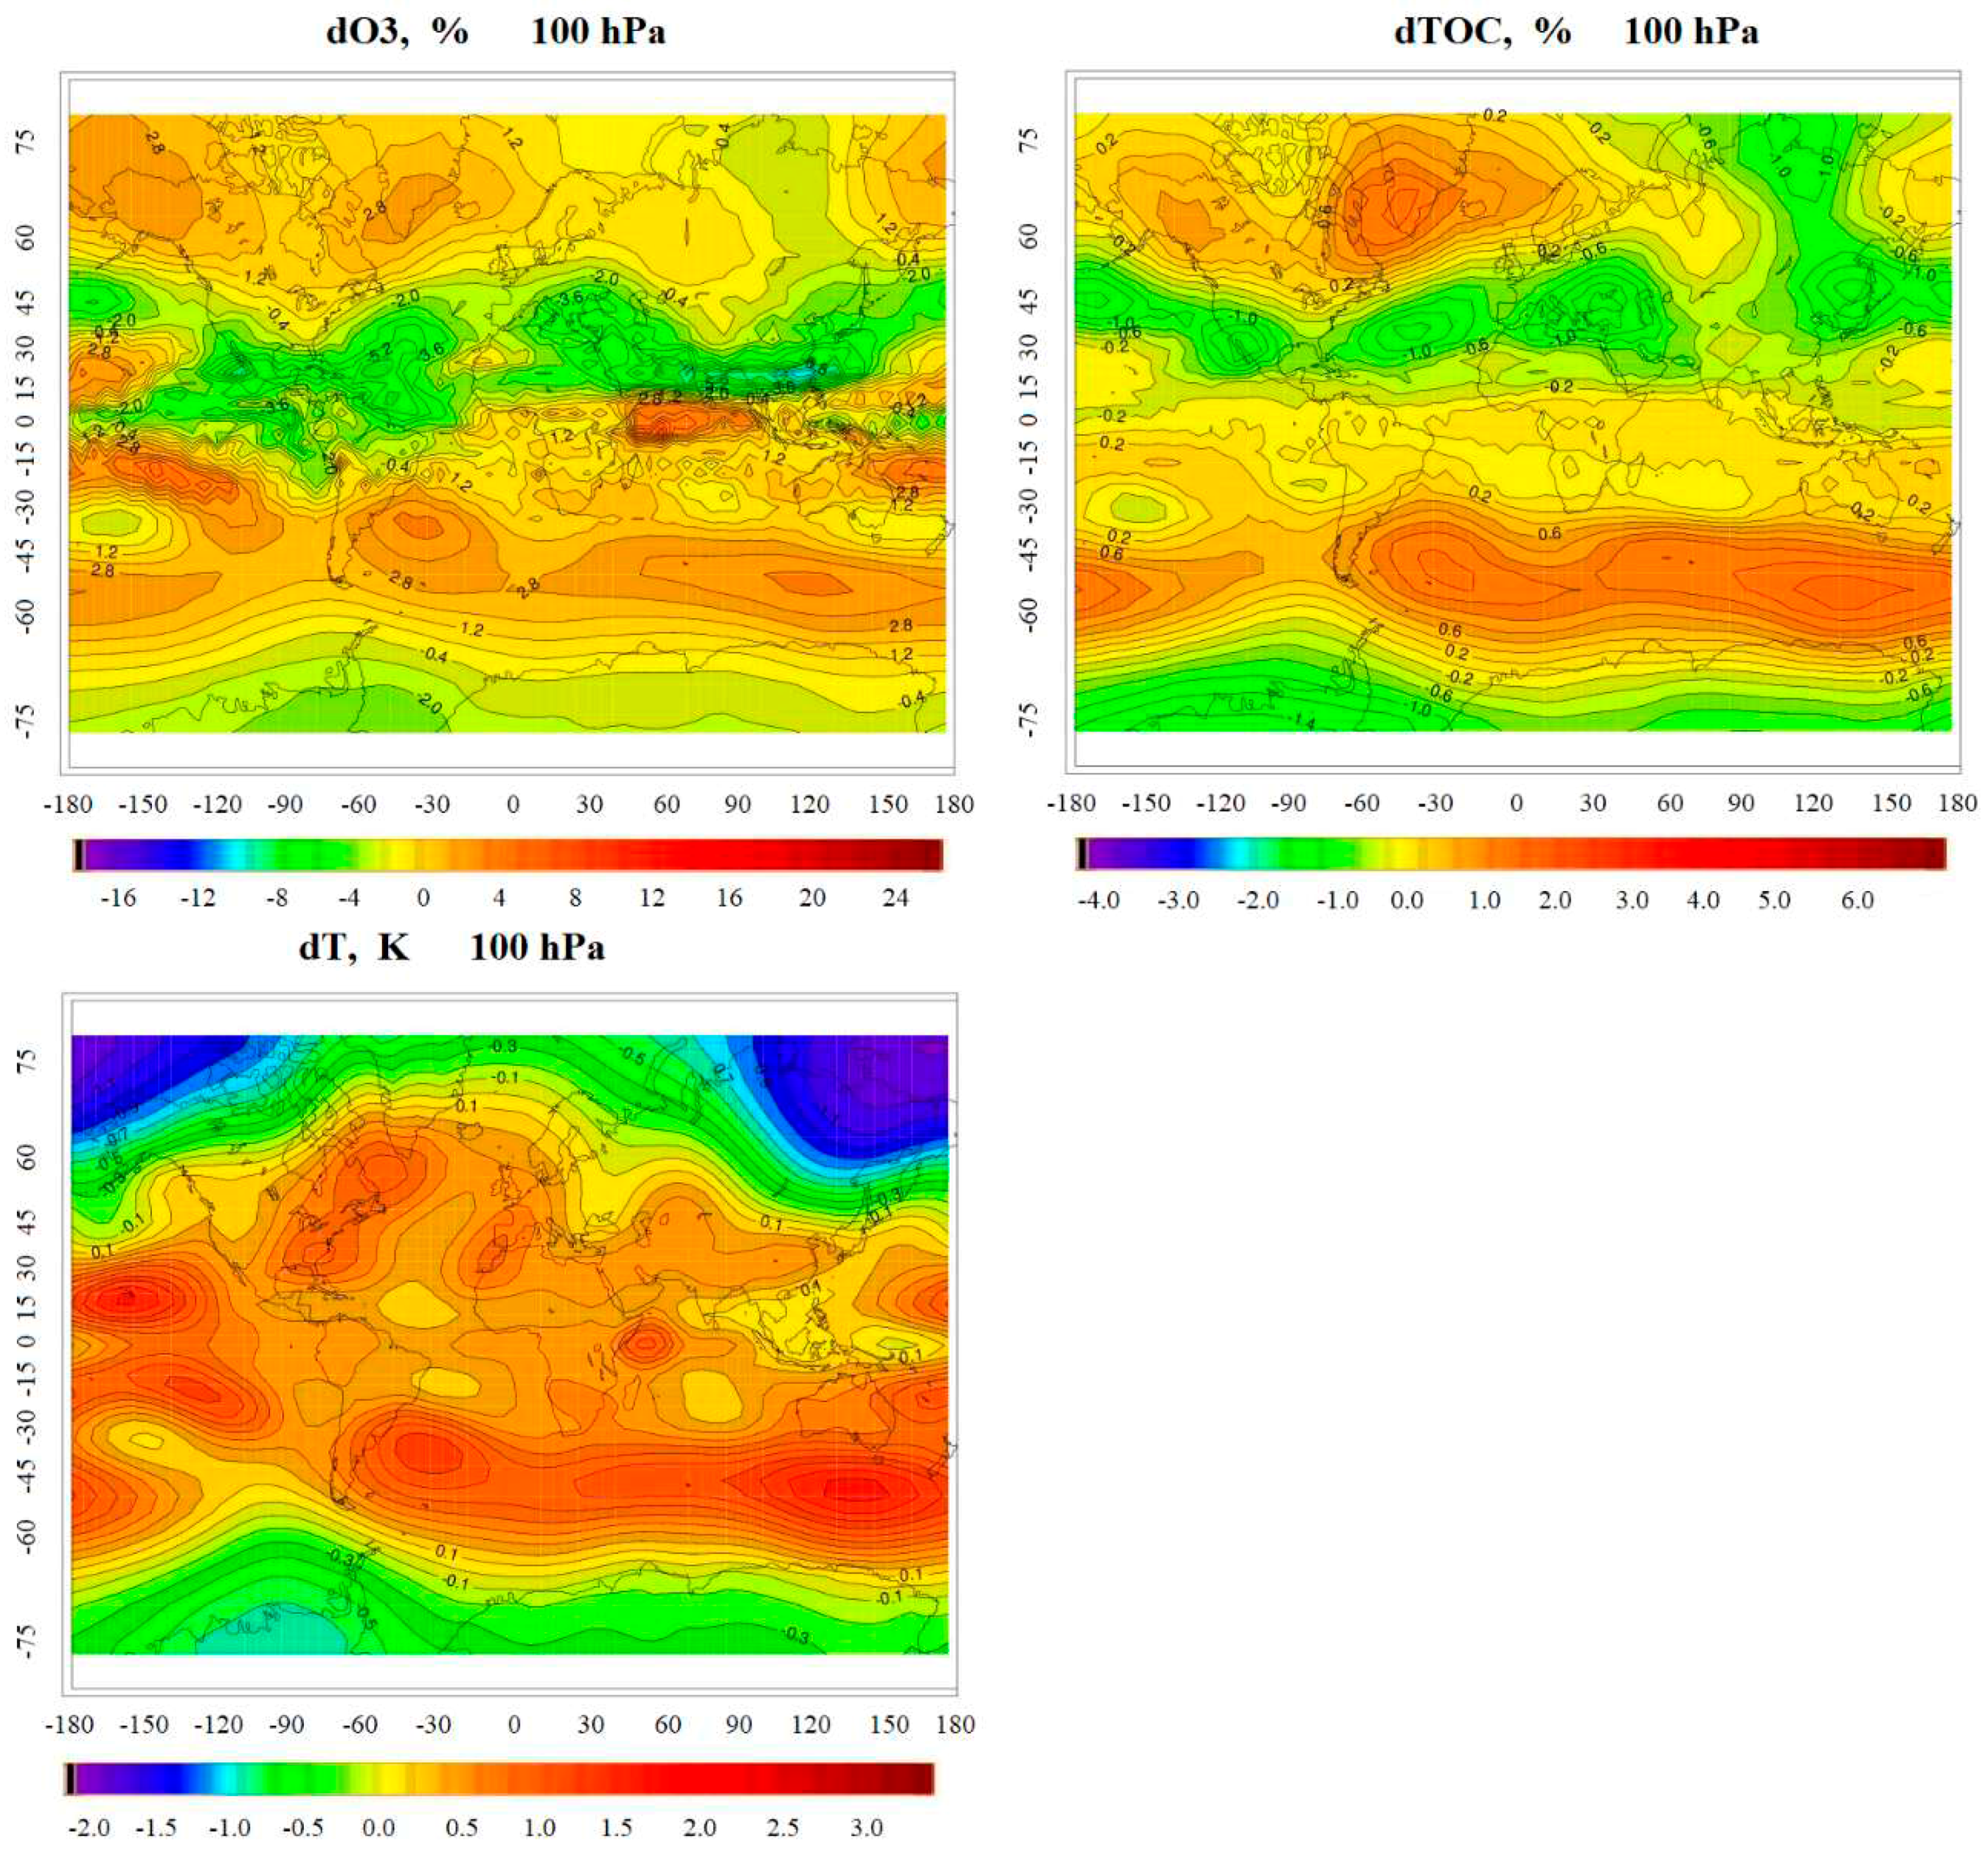
The distributions of air temperature differences, concentration and total ozone content in the stratosphere are presented below (
Figure 5).
Figure 5 shows a decrease of ozone concentration in the tropical part of the stratosphere, especially over the equatorial part of the Pacific Ocean, while an increase of ozone concentration by 3-5% is seen over the Arctic and a decrease of 3-4% over the Antarctic. The total ozone content (
Figure 5, top right) shows a 1-2% decrease in ozone concentration in the tropics, especially over the Pacific Ocean in the El Niño region, which is consistent with air temperature (
Figure 5, bottom) and ozone concentration in the lower stratosphere, and indicates a strengthening of the Brewer-Dobson circulation in the tropics during El Niño years. A decrease of 0.5-1% is also observed over Greenland and Antarctica, while over the Arctic there is an increase of 2% in El Niño years compared to the La Niña phase. Over Antarctica, there is a decrease of ozone content by 3% compared to the La Niña phase. Also, a 0.5% increase in ozone content is observed between Australia and Antarctica. This indicates the strengthening of the Brewer-Dobson circulation during El Niño years, which contributes to the increased transport of ozone from the tropics to the polar regions and, as a result, to the increase of ozone content over the Arctic and the decrease of ozone content in the tropics, from where it is carried to the poles. The El Niño effect is weaker in the Antarctic than in the Arctic.
Regarding stratospheric air temperature (
Figure 5, bottom), a 2.5 degree decrease in air temperature is observed over the equatorial Pacific Ocean, while south of the equatorial Pacific and over much of the Arctic, the temperature increases by 1.8-2 degrees. These features may be related to enhanced stratospheric heat flux due to El Niño phenomena, which contribute to enhanced stratospheric heat flux and SSW [
41], and indicate heating of the Arctic stratosphere and increased probability of SSW, which affects the zonal wind [
41] and contributes to the instability of the SPV and enhanced Brewer-Dobson circulation, contributing to the transfer of heat and ozone from the tropical stratosphere to the polar stratosphere. The temperature decrease by 1-2 degrees is also observed over the Antarctic south of Australia, while over the vicinity of South America there is an increase by 0.2 degrees, indicating weak stratospheric warming in the Southern Hemisphere, and contributing to a slight weakening of the SPV and an increase of total ozone.
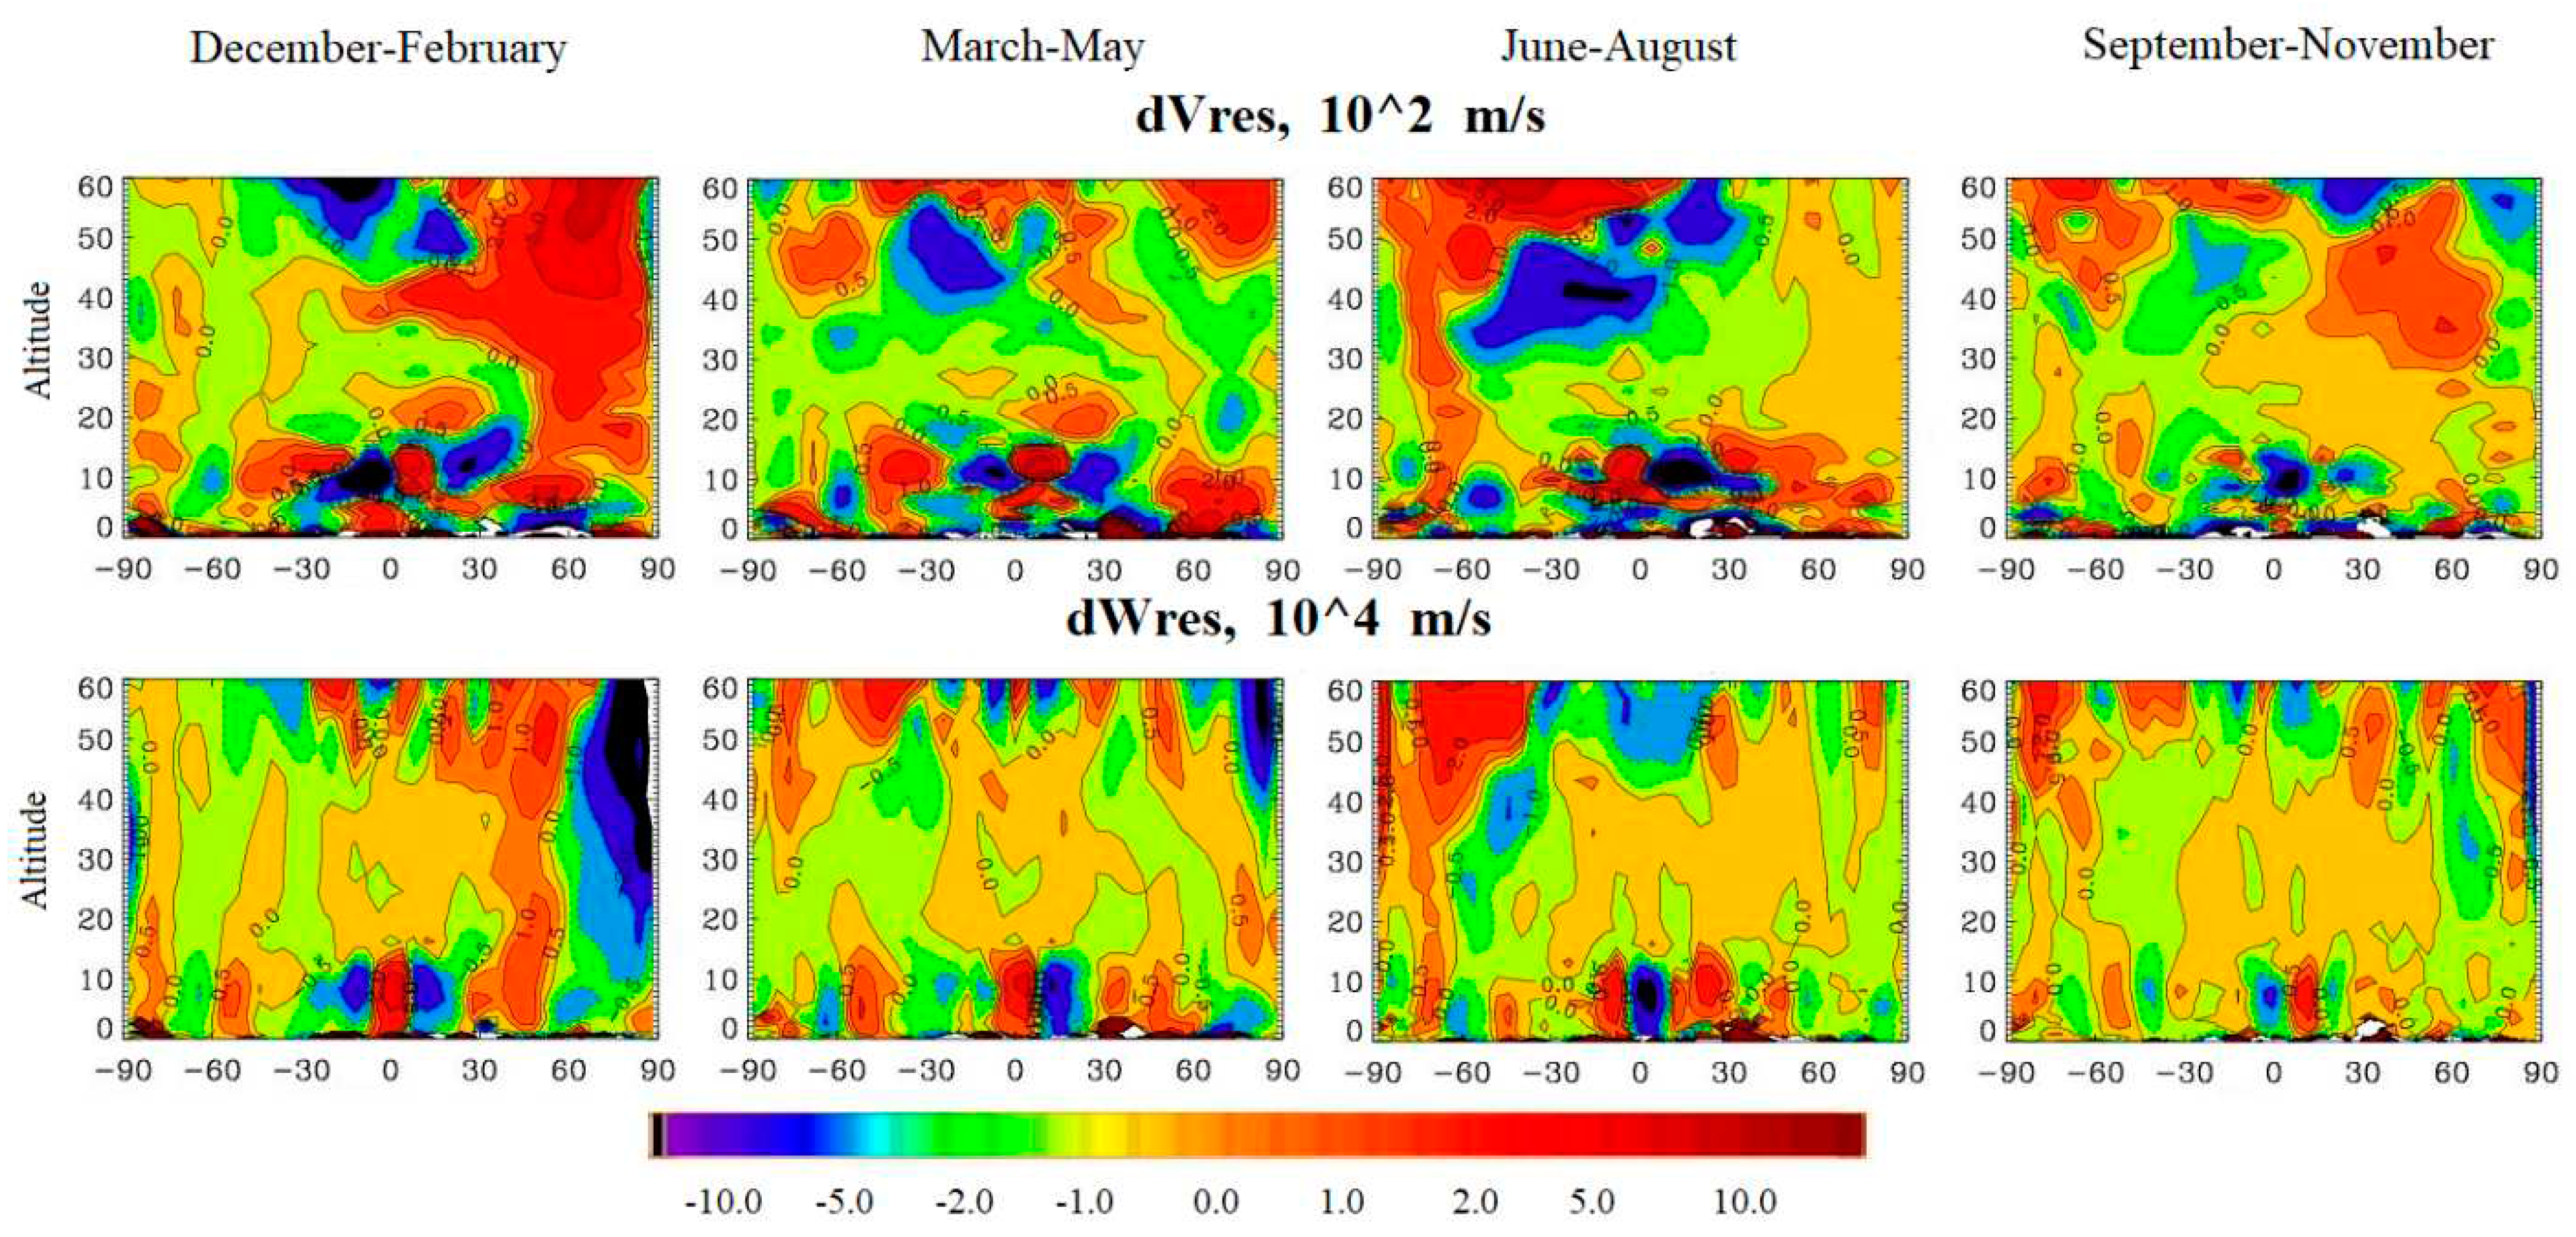
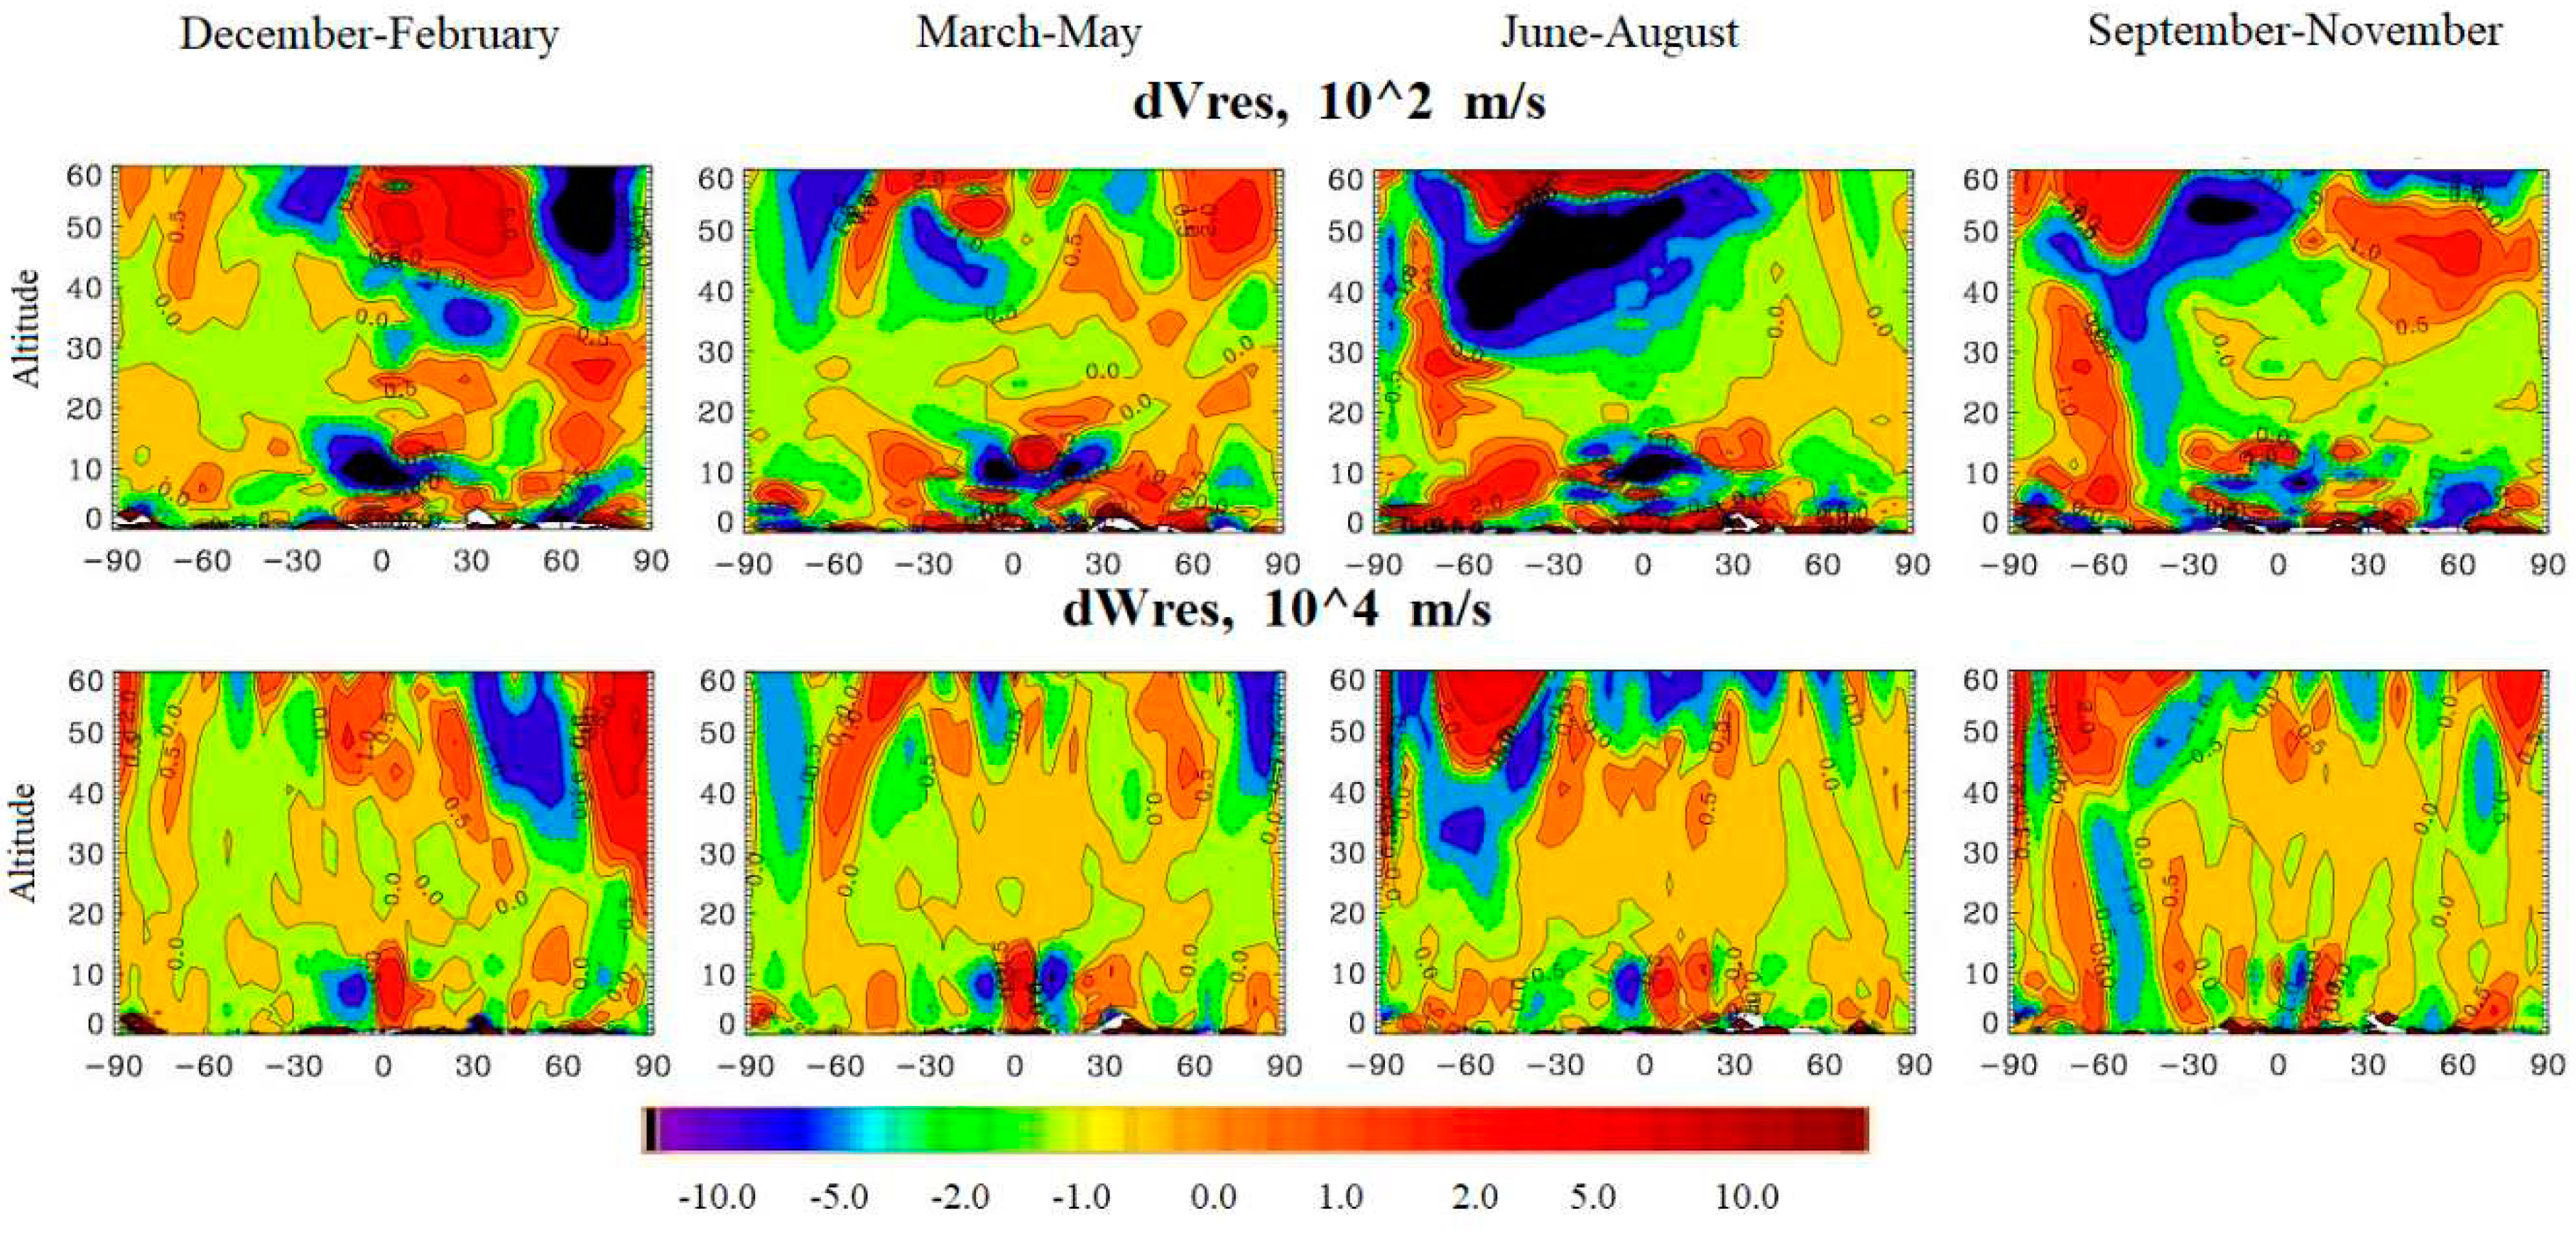
Figure 6 presents the vertical profiles of the differences between the meridional (top) and vertical (bottom) components of the residual circulation, based on the simulation results for the scenarios with El Niño and La Niña phases, which characterizes the changes in the heat and mass transport from the tropics to the poles.
As can be seen, above the Arctic at the heights of 40-60 km, one observes an increase of the meridional component of the residual circulation (Fig. 6, above) by 5*10
-2 m/s at the El Niño phase in the winter months and a similar increase above the Antarctic in the summer months. At the same time, a decrease of the meridional component by 2*10
-2 m/s is observed over tropical latitudes at the same heights during the winter months. At the altitudes of 20-30 km in the Northern Hemisphere, one can observe an increase of the meridional component by 2*10
-2 m/s in the winter and autumn months, which indicates an increased transport from the equator to the North Pole. In the Southern Hemisphere at altitudes of 20-30 km, a very weak strengthening of the meridional flow by 0.5-1*10
-2 m/s in summer months is observed. As for the vertical component (
Figure 5, bottom), an enhancement of 5*10
-4 m/s is observed over the equator in all months except summer months, indicating an enhancement of the vertical convective flux over equatorial latitudes due to the El Niño phenomenon.
Also in the winter months, a decrease of the vertical component by 5*10
-4 m/s is observed above the Arctic at the heights of 20-60 km. These changes in the components of the residual circulation indicate an intensification of the Brewer-Dobson circulation during the El Niño phase, and, as a result, ozone supply from tropical latitudes to the Arctic latitudes. El Niño leads to air heating in the tropical region, which contributes to the intensification of temperature contrasts and, as a result, to the intensification of convective flows in the tropical troposphere and deepening of the Aleutian Minimum. All this enhances the orderly heat transfer from the troposphere to the stratosphere. These flows contribute to stratospheric heating and SSW, which contributes to the strengthening of the meridional flow, which affects the zonal flow, contributing to its weakening and circulation, as a result of which the SSW loses stability and becomes weaker [
41]. These processes contribute to the strengthening of the Brewer-Ra-Dobson circulation, resulting in an increase in the heat and ozone transport from the tropical part of the stratosphere to the Arctic stratosphere. As a result, the air temperature and ozone concentration increases in the Arctic stratosphere, while in the tropical stratosphere it decreases. In the Southern Hemisphere, this effect is much weaker, the heat and ozone transport is less intense than in the Northern Hemisphere, therefore the zonal flux and SPV and hence the ozone holes over the Antarctic are more powerful and stable than over the Arctic.
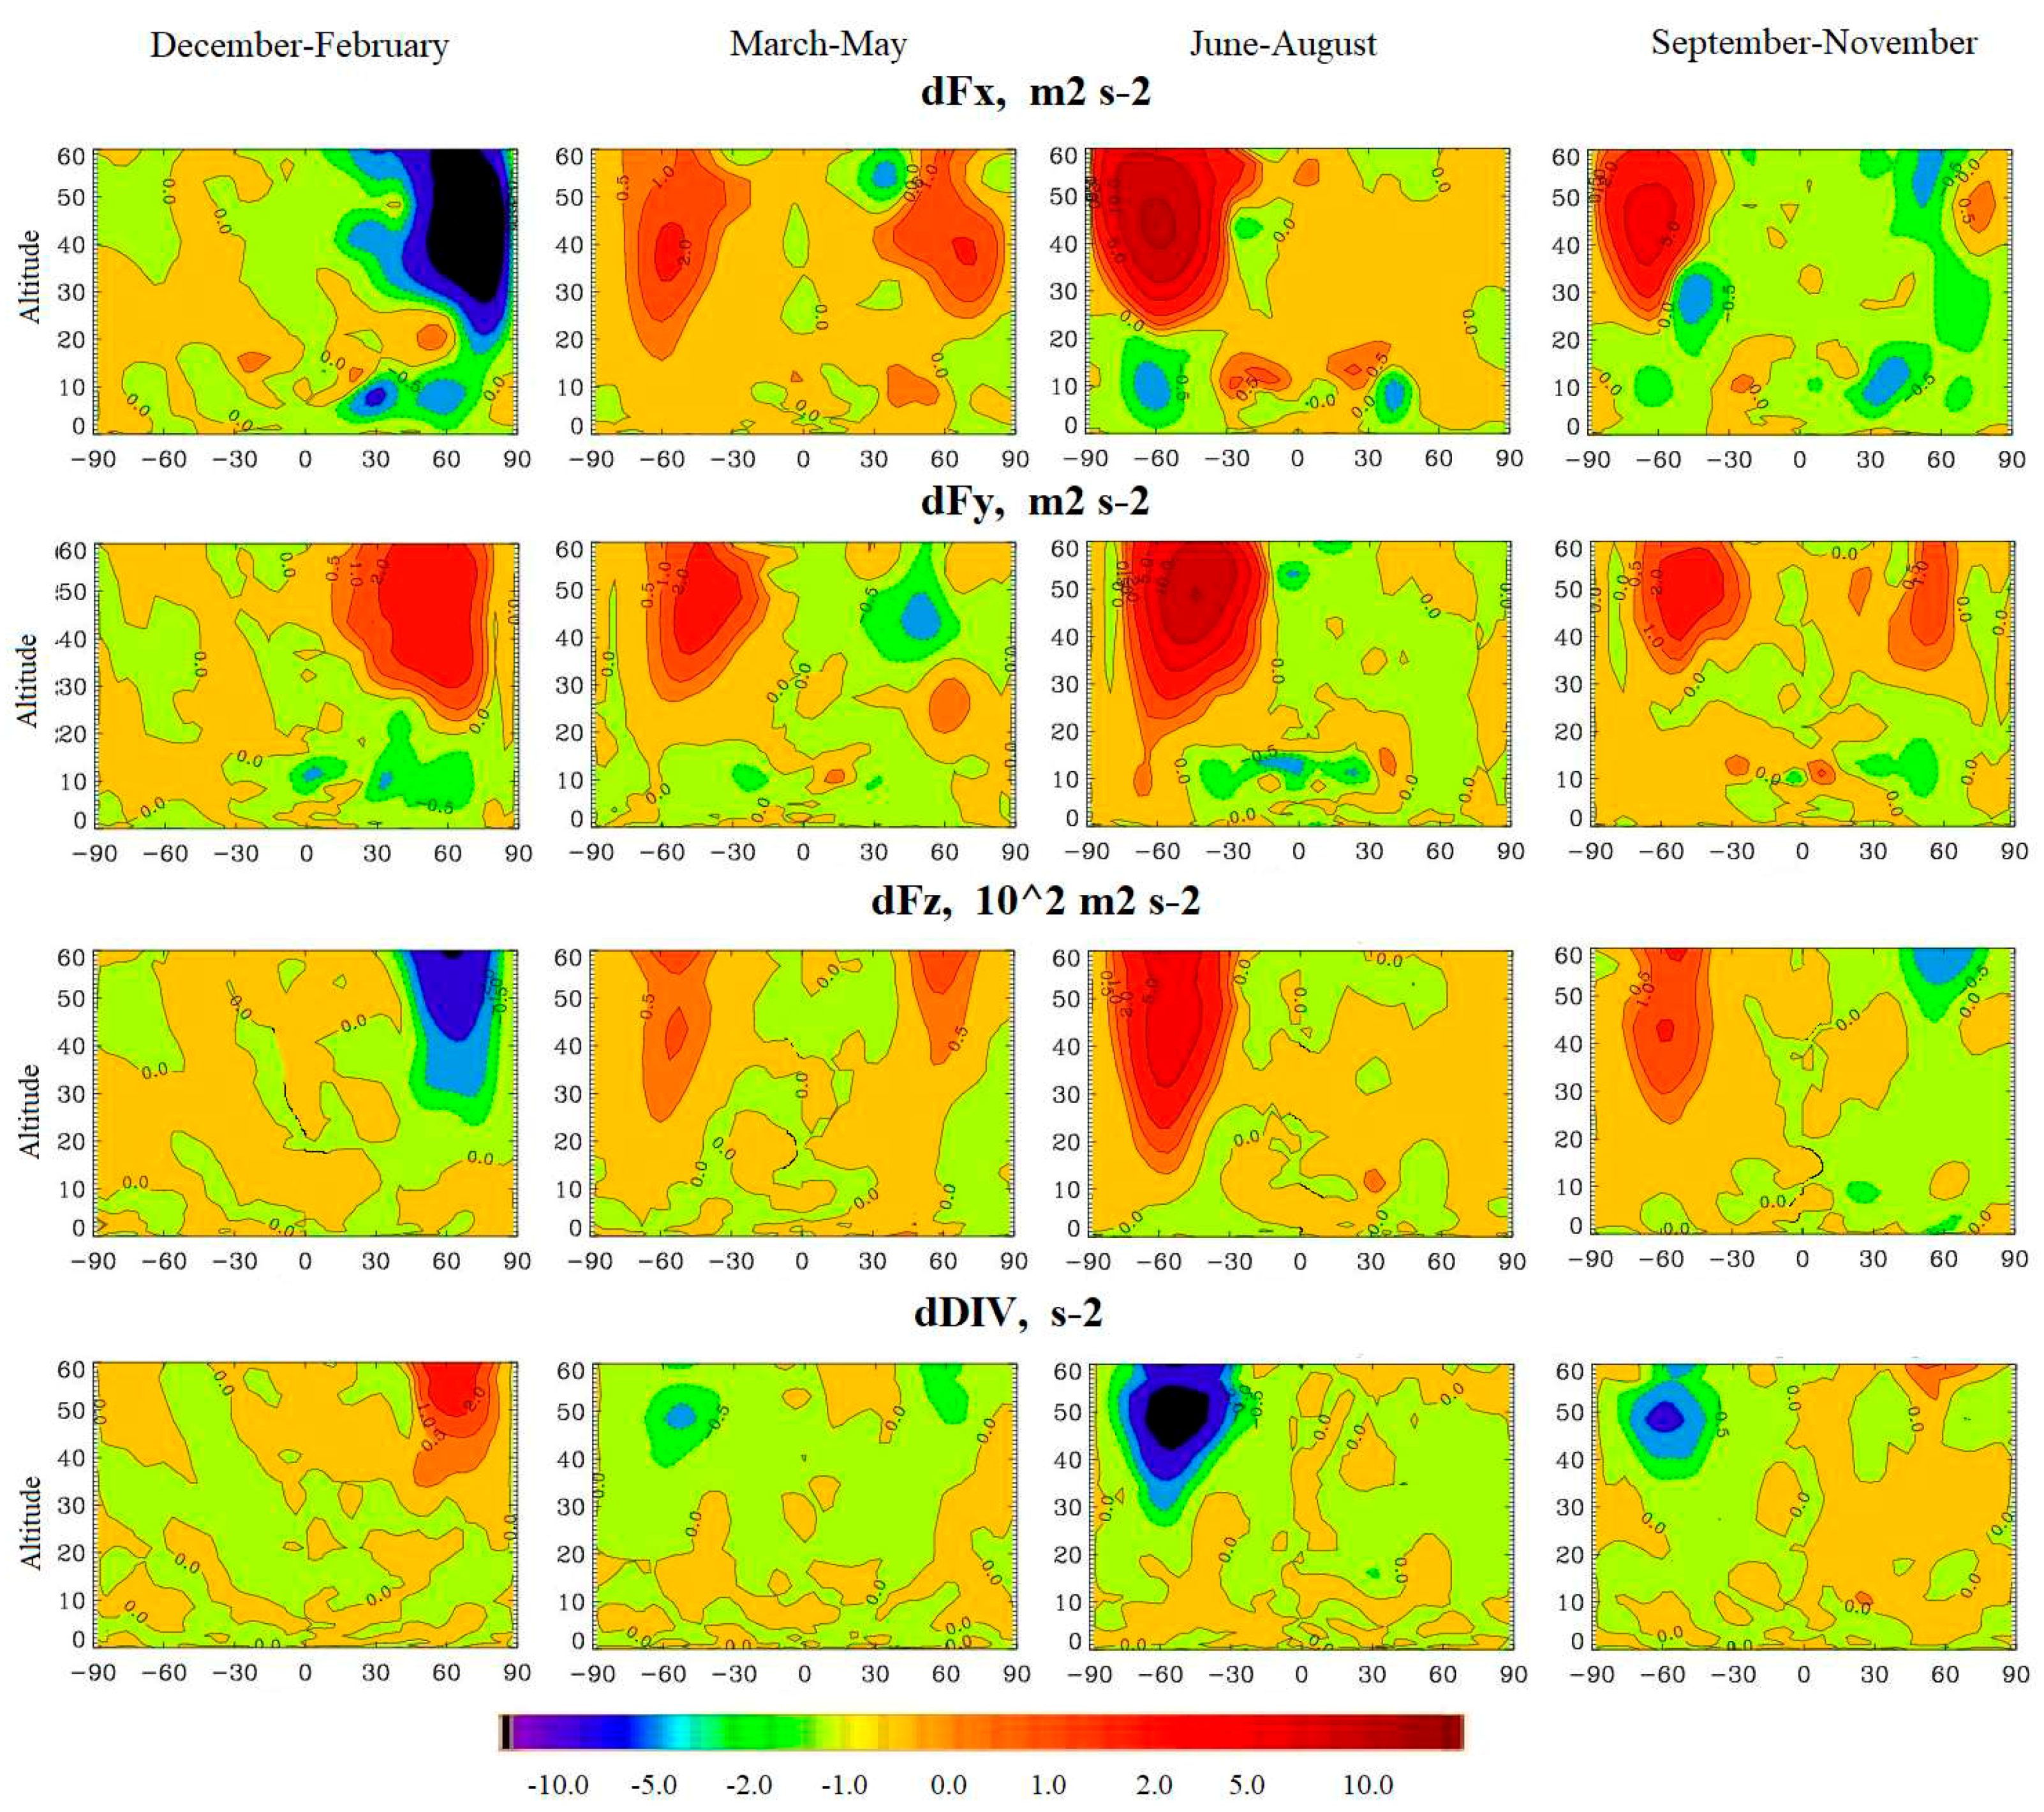
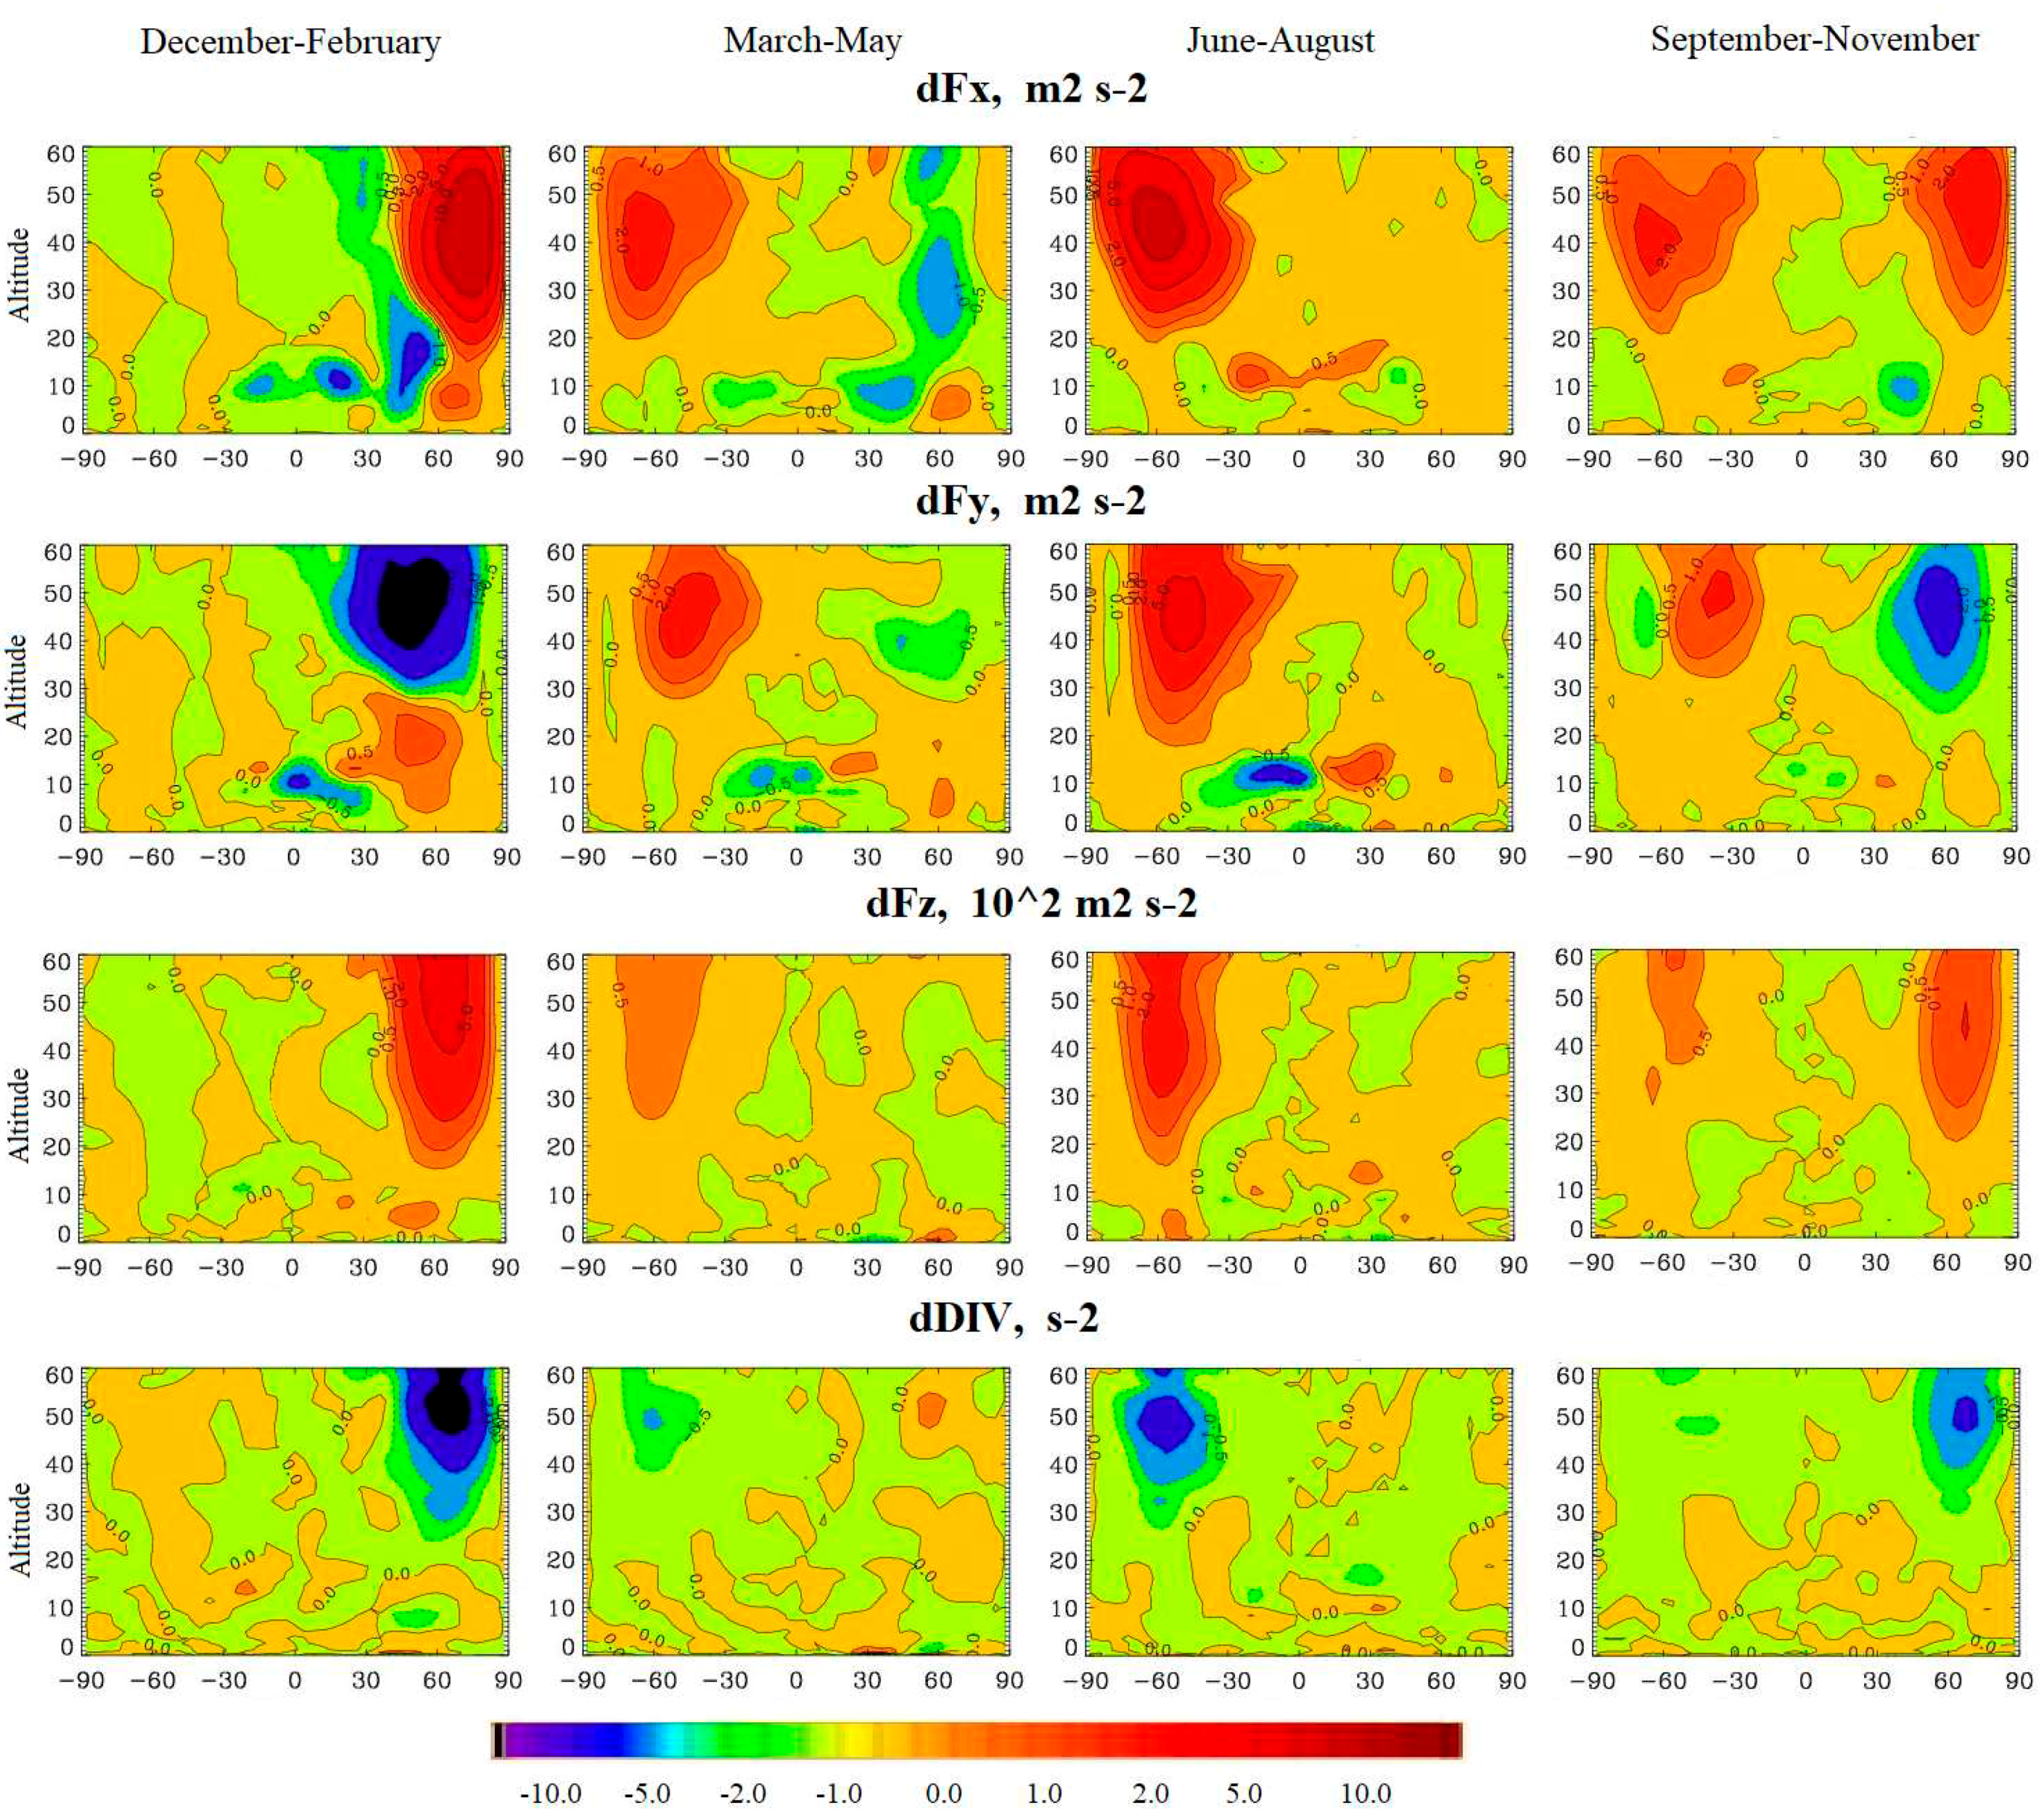
Below are the differences in the components and divergence of the flux of Plumb wave activity based on the modeling results for scenarios with the El Niño phase and the La Niña phase, which characterizes the transfer of heat and mass due to waves (
Figure 7).
As can be seen, over the Northern Hemisphere, there is a strong amplification of the zonal component of the Plumba flux at altitudes 30-60 km by 10 m2 s-2 and the vertical component of the Plumba flux by 2-5*10-2 m2 s-2 at altitudes 20-60 km in winter and fall months. The meridional component has a decrease of 10 m2 s-2 at altitudes 30-60 and an enhancement of 0.5 m2 s-2 at altitudes 10-30 km. At altitudes of 0-30 km and 30-60 latitudes in winter months, a decrease of the zonal component by 1 m2 s-2 and strengthening of the meridional component of the Plumb flow by 0.5 m2 s-2 are observed. Strengthening of the meridional and vertical components at the altitudes of 20-30 km is related to the strengthening of meridional processes due to stratospheric heating, which contribute to the weakening of the zonal flux and Rossby waves. This amplification indicates an increase in the intensity of propagation of planetary Rossby waves from the troposphere to the stratosphere due to enhanced heat fluxes from the stratosphere during the Southern Oscillation. These heat fluxes contribute to the enhanced wave activity flux from the tropics to the pole and from the troposphere to the stratosphere, which contributes to the instability of Rossby waves. All of this affects the zonal wind and disrupts the SPV, resulting in enhanced Brewer-Dobson circulation and heat and ozone transport from the tropics to the polar regions. As for the Southern Hemisphere, at the altitudes of 40-60 km, one observes an intensification of the zonal component of the Plumb flow in the spring and autumn months by 0.5 m2 s-2. . In the summer months, an increase of 5 m2 s-2 is observed at altitudes 0-30 km. The meridional component shows an increase by 0.5 m2 s-2 in the spring and fall months and by 5 m2 s-2 in the summer months at altitudes of 20-50 km, indicating an increase in the meridional flow of wave activity from the equator to the South Pole. The vertical component shows an increase of 0.5*10-2 m2 s-2 during spring and fall months at altitudes of 20-60 km and 2*10-2 m2 s-2 during summer months at altitudes of 30-60 km. These phenomena indicate the strengthening of the wave activity flux in the Northern Hemisphere and weakening of this flux in the Southern Hemisphere, which, in turn, contributes to the weakening of planetary Rossby waves and the destruction of the SPV, especially in the Northern Hemisphere, and the transfer of heat by planetary waves from the equator to the pole and from the troposphere to the stratosphere.
As for the divergence of the wave activity flux (
Figure 7, row 4), there is a negative anomaly between El Niño and La Niña phases in the Northern Hemisphere at 30-60 km altitudes in the winter and fall months of 2-5 s
-2, and weaker (up to 0.5 s
-2) in the spring months. In the Southern Hemisphere, there is a weak negative divergence anomaly in the spring and summer months (up to 2 s
-2) at altitudes of 40-60 km. This means that during the El Niño phase there are more dramatic changes in the flow of wave activity in the Northern Hemisphere than during the La Niña phase. El Niño contributes to the enhancement of the meridional and vertical flux of wave activity into the stratosphere. This contributes to the enhanced convergence of the Plumb flow, as indicated by the negative anomalies, and hence to the reversal of the zonal flow and weakening of the Rossby waves. These changes are related to the enhanced heat flux into the stratosphere during the El Niño phase, which contributes to the enhanced meridional temperature transport from the tropics to the polar regions, which affects the zonal wind, and contributes to the enhanced wave activity flux. This both weakens the planetary Rossby waves during the El Niño phase and enhances the propagation of heat into the stratosphere through these waves, which contributes to the destruction of the SPV and SSW. In the Southern Hemisphere, this influence is much weaker than in the Northern Hemisphere.
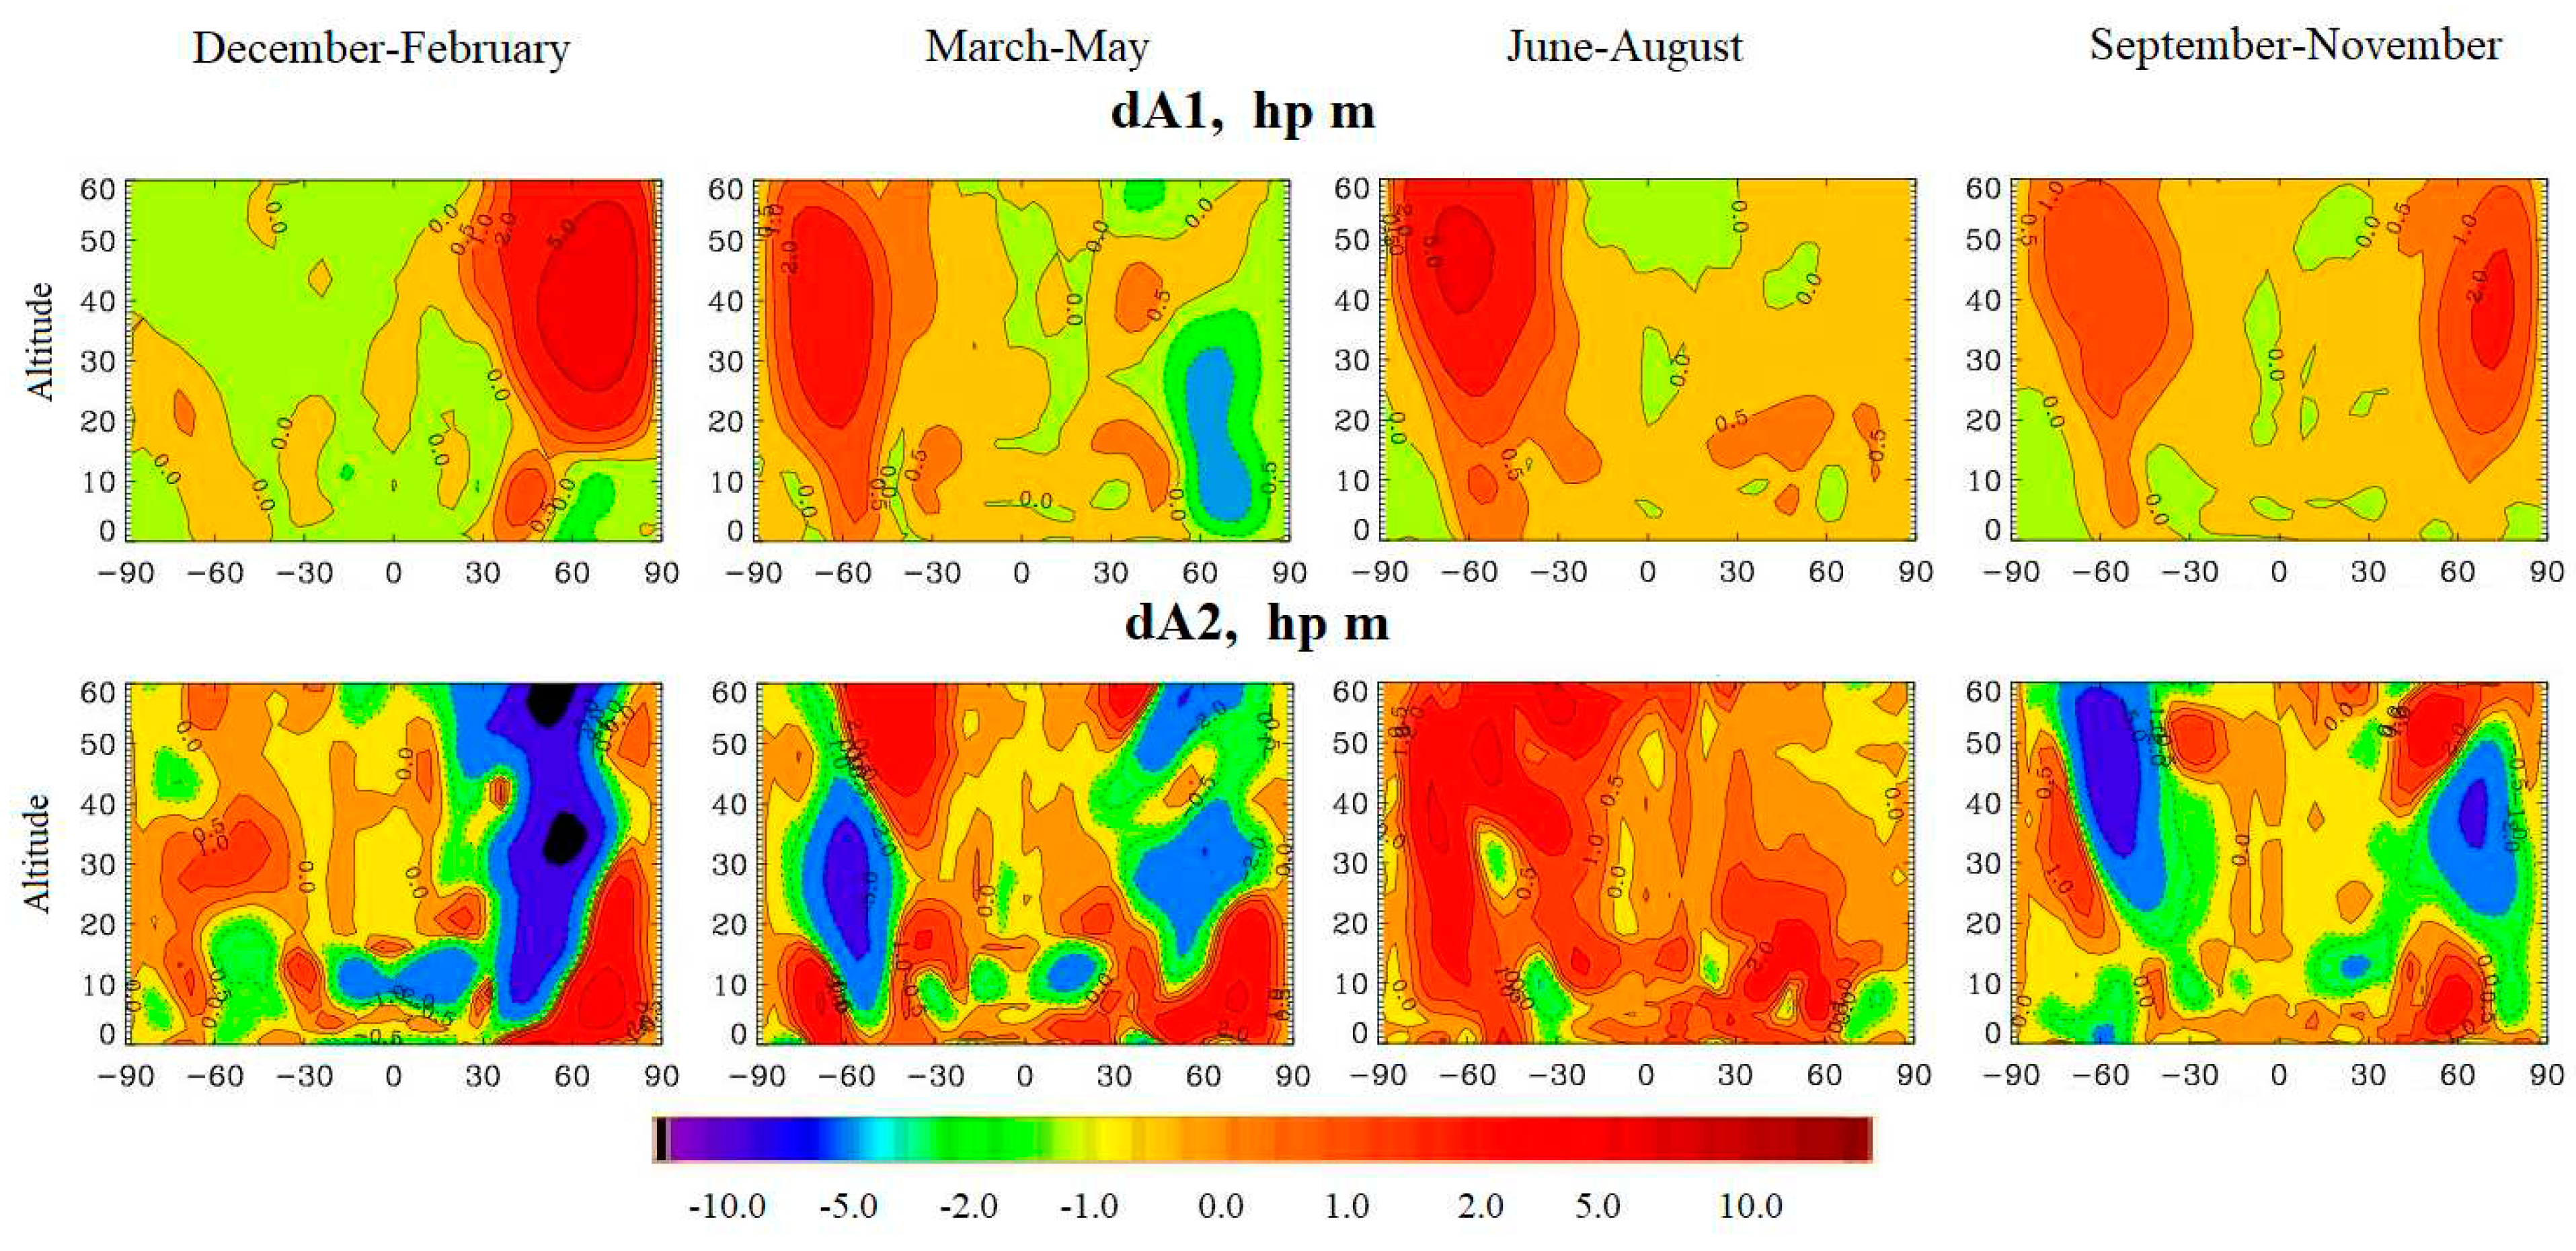
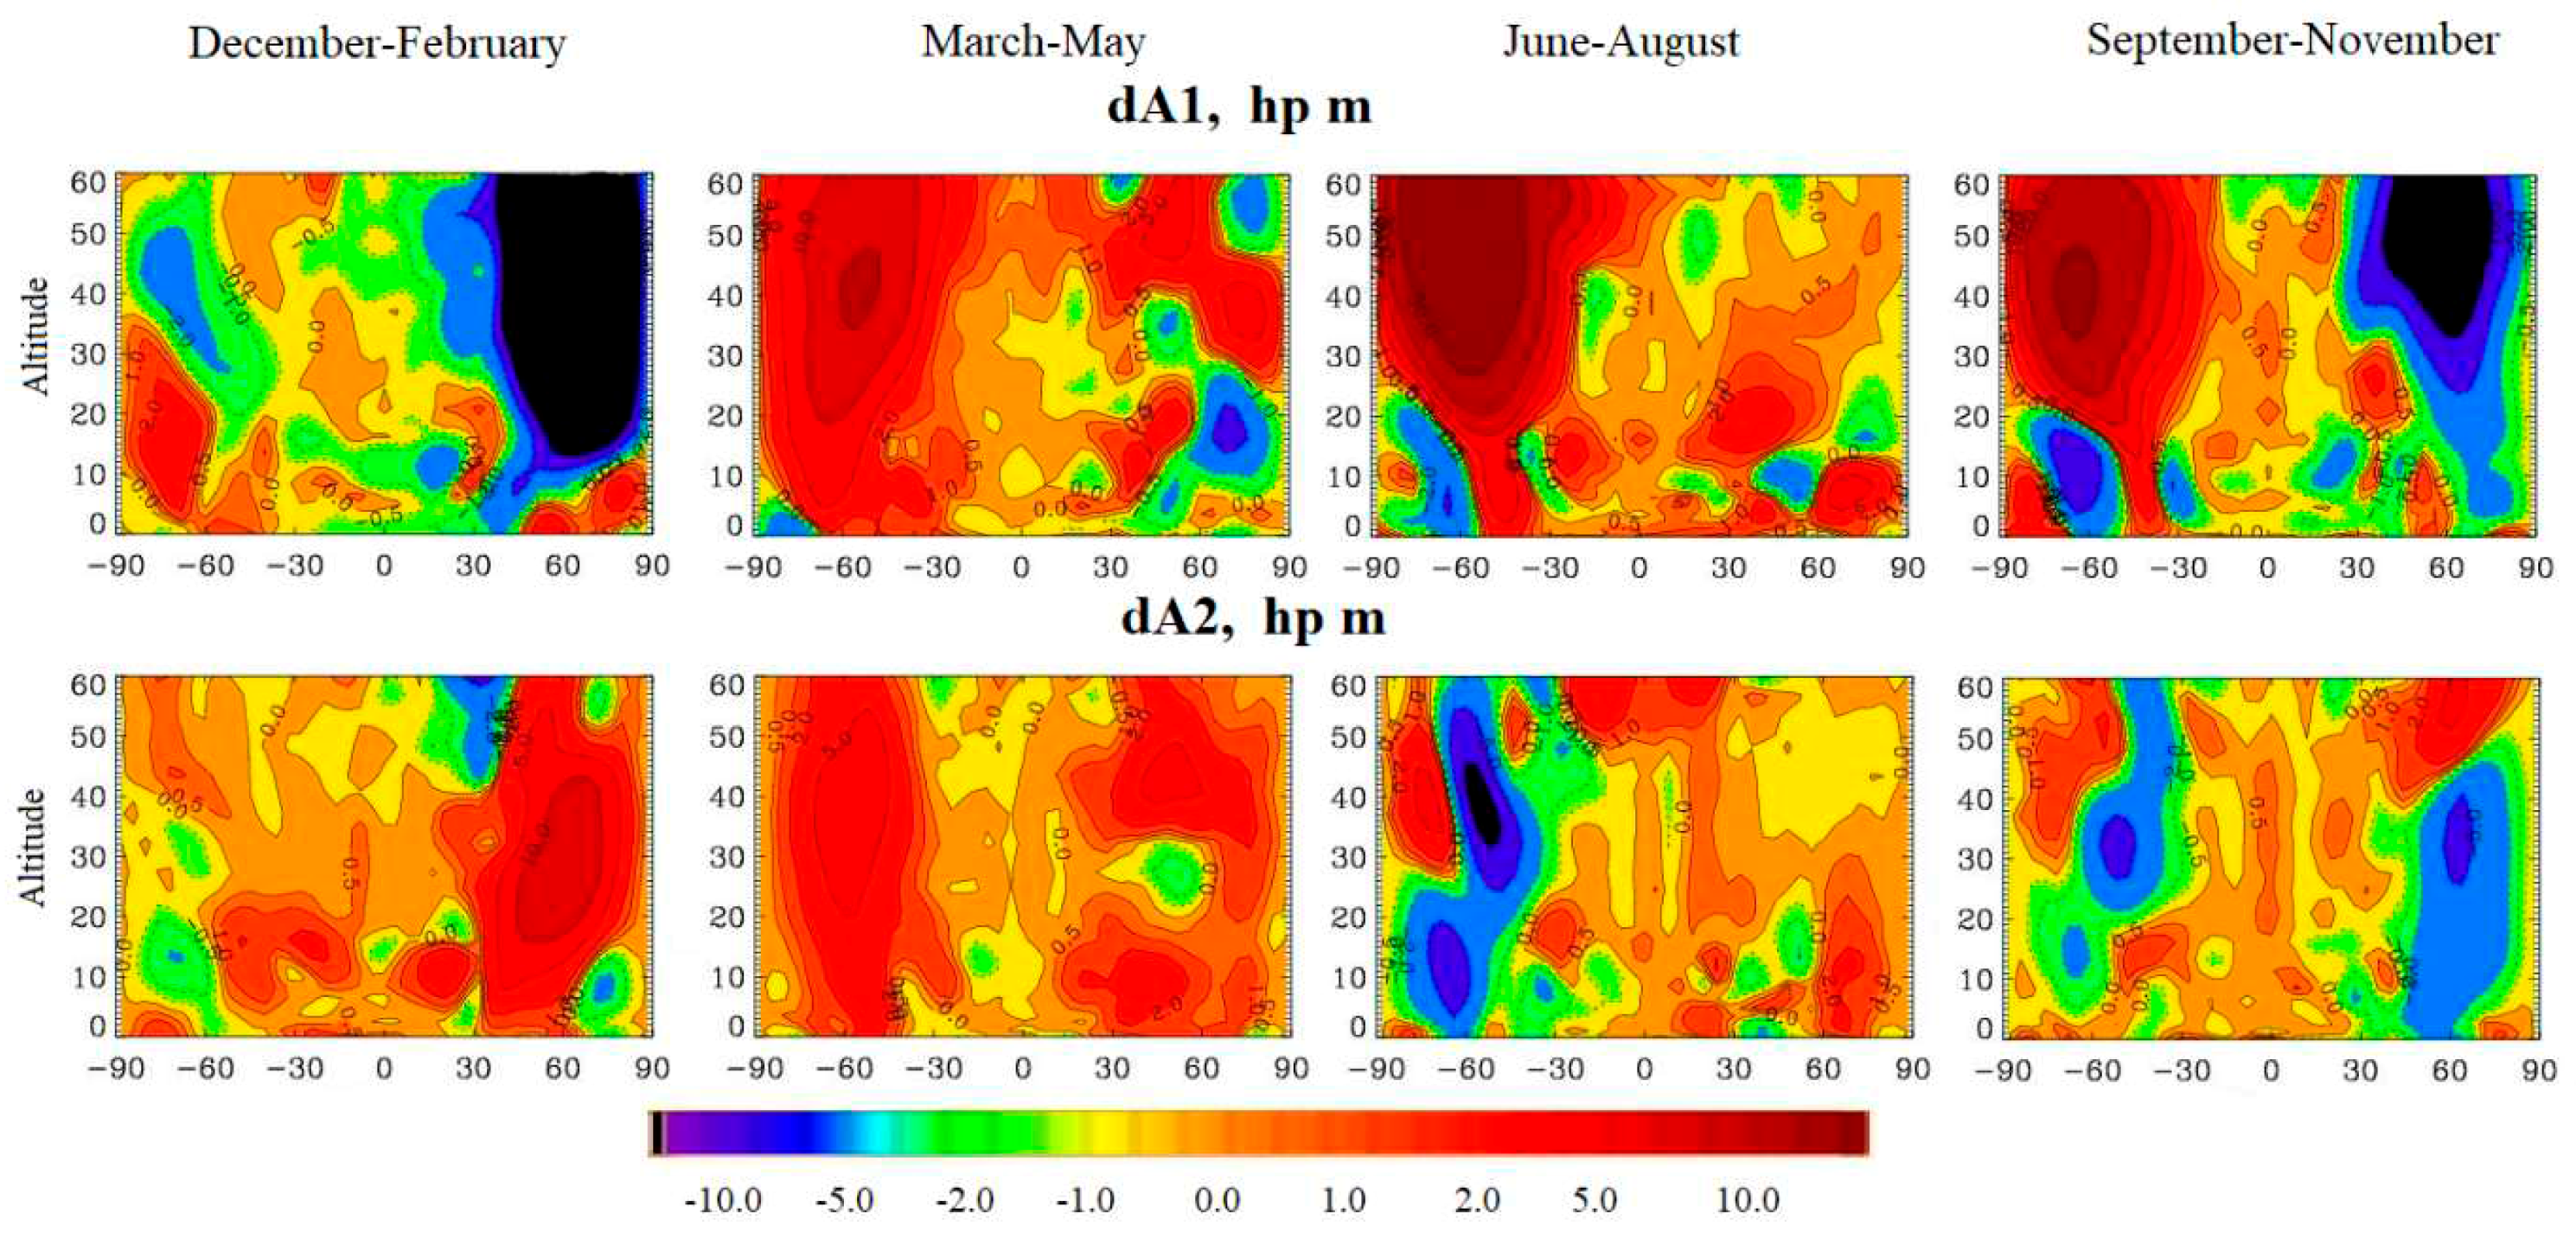
Also, to analyze the wave activity, the amplitude differences of planetary waves with wave numbers 1 and 2 were calculated from the experimental results for the El Niño phase and La Niña phase scenarios presented in
Figure 8.
As can be seen from the figure, in the Arctic stratosphere (60-90 latitudes, heights from 15 km) in the winter months there is an increase in the amplitude of this wave by 5 hp m. In the spring months, there is a decrease in amplitude at altitudes of 20-30 km by 1 hp m. During the summer months, the amplitude of the wave with number 1 in the Arctic increases by 0.5 hp m. In the fall months, this amplitude increases by 2 hp m throughout the Northern Hemisphere at altitudes of 15 km or more. As for the amplitude of the wave number 2 (
Figure 7, bottom), in the Northern Hemisphere at 30-60 latitudes, there are two centers of amplitude decrease by 2-5 gp m at altitudes of 10-30 km and at altitudes of 45-60 km in winter months, and amplitude increase by 2 gp m at 5-30 km. During the spring months, there is an increase in wave number 2 amplitude by 2 gp m at altitudes 5-30 km, and a decrease of 10 gp m at altitudes 25-60 km and 30-60 latitudes. In the summer months, the amplitude of the wave with number 2 increases by 2 hp m at the altitudes of 5-40 km near latitude 60, and in the autumn months in this place, but up to the altitude of 20 km, the amplitude increases by 1 hp m. At the same time in the autumn months one can also see a center of amplitude decrease by 2 hp m at the altitudes of 30-40 km. The increase in the amplitude of the wave with number 1 and decrease in the amplitude of the wave with number 2 in the Northern Hemisphere in winter and partly in spring and autumn months is connected with the increased heat flux to the stratosphere due to El Niño.
This heat flux leads to stratospheric heating and intensification of meridional processes, which lead to an intensification of the wave activity flux. As a result, there is an increase in the amplitude of the wave amplitude with number 1, and weakening of the amplitude of the wave amplitude with number 2, which contributes to the amplification of the wave activity flux that destroys the SPV, which leads to an increase in the Brewer-Dobson circulation and increases the air temperature and ozone content in the Arctic stratosphere. As for the Southern Hemisphere, the largest increases in the amplitudes of the number 1 wave are observed during the spring and summer months (by 2-5 hp m over the entire thickness of the Southern Hemisphere stratosphere), whereas during the fall months the amplitude of the number 1 wave increases by only 1 hp m. The amplitude of the wave with number 2 in the Southern Hemisphere decreases only in the spring and autumn months by 2 hp m in the region of latitude 60 at the altitudes of 15-40 km, whereas in the summer months it increases by 5 hp m over the entire stratospheric thickness. Thus, in the Southern Hemisphere, the effect associated with the Southern Oscillation is mainly manifested in the wave amplitude with number 1, indicating a weaker enhancement of the wave activity flux compared to the Northern Hemisphere. This is because the zonal wind is stronger in the Southern Hemisphere than in the Northern Hemisphere and therefore the SPV is more stable. Thus, the Southern Oscillation has a significant effect on planetary waves and wave activity in the Northern Hemisphere, and a weaker effect on waves and wave activity in the Southern Hemisphere.
3.3. Influence of the long-term SST trend on stratospheric processes
In this study, numerical experiments were carried out using simulation results from SST data for the conditions of the beginning of the period (early 1980s) and the end of the period (late 2010s). At the same time, as in the case of ENSO, the remaining factors were fixed at the level of 2020, which makes it possible to conduct a pure experiment to assess the influence of the SST trend on the structure and composition of the atmosphere.
Figure 9 (row 1) presents vertical profiles of air temperature differences between the modeling results for the end and beginning of the trend scenarios. As can be seen, a warming of 0.2-0.5 degrees is observed in the troposphere for all seasons. This confirms the warming of the troposphere that is occurring throughout the globe (global warming). In the stratosphere in the tropics, air temperature varies little throughout the year. Also, in the winter months there is a warming of 0.5-1 degrees in the Arctic stratosphere at altitudes of 30-60 km and in the spring by 2 degrees at altitudes of 20-40 km, which may be associated with an increase in heat flows into the stratosphere, a deepening of the Aleutian minimum and an increase in the probability of SSWs due to ocean warming. These heat fluxes influence the zonal wind and SPV, which contributes to the strengthening of the Brewer-Dobson circulation and warming of the Arctic stratosphere. At the same time, in winter there is also a decrease in temperature by 0.5 degrees at altitudes of 10-30 km. In spring and autumn at these altitudes there is a decrease in temperature of 1 degree. In the Southern Hemisphere, in the stratosphere there is a decrease in temperature by 0.5-1 degrees in the winter and autumn months at altitudes of 10-30 km, while in the summer and spring months there is an increase in temperature by 0.5 degrees at altitudes of 20-40 km and by 1 degree at altitudes 40-50 km, indicating a weaker increase in heat fluxes and the Brewer-Dobson circulation towards the South Pole compared to the Northern Hemisphere. This confirms the fact that the SST trend has less impact on stratospheric processes than ENSO.
Figure 9 (2nd row) shows the vertical profiles of the differences in ozone concentration between the modeling results for the end and beginning of the trend scenarios. Vertical profiles show that ozone concentration increases in the tropical troposphere by 2-5% in all seasons, and in the Arctic stratosphere by 2% at altitudes up to 10-30 km throughout the year due to heating of the stratosphere by vertical flows associated with ocean warming.
At the same time, during winter, spring and fall months, a decrease in ozone concentration over the Arctic by 1-2% at altitudes of 20-40 km is observed. These flows have an impact on the zonal wind, contributing to its weakening and weakening of the SPV. As a result, the meridional transport and the Brewer-Dobson circulation, which transports temperature and ozone from the tropics to the poles, may be enhanced. Thus, warming of the troposphere contributes to the increase of ozone concentration in the tropics and over the Arctic, which can be a sign of the Bruer-Dobson circulation strengthening and the increase of heat fluxes to the Arctic stratosphere. But this effect is weaker than in the case of ENSO. At the same time over the Antarctic, the ozone concentration decreases by 0. 5-1% at altitudes up to 20-30 km in winter and autumn months, and increases by 1-5% in summer and, especially, spring months, which can be connected with the influence of seasonal changes of ozone concentration in spring months and with weaker compared to the Northern Hemisphere heat fluxes and strengthening of the Brewer-Dobson circulation, due to which the strong zonal flux and the SPV remain very stable, which contributes to the air temperature decrease in the Antarctic stratosphere and favors the chemical processes in the Antarctic stratosphere with participation of bromine and chlorine. That is, the SST increase due to the multiyear trend contributes to deepening of the ozone hole in the Antarctic. Compared to ENSO, the influence of the trend on the ozone concentration is weaker and is manifested mainly in the in the Northern Hemisphere.
Figure 9 (3rd row) presents the vertical profiles of the differences in zonal wind speed between the simulation results for the end and beginning of the trend scenarios. As can be seen, there is an increase in the zonal flow over the Arctic during the year by 2 m/s, while in the summer months it weakens, as can be seen from the anomalies of the zonal wind speed of 0.5 m/s over the Arctic. Moreover, in the autumn months, at altitudes of 10-30 km near the pole, a reversal of the zonal wind is observed, which is evident from the negative anomaly of 0.5-1 m/s. At the same time, over Antarctica there is an increase in the zonal flow by 1 m/s throughout the year. This may be due to the fact that warming of the ocean, and therefore the troposphere, has a greater impact on the Arctic than on the Antarctic due to the geographic configuration of the Arctic (sea surrounded by land) and Antarctica (land surrounded by sea). That is, “Arctic amplification” is manifested - strong warming of the Arctic and increased heat flows into the stratosphere due to an increase in SST and air temperature in the Arctic troposphere, affecting the zonal wind. Warming of the troposphere contributes to a slight weakening of the zonal flow in the Northern Hemisphere, and an increase in the meridional flow, and may also contribute to SSW. The SSW in 2019 could also have an impact on the zonal flow. This could strengthen the Brewer-Dobson circulation, contributing to higher air temperatures and ozone levels in the Arctic stratosphere. At the same time, the effect of the SST trend on the zonal wind is much weaker compared to ENSO. In the Southern Hemisphere, the zonal flow is generally increasing, indicating its stability and the absence of any powerful heat flows into the Antarctic stratosphere, which could weaken the zonal wind and strengthen the Brewer-Dobson circulation, which may also be associated with a decrease in SST and air temperatures in Antarctica. The weakening of the zonal flux due to an increase in SST is less than that due to short-period SST fluctuations, and is manifested only in the Arctic stratosphere.
The distributions of air temperature differences, ozone concentration and total ozone content in the stratosphere are presented below (
Figure 10). These figures show an increase of ozone concentration and total ozone content by 1-3% over the tropical Pacific Ocean and by 0.5% in the Arctic stratosphere, and a decrease by 3-5% in the Antarctic stratosphere. We also see a 1-3% decrease in ozone concentration and total ozone content over the tropical Atlantic and over Siberia. The distribution of ozone differences is consistent with stratospheric air temperature (
Figure 10, bottom). Decreases in ozone concentration and content are observed mainly in the Southern Hemisphere over the Atlantic. In the Northern Hemisphere, ozone content increases, except in Siberia. The decrease in ozone in the tropics and increase in the Northern Hemisphere indicates an enhanced Brewer-Dobson circulation, which transports air temperature and ozone from the tropics to the poles, but this effect is much smaller than in the case of ENSO. In the Southern Hemisphere, the ozone transport to the Southern Hemisphere is practically absent, due to which the ozone content decreases.
As for the air temperature in the stratosphere (
Figure 9, bottom), a warming of 1-2 degrees is observed over the tropics, especially over the Pacific Ocean and Australia, and a warming of 1 degree over the Canadian Arctic. Also in the stratosphere there is a decrease in temperature in the Southern Hemisphere by 0.5-1.0 degrees, and over the Arctic in the region of Chukotka and Alaska - by 1-2 degrees. The increase in temperature over the Atlantic and North America is due to increased heat fluxes from the troposphere and SSW. SST changes have a much smaller effect on the stratosphere than on the troposphere, but, nevertheless, the ocean still affects it indirectly. Compared to ENSO, the influence of the SST trend on the stratosphere is less significant. However, an increase in SST still contributes to increased heat fluxes into the stratosphere, as can be seen from the increase in air temperature in the Northern Hemisphere. In the Southern Hemisphere, air temperatures are decreasing, indicating a weakening of heat fluxes into the stratosphere over Antarctica, and an increase in zonal flux.
Figure 11 presents the vertical profiles of the differences of the meridional (top) and vertical (bottom) components of the residual circulation between the modeling results for the end and the beginning of the trend scenarios. As can be seen, there is an increase of the meridional component above the equator by 2*10-2 m/s at the altitudes of 10-15 km, and an increase in the Northern Hemisphere in the spring and autumn months by 1-2*10-2 m/s. At the same time in winter months there is a decrease by 1-2*10-2 m/s, indicating a weaker strengthening of meridional transport from the tropics to the Northern Hemisphere compared to ENSO. In the vertical component, an increase of 2*10
-4 m/s in the tropical part of the troposphere and a decrease of 2*10
-4 m/s in the equatorial part of the troposphere are observed, indicating an enhanced heat flux to the stratosphere in the tropics and a weakening at the equator. There is also an increase in vertical flux by 2*10-4 m/s. This means that ocean and lower troposphere warming in the Northern Hemisphere due to "Arctic amplification" and general warming of the lower troposphere may contribute to enhanced heat fluxes into the Arctic stratosphere, resulting in stratospheric heating and SSWs that affect zonal wind and SPV in the Northern Hemisphere. As a result, the meridional transport of air masses from the tropical region to the Arctic region is enhanced. This contributes to the strengthening of the Brewer-Dobson circulation from the tropics to the North Pole due to the increase of the SST and, hence, to the warming of the Arctic stratosphere and increase of the ozone content in the Northern Hemisphere. In the Southern Hemisphere, the effect is practically absent as there is a decrease of SST and air temperatures in the troposphere, and the meridional transport from the tropics to the South Pole is insignificant. As a result, the zonal flux and SPV are stable, the air temperature decreases and the ozone content decreases due to chemical processes involving chlorine and bromine.
The vertical profiles of the differences in the zonal (
Figure 11, 1st row), meridional (
Figure 11, 2nd row) and vertical (
Figure 11, 3rd row) components and the divergence (
Figure 11, 4th row) of the Plumb wave activity flux between the modeling results for the end-of-trend and beginning-of-trend scenarios are presented below.
As can be seen, there is a decrease of 5-10 m2 s-2 in the zonal component over the Arctic at altitudes 20-50 km during winter months and at altitudes 30-60 km at latitude 60 during fall months, and an increase of 1 m2 s-2 at altitudes 10-30 km during winter and spring months, and at altitudes 40-60 km during fall months. The meridional component increases by 2-10 m2 s-2 at latitudes 30-90 degrees and altitudes 10-50 km during winter and fall months, and decreases by 1 m2 s-2 at altitudes 10-20 km during winter months. The verti- cal component decreases by 2-5*10-2 m2 s-2 around latitude 60 at altitudes 30-60 km during the winter months. We also see an increase in divergence by 2 s-2 at altitudes 40-60 km during the winter months. These changes indicate a slight strengthening of the wave activity flux from the tropics to the North Pole and to the Arctic stratosphere due to the "Arctic amplification", which may contribute to the heat transport to the Arctic stratosphere, and, as a consequence, weakening the zonal flux and destroying the SPV, contributing to the strengthening of the Brewer-Dobson circulation and increasing the ozone content.
Figure 12.
Vertical zonal mean seasonal profiles of differences of zonal (1 row), meridional (2 row) (in m2 s-2), vertical (3 row) (in 102 m2 s-2) and divergence (in s-2) (4 row) components of the residual circulation based on modeling results for the scenarios of the late 2010s and early 1980s.
Figure 12.
Vertical zonal mean seasonal profiles of differences of zonal (1 row), meridional (2 row) (in m2 s-2), vertical (3 row) (in 102 m2 s-2) and divergence (in s-2) (4 row) components of the residual circulation based on modeling results for the scenarios of the late 2010s and early 1980s.
Above the Antarctic, one observes an increase by 10 m2 s-2 at 30-60 km heights in the summer months of the zonal component; an increase by 2-5 m2 s-2 at 30-60 km heights in the summer and autumn months of the meridional component and an increase by 2*10-2 m2 s-2 in summer of the vertical component. At the same time, there are no significant amplifications of the wave activity flux components at the altitudes of 20-30 km. One can also see an increase in the con-vergence by 5 s-2 in summer and fall months at altitudes of 40-60 km. This indicates that there is no heat transfer from the troposphere to the Antarctic stratosphere in the Southern Hemisphere due to the decreased SST and air temperature in the Antarctic. Therefore, the zonal flux and SPV are stable, the Brewer-Dobson circulation is not intensified and the ozone content is decreased. In contrast to ENSO, the ocean warming due to the trend has a smaller impact on the wave activity flux. But the positive anomalies of the meridional component in the Arctic stratosphere indicate an intensification of this component, which contributes to the instability of the planetary Rossby waves, and to the weakening of zonal transport and destruction of the SPV.
Figure 13 shows the differences in the amplitudes of planetary waves with wave number 1 (top) and wave number 2 (bottom) according to the experimental results for the end and beginning of the trend scenarios.
As can be seen from the figure, in the Arctic stratosphere in the winter months at altitudes 20-60 km there is a decrease in the amplitude of the wave number 1 by 5-10 hp m at altitudes 20-60 km. During the spring months, a decrease of 2 hp m in amplitude is observed at 10-20 km and 50-60 km altitudes in the Arctic, with a 0.5-1.0 hp m increase in amplitude at 30-45 km altitudes. During the summer months, the amplitude in the Arctic does not change much. During the fall months, there is a decrease of 5 hp m in amplitude at altitudes of 20-60 km in the Northern Hemisphere. Regarding the amplitude of the wave number 2 (
Figure 12, bottom), an increase of 10 hp m in amplitude is observed at altitudes of 5-50 km over the Arctic during the winter months. In the spring months, a 5 hp m increase in amplitude is observed at altitudes 5-60. During the fall months, the amplitude of the wave number 2 decreases by 5 hp m throughout the Northern Hemisphere. The decrease in the amplitude of the number 1 wave and increase in the amplitude of the number 2 wave during the winter months in the Northern Hemisphere indicates very little or no enhancement of the heat flux due to the upward trend of the SST and the "Arctic Boost" that contribute to the meridional flux and wave activity flux that inhibits zonal wind and destroys the SPV. However, the effect associated with the SST trend is very weak compared to the effect of the Southern Oscillation. As a result, the Brewer-Dobson circulation is practically not enhanced and the air temperature and ozone content in the stratosphere of the Northern Hemisphere do not change much.
As for the Southern Hemisphere, in the winter months at altitudes of 30-50 km, the amplitude of the wave number 1 decreases by 0.5-1 hp m, while at 10-30 km it increases by 2 hp m. In the spring, summer and autumn months at the altitudes of 20-60 km, the amplitude increases by 5-10 hp m. The amplitude of the wave with number 2 decreases in the autumn months by 1 hp m in the region of latitude 60 and altitudes of 20-40 km, and in the summer months - by 5 hp m throughout the stratosphere. In the spring months, the amplitude of the wave number 2 increases by 5 hp m over the entire stratosphere. Thus, in the Southern Hemisphere, the effect associated with the SST trend is manifested in a decrease in the amplitude of the wave with number 2 in the summer and fall months and an increase in the amplitude of the wave with number 1. The increase in the amplitude of the wave with number 1 indicates an increase in the flux of wave activity in the Southern Hemisphere due to the influence of the SST trend. However, analysis of air temperature, ozone concentration and zonal wind (
Figure 8,
Figure 9 and
Figure 10) indicate a steady SPV and decreasing ozone concentration in the Southern Hemisphere. This indicates a very weak effect on the zonal wind and the persistent SPV, leading to a deepening of the ozone hole in the Southern Hemisphere. Thus, the SST trend has an impact on the planetary waves and wave activity only in the Northern Hemisphere.
