Submitted:
31 December 2023
Posted:
02 January 2024
You are already at the latest version
Abstract
Keywords:
1. Introduction
1.1. RFID Techniques in Wildlife Tracking
1.2. Radio-Tracking Techniques in Acorn Dispersal
1.3. Our Motivations and Contributions
2. Materials and Methods
2.1. Determining the Operation Range of the RFID System
2.2. Selection of RFID Tags for Experimental Studies
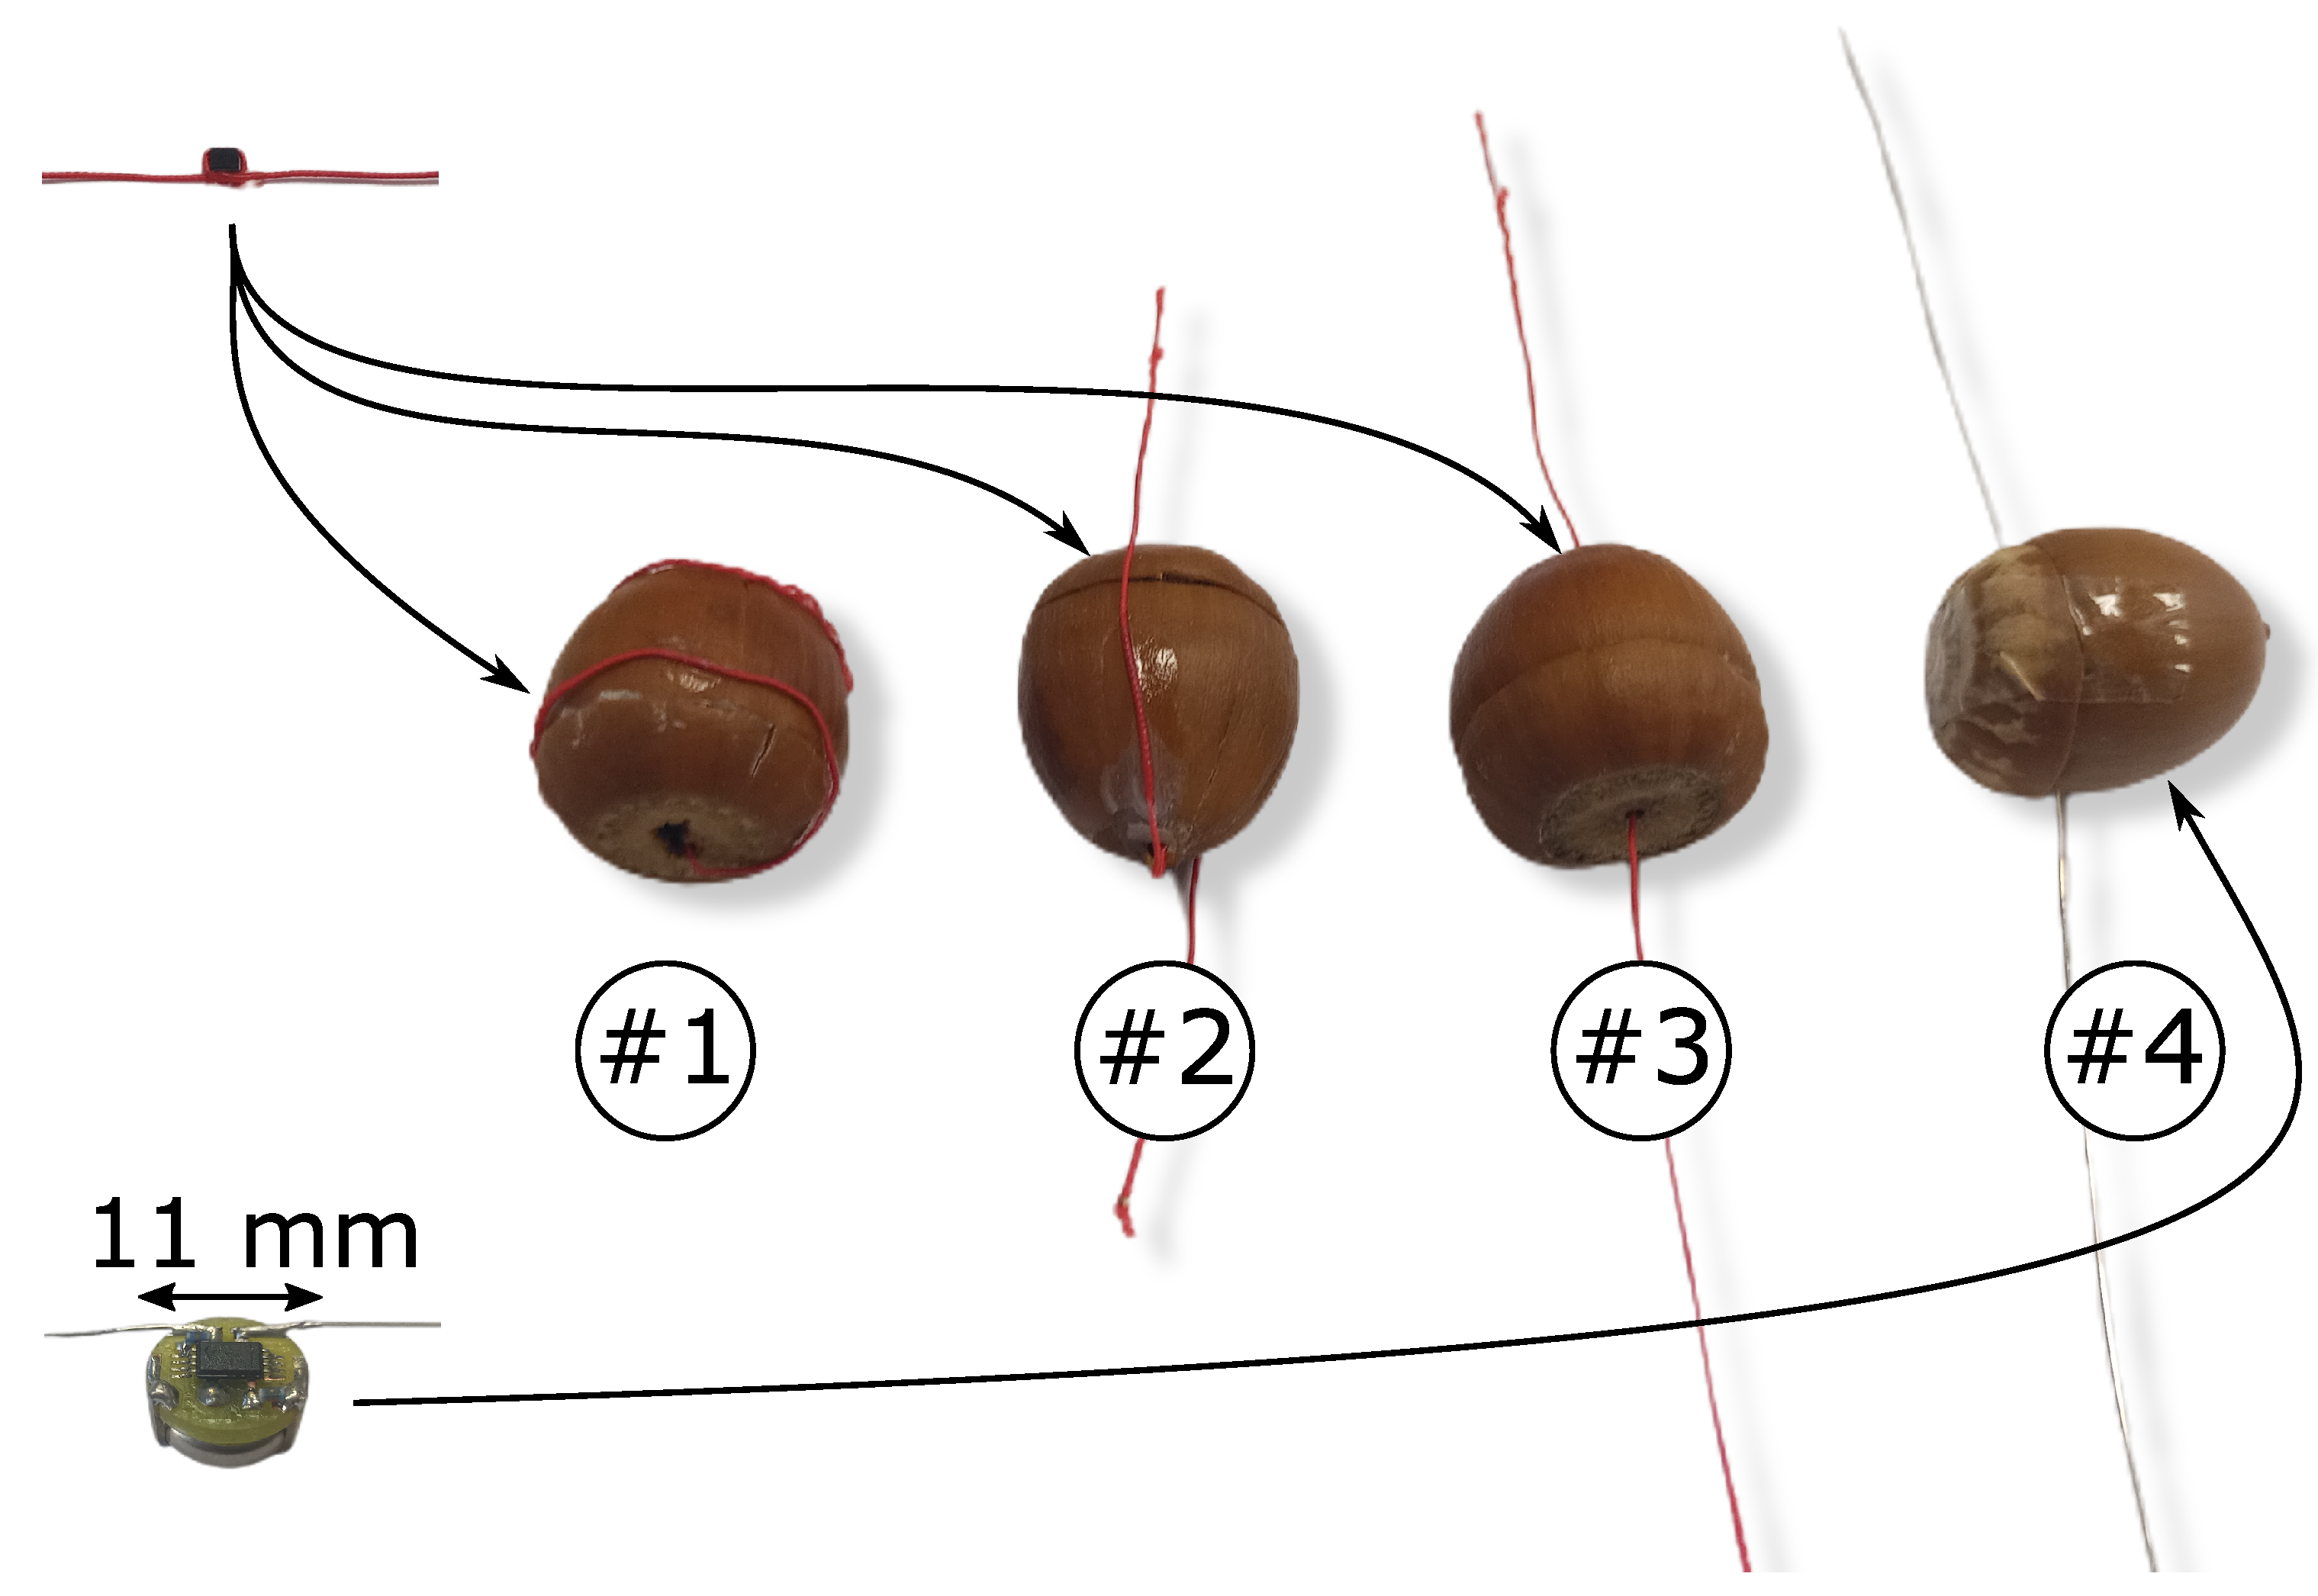
 in Figure 1), the s-shaped configuration
  and the straight line configuration
  , and one straight line configuration for the semi-passive tag
  .
.2.3. Laboratory Experimental Set-Up
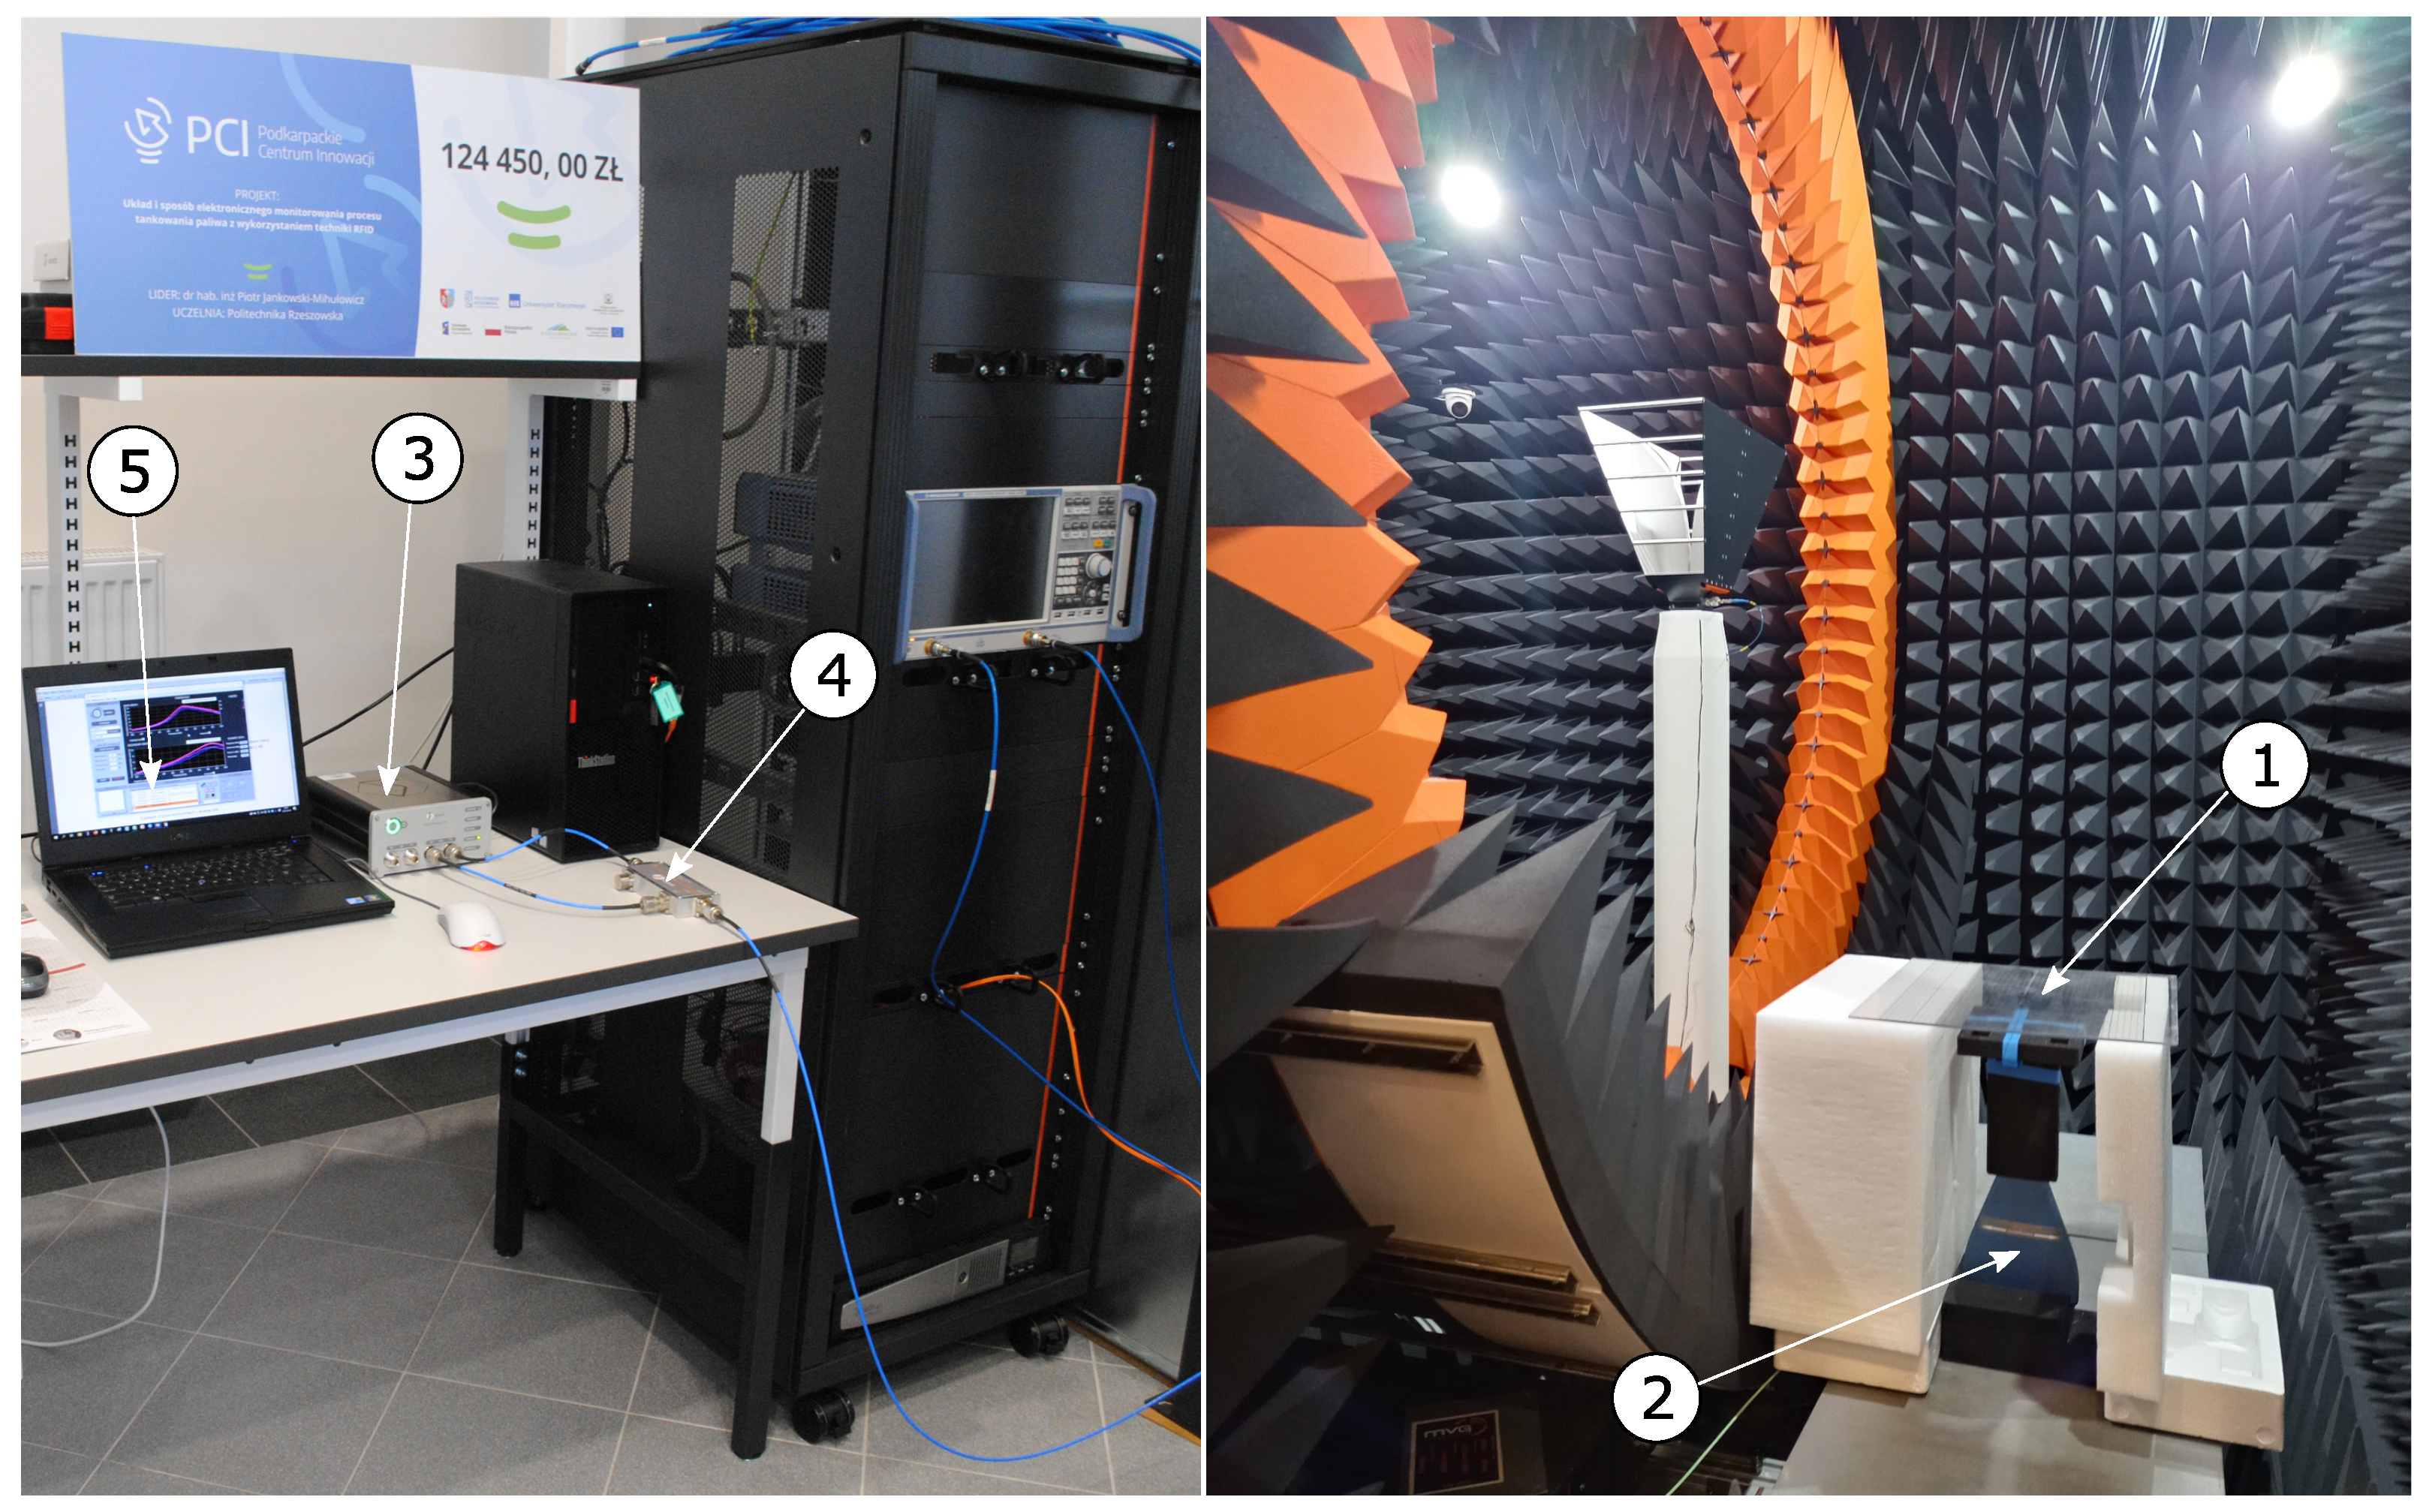
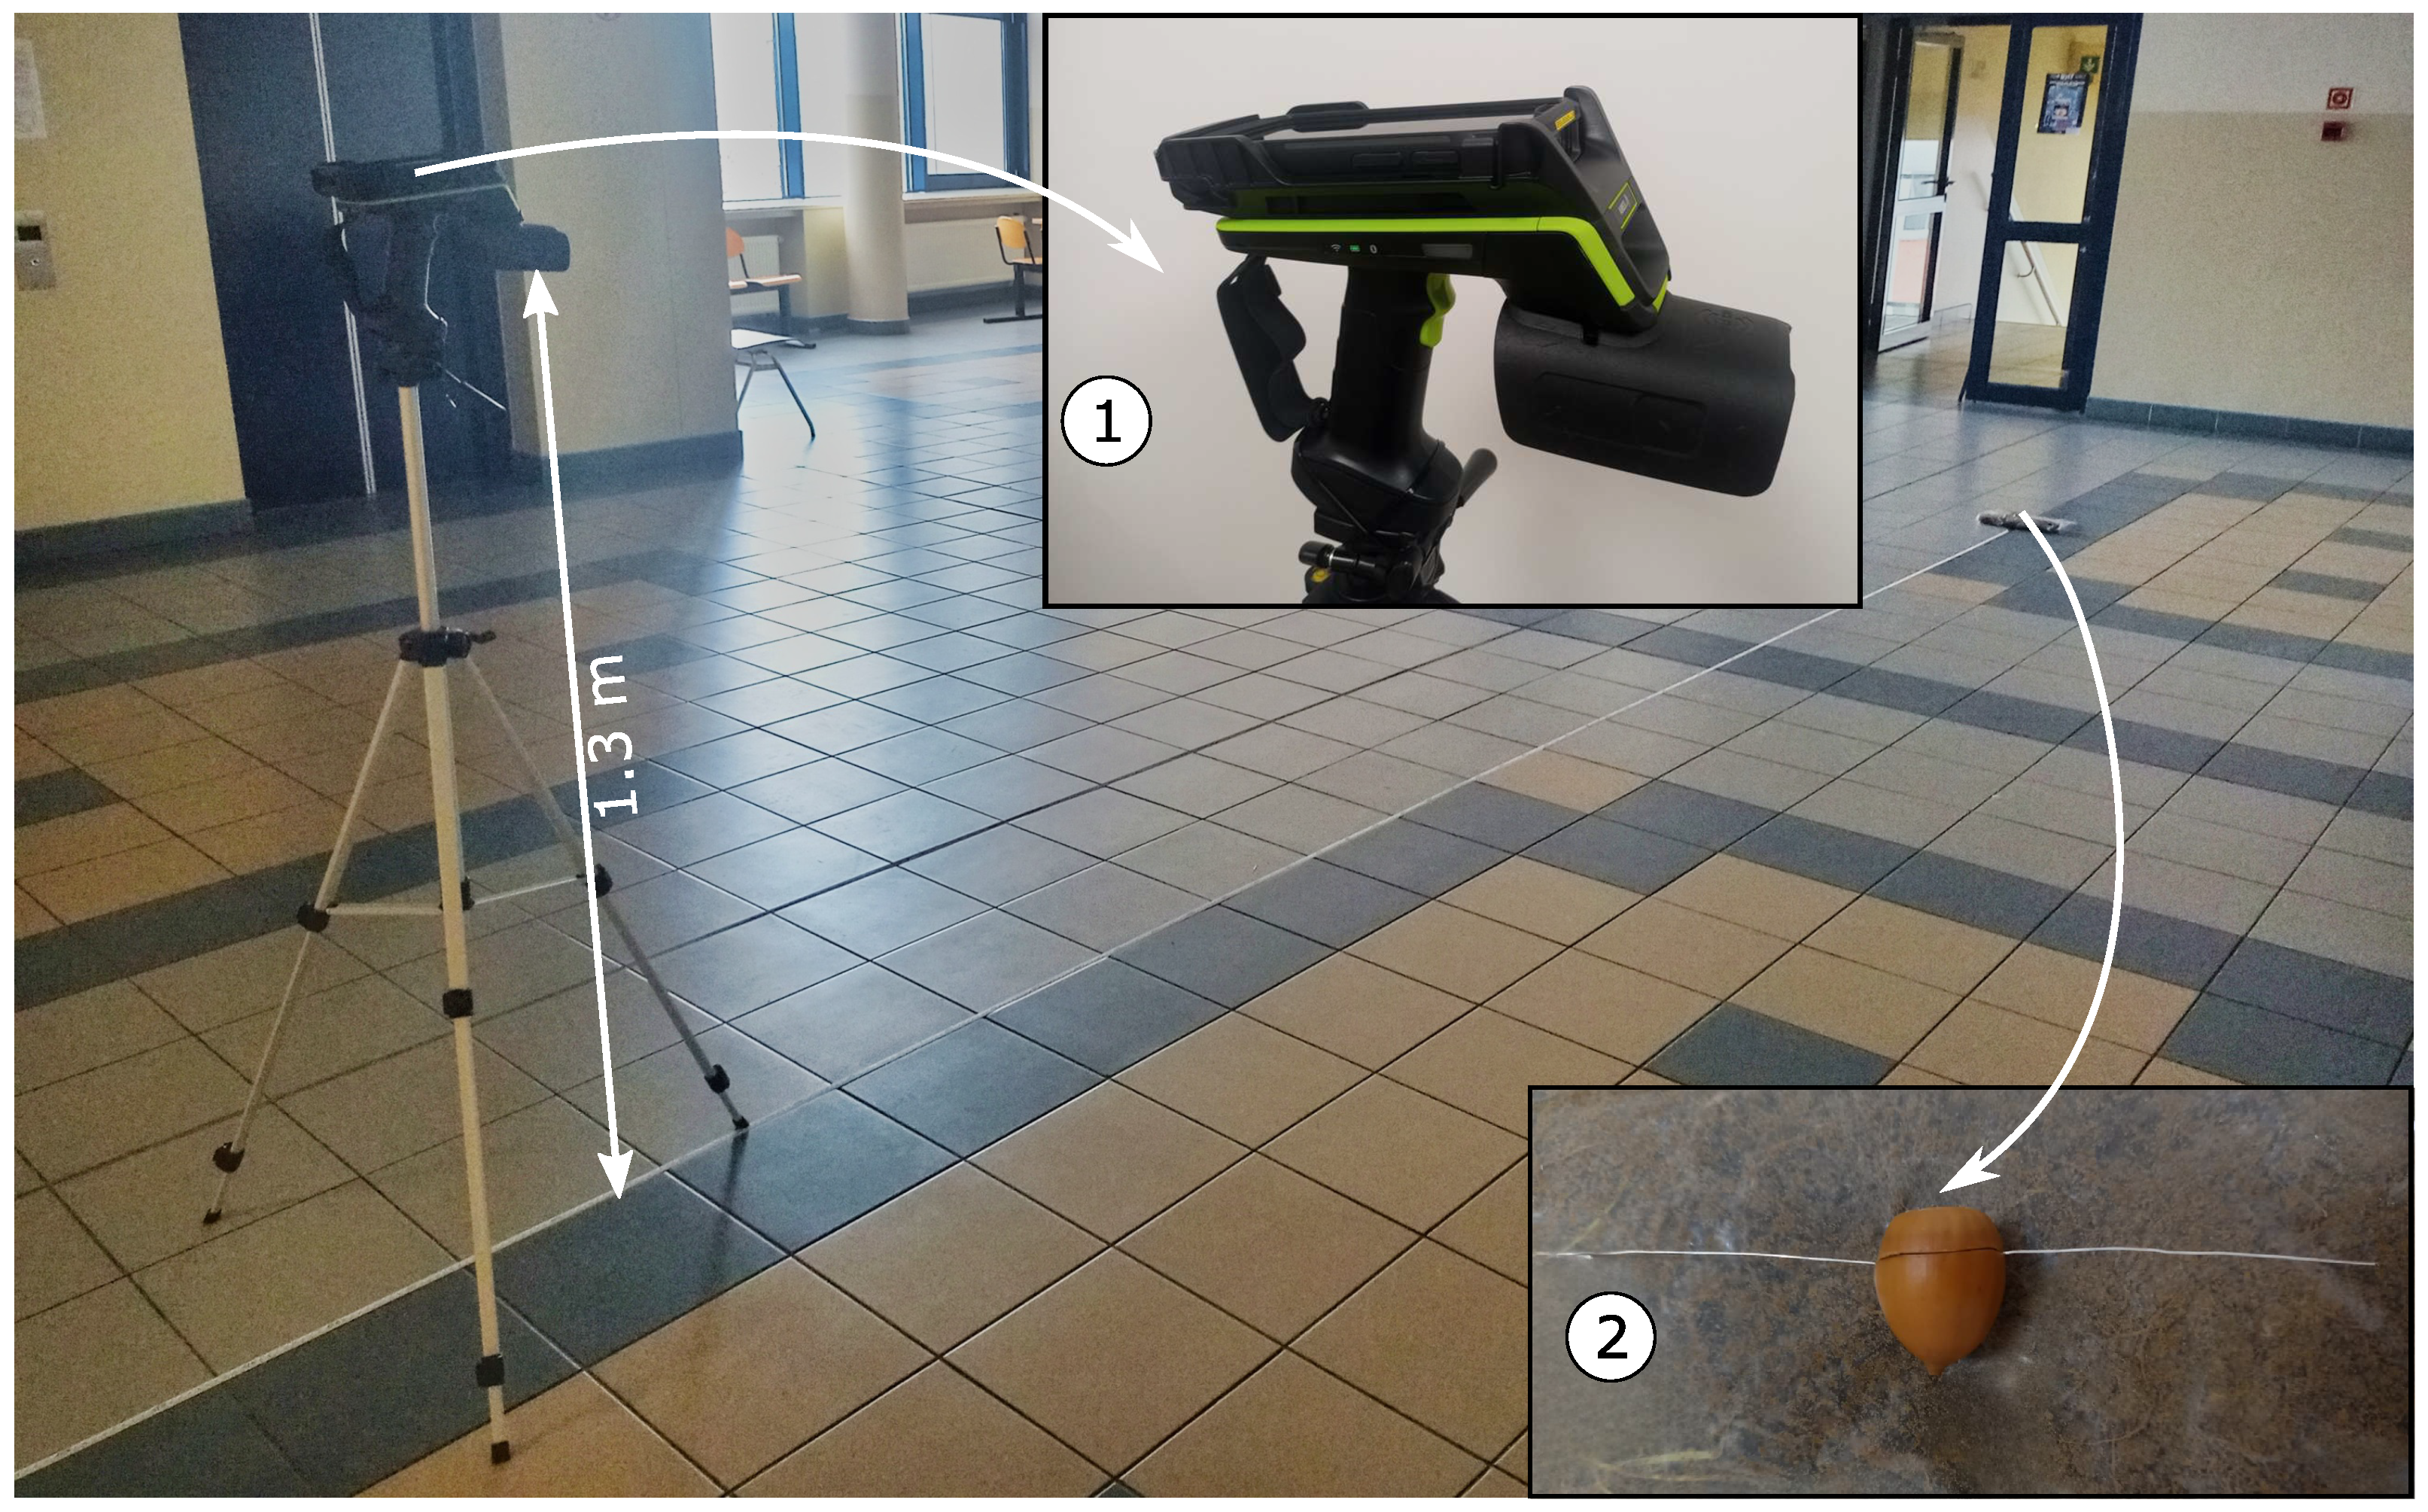
2.4. Experimental Set-Up under Quasi-Real Conditions
3. Results
3.1. Laboratory Experiments Results
 and
and  can therefore be immediately ruled out as useless. Configuration
  i.e. a passive tag with a straight line antenna gives a good result for Read range reverse, but the result for Read range forward is poor (the chip can be sufficiently powered up from a distance of no more than about 7 m). The best results were obtained for sample
  with a semi-passive RFID tag, for which the Resulting read range was 24.6 m. Given the results obtained in the first laboratory test, it was decided that further tests would only be carried out on the RFID acorn sample
  .
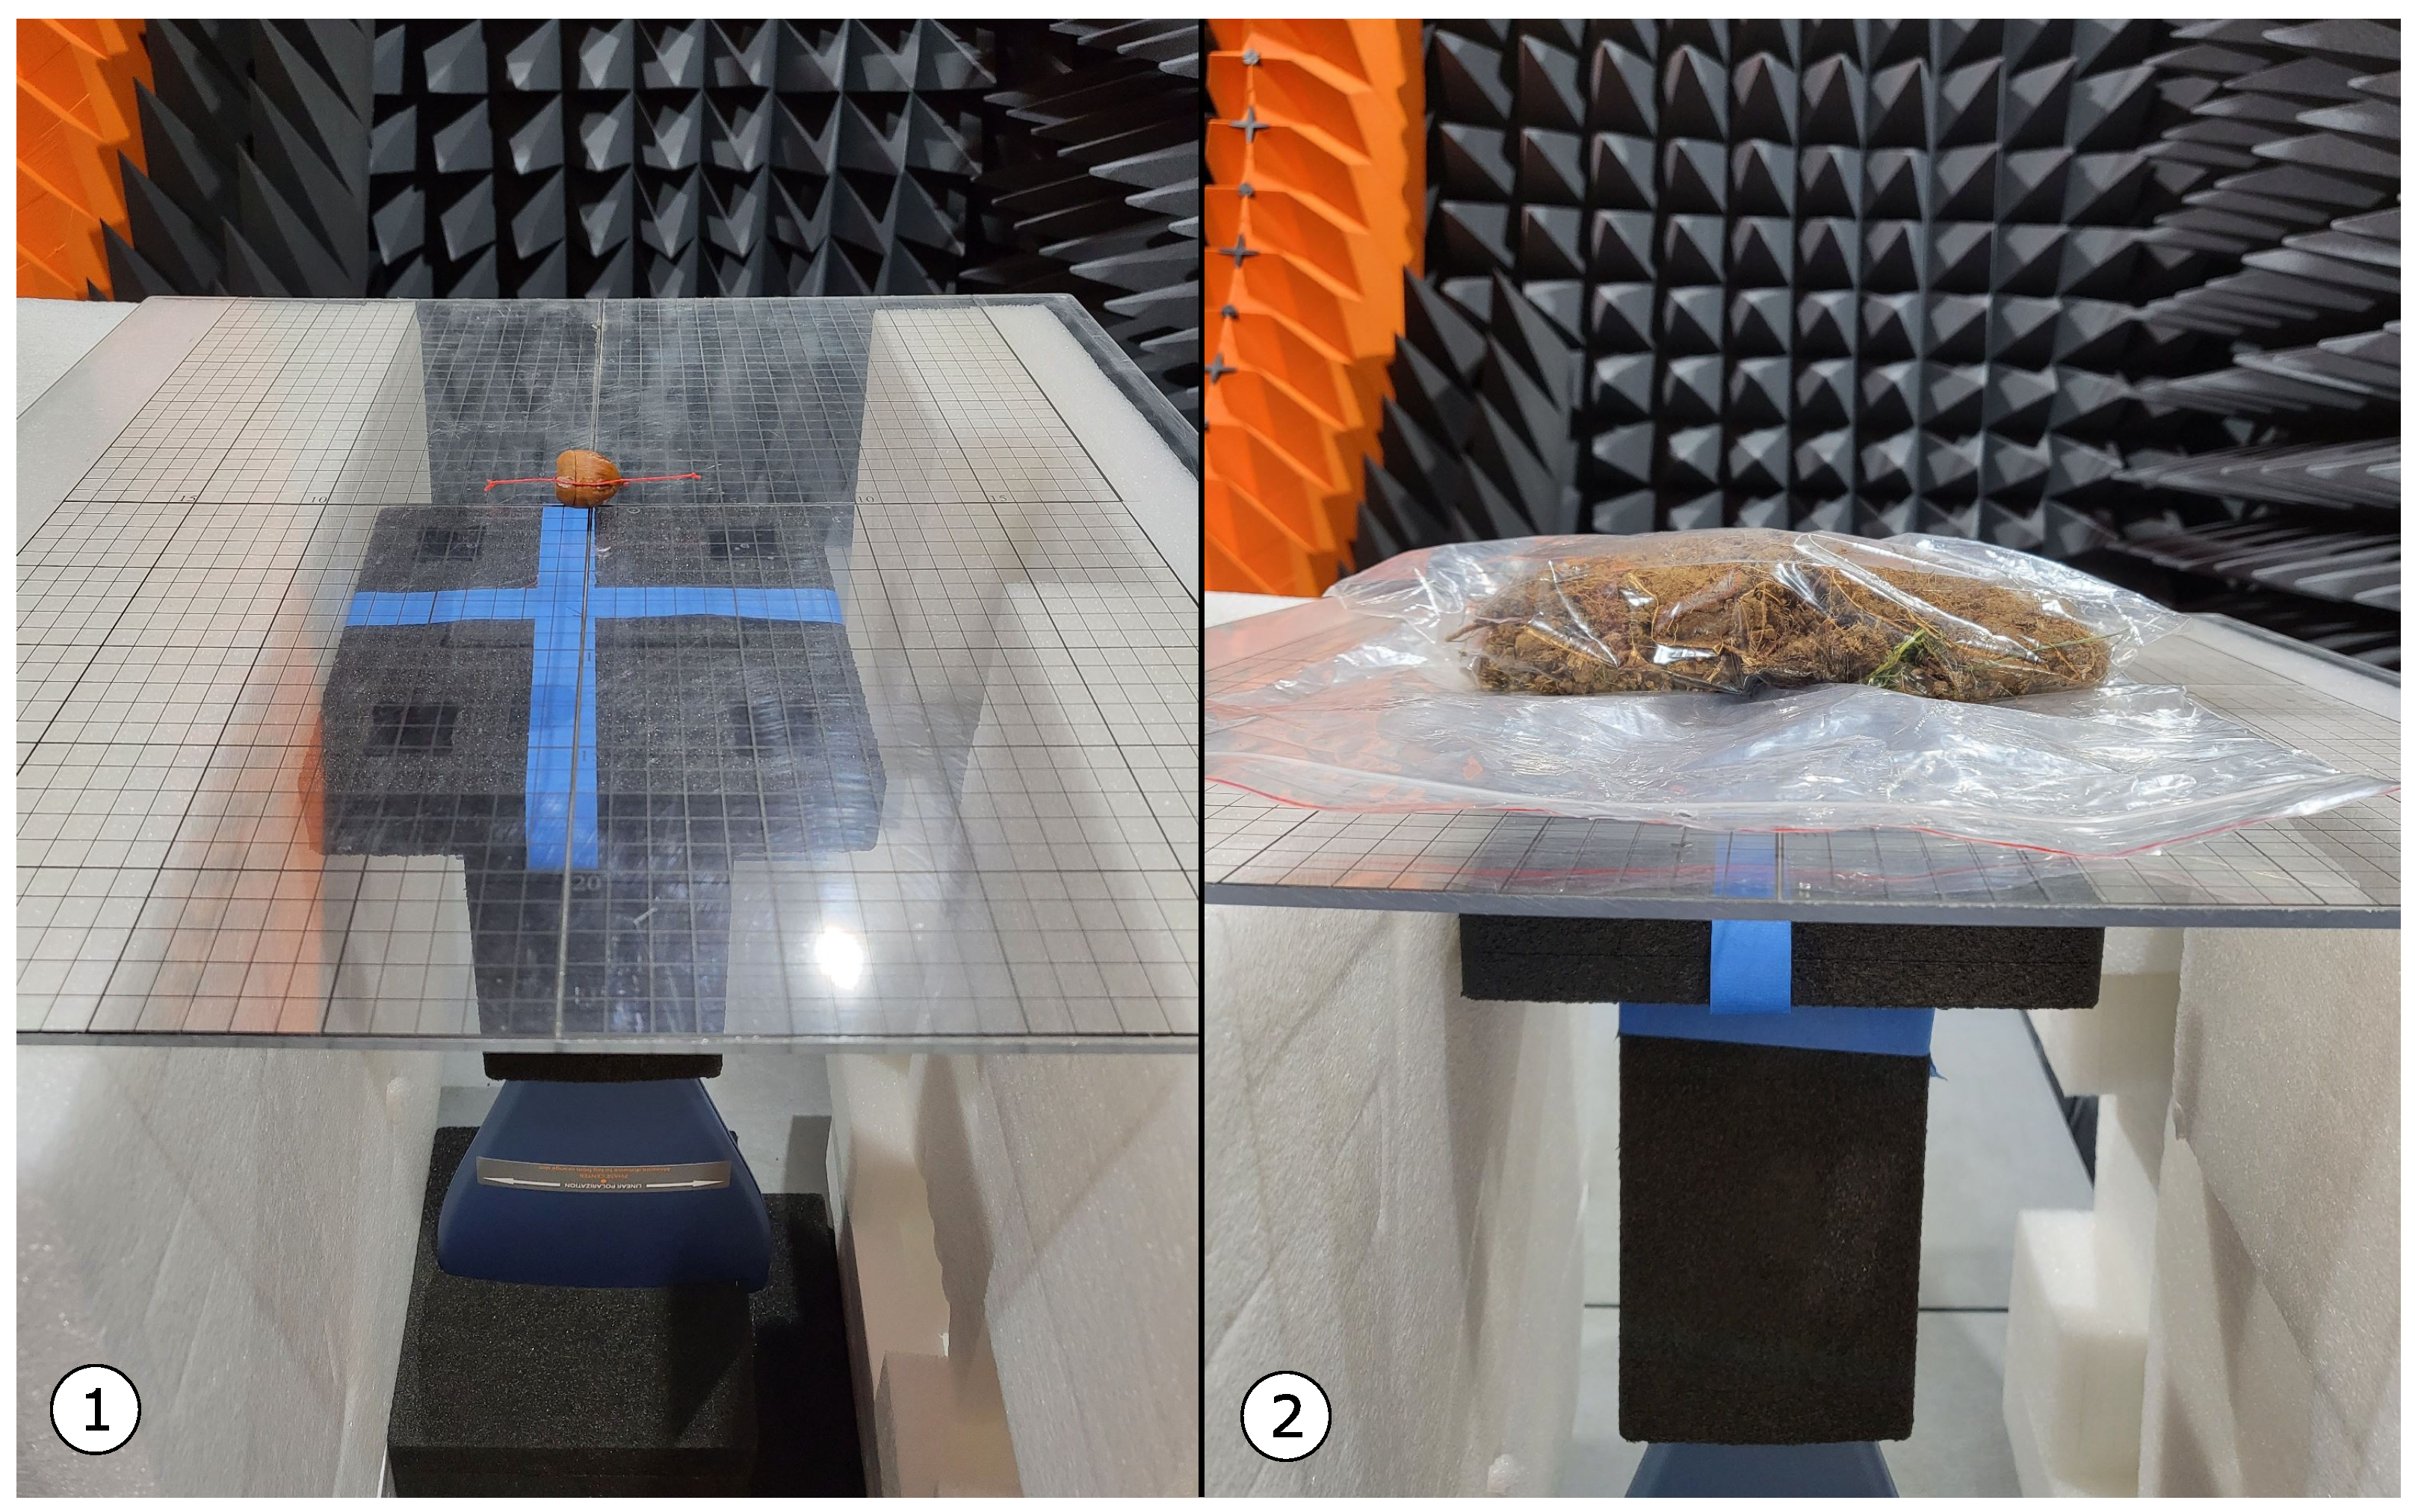
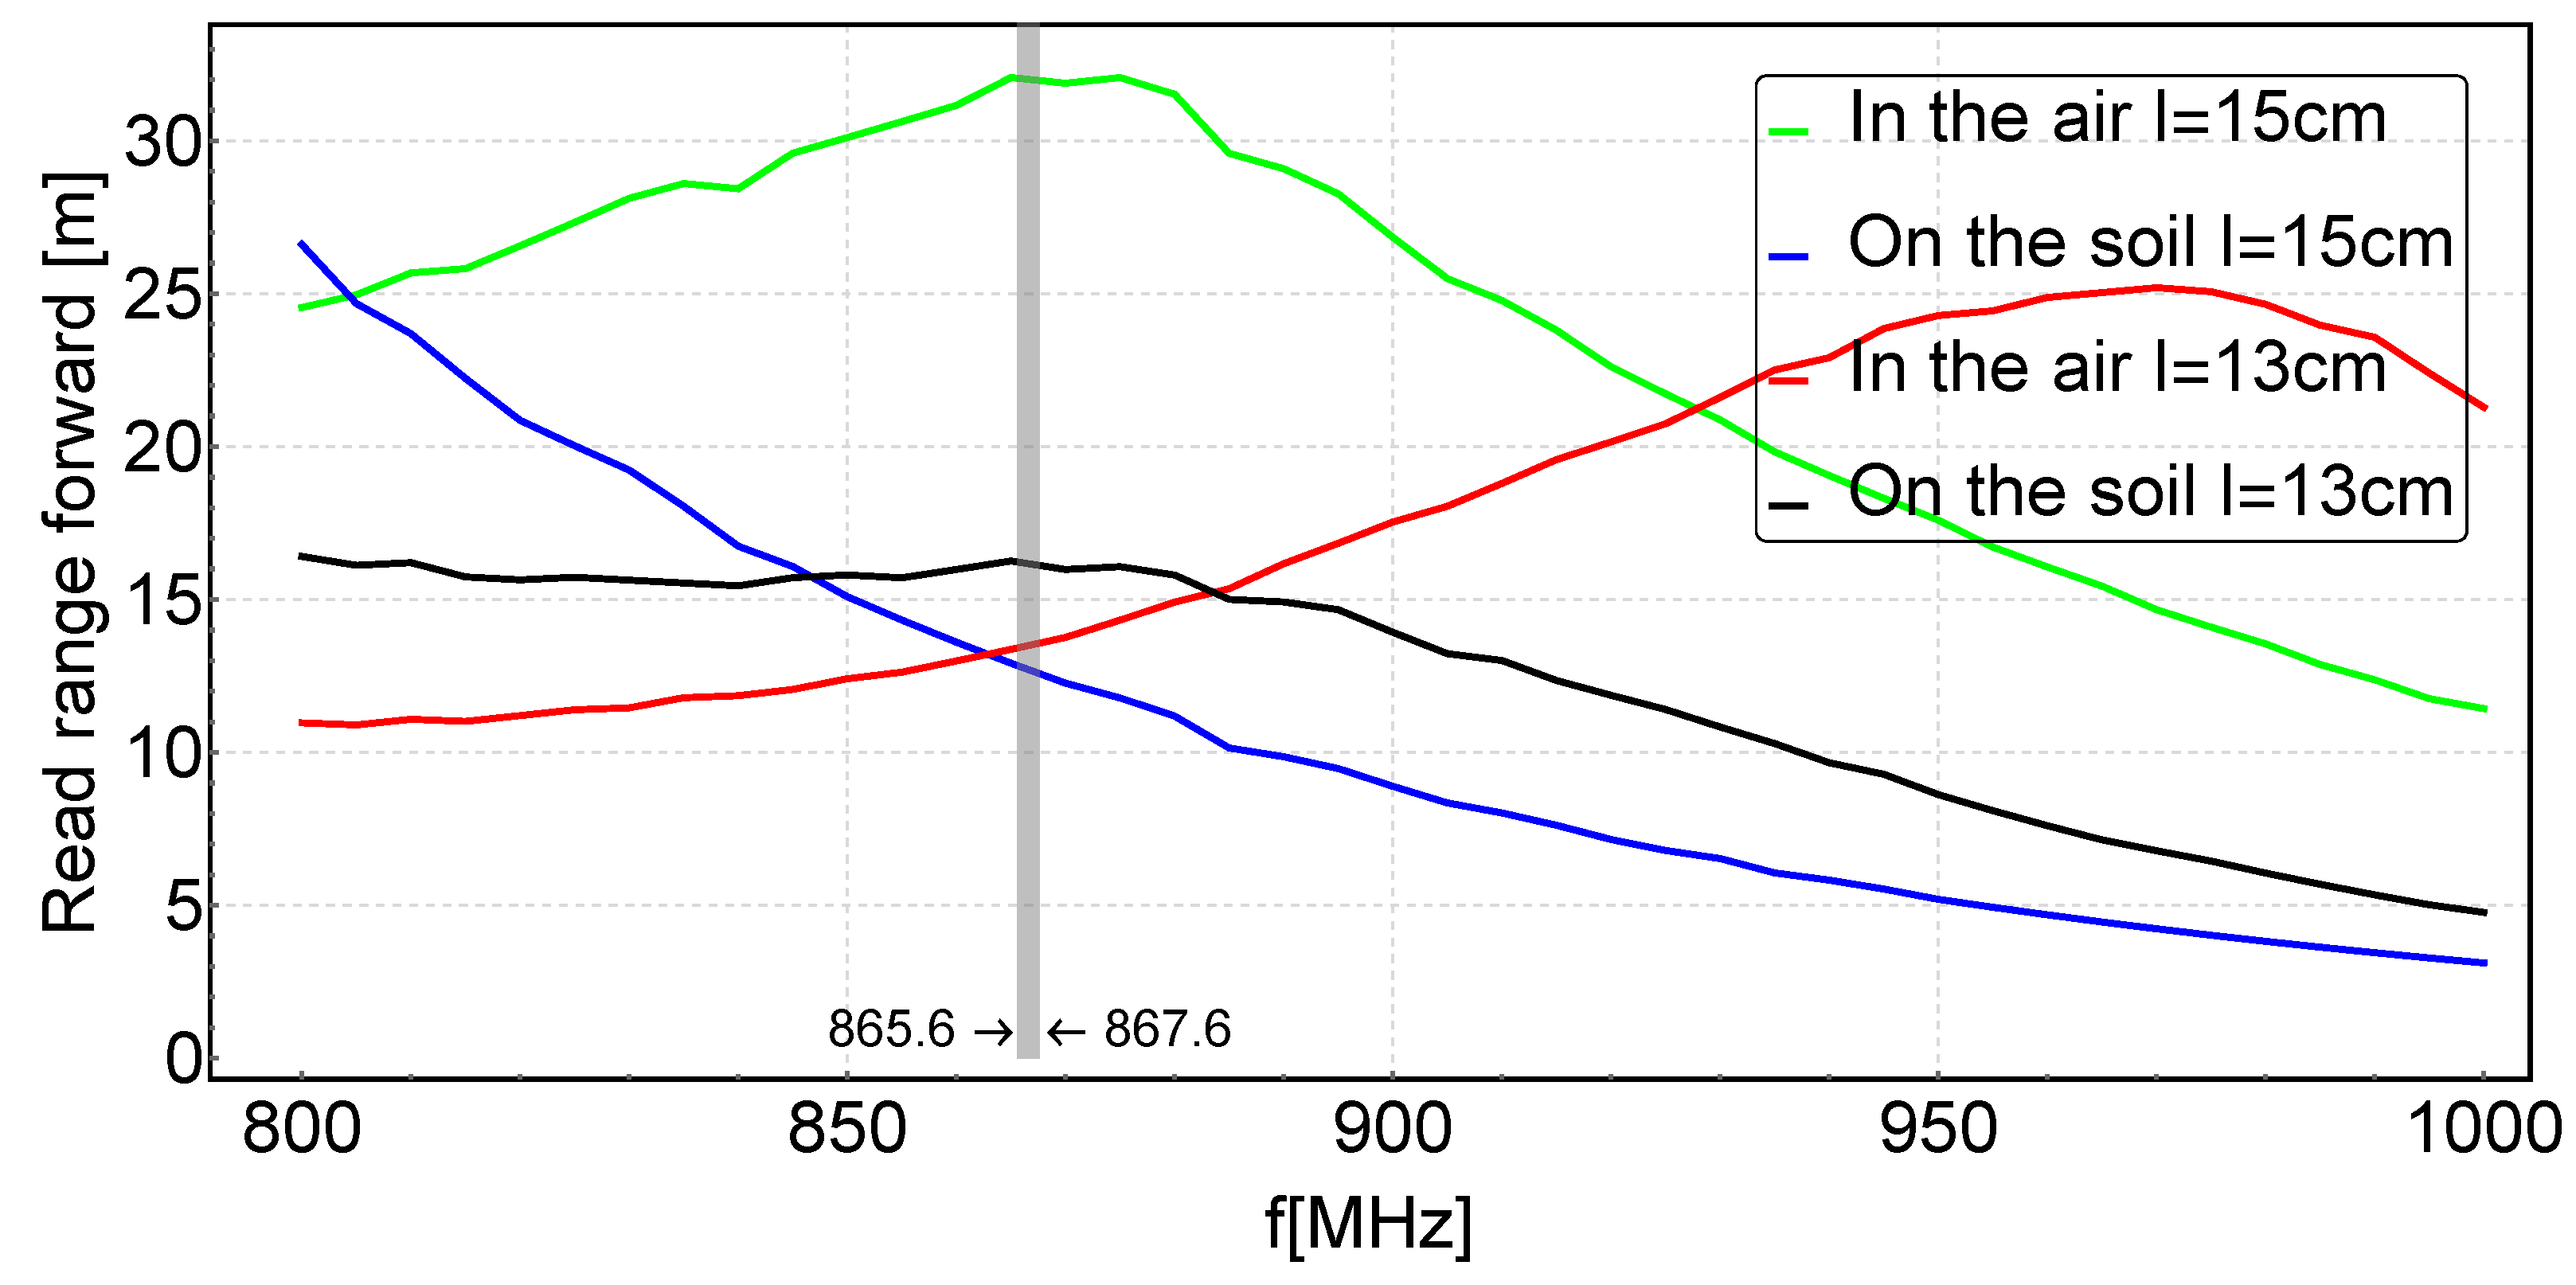
. in a quasi-real environment, i.e. a soil environment (see ②in Figure 3). The response of the chip was investigated for data transmission performed in the 800-1000 MHz band. The performed study showed that the read range of the RFID acorn on the soil decreased. Furthermore, the RFID antenna system became untuned due to the presence of the soil in close neighbourhood of the tag. As can be seen in Figure 6, a 15 cm long antenna tuned to 868 MHz appeared to be untuned in the soil environment, whereas a 13 cm long antenna appeared to be tuned. The phenomenon of performance degradation of UHF RFID tags in the neighbourhood of a material surface is well known and has been described for example in papers [33,34].
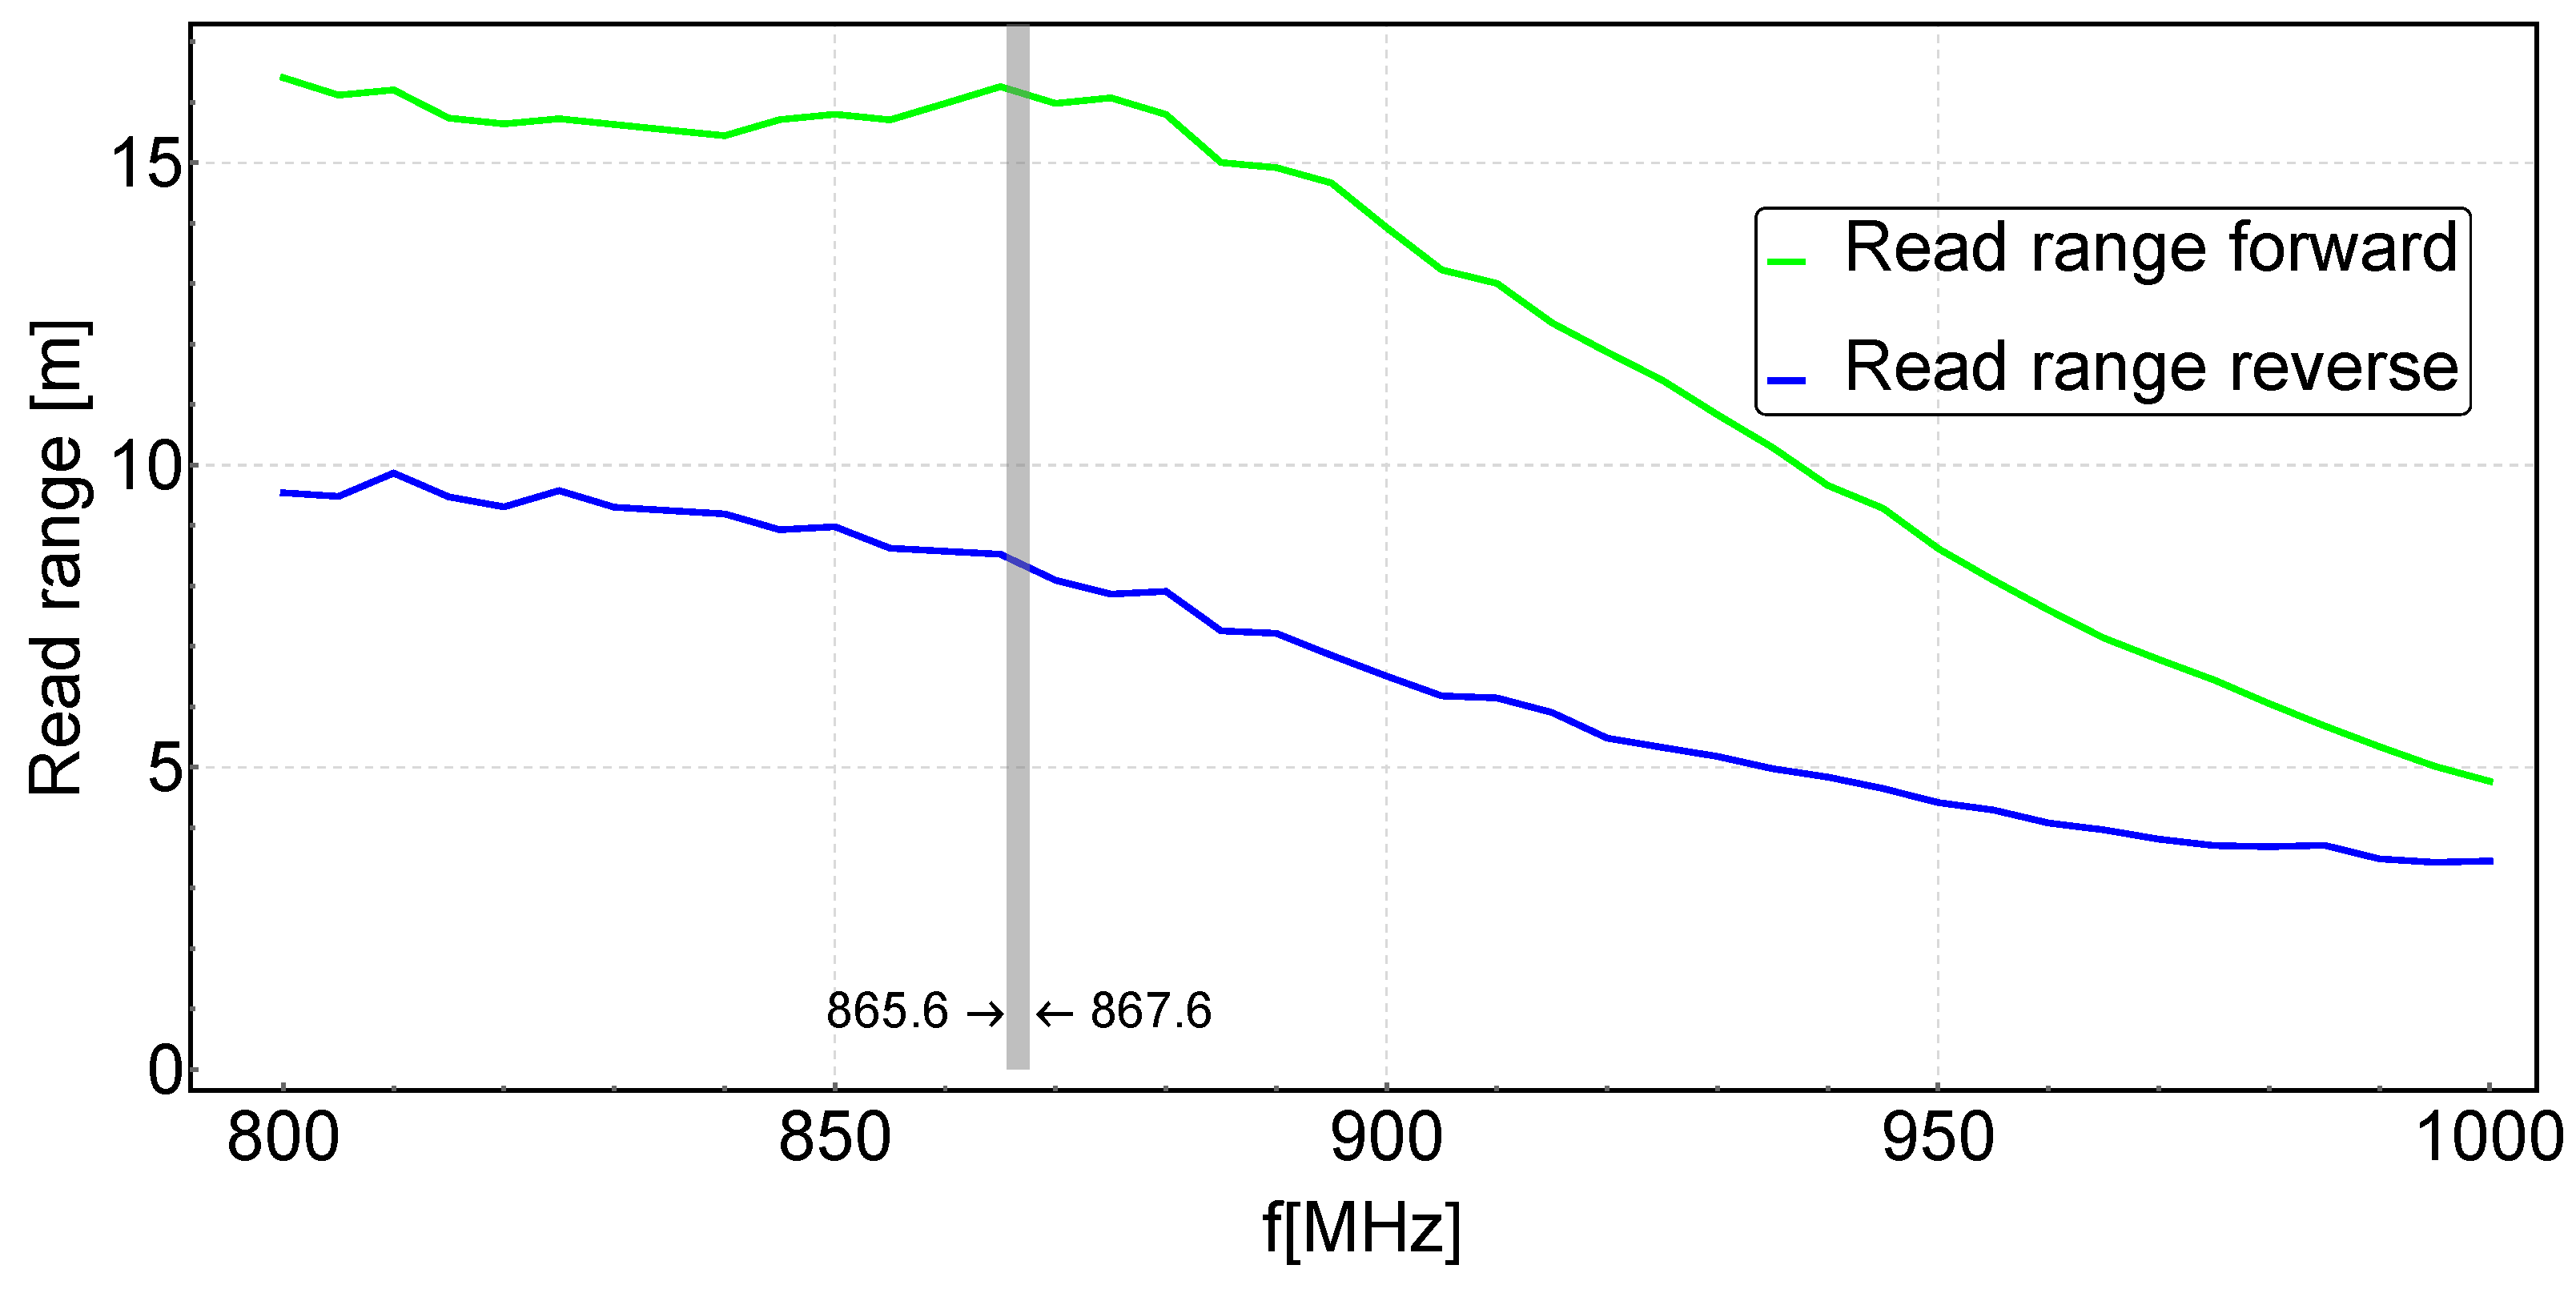
 to the soil environment are shown in Figure 7. It can be seen here that the value of Read range forward is greater than Read range reverse. It can therefore be said that the semi-passive tag (with greater sensitivity than a passive one) ’hears’ the RWD reader’s query from further away than it is able to respond to the query. The same results were shown in paper [35] where the read range of a semi-passive RFID tag was investigated. This fact can be used to improve the localization range of the RFID acorn, as will be shown in the next section.
3.1.1. Conclusions from Laboratory Experiments - RFID Tag Concept with Sound Indicator
3.2. Experiments Results under Quasi-Real Conditions
4. Discussion
Author Contributions
Funding
Institutional Review Board Statement
Informed Consent Statement
Data Availability Statement
Conflicts of Interest
References
- Cochran, W.W.; Lord Jr, R.D. A radio-tracking system for wild animals. The Journal of Wildlife Management, 1963; 9–24. [Google Scholar]
- Lahoz-Monfort, J.J.; Magrath, M.J. A comprehensive overview of technologies for species and habitat monitoring and conservation. BioScience 2021, 71, 1038–1062. [Google Scholar] [CrossRef] [PubMed]
- Thomas, B.; Holland, J.D.; Minot, E.O. Wildlife tracking technology options and cost considerations. Wildlife Research 2011, 38, 653–663. [Google Scholar] [CrossRef]
- Singh, J.; Bais, B. Wildlife tracking with latest electronic technology. International Journal of Avian & Wildlife Biology 2018, 3, 238–240. [Google Scholar]
- Hofman, M.P.; Hayward, M.W.; Heim, M.; Marchand, P.; Rolandsen, C.M.; Mattisson, J.; Urbano, F.; Heurich, M.; Mysterud, A.; Melzheimer, J.; others. Right on track? Performance of satellite telemetry in terrestrial wildlife research. PLoS One 2019, 14, e0216223. [Google Scholar] [CrossRef] [PubMed]
- Chabot, D.; Bird, D.M. Wildlife research and management methods in the 21st century: Where do unmanned aircraft fit in? Journal of Unmanned Vehicle Systems 2015, 3, 137–155. [Google Scholar] [CrossRef]
- Mesquita, G.P.; Mulero-Pázmány, M.; Wich, S.A.; Rodríguez-Teijeiro, J.D. A practical approach with drones, smartphones, and tracking tags for potential real-time animal tracking. Current Zoology 2023, 69, 208–214. [Google Scholar] [CrossRef] [PubMed]
- Desrochers, A.; Tremblay, J.A.; Aubry, Y.; Chabot, D.; Pace, P.; Bird, D.M. Estimating wildlife tag location errors from a VHF receiver mounted on a drone. Drones 2018, 2, 44. [Google Scholar] [CrossRef]
- Gottwald, J.; Zeidler, R.; Friess, N.; Ludwig, M.; Reudenbach, C.; Nauss, T. Introduction of an automatic and open-source radio-tracking system for small animals. Methods in Ecology and Evolution 2019, 10, 2163–2172. [Google Scholar] [CrossRef]
- Finkenzeller, K. RFID handbook: fundamentals and applications in contactless smart cards, radio frequency identification and near-field communication; John wiley & sons, 2010.
- Chetouane, F. An overview on RFID technology instruction and application. IFAC-PapersOnLine 2015, 48, 382–387. [Google Scholar] [CrossRef]
- Floyd, R.E. RFID in animal-tracking applications. IEEE Potentials 2015, 34, 32–33. [Google Scholar] [CrossRef]
- Habedank, A.; Urmersbach, B.; Kahnau, P.; Lewejohann, L. O mouse, where art thou? The Mouse Position Surveillance System (MoPSS)—an RFID-based tracking system. Behavior Research Methods 2022, 54, 676–689. [Google Scholar] [CrossRef]
- Ross, R.; Anderson, B.; Bienvenu, B.; Scicluna, E.L.; Robert, K.A. WildTrack: An IoT System for Tracking Passive-RFID Microchipped Wildlife for Ecology Research. Automation 2022, 3, 426–438. [Google Scholar] [CrossRef]
- Briggs, A.J.; Robstad, C.A.; Rosell, F. Using radio-frequency identification technology to monitor Eurasian beavers. Wildlife Society Bulletin 2021, 45, 154–161. [Google Scholar] [CrossRef]
- Dyo, V.; Ellwood, S.A.; Macdonald, D.W.; Markham, A.; Trigoni, N.; Wohlers, R.; Mascolo, C.; Pásztor, B.; Scellato, S.; Yousef, K. WILDSENSING: Design and deployment of a sustainable sensor network for wildlife monitoring. ACM Transactions on Sensor Networks (TOSN) 2012, 8, 1–33. [Google Scholar] [CrossRef]
- Rafiq, K.; Appleby, R.G.; Edgar, J.P.; Radford, C.; Smith, B.P.; Jordan, N.R.; Dexter, C.E.; Jones, D.N.; Blacker, A.R.; Cochrane, M. WildWID: An open-source active RFID system for wildlife research. Methods in Ecology and Evolution 2021, 12, 1580–1587. [Google Scholar] [CrossRef]
- Gómez, J.M.; Schupp, E.W.; Jordano, P. Synzoochory: the ecological and evolutionary relevance of a dual interaction. Biological Reviews 2019, 94, 874–902. [Google Scholar] [CrossRef]
- Bossema, I. Jays and oaks: an eco-ethological study of a symbiosis. Behaviour 1979, 70, 1–116. [Google Scholar] [CrossRef]
- Bobiec, A.; Reif, A.; Öllerer, K. Seeing the oakscape beyond the forest: a landscape approach to the oak regeneration in Europe. Landscape Ecology 2018, 33, 513–528. [Google Scholar] [CrossRef]
- Pons, J.; Pausas, J.G. Acorn dispersal estimated by radio-tracking. Oecologia 2007, 153, 903–911. [Google Scholar] [CrossRef]
- Kurek, P.; Dobrowolska, D.; Wiatrowska, B. Dispersal distance and burial mode of acorns in Eurasian Jays Garrulus glandarius in European temperate forests. Acta Ornithologica 2019, 53, 155–162. [Google Scholar] [CrossRef]
- Wróbel, A.; Kurek, P.; Bogdziewicz, M.; Dobrowolska, D.; Zwolak, R. Avian dispersal of an invasive oak is modulated by acorn traits and the presence of a native oak. Forest Ecology and Management 2022, 505, 119866. [Google Scholar] [CrossRef]
- Commission Implementing Decision (EU) 2019/1345 of 2 August 2019 amending Decision 2006/771/EC updating harmonised technical conditions in the area of radio spectrum use for short-range devices (notified under document C(2019) 5660) (Text with EEA relevance.), 2019.
- Jankowski-Mihułowicz, P.; Węglarski, M.; Chamera, M.; Pyt, P. Textronic UHF RFID Transponder. Sensors 2021, 21, 1093. [Google Scholar] [CrossRef] [PubMed]
- Balanis, C.A. Antenna theory: analysis and design; John wiley & sons, 2016.
- European Telecommunications Standards Institute. Radio Frequency Identification Equipment Operating in the Band 865 MHz to 868 MHz with Power Levels up to 2 W and in the Band 915 MHz to 921 MHz with Power Levels up to 4 W; Harmonised Standard for Access to Radio Spectrum, 2020.
- Voyantic. Tagformance, RAIN RFID and NFC Testing and Measurement System for Research & Development, 2023. Ver.Q3.
- Impinj, Inc. IMPINJ MONZA R6-P, 2021. Ver.7.0.
- EM Microelectronic-Marin SA. EM4325, 2017. Ver.9.0.
- Aaronia AG. HYPERLOG®. LOGPER ANTENNAS. 70 SERIES, 2023. Ver.6.0.
- Zebra Technologies Corp. RFD90 ULTRA-RUGGED UHF RFID SLEDS, 2022.
- Mohammed, N.A.; Sivakumar, M.; Deavours, D.D. An RFID tag capable of free-space and on-metal operation. 2009 IEEE Radio and Wireless Symposium. IEEE, 2009, pp. 63–66.
- Sidén, J.; Nilsson, H.E. RFID Antennas–Possibilities and Limitations. Radio frequency identification fundamentals and applications design methods and solutions 2010, 5, 324. [Google Scholar]
- Solar, H.; Beriain, A.; Rezola, A.; Del Rio, D.; Berenguer, R. A 22-m Operation Range Semi-Passive UHF RFID Sensor Tag With Flexible Thermoelectric Energy Harvester. IEEE Sensors Journal 2022, 22, 19797–19808. [Google Scholar] [CrossRef]
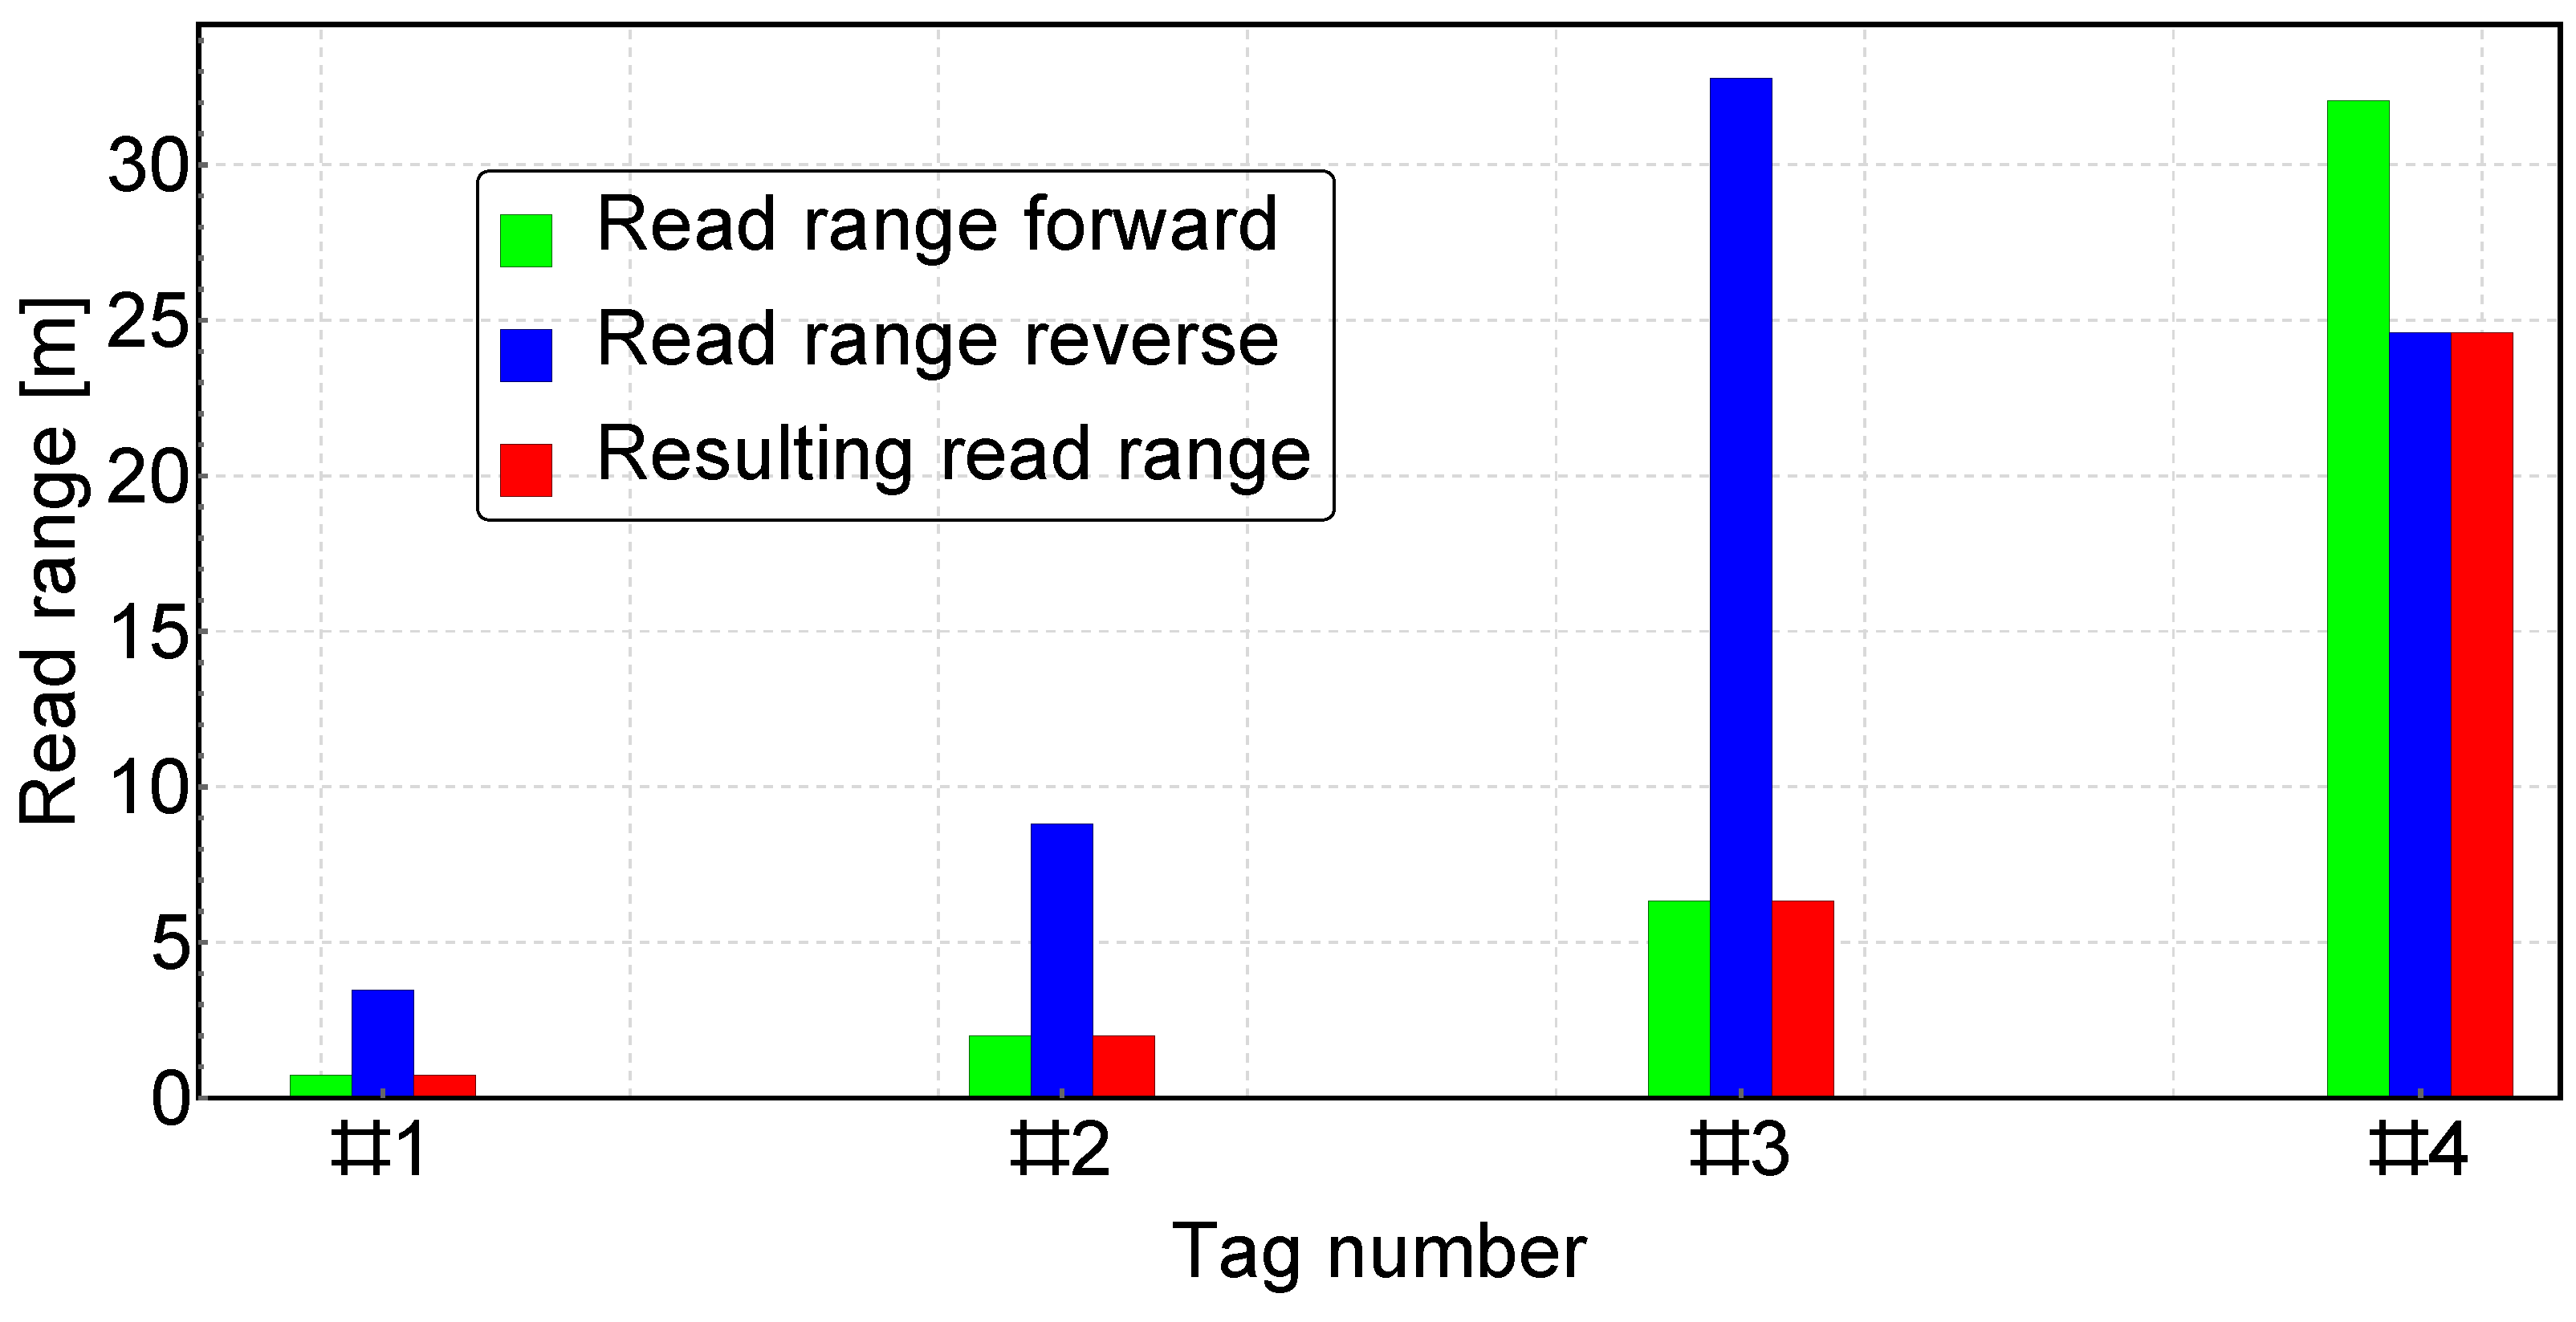
 depends on the length of the antenna and the environment measured in the anechoic chamber.
 depends on the length of the antenna and the environment measured in the anechoic chamber.
 on the soil measured in the chamber.
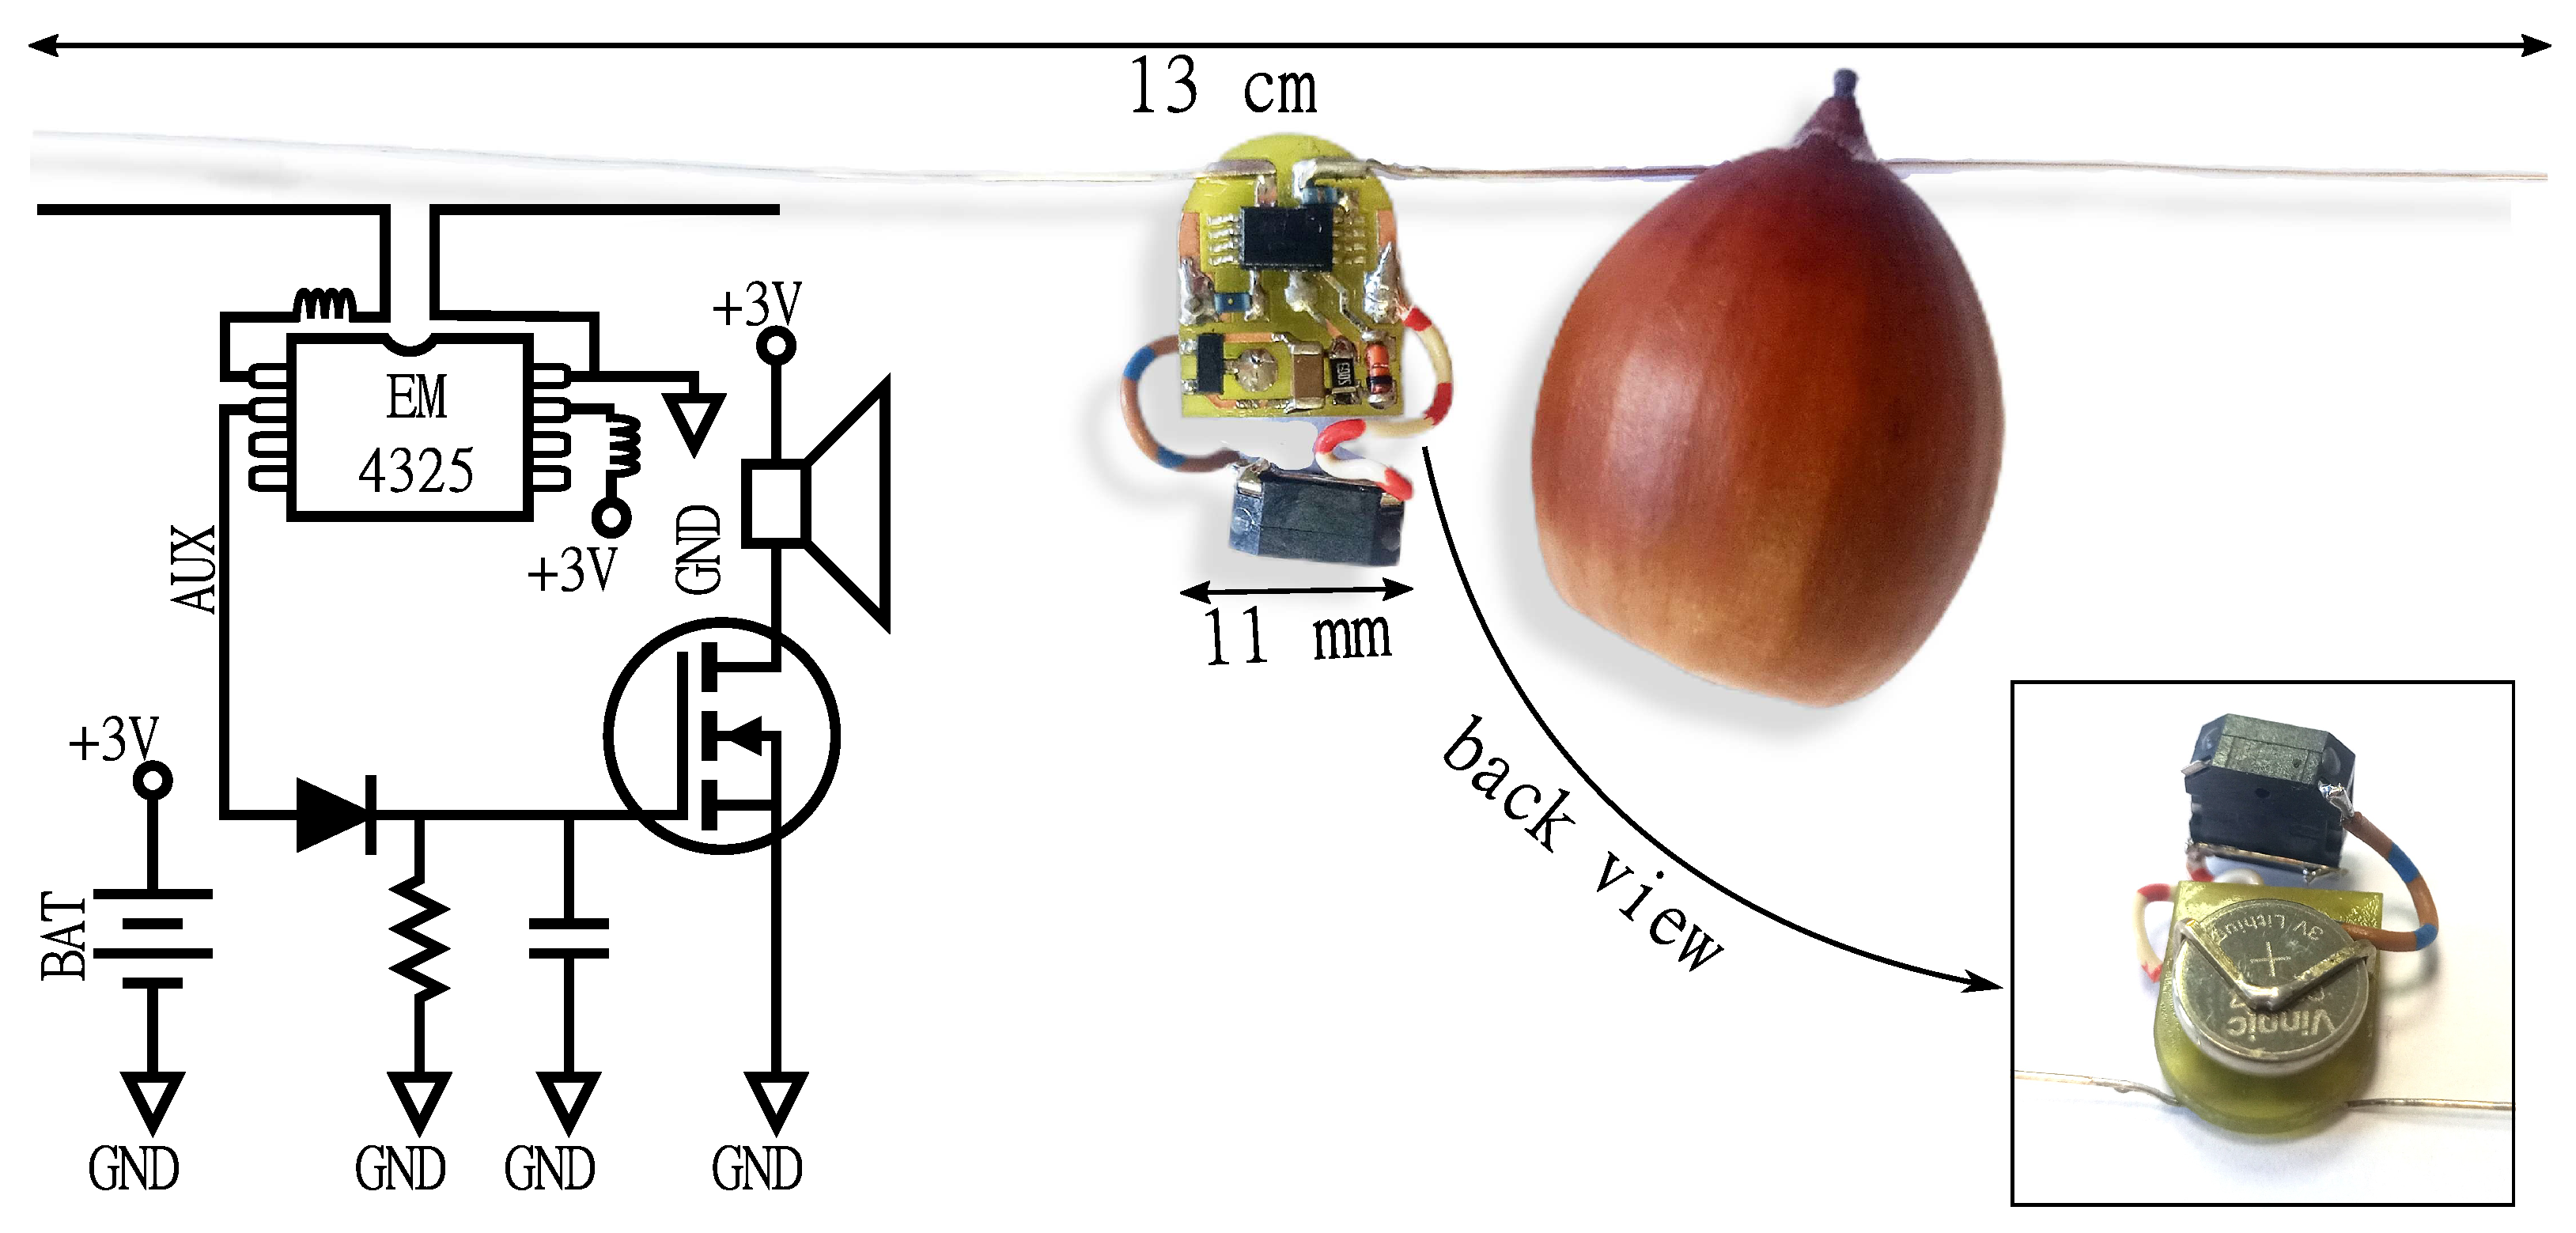
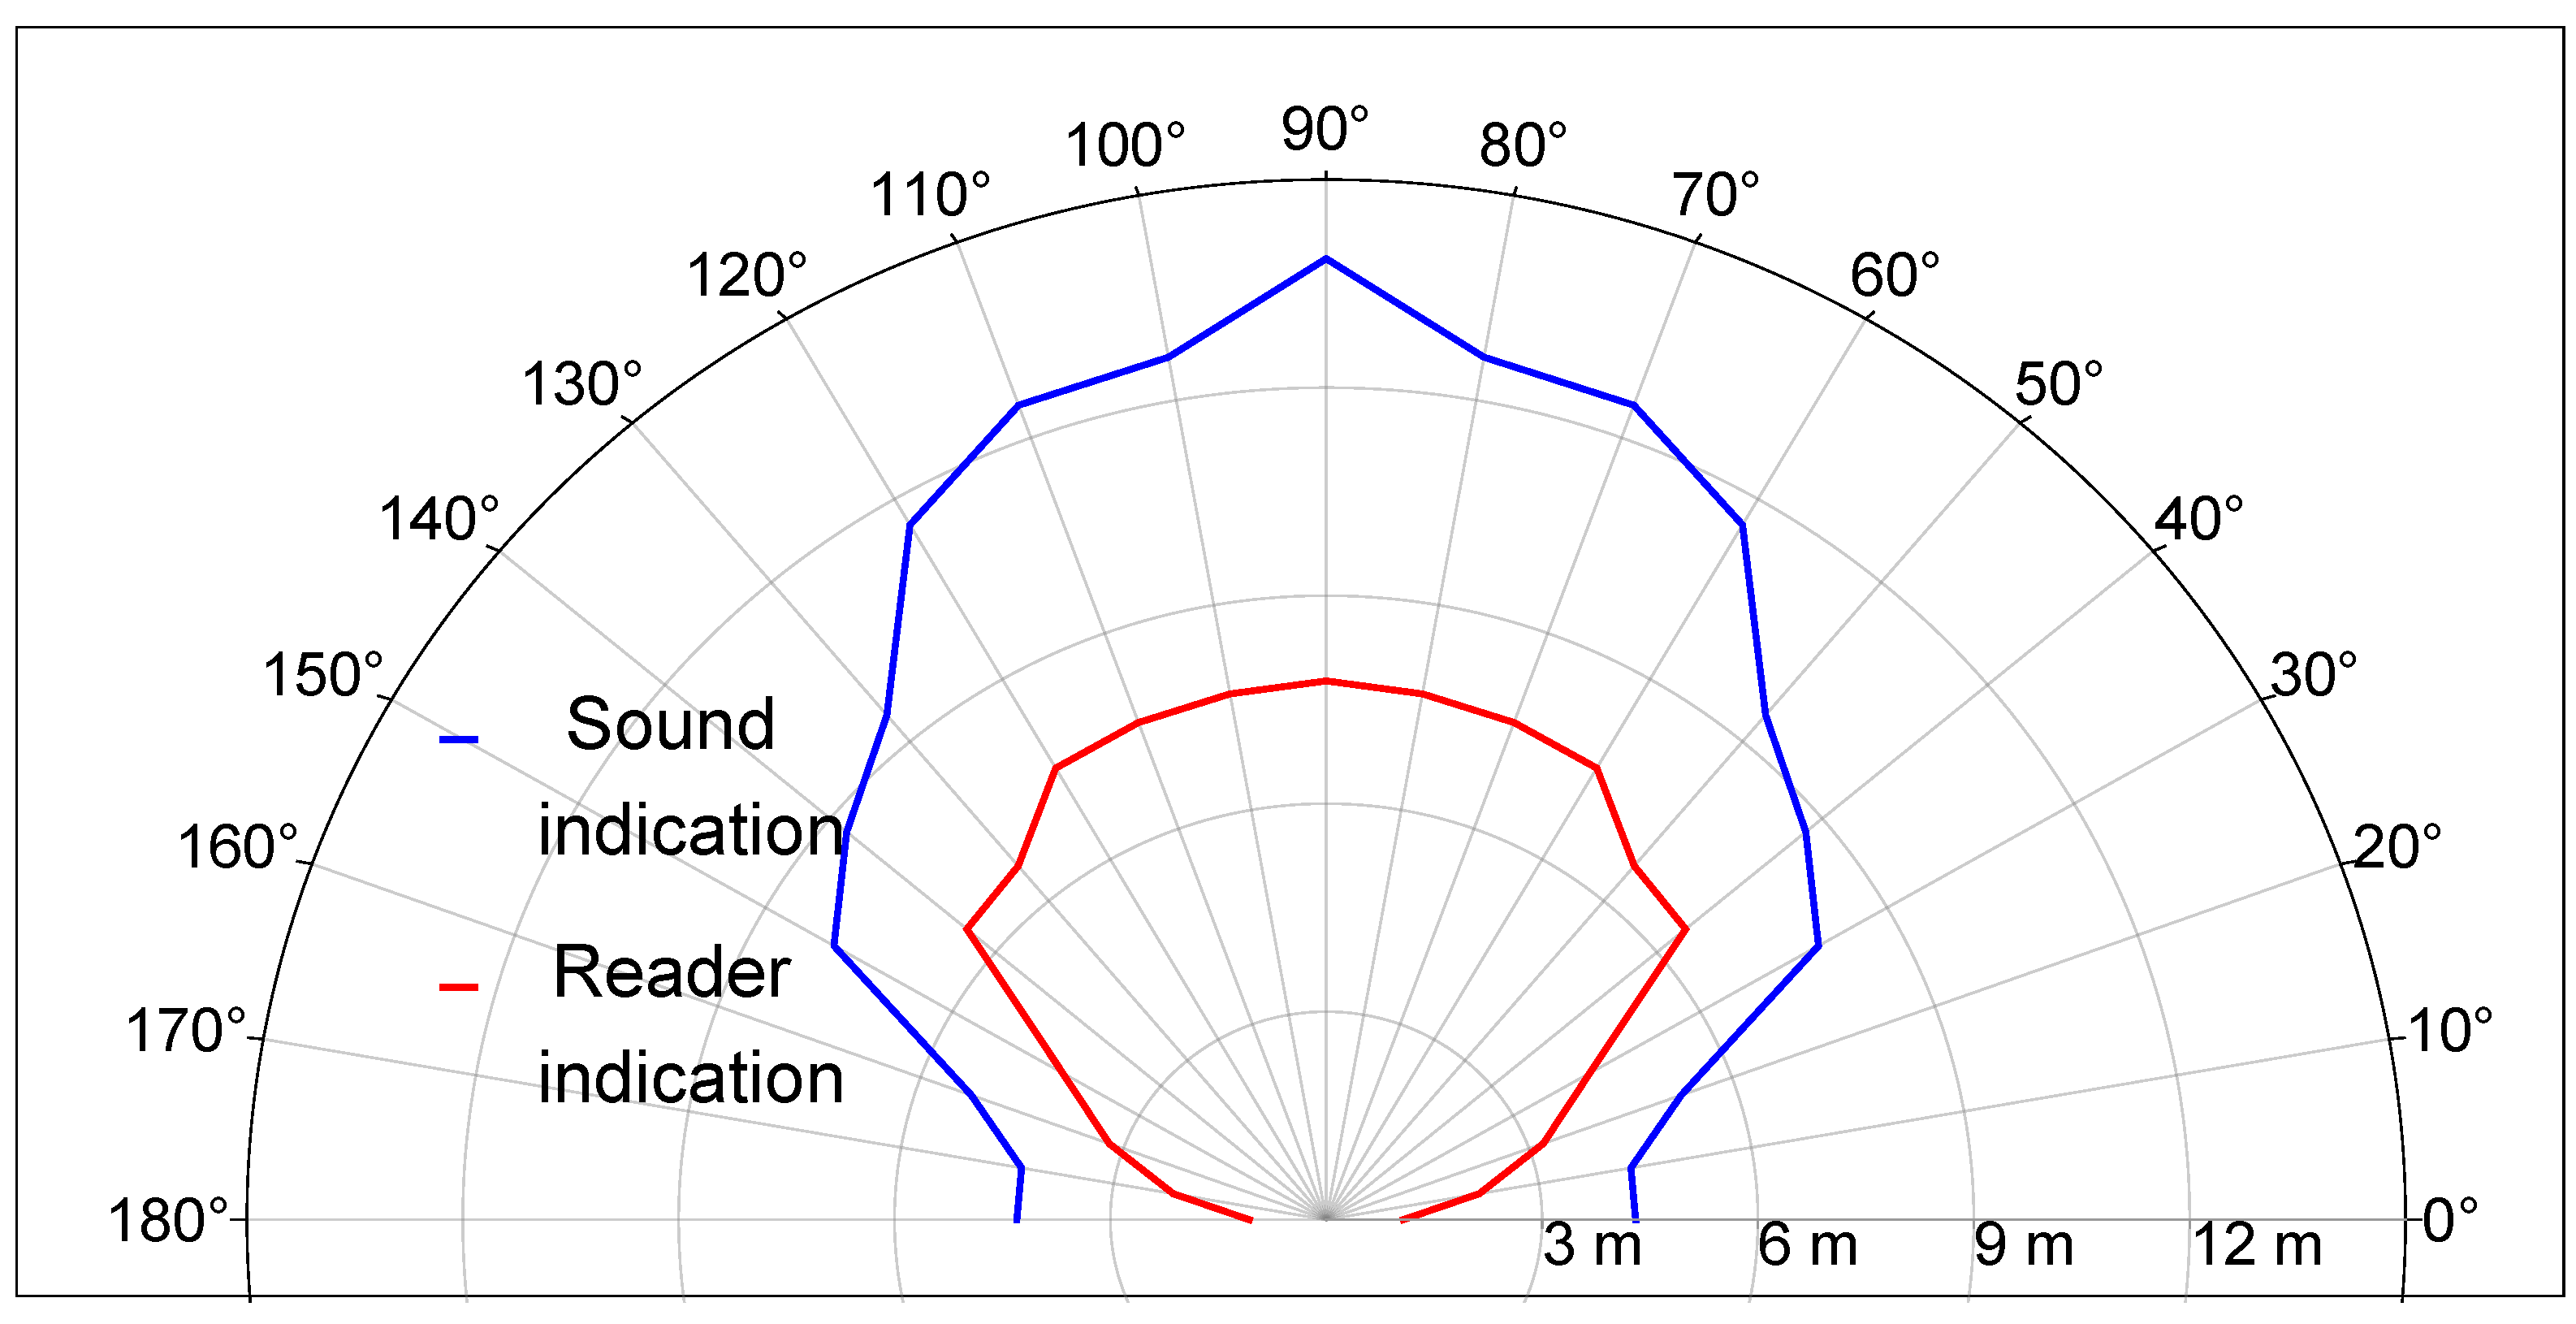
| Reader-Tag Orientation Angle | Sound Indication Range | Reader Indication Range |
|---|---|---|
| [] | [m] | [m] |
| 90 | 13.86 | 7.77 |
| 80 | 12.63 | 7.70 |
| 70 | 12.50 | 7.63 |
| 60 | 11.57 | 7.52 |
| 50 | 9.50 | 6.66 |
| 40 | 8.70 | 6.52 |
| 30 | 7.90 | 4.23 |
| 20 | 5.25 | 3.21 |
| 10 | 4.30 | 2.16 |
| 0 | 4.30 | 1.07 |
Disclaimer/Publisher’s Note: The statements, opinions and data contained in all publications are solely those of the individual author(s) and contributor(s) and not of MDPI and/or the editor(s). MDPI and/or the editor(s) disclaim responsibility for any injury to people or property resulting from any ideas, methods, instructions or products referred to in the content. |
© 2024 by the authors. Licensee MDPI, Basel, Switzerland. This article is an open access article distributed under the terms and conditions of the Creative Commons Attribution (CC BY) license (http://creativecommons.org/licenses/by/4.0/).


