Submitted:
02 January 2024
Posted:
04 January 2024
You are already at the latest version
Abstract
Keywords:
1. Introduction
2. Materials and Methods
2.1. Materials
2.2. Production of Red Dragon Fruit Peel Powder
2.3. Determination of the Physicochemical and Techno-Functional Properties of RDF-PP
2.3.1. Colourimetric Characteristics
2.3.2. Crude Fibre
2.3.3. Pectin Yield
2.3.4. Degree of Esterification
2.3.5. Water and Oil Holding Capacity
2.3.6. Swelling Capacity
2.3.7. Particle Size Distribution
2.4. Production of Emulsified Alpaca-Based Sausages
2.5. Physicochemical Properties of Emulsified Alpaca-Based Sausages
2.5.1. Colourimetric Characteristics
2.5.2. Physicochemical Properties
2.5.3. Frying Loss and Cooking Yield
2.5.4. Texture Profile Analysis
2.6. Sensory Evaluation of Emulsified Alpaca-Based Sausages
2.7. Statistical Analysis
2.7.1. Three-level Full Factorial Design and Response Surface Methodology
2.7.2. Completely Randomised Design (CRD)
2.7.3. Sensory Analysis
3. Results and Discussion
3.1. Effect of RDF-PR and PS on Physicochemical Properties of RDF-PP
3.1.1. Colorimetric Characteristics of RDF-PP
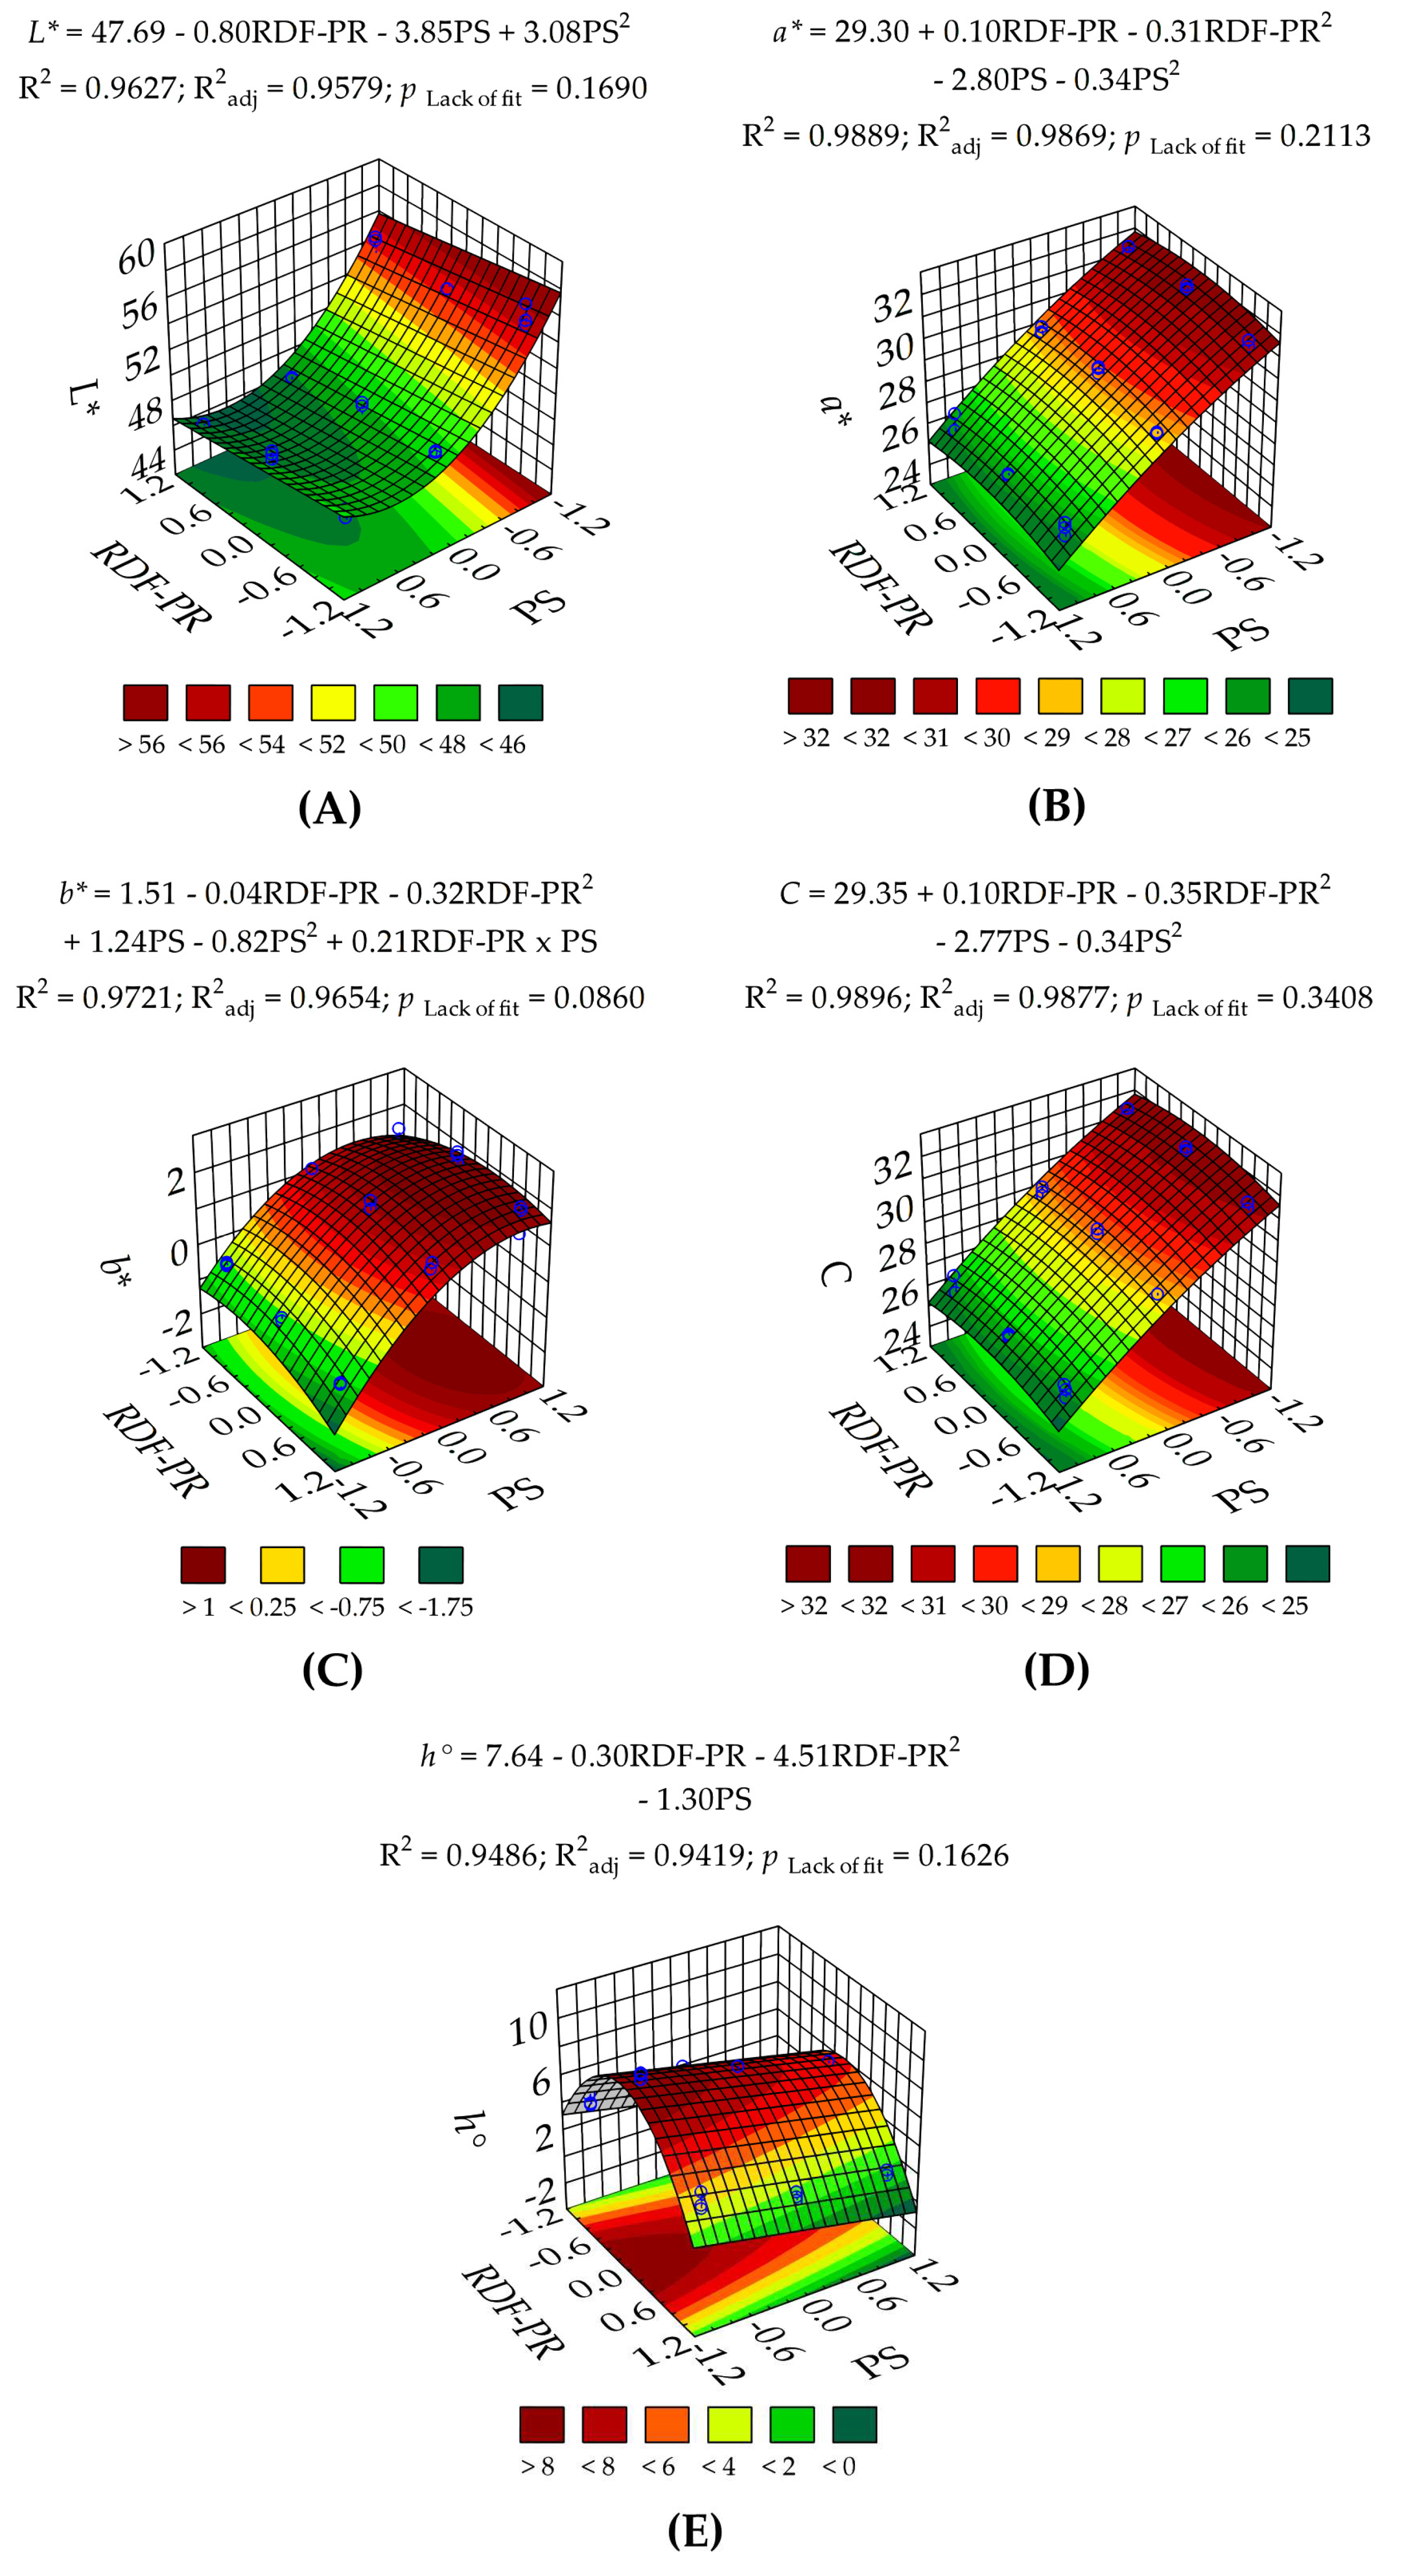
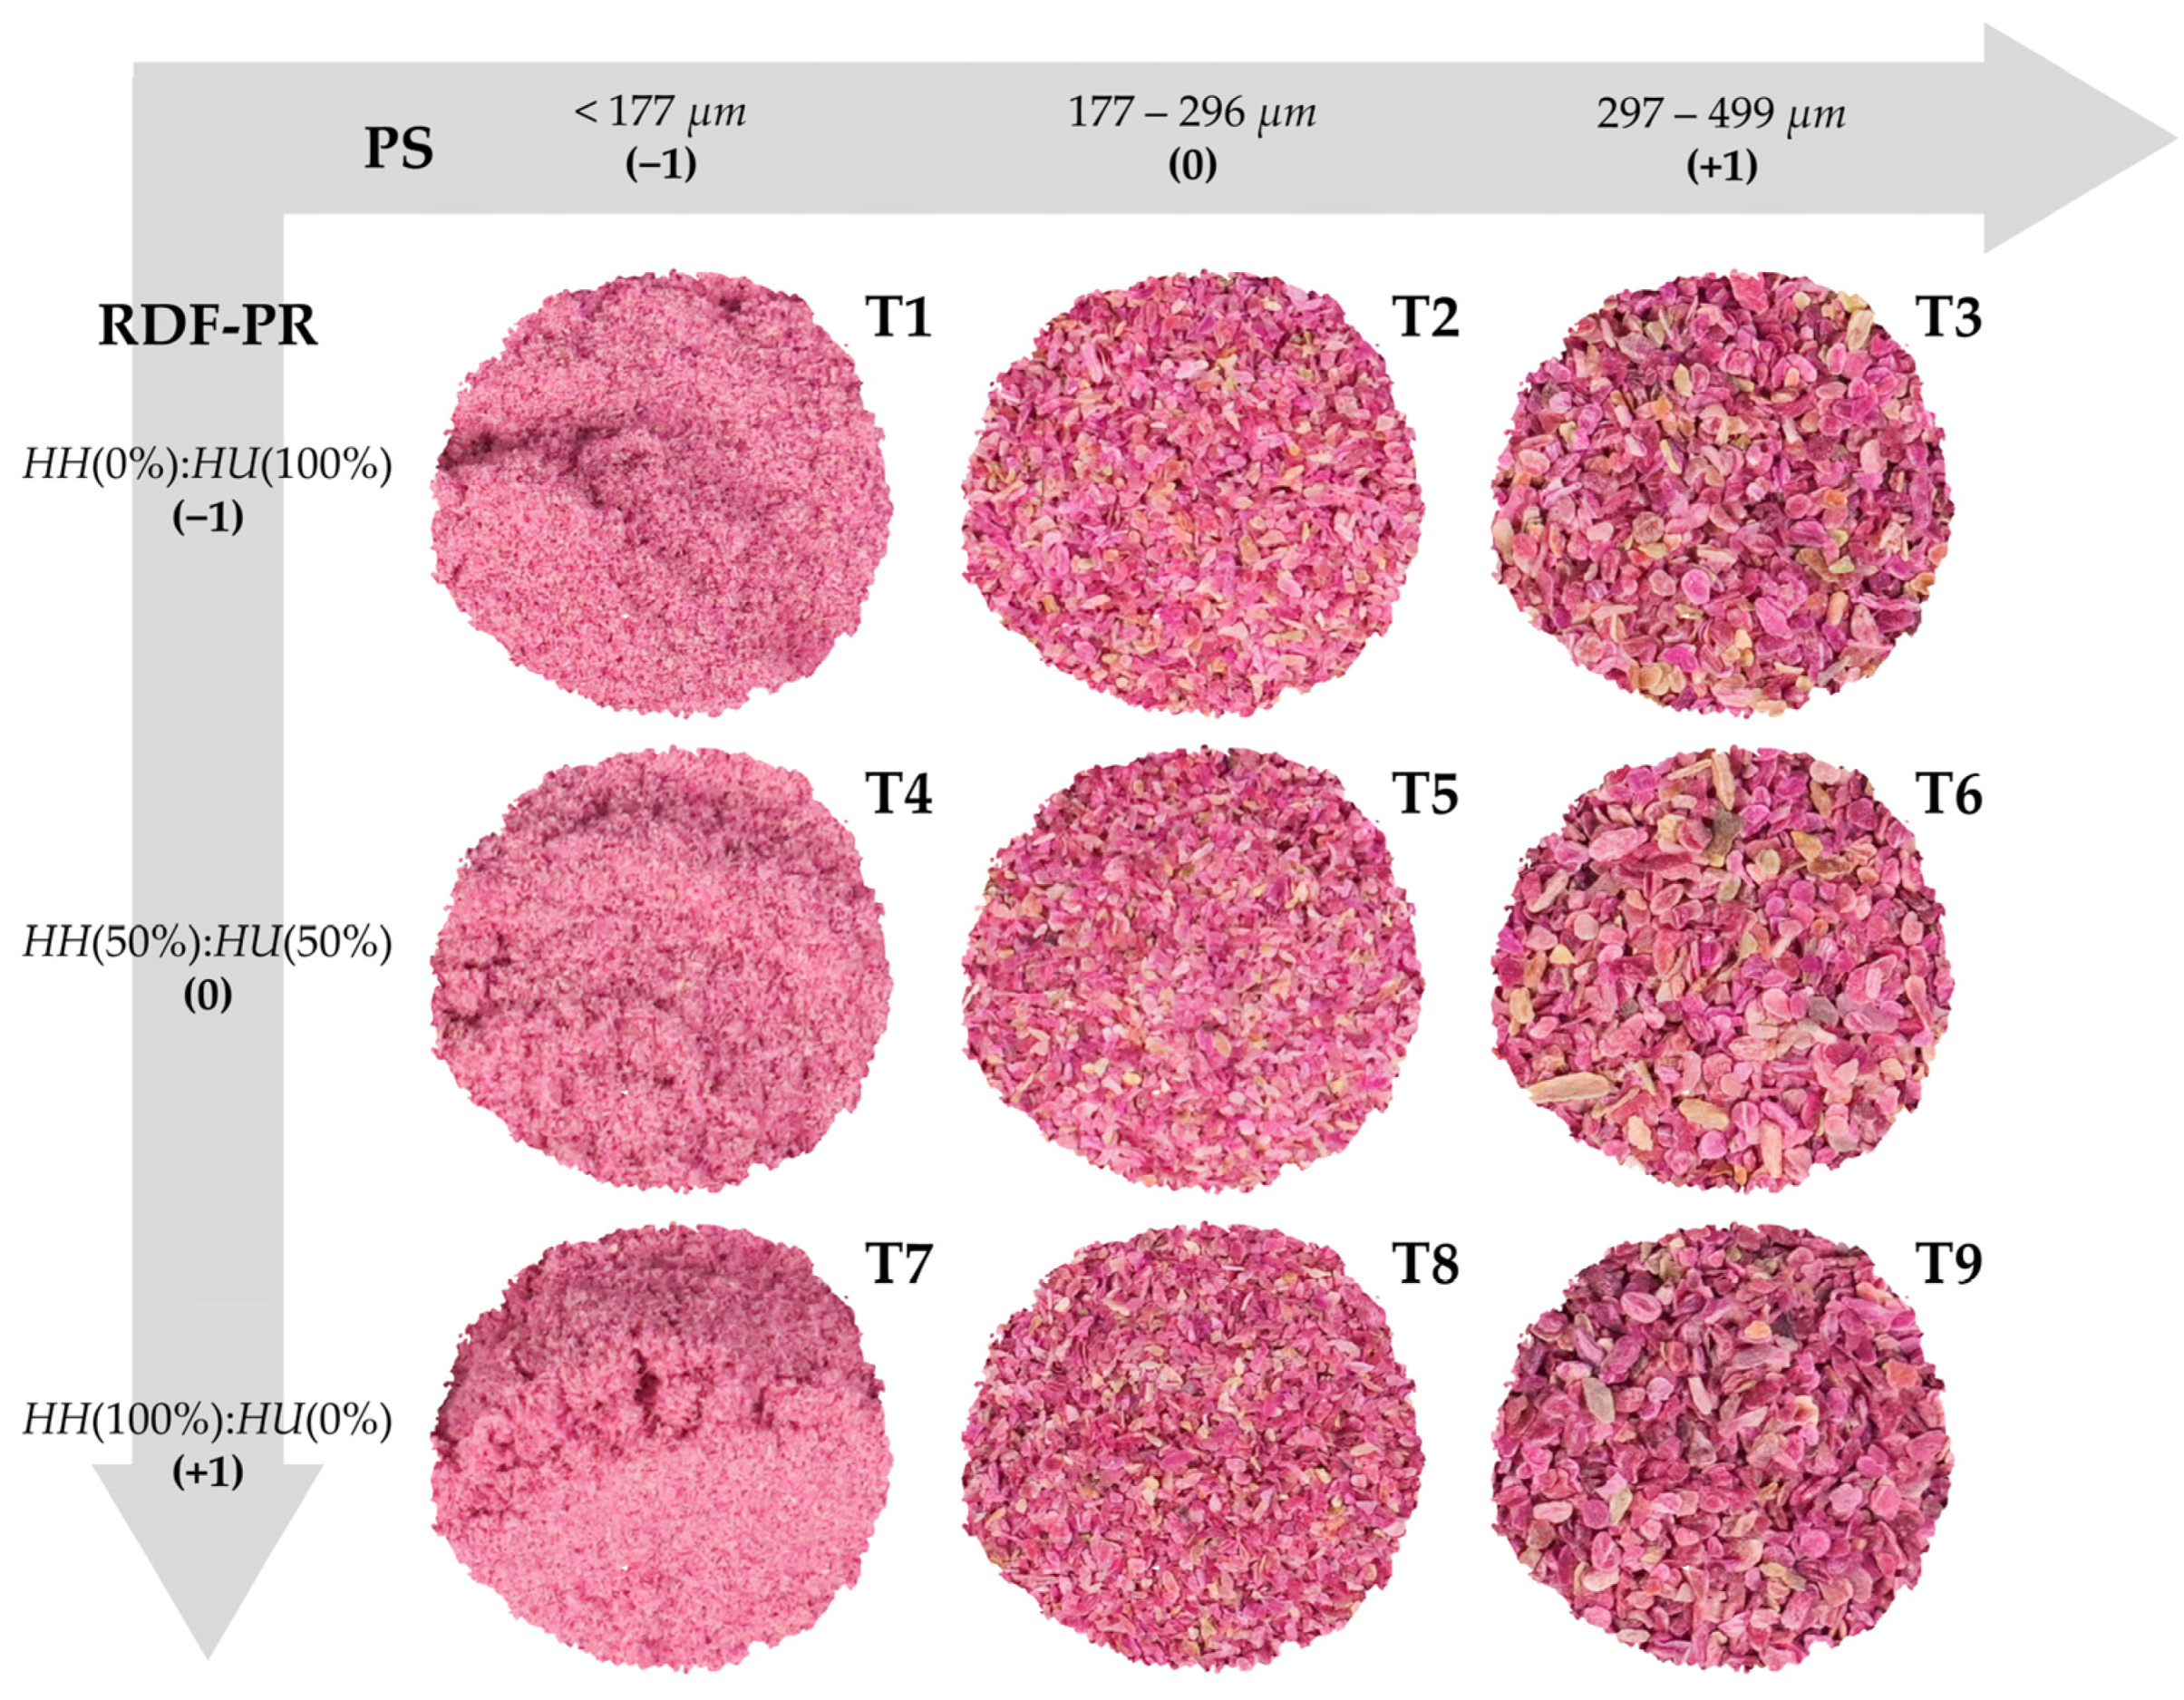
| T | Uncoded and coded values | L* | a* | b* | C | h° | |||
|---|---|---|---|---|---|---|---|---|---|
| RDF-PR [HH(%):HU(%)] | PS (µm) | ||||||||
| T1 | 0:100 | (−1) | <177 | (−1) | 55.8 ± 0.87 a | 31.3 ± 0.19 a | −0.49 ± 0.05 d | 31.3 ± 0.18 a | 4.33 ± 0.42 c |
| T2 | 0:100 | (−1) | 177–296 | (0) | 48.5 ± 0.17 b | 28.7 ± 0.19 c | 1.13 ± 0.17 c | 28.7 ± 0.18 c | 3.64 ± 0.99 cd |
| T3 | 0:100 | (−1) | 297–499 | (+1) | 47.2 ± 0.36 bc | 25.9 ± 0.30 d | 1.40 ± 0.26 bc | 25.9 ± 0.30 d | 2.35 ± 0.75 de |
| T4 | 50:50 | (0) | <177 | (−1) | 54.0 ± 0.35 a | 31.8 ± 0.13 a | −0.72 ± 0.07 de | 31.8 ± 0.13 a | 9.44 ± 0.27 a |
| T5 | 50:50 | (0) | 177–296 | (0) | 47.9 ± 0.95 bc | 29.4 ± 0.14 b | 1.55 ± 0.14 abc | 29.5 ± 0.14 b | 7.44 ± 0.56 b |
| T6 | 50:50 | (0) | 297–499 | (+1) | 47.6 ± 0.30 bc | 25.9 ± 0.10 d | 2.07 ± 0.15 a | 26.1 ± 0.09 d | 6.06 ± 0.31 b |
| T7 | 100:0 | (+1) | <177 | (−1) | 54.1 ± 1.50 a | 31.5 ± 0.21 a | −1.06 ± 0.04 e | 31.5 ± 0.21 a | 4.28 ± 0.65 c |
| T8 | 100:0 | (+1) | 177–296 | (0) | 46.7 ± 0.08 bc | 29.1 ± 0.19 bc | 1.21 ± 0.12 bc | 29.2 ± 0.19 bc | 2.39 ± 0.33 de |
| T9 | 100:0 | (+1) | 297–499 | (+1) | 45.9 ± 0.24 c | 25.9 ± 0.54 d | 1.68 ± 0.41 ab | 25.9 ± 0.55 d | 1.83 ± 0.19 e |
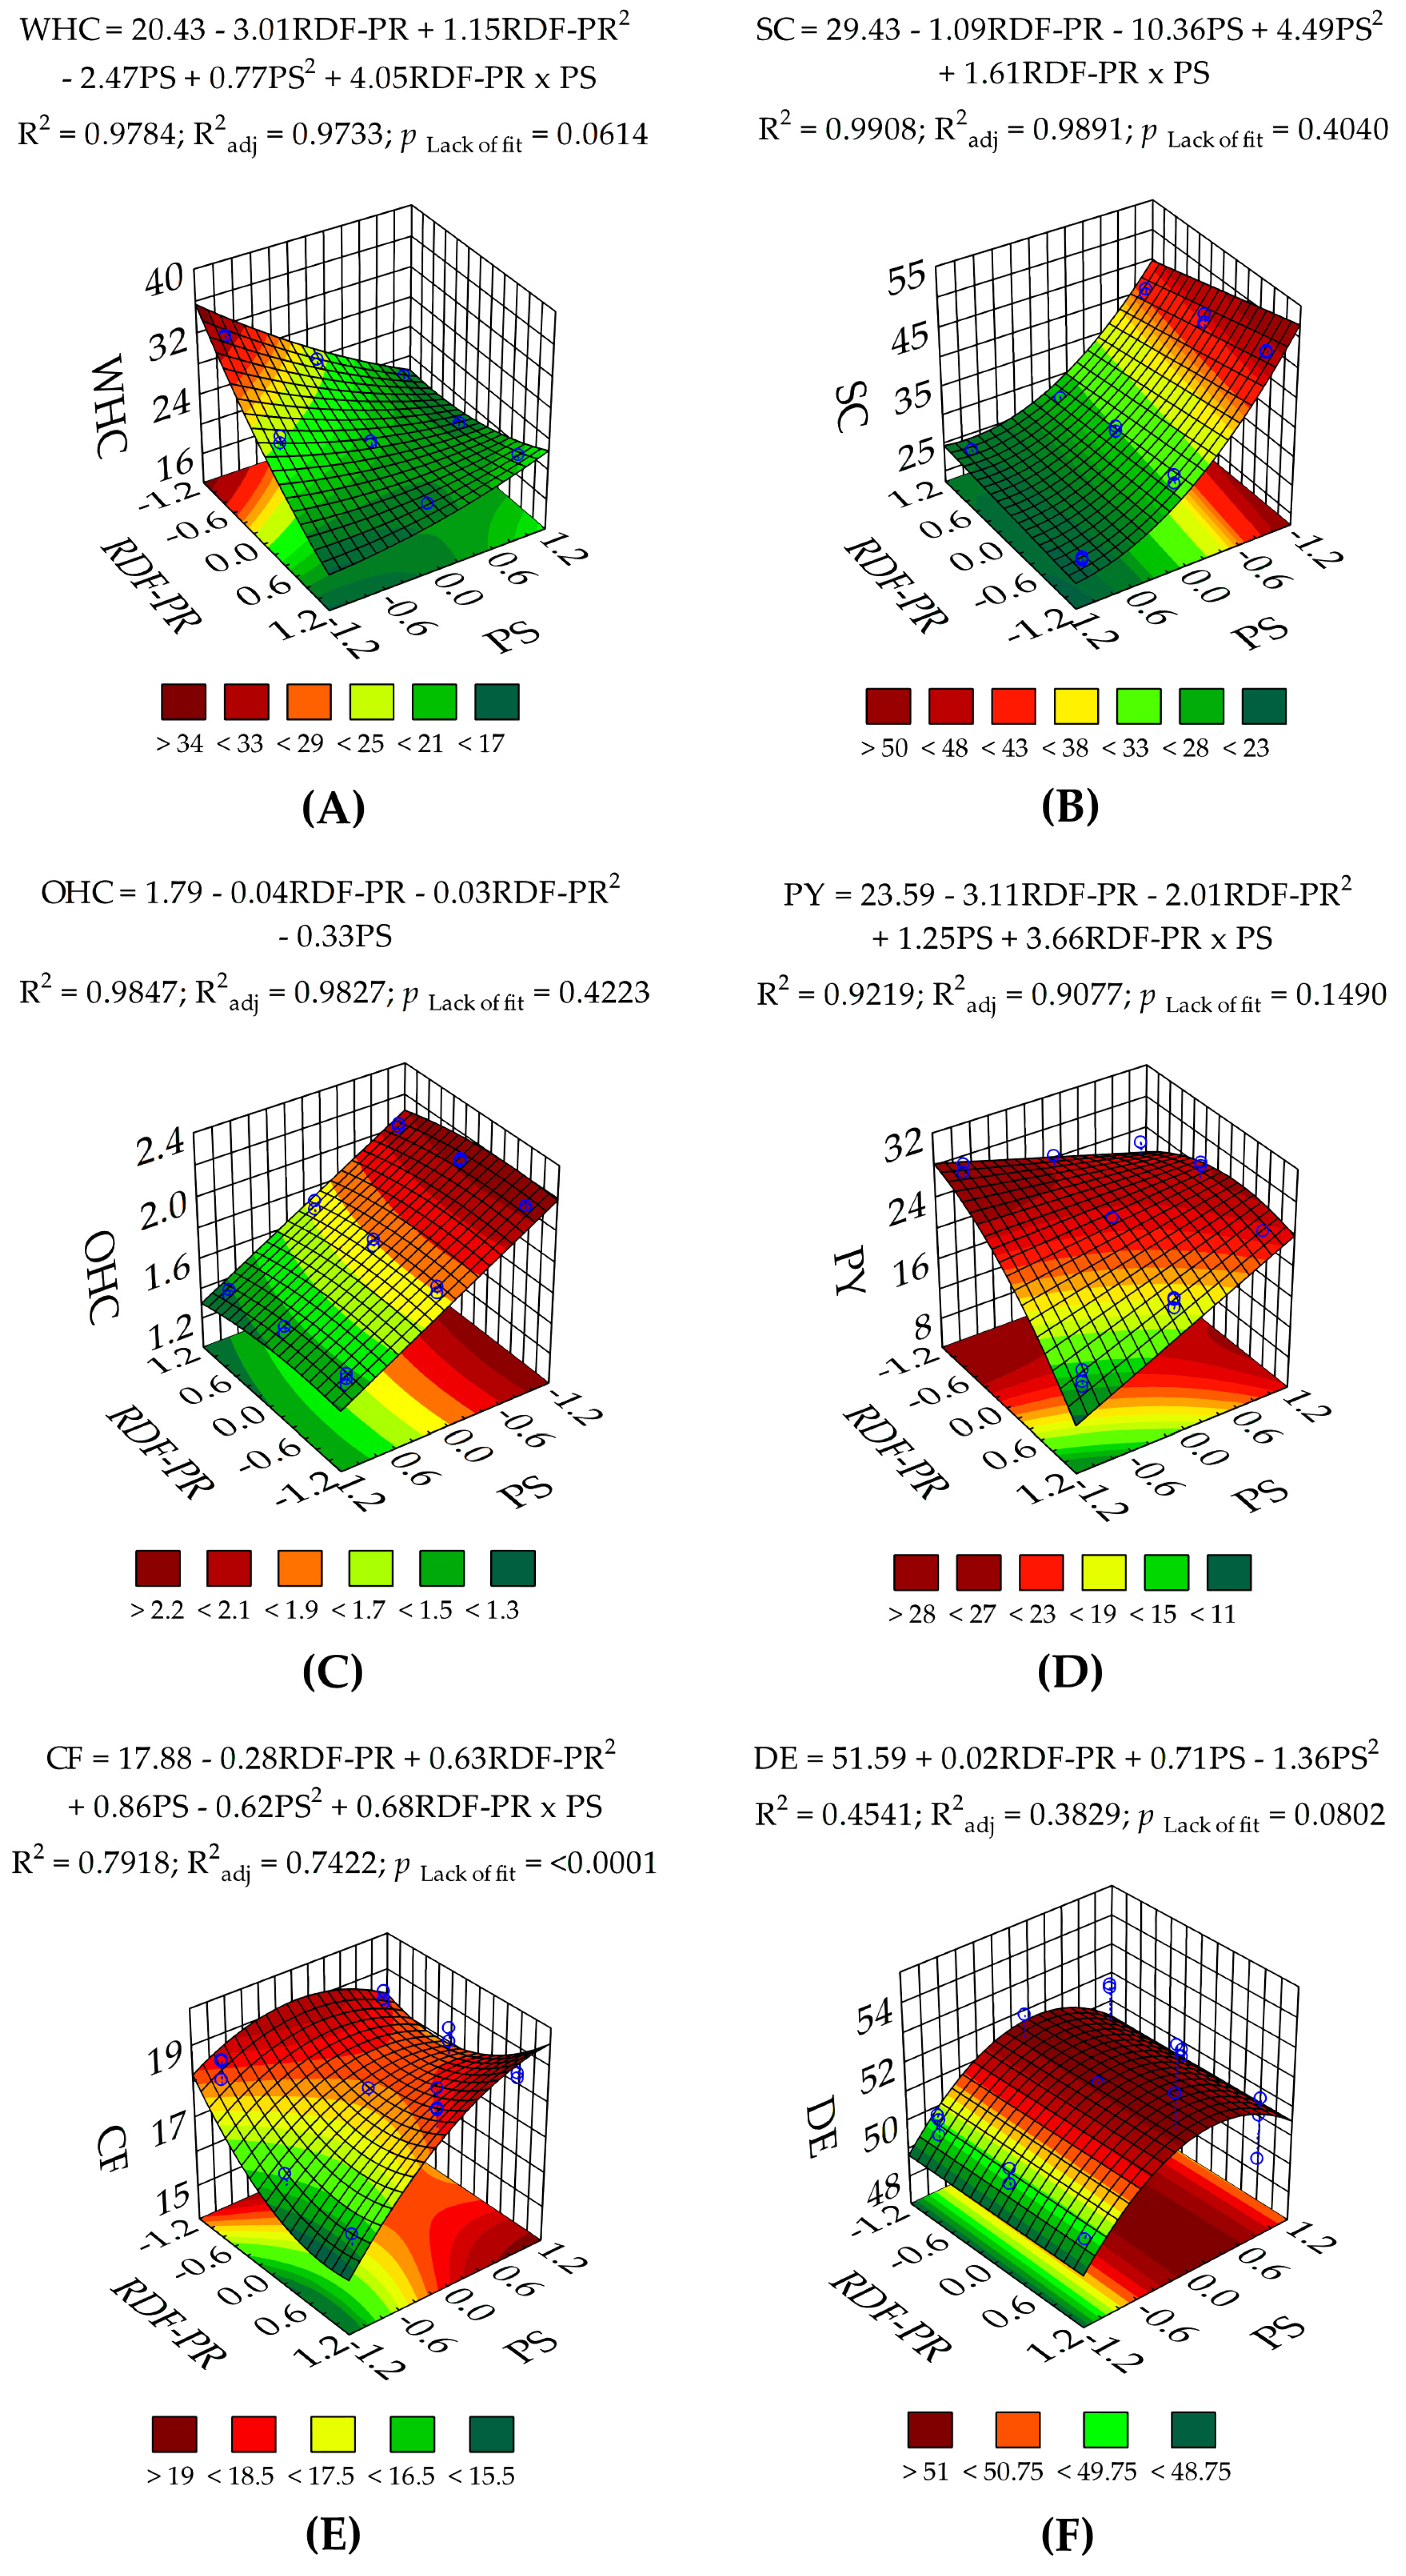
| Dependent variables | ANOVA | Goodness-of-fit | |||||||||||
|---|---|---|---|---|---|---|---|---|---|---|---|---|---|
| Model | RDF-PR (L) | RDF-PR (Q) | PS (L) | PS (Q) | RDF-PR × PS | Lack of fit | C. V. (%) | PRESS (−) | R2 | R2 adj | R2 pred | Adeq. Prec. (−) | |
| L* | 207 (<0.0001) | 23.6 (0.00013) | — | 553 (<0.0001) | 118 (<0.0001) | — | 1.77 (0.1690) | 1.48 | 18.7 | 0.9627 | 0.9579 | 0.9462 | 28.4 |
| a* | 454 (<0.0001) | 2.62 (0.1229) | 9.10 (0.0074) | 21.7 (<0.0001) | 10.7 (0.0042) | — | 1.62 (0.2113) | 0.96 | 2.85 | 0.9889 | 0.9869 | 0.9802 | 42.7 |
| b* | 132 (<0.0001) | 0.60 (0.4472) | 16.6 (0.0007) | 754 (<0.0001) | 109 (<0.0001) | 14.7 (0.0012) | 2.57 (0.0860) | 29.5 | 1.99 | 0.9720 | 0.9654 | 0.9409 | 25.2 |
| C | 484 (<0.0001) | 2.58 (0.1252) | 11.1 (0.0037) | 2152 (<0.0001) | 10.7 (0.0041) | — | 1.21 (0.3408) | 0.93 | 2.63 | 0.9896 | 0.9877 | 0.9814 | 44.3 |
| h° | 162 (<0.0001) | 5.38 (0.0321) | 395 (<0.0001) | 98.8 (<0.0001) | — | — | 1.80 (0.1626) | 12.1 | 10.9 | 0.9486 | 0.9419 | 0.9322 | 30.0 |
| WHC | 180 (<0.0001) | 414 (<0.0001) | 19.9 (0.0002) | 278 (<0.0001) | 9.02 (0.0076) | 497 (<0.0001) | 2.93 (0.0614) | 3.36 | 19.4 | 0.9784 | 0.9733 | 0.9604 | 36.3 |
| OHC | 555 (<0.0001) | 19.6 (0.0003) | 5.11 (0.0363) | 1469 (<0.0001) | — | — | 1.04 (0.4223) | 1.96 | 0.04 | 0.9846 | 0.9826 | 0.9790 | 47.0 |
| SC | 589 (<0.0001) | 24.3 (0.00011) | — | 2200 (<0.0001) | 137 (<0.0001) | 35.3 (<0.0001) | 1.06 (0.4040) | 2.92 | 29.3 | 0.9908 | 0.9891 | 0.9862 | 50.9 |
| PY | 75.1 (<0.0001) | 136 (<0.0001) | 18.9 (0.0003) | 22.2 (0.0002) | — | 126 (<0.0001) | 1.93 (0.1490) | 5.10 | 50.9 | 0.9219 | 0.9077 | 0.8767 | 25.4 |
| CF | 14.6 (<0.0001) | 12.7 (0.0022) | 21.6 (0.0002) | 121 (<0.0001) | 20.6 (0.0002) | 50.1 (<0.0001) | 13.8 (0.00007) | 3.28 | 12.9 | 0.7917 | 0.7421 | 0.5891 | 10.0 |
| DE | 6.47 (0.0028) | 0.01 (0.9178) | — | 11.1 (0.0037) | 13.7 (0.0016) | — | 2.37 (0.0802) | 2.01 | 37.4 | 0.4540 | 0.3828 | 0.1110 | 5.72 |
3.1.2. Techno-Functional and Physicochemical Properties of RDF-PP
3.1.3. Statistical Validation of Optimal Treatment of RDF-PP
3.2. Effect of Fat Replacement by Hydrated RDF-PP in Emulsified Alpaca-Based Sausages
3.2.1. Colourimetric Characteristics of Emulsified Alpaca-Based Sausages
3.2.2. Physicochemical Characteristics of Emulsified Alpaca-Based Sausages
3.2.3. Frying Loss and Cooking Yield
3.2.4. Texture Characteristics of Emulsified Alpaca-Based Sausages
3.3. Effect of Fat Replacement by Hydrated RDF-PP on Sensory Properties of Emulsified Alpaca-Based Sausages
4. Conclusions
Supplementary Materials
Author Contributions
Funding
Data Availability Statement
Acknowledgments
Conflicts of Interest
Abbreviations
References
- El-Nashi, H.B.; Abdel Fattah, A.F.A.K.; Abdel Rahman, N.R.; Abd El-Razik, M.M. Quality Characteristics of Beef Sausage Containing Pomegranate Peels during Refrigerated Storage. Annals of Agricultural Sciences 2015, 60, 403–412. [Google Scholar] [CrossRef]
- Alves, L.A.A.; Lorenzo, J.M.; Gonçalves, C.A.A.; Dos Santos, B.A.; Heck, R.T.; Cichoski, A.J.; Campagnol, P.C.B. Production of Healthier Bologna Type Sausages Using Pork Skin and Green Banana Flour as a Fat Replacers. Meat Science 2016, 121, 73–78. [Google Scholar] [CrossRef]
- Kamani, M.H.; Meera, M.S.; Bhaskar, N.; Modi, V.K. Partial and Total Replacement of Meat by Plant-Based Proteins in Chicken Sausage: Evaluation of Mechanical, Physico-Chemical and Sensory Characteristics. J Food Sci Technol 2019, 56, 2660–2669. [Google Scholar] [CrossRef]
- Salvá, B.K.; Zumalacárregui, J.M.; Figueira, A.C.; Osorio, M.T.; Mateo, J. Nutrient Composition and Technological Quality of Meat from Alpacas Reared in Peru. Meat Science 2009, 82, 450–455. [Google Scholar] [CrossRef]
- Wurzinger, M.; Gutiérrez, G. Alpaca Breeding in Peru: From Individual Initiatives Towards a National Breeding Programme? Small Ruminant Research 2022, 217, 106844. [Google Scholar] [CrossRef]
- Popova, T.; Tejeda, L.; Peñarrieta, J.M.; Smith, M.A.; Bush, R.D.; Hopkins, D.L. Meat of South American Camelids - Sensory Quality and Nutritional Composition. Meat Science 2021, 171, 108285. [Google Scholar] [CrossRef]
- Smith, M.A.; Nelson, C.L.; Biffin, T.E.; Bush, R.D.; Hall, E.J.S.; Hopkins, D.L. Vitamin E Concentration in Alpaca Meat and Its Impact on Oxidative Traits during Retail Display. Meat Science 2019, 151, 18–23. [Google Scholar] [CrossRef] [PubMed]
- Peña-Saldarriaga, L.M.; Pérez-Alvarez, J.A.; Fernández-López, J. Quality Properties of Chicken Emulsion-Type Sausages Formulated with Chicken Fatty Byproducts. Foods 2020, 9, 507. [Google Scholar] [CrossRef] [PubMed]
- Nieto, G.; Lorenzo, J.M. Use of Olive Oil as Fat Replacer in Meat Emulsions. Current Opinion in Food Science 2021, 40, 179–186. [Google Scholar] [CrossRef]
- Yum, H.W.; Seo, J.K.; Jeong, J.Y.; Kim, G.D.; Rahman, M.S.; Yang, H.S. The Quality Improvement of Emulsion-Type Pork Sausages Formulated by Substituting Pork Back Fat with Rice Bran Oil. 2018, 38, 123–134. Korean journal for food science of animal resources 2018, 38, 123–134. [Google Scholar] [PubMed]
- Olsen, E.; Vogt, G.; Ekeberg, D.; Sandbakk, M.; Pettersen, J.; Nilsson, A. Analysis of the Early Stages of Lipid Oxidation in Freeze-Stored Pork Back Fat and Mechanically Recovered Poultry Meat. J. Agric. Food Chem. 2005, 53, 338–348. [Google Scholar] [CrossRef]
- World Health Organization. Report of the Formal Meeting of Member States to Conclude the Work on the Comprehensive Global Monitoring Framework, Including Indicators, and a Set of Voluntary Global Targets for the Prevention and Control of Noncommunicable Diseases; World Health Organization: Geneva, 2012; p. 6. [Google Scholar]
- World Health Organization Healthy Diet. Available online: https://www.who.int/news-room/fact-sheets/detail/healthy-diet.
- Del Nobile, M.A.; Conte, A.; Incoronato, A.L.; Panza, O.; Sevi, A.; Marino, R. New Strategies for Reducing the Pork Back-Fat Content in Typical Italian Salami. Meat Science 2009, 81, 263–269. [Google Scholar] [CrossRef] [PubMed]
- Mehta, N.; Chatli, M.K.; Kumar, P.; Malav, O.P.; Verma, A.K.; Kumar, Y.; Kumar, D. Development of Dietary Fiber-Rich Meat Products: Technological Advancements and Functional Significance. In Bioactive Molecules in Food; Merillon, J.M., Ramawat, K.G., Eds.; Reference Series in Phytochemistry; Springer International Publishing, 2018; pp. 1–34. ISBN 978-3-319-26478-3. [Google Scholar]
- Salazar, D.; Arancibia, M.; Calderón, L.; López-Caballero, M.E.; Montero, M.P. Underutilized Green Banana (Musa Acuminata AAA) Flours to Develop Fiber Enriched Frankfurter-Type Sausages. Foods 2021, 10, 1142. [Google Scholar] [CrossRef] [PubMed]
- Wongkaew, M.; Sommano, S.R.; Tangpao, T.; Rachtanapun, P.; Jantanasakulwong, K. Mango Peel Pectin by Microwave-Assisted Extraction and Its Use as Fat Replacement in Dried Chinese Sausage. Foods 2020, 9, 450. [Google Scholar] [CrossRef] [PubMed]
- Chen, H.; Liu, Y.; Zhang, J.; Jiang, Y.; Li, D. Pectin Extracted from Dragon Fruit Peel: An Exploration as a Natural Emulsifier. International Journal of Biological Macromolecules 2022, 221, 976–985. [Google Scholar] [CrossRef] [PubMed]
- Roman-Benn, A.; Contador, C.A.; Li, M.-W.; Lam, H.-M.; Ah-Hen, K.; Ulloa, P.E.; Ravanal, M.C. Pectin: An Overview of Sources, Extraction and Applications in Food Products, Biomedical, Pharmaceutical and Environmental Issues. Food Chemistry Advances 2023, 2, 100192. [Google Scholar] [CrossRef]
- Vilcapoma, W.; De Bruijn, J.; Elías-Peñafiel, C.; Espinoza, C.; Farfán-Rodríguez, L.; López, J.; Encina-Zelada, C.R. Optimization of Ultrasound-Assisted Extraction of Dietary Fiber from Yellow Dragon Fruit Peels and Its Application in Low-Fat Alpaca-Based Sausages. Foods 2023, 12, 2945. [Google Scholar] [CrossRef] [PubMed]
- Choe, J.H.; Kim, H.Y.; Lee, J.M.; Kim, Y.J.; Kim, C.J. Quality of Frankfurter-Type Sausages with Added Pig Skin and Wheat Fiber Mixture as Fat Replacers. Meat Science 2013, 93, 849–854. [Google Scholar] [CrossRef] [PubMed]
- Zaini, H.B.M.; Sintang, M.D.B.; Pindi, W. The Roles of Banana Peel Powders to Alter Technological Functionality, Sensory and Nutritional Quality of Chicken Sausage. Food Science & Nutrition 2020, 8, 5497–5507. [Google Scholar] [CrossRef]
- Properties of Emulsion Sausage with Partial Replacement of Fat by Dragon Fruit Peel Powder. In Human Interaction, Emerging Technologies and Future Applications II; Aukkanit, N., Sroyraya, S., Duljumnong, T., Eds.; Advances in Intelligent Systems and Computing; Springer International Publishing: Cham, 2020; Volume 1152 , ISBN 978-3-030-44266-8. [Google Scholar]
- Zahari, N.I.M.; Muhammad, K.; Bakar, J.; Mohd Adzahan, N. Optimization of Pectin Extraction from Dragon Fruit Peel. Acta Hortic. 2013, 1443–1450. [Google Scholar] [CrossRef]
- Mai, T.H.A.; Tran, T.T.T.; Le, V.V.M. Use of Pitaya Peel Powder for Partial Replacement of Wheat Flour in Cookie Making: Effects of Particle Size of Pitaya Peel Powder on the Product Quality. Food Processing Preservation 2022, 46. [Google Scholar] [CrossRef]
- Morais, D.C.M.; Alves, V.M.; Asquieri, E.R.; Souza, A.R.M.; Damiani, C. Physical, Chemical, Nutritional and Antinutritional Characterization of Fresh Peels of Yellow Pitaya (Selenicereus Megalanthus) and Red Pitaya (Hylocereus Costaricensis) and Their Flours. Revista Ciência Agronômica 2021, 52, e20207289. [Google Scholar] [CrossRef]
- Hsu, C.; Chang, Y.; Shiau, S. Color, Antioxidation, and Texture of Dough and Chinese Steamed Bread Enriched with Pitaya Peel Powder. Cereal Chem 2019, 96, 76–85. [Google Scholar] [CrossRef]
- Zhuang, Y.; Zhang, Y.; Sun, L. Characteristics of Fibre-Rich Powder and Antioxidant Activity of Pitaya (Hylocereus Undatus) Peels. Int J of Food Sci Tech 2012, 47, 1279–1285. [Google Scholar] [CrossRef]
- Geerkens, C.H.; Nagel, A.; Just, K.M.; Miller-Rostek, P.; Kammerer, D.R.; Schweiggert, R.M.; Carle, R. Mango Pectin Quality as Influenced by Cultivar, Ripeness, Peel Particle Size, Blanching, Drying, and Irradiation. Food Hydrocolloids 2015, 51, 241–251. [Google Scholar] [CrossRef]
- Chia, S.L.; Chong, G.H. Effect of Drum Drying on Physico-Chemical Characteristics of Dragon Fruit Peel (Hylocereus Polyrhizus). International Journal of Food Engineering 2015, 11, 285–293. [Google Scholar] [CrossRef]
- AOAC International AOAC: Official Methods of Analysis 1990.
- Muhammad, K.; Zahari, N.I.M.; Gannasin, S.P.; Adzahan, N.M.; Bakar, J. High Methoxyl Pectin from Dragon Fruit (Hylocereus Polyrhizus) Peel. Food Hydrocolloids 2014, 42, 289–297. [Google Scholar] [CrossRef]
- F04 Committee ASTM F1877-16 Standard Practice for Characterization of Particles 2016.
- Salazar, P.; García, M.L.; Selgas, M.D. Short-Chain Fructooligosaccharides as Potential Functional Ingredient in Dry Fermented Sausages with Different Fat Levels. Int J of Food Sci Tech 2009, 44, 1100–1107. [Google Scholar] [CrossRef]
- Amini-Sarteshnizi, R.; Hosseini, H.; Bondarianzadeh, D.; Colmenero, F.J.; Khaksar, R. Optimization of Prebiotic Sausage Formulation: Effect of Using β-Glucan and Resistant Starch by D-Optimal Mixture Design Approach. LWT - Food Science and Technology 2015, 62, 704–710. [Google Scholar] [CrossRef]
- Grigelmo-Miguel, N. Characterisation of Low-Fat High-Dietary Fibre Frankfurters. Meat Science 1999, 52, 247–256. [Google Scholar] [CrossRef] [PubMed]
- Salejda, A.M.; Olender, K.; Zielińska-Dawidziak, M.; Mazur, M.; Szperlik, J.; Miedzianka, J.; Zawiślak, I.; Kolniak-Ostek, J.; Szmaja, A. Frankfurter-Type Sausage Enriched with Buckwheat By-Product as a Source of Bioactive Compounds. Foods 2022, 11, 674. [Google Scholar] [CrossRef]
- R Core Team R: A Language and Environment for Statistical Computing 2023.
- Encina-Zelada, C.R.; Cadavez, V.; Teixeira, J.A.; Gonzales-Barron, U. Optimization of Quality Properties of Gluten-Free Bread by a Mixture Design of Xanthan, Guar, and Hydroxypropyl Methyl Cellulose Gums. Foods 2019, 8, 156. [Google Scholar] [CrossRef]
- Ahmed, J.; Al-Attar, H.; Arfat, Y.A. Effect of Particle Size on Compositional, Functional, Pasting and Rheological Properties of Commercial Water Chestnut Flour. Food Hydrocolloids 2016, 52, 888–895. [Google Scholar] [CrossRef]
- Ahmed, J.; Thomas, L.; Arfat, Y.A. Functional, Rheological, Microstructural and Antioxidant Properties of Quinoa Flour in Dispersions as Influenced by Particle Size. Food Research International 2019, 116, 302–311. [Google Scholar] [CrossRef]
- Gao, W.; Chen, F.; Wang, X.; Meng, Q. Recent Advances in Processing Food Powders by Using Superfine Grinding Techniques: A Review. Comp Rev Food Sci Food Safe 2020, 19, 2222–2255. [Google Scholar] [CrossRef]
- Jose, M.; Himashree, P.; Sengar, A.S.; Sunil, C.K. Valorization of Food Industry By-Product (Pineapple Pomace): A Study to Evaluate Its Effect on Physicochemical and Textural Properties of Developed Cookies. Measurement: Food 2022, 6, 100031. [Google Scholar] [CrossRef]
- Bourré, L.; Frohlich, P.; Young, G.; Borsuk, Y.; Sopiwnyk, E.; Sarkar, A.; Nickerson, M.T.; Ai, Y.; Dyck, A.; Malcolmson, L. Influence of Particle Size on Flour and Baking Properties of Yellow Pea, Navy Bean, and Red Lentil Flours. Cereal Chem 2019, 96, 655–667. [Google Scholar] [CrossRef]
- Silva, V.; Arquelau, P.; Silva, M.; Augusti, R.; Melo, J.; Fante, C. Use of Paper Spray-Mass Spectrometry to Determine the Chemical Profile of Ripe Banana Peel Flour and Evaluation of Its Physicochemical and Antioxidant Properties. Quim. Nova 2020, 43, 579–585. [Google Scholar] [CrossRef]
- Tejada-Ortigoza, V.; Garcia-Amezquita, L.E.; Serna-Saldívar, S.O.; Welti-Chanes, J. Advances in the Functional Characterization and Extraction Processes of Dietary Fiber. Food Eng Rev 2016, 8, 251–271. [Google Scholar] [CrossRef]
- Zlatanović, S.; Kalušević, A.; Micić, D.; Laličić-Petronijević, J.; Tomić, N.; Ostojić, S.; Gorjanović, S. Functionality and Storability of Cookies Fortified at the Industrial Scale with up to 75% of Apple Pomace Flour Produced by Dehydration. Foods 2019, 8, 561. [Google Scholar] [CrossRef] [PubMed]
- Niu, Y.; Xia, Q.; Gu, M.; Yu, L.Y. Interpenetrating Network Gels Composed of Gelatin and Soluble Dietary Fibers from Tomato Peels. Food Hydrocolloids 2019, 89, 95–99. [Google Scholar] [CrossRef]
- Iuga, M.; Mironeasa, S. Potential of Grape Byproducts as Functional Ingredients in Baked Goods and Pasta. Comp Rev Food Sci Food Safe 2020, 19, 2473–2505. [Google Scholar] [CrossRef] [PubMed]
- Larrosa, A.P.Q.; Otero, D.M. Flour Made from Fruit By-Products: Characteristics, Processing Conditions, and Applications. J Food Process Preserv 2021, 45, e15398. [Google Scholar] [CrossRef]
- Martínez-Girón, J.; Osorio, C.; Ordoñez-Santos, L.E. Effect of Temperature and Particle Size on Physicochemical and Techno-Functional Properties of Peach Palm Peel Flour (Bactris Gasipaes, Red and Yellow Ecotypes). Food sci. technol. int. 2022, 28, 535–544. [Google Scholar] [CrossRef] [PubMed]
- Viuda-Martos, M.; Barber, X.; Pérez-Álvarez, J.A.; Fernández-López, J. Assessment of Chemical, Physico-Chemical, Techno-Functional and Antioxidant Properties of Fig (Ficus Carica L.) Powder Co-Products. Industrial Crops and Products 2015, 69, 472–479. [Google Scholar] [CrossRef]
- Chen, J.; Liang, R.H.; Liu, W.; Liu, C.M.; Li, T.; Tu, Z.C.; Wan, J. Degradation of High-Methoxyl Pectin by Dynamic High Pressure Microfluidization and Its Mechanism. Food Hydrocolloids 2012, 28, 121–129. [Google Scholar] [CrossRef]
- Van Audenhove, J.; Bernaerts, T.; Putri, N.I.; Van Loey, A.M.; Hendrickx, M.E. The Functionalisation of Fruit and Vegetable Cell Wall Material as Texturizing Agent: The Role of Pectin Depletion and Particle Size Reduction Techniques. Food Hydrocolloids 2023, 142, 108814. [Google Scholar] [CrossRef]
- Parrott, M.E.; Thrall, B.E. Functional Properties of Various Fibers: Physical Properties. Journal of Food Science 1978, 43, 759–763. [Google Scholar] [CrossRef]
- Singthong, J.; Cui, S.; Ningsanond, S.; Douglasgoff, H. Structural Characterization, Degree of Esterification and Some Gelling Properties of Krueo Ma Noy (Cissampelos Pareira) Pectin. Carbohydrate Polymers 2004, 58, 391–400. [Google Scholar] [CrossRef]
- Tien, N.N.T.; Le, N.L.; Khoi, T.T.; Richel, A. Optimization of Microwave-Ultrasound-Assisted Extracction (MUAE) of Pectin from Dragon Fruit Peels Using Natural Deep Eutectic Solvents (NADES). Journal of Food Processing and Preservation 2022, 46, e16117. [Google Scholar] [CrossRef]
- Zaid, R.M.; Mishra, P.; Tabassum, S.; Wahid, Z.A.; Sakinah, A.M.M. High Methoxyl Pectin Extracts from Hylocereus Polyrhizus’s Peels: Extraction Kinetics and Thermodynamic Studies. International Journal of Biological Macromolecules 2019, 141, 1147–1157. [Google Scholar] [CrossRef]
- Li, X.; Zhang, Z.H.; Qiao, J.; Qu, W.; Wang, M.S.; Gao, X.; Zhang, C.; Brennan, C.S.; Qi, X. Improvement of Betalains Stability Extracted from Red Dragon Fruit Peel by Ultrasound-Assisted Microencapsulation with Maltodextrin. Ultrasonics Sonochemistry 2022, 82, 105897. [Google Scholar] [CrossRef] [PubMed]
- European Commission. Regulation (EC) No 1924/2006 of the European Parliament and of the Council of 20 December 2006 on Nutrition and Health Claims Made on Foods; Volume 1924/2006.
- Basharat, Z.; Imran, M.; Fatima, N.; Sajid, M.W.; Tariq, M.R.; Ali, S.W.; Umer, Z.; Safdar, W.; Garti, H. Development of Chicken Tender Pops by Utilizing Pomegranate Peel Powder. Food Science & Nutrition 2023, 11, 4530–4546. [Google Scholar] [CrossRef]
- Petersson, K.; Godard, O.; Eliasson, A.C.; Tornberg, E. The Effects of Cereal Additives in Low-Fat Sausages and Meatballs. Part 2: Rye Bran, Oat Bran and Barley Fibre. Meat Science 2014, 96, 503–508. [Google Scholar] [CrossRef] [PubMed]
- Pereira, A.G.T.; Ramos, E.M.; Teixeira, J.T.; Cardoso, G.P.; Ramos, A.L.S.; Fontes, P.R. Effects of the Addition of Mechanically Deboned Poultry Meat and Collagen Fibers on Quality Characteristics of Frankfurter-Type Sausages. Meat Science 2011, 89, 519–525. [Google Scholar] [CrossRef]
- Cáceres, E.; García, M.L.; Selgas, M.D. Design of a New Cooked Meat Sausage Enriched with Calcium. Meat Science 2006, 73, 368–377. [Google Scholar] [CrossRef]
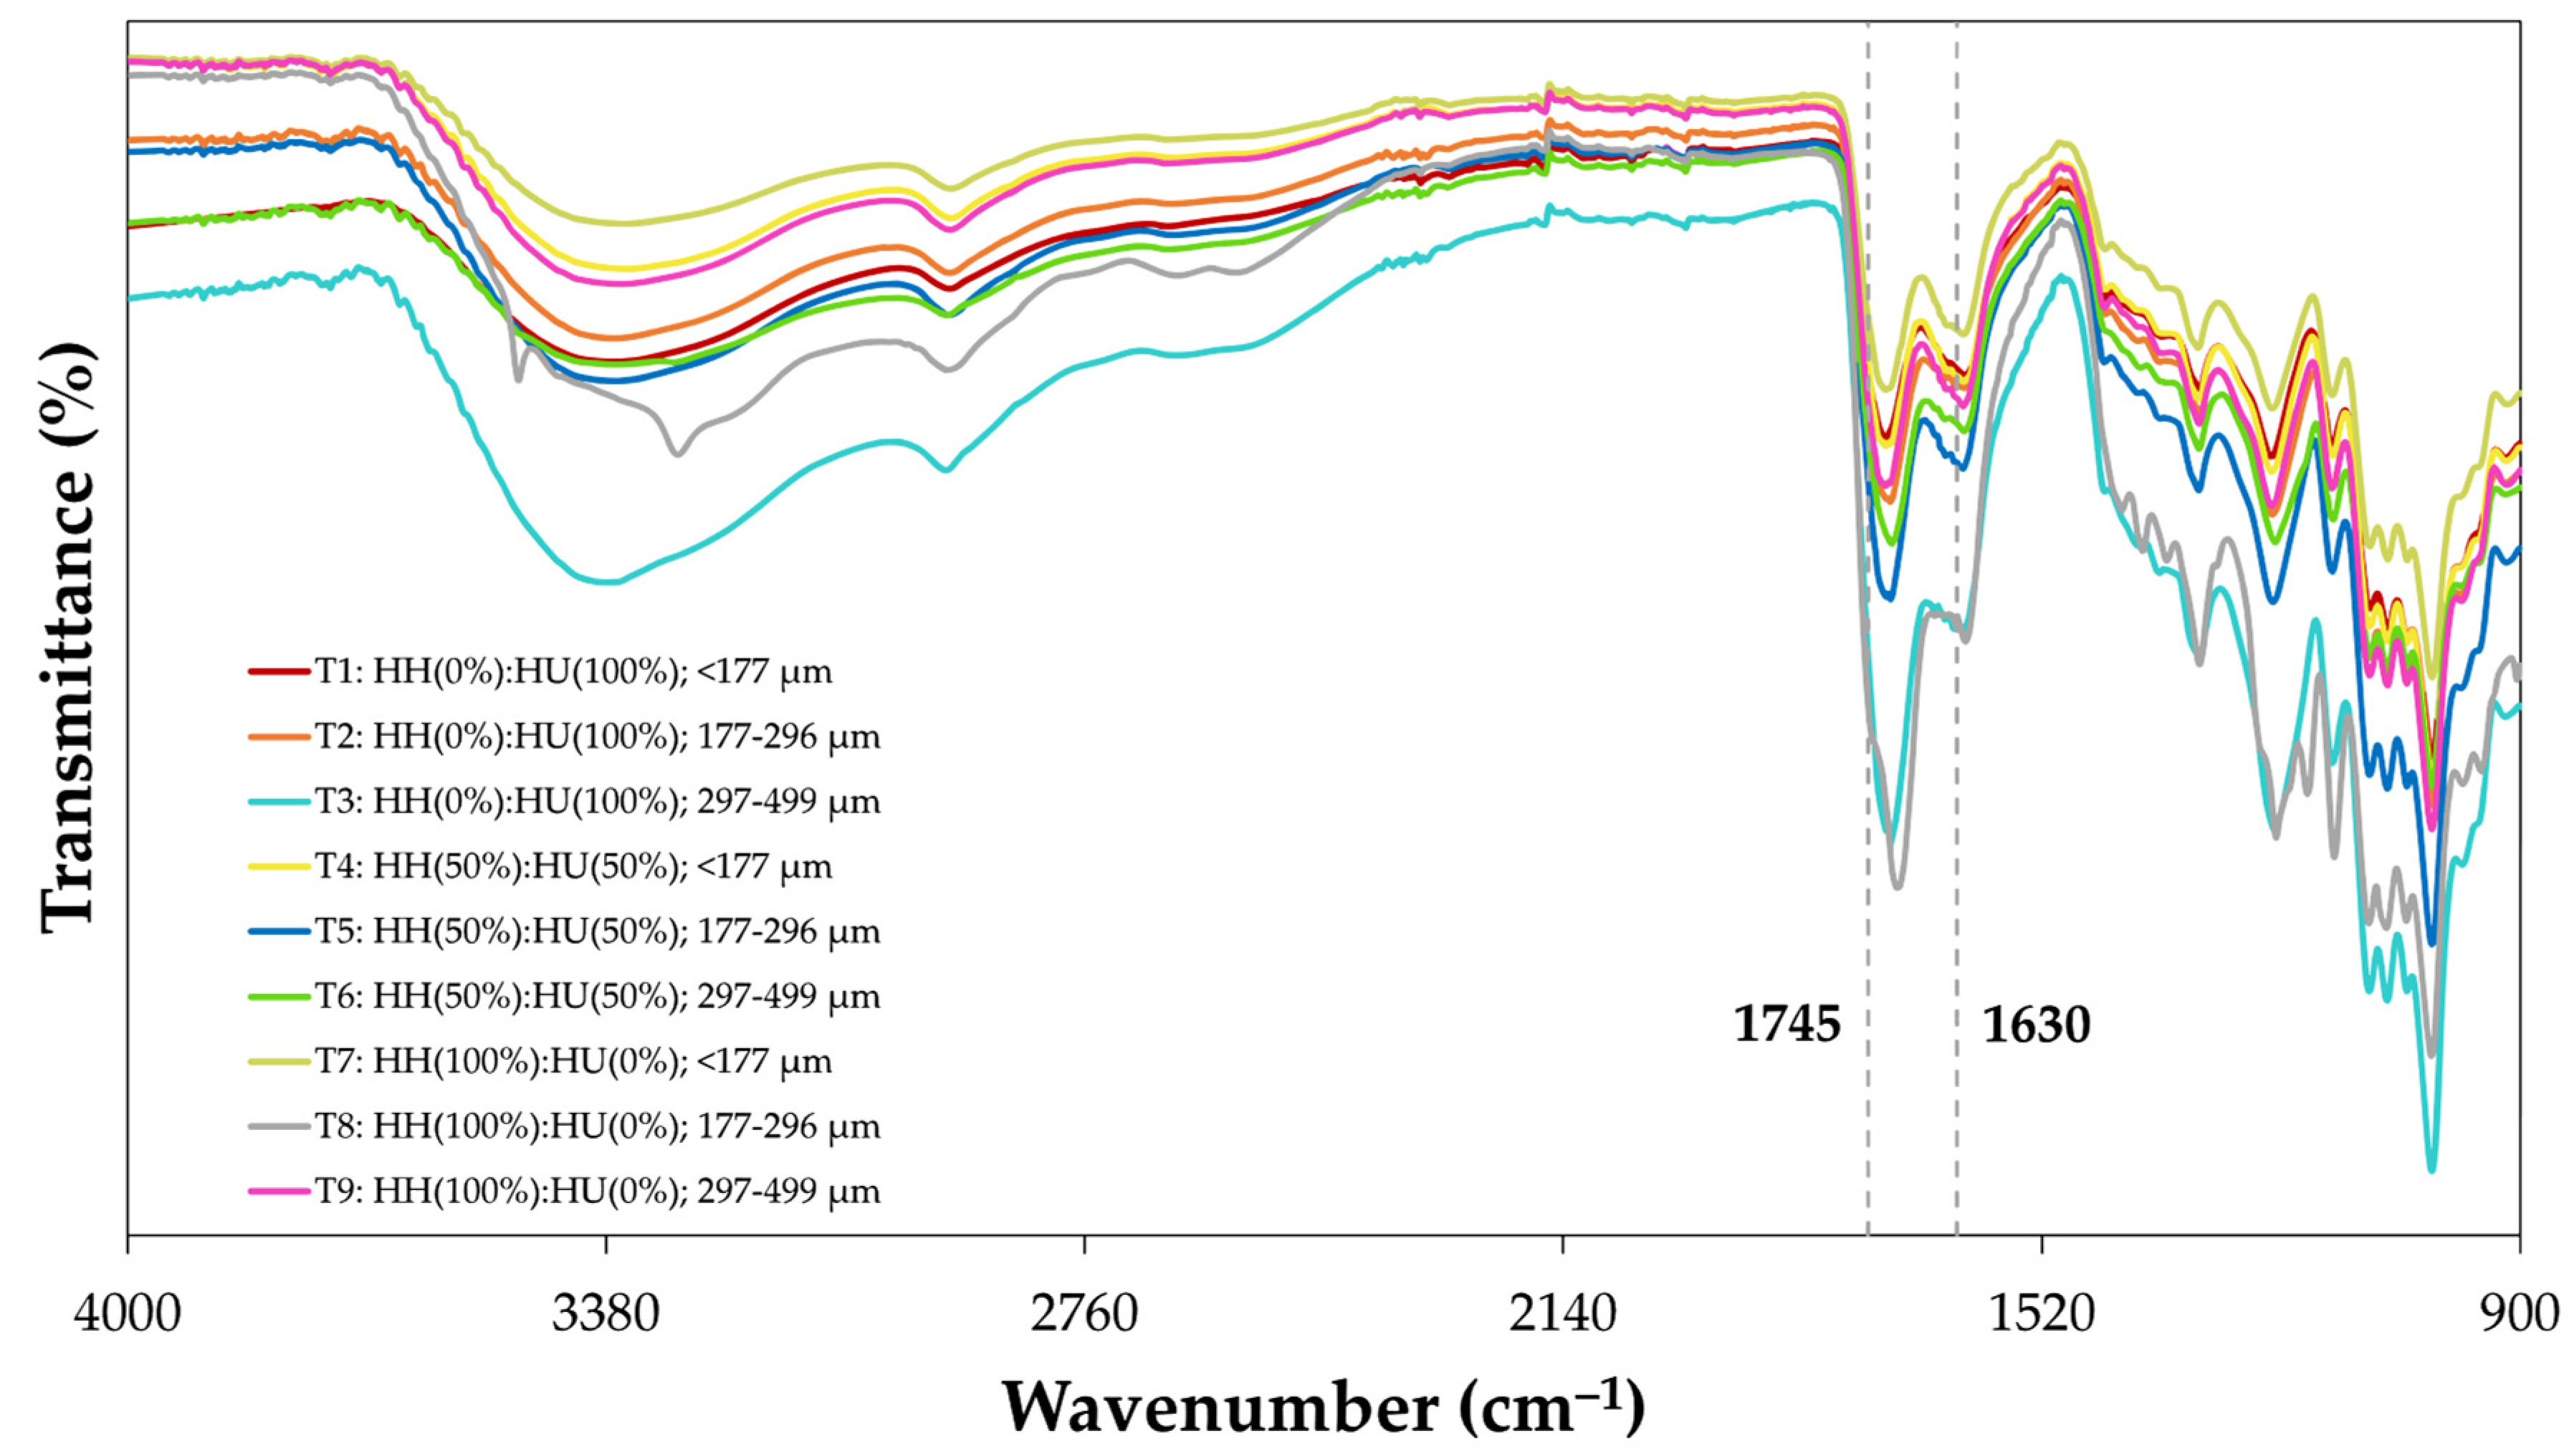
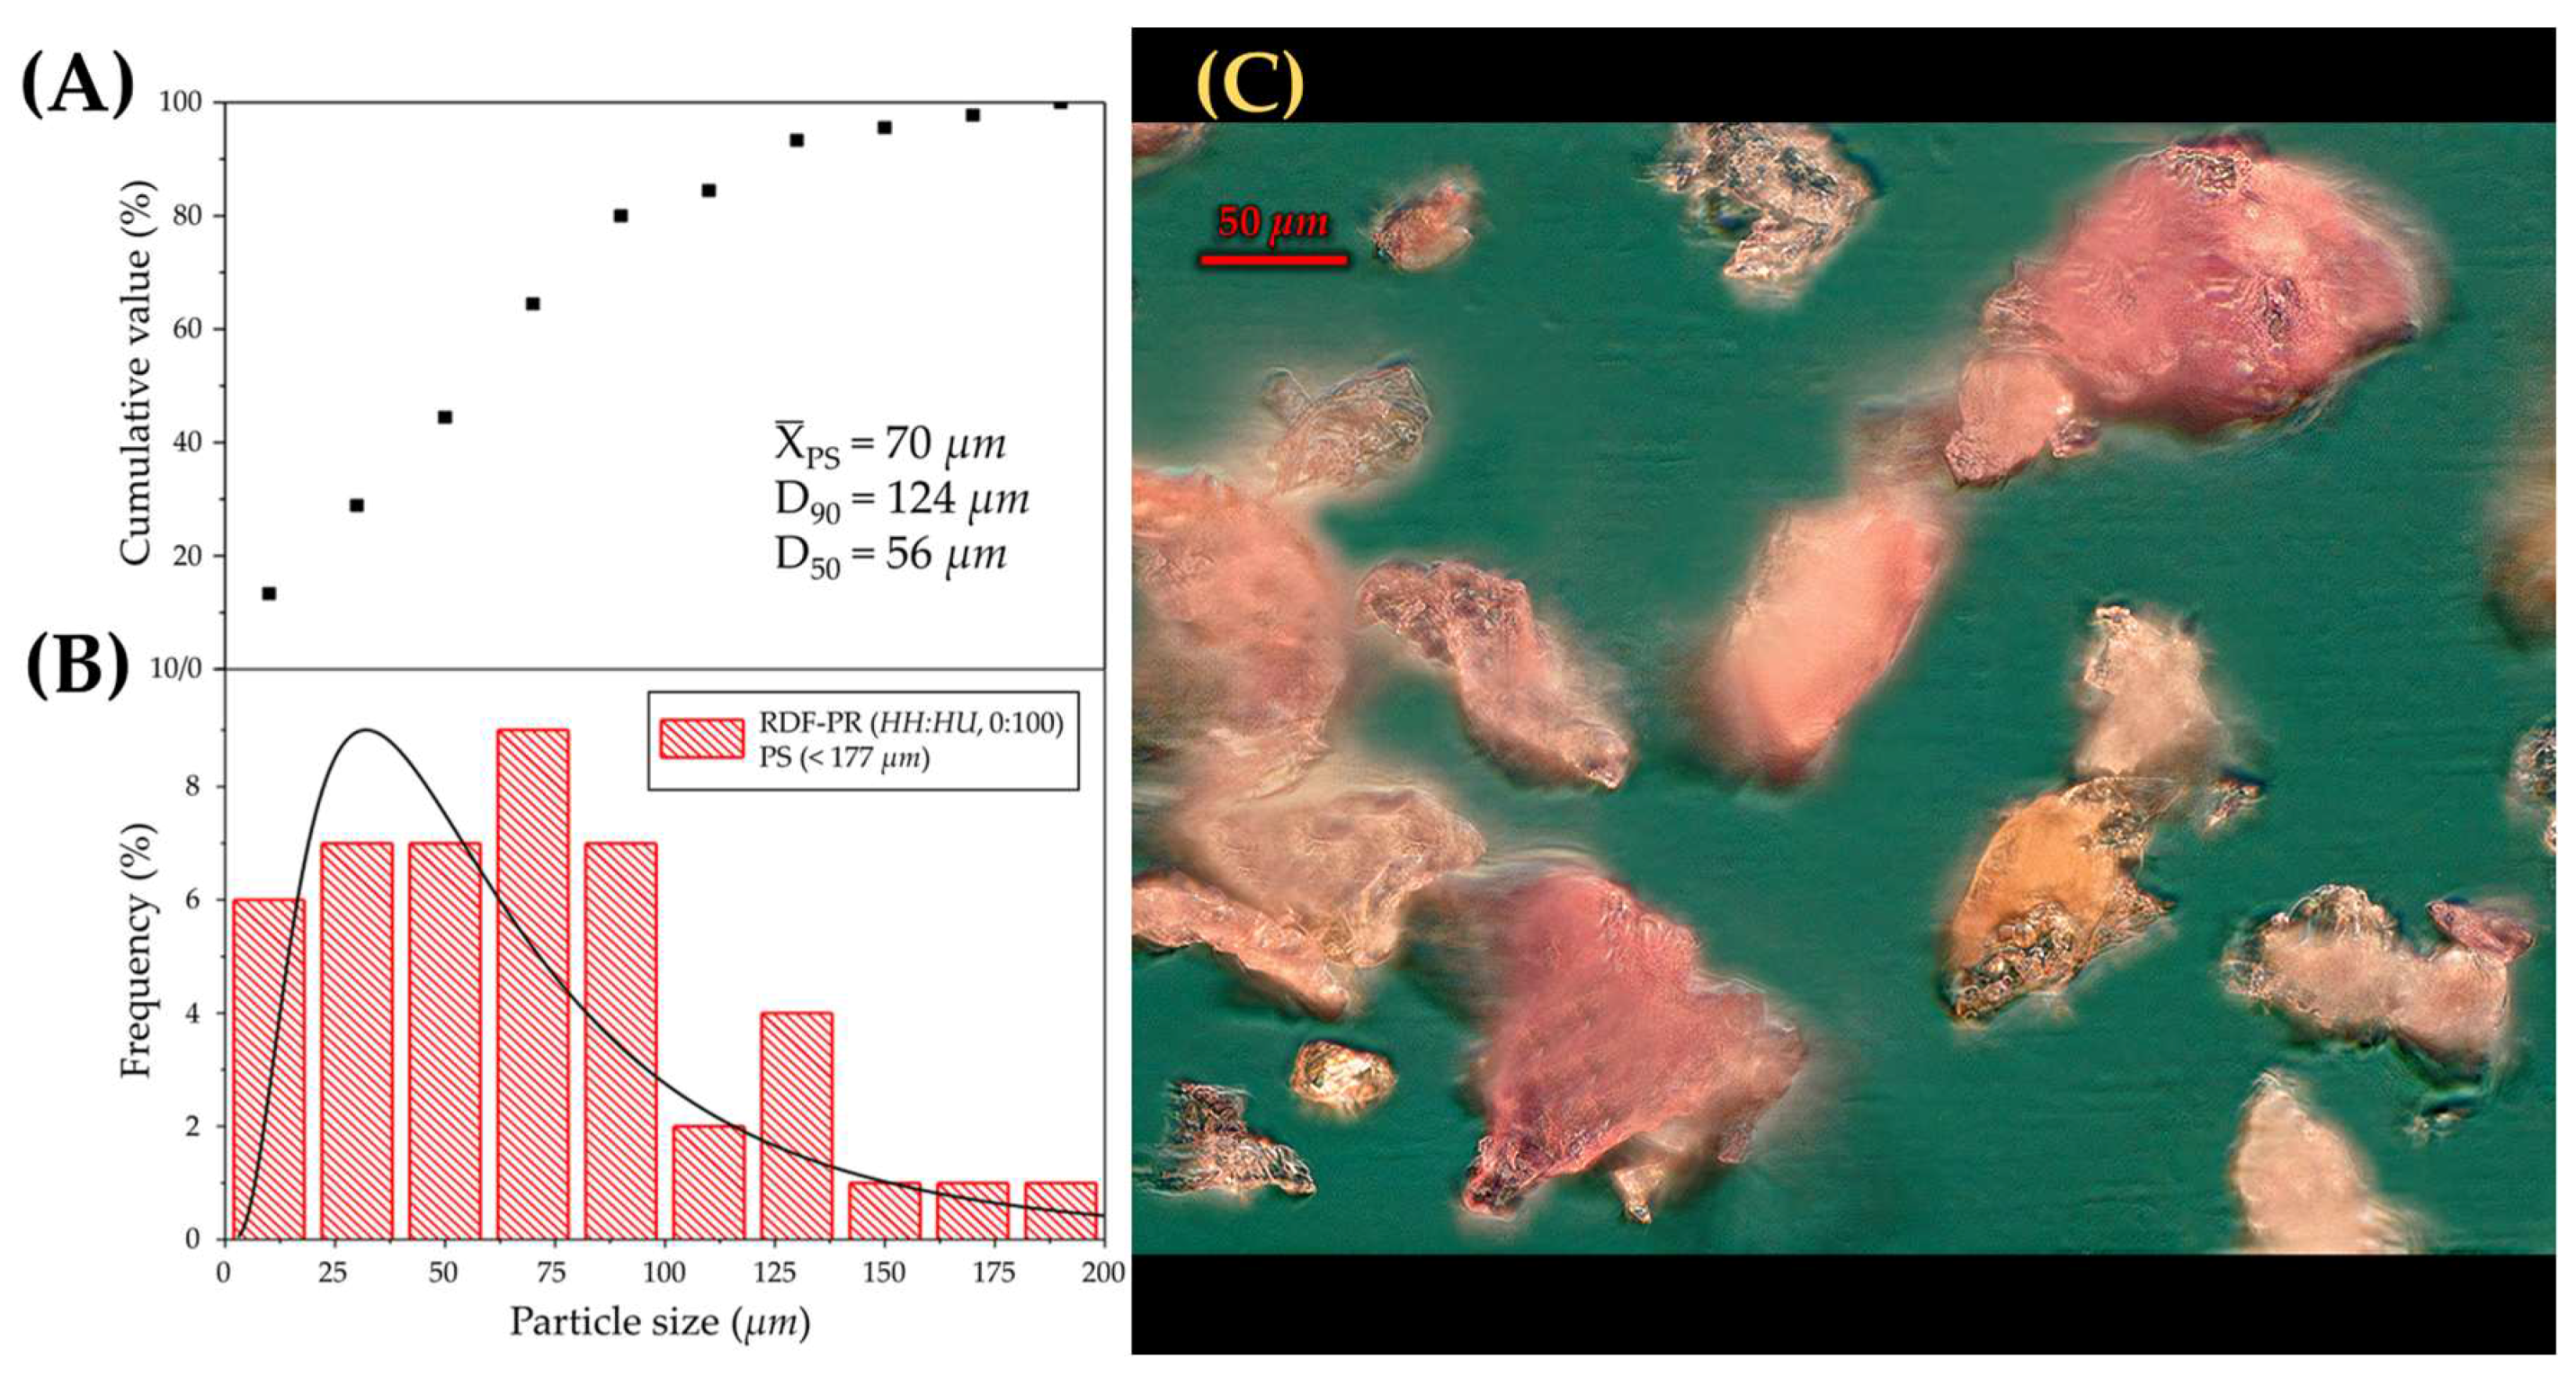
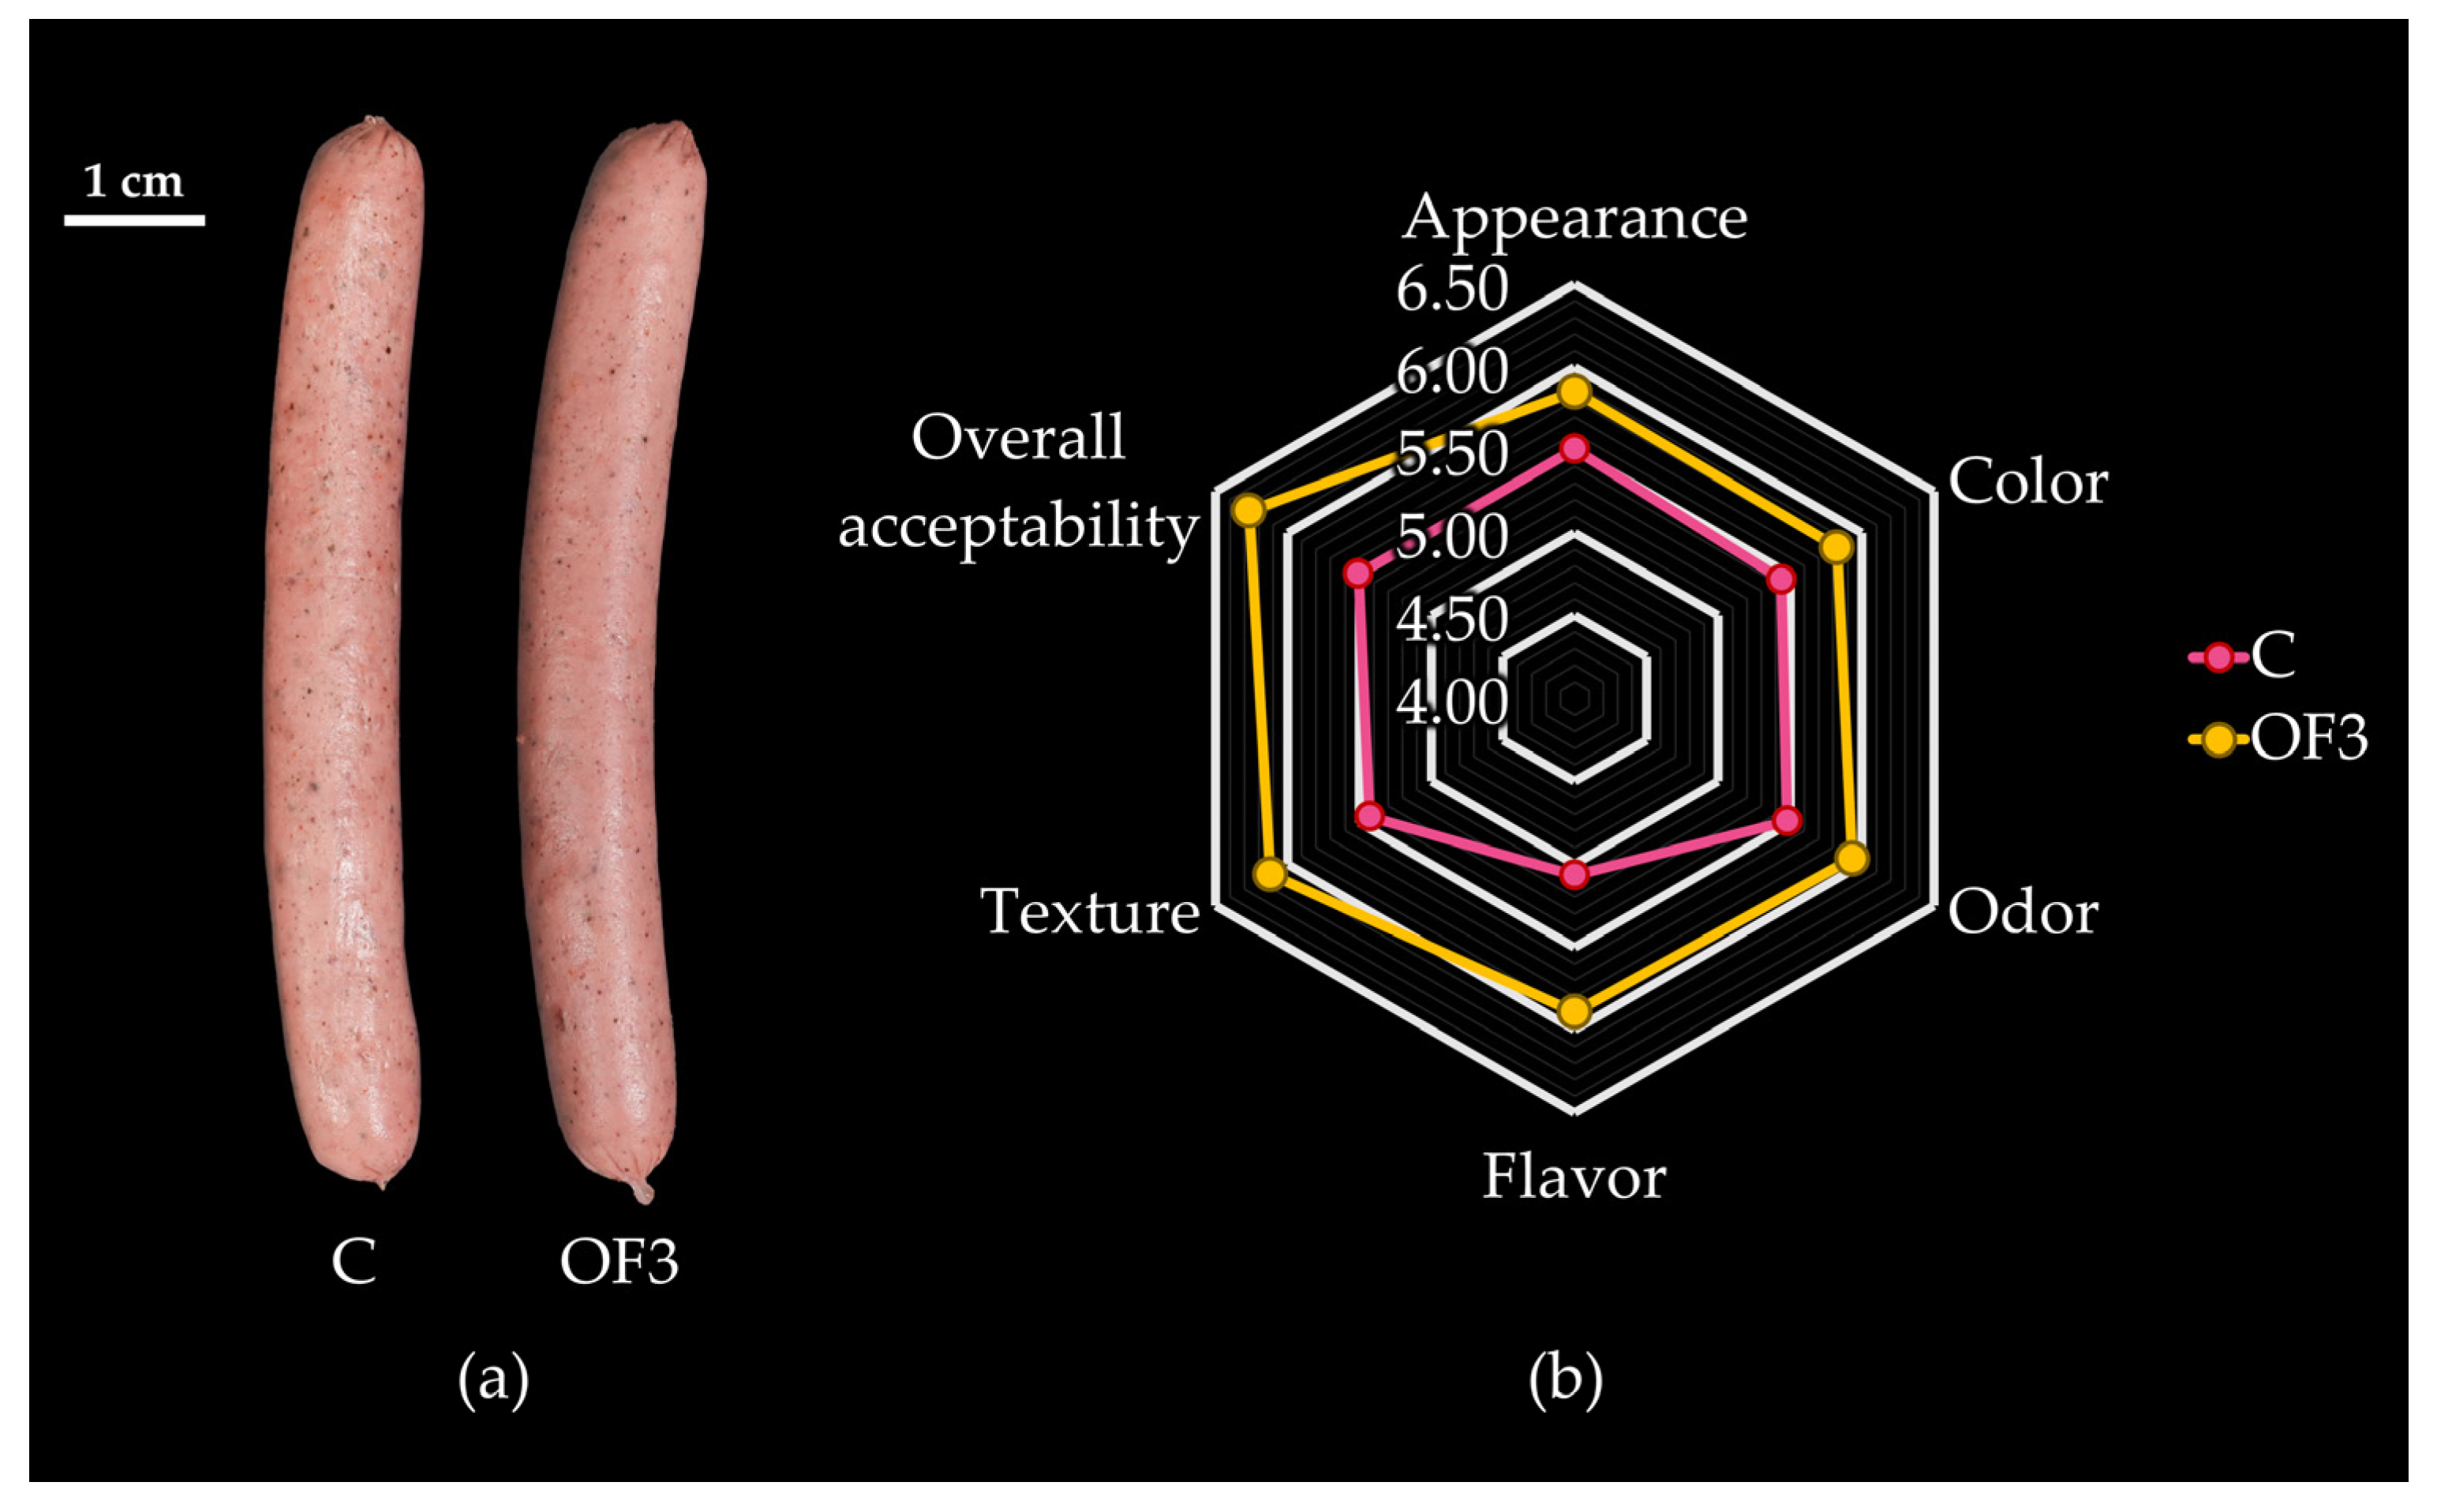
| T | WHC | OHC | SC | PY | CF | DE |
|---|---|---|---|---|---|---|
| T1 | 31.9 ± 0.09 a | 2.11 ± 0.02 a | 46.9 ± 0.03 a | 27.3 ± 1.29 a | 18.4 ± 0.31 ab | 49.9 ± 0.38 b |
| T2 | 24.3 ± 0.93 b | 1.81 ± 0.04 b | 30.1 ± 1.85 c | 25.2 ± 1.12 ab | 18.2 ± 0.27 ab | 50.8 ± 1.35 ab |
| T3 | 19.1 ± 0.04 cd | 1.48 ± 0.03 c | 23.3 ± 0.25 d | 21.6 ± 1.98 cd | 18.5 ± 0.17 ab | 51.5 ± 1.02 ab |
| T4 | 24.1 ± 1.45 b | 2.13 ± 0.01 a | 44.3 ± 1.07 a | 21.6 ± 0.10 cd | 16.2 ± 0.48 c | 49.5 ± 0.47 b |
| T5 | 20.1 ± 0.43 cd | 1.80 ± 0.02 b | 30.2 ± 1.73 c | 23.4 ± 0.19 bc | 17.8 ± 0.23 b | 51.2 ± 0.31 ab |
| T6 | 18.6 ± 0.34 de | 1.44 ± 0.04 cd | 23.0 ± 0.10 d | 25.8 ± 1.25 ab | 18.4 ± 0.45 ab | 51.0 ± 0.36 ab |
| T7 | 17.3 ± 0.12 e | 2.04 ± 0.07 a | 41.5 ± 0.52 b | 13.7 ± 1.10 e | 15.9 ± 0.44 c | 49.1 ± 0.37 b |
| T8 | 19.2 ± 0.09 cd | 1.75 ± 0.04 b | 28.0 ± 0.07 c | 19.1 ± 0.67 d | 18.9 ± 0.34 a | 52.8 ± 1.59 a |
| T9 | 20.8 ± 0.48 c | 1.37 ± 0.03 d | 24.3 ± 0.04 d | 22.7 ± 1.16 bc | 18.7 ± 0.09 ab | 50.3 ± 1.08 ab |
| Dependent variables | Lower limit | Upper limit | Observed value | Predicted value |
|---|---|---|---|---|
| WHC | 30.7 | 33.1 | 32.1 a | 31.9 a |
| OHC | 2.08 | 2.18 | 2.20 b | 2.13 b |
| PY | 25.3 | 28.9 | 27.1 c | 27.1 c |
| Dependent variables | Formulations | |||
|---|---|---|---|---|
| C | F1 | F2 | F3 | |
| Physico–chemical properties | ||||
| L* | 56.3 ± 0.05 a | 53.4 ± 0.02 b | 50.7 ± 0.34 c | 48.9 ± 0.43 d |
| a* | 17.2 ± 0.01 c | 17.3 ± 0.17 c | 18.4 ± 0.03 b | 19.3 ± 0.03 a |
| b* | 13.0 ± 0.05 a | 12.9 ± 0.04 b | 12.6 ± 0.01 c | 12.4 ± 0.01 d |
| C | 19.2 ± 0.04 d | 21.2 ± 0.01 c | 22.4 ± 0.03 b | 22.9 ± 0.02 a |
| h° | 36.7 ± 0.03 a | 36.3 ± 0.02 b | 35.3 ± 0.02 c | 32.6 ± 0.10 d |
| aw | 0.9817 ± 0.0000 a | 0.9842 ± 0.0000 a | 0.9825 ± 0.0000 a | 0.9814 ± 0.0000 a |
| MC (%) | 66.9 ± 0.10 d | 68.1 ± 0.53 c | 69.9 ± 0.04 b | 73.2 ± 0.27 a |
| FC (%) | 24.3 ± 0.45 a | 20.0 ± 0.84 b | 17.6 ± 0.88 c | 12.8 ± 0.42 d |
| PC (%) | 15.9 ± 0.13 a | 15.9 ± 0.09 a | 15.5 ± 0.15 b | 15.3 ± 0.12 b |
| CY (%) | 72.2 ± 1.22 a | 70.7 ± 0.77 ab | 69.9 ± 0.90 b | 66.9 ± 0.05 c |
| FL (%) | 27.8 ± 1.22 c | 29.3 ± 0.77 bc | 30.0 ± 0.90 b | 33.0 ± 0.05 a |
| Texture properties | ||||
| Hardness (N) | 49.9 ± 1.45 a | 41.3 ± 1.73 b | 40.0 ± 0.20 b | 34.8 ± 0.96 c |
| Chewiness (N) | 26.9 ± 0.78 a | 25.5 ± 1.98 ab | 22.9 ± 0.25 bc | 21.7 ± 0.24 c |
| Cohesiveness (−) | 0.606 ± 0.01 a | 0.616 ± 0.03 a | 0.633 ± 0.06 a | 0.633 ± 0.06 a |
| Springiness (−) | 0.867 ± 0.06 a | 0.900 ± 0.00 a | 0.867 ± 0.06 a | 0.900 ± 0.00 a |
| Adhesiveness (mJ) | 0.180 ± 0.02 a | 0.057 ± 0.02 b | 0.064 ± 0.01 b | 0.031 ± 0.01 b |
| Adhesive force (N) | 0.049 ± 0.001 a | 0.056 ± 0.008 a | 0.059 ± 0.021 a | 0.065 ± 0.005 a |
Disclaimer/Publisher’s Note: The statements, opinions and data contained in all publications are solely those of the individual author(s) and contributor(s) and not of MDPI and/or the editor(s). MDPI and/or the editor(s) disclaim responsibility for any injury to people or property resulting from any ideas, methods, instructions or products referred to in the content. |
© 2024 by the authors. Licensee MDPI, Basel, Switzerland. This article is an open access article distributed under the terms and conditions of the Creative Commons Attribution (CC BY) license (http://creativecommons.org/licenses/by/4.0/).


