Preprint
Article

Vortex Induced Vibration Response of the Cylinder Inspired by Terebridae with Different Helical Angle

Altmetrics

Downloads

116

Views

50

Comments

0

This version is not peer-reviewed

Submitted:

03 January 2024

Posted:

05 January 2024

You are already at the latest version

Alerts
Abstract
Biomimetic design has recently received widespread attention. Inspired by the Terebridae structure, this paper provides a structural form for suppressing vortex-induced vibration (VIV) response. Four different structural forms are shown, including the traditional smooth cylinder (P0), the Terebridae-inspired cylinder with a helical angle of 30° (P30), the Terebridae-inspired cylinder with a helical angle of 60° (P60), and the Terebridae-inspired cylinder with a helical angle of 90° (P90). And computational fluid dynamics (CFD) method is adopted to solve the flow pass the Terebridae-inspired structures, and the vibration equation is solved using the Newmark-β method. The results show that the VIV responses are effectively controlled in the lock-in region for P30, P60, and P90, and P60 shows the best VIV suppression performance. The transverse amplitude and the downstream amplitude can be reduced by 82.67% and 91.43% respectively for P60 compared with that for P0, and the peak of the mean-drag coefficient is suppressed by 53.33%. The Q-criterion vortices of P30, P60, and P90 are destroyed, with irregular vortices shedding. It is also found that the boundary layer separation is located on the Terebridae-inspired ribs. The twisted ribs cause the separation point to constantly change along the spanwise direction, resulting in the development of the boundary layer separation being completely destroyed. The strength of the wake flow is significantly weakened for the Terebridae-inspired cylinder. In the lock-in region, the motion trajectory presents a typical 8-shaped for P0, while the motion trajectory of the Terebridae-inspired cylinder tends to be a flat 1-shaped.
Keywords: 
Subject: Engineering  -   Marine Engineering

1. Introduction

Under the action of ocean currents, marine structures such as marine risers, anchoring line, submarine tunnels, and submarine pipeline will suffer vortex-induced vibration (VIV) responses.1 On both sides of the marine structure, vortices will alternately shed, causing periodic fluctuations in the lift force, thereby triggering structural vibration. The vibration of the structure will in turn affect the shedding vortices.2,3 More intense motion phenomena will occur when the vortex-shedding frequency is close to the natural frequency of the marine structures, called “lock-in”.4 Therefore, VIV is an important reason for the fatigue damage or the fracture of marine structures with large slenderness ratios.5 The VIV suppression has attracted increasing attention from scholars and engineers.6,7,8
There have been already a large number of active and passive control methods used for suppressing VIV response.6,9 The method that usually requires additional energy input is called active control method.6,9 Active jet is the most common active control method, and the windward-suction-leeward-blowing method (WSLBM) was adopted by Rabiee et al. for VIV suppression of square cylinder.10 There have been grooves of a certain length at the front and back of the square cylinder for the jet of the open loop, and as the blowing and suction speed increases, the wake was elongated, suppressing the wake vortex shedding. The vortex pattern has been changed, and the VIV response could be effectively suppressed.10 Vicente-Ludlam et al. used Lattice Boltzmann method to study the VIV response of a rotating cylinder, and rotation rate determined whether to suppress or enhance VIV response. When the rotation rate was positive, the VIV response was suppressed. When the rotation rate was negative, the VIV response was enhanced.12 Zhu et al. used CFD method to investigate the suppression effect of two rotating control rods on the VIV response of a circular cylinder, and the diameter ratio of the control rod to the cylinder was 0.06.13 When two control rods rotate inward and in opposite directions, external flow could be introduced into the boundary layer of the circular cylinder, disrupting the formation of the boundary layer and effectively suppressing the VIV response.13 The sharp-interface immersed boundary method was adopted to numerically investigated the VIV response of the cylinder, taking into account the thermal buoyancy, and the Richardson number (Ri) was the most important thermal control parameter.14,15 When Ri exceeded the critical value, the VIV response could be completely suppressed. However, the smaller the mass ratio of the cylinder, the higher critical value of Ri was required to completely suppress the VIV response.14,15 Hebrero et al. used the particle image velocimetry (PIV) experiments to study the suppression effect of plasma actuators on VIV response, and this method showed excellent suppression effect throughout the entire VIV response region.16 With the development of the artificial intelligence technology, some machine learning methods have been introduced to control VIV response. Zheng et al. showed two machine learning frameworks to control jet, including active learning and reinforcement learning. The VIV amplitude could be reduced by 82.7% using the jet active control method under the reinforcement learning framework. The Gaussian progress regression surrogate model was used in the active learning framework, while the soft actor-critic deep reinforcement learning algorithm is adopted in the reinforcement learning framework.17 Chen et al. used deep reinforcement learning (DRL) method for active control of jet method, and the DRL method broke through the high-dimensional nonlinear problem of traditional Jet control methods. When the Jet controller was installed at the rear, middle, and front of the square cylinder, the VIV response amplitudes were reduced by 96%, 79%, and 86%, respectively.18
Compared to the active control methods mentioned above, the passive control method does not require additional energy input, is relatively simple and inexpensive, and is often used in practical engineering. Installing splitters is one of the common methods. The PIV experimental method was adopted to study the suppression effect of flexible splitters on VIV response, and two important parameters, including the length of the flexible splitter and the stiffness of the flexible splitter, were studied by Cui and Feng.19 When the length of the flexible splitter was equal to the diameter of the cylinder, the suppression effect was the best, and the transverse amplitude could be reduced by 93%.19 The flexible plate weakened the shear layers in the wake region, effectively weakening the strength of the wake vortex.19 Installing some small control rods to control the VIV response was numerically investigated by Song et al, and the amplitude could be reduced by 83% when the number of control rods were odd (5, 7, and 9).20 The small control rod significantly reduced the pressure gradient on both sides of the main circular cylinder, effectively controlling the VIV response.20 Ishihara and Li investigated installing helical wires to control the VIV response of a circular cylinder, and the results indicated that the lock-in region of VIV response completely disappeared, and the amplitude response could be reduced by 80%.21 The helical wires caused the damping of the structure to change from negative to positive in the lock-in region.21 The flow characteristics of a circular cylinder coated with porous media coating (PMC) were investigated in a wind tunnel through PIV experiments, and the results indicated that the root-mean-square value of the lift coefficient could be reduced by 98%, and the amplitude could be reduced by 4%.22 The deeper the depth of PMC, the greater the aerodynamic damping value, and the better the VIV control effect.22 Different surface roughness can also have an impact on vortex induced vibration response, and the lock-in region disappeared when the roughness exceeded the critical value.23 Gao et al. conducted an experimental study on the VIV response of a flexible riser installed the helical strakes.24 Under the condition of uniform flow, when the coverage rate of helical strakes was 75%, the suppression effect of VIV response was optimal, and the suppression efficiency is 96%.24 A flexible cylinder with a fixed fairing installed was numerically investigated by Zheng and Wang, and the results showed that the additional mass was added in the VIV system, and helping to reduce vibration frequency.25
Biomimetic design has recently received attention, with some structures inspired by natural phenomena being designed to guide the suppression of VIV. Li et al designed a bird-wing-shaped device to control the VIV response of a circular cylinder, and the PIV experiment was performed.26 The result showed that the device helped to delay vortex generation, and the VIV suppression effect was best when the characteristic length of the bird-wing-shaped device was 4 times the diameter of the main cylinder.26 Inspired by the honeycomb, Wang and Zhao investigated the VIV response of the honeycomb-shaped cylinder, and it was found that the critical angle of attack of the cylinder was 40 degrees.2 Inspired by the shape of Terebridae, this paper provides a detailed study on the VIV response of the cylinder inspired by Terebridae. The slender Terebridae are shown in Figure 1(a), and Figure 1(b) shows a high-rise building inspired by Terebridae, which has good wind resistance performance. The VIV responses of the Terebridae-inspired cylinder with different helical angles are numerically investigated. The numerical model is established in Section 2. The numerical model is validated in Section 3. The results and discussions are presented in Section 4. Some conclusions are shown in Section 5.

2. Numerical Model

The numerical model for the calculation of the VIV response is explained in this section. The governing equations of the flow around the Terebridae-inspired cylinder are introduced in Section 2.1, and the computational domain and oscillation equations are given in Section 2.2. The Newmark-β method is described in Section 2.3, and the grid independence verification is introduced in Section 2.4.

2.1. Governing Equations

In this paper, the flow around the Terebridae-inspired cylinder is unsteady, viscous, and incompressible. And Reynolds-Averaged-Navier-Stokes (RANS) equations need to be solved. In the author's previous researches27, 28 and other research29, various turbulence models have been compared. The large amount of time is required to solve the three-dimensional two-degree-of-freedom (2-DOF) VIV response, and the numerical calculation is conducted using the server of the Computing Center of Northwestern Polytechnical University. In order to reduce computational time and achieve high computational accuracy, the Shear Stress Transport (SST) k-ω turbulence model is adopted.2
The continuity equation and momentum equation are described:2
u ¯ i x i = 0
ρ u ¯ i t + ρ u ¯ i u ¯ j x j = p ¯ x i + x j ( τ ¯ i j ρ u i ' u j ' ¯ )
In which, i and j are the coordinate directions (i, j∈[1,2,3]), and u i , u i ' and u i ' ¯ represent instantaneous velocity components, fluctuate velocity components, and time-averaged velocity components, respectively. p ¯ is the time-averaged pressure, and ρ is the fluid density. xi and xj are the position vector of fluid unit.
The viscous stress tensor ( τ ¯ i j ) in Equation 2 is expressed as:2
τ ¯ i j = µ u ¯ i x j + u ¯ j x i
The Reynolds stress ( ρ u i ' u j ' ¯ ) in Equation 2 is expressed as: 2
ρ u i ' u j ' ¯ = μ t u i x j + u j x i 2 3 ρ k t δ i j
In which, δij is Kronecker delta function, μ is the dynamic viscosity, and kt is the turbulent kinetic energy. The turbulent viscosity (µt) is expressed as follows:
μ t = ρ k t ω
Where ω is the specific dissipation rate.

2.2. Computational Domain and Oscillation Equations

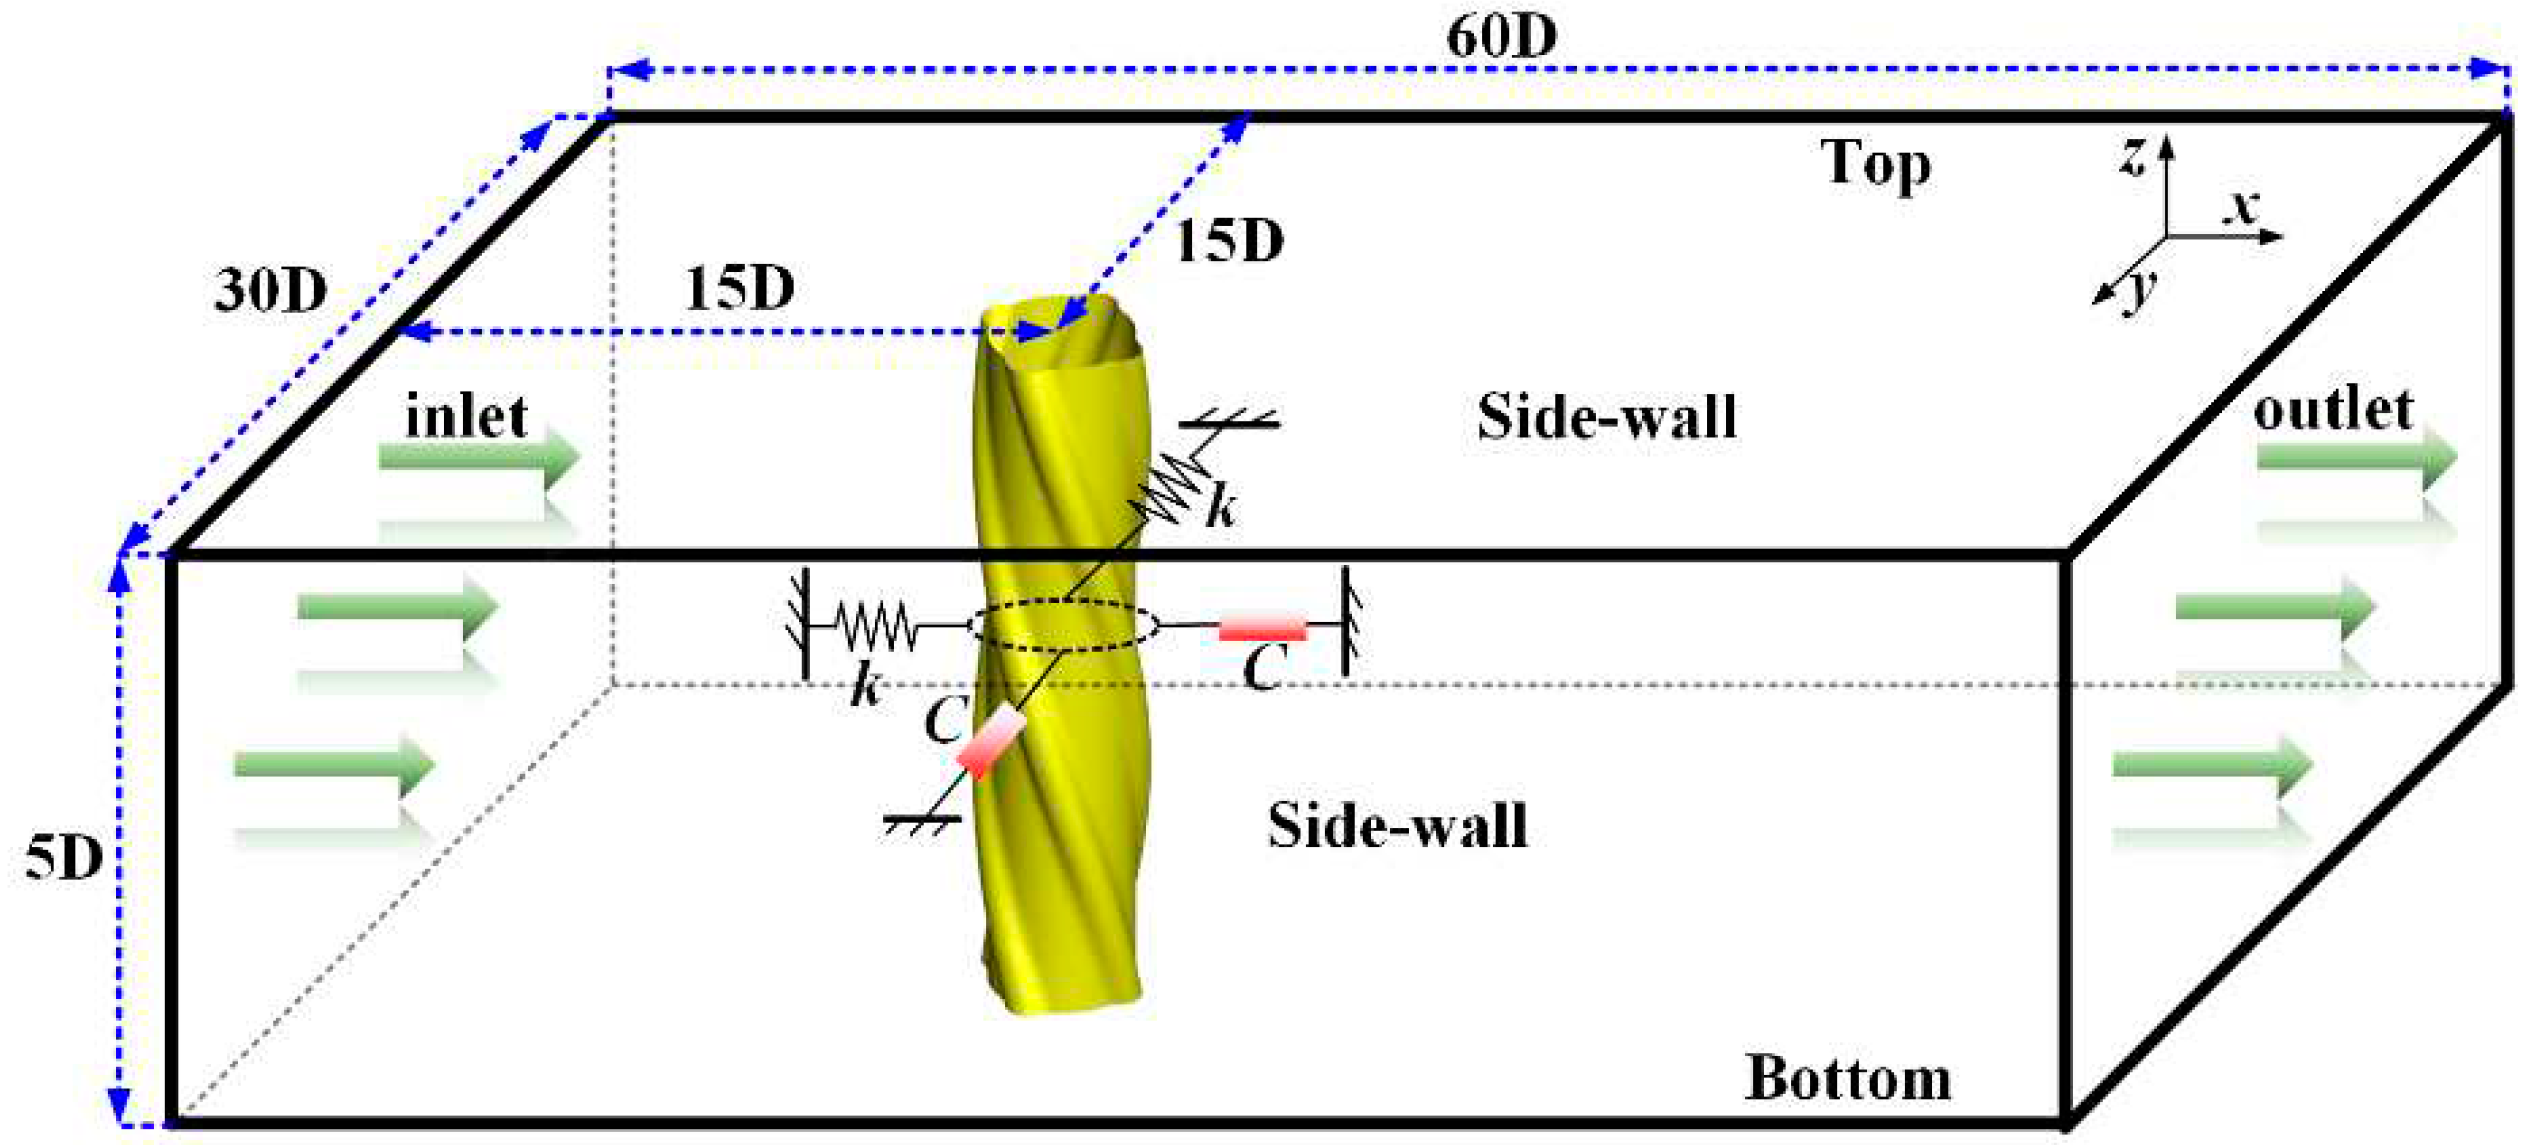
The setting of the computational domain is as shown in Figure 2. The diameter of the Terebridae-inspired cylinder is D, and the distance between the Terebridae-inspired cylinder and the inlet (the uniform velocity boundary [ux=U, uy=0, uz=0; U is the flow velocity]) of the flow field is 15D. The distance between the Terebridae-inspired cylinder and the side-wall (the free-slip boundary) is 15D. The upper and lower boundaries of the computational domain are the periodic boundaries.2 The Arbitrary Lagrangian-Eulerian (ALE) method is adopted to solve the moving boundary.27,28 The boundary of the Terebridae-inspired cylinder is a no-slip wall. The length of the computational domain along the flow direction is 60D. The spanwise length of the Terebridae-inspired cylinder is 5D, meeting the requirements for the development of spanwise vortices.
The 2-DOF VIV system is shown in Figure 2, and the motion equations of the Terebridae-inspired cylinder are defined as follows: 24,25
m x ¨ + C x ˙ + k x = F x
m y ¨ + C y ˙ + k y = F y
Where m is the VIV system mass. x and y are the displacement, x ˙ and y ˙ are the velocity, and x ¨ and y ¨ are the acceleration. C is the system damping. Fx and Fy are the fluid forces acting on the Terebridae-inspired cylinder, calculated using the computational fluid dynamics (CFD) method in ANSYS Fluent 17.2. And k is the spring stiffness.
The 2-DOF VIV system parameters are shown in Table 1. The parameters in Equations (6) and (7) can be calculated as follows: 24,25
m = m * V ρ
k = ( 2 π f n ) 2 ( m + m a d d )
m a d d = C a V ρ
C = 2 k ( m + m a d d ) ξ
In which, ρ is the fluid density (ρ = 1000kg/m3), V is the cylinder volume, and ξ is the damping ratio. madd is the added mass, and Ca is the added mass-ratio. m* is the mass ratio, defined as the ratio of the structure density to the fluid density. fn is the natural frequency of the cylinder.
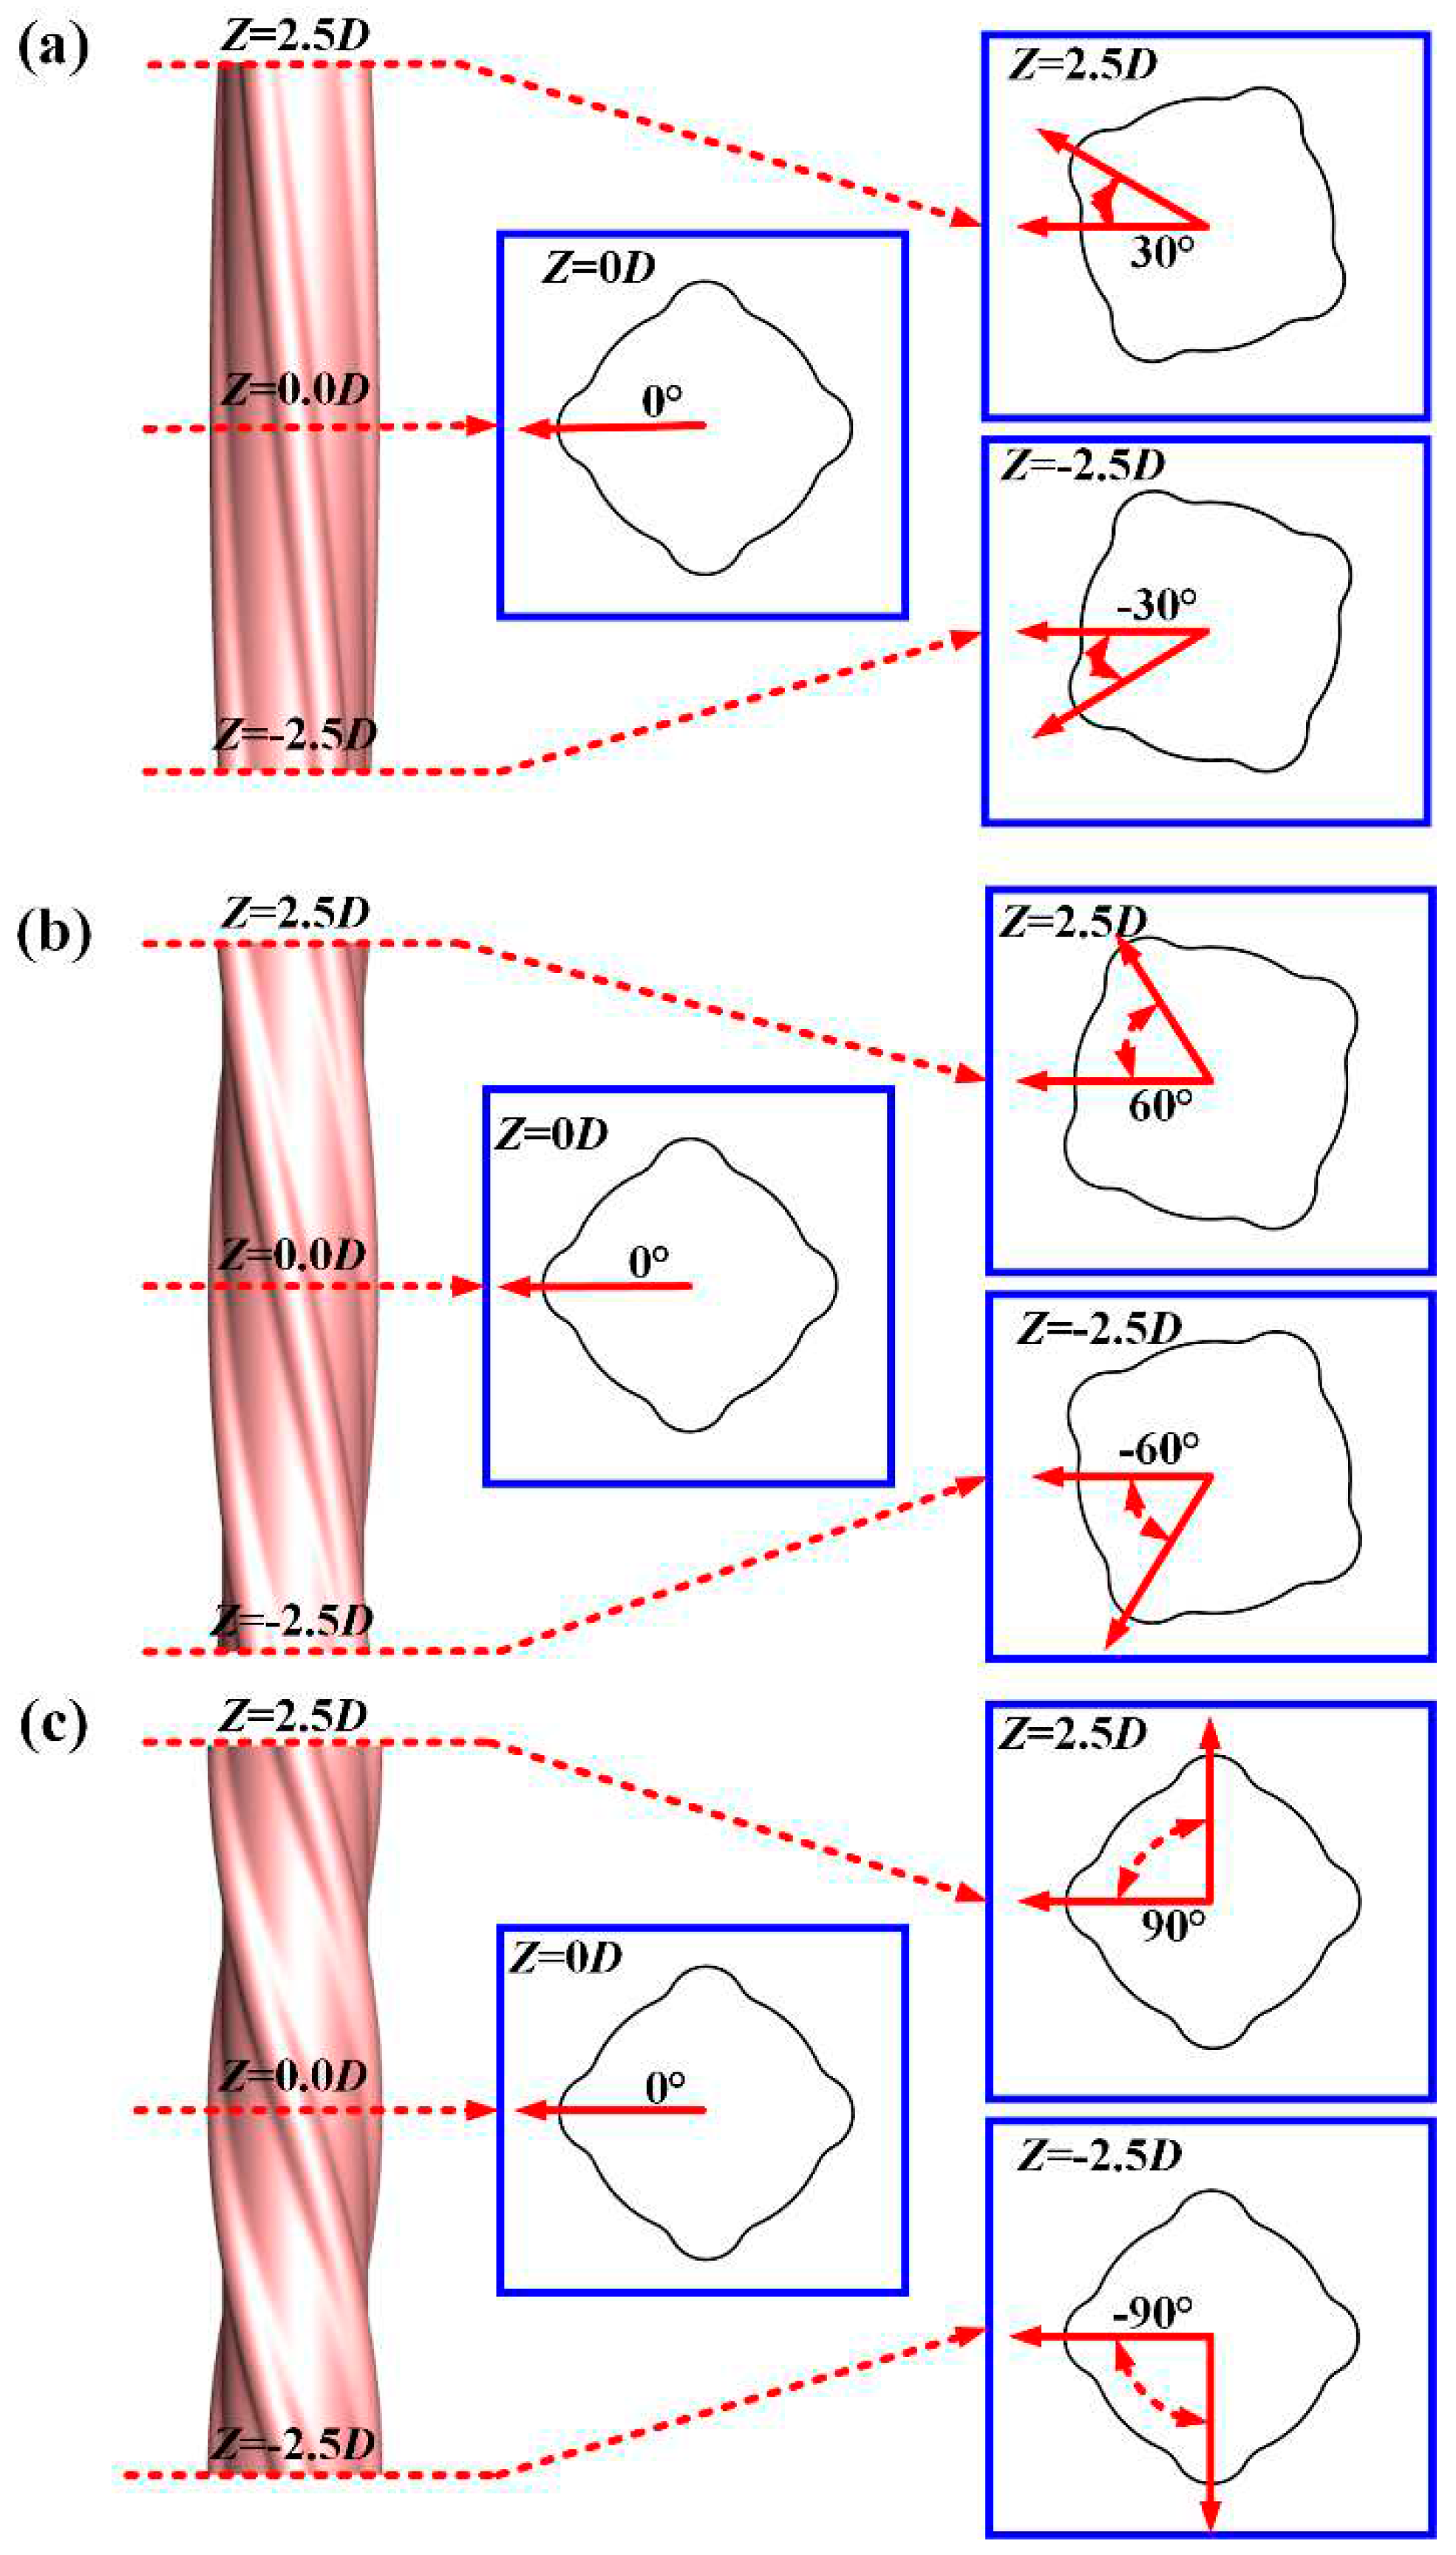
The section shape of the Terebridae-inspired cylinders with four-start helical ribs are shown in Figure 3. The traditional smooth cylinder is reference objects (P0). The helical angle of the cylinder is 30° (P30), 60° (P60), and 90° (P90), respectively. The section shape of the helical ribs is arc-shaped as shown in Figure 3, and the cylindrical angle corresponding to the helical ribs is 36°, with a maximum height of 0.1D.

2.3. Newmark-β Method

The oscillation Equations (6) and (7) of the 2-DOF VIV system in Section 2.2 are numerically solved using the Newmark-β method. In this method, two important parameters (α and β) need to be introduced to express the displacement increment equation and the velocity increment equation, expressed as follows:2,27
Q t + Δ t Q t = Q ˙ t Δ t + [ ( 1 / 2 β ) Q ¨ t + β Q ¨ t + Δ t ] Δ t 2
Q ˙ t + Δ t Q ˙ t = [ ( 1 α ) Q ¨ t + α Q ¨ t + Δ t ] Δ t
The velocity ( Q ˙ t + Δ t ) and acceleration ( Q ¨ t + Δ t ) at time t+∆t can be expressed based on the above two equations. ∆t is the time step. α and β are usually set to 0.5 and 0.25. 2,27
Q ˙ t + Δ t = α β Δ t ( Q t + Δ t Q t ) + ( 1 α β ) Q ˙ t ( α 2 β 1 ) Δ t Q ¨ t
Q ¨ t + Δ t = 1 β Δ t 2 ( Q t + Δ t Q t ) 1 β Δ t Q ˙ t ( 1 2 β 1 ) Q ¨ t
Equations (6) and (7) can be unified into the following form at time t+∆t:
m Q ¨ t + Δ t + C Q ˙ t + Δ t + k Q t + Δ t = F ( t + Δ t )
Finally, based on Equations (14) and (15), the simplest form of Equation (16) is:
[ k ] Q t + Δ t = [ F ]
In which, [k] and [F] are:
[ k ] = k + 1 β Δ t 2 m + α β Δ t C
[ F ] = F ( t + Δ t ) + [ 1 β Δ t 2 Q t + 1 β Δ t Q ˙ t + ( 1 2 β 1 ) Q ¨ t ] m +
[ α β Δ t Q t + ( α β 1 ) Q ˙ t + ( α 2 β 1 ) Δ t Q ¨ t ] C
Finally, the displacement ( Q t + Δ t ) can be numerically calculated at time t+∆t by Equation (17). The velocity ( Q ˙ t + Δ t ) and acceleration ( Q ¨ t + Δ t ) are numerically calculated at time t+∆t by Equation (14) and (15), respectively. The fluid force ( F ( t + Δ t ) ) is numerically calculated using the CFD method in Section 2.1. The numerical solution process of the above structural motion equation adopts C++language.

2.4. Grid Independence Verification

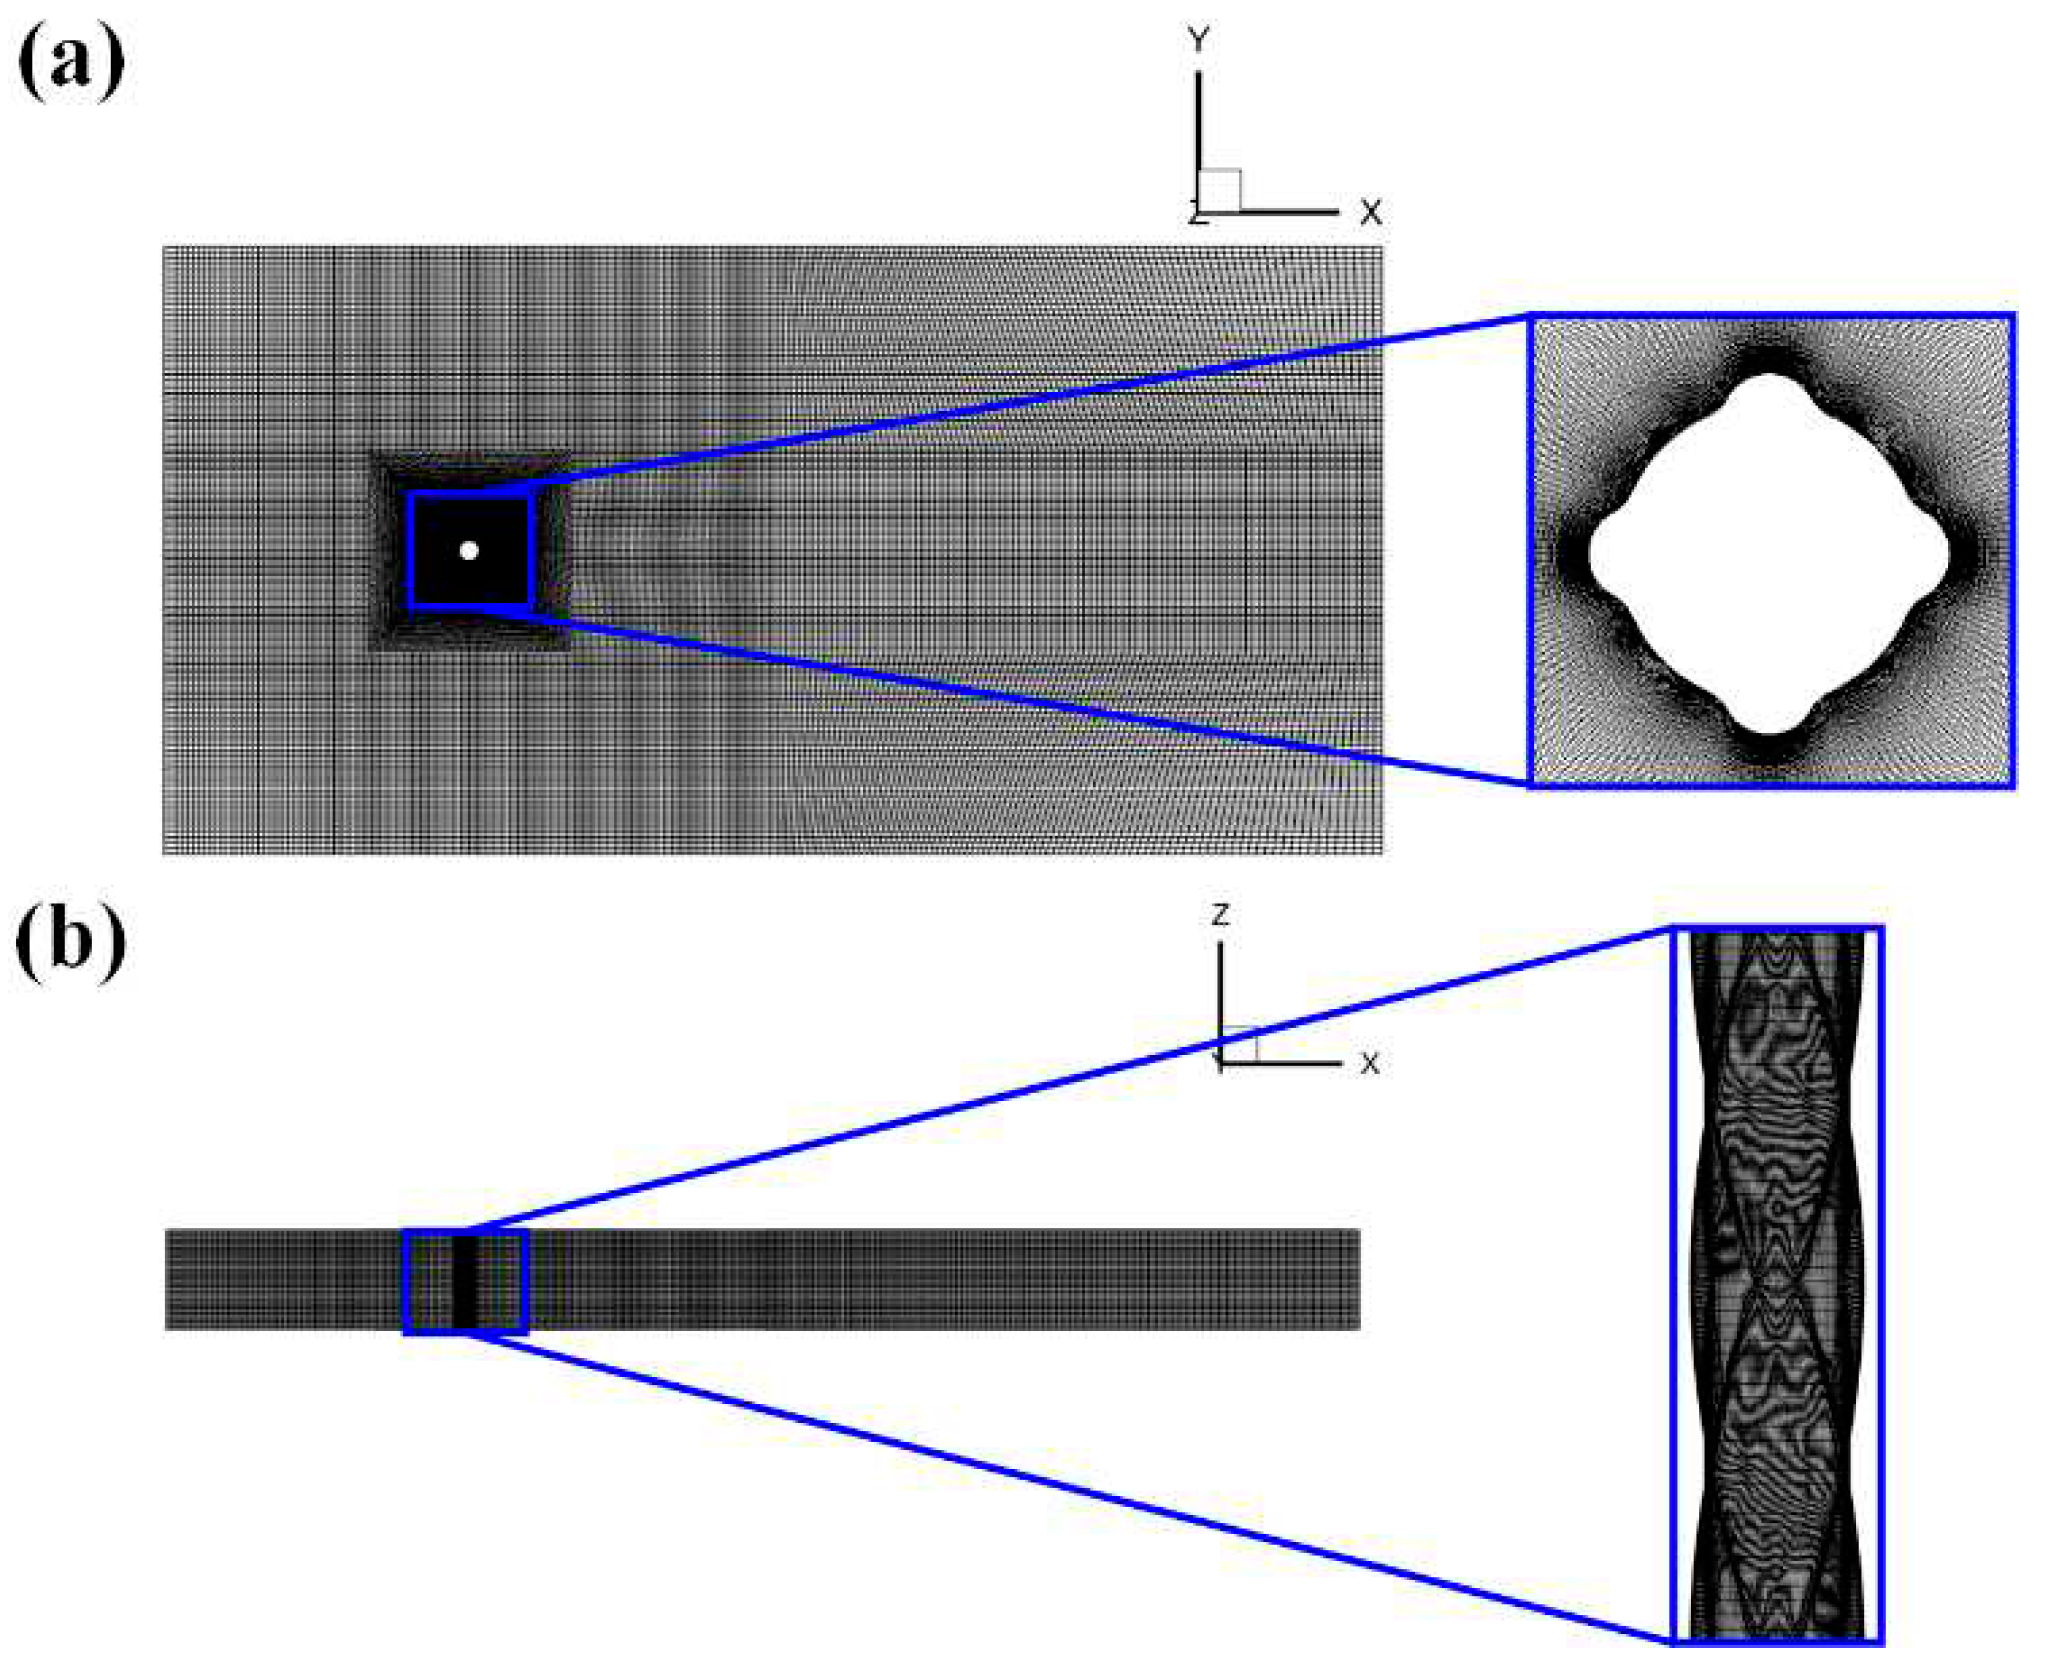
The number of grids not only affects calculation time, but also affects calculation accuracy. Therefore, it is necessary to conduct grid independence verification and select the minimum number of grids while ensuring high computational accuracy. The height of the first grid layer in the boundary layer is determined by the y+ value, and the growth rate of the grid is set as 1.1. The number of grid nodes in the circumferential direction (x-y plane) of the cylinder is 400, and the total number of grids is determined by the number of grid nodes in the z-direction. The comparison results of different grid numbers are shown in Table 2. It is usually considered that the effect of the grid can be ignored for the difference is smaller than 1%. The percentage represents the difference between the numerical results of the current grid and the numerical results of the previous grid. When the difference in percentage is less than 1%, it is considered that the effect of the current grid on the numerical results can be ignored. Therefore, the Mesh-4 is adopted.

3. Numerical Model Validation

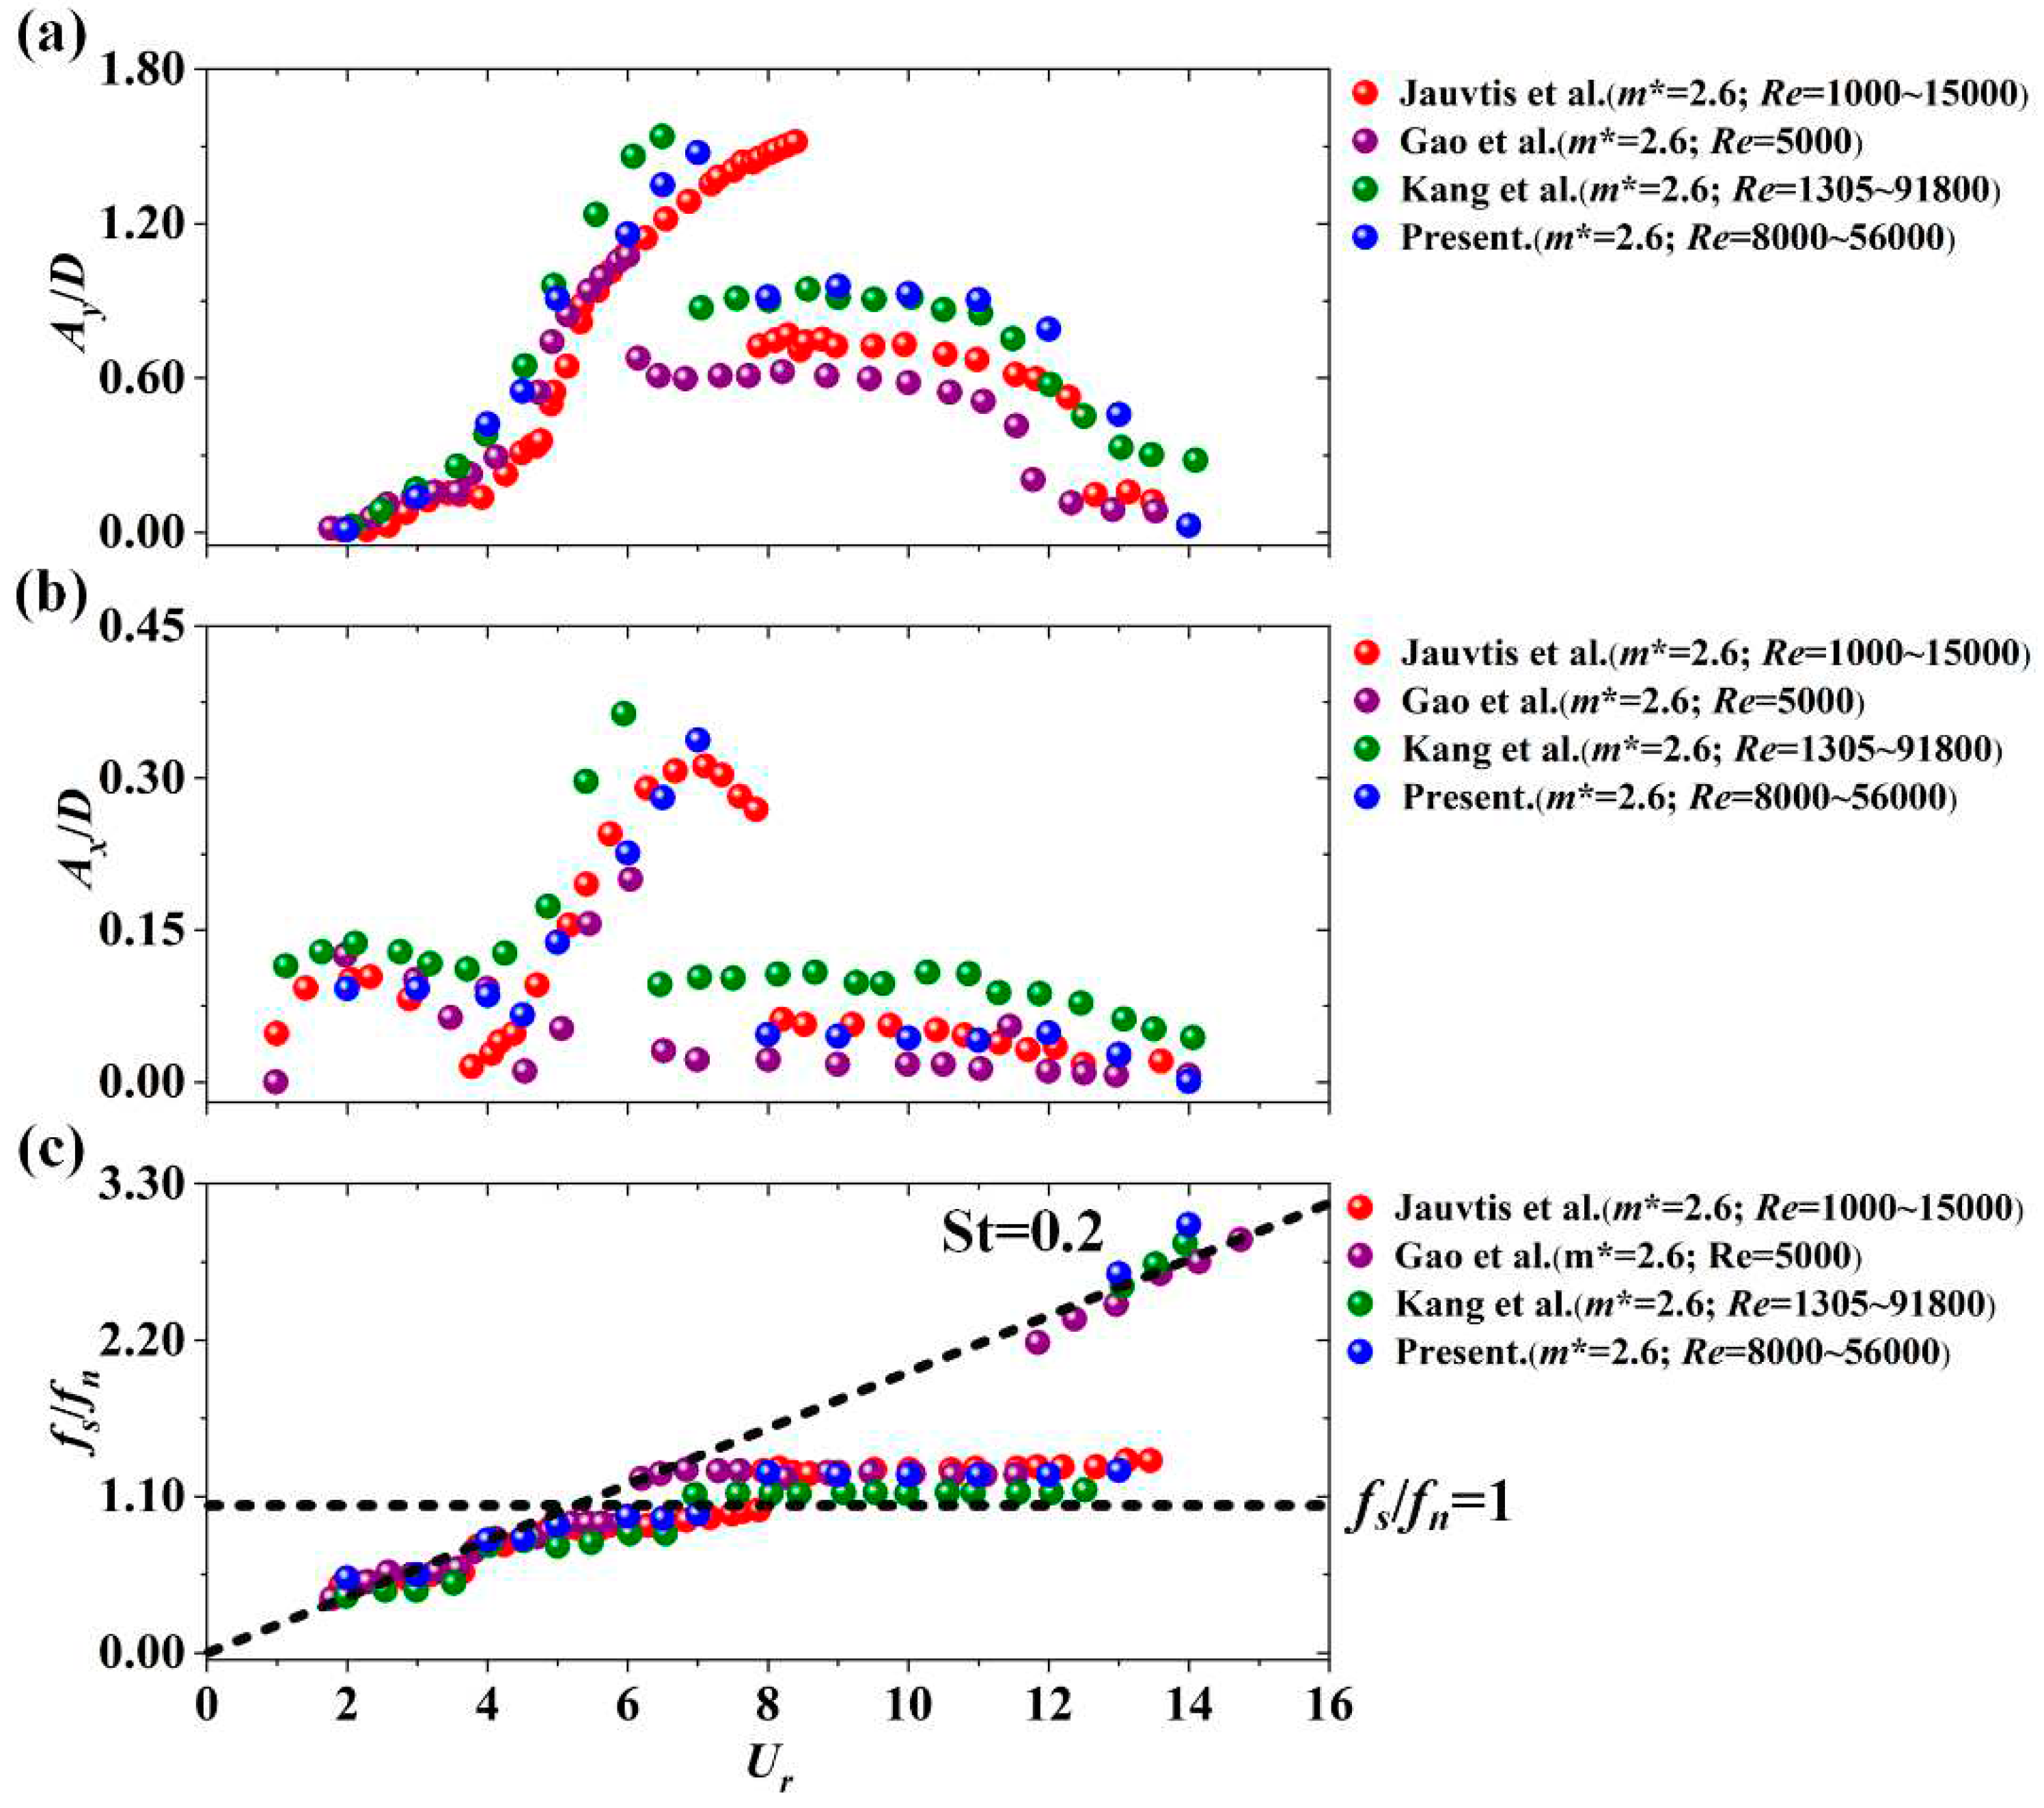
In the Section 2, the numerical model is fully established. However, the accuracy of the numerical model needs to be further verified. The VIV response results obtained from the numerical model in this paper need to be compared with the VIV response results obtained from the experiment and other numerical models. The main quantities of VIV response described, including the transverse-amplitude ratio (Ay/D), and the downstream-amplitude ratio (Ax/D), and vortex-shedding frequency ratio (fs/fn), need to be compared. The vortex-shedding frequency (fs) is obtained through the fast Fourier transform (FFT) of lift force, and the vibration frequency (fy) is obtained though the FFT of the transverse amplitude. The calculated Reynolds number conditions are set to 0.8×10⁴Re ≤ 5.6×10⁴ (2.0 ≤ Ur ≤ 14.0; Ur=U/(fn*D)).
The parameters of experimental model, other numerical models, and the numerical model in this paper are shown in Table 3. The mass ratios of the cylinders for the different models are completely consistent, and the mass ratio has a significant impact on the VIV response. Based on the Jauvtis et al.’s experimental results, four sub-branches were used to describe the entire VIV response, including the initial branch, the upper branch, the lower branch, and the desynchronization branch.34 The same divided method is used in the following paper. In the initial branch, the transverse amplitude ratio (Ay/D) gradually increases as the Reynolds number increases, but the value is small. The downstream amplitude ratio (Ax/D) increases first and then decreases. The vortex-shedding frequency ratio (fs/fn) gradually increases, but it does not reach the natural frequency (fn). In the upper branch, the transverse amplitude ratio (Ay/D) and the downstream amplitude ratio (Ax/D) rapidly increase until reaching their peaks. The vortex-shedding frequency ratio (fs/fn) gradually increases until it reaches the natural frequency (fn). In the lower branch, the transverse amplitude ratio (Ay/D), the downstream amplitude ratio (Ax/D), and the vortex-shedding frequency ratio (fs/fn) are relatively stable. In the desynchronization branch, the vortex-shedding frequency ratio (fs/fn) gradually moves away from the natural frequency (fn), and the amplitude gradually decreases.
In Kang et al’s numerical model, the diameter of smooth cylinder was larger than that in Jauvtis et al’s experiment. Therefore, for the same flow velocity, the Reynolds number would be higher. In Gao et al’s, the Reynolds number was set to 5000, and the flow velocity was fixed. The reduced velocity (Ur) was changed by changing the natural frequency (fn). At the same time, the damping ratio was set to 0, in order to observe higher amplitude. Figure 5 shows the VIV response results of different models. It can be seen from Figure 5 that the four sub-branches of the VIV response can be well displayed. Therefore, the numerical model is available in this paper.

4. Results and Discussions

4.1. VIV responses

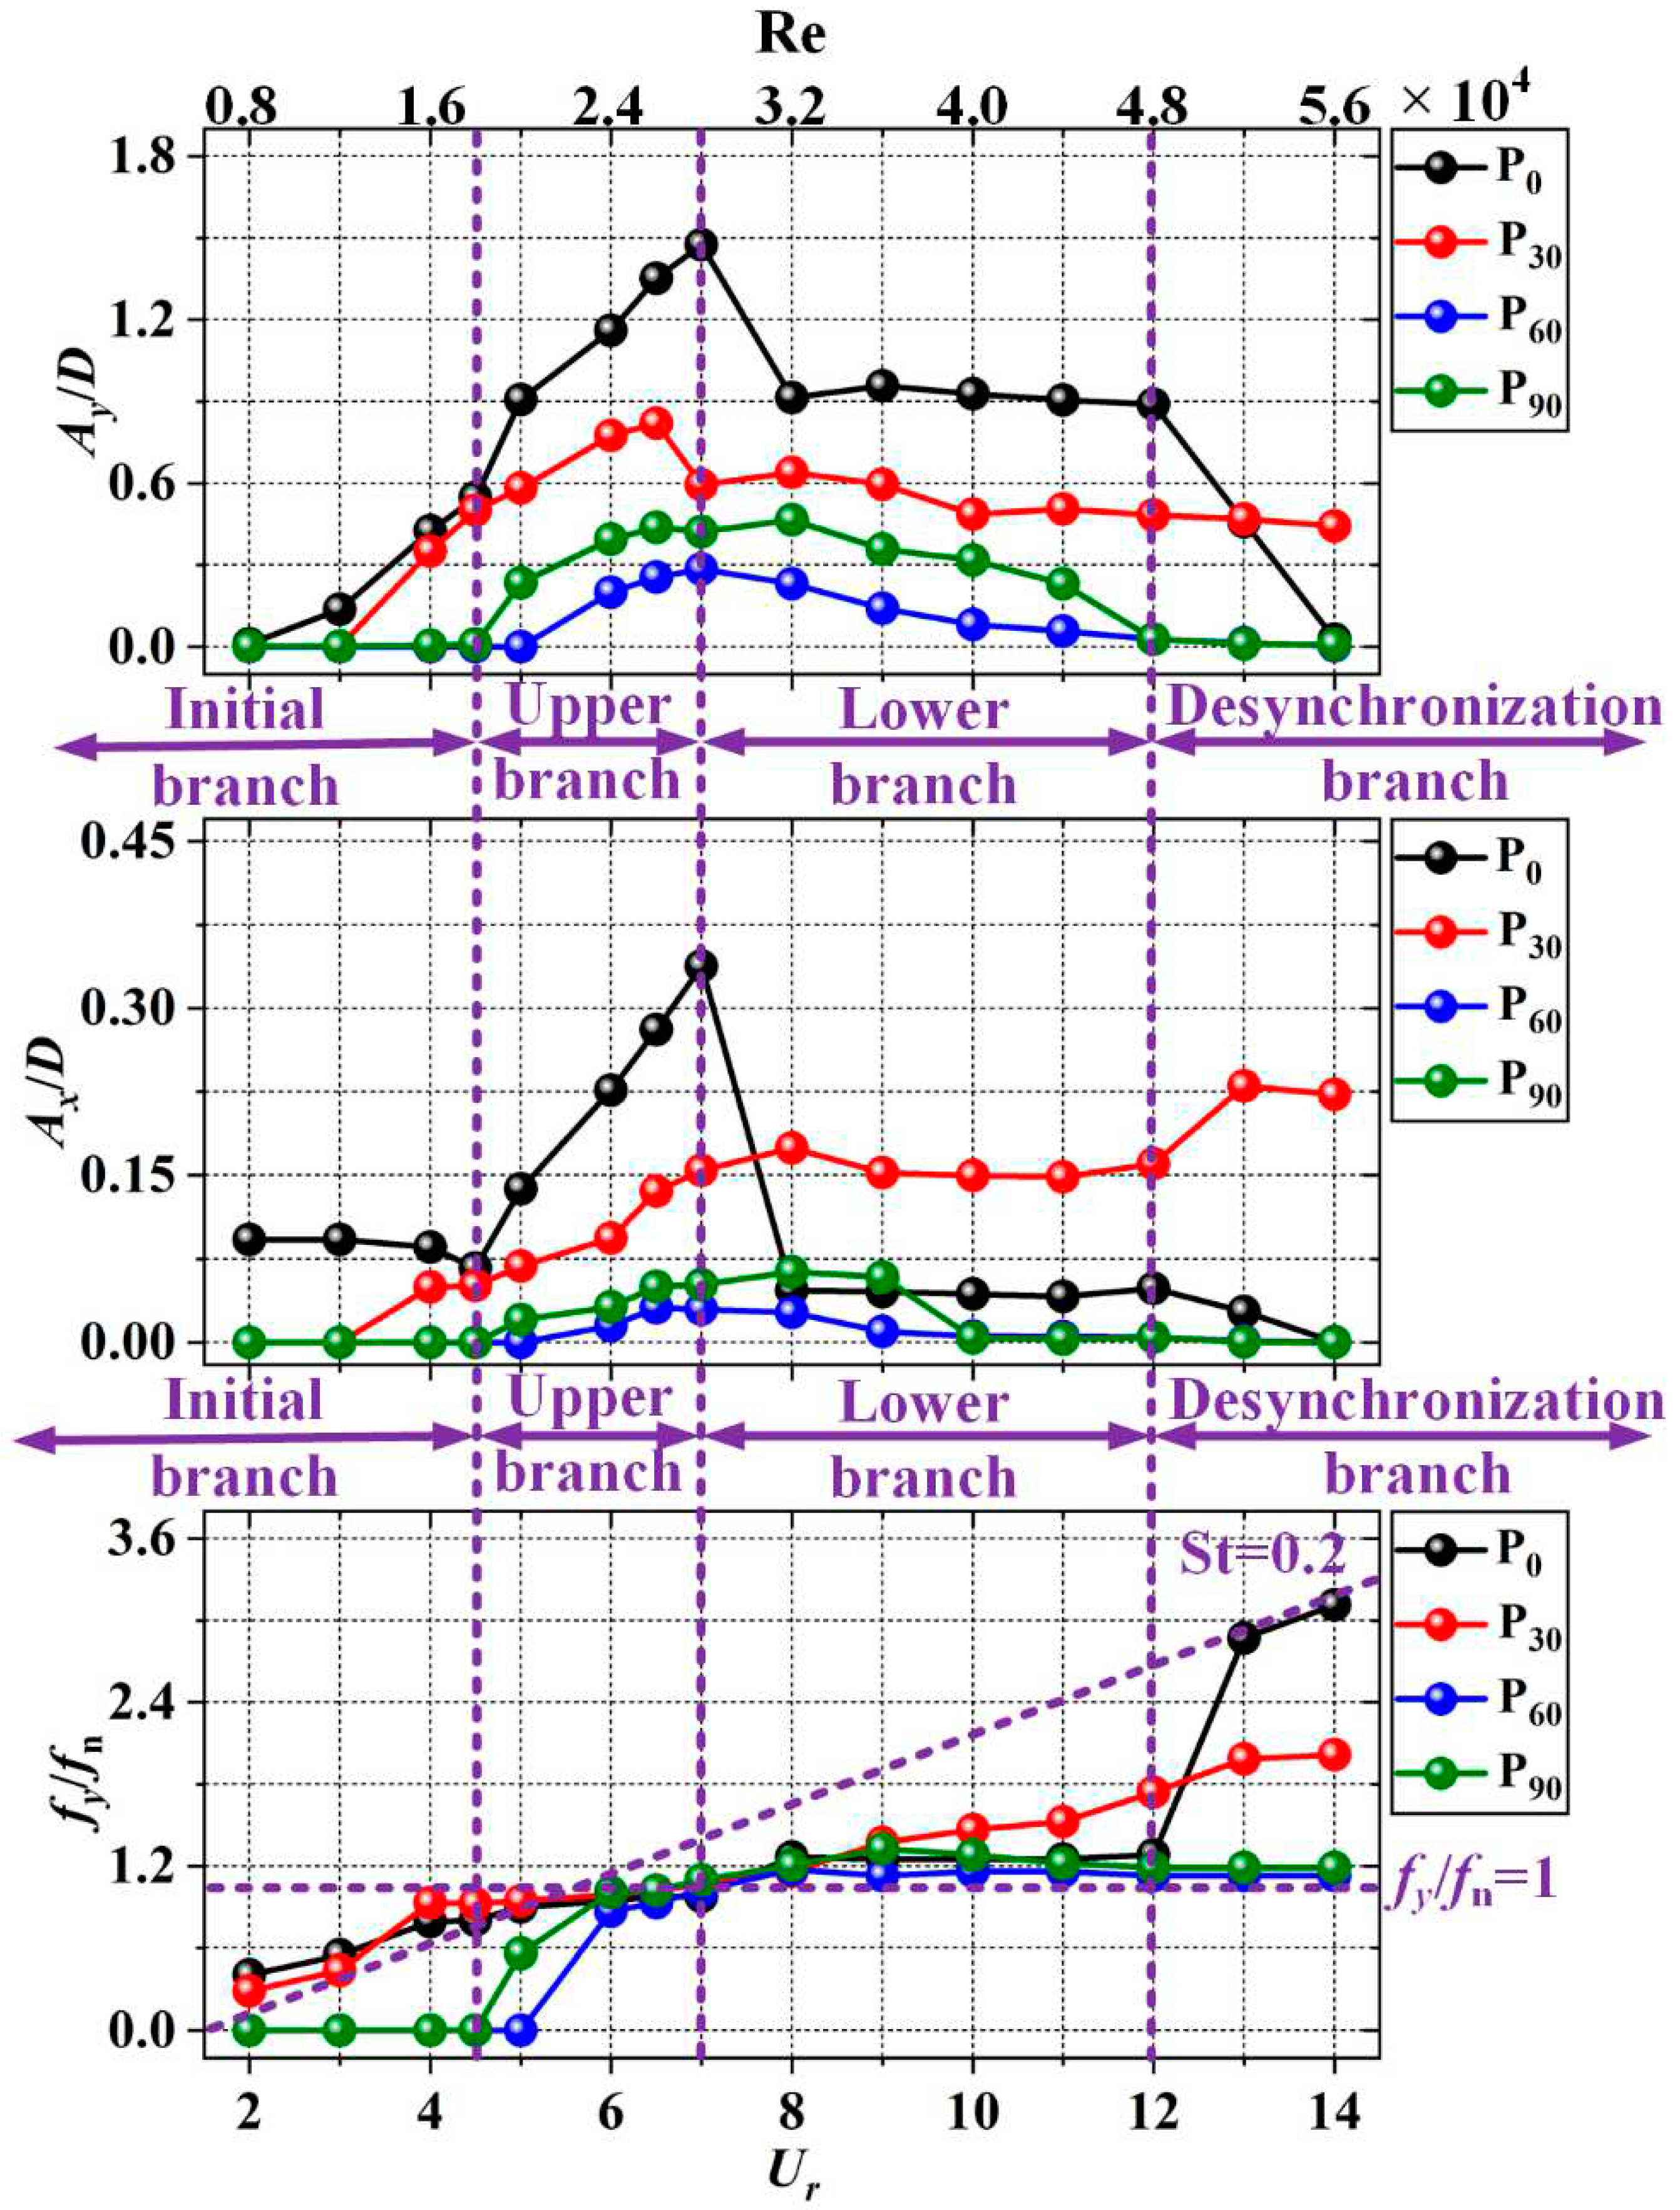
Figure 6 shows the transverse-amplitude ratio (Ay/D), the downstream-amplitude ratio (Ax/D), and the vibration-frequency ratio (fy/fn) of P0, P30, P60, and P90. In Section 3, the VIV response region as divided into four branches, including the initial branch, the upper branch, the lower branch, and the desynchronization branch. In the following paper, the differences on VIV response between different cylinders based on these four branches will be discussed in detail.
In the initial branch, the transverse amplitude ratios (Ay/D) of P0 and P30 slowly increase, while the transverse- amplitude ratios (Ay/D) of P60 and P90 are completely suppressed. The downstream amplitude ratios (Ax/D) of P60 and P90 are also completely suppressed. This phenomenon indicates that when the helical angle of the Terebridae-inspired cylinder exceeds a certain value, the VIV response can be completely suppressed in the low reduced velocity range. The downstream amplitude ratio (Ax/D) of P30 gradually increases, and the downstream amplitude ratio (Ax/D) of P0 remains stable. The vibration frequency ratios (fy/fn) of P0 and P30 slowly increase, but they do not reach the natural frequency of the cylinder. Due to the complete suppression of the VIV response for P60 and P90, the main frequency of vibration cannot be calculated, so their vibration frequency is set to 0 in the Figure 6.
In the upper branch, the transverse amplitude ratios (Ay/D) of P0, P30, P60, and P90 rapidly increase until reaching their peaks. The peak of the transverse-amplitude ratio (Ay/D) for P0 is 1.50 at Ur=7.0, and the peak of the downstream-amplitude ratio (Ax/D) is 0.35. The peak of transverse-amplitude ratio (Ay/D) of P30, P60, and P90 are 0.82, 0.26, and 0.44 at Ur=6.5, respectively. Compared with the peak of the transverse-amplitude ratio (Ay/D) of P0, they are decreased by 45.33%, 82.67%, and 70.67% for P30, P60, and P90, respectively. When Ur=7.5, the maximum downstream-amplitude ratios (Ax/D) of P60 is 0.03. And it is 0.06 for P90 when Ur=8.0. However, the downstream-amplitude ratio (Ax/D) for P30 increases steadily as the reduced velocity increases. Compared with the maximum downstream amplitude ratios (Ax/D) of P0, they are reduced by 91.43%, and 82.86% for P60 and P90, respectively. For P60 and P90, the VIV responses are effectively suppressed. This phenomenon indicates that when the helical angle exceeds a certain angle, the Terebridae-inspired ribs can effectively suppress VIV response. The vibration frequencies (fy/fn) of P0 and P30 are close to the natural frequencies of the cylinder. And the vibration frequencies (fy/fn) of P60 and P90 increase rapidly until they reach their natural frequencies.
In the lower branch, the transverse amplitude ratios (Ay/D) of P0 rapidly drops from its peak to a relatively stable value, which is about 0.90. The transverse amplitude ratios (Ay/D) of P30, P60, and P90 slowly decrease. The downstream amplitude ratios (Ay/D) of P0 rapidly drops from its peak to a relatively stable value, which is about 0.04. The downstream amplitude ratios (Ay/D) of P30 remains at a relatively stable value, which is about 0.15. And the downstream amplitude ratios (Ay/D) of P60 and P90 slowly decreases until they reach 0. The vibration frequencies (fy/fn) of P0, P60, and P90 are always locked near the natural frequencies. However, the vibration frequency (fy/fn) of P30 has been slowly increasing.
In the desynchronization branch, due to the VIV response being far from the lock-in region, the vibration-frequency ratio (fy/fn) of P0 rapidly increases. Therefore, the transverse-amplitude ratios (Ay/D) and downstream-amplitude ratios (Ax/D) begin to rapidly decrease until they approach 0. However, the transverse-amplitude ratios (Ay/D) and downstream amplitude ratios (Ax/D) of P30 do not decrease rapidly, but remained at a relatively high value. The transverse amplitude ratios (Ay/D) and downstream amplitude ratios (Ax/D) of P60 and P90 are both close to 0. The vibration frequencies (fy/fn) of P60 and P90 do not significantly increase. In the high reduced velocity range, the VIV response is completely suppressed for P60 and P90.
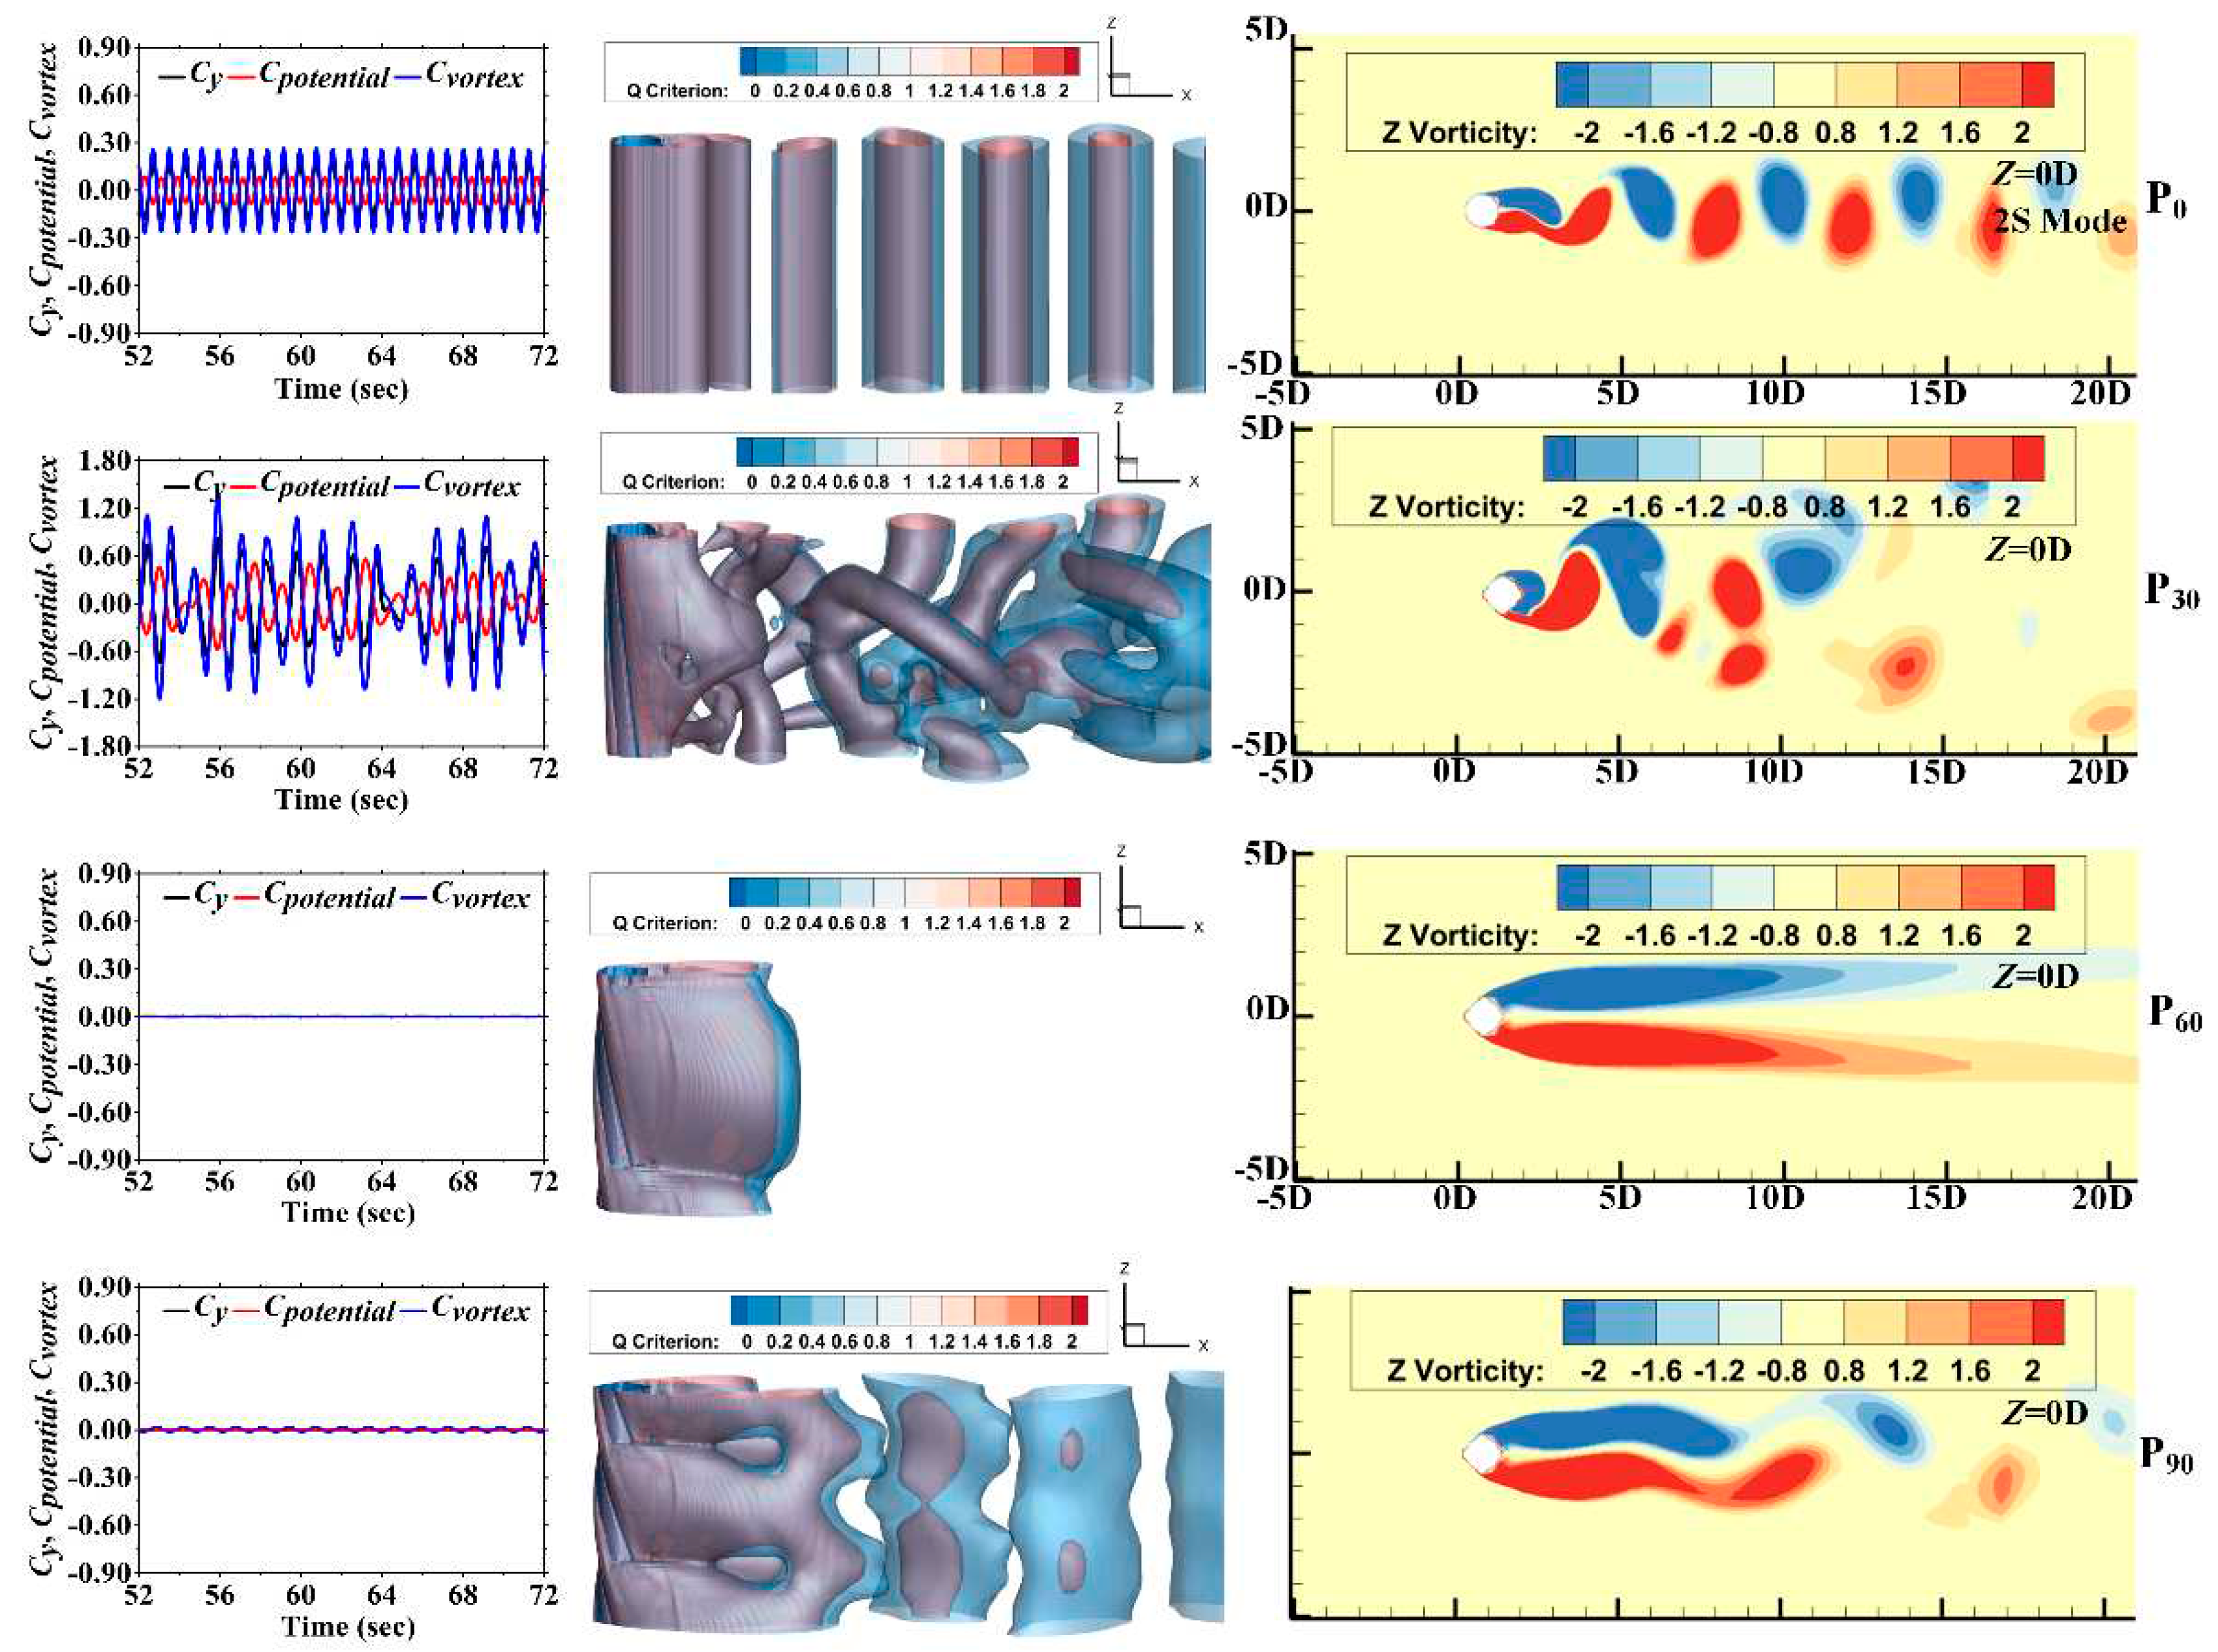
According to the four branches mentioned above, four different reduced velocities are selected for detailed analysis, including Ur=2.0 (Initial branch), 6.0 (Upper branch), 10.0 (Lower branch), and 14.0 (Desynchronization branch). The cross-section of Z=0.0D is selected for the vortex pattern analysis. Q-criterion is selected to calculate the three-dimensional vortex. And Z vorticity is calculated by ∂u/∂y-∂v/∂x. The evolution of vortex has a very important impact on the VIV response, so vortex force (Fvortex (t)) is introduced to further quantify the impact of vortices. The vortex force (Fvortex (t)) can be calculated:
F v o r t e x t = F y t F p o t e n t i a l ( t )
Where (Fy (t)) is the lift force, directly calculated by CFD method in Section 2.1. (Fpotential (t)) is the potential lift force, calculated as follows:27
F p o t e n t i a l t = m a d d d 2 A y t d t 2
When the displacement Ay(t) satisfies the assumption of the sinusoidal function (Ay(t) ≈ AY·sin(2πt·fy), AY is the maximum transverse amplitude), Equation 21 is rewritten:
F p o t e n t i a l t = m a d d d 2 A y t d t 2 = C a · ρ · V · 2 π · f y 2 · A Y · s i n 2 π t · f y
After dimensionless processing through 1/2·ρ·V·U2·D, the potential-force coefficient is further calculated:
C p o t e n t i a l t = F p o t e n t i a l t 1 2 · ρ · V · U 2 · D = C a · ρ · V · 2 π · f y 2 · A y t 1 2 · ρ · U 2 · D = 2 π 3 [ A y ( t ) D ] [ U f y D ] 2 · C a
Finally, the dimensionless form of Equation 20 is also calculated:
C v o r t e x t = C y t C p o t e n t i a l ( t )
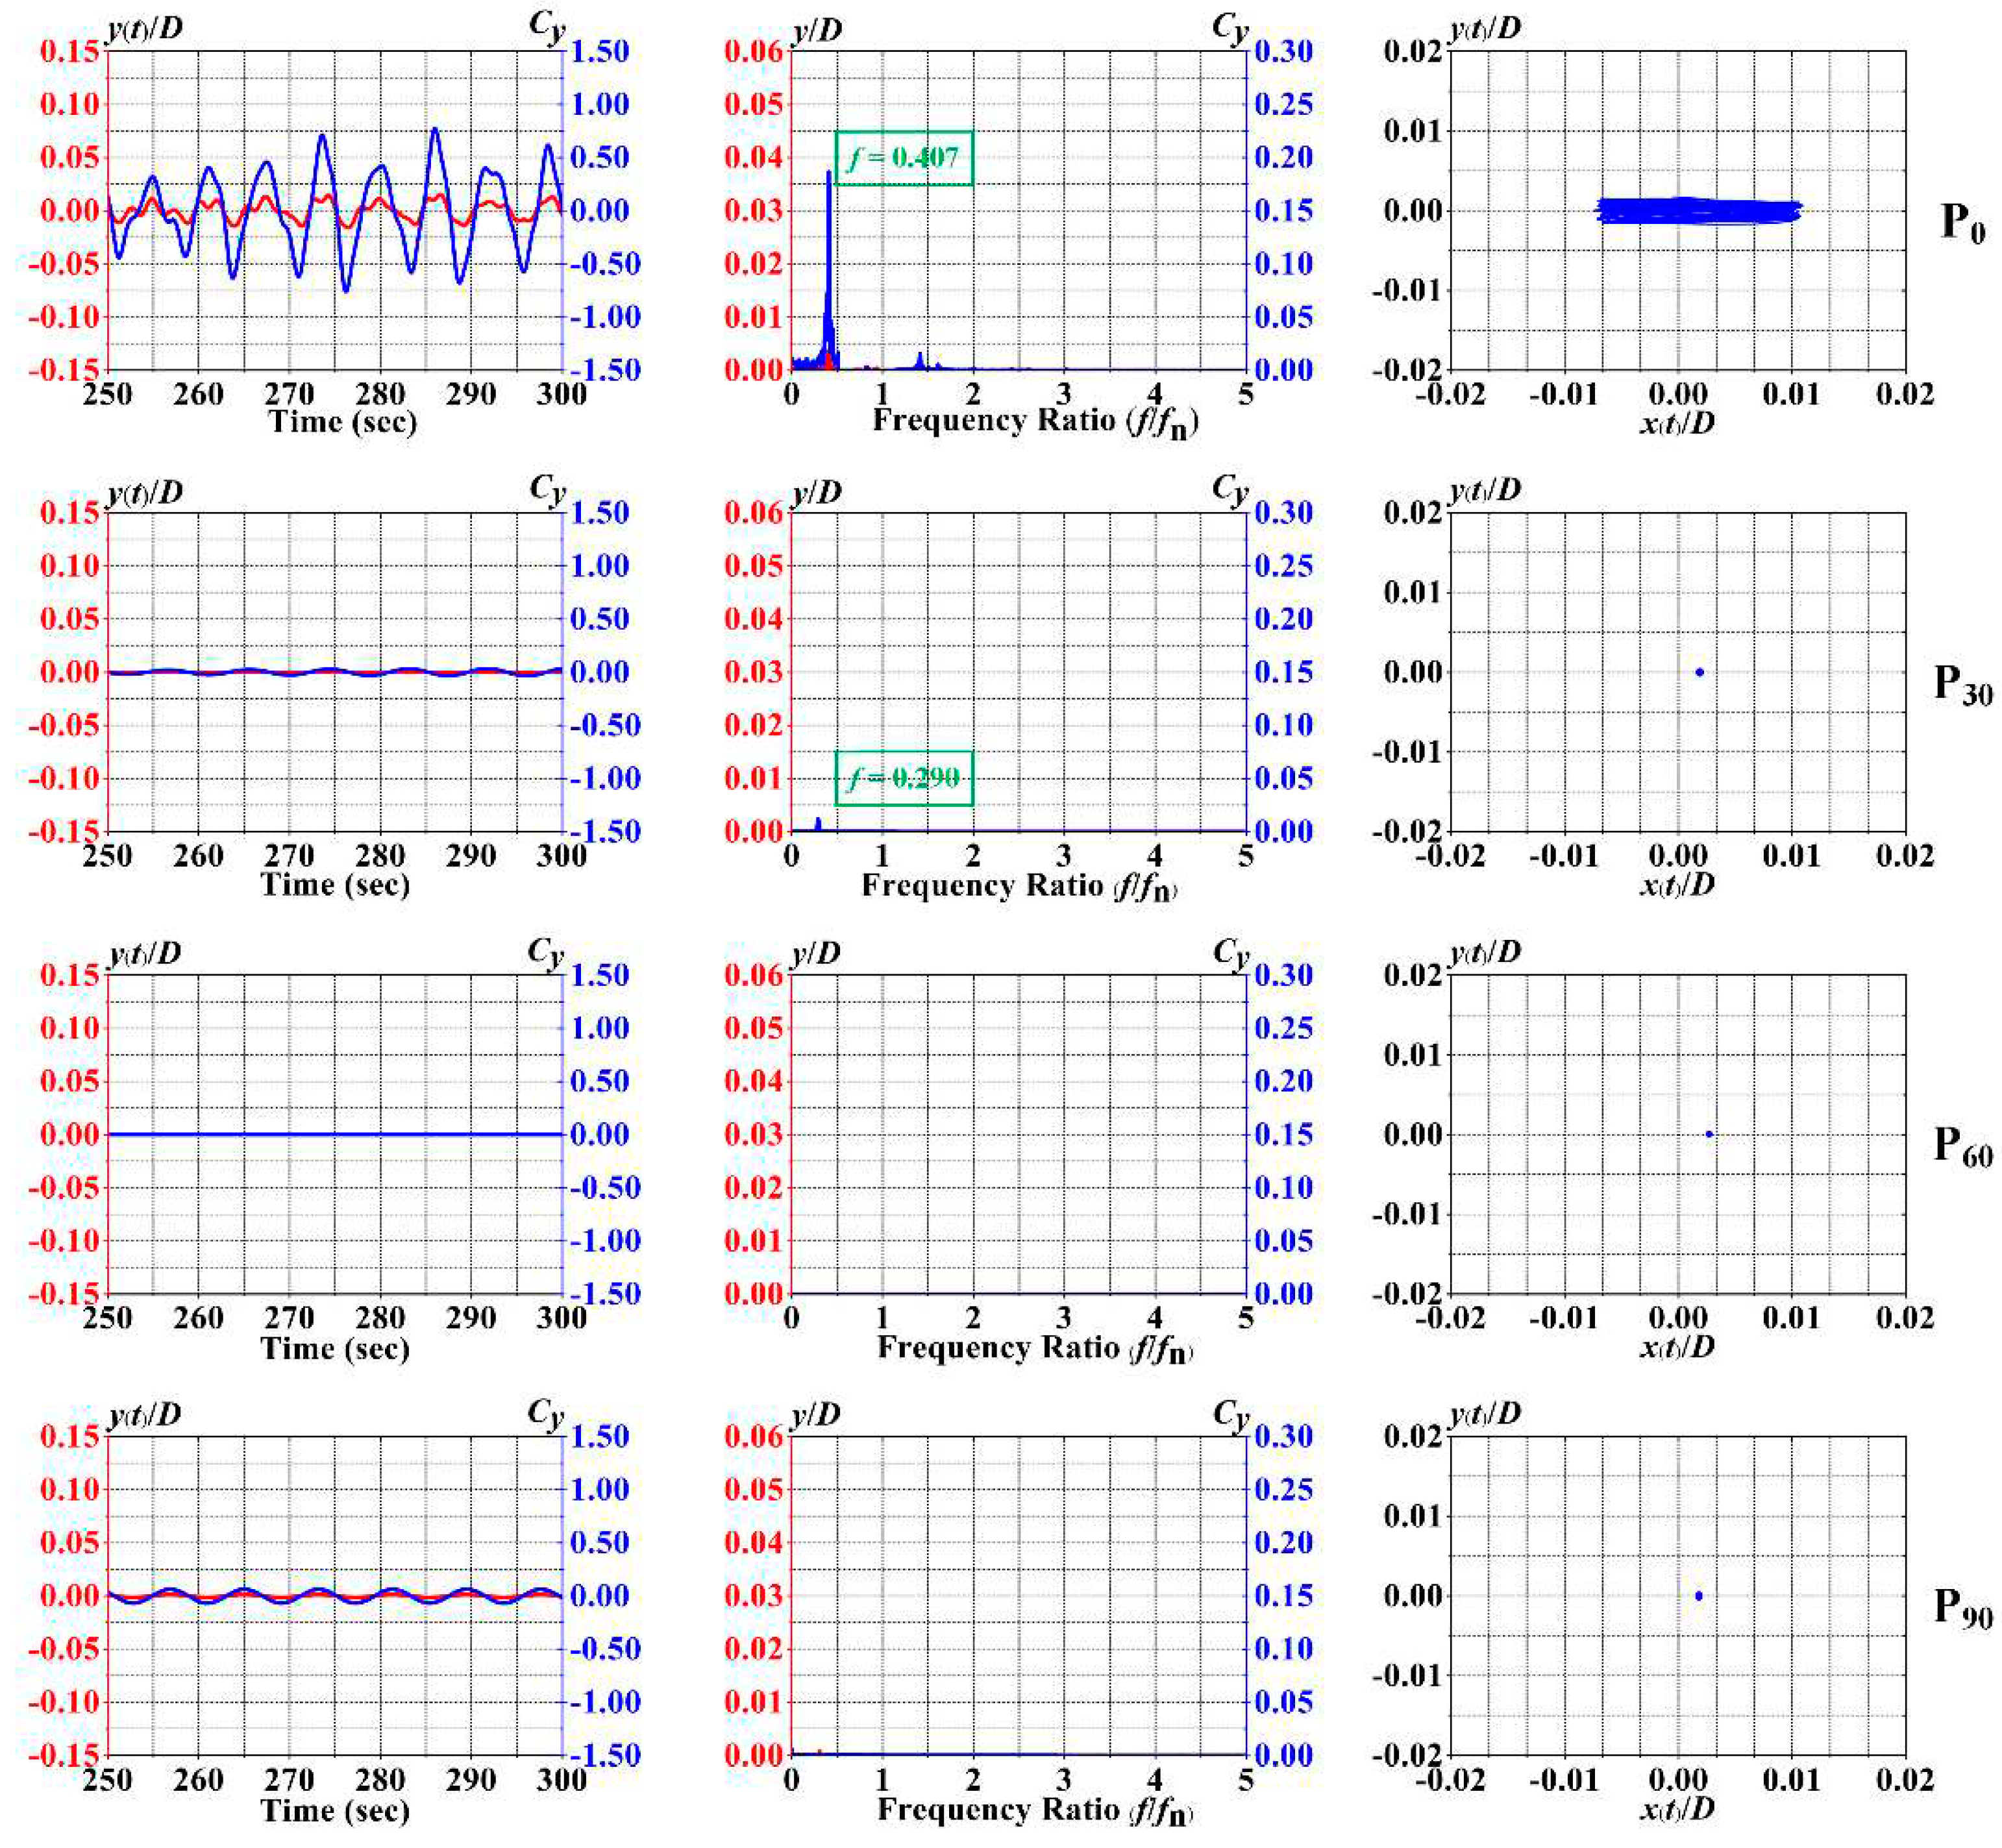
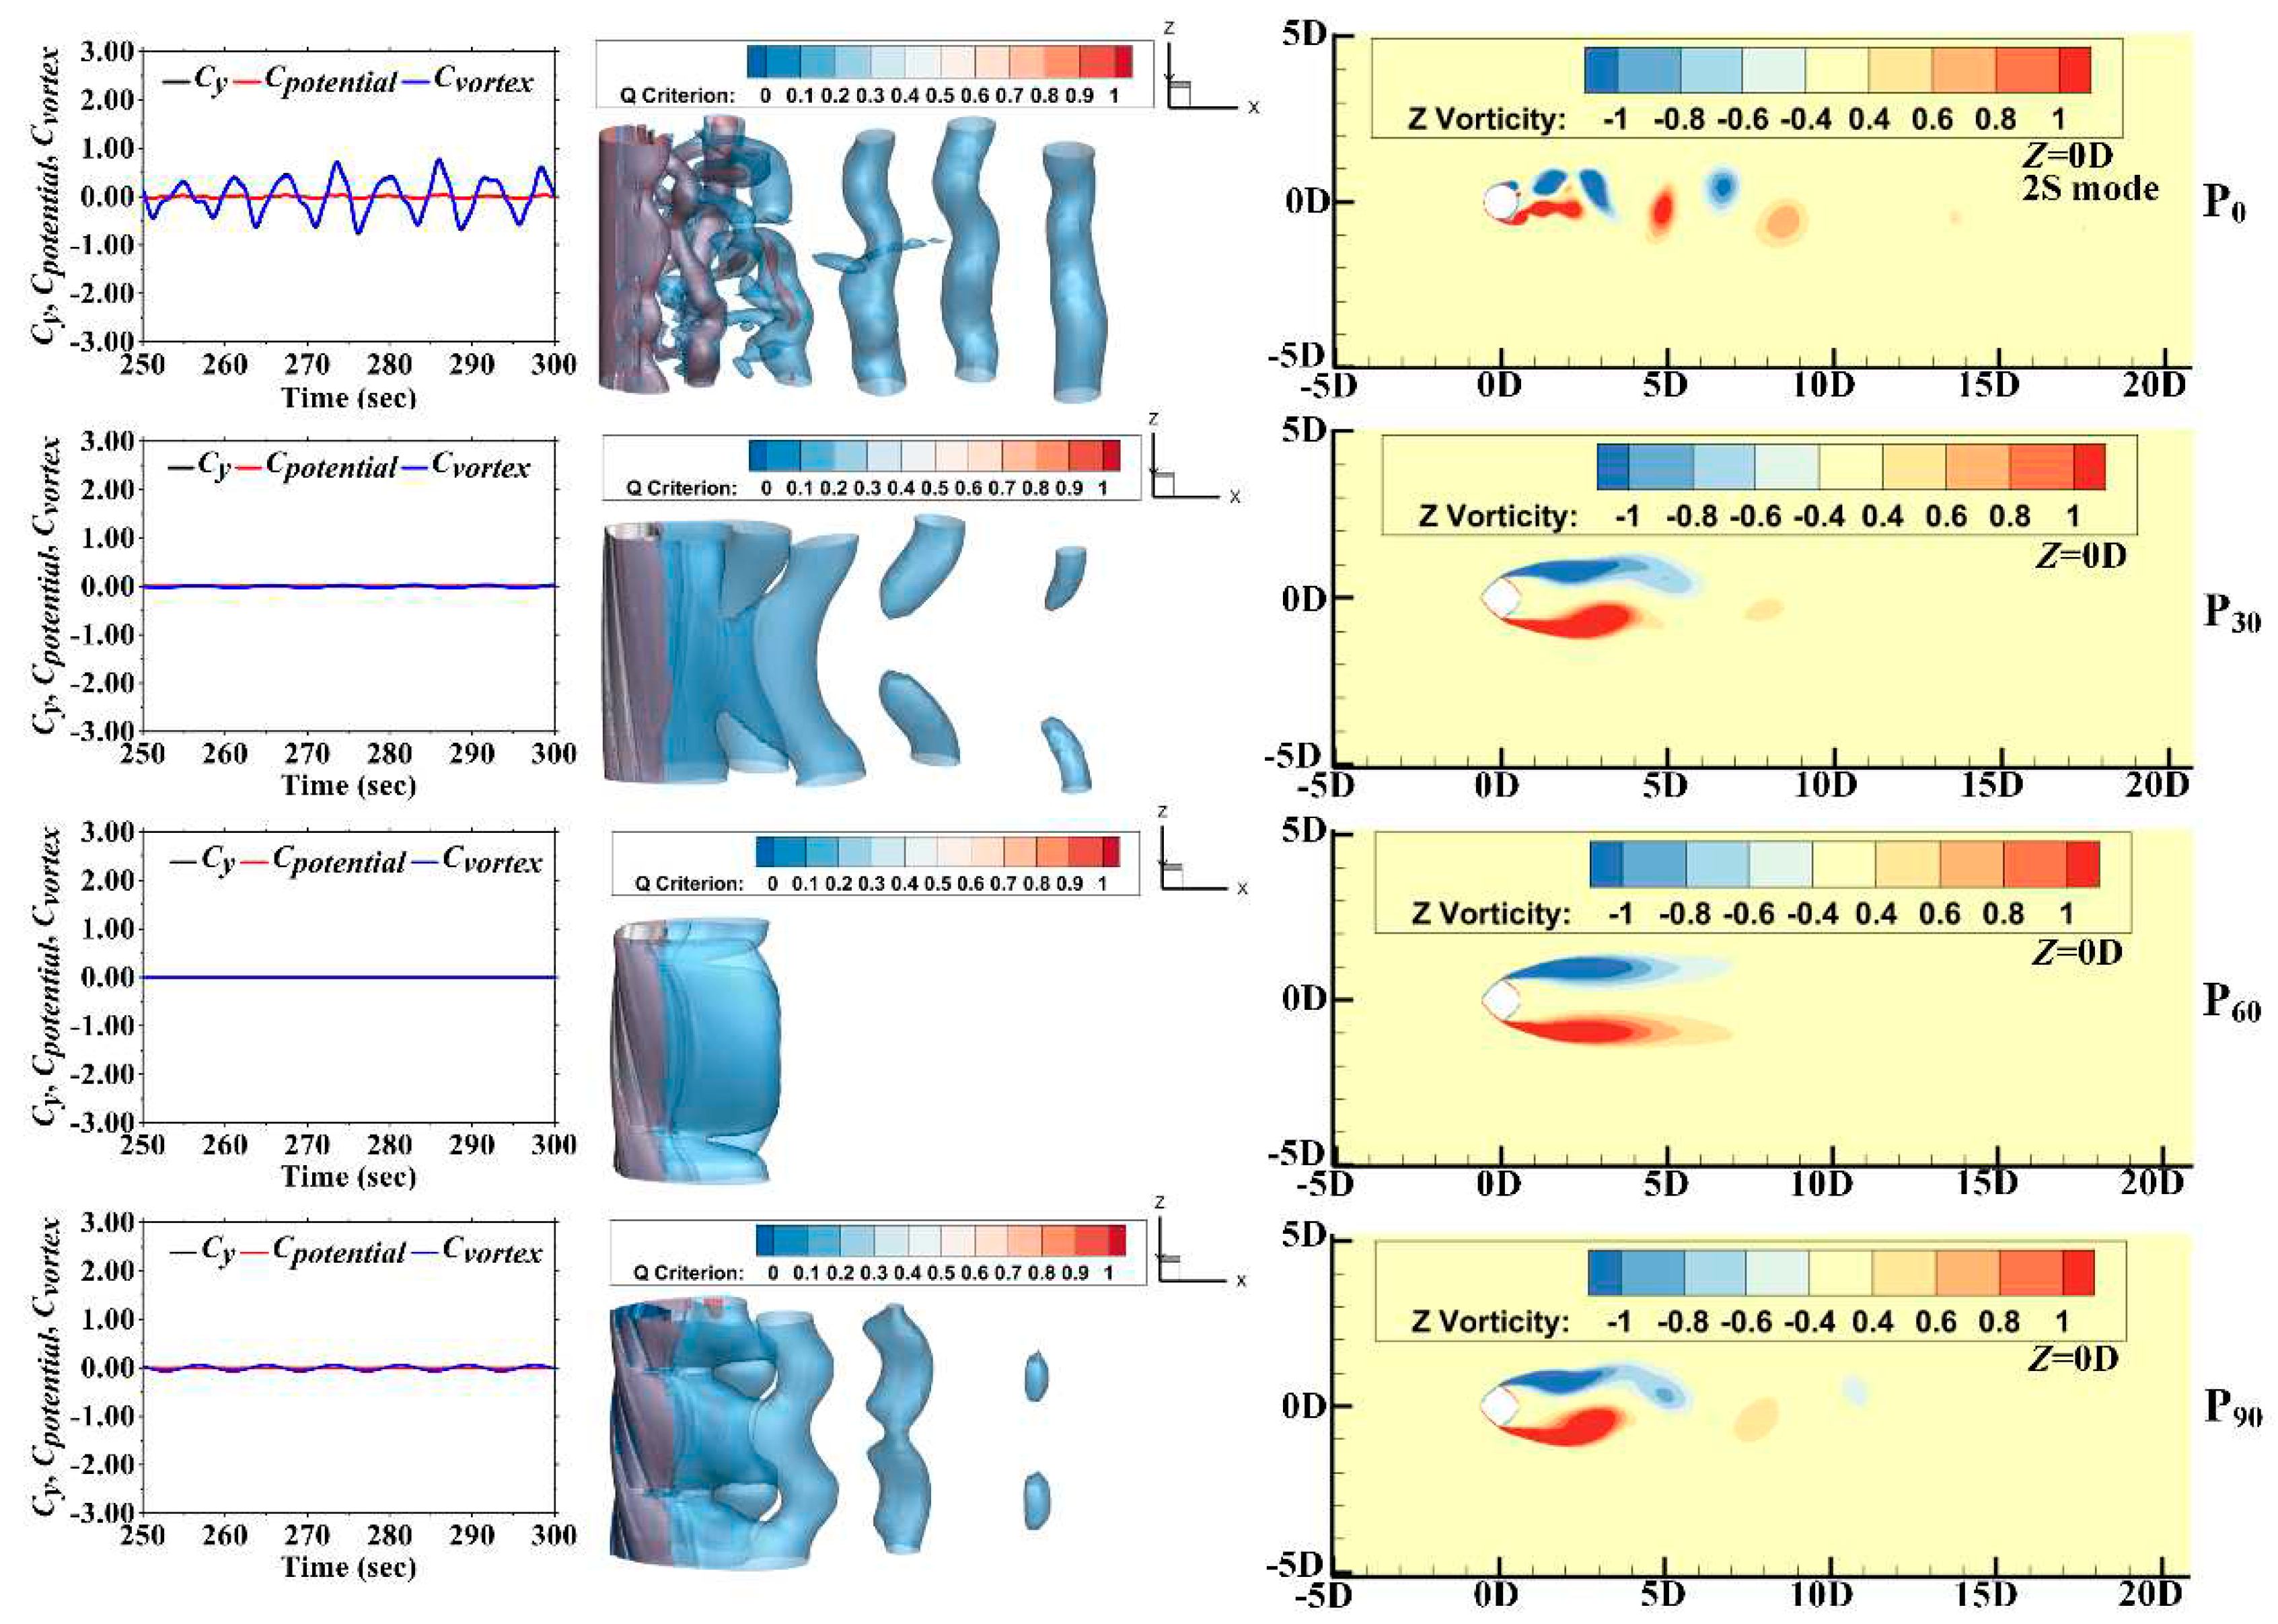
(1) Ur=2.0 (Re=0.8×10⁴). The time histories variation of VIV responses for P0, P30, P60, and P90 are shown in Figure 7. In Figure 7, the maximum lift coefficient (Cy(t)) is not more than 0.75 for P0, and the peak of the transverse amplitude ratio (Ay/D) is not more than 0.01. The peak frequency spectrum of vibration is 0.407 for P0, and the vibration trajectory is a flat 8-shaped. Because the VIV responses of P30, P60, and P90 are completely suppressed, the vibration trajectories are point-shaped. The lift coefficient (Cy(t)) and the transverse amplitude ratio (Ay/D) are about 0 for P30, P60, and P90. The frequency spectrum of P30 lift coefficient can display weak peak. Different forces, Q-criterion vortex, and vortex patterns for P0, P30, P60, and P90 are shown in Figure 8. In Figure 8, the vortex pattern is 2S mode (During a vibration cycle, there are two vortices shedding, with similar intensities and opposite directions). The vortex-force coefficient Cvortex (t) is the main source of the lift coefficient Cy (t), and Cy (t) ≈ Cvortex (t) for P0. Since the wake vortex cannot form and shed normally, the wake vortex is the band-shaped, resulting in a smaller vortex-force coefficient (Cvortex (t) ≈ 0). The Q-criteria vortex of P0 can be formed and shed normally, but the Q-criteria vortex of P60 is difficult to shed normally after forming. The Q-criteria vortices of P30 and P90 will partly separate and shed. This phenomenon shows that P60 has the best VIV suppression effect at the low reduced velocity.
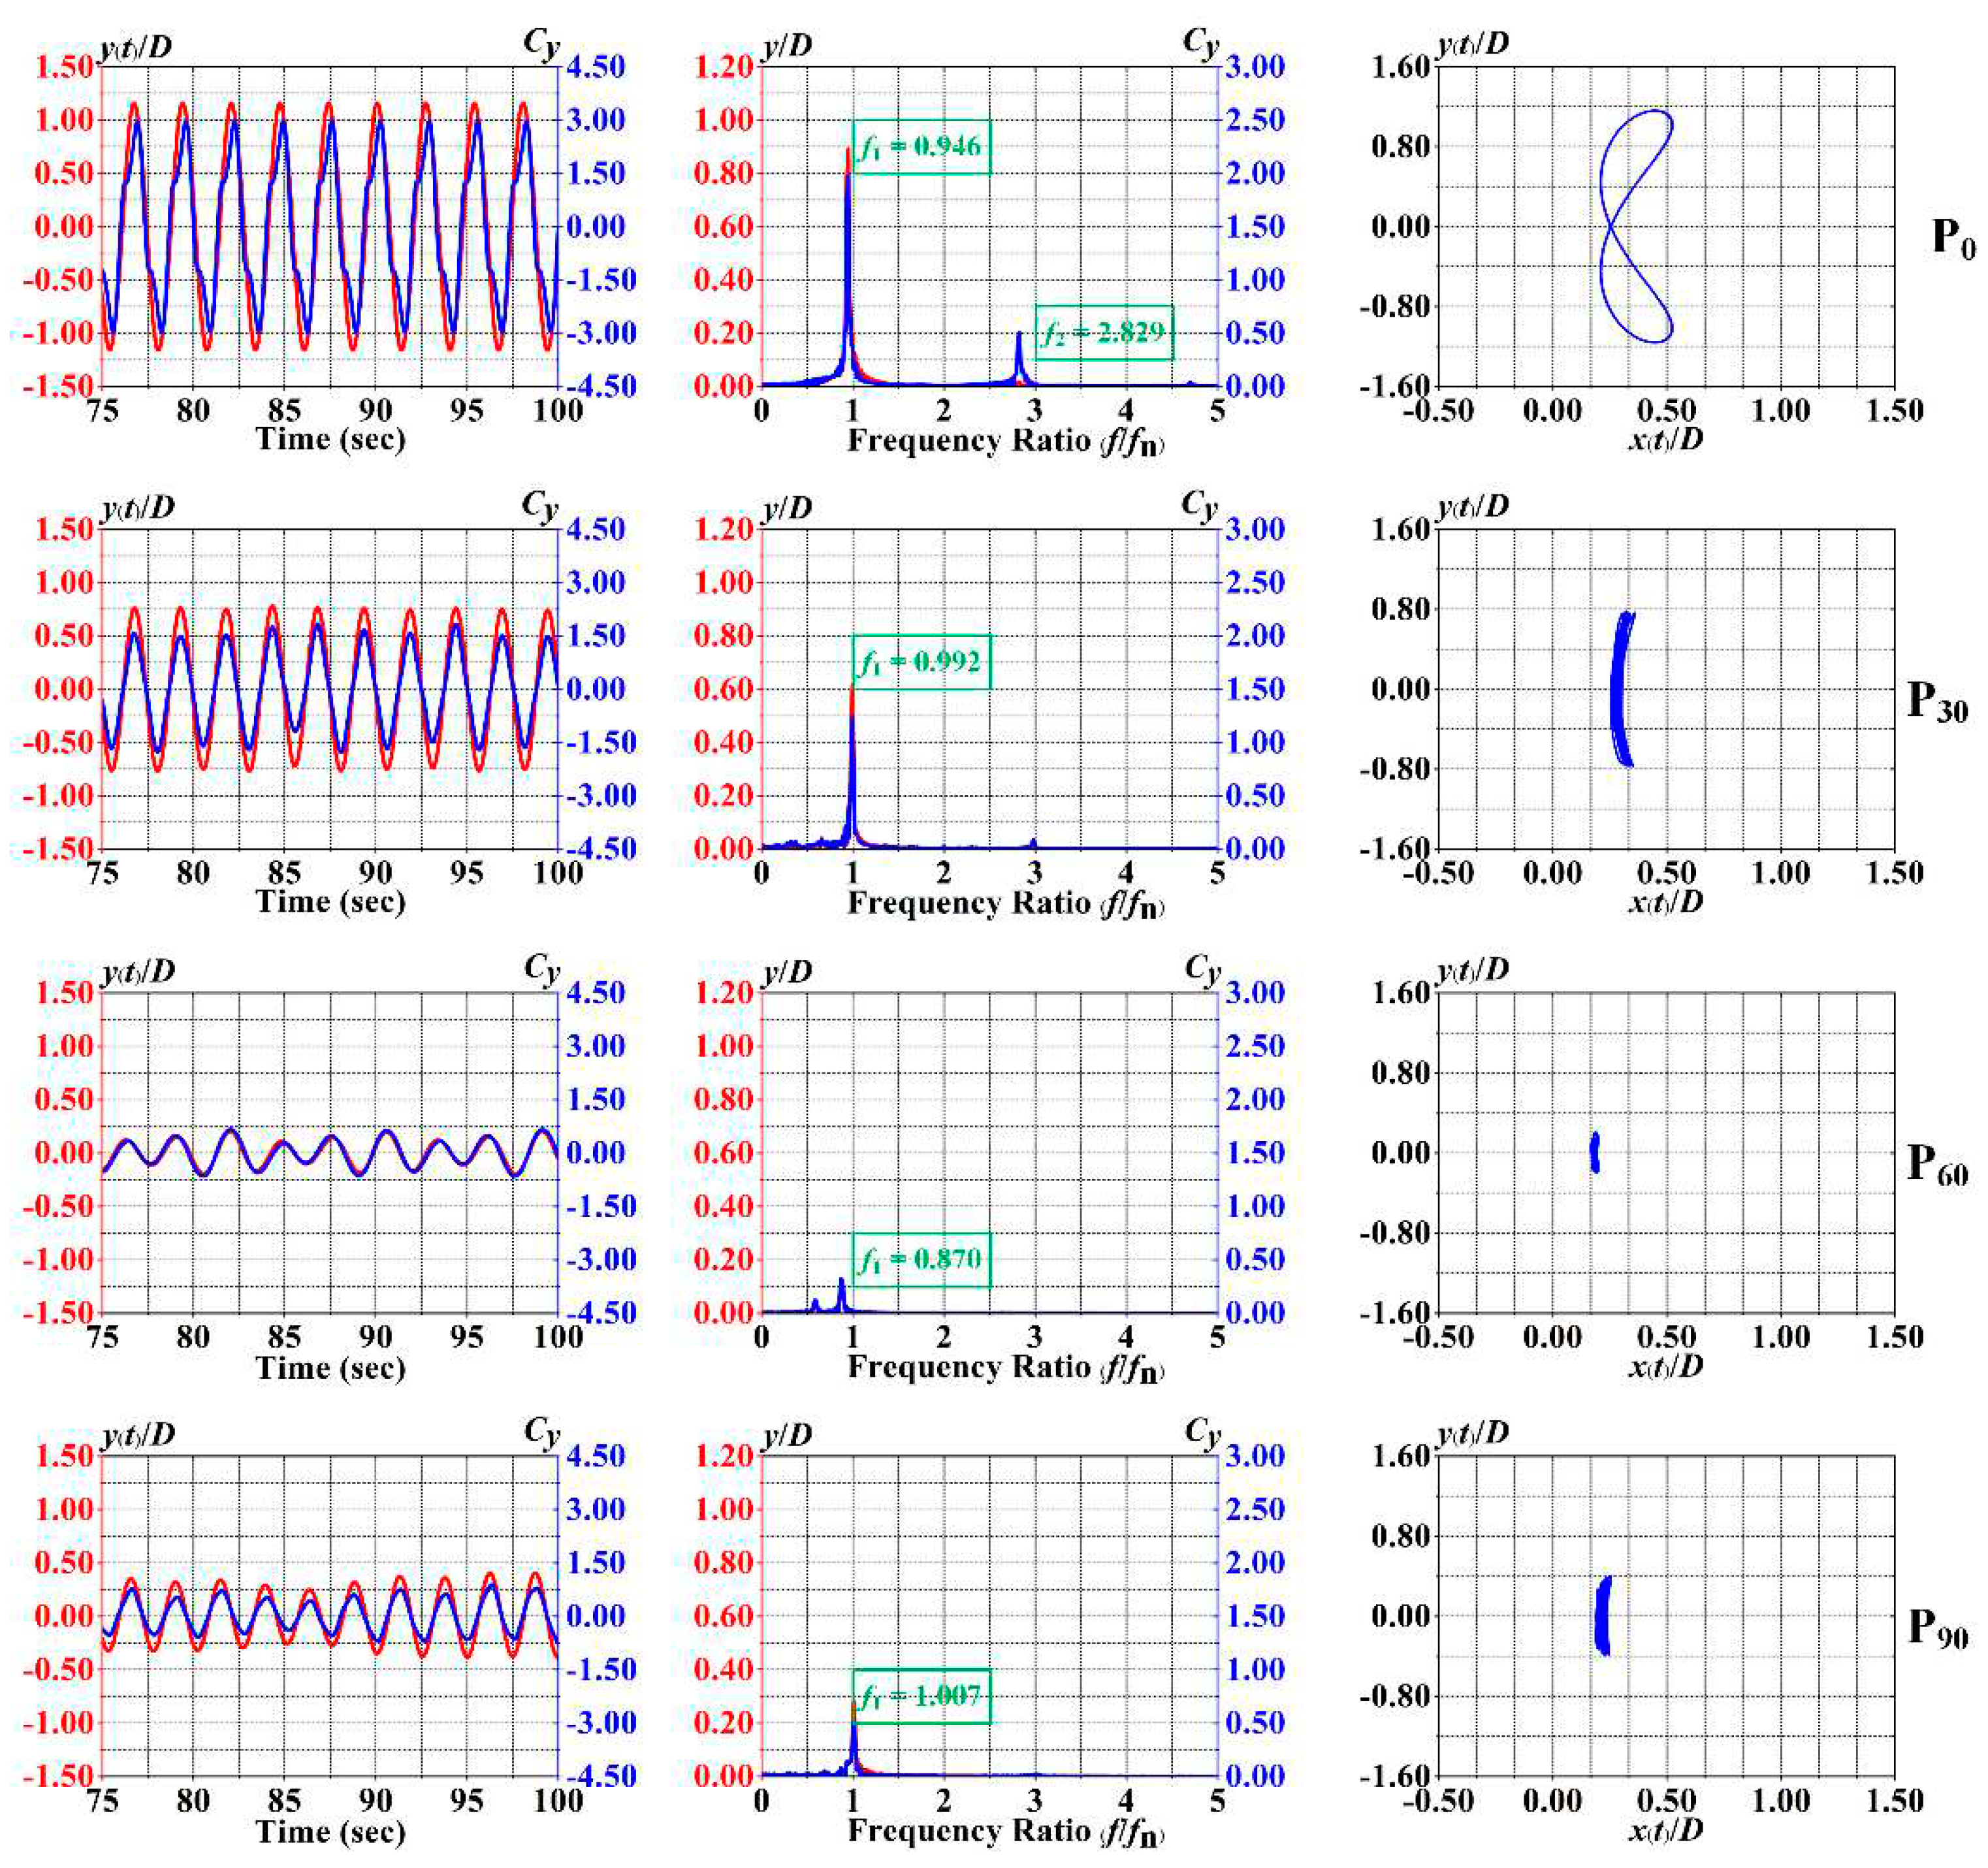
(2) Ur=6.0 (Re=2.4×10⁴). The time histories variation of VIV responses for P0, P30, P60, and P90 are shown in Figure 9. In Figure 9, the maximum lift coefficient (Cy(t)) is about 3.00 for P0, and the peak of transverse-amplitude ratio (Ay/D) is around 1.20. The peak frequency spectrum of vibration is 0.946 for P0, and there are two peaks (f1 and f2) frequency spectrum of vortex shedding. f2 is approximately three times that of f1, and this phenomenon is related to the vortex pattern. The vortex pattern is 2P mode (During the half cycle of VIV response, two vortices shed in opposite directions, with the first shedding vortex having a higher intensity) for P0. The vibration trajectory is clearly 8-shaped. Compared with the VIV responses of P0, the VIV responses of P30, P60, and P90 are significantly suppressed. There is only one peak (f1) frequency spectrum of vibration for P30, P60, and P90. From the perspective of vortex mode, the wake vortex begins to shed normally for P30, P60, and P90, more like the 2S mode. The vibration trajectory is more like a 1-shaped for P30, P60, and P90. Different forces, Q-criterion vortex, and vortex patterns for P0, P30, P60, and P90 are shown in Figure 10. In Figure 10, the vortex-force coefficient Cvortex (t) of P30, P60, and P90 are significantly smaller than those of P0, and the Terebridae-inspired ribs significantly suppresses vortex forces. The potential-force coefficient Cpotential (t) is the main source of the lift coefficient Cy (t), and Cy (t) ≈ Cpotential (t) for P30, P60, and P90. It can be seen that the Q-criterion vortex of P0 has a clear process of formation and shedding, while the Q-criterion vortices of P30, P60, and P90 are chaotic and does not have a clear pattern.
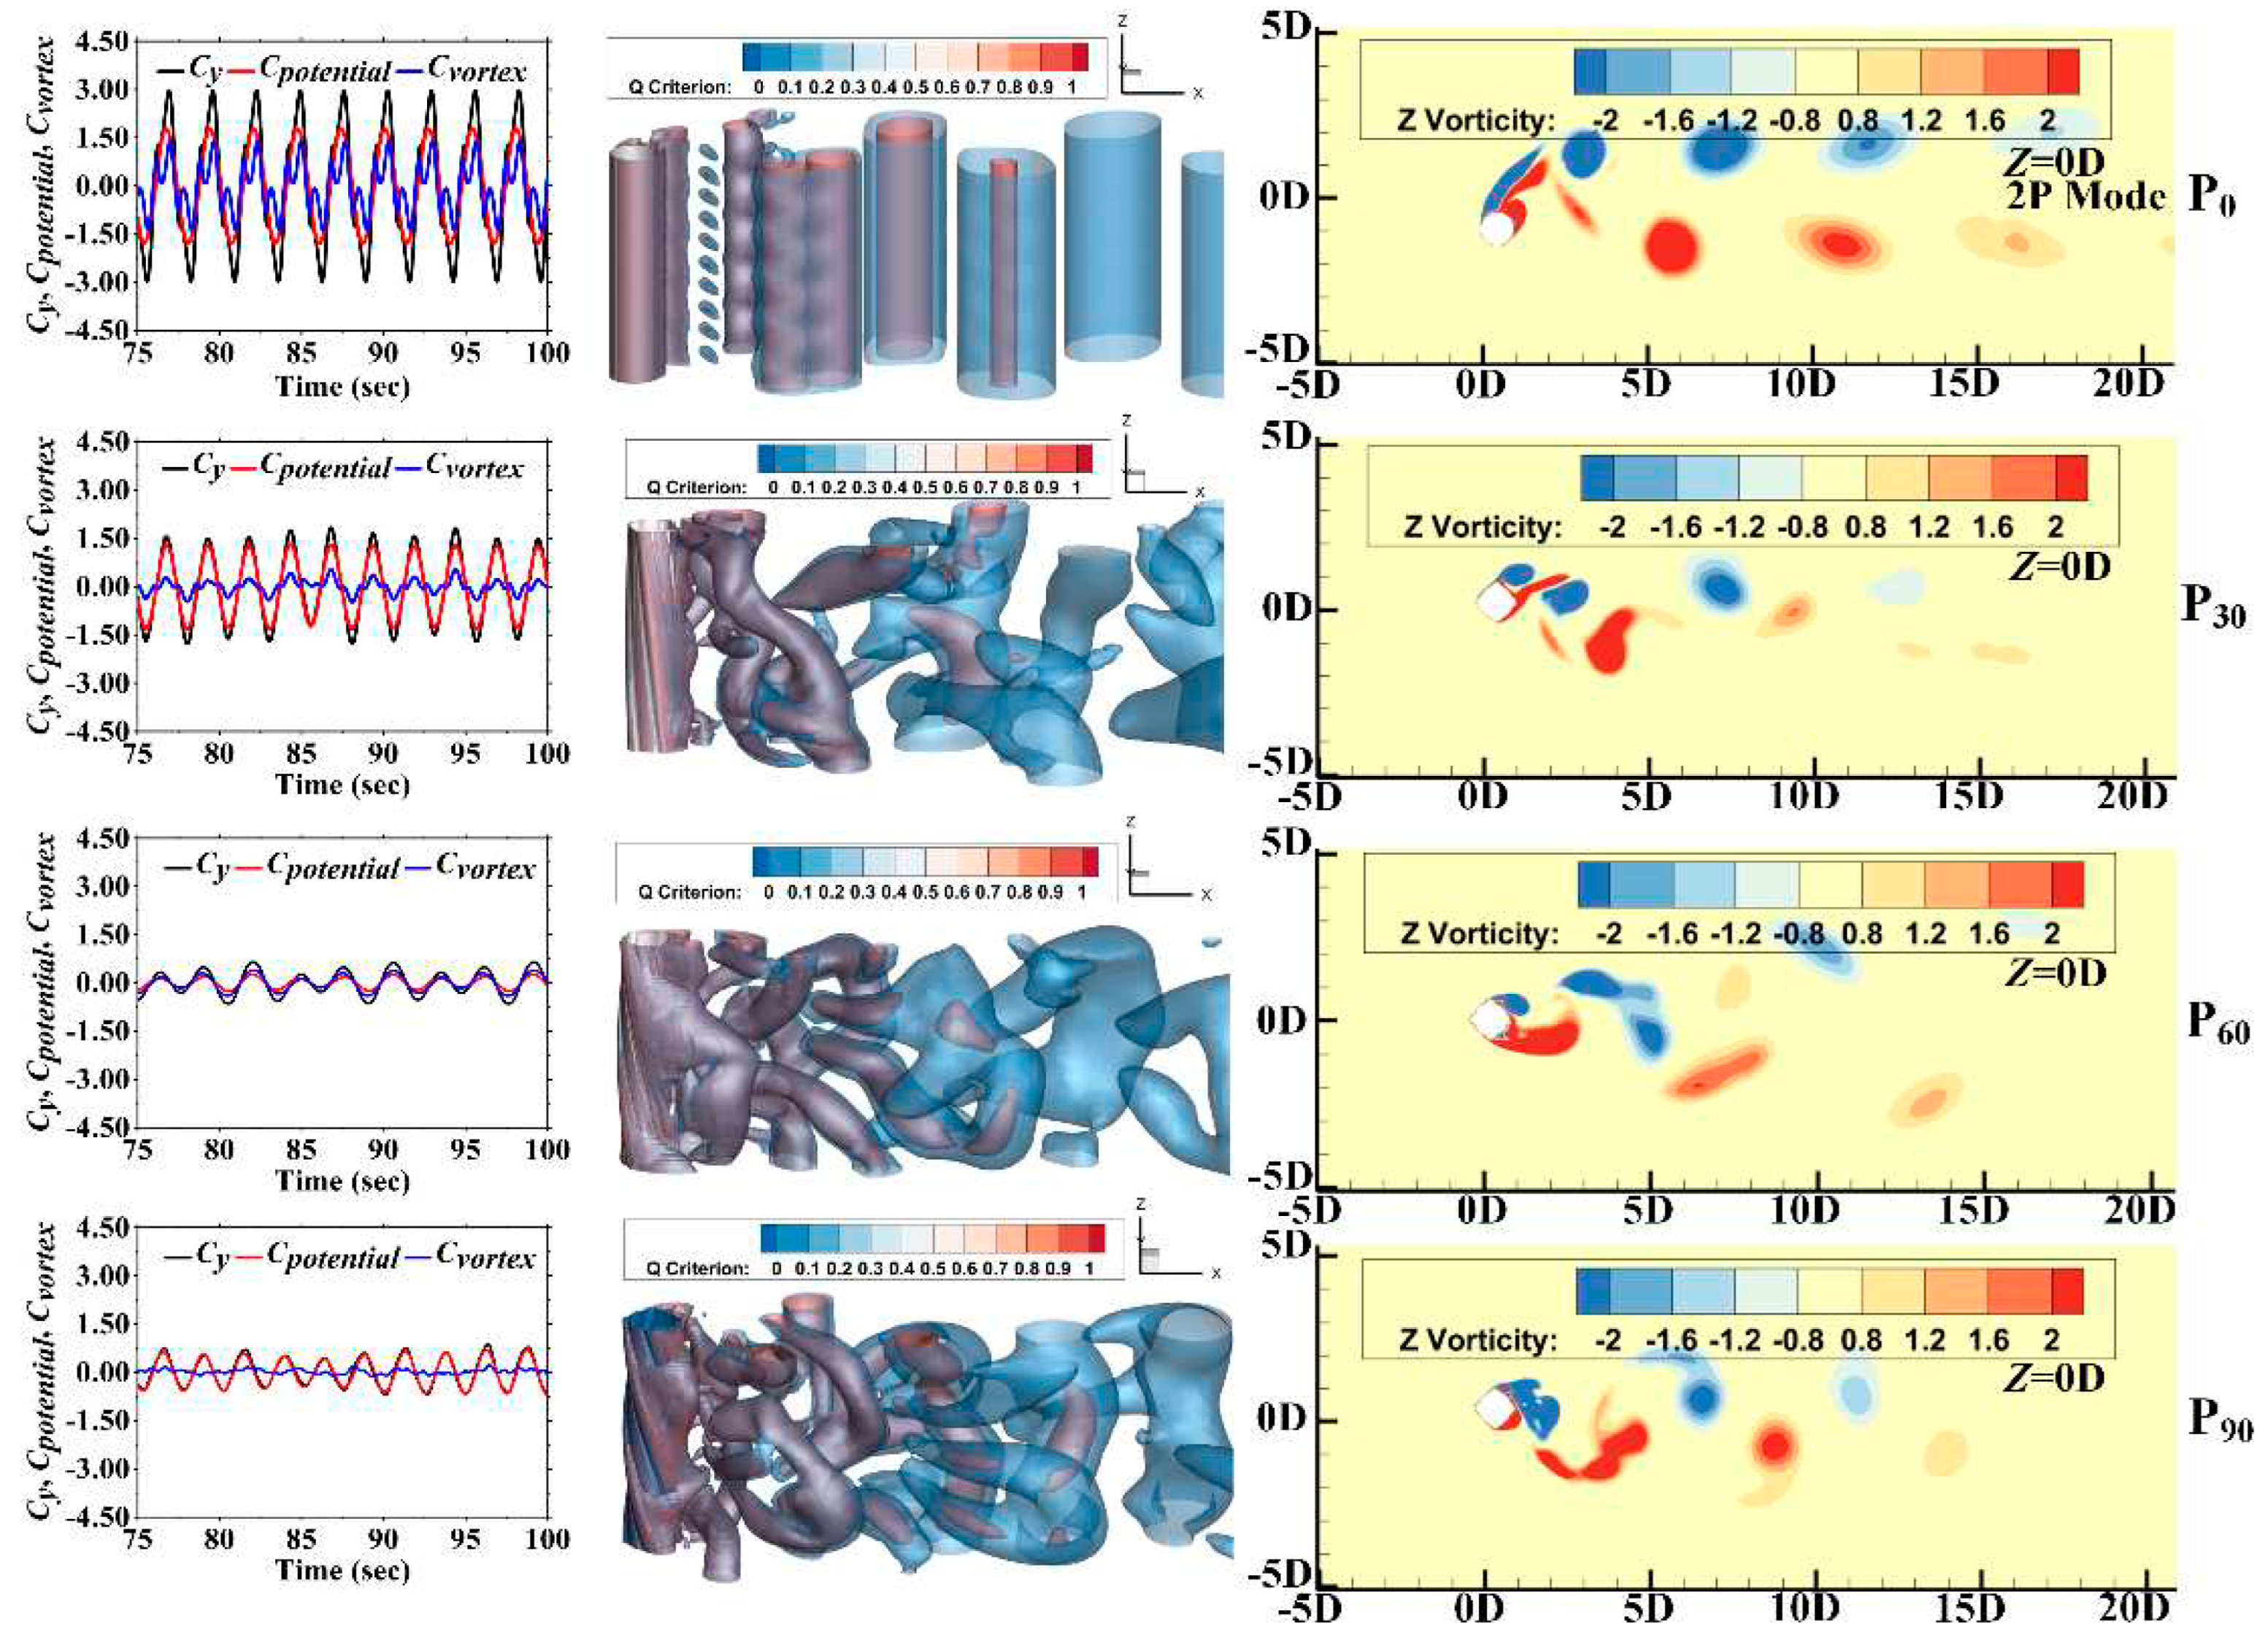
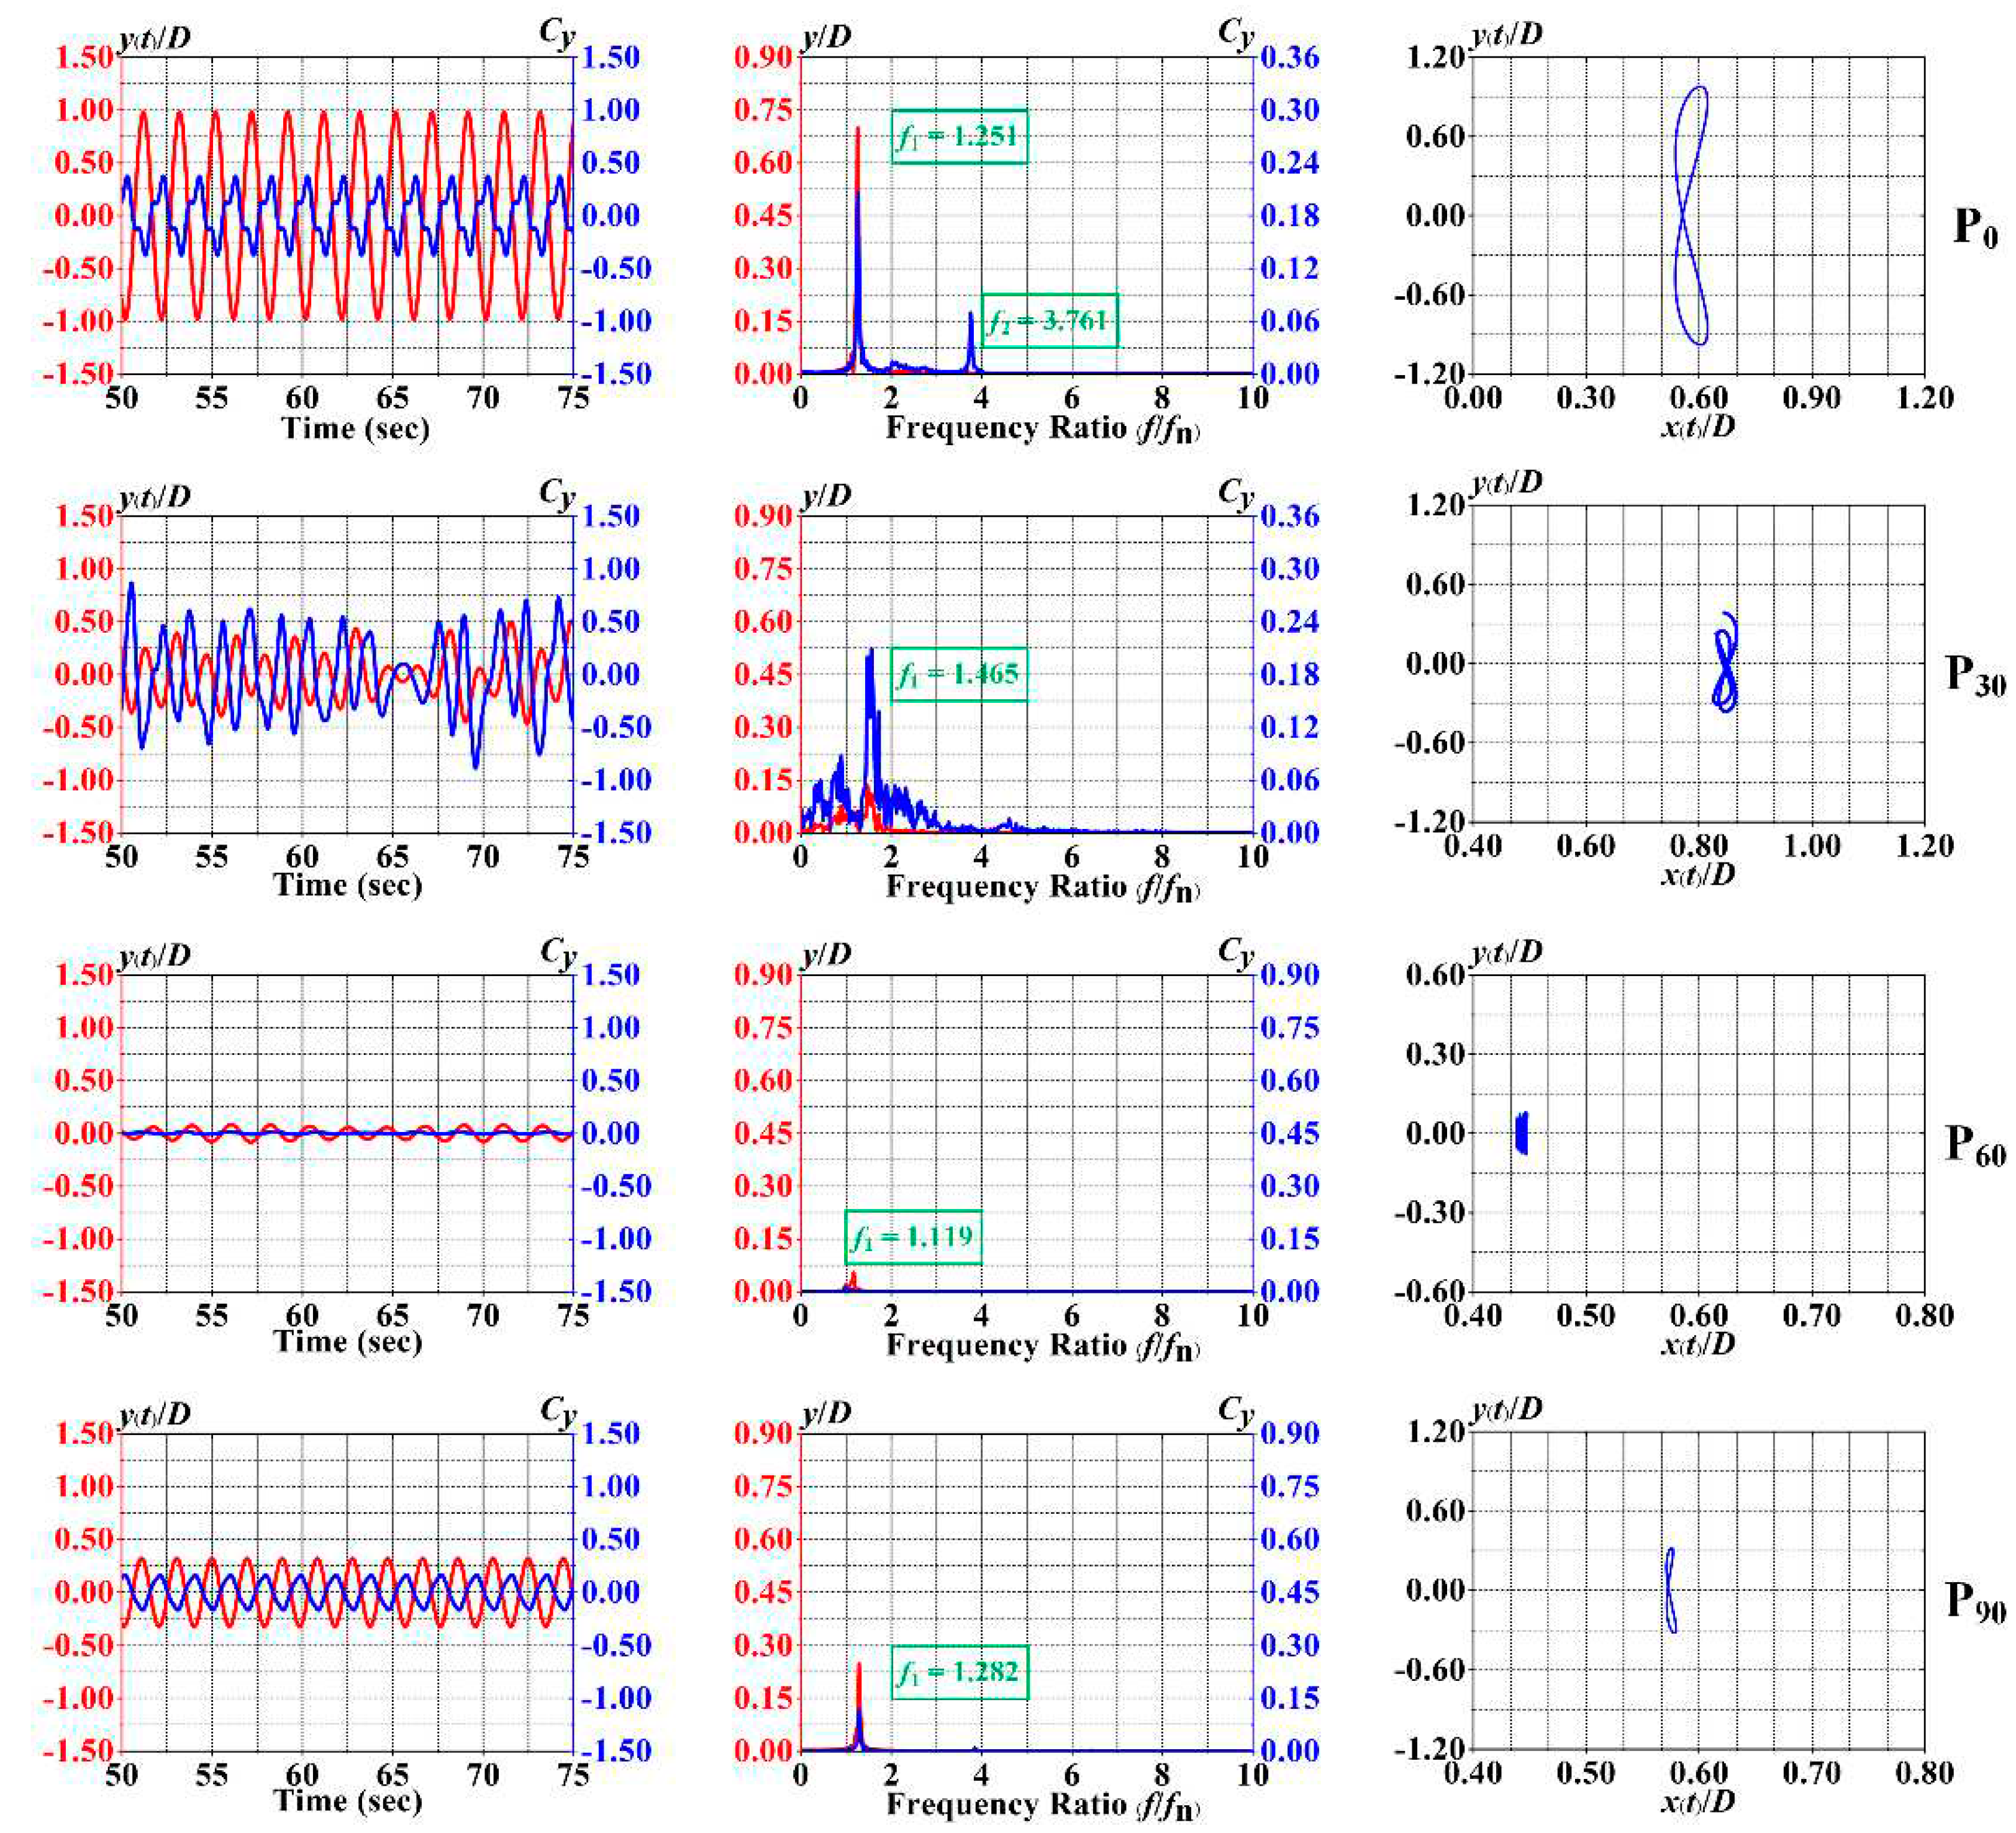
(3) Ur=10.0 (Re=4.0×10⁴): The time histories variation of VIV responses for P0, P30, P60, and P90 are shown in Figure 11. In Figure 11, the maximum lift coefficient (Cy(t)) does not extend 0.50 for P0, and the peak of transverse-amplitude ratio (Ay/D) is about 1.00. Different forces, Q-criterion vortex, and vortex patterns for P0, P30, P60, and P90 are shown in Figure 12. The peak of frequency spectrum of vibration is 1.251 for P0, and there are two peaks (f1 and f2) in the frequency spectrum of vortex shedding. f2 is approximately three times that of f1, and the vortex pattern is 2P mode for P0. The vibration trajectories are clearly 8-shaped for P0, P30, and P90. Because the VIV response is well suppressed of P60, no obvious shape was observed on the motion trajectory, and there is a smaller amplitude of motion. There is only one peak (f1) frequency spectrum of vibration for P30, P60, and P90. There is a significant phase difference between the potential-force coefficient Cpotential (t) and the vortex-force coefficient Cvortex (t), results in a significant drop in the lift coefficient Cy (t). The Q-criteria vortex of P0 appears a stable shedding state, while the Q-criterion vortex formation and shedding of P30, P60, and P90 are destroyed.
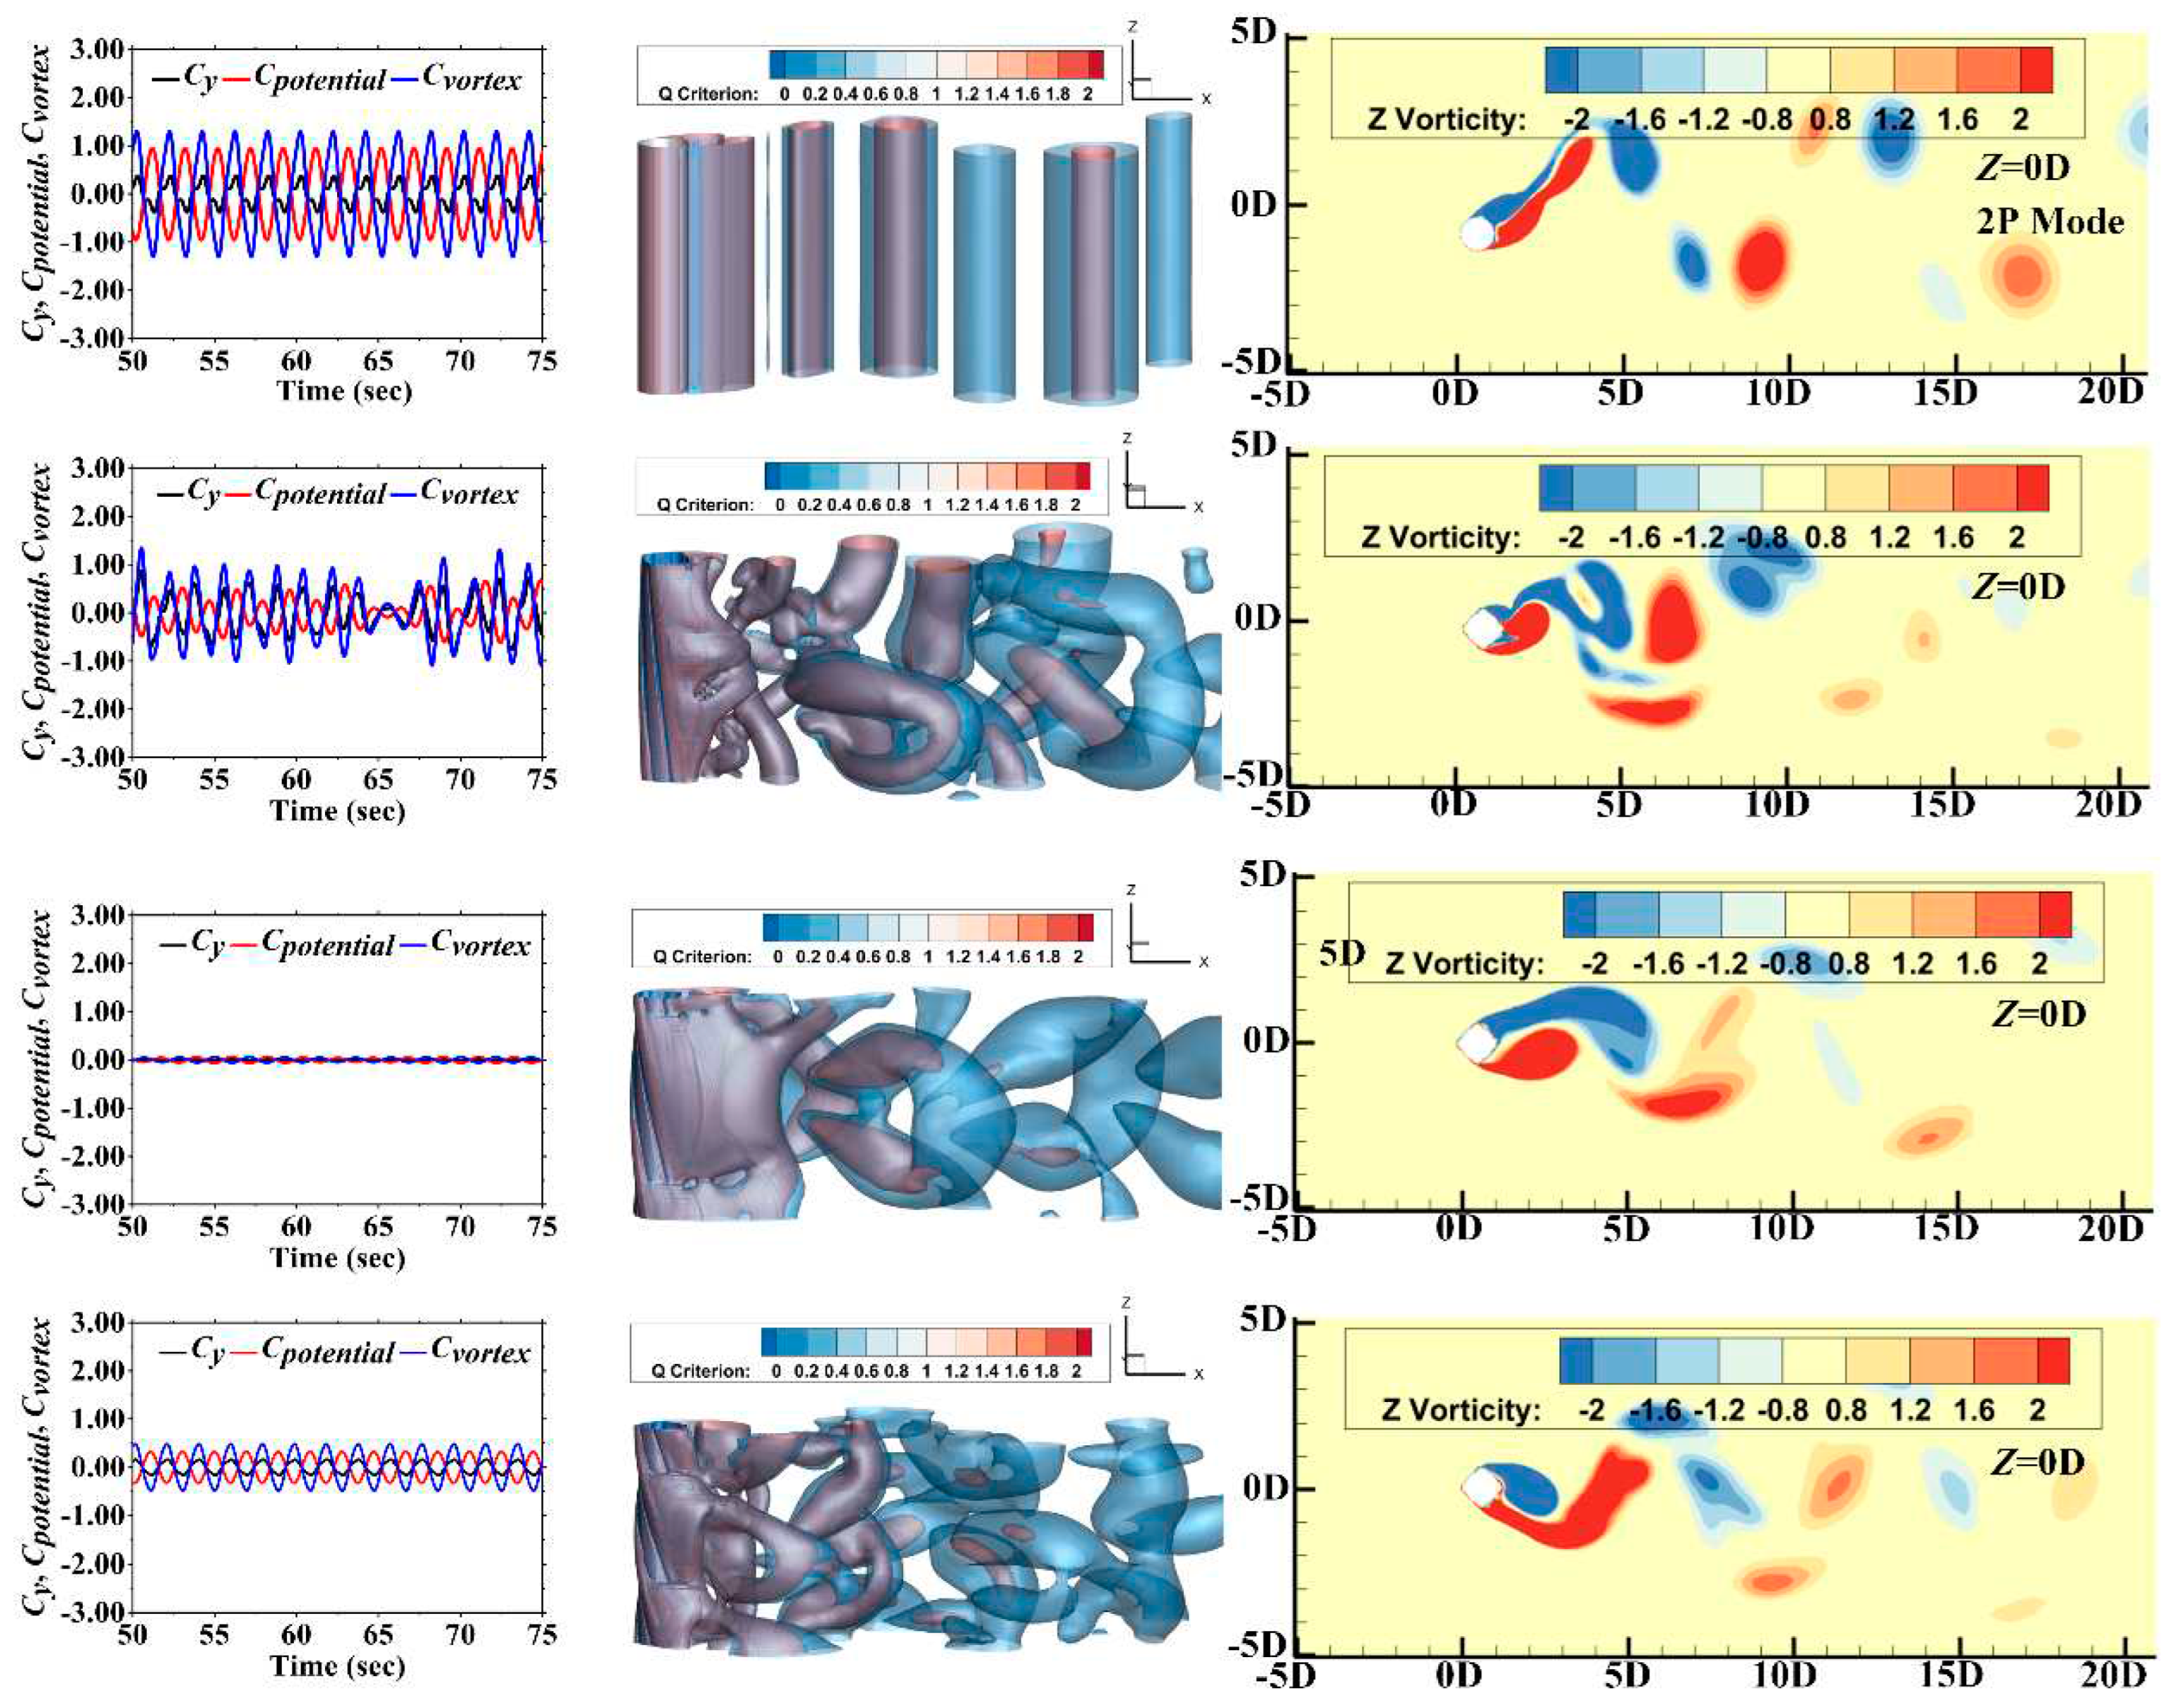
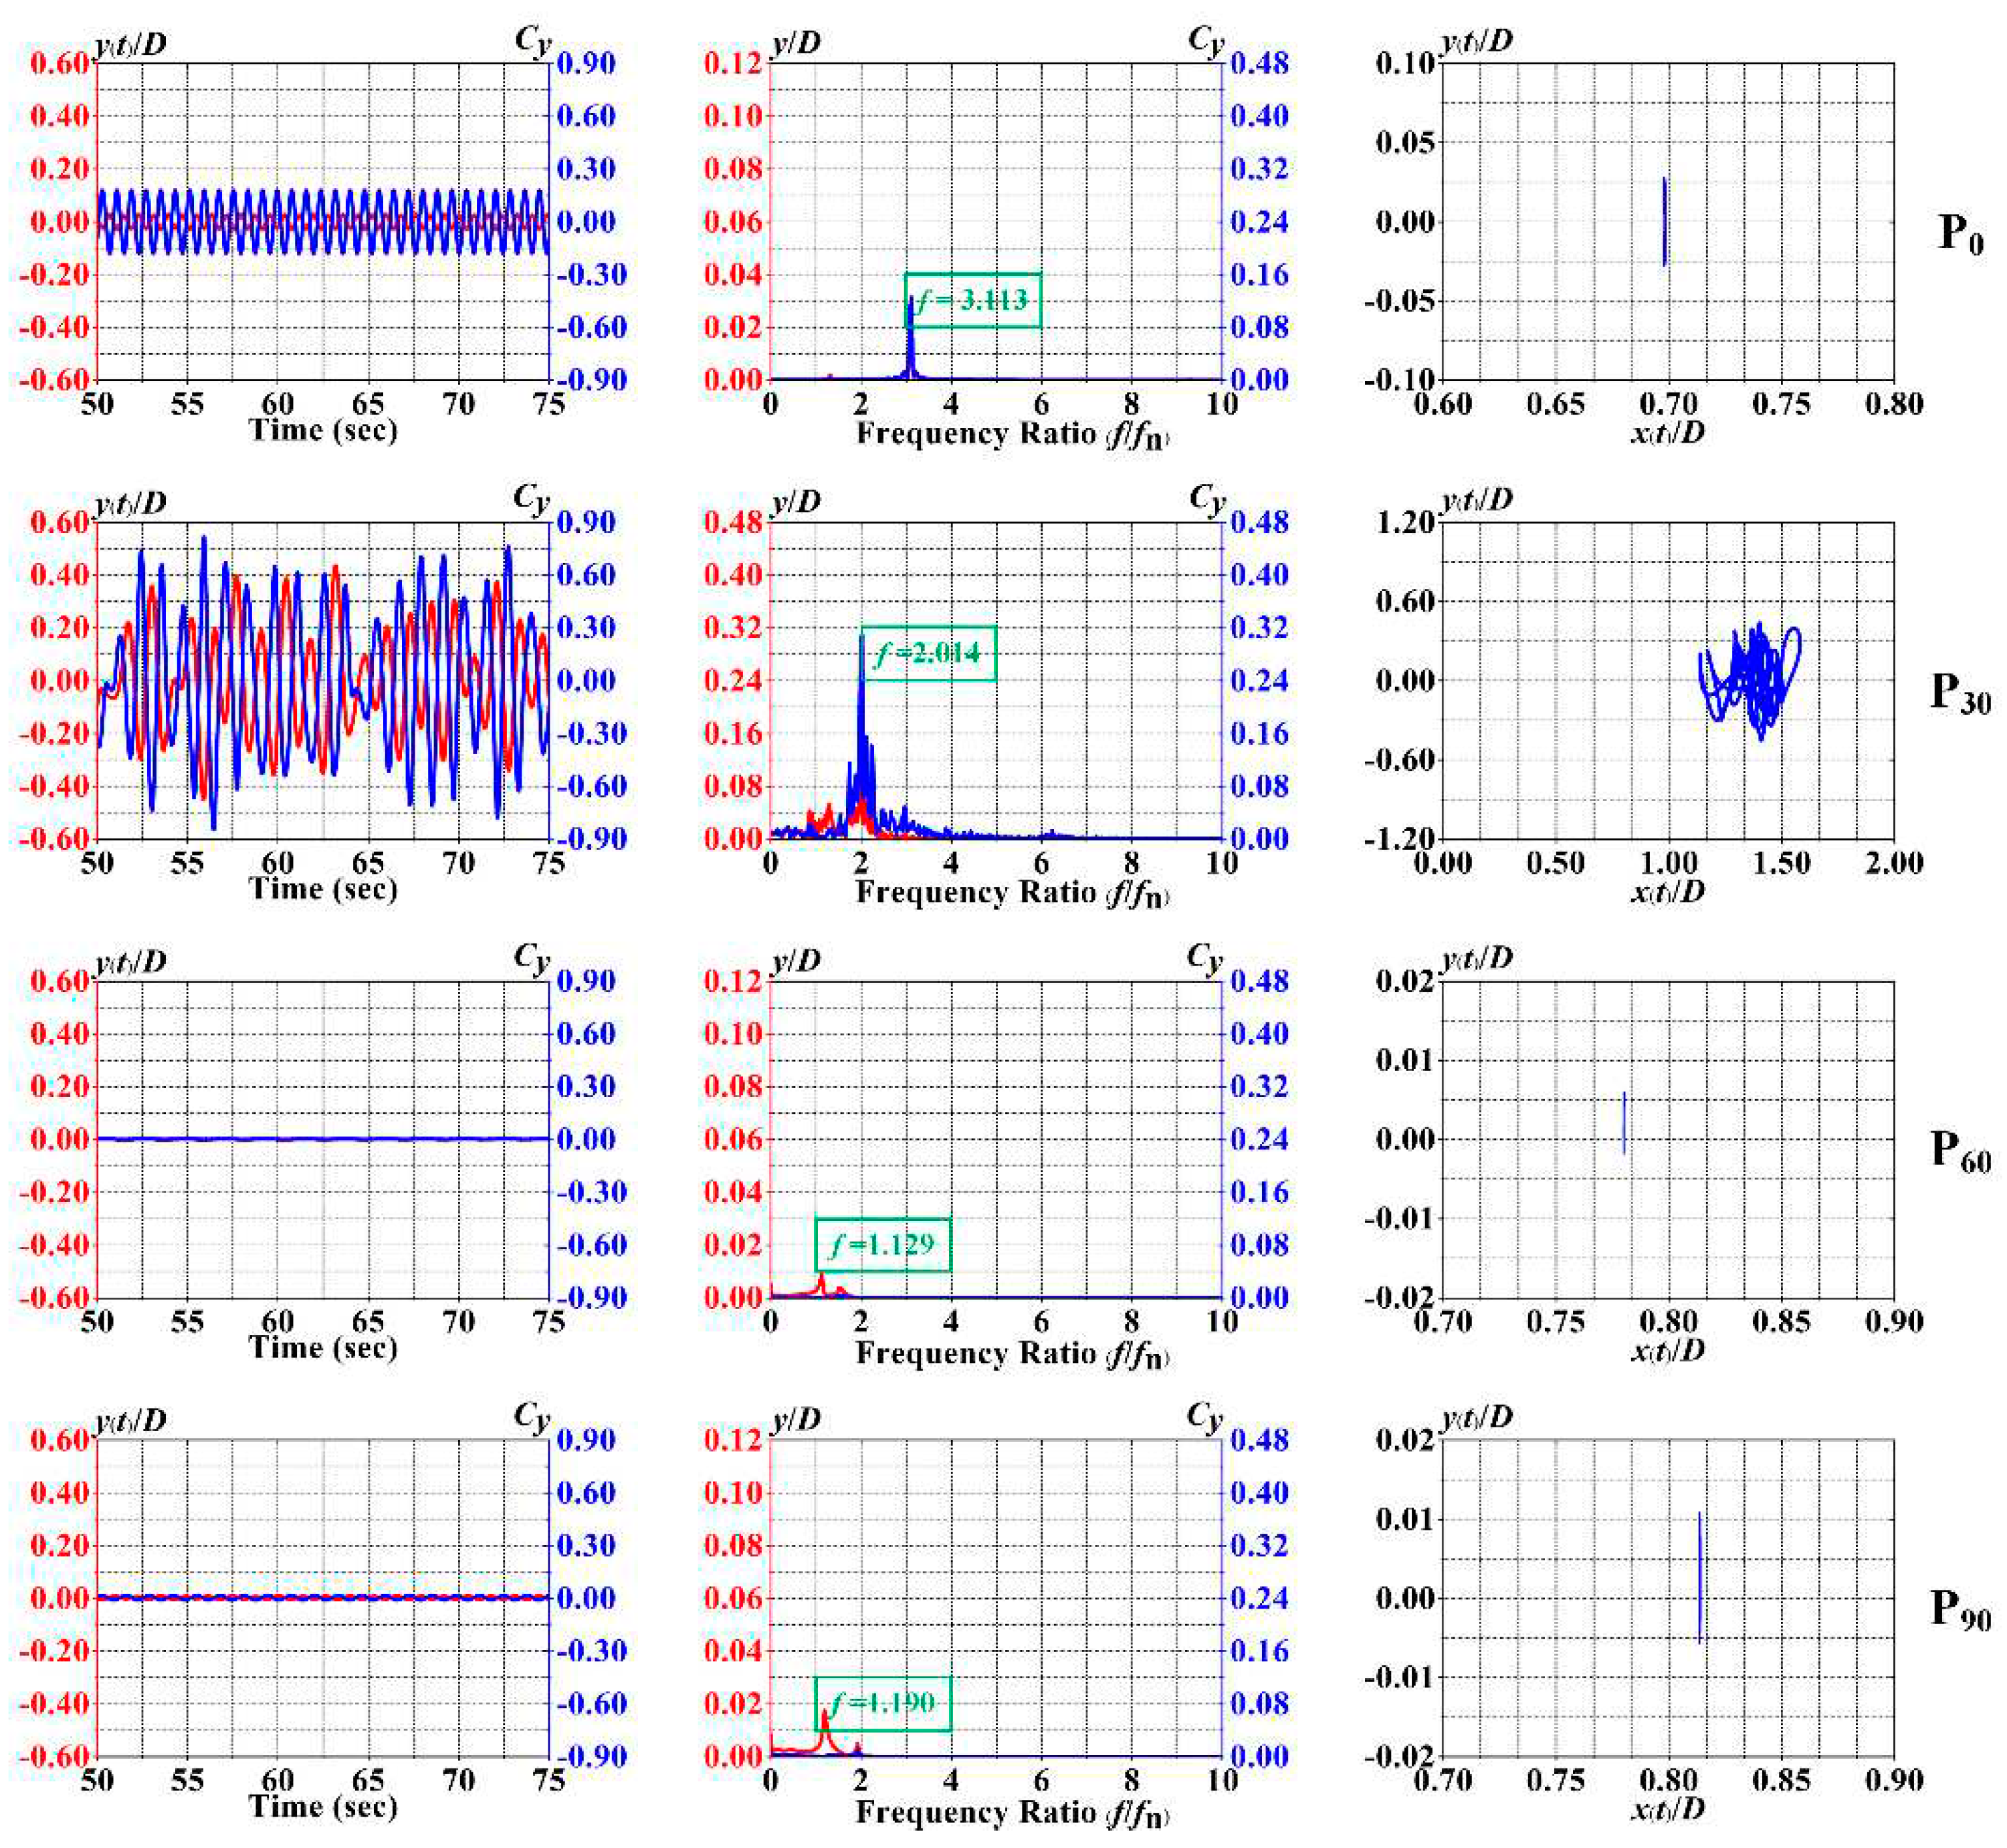
(4) Ur=14.0 (Re=5.6×10⁴). The time histories variation of VIV responses for P0, P30, P60, and P90 are shown in Figure 13. In Figure 13, there is only one peak (f1) frequency spectrum of vibration for P0, P30, P60, and P90. Compared to the amplitude response of P0, the amplitude response of P30 is enhanced. This phenomenon indicates that the VIV response of P30 exhibits instability at the high reduced velocity. And the vibration trajectory of P30 is chaotic, and the vibration trajectories of P0, P60, and P90 are more like a 1-shaped. The VIV responses of P60 and P90 are completely suppressed. Especially for the Q-criterion vortex of P60, it is found that it is difficult to form and shed. And Different forces, Q-criterion vortex, and vortex modes of P0, P30, P60, and P90 are shown in Figure 14. There is a significant phase difference between the potential-force coefficient Cpotential (t) and the vortex-force coefficient Cvortex (t). But the vortex-force coefficient Cvortex (t) is the main source of the lift coefficient Cy (t) for P0.

4.2. Phase Angle and Mean Drag Coefficients

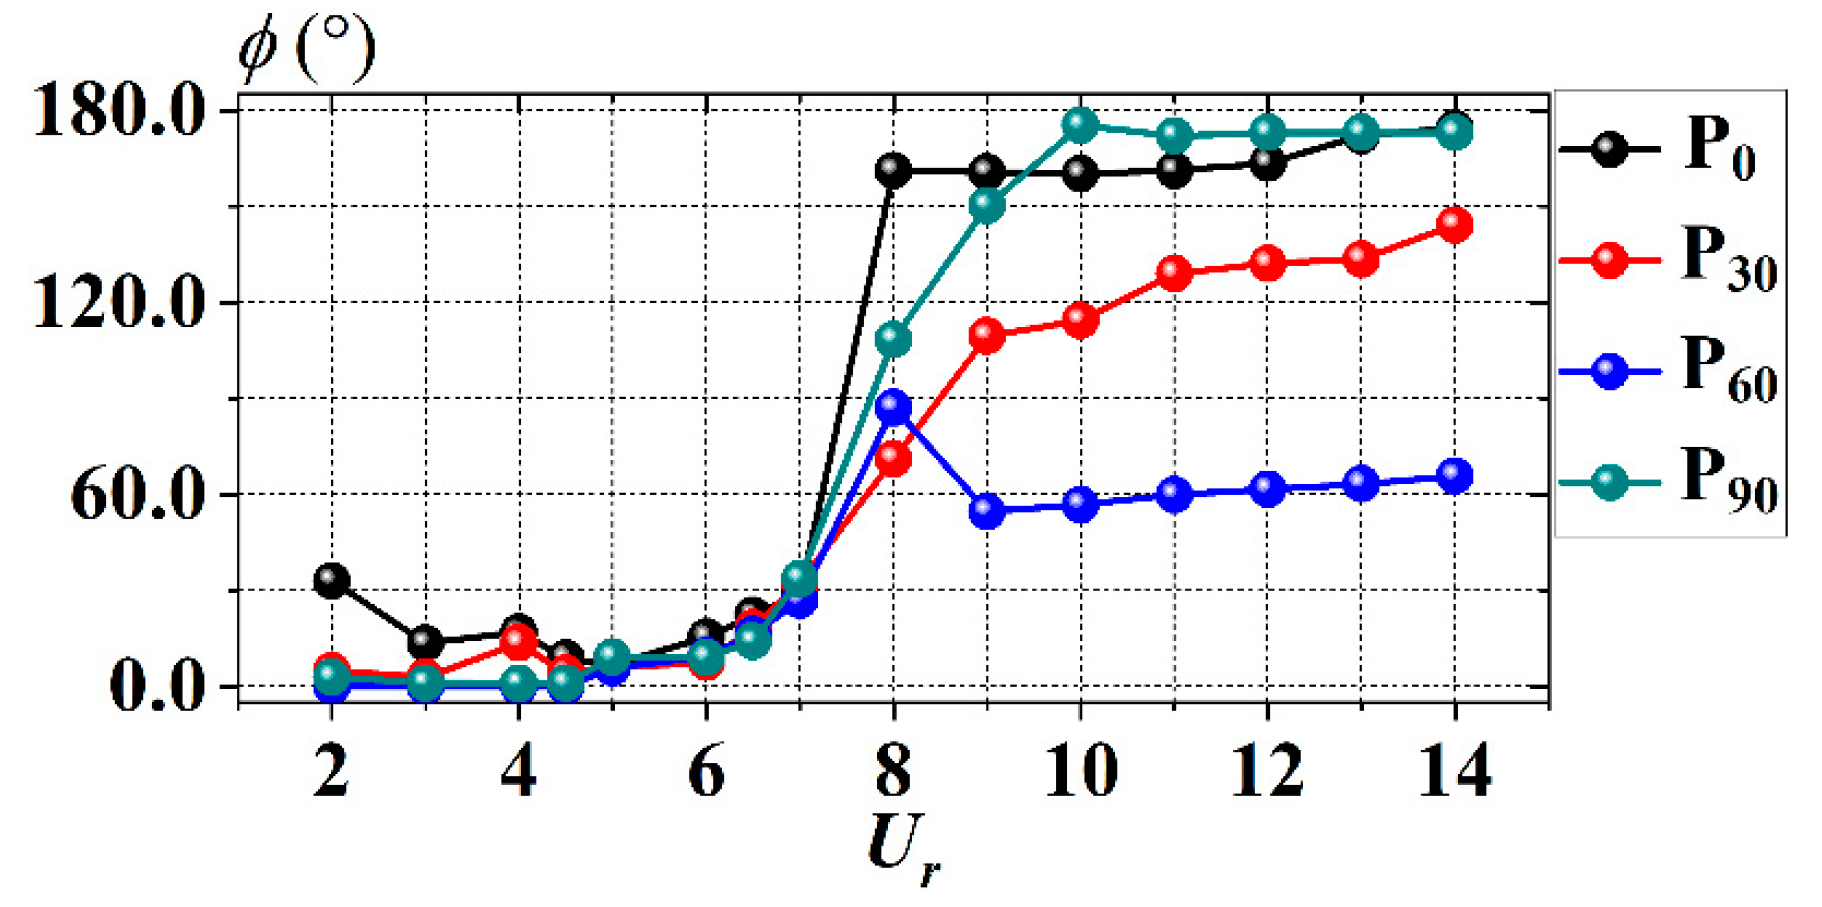
Based on the above analysis, it can be seen that the phase difference between the potential-force coefficient Cpotential (t) and the vortex-force coefficient Cvortex (t) has a very important impact on the VIV response. The phase differences of P0, P30, P60, and P90 between the vortex-force coefficient Cvortex (t) and the potential-force coefficient Cpotential (t) are defined as φ. The relationships between the phase difference and the reduced velocity for P0, P30, P60, and P90 are shown in Figure 15. In the initial branch, the phase differences of P0, P30, P60, and P90 are both less than 30°, and the vortex-force coefficient Cvortex (t) is the main source of the lift coefficient Cy (t), and Cy (t) ≈ Cvortex (t). The potential-force coefficient Cpotential (t) is small and the vortex patterns are 2S modes for P0. In the upper branch, the phase angle φ begins to rapidly increase, and the potential-force coefficient Cpotential (t) is also starting to increase. The phase angles of P0, P30, P60, and P90 increase to 175°, 150°, 110°, and 90°, respectively. In the lower branch, the phase angle is relatively stable, and the vortex-force coefficient Cvortex (t) and the potential-force coefficient Cpotential (t) are relatively high. But because the phase angle approaches 180°, the lift coefficient Cy (t) actually decreases. In the desynchronization branch, the phase angle is relatively stable, and the potential-force coefficient Cpotential (t) are relatively low. The vortex-force coefficient Cvortex (t) is the main source of the lift coefficient Cy (t), and Cy (t) ≈ Cvortex (t). The phase angle of P30 is still steadily increasing, and the VIV response of P30 is still in an unstable state. The phase angles of P0 and P90 are close to 180°, and the VIV responses are similar. The phase angle of P60 is stable at 60°, and the VIV response is effectively suppressed. From the above analysis, it can be seen that the changes in phase angle, vortex-force coefficient, and potential-force coefficient have a very important impact on the VIV response.
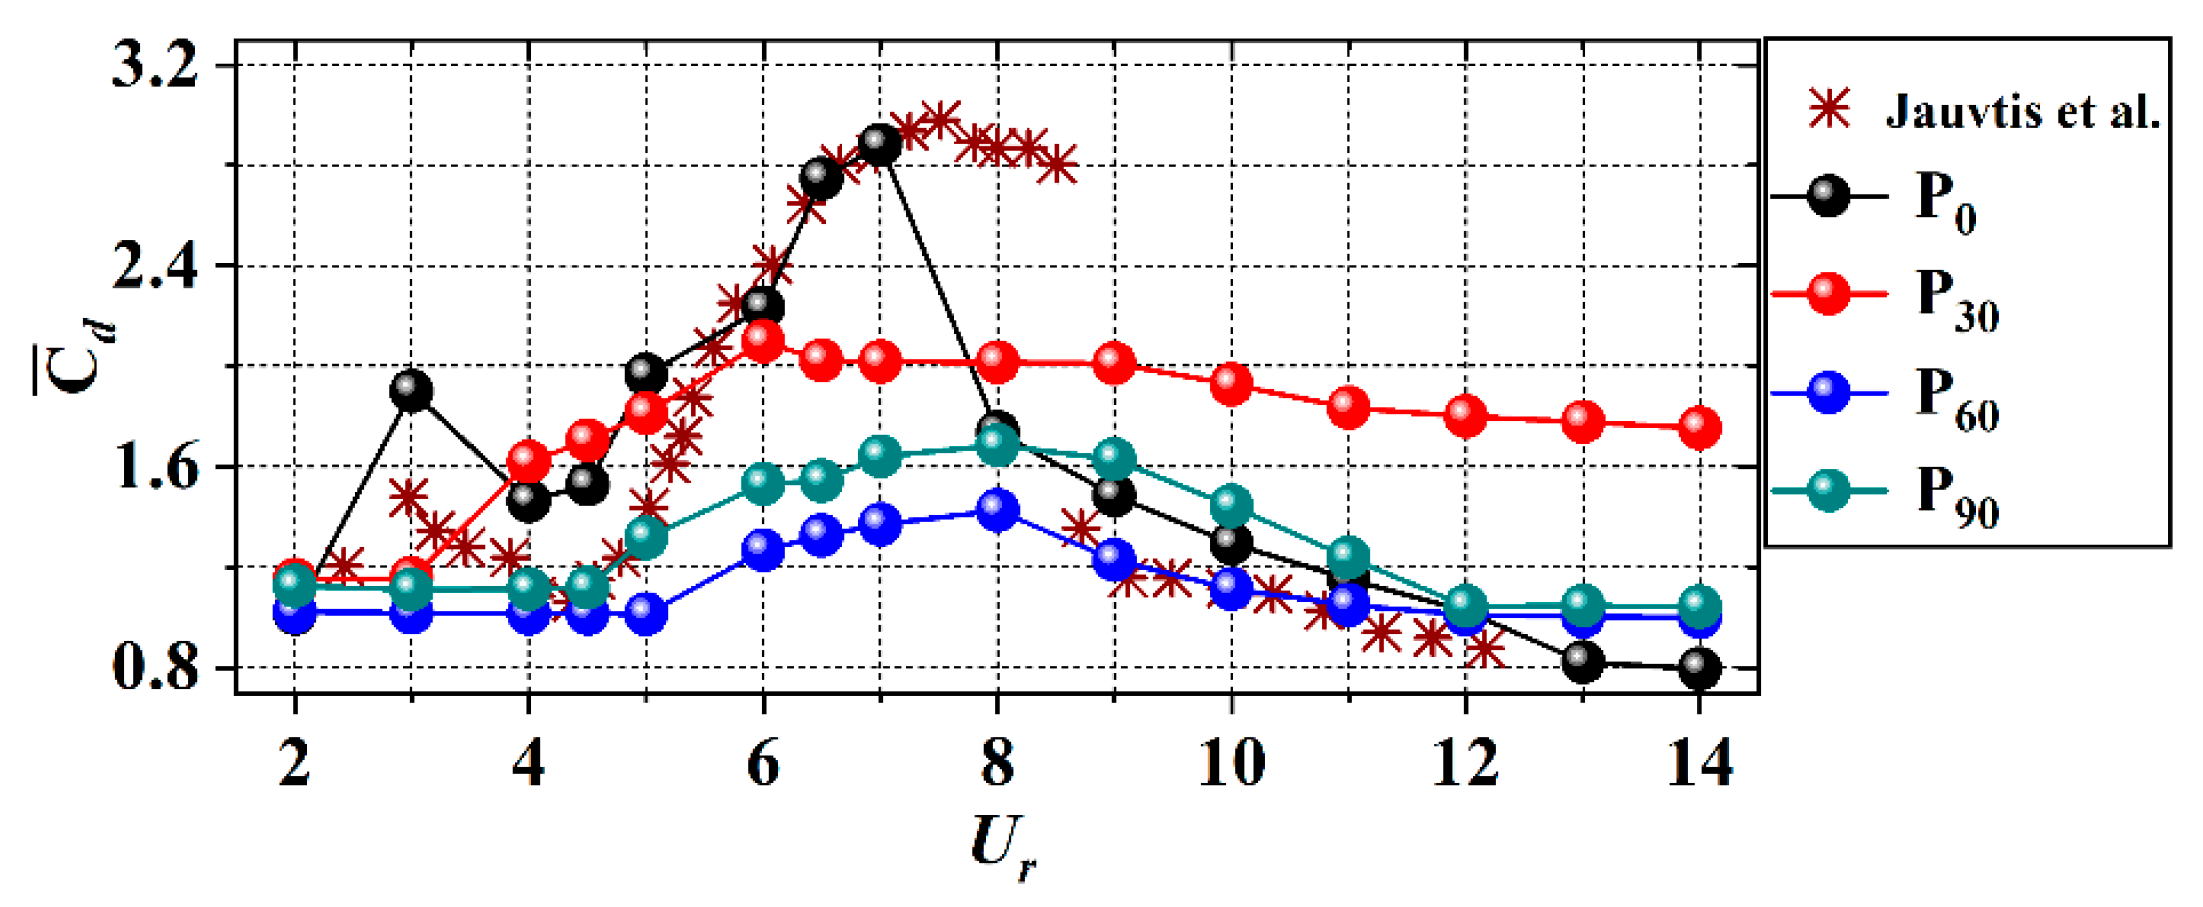
Figure 16 shows the relationship between the mean-drag coefficients and reduced velocity for P0, P30, P60, and P90. In the initial branch, there is a trend of increasing first and then decreasing for P0, and it slowly increases for P30. The mean-drag coefficients are relatively stable for P60 and P90. In the upper branch, the mean-drag coefficient of P0, P30, P60, and P90 start rapidly increasing. The peaks of mean-drag coefficients are 3.0, 2.1, 1.4, and 1.7 for P0, P30, P60, and P90, respectively. It has been decreased by 53.33% for P60. In the lower branch, the mean-drag coefficients slowly decrease for P0, P30, P60, and P90. In the desynchronization branch, the mean-drag coefficients gradually stabilize. The relationship between the mean-drag coefficients is C d ¯ (P30) > C d ¯ (P90) > C d ¯ (P60) > C d ¯ (P0).

4.3. Wake Flow

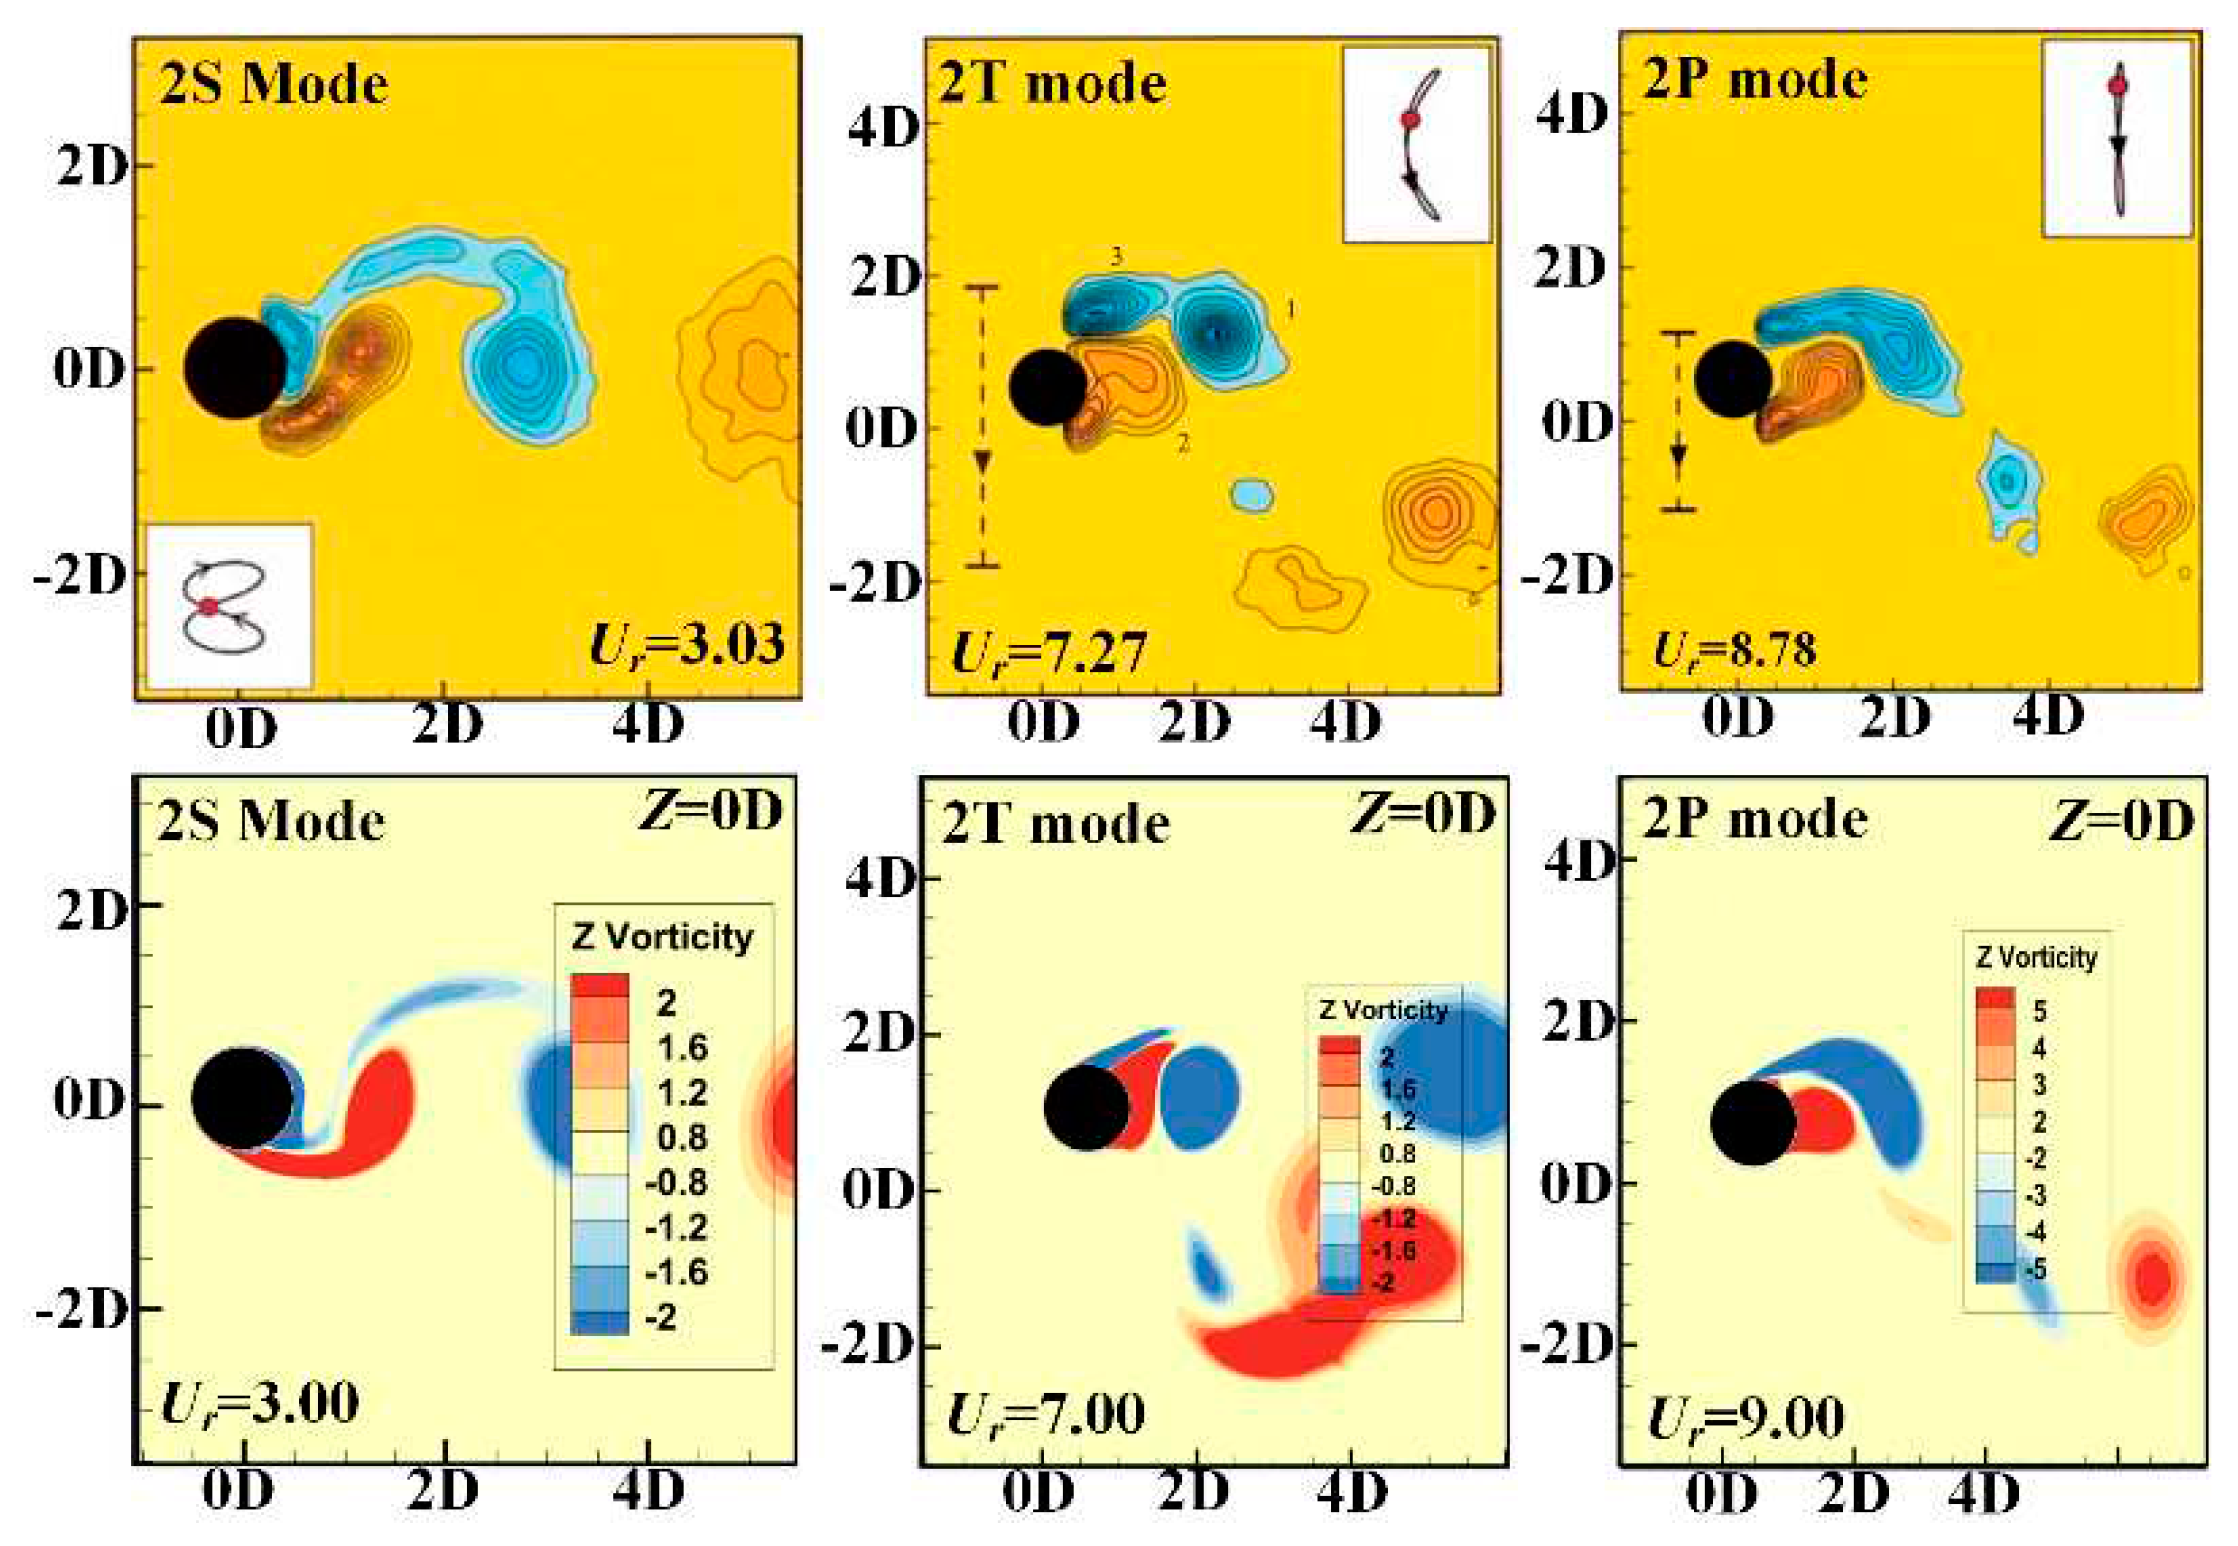
The comparisons of vortex patterns under different reduced velocity conditions are shown in Figure 17. The vortex patterns described by the numerical model in this paper can well match the vortex patterns captured in PIV experiments30. When Ur ≈ 3.0, the vortex pattern is 2S mode for P0, and the VIV response is at the initial branch. When Ur ≈ 7.0, the vortex pattern is 2T mode for P0 (During the half cycle of VIV response, there are there vortices shedding), and the VIV response is at the upper branch. The unique vortex mode that can only be observed when the transverse amplitude ratio is close to 1.5 in 2-DOF VIV response. When Ur ≈ 9.0, the vortex pattern is 2P mode for P0, and the VIV response is at the lower branch.
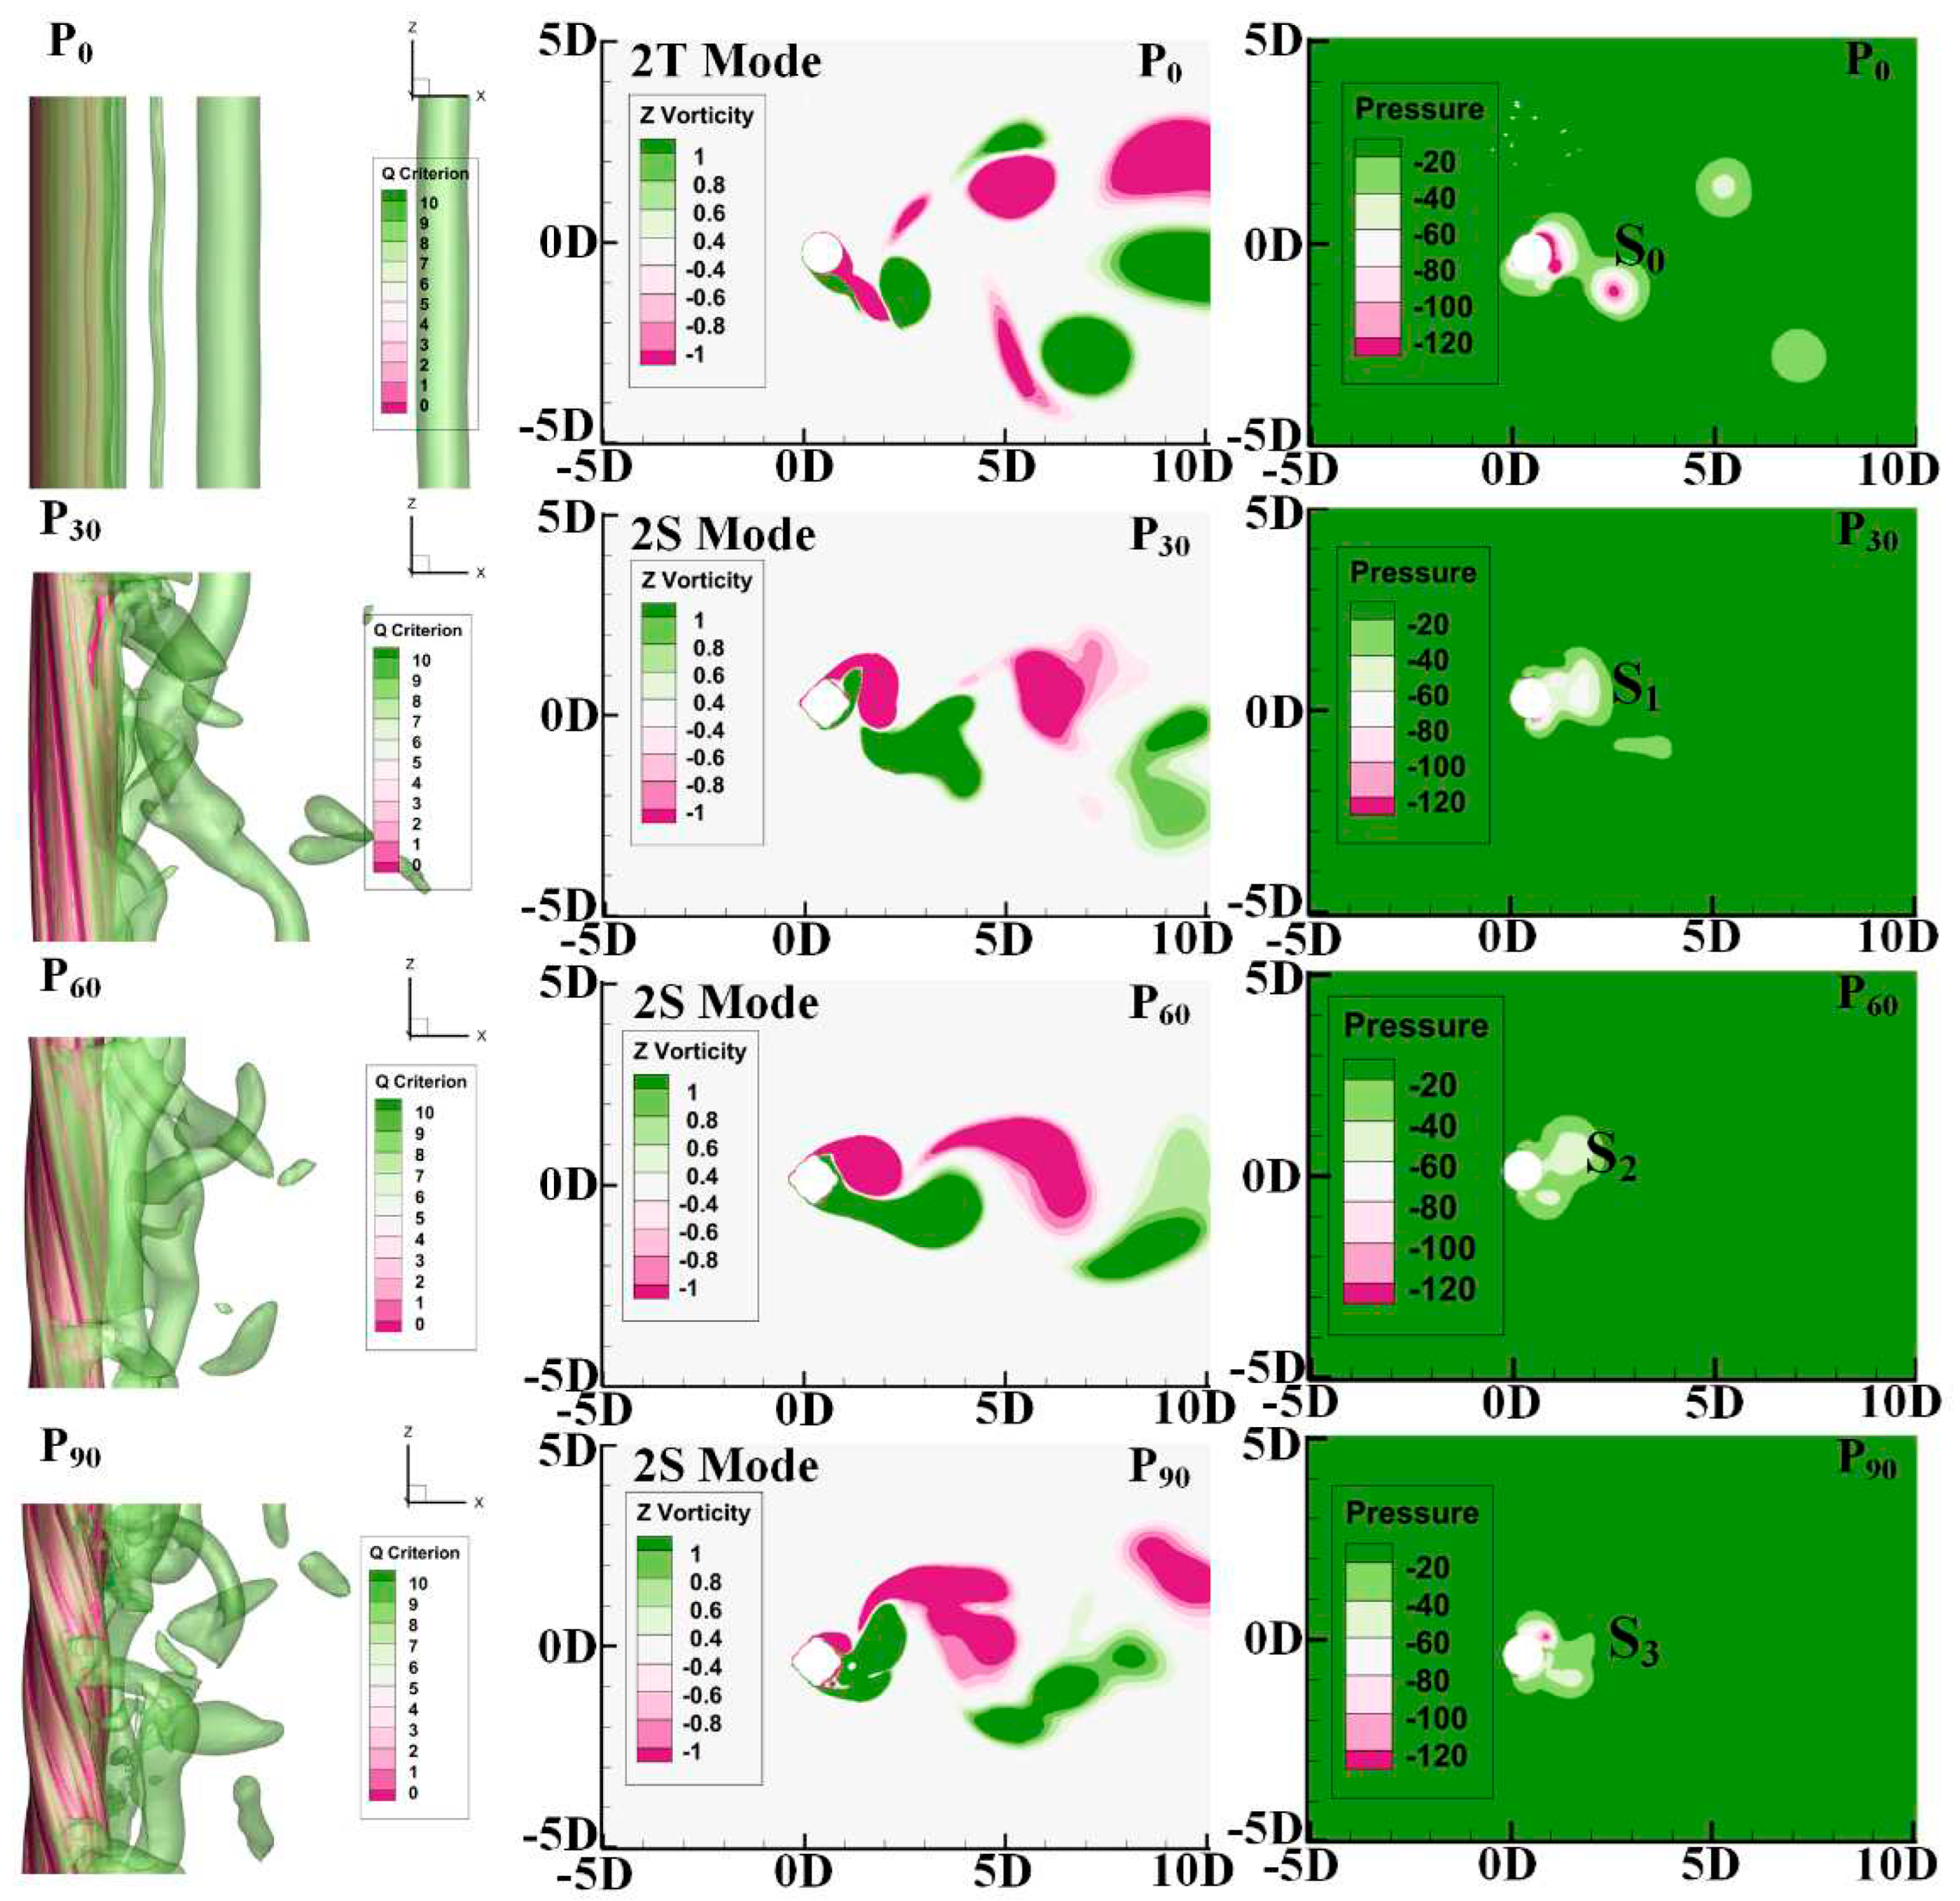
Figure 18 shows the wake flow field near the wall of the Terebridae-inspired cylinder when Ur=7.0. Compared with the Q-criterion vortex of P0, the Q-criterion vortices of P30, P60, and P90 are destroyed, with irregular vortices shedding. The vortex pattern of P0 is 2T mode, and the vortex patterns of P30, P60, and P90 are is closer to the 2S modes. At the same time, it is found that the boundary layer separation occurs at the Terebridae-inspired ribs. The twisted ribs cause the separation point to constantly change along the z direction, resulting in the development of the boundary layer separation being completely destroyed along the spanwise direction. From the pressure nephogram, it can be seen that the vortices that alternately shed from the cylinder wall will form a negative pressure area behind the cylinder. It is obvious that the relationship between intensity of pressure is |S2| < |S3| < |S1| < |S0|.

5. Conclusions

Inspired by the Terebridae structure, this paper provides a structural form for suppressing vortex-induced vibration (VIV) response. Four different structural forms are shown, including the traditional smooth cylinder (P0), the Terebridae-inspired cylinder with a helical angle of 30° (P30), the Terebridae-inspired cylinder with a helical angle of 60° (P60), and the Terebridae-inspired cylinder with a helical angle of 90° (P90). The following conclusion can be obtained:
(1) The VIV response is described by four branches. The peak of transverse-amplitude ratio (Ay/D) of P0 is 1.50 at Ur=7.0, and the peak of downstream amplitude ratio (Ax/D) is 0.35. When Ur=6.5, the maximum transverse amplitude ratio (Ay/D) of P30, P60, and P90 are 0.82, 0.26, and 0.44, respectively. Compared with the peak of transverse-amplitude ratio (Ay/D) of P0, they are reduced by 45.33%, 82.67%, and 70.67% for P30, P60, and P90, respectively. When Ur=7.5, the maximum downstream amplitude ratios (Ax/D) of P60 is 0.03. And it is 0.06 for P90 when Ur=8.0. Compared with the maximum downstream amplitude ratios (Ax/D) of P0, they are reduced by 91.43%, and 82.86% for P60 and P90, respectively. For P60 and P90, the VIV responses are effectively suppressed. This phenomenon indicates that when the helical angle exceeds a certain angle, the Terebridae-inspired ribs can effectively suppress VIV response.
(2) The phase differences of P0, P30, P60, and P90 between the vortex-force coefficient Cvortex (t) and the potential-force coefficient Cpotential (t) are defined as φ. In the initial branch, the phase differences of P0, P30, P60, and P90 are both less than 30°, and the vortex-force coefficient Cvortex (t) is the main source of the lift coefficient Cy (t), and Cy (t) ≈ Cvortex (t). In the upper branch, the phase angle φ begins to rapidly increase, and the potential-force coefficient Cpotential (t) is also starting to increase. The phase angles of P0, P30, P60, and P90 increase to 175°, 150°, 110°, and 90°, respectively. In the lower branch, the phase angle is relatively stable, and the vortex-force coefficient Cvortex (t) and the potential-force coefficient Cpotential (t) are relatively high. In the desynchronization branch, the phase angle is relatively stable, and the potential-force coefficient Cpotential (t) are relatively low. The lift coefficient Cy (t) mainly depends on the vortex-force coefficient Cvortex (t), and Cy (t) ≈ Cvortex (t). The phase angle of P30 is still steadily increasing, and the VIV response of P30 is still in an unstable state. The phase angles of P0 and P90 are close to 180°, and the VIV responses are similar. The phase angle of P60 is stable at 60°, and the VIV response is effectively suppressed.
(3) The peaks of mean-drag coefficients of P0, P30, P60, and P90 are 3.0, 2.1, 1.4, and 1.7, respectively. It has been reduced by 53.33% for P60 compared with that of P0. In the desynchronization branch, the mean-drag coefficients gradually stabilize. The relationship between the mean-drag coefficients is C d ¯ (P30) > C d ¯ (P90) > C d ¯ (P60) > C d ¯ (P0) for P0, P30, P60, and P90.
(4) Compared with the Q-criterion vortex of P0, the Q-criterion vortices of P30, P60, and P90 are destroyed, with irregular vortices shedding. It is found that the boundary layer separation is located at the Terebridae-inspired ribs. The twisted ribs cause the separation point to constantly change along the z direction, resulting in the development of the boundary layer separation being completely destroyed along the spanwise direction. From the pressure nephogram, it can be seen that the vortices that alternately shed from the cylinder wall will form a negative pressure area behind the cylinder. It is obvious that the relationship between intensity of pressure is |S2| < |S3| < |S1| < |S0|.

Data Availability Statement

The data that support the findings of this study are available from the corresponding author upon reasonable request.

Acknowledgments

This research is supported by the Joint Postdoc Scheme with Non-local Institutions of The Hong Kong Polytechnic University (Grant No.1-YY4P).

References

  1. Rashidi S., Hayatdavoodi M., and Esfahani J.A., “Vortex shedding suppression and wake control: A review”, Ocean Eng. 126, 57-80 (2016). [CrossRef]
  2. Wang W., and Zhao F.W., “Numerical investigation on flow-induced vibration response of the cylinder inspired by the honeycomb”, Ocean Eng. 268, 113461 (2023).
  3. Irawan Y.H., Raza S.A., and Chern M.J., “Passively enhanced VIV responses of side-by-side cylinders at moderate Reynolds number”, Appl Ocean Res. 138, 103668 (2023). [CrossRef]
  4. Liu H., Han X., Williams J.J.R., Xie R.Y., and Lin P.Z., “3D numerical study of splitter Plate’s effect on a flexible cylinder VIV”, Appl Ocean Res. 269, 113397 (2023).
  5. Tang T., Zhu H.J., Song J.Z., Ma B.W., and Zhou T.M., “The state-of-the-art review on the wake alteration of a rotating cylinder and the associated interaction with flow-induced vibration”, Ocean Eng. 254, 111340 (2022).
  6. Liu G.J., Li H.Y., Qiu Z.Z., Leng D.X., Li Z.X., and Li W.H., “A mini review of recent progress on vortex-induced vibrations of marine risers”, Ocean Eng. 195, 106704 (2020).
  7. Chen W.L., Huang Y.W., Chen C.L., Yu H.Y., and Gao D.L., “Review of active control of circular cylinder flow”, Ocean Eng. 258, 111840 (2022).
  8. Hong K.S., and Shah U.H., “Vortex-induced vibrations and control of marine risers: A review”, Ocean Eng. 152, 300-315 (2018).
  9. Zhao M., “A review of recent studies on the control of vortex-induced vibration of circular cylinders”, Ocean Eng. 285, 115389 (2023). [CrossRef]
  10. Rabiee A.H., Barzan M.R., and Mohammadebrahim A., “Flow-induced vibration suppression of elastic square cylinder using windward-suction-leeward-blowing approach”, Appl Ocean Res. 109, 102552 (2021). [CrossRef]
  11. Ding L., Kong H., Zou Q.F., Wang J.L., and Zhang L., “2-DOF vortex-induced vibration of rotating circular cylinder in shear flow”, Ocean Eng. 249, 111003 (2022).
  12. Vicente-Ludlam D., Barrero-Gil A., and Velazquez A., “Flow-Induced Vibration of a rotating circular cylinder using position and velocity feedback”, J. Fluids Struct. 72, 127-151 (2017). [CrossRef]
  13. Zhu H.J., and Gao Y., “Vortex-induced vibration suppression of a main circular cylinder with two rotating control rods in its near wake: Effect of the rotation direction”, J. Fluids Struct. 74, 469-491 (2017).
  14. Wan H., and Patnaik S.S., “Suppression of vortex-induced vibration of a circular cylinder using thermal effects”, Phys. Fluids 28, 123603 (2017).
  15. Garg H., Soti A.K., and Bhardwaj R., “Vortex-induced vibration of a cooled circular cylinder”, Phys. Fluids 31, 083608 (2019).
  16. Hebrero F.C., D’Adamo J., Sosa R., and Artana G., “Vortex induced vibrations suppression for a cylinder with plasma actuators”, J. Sound Vib. 468, 115121 (2020). [CrossRef]
  17. Zheng C.D., Ji T.W., Xie F.F., Zhang X.S., Zheng H.Y., and Zheng Y., “From active learning to deep reinforcement learning: Intelligent active flow control in suppressing vortex-induced vibration”, Phys. Fluids 33, 063607 (2021).
  18. Chen W.J., Wang Q.L., Yan L., Hu G., and Noack B.R., “Deep reinforcement learning-based active flow control of vortex-induced vibration of a square cylinder”, Phys. Fluids 35, 053610 (2023).
  19. Cui G.P., and Feng L.H., “Combined effect of bending stiffness and streamwise length of the attached flexible splitter plate on the vortex-induced vibration of a circular cylinder”, Exp. Therm. Fluid Sci. 141, 110787 (2023).
  20. Song Z.H., Yang X., Li T., Shen Y.J., Duan M.L., “Numerical investigation on VIV of a circular cylinder with multiple small control rods”, Appl Ocean Res. 139, 103690 (2023).
  21. Ishihara T., and Li T., “Numerical study on suppression of vortex-induced vibration of circular cylinder by helical wires”, J. Wind Eng. Ind. Aerod. 197, 104081 (2020).
  22. Yuan W.Y., Laima S.J., Gao D.L., Chen W.L., and Li H., “Influence of porous media coatings on flow characteristics and vortex-induced vibration of circular cylinders”, J. Fluids Struct. 106, 103365 (2021).
  23. Gao Y., Zong Z., Zou L., Takagi S., and Jiang Z.Y., “Effect of surface roughness on vortex-induced vibration response of a circular cylinder”, Mar. Struct. 57, 165-179 (2018).
  24. Gao Y., Yang J.D., Xiong Y.M., Wang M.H., and Peng G., “Experimental investigation of the effects of the coverage of helical strakes on the vortex-induced vibration response of a flexible riser”, Appl Ocean Res. 59, 53-64 (2016).
  25. Zheng H.X., and Wang J.S., “Flow-induced vibration of flexible cylinders covered by fixed fairings with different chord-thickness ratios”, Mar. Struct. 86, 103299 (2022).
  26. Li Z.F., Song G.M., and Chen Y.L., “Experimental study on bird-wing-shaped suppression device for vortex-induced vibration of deep water risers”, Ocean Eng. 213, 107669 (2020).
  27. Wang W., Song B.W., Mao Z.Y., Tian W.L., and Zhang T.Y., “Numerical investigation on VIV suppression of the cylinder with the bionic surface inspired by giant cactus,” Ocean Eng. 214, 107775 (2020).
  28. Wang W., Mao Z.Y., Song B.W., and Han P., “Numerical investigation on vortex-induced vibration suppression of the cactus-inspired cylinder with some ribs,” Phys. Fluids 33, 037127 (2021).
  29. Nikoo H.M., Bi K.M., and Hao H., “Effectiveness of using pipe-in-pipe (PIP) concept to reduce vortex-induced vibrations (VIV): Three-dimensional two-way FSI analysis” Ocean Eng. 148, 263-276 (2018).
  30. Jauvtis N., and Williamson C.H.K., “The effect of two degrees of freedom on vortex-induced vibration at low mass and damping,” J. Fluid Mech. 509, 23-62 (2004).
  31. Kang Z., Zhang C., Chang R., and Ma G., “A numerical investigation of the effects of Reynolds number on vortex-induced vibration of the cylinders with different mass ratios and frequency ratios,” Int. J. Nav. Arch. Ocean 11, 835-850 (2019).
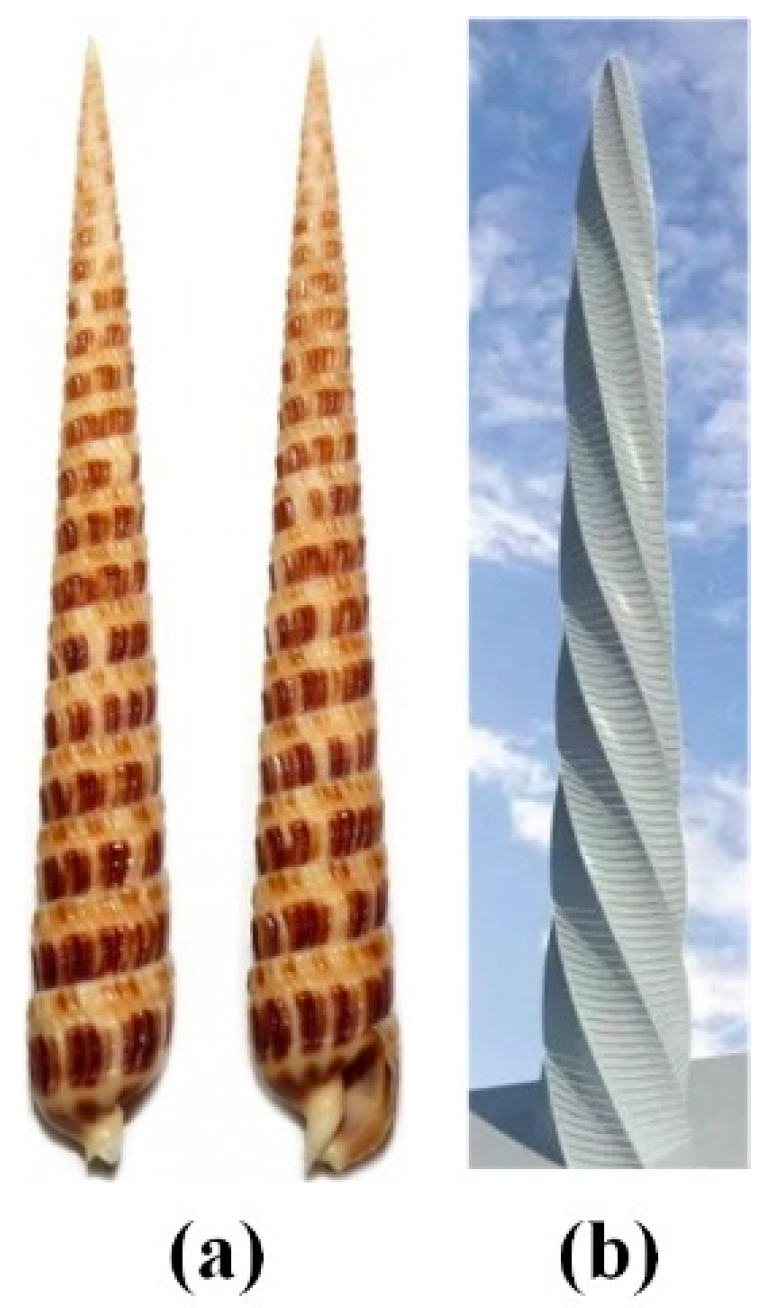
Figure 1. (a) Terebridae; (b) the building inspired by Terebridae.
Preprints 95342 g001
Figure 2. The calculation domain.
Preprints 95342 g002
Figure 3. The shapes of the Terebridae-inspired cylinder (a) P30; (b) P60; (c) P90.
Preprints 95342 g003
Figure 4. Grid: (a) grid (x-y plane); (b) grid (x-z plane).
Preprints 95342 g004
Figure 5. Model validation: (a) Ay/D, (b) Ax/D, and (c)fs/fn.
Preprints 95342 g005
Figure 6. The VIV responses for P0, P30, P60, and P90.
Preprints 95342 g006
Figure 7. The time histories variation of VIV responses at Ur=2.0 (Re=0.8×10⁴).
Preprints 95342 g007
Figure 8. Different forces, Q-criterion vortex, and vortex patterns at Ur=2.0 (Re=0.8×10⁴).
Preprints 95342 g008
Figure 9. The time histories variation of VIV responses at Ur=6.0 (Re=2.4×10⁴).
Preprints 95342 g009
Figure 10. Different forces, Q-criterion vortex, and vortex patterns at Ur=6.0 (Re=2.4×10⁴).
Preprints 95342 g010
Figure 11. The time histories variation of VIV responses at Ur=10.0 (Re=4.0×10⁴).
Preprints 95342 g011
Figure 12. Different forces, Q-criterion vortex, and vortex patterns at Ur=10.0 (Re=4.0×10⁴).
Preprints 95342 g012
Figure 13. The time histories variation of VIV responses at Ur=14.0 (Re=5.6×10⁴).
Preprints 95342 g013
Figure 14. Different forces, Q-criterion vortex, and vortex patterns at Ur=14.0 (Re=5.6×10⁴).
Preprints 95342 g014
Figure 15. The relationships between the phase difference and the reduced velocity for P0, P30, P60, and P90.
Preprints 95342 g015
Figure 16. The relationship between the mean-drag coefficients and reduced velocity for P0, P30, P60, and P90.
Preprints 95342 g016
Figure 17. The comparisons of vortex patterns under different reduced velocity conditions.
Preprints 95342 g017
Figure 18. Wake flow near the wall for P0, P30, P60, and P90 (Ur=7.0).
Preprints 95342 g018
Table 1. The setting of VIV system.
Description Symbol Value
Mass-ratio m* 2.6
Length of the cylinder L (m) 0.5
Damping-ratio ξ 0
Diameter of the cylinder D (m) 0.1
Natural frequency in water fn (Hz) 0.4
Table 2. Grid independence verification.
Mesh Elements Ay/D fs/fn
Mesh-1 0.45×10⁶ 0.2489 0.9989
Mesh-2 0.90×10⁶ 0.2207 (11.33%) 0.9091 (8.99%)
Mesh-3 1.80×10⁶ 0.2116 (4.11%) 0.8798 (3.22%)
Mesh-4 3.60×10⁶ 0.2009 (0.97%) 0.8723 (0.85%)
Mesh-5 7.20×10⁶ 0.2003 (0.28%) 0.8698 (0.29%)
Table 3. Differences in different models.
Model m* D fn ξ Re
Jauvtis et al.30 2.6 0.0381 0.4 0.005 1450~10200
Kang et al.31 2.6 0.1143 0.4 0.005 13050~91800
Gao et al.23 2.6 0.0381 0.24~1.72 0 5000
Present 2.6 0.1000 0.4 0 8000~56000
Disclaimer/Publisher’s Note: The statements, opinions and data contained in all publications are solely those of the individual author(s) and contributor(s) and not of MDPI and/or the editor(s). MDPI and/or the editor(s) disclaim responsibility for any injury to people or property resulting from any ideas, methods, instructions or products referred to in the content.
Copyright: This open access article is published under a Creative Commons CC BY 4.0 license, which permit the free download, distribution, and reuse, provided that the author and preprint are cited in any reuse.
Prerpints.org logo

Preprints.org is a free preprint server supported by MDPI in Basel, Switzerland.

Subscribe

© 2024 MDPI (Basel, Switzerland) unless otherwise stated