Submitted:
29 December 2023
Posted:
04 January 2024
You are already at the latest version
Abstract
Keywords:
1. Introduction
2. Materials and Methods
2.1. Predictive Model of Water and Nutrients Uptake
2.1.1. Water Uptake Submodel
2.1.2. Nutrient Concentration Submodel
2.2. Modelling Process
2.3. Location, Climatic Conditions, and Time Experiment
2.4. Plant Material
2.5. Experimental Design and Vertical Crop Set-Up
2.5.1. Experimental Design 1 (ED1)
2.5.2. Experimental Design 2 (ED2)
2.6. Management of Fertigation System
2.7. Response Variables
2.8. Statistical Analysis
3. Results and Discussion
3.1. Statistical Performance of the Predictive Model
3.2. Water Uptake and Cation Concentrations
3.2.1. Water Uptake
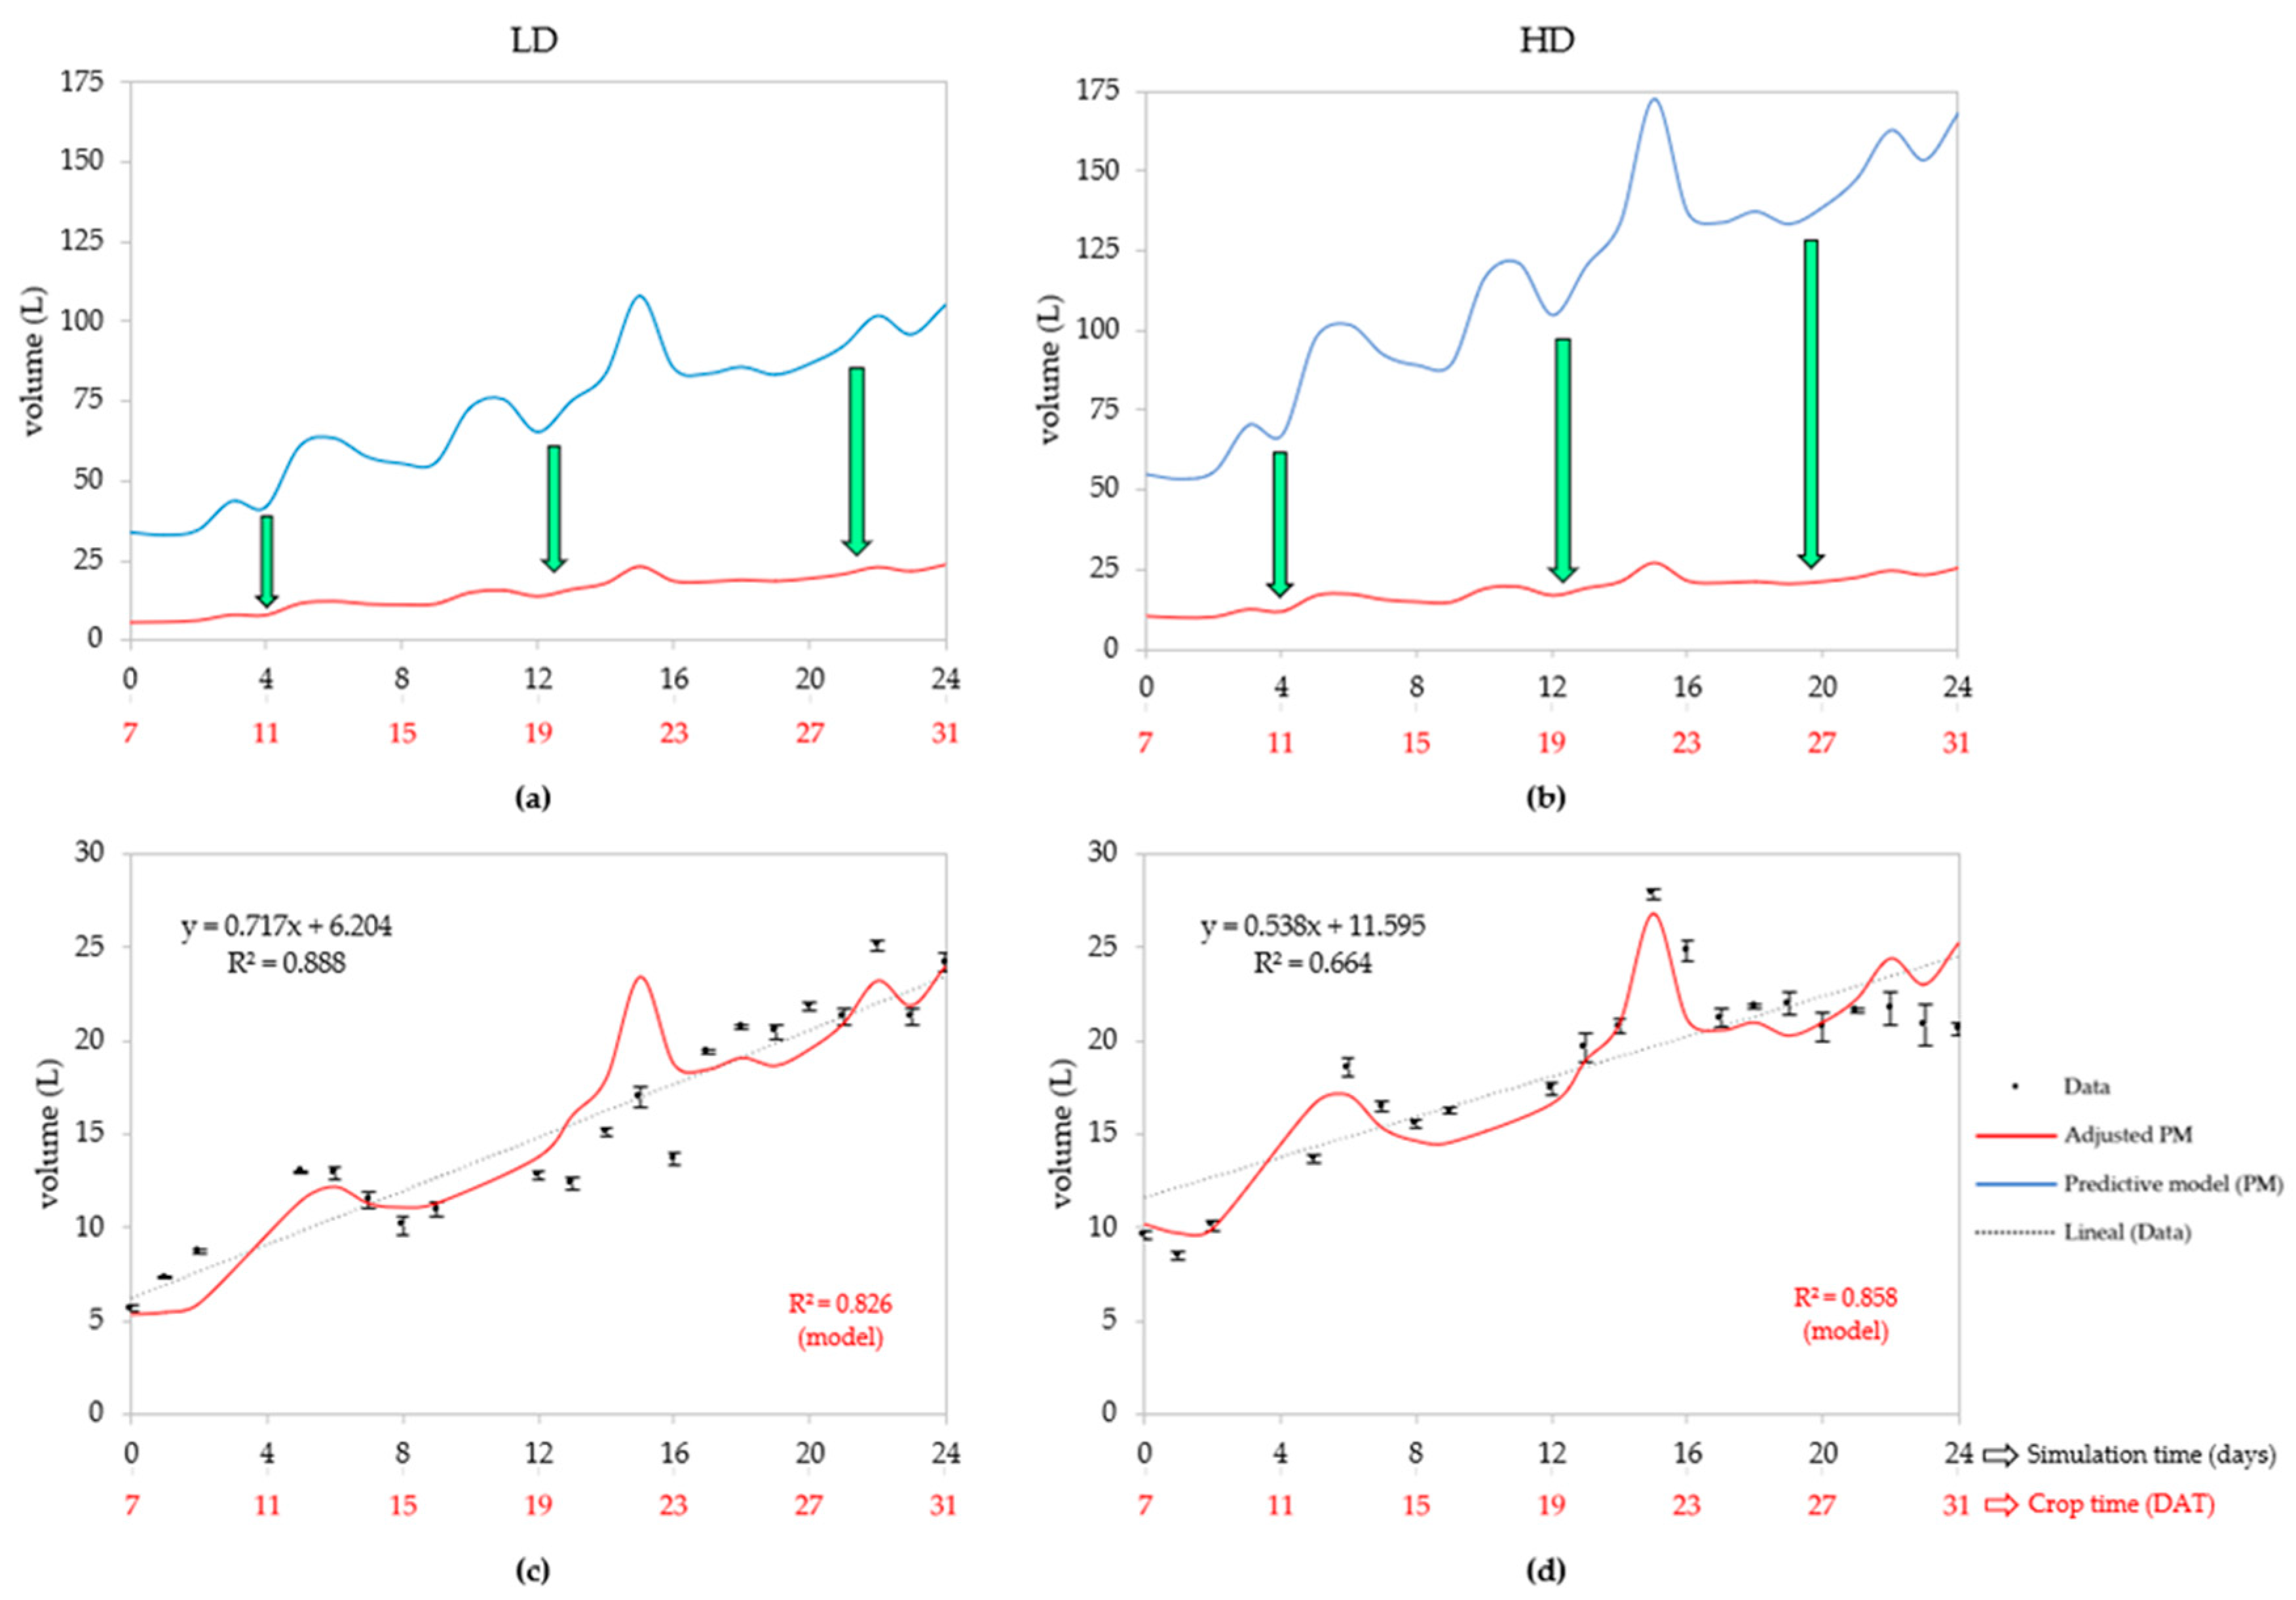
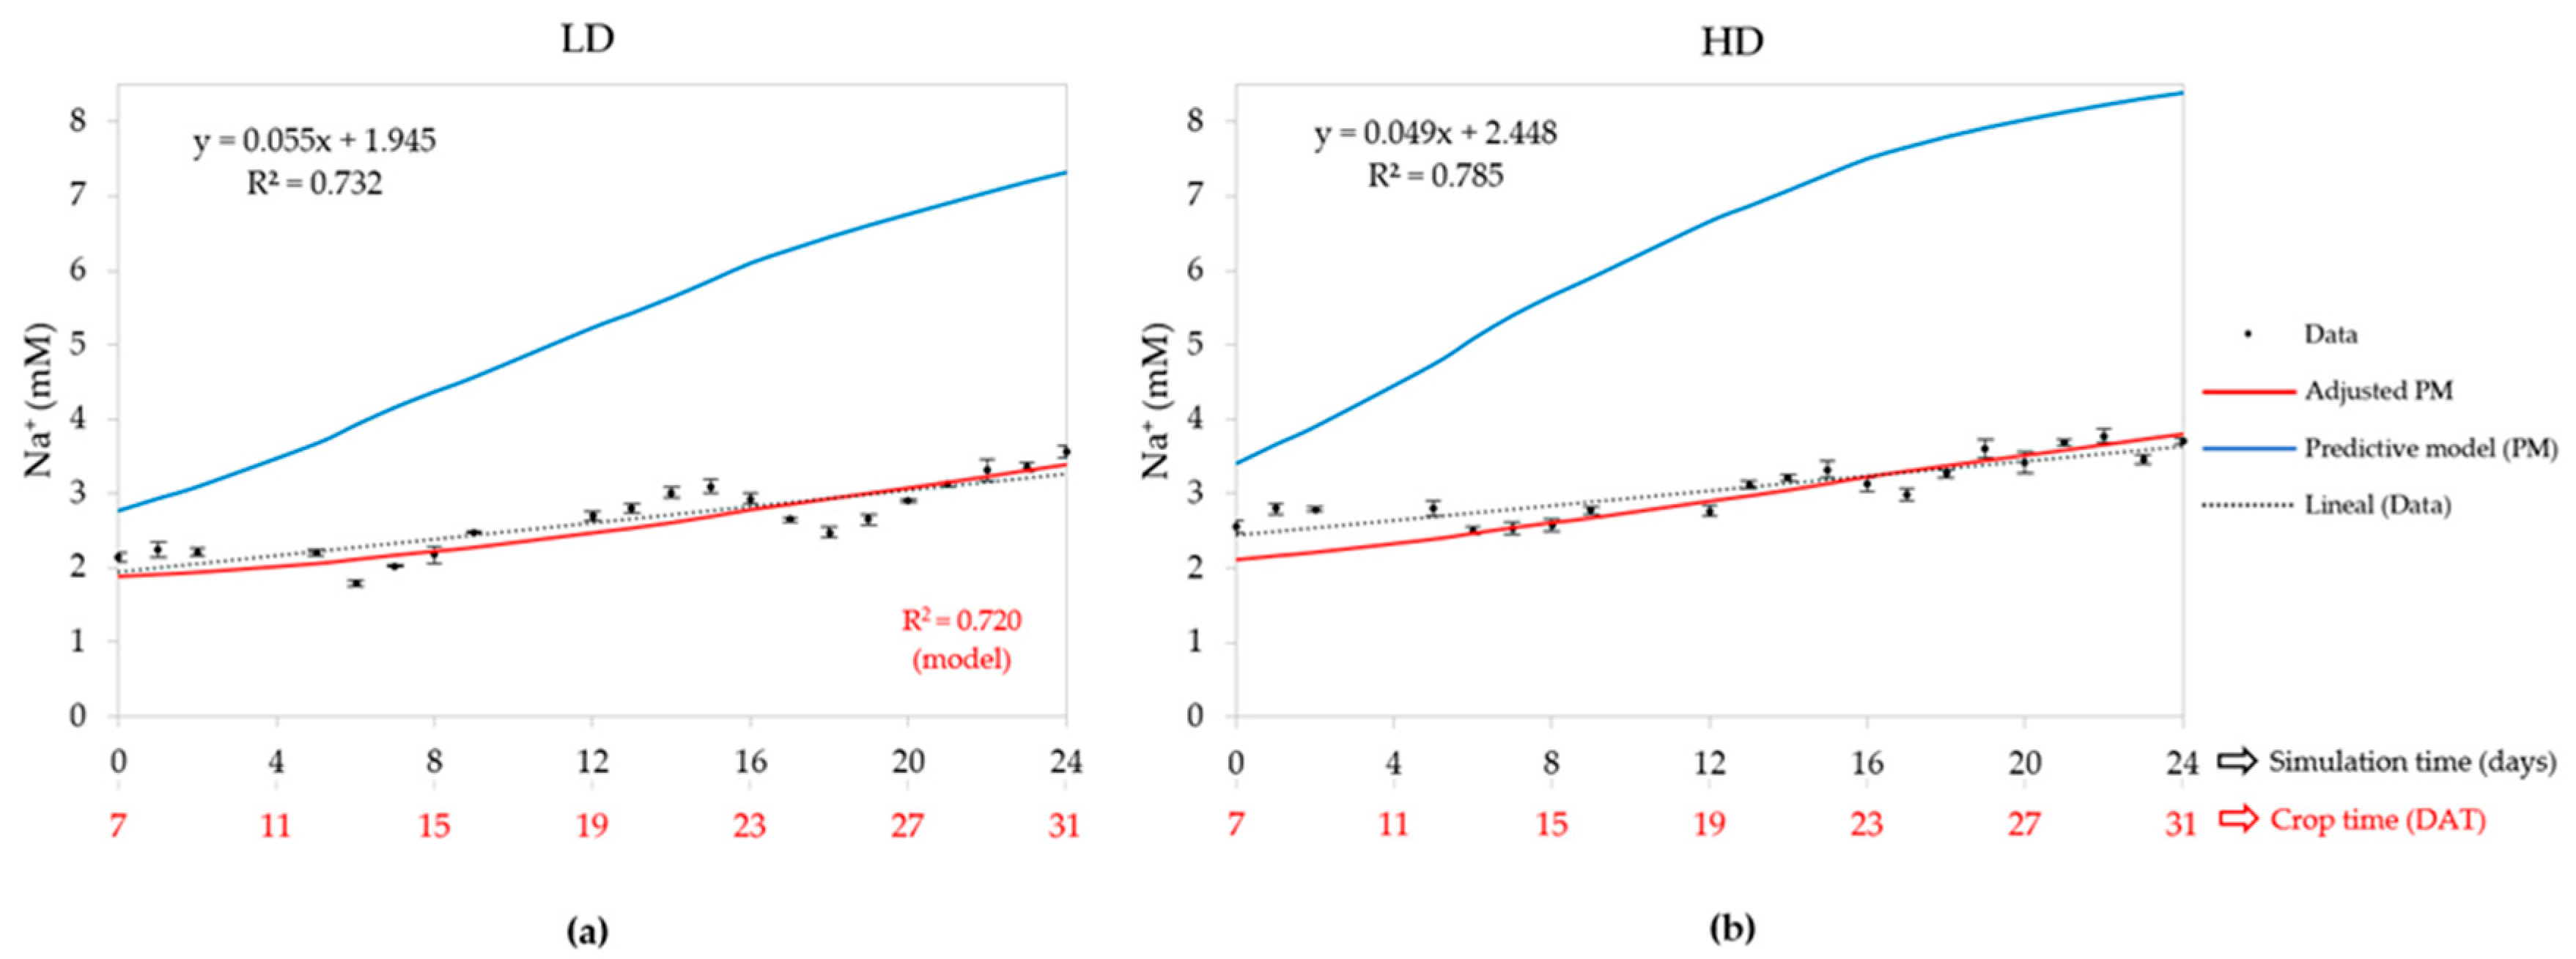
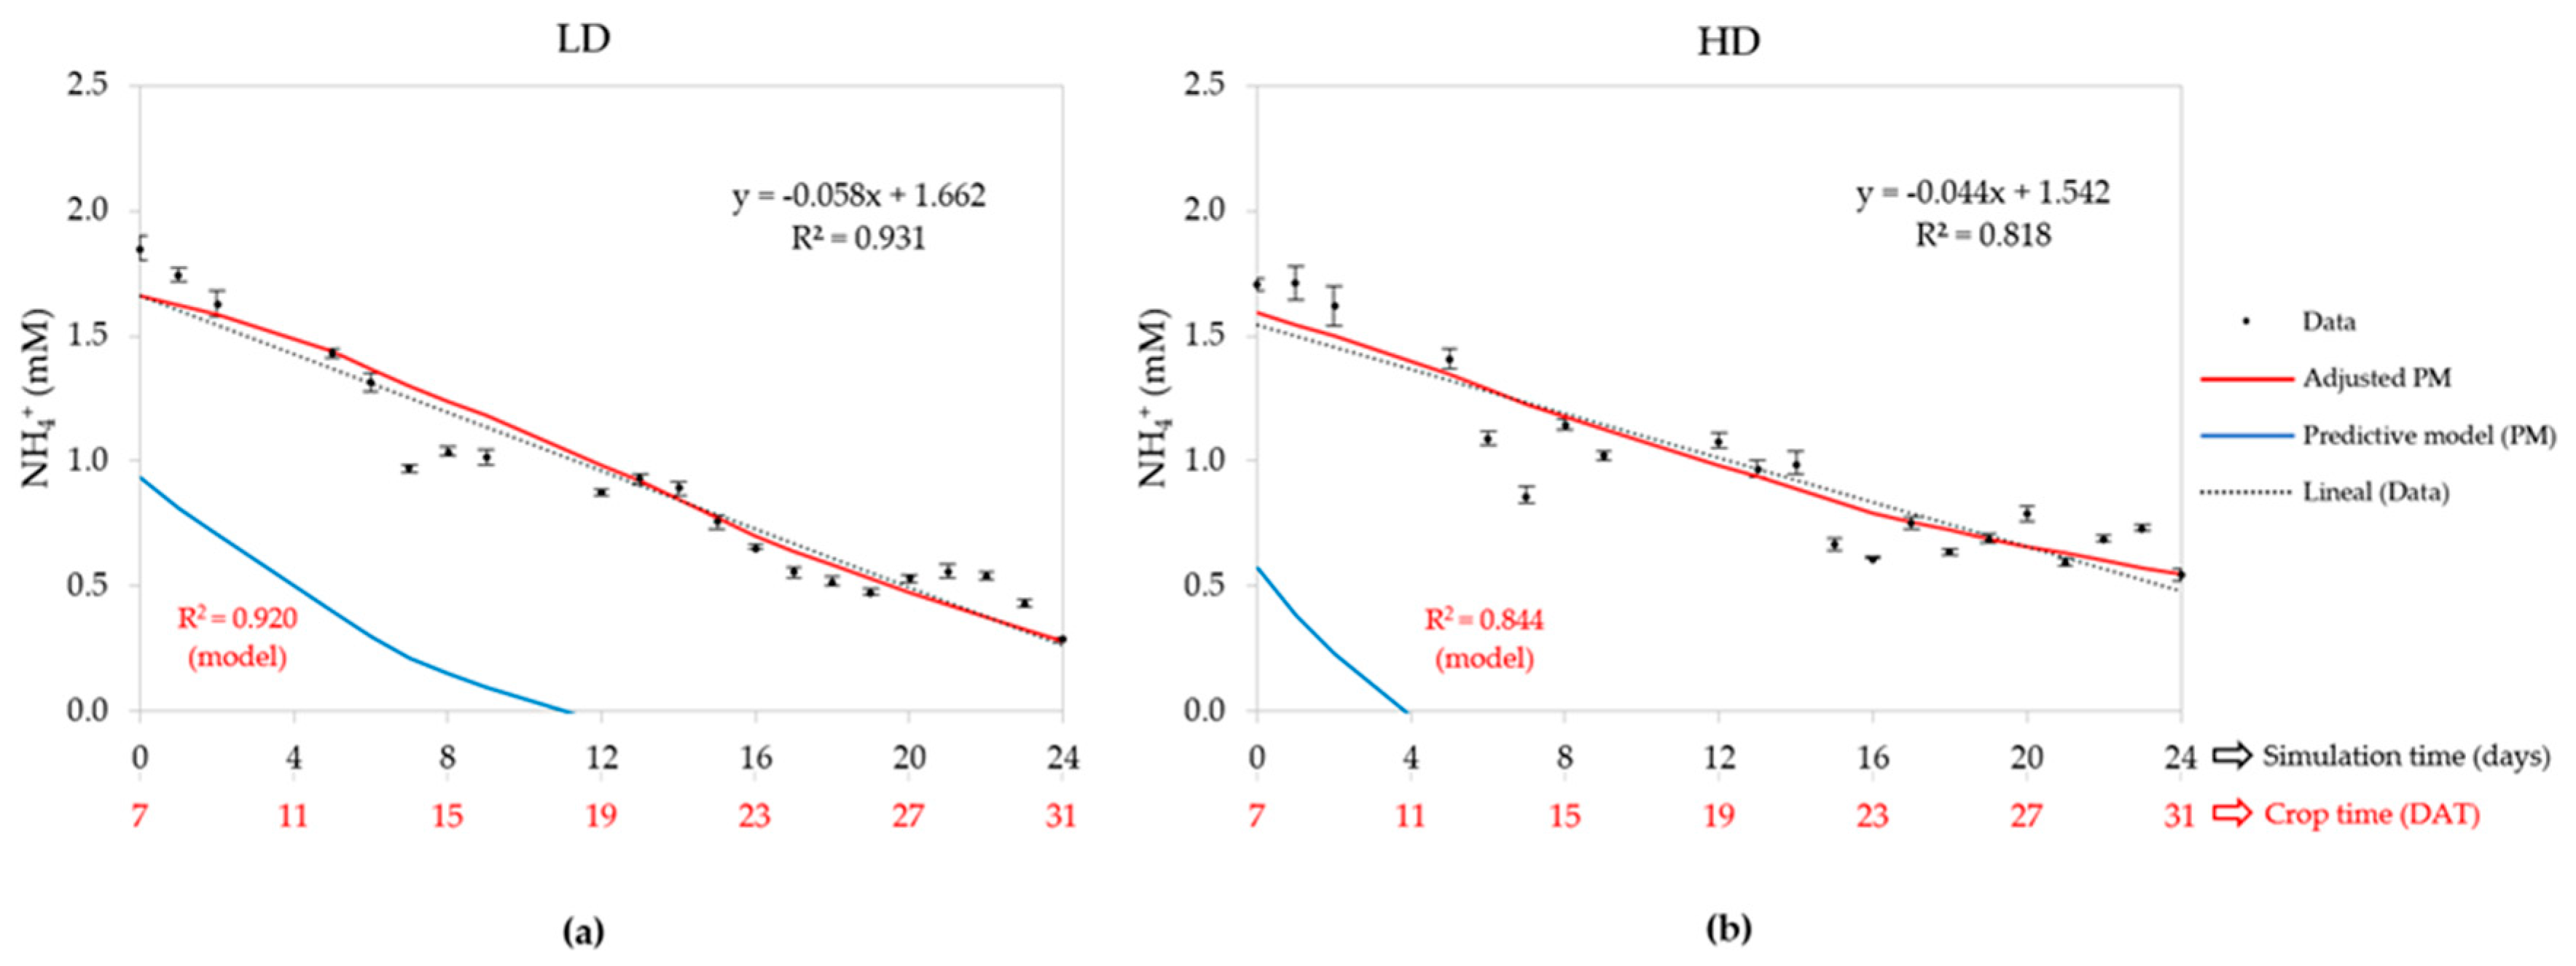
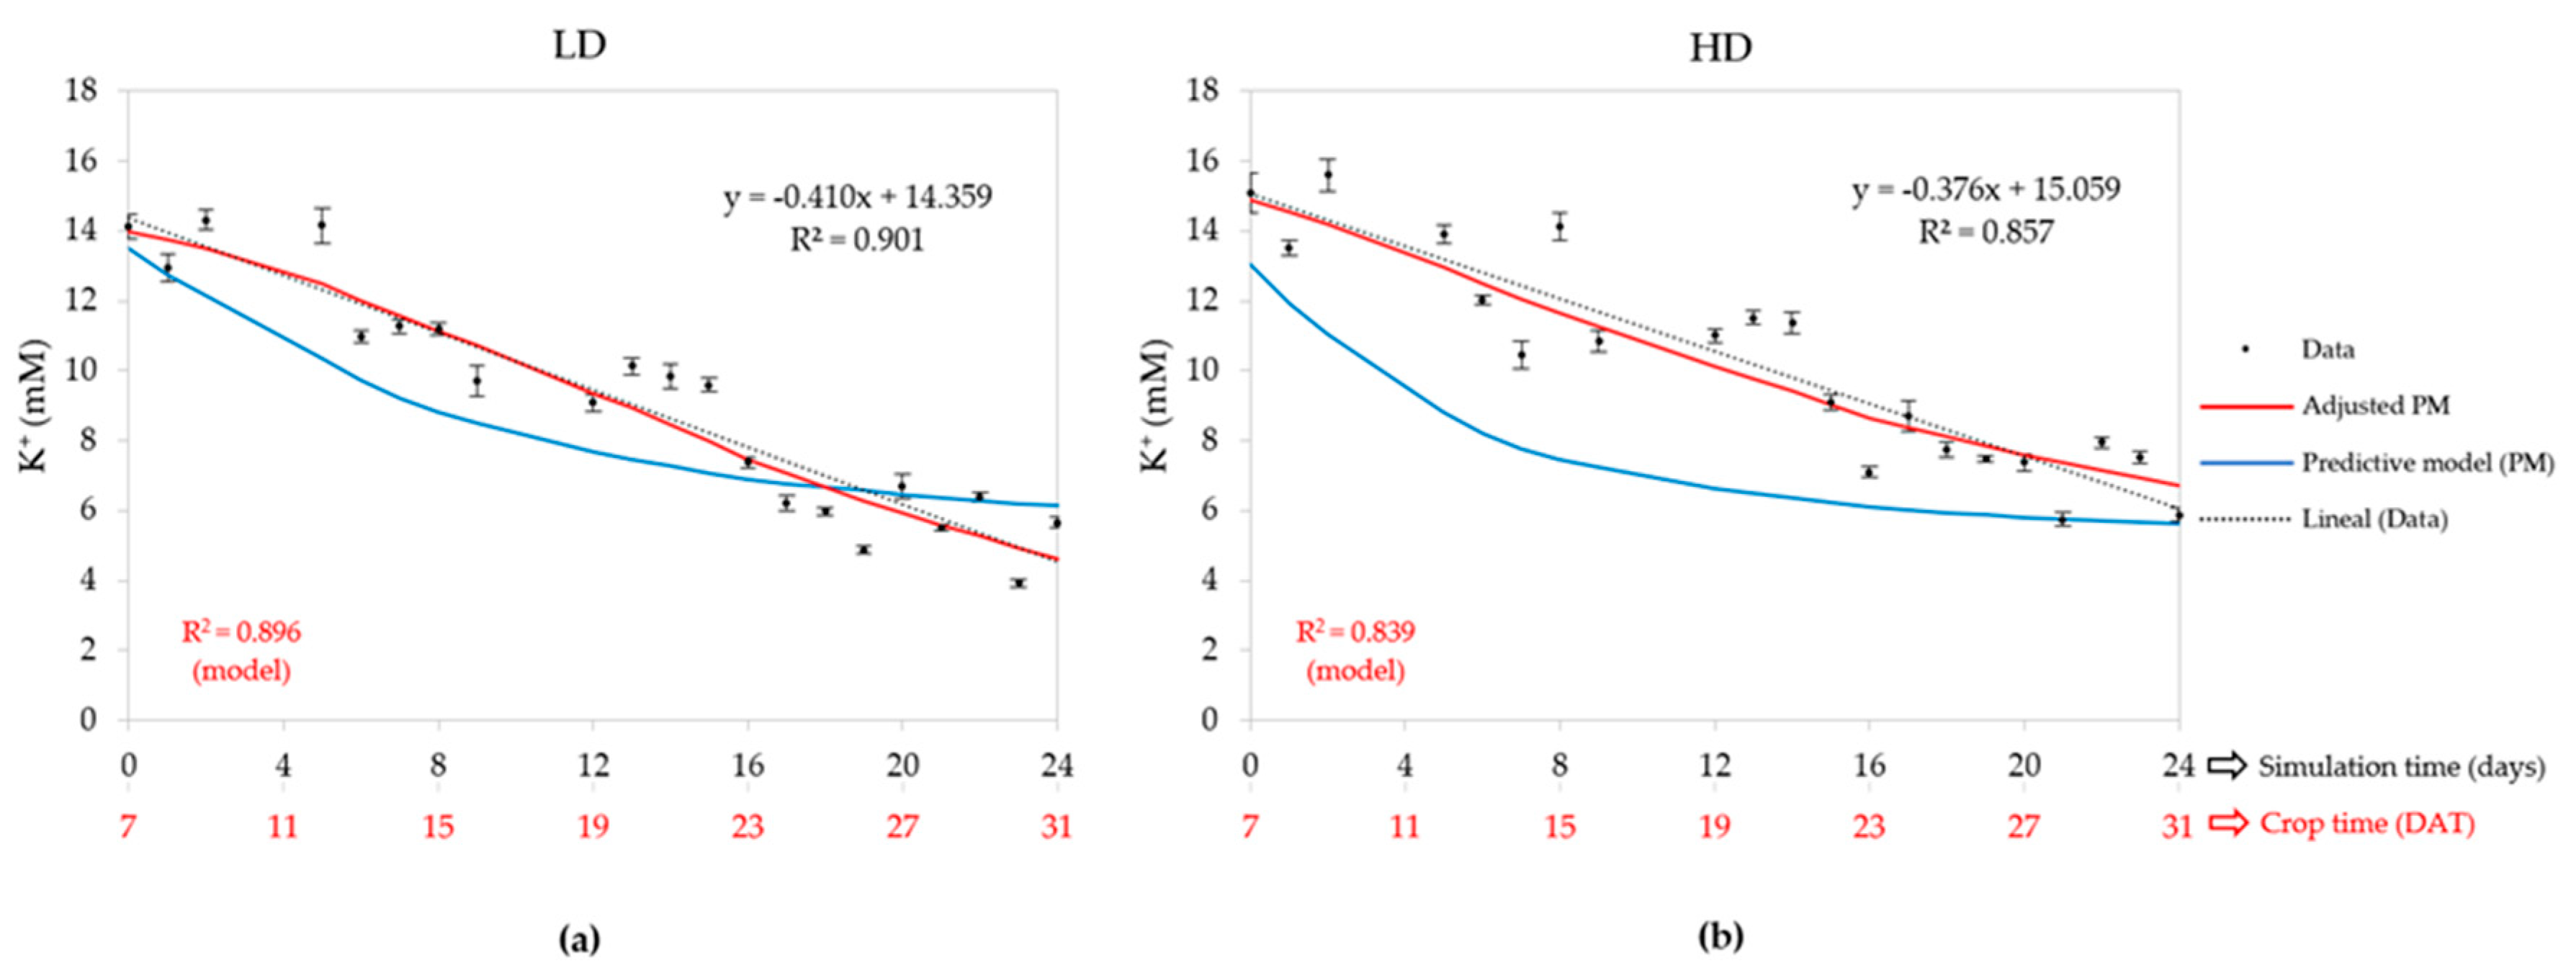
3.2.2. Sodium Concentration (Na+)
3.2.3. Ammonium Concentration (NH4+)
3.2.4. Potassium Concentration (K+)
3.2.5. Calcium Concentration (Ca2+)
3.2.6. Magnesium Concentration (Mg2+)
3.3. Crop Behavoir: Physiological and Production Parameters
4. Conclusions
Author Contributions
Funding
Data Availability Statement
Acknowledgements
Conflicts of Interest
References
- UUNN World Population Prospects 2019; 2019. ISBN 9789211483161.
- World Bank. Population estimates and projections | DataBank Available online:. Available online: https://databank.worldbank.org/source/population-estimates-and-projections (accessed on 18 December 2023).
- FAO The future of food and agriculture–Trends and challenges. Annu. Rep. 2017, 1–180.
- Calicioglu, O.; Flammini, A.; Bracco, S.; Bellù, L.; Sims, R. The future challenges of food and agriculture: An integrated analysis of trends and solutions. Sustain. 2019, 11. [Google Scholar] [CrossRef]
- FAO The State of the World’s Land and Water Resources for Food and Agriculture – Systems at breaking point, Syntesis report 2021. 2021; 63. [CrossRef]
- Feng, T.; Xiong, R.; Huan, P. Productive use of natural resources in agriculture: The main policy lessons. Resour. Policy 2023, 85, 103793. [Google Scholar] [CrossRef]
- FAO Land statistics and indicators 2000–2021. FAOSTAT Anal. Br. Ser. 2023, 71, 14. [CrossRef]
- FAO AQUASTAT Dissemination Platform. Available online: https://data.apps.fao.org/aquastat/?lang=en (accessed on 18 December 2023).
- FAO Greenhouse gas emissions from agrifood systems Global, regional and country trends, 2000-2020. FAOSTAT Anal. Br. Ser. 2022, 50, 1–12.
- Foley, J.A.; Ramankutty, N.; Brauman, K.A.; Cassidy, E.S.; Gerber, J.S.; Johnston, M.; Mueller, N.D.; O’Connell, C.; Ray, D.K.; West, P.C.; et al. Solutions for a cultivated planet. Nature 2011, 478, 337–342. [Google Scholar] [CrossRef] [PubMed]
- Sambo, P.; Nicoletto, C.; Giro, A.; Pii, Y.; Valentinuzzi, F.; Mimmo, T.; Lugli, P.; Orzes, G.; Mazzetto, F.; Astolfi, S.; et al. Hydroponic Solutions for Soilless Production Systems: Issues and Opportunities in a Smart Agriculture Perspective. Front. Plant Sci. 2019, 10, 923. [Google Scholar] [CrossRef] [PubMed]
- Fussy, A.; Papenbrock, J. An Overview of Soil and Soilless Cultivation Techniques—Chances, Challenges and the Neglected Question of Sustainability. Plants 2022, 11. [Google Scholar] [CrossRef]
- Sushma Devi, N.; Hatibarua, P.; Bijaya Devi, N.; Jamja, T.; Tagi, N.; Tabing, R. Urban Horticulture for Sustainable Food Production and Food Security. Eco. Env. Cons. 2022, 28, 324–335. [Google Scholar] [CrossRef]
- Orsini, F.; Pennisi, G.; Michelon, N.; Minelli, A.; Bazzocchi, G.; Sanyé-Mengual, E.; Gianquinto, G. Features and Functions of Multifunctional Urban Agriculture in the Global North: A Review. Front. Sustain. Food Syst. 2020, 4. [Google Scholar] [CrossRef]
- van Delden, S.H.; SharathKumar, M.; Butturini, M.; Graamans, L.J.A.A.; Heuvelink, E.; Kacira, M.; Kaiser, E.; Klamer, R.S.; Klerkx, L.; Kootstra, G.; et al. Current status and future challenges in implementing and upscaling vertical farming systems. Nat. Food 2021, 2, 944–956. [Google Scholar] [CrossRef] [PubMed]
- Orsini, F.; Kahane, R.; Nono-Womdim, R.; Gianquinto, G. Urban agriculture in the developing world: A review. Agron. Sustain. Dev. 2013, 33, 695–720. [Google Scholar] [CrossRef]
- Al-Kodmany, K. The vertical farm: A review of developments and implications for the vertical city. Buildings 2018, 8. [Google Scholar] [CrossRef]
- Supraja, M.L. Opportunities and challenges of vertical farming. Int. J. Res. Trends Innov. 2022, 7, 1071–1074. [Google Scholar]
- Van Gerrewey, T.; Boon, N.; Geelen, D. Vertical farming: The only way is up? Agronomy 2022, 12. [Google Scholar] [CrossRef]
- Beacham, A.M.; Vickers, L.H.; Monaghan, J.M. Vertical farming: a summary of approaches to growing skywards. J. Hortic. Sci. Biotechnol. 2019, 94, 277–283. [Google Scholar] [CrossRef]
- Oh, S.; Lu, C. Vertical farming - smart urban agriculture for enhancing resilience and sustainability in food security. J. Hortic. Sci. Biotechnol. 2023, 98, 133–140. [Google Scholar] [CrossRef]
- Kabir, M.S.N.; Reza, M.N.; Chowdhury, M.; Ali, M.; Samsuzzaman; Ali, M.R.; Lee, K.Y.; Chung, S. Technological Trends and Engineering Issues on Vertical Farms: A Review. Horticulturae 2023, 9, 1229. [Google Scholar] [CrossRef]
- Graamans, L.; Baeza, E.; van den Dobbelsteen, A.; Tsafaras, I.; Stanghellini, C. Plant factories versus greenhouses: Comparison of resource use efficiency. Agric. Syst. 2018, 160, 31–43. [Google Scholar] [CrossRef]
- Nikolaou, G.; Neocleous, D.; Katsoulas, N.; Kittas, C. Irrigation of Greenhouse Crops. Hortic. 2019, 5, 7. [Google Scholar] [CrossRef]
- Avgoustaki, D.D.; Xydis, G. Plant factories in the water-food-energy Nexus era: a systematic bibliographical review. Food Secur. 2020, 12, 253–268. [Google Scholar] [CrossRef]
- Voogt, W.; Bar-Yosef, B. Water and nutrient management and crops response to nutrient solution recycling in soilless growing systems in greenhouses; Second Edi.; Elsevier B.V., 2019. ISBN 9780444636966.
- Heuvelink, E.; Bakker, M.; Stanghellini, C. Salinity effects on fruit yield in vegetable crops: A simulation study. Acta Hortic. 2003, 609, 133–140. [Google Scholar] [CrossRef]
- Stanghellini, C.; Kempkes, F.; Pardossi, A.; Incrocci, L. Closed Water Loop in Greenhouses: Effect of Water Quality and Value of Produce. Acta Hortic. 2005, 691, 233–242. [Google Scholar] [CrossRef]
- Giuffrida, F.; Lipari, V.; Leonardi, C. A simplified management of closed soilless cultivation systems. Acta Hortic. 2003, 614, 155–160. [Google Scholar] [CrossRef]
- Silberbush, M.; Ben-Asher, J. Simulation study of nutrient uptake by plants from soilless cultures as affected by salinity buildup and transpiration. Plant Soil 2001, 233, 59–69. [Google Scholar] [CrossRef]
- Sonneveld, C.; Voogt, W.; Spaans, L. A universal algorithm for calculation of nutrient solutions. Acta Hortic. 1999, 481, 331–339. [Google Scholar] [CrossRef]
- Carmassi, G.; Incrocci, L.; Maggini, R.; Malorgio, F.; Tognoni, F.; Pardossi, A. Modeling Salinity Build-Up in Recirculating Nutrient Solution Culture. J. Plant Nutr. 2005, 28, 431–445. [Google Scholar] [CrossRef]
- Carmassi, G.; Incrocci, L.; Malorgio, M.; Tognoni, F.; Pardossi, A. A simple model for salt accumulation in closed-loop hydroponics. Acta Hortic. 2003, 614, 149–154. [Google Scholar] [CrossRef]
- Carmassi, G.; Incrocci, L.; Maggini, R.; Malorgio, F.; Tognoni, F.; Pardossi, A. An aggregated model for water requirements of greenhouse tomato grown in closed rockwool culture with saline water. Agric. Water Manag. 2007, 88, 73–82. [Google Scholar] [CrossRef]
- Incrocci, L.; Massa, D.; Carmassi, G.; Pulizzi, R.; Maggini, R.; Pardossi, A.; Bibbiani, C. SIMULHYDRO, a simple tool for predicting water use and water use efficiency in tomato closed-loop soilless cultivations. Acta Hortic. 2008, 801 PART 2, 1005–1011. [Google Scholar] [CrossRef]
- Son, J.-E.; Ahn, T.I.; Moon, T. Advances in nutrient management modelling and nutrient concentration prediction for soilless culture systems. In Advances in horticultural soilless culture; Burleigh Dodds Science Publishing: London, UK, 2021; pp. 277–301. ISBN 9781003048206. [Google Scholar]
- Noumedem, J.A.K.; Djeussi, D.E.; Hritcu, L.; Mihasan, M.; Kuete, V. Lactuca sativa. In Medicinal Spices and Vegetables from Africa; Elsevier, 2017; pp. 437–449.
- Shatilov, M. V; Razin, A.F.; Ivanova, M.I. Analysis of the world lettuce market. IOP Conf. Ser. Earth Environ. Sci. 2019, 395, 012053. [Google Scholar] [CrossRef]
- Yang, X.; Gil, M.I.; Yang, Q.; Tomás-Barberán, F.A. Bioactive compounds in lettuce: Highlighting the benefits to human health and impacts of preharvest and postharvest practices. Compr. Rev. Food Sci. Food Saf. 2022, 21, 4–45. [Google Scholar] [CrossRef]
- FAO FAOSTAT. Crops and livestock products. Available online: https://www.fao.org/faostat/en/#data/QCL (accessed on 18 December 2023).
- Voutsinos, O.; Mastoraki, M.; Ntatsi, G.; Liakopoulos, G.; Savvas, D. Comparative Assessment of Hydroponic Lettuce Production Either under Artificial Lighting, or in a Mediterranean Greenhouse during Wintertime. Agriculture 2021, 11, 503. [Google Scholar] [CrossRef]
- Asseng, S.; Guarin, J.R.; Raman, M.; Monje, O.; Kiss, G.; Despommier, D.D.; Meggers, F.M.; Gauthier, P.P.G. Wheat yield potential in controlled-environment vertical farms. Proc. Natl. Acad. Sci. 2020, 117, 19131–19135. [Google Scholar] [CrossRef] [PubMed]
- Pereira, L.S.; Allen, R.G.; Smith, M.; Raes, D. Crop evapotranspiration estimation with FAO56: Past and future. Agric. Water Manag. 2015, 147, 4–20. [Google Scholar] [CrossRef]
- Walter, I.A.; Allen, R.G.; Elliott, R.; Jensen, M.E.; Itenfisu, D.; Mecham, B.; Howell, T.A.; Snyder, R.; Brown, P.; Echings, S.; et al. ASCE’s Standardized Reference Evapotranspiration Equation. In Proceedings of the Watershed Management and Operations Management 2000; American Society of Civil Engineers: Reston, VA, 2001; pp. 1–11. [Google Scholar]
- Carmassi, G.; Maggini, R.; Incrocci, L. Modelling ion concentration in the culture solution of closed-loop hydroponics. Acta Hortic. 2004, 654, 251–256. [Google Scholar] [CrossRef]
- Allen, R.G.; Pereira, L.S.; Raes, D.; Martin Smith, S. Crop evapotranspiration - Guidelines for computing crop water requirements.; FAO Irrigation and drainage. Paper 56, 1998. ISBN 92-5-104219-5.
- Chapra, E.C.; Canale, R.P.; Valle Sotelo, J.C. Numerical methods for engineers.; Fifth.; McGraw-Hill Companies, Inc., 2006. ISBN 0-07-291873-X.
- Fylstra, D.; Lasdon, L.; Watson, J.; Waren, A. Design and Use of the Microsoft Excel Solver. Interfaces (Providence). 1998, 28, 29–55. [Google Scholar] [CrossRef]
- Sonneveld, C. Effects of salinity on substrate grown vegetables and ornamentals in greenhouse horticulture; Wageningen, 2004. ISBN 9058081907.
- Michael, P.R.; Johnston, D.E.; Moreno, W. A conversion guide: solar irradiance and lux illuminance. J. Meas. Eng. 2020, 8, 153–166. [Google Scholar] [CrossRef]
- EU. European Commission Photovoltaic Geographical Information System (PVGIS). Solar radiation. Available online: https://re.jrc.ec.europa.eu/pvg_tools/en/ (accessed on 18 December 2023).
- EU Meteostat Station Identifiers “Almeria aeropuerto”. Available online: https://meteostat.net/en/station/08487?t=2023-05-05/2023-05-12 (accessed on 18 December 2023).
- Wang, S. Air speed profiles in a naturally ventilated greenhouse with a tomato crop. Agric. For. Meteorol. 1999, 96, 181–188. [Google Scholar] [CrossRef]
- AEMET (Agencia Estatal de Meteorología) Valores climatológicos normales, Almería Aeropuerto. Available online: https://www.aemet.es/es/serviciosclimaticos/datosclimatologicos/valoresclimatologicos?l=6325O&k=undefined (accessed on 18 December 2023).
- Franklin, J. Plant Growth Chamber Handbook.; Langhans, R.W., Tibbits, T.W., Eds.; SR-99; Cambridge University Press: Iowa State University. Agriculture and Home Economics Experiment Station, 1997. [Google Scholar]
- Ahmed, H.A.; Yu-Xin, T.; Qi-Chang, Y. Optimal control of environmental conditions affecting lettuce plant growth in a controlled environment with artificial lighting: A review. South African J. Bot. 2020, 130, 75–89. [Google Scholar] [CrossRef]
- Bussotti, F.; Kalaji, M.H.; Desotgiu, R.; Pollastrini, M.; Loboda, T.; Bosa, K. Misurare la vitalità delle piante per mezzo della fluorescenza della clorofilla; Bussotti, F., et al., Eds.; Strumenti per la didattica e la ricerca; 1st ed.; Firenze University Press: Firenze, 2012; Vol. 137, ISBN 978-88-6655-215-4. [Google Scholar]
- Pardossi, A.; Carmassi, G.; Diara, C.; Incrocci, L.; Maggini, R.; Massa, D. Fertigation and substrate management in closed soilless culture; Pisa, Italy, 2011; Vol. 1.
- Chicco, D.; Warrens, M.J.; Jurman, G. The coefficient of determination R-squared is more informative than SMAPE, MAE, MAPE, MSE and RMSE in regression analysis evaluation. PeerJ Comput. Sci. 2021, 7, 1–24. [Google Scholar] [CrossRef] [PubMed]
- Hai, T.; Sharafati, A.; Mohammed, A.; Salih, S.Q.; Deo, R.C.; Al-Ansari, N.; Yaseen, Z.M. Global Solar Radiation Estimation and Climatic Variability Analysis Using Extreme Learning Machine Based Predictive Model. IEEE Access 2020, 8, 12026–12042. [Google Scholar] [CrossRef]
- Yang, J.M.; Yang, J.Y.; Liu, S.; Hoogenboom, G. An evaluation of the statistical methods for testing the performance of crop models with observed data. Agric. Syst. 2014, 127, 81–89. [Google Scholar] [CrossRef]
- Saxena, A.; Celaya, J.; Balaban, E.; Goebel, K.; Saha, B.; Saha, S.; Schwabacher, M. Metrics for evaluating performance of prognostic techniques. 2008 Int. Conf. Progn. Heal. Manag. PHM 2008 2008. [Google Scholar] [CrossRef]
- Barbosa, G.L.; Almeida Gadelha, F.D.; Kublik, N.; Proctor, A.; Reichelm, L.; Weissinger, E.; Wohlleb, G.M.; Halden, R.U. Comparison of land, water, and energy requirements of lettuce grown using hydroponic vs. Conventional agricultural methods. Int. J. Environ. Res. Public Health 2015, 12, 6879–6891. [Google Scholar] [CrossRef]
- Kozai, T. Why LED Lighting for Urban Agriculture. In LED Lighting for Urban Agriculture; Springer Singapore: Singapore, 2016; pp. 3–18. [Google Scholar]
- Kozai, T.; Niu, G. Role of the plant factory with artificial lighting (PFAL) in urban areas; Elsevier Inc., 2019. ISBN 9780128166918.
- Formisano, L.; Ciriello, M.; Cirillo, V.; Pannico, A.; El-Nakhel, C.; Cristofano, F.; Duri, L.G.; Giordano, M.; Rouphael, Y.; De Pascale, S. Divergent Leaf Morpho-Physiological and Anatomical Adaptations of Four Lettuce Cultivars in Response to Different Greenhouse Irradiance Levels in Early Summer Season. Plants 2021, 10, 1179. [Google Scholar] [CrossRef]
- Cristofano, F.; El-Nakhel, C.; Colla, G.; Cardarelli, M.; Pii, Y.; Lucini, L.; Rouphael, Y. Tracking the Biostimulatory Effect of Fractions from a Commercial Plant Protein Hydrolysate in Greenhouse-Grown Lettuce. Antioxidants 2023, 12. [Google Scholar] [CrossRef]
- Carillo, P.; De Micco, V.; Ciriello, M.; Formisano, L.; El-Nakhel, C.; Giordano, M.; Colla, G.; Rouphael, Y. Morpho-Anatomical, Physiological, and Mineral Composition Responses Induced by a Vegetal-Based Biostimulant at Three Rates of Foliar Application in Greenhouse Lettuce. Plants 2022, 11, 2030. [Google Scholar] [CrossRef] [PubMed]
- Buturi, C.V.; Sabatino, L.; Mauro, R.P.; Navarro-León, E.; Blasco, B.; Leonardi, C.; Giuffrida, F. Iron Biofortification of Greenhouse Soilless Lettuce: An Effective Agronomic Tool to Improve the Dietary Mineral Intake. Agronomy 2022, 12, 1793. [Google Scholar] [CrossRef]
- Söylemez, S. The impact of different growth media and ammonium-nitrate ratio on yield and nitrate accumulation in lettuce (Lactuca sativa var. longifolia). Not. Bot. Horti Agrobot. Cluj-Napoca 2021, 49, 1–14. [Google Scholar] [CrossRef]
- Lycoskoufis, I.; Kavga, A.; Koubouris, G.; Karamousantas, D. Ultraviolet Radiation Management in Greenhouse to Improve Red Lettuce Quality and Yield. Agriculture 2022, 12, 1620. [Google Scholar] [CrossRef]
- Hamidon, M.H.; Ahamed, T. Detection of Tip-Burn Stress on Lettuce Grown in an Indoor Environment Using Deep Learning Algorithms. Sensors 2022, 22. [Google Scholar] [CrossRef] [PubMed]
- Hernández, E.; Timmons, M.B.; Mattson, N.S. Quality, Yield, and Biomass Efficacy of Several Hydroponic Lettuce (Lactuca sativa L.) Cultivars in Response to High Pressure Sodium Lights or Light Emitting Diodes for Greenhouse Supplemental Lighting. Horticulturae 2020, 6, 7. [Google Scholar] [CrossRef]
- Li, Q.; Li, X.; Tang, B.; Gu, M. Growth responses and root characteristics of lettuce grown in Aeroponics, Hydroponics, and Substrate Culture. Horticulturae 2018, 4. [Google Scholar] [CrossRef]
- Neumann, G.; Bott, S.; Ohler, M.A.; Mock, H.P.; Lippmann, R.; Grosch, R.; Smalla, K. Root exudation and root development of lettuce (lactuca sativa l. Cv. Tizian) as affected by different soils. Front. Microbiol. 2014, 5, 1–6. [Google Scholar] [CrossRef]
- Kerbiriou, P.J.; Stomph, T.J.; Van Der Putten, P.E.L.; Lammerts Van Bueren, E.T.; Struik, P.C. Shoot growth, root growth and resource capture under limiting water and N supply for two cultivars of lettuce (Lactuca sativa L.). Plant Soil 2013, 371, 281–297. [Google Scholar] [CrossRef]
- Gavhane, K.P.; Hasan, M.; Singh, D.K.; Kumar, S.N.; Sahoo, R.N.; Alam, W. Determination of optimal daily light integral (DLI) for indoor cultivation of iceberg lettuce in an indigenous vertical hydroponic system. Sci. Rep. 2023, 13, 1–15. [Google Scholar] [CrossRef]
- Vetrano, F.; Moncada, A.; Miceli, A. Use of gibberellic acid to increase the salt tolerance of leaf lettuce and rocket grown in a floating system. Agronomy 2020, 10. [Google Scholar] [CrossRef]
- Popkin, B.M.; D’Anci, K.E.; Rosenberg, I.H. Water, hydration, and health. Nutr. Rev. 2010, 68, 439–458. [Google Scholar] [CrossRef]
- Murray, J.J.; Basset, G.; Sandoya, G. Nutritional Benefits of Lettuce Consumed at Recommended Portion Sizes. EDIS 2021, 2021, 1–8. [Google Scholar] [CrossRef]
- Travieso, L.L.; Leon, A.P.; Logegaray, V.R.; Frezza, D.; Chiesa, A. Loose Leaf Lettuce Quality Grown in Two Production Systems. Eur. Sci. Journal, ESJ 2016, 12, 55. [Google Scholar] [CrossRef]
- Gang, M.S.; Kim, H.J.; Kim, D.W. Estimation of Greenhouse Lettuce Growth Indices Based on a Two-Stage CNN Using RGB-D Images. Sensors 2022, 22, 1–17. [Google Scholar] [CrossRef] [PubMed]
- Ahmed, Z.F.R.; Alnuaimi, A.K.H.; Askri, A.; Tzortzakis, N. Evaluation of Lettuce (Lactuca sativa L.) Production under Hydroponic System: Nutrient Solution Derived from Fish Waste vs. Inorganic Nutrient Solution. Horticulturae 2021, 7, 292. [Google Scholar] [CrossRef]


| Density | Statistic | Water uptake | EC | Cation concentrations (mM) | ||||
|---|---|---|---|---|---|---|---|---|
| (plants·m-2) | metric | (L·day-1) | (dS·m-1) | NH4+ | K+ | Ca+2 | Mg+2 | Na+ |
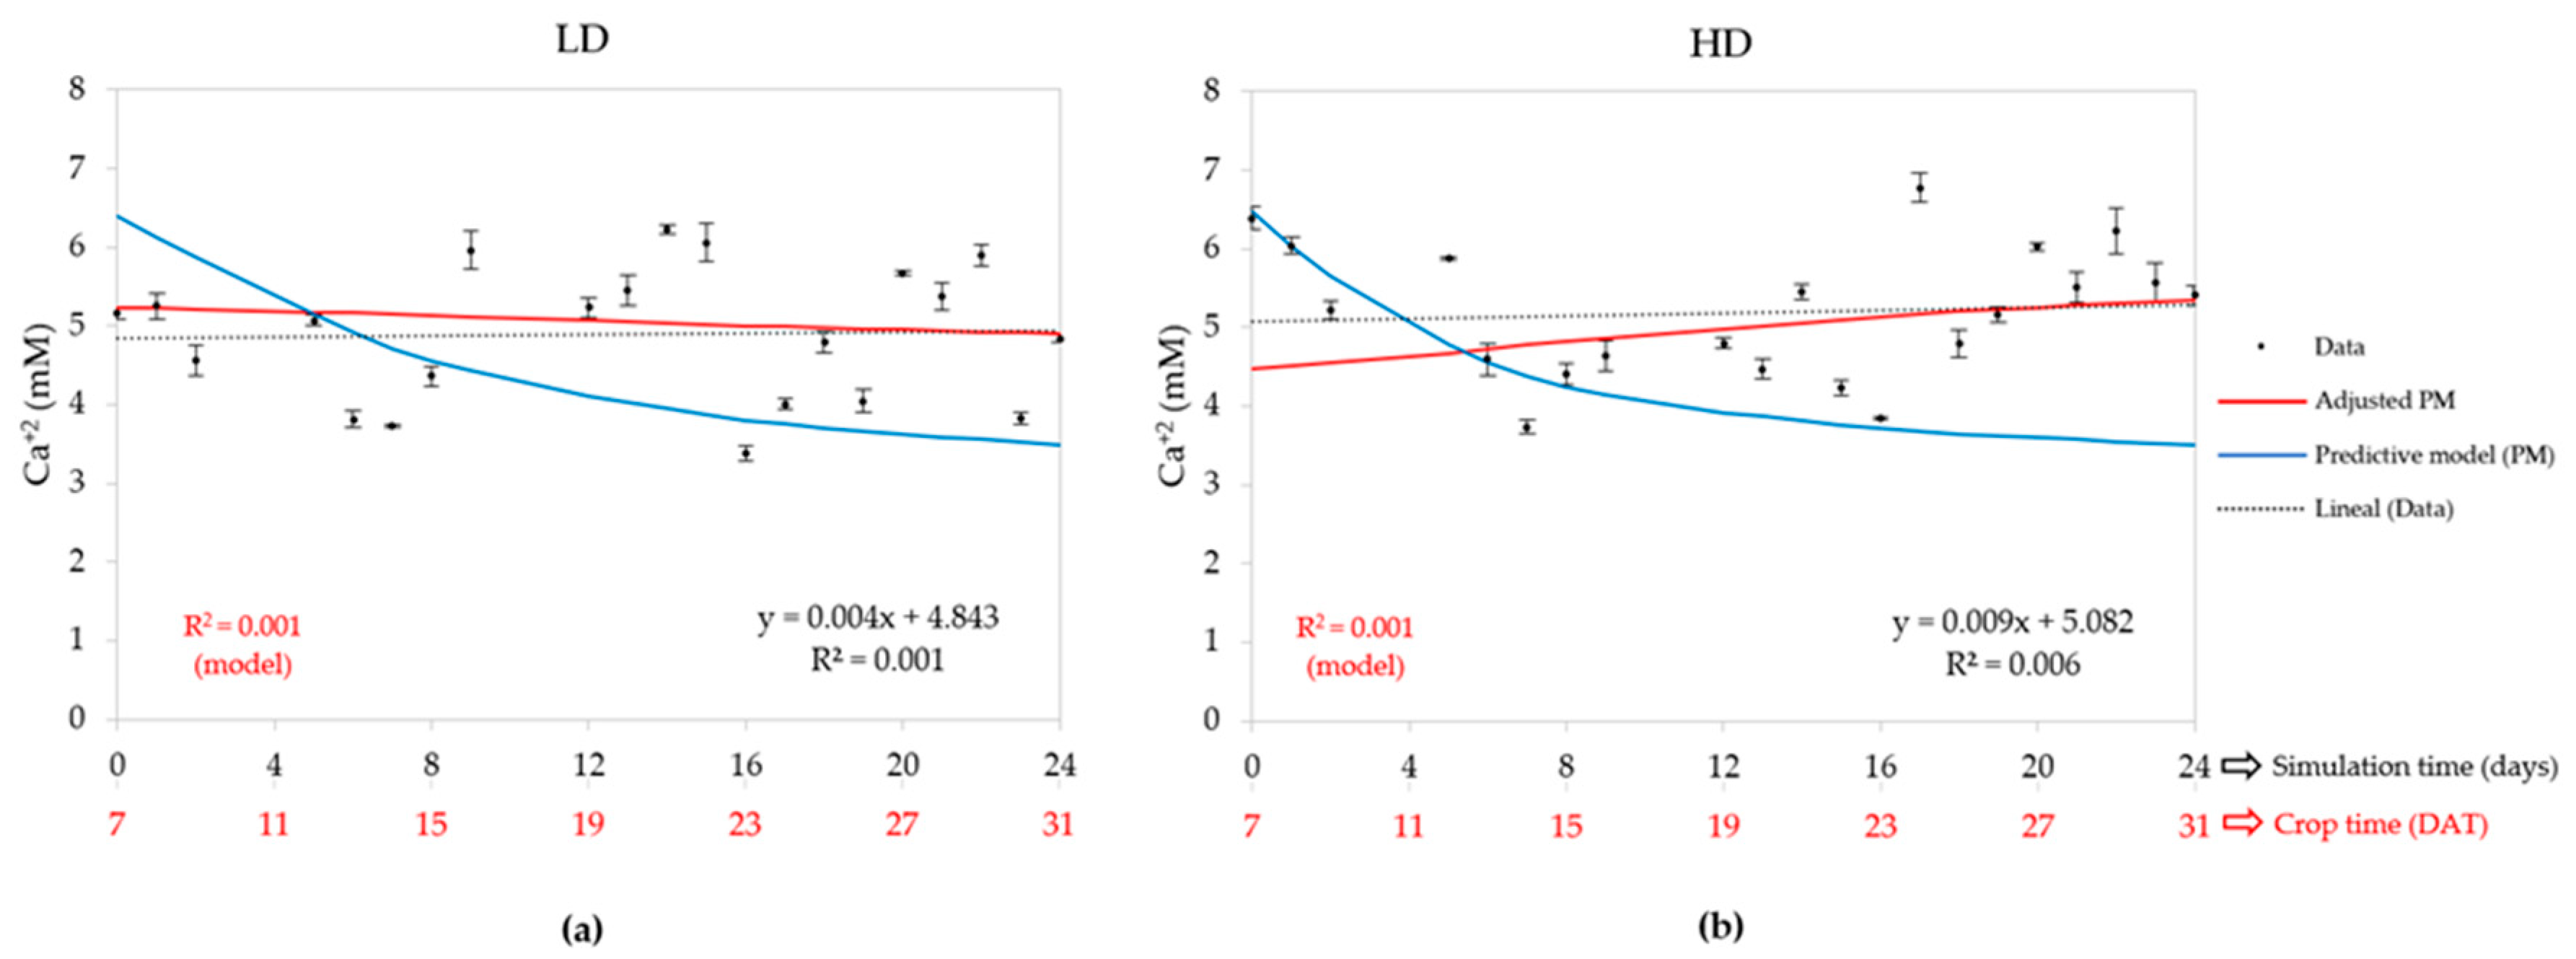
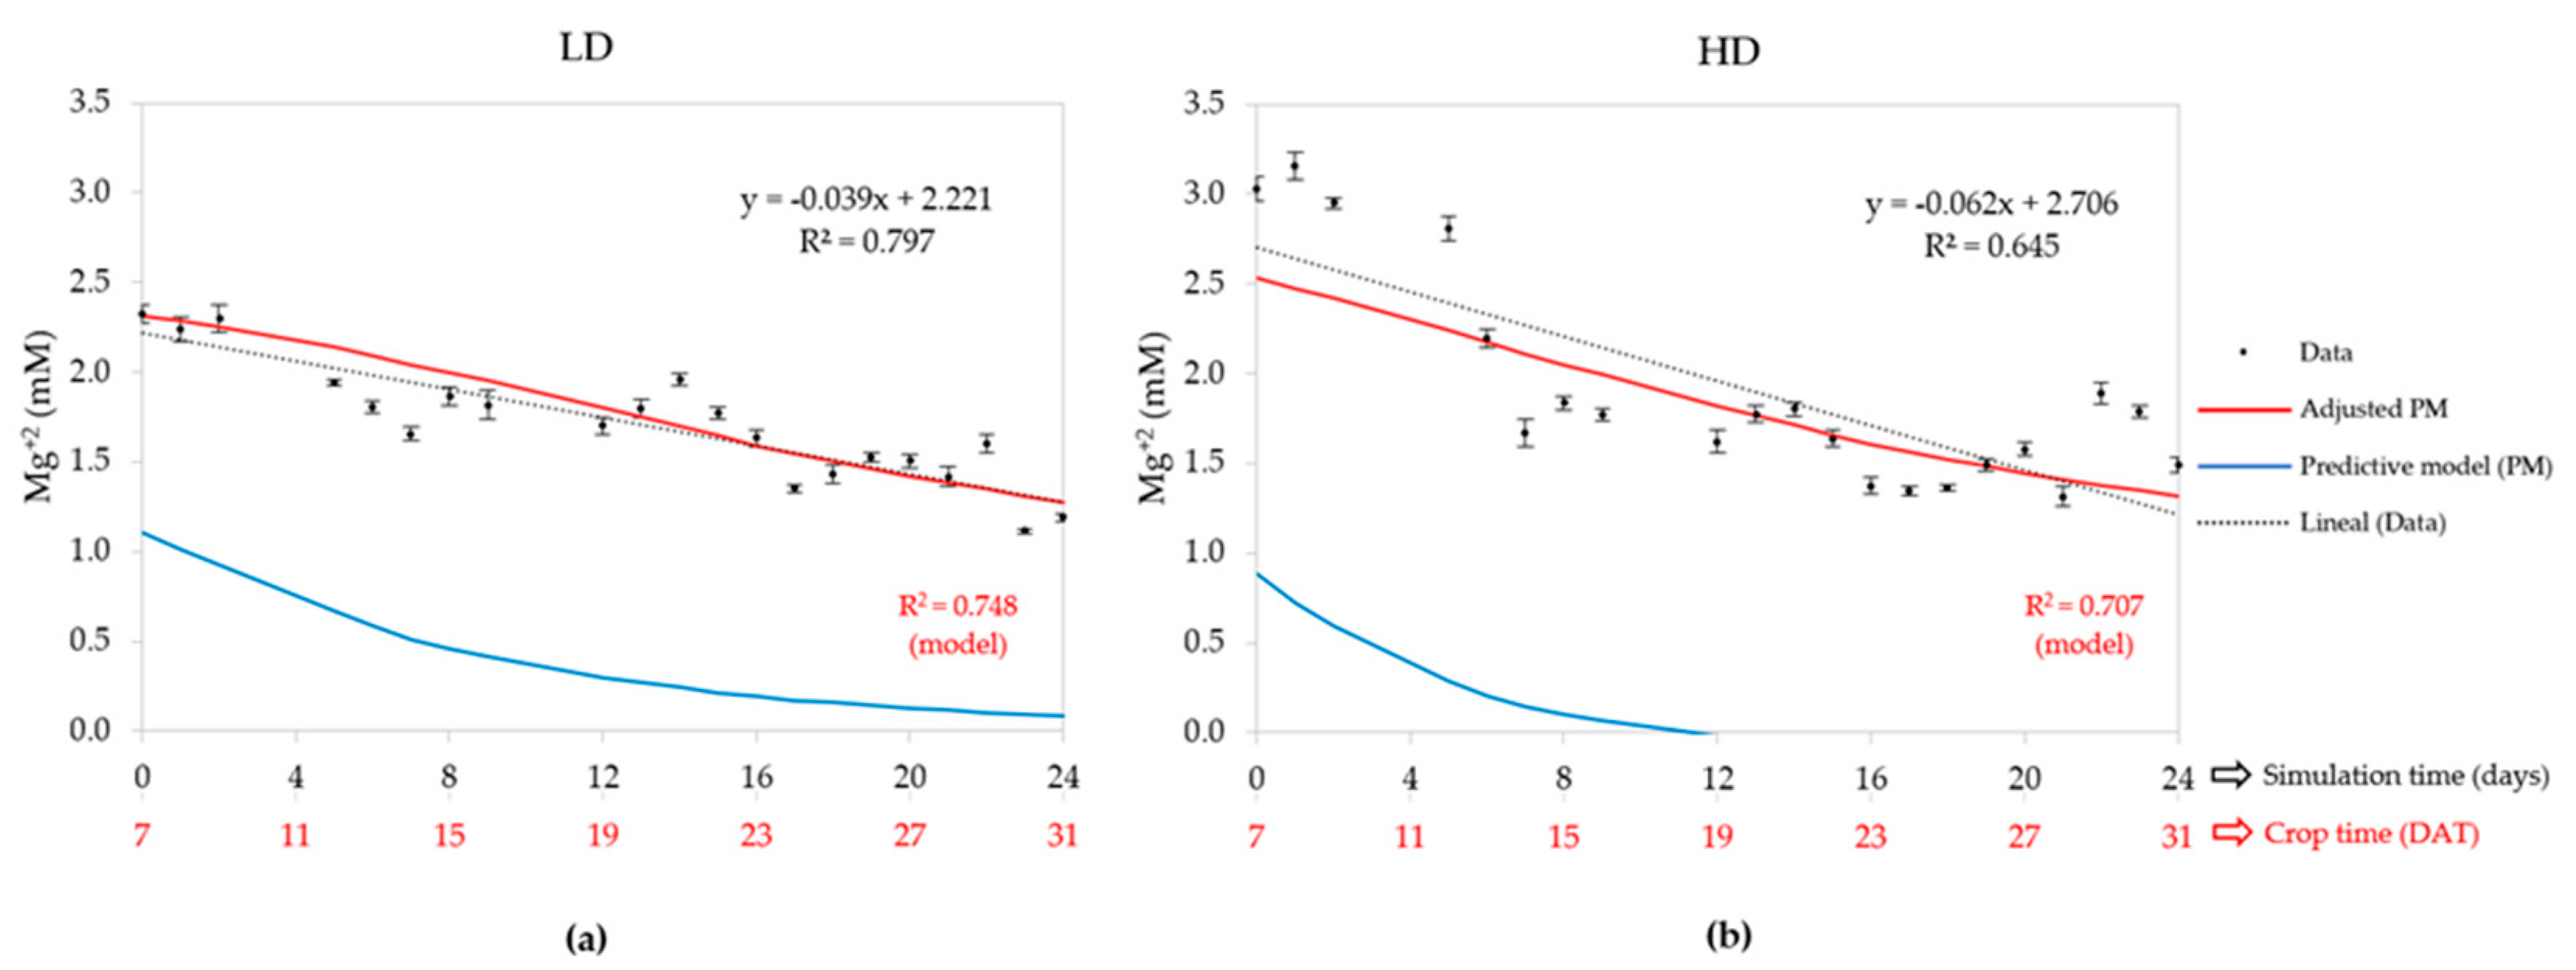
| LD (50) | R2 | 0.826 | - | 0.920 | 0.896 | 0.001 | 0.748 | 0.720 |
| MAE | 1.895 | 0.341 | 0.098 | 0.854 | 0.728 | 0.146 | 0.235 | |
| MSE | 5.939 | 0.177 | 0.016 | 1.075 | 0.778 | 0.032 | 0.074 | |
| RMSE | 2.437 | 0.420 | 0.128 | 1.037 | 0.882 | 0.178 | 0.272 | |
| HD (80) | R2 | 0.858 | - | 0.844 | 0.839 | 0.001 | 0.707 | 0.743 |
| MAE | 1.354 | 0.243 | 0.112 | 0.996 | 0.732 | 0.267 | 0.222 | |
| MSE | 3.482 | 0.087 | 0.021 | 1.498 | 0.831 | 0.114 | 0.084 | |
| RMSE | 1.866 | 0.295 | 0.144 | 1.224 | 0.912 | 0.337 | 0.290 | |
| Sources of | Water uptake | pH | EC | Cation concentration (mM) | ||||
|---|---|---|---|---|---|---|---|---|
| variation | (L·day-1) | (dS·m-1) | NH4+ | K+ | Ca2+ | Mg2+ | Na+ | |
| CD (plants·m-2) | * | * | * | * | * | * | * | * |
| LD (50) | 15a | 5.67b | 3.25a | 0.91a | 9.05a | 4.89a | 1.71a | 2.66a |
| HD (80) | 19b | 5.27a | 3.53b | 0.97b | 10.19b | 5.20b | 1.90b | 3.09b |
| DAT | * | * | * | * | * | * | * | * |
| CD x DAT | * | * | * | * | * | * | * | * |
| RP | ns | ns | ns | ns | ns | ns | ns | ns |
| Variation Sources | Fresh Weight | Dry Weight | Leaf (nº) |
SBI (g·leaf-1) |
|||||
| Shoot | Root | Yield | Shoot | Root | Water | ||||
| (g) | (g) | R/S | (t·ha-1) | (g) | (g) | (%) | |||
| CD (plants·m-2) | * | * | * | * | * | * | ns | * | * |
| PP | * | * | * | * | * | * | * | * | * |
| LD (50) | 148.6b | 14.6b | 0.09b | 74.3b | 5.8b | 0.9b | 96.0 | 20.2a | 7.53b |
| Upper | 172.7b | 18.1b | 0.10b | 86.4b | 7.4b | 1.2b | 95.5 | 16.8a | 5.7a |
| Medium | 135.4a | 13.5a | 0.09b | 67.7a | 4.9a | 0.8a | 96.2 | 20.2b | 8.2b |
| Low | 137.5a | 12.1a | 0.08a | 68.7a | 5.1a | 0.8a | 96.2 | 23.6c | 8.7b |
| HD (80) | 80.6a | 5.9a | 0.07a | 64.5a | 3.1a | 0.4a | 95.9 | 22.4b | 3.48a |
| Upper | 126.5c | 10.8c | 0.08b | 101.2c | 5.0c | 0.7c | 95.6a | 20.1a | 5.0c |
| Medium | 71.9b | 4.3b | 0.06a | 57.5b | 2.7b | 0.2b | 95.9ab | 21.9b | 3.2b |
| Low | 43.6a | 2.5a | 0.06a | 34.8a | 1.5a | 0.1a | 96.4b | 25.3c | 2.1a |
| CD x PP | * | ns | ns | * | ns | ns | ns | ns | * |
| RP | ns | ns | ns | ns | ns | ns | ns | ns | ns |
Disclaimer/Publisher’s Note: The statements, opinions and data contained in all publications are solely those of the individual author(s) and contributor(s) and not of MDPI and/or the editor(s). MDPI and/or the editor(s) disclaim responsibility for any injury to people or property resulting from any ideas, methods, instructions or products referred to in the content. |
© 2024 by the authors. Licensee MDPI, Basel, Switzerland. This article is an open access article distributed under the terms and conditions of the Creative Commons Attribution (CC BY) license (http://creativecommons.org/licenses/by/4.0/).


